


Abstract
Building heating energy demand is influenced by indoor temperature, air exchange, and climatic conditions. This study examines the individual and combined effects of these parameters on a district-heated multi-apartment residential building in Osijek, Croatia. A TRNSYS model was evaluated using measured space-heating consumption for the analysed period from October 2024 to April 2025 and representative TMYx weather data. In the model, air exchange was represented by an effective air-change rate accounting for both uncontrolled air infiltration through the building envelope and natural ventilation associated with occupant window opening. The measured seasonal consumption was 666.16 MWh, while the model predicted 670.61 MWh, resulting in a deviation of 0.67%. The model was then used for a full-factorial analysis including nine indoor temperatures from 18 to 26 °C, nine effective air-change rates from 0.30 to 0.70 h−1, and six Croatian locations, giving 486 simulation scenarios. Under reference conditions, heating demand in Zadar and Split was 44.05% and 50.93% lower than in Osijek/Čepin. Increasing the indoor temperature from 18 to 26 °C increased seasonal demand by 432.63–525.32 MWh, while increasing the effective air-change rate from 0.30 to 0.70 h−1 increased it by 182.67–296.55 MWh. The analysis also showed a positive interaction between indoor temperature and effective air-change rate. For the analysed building, the results can support more sustainable energy use by informing energy-efficient building operation and district-heating demand planning, while the reported numerical sensitivities remain specific to the case-study building.
1. Introduction
According to the recast Energy Performance of Buildings Directive, buildings account for approximately 40% of final energy consumption and 36% of energy-related greenhouse gas emissions in the European Union [1]. Reducing building energy demand is therefore an important part of European energy policy and the transition towards a low-carbon energy system [1,2].
Reliable estimation of heating demand is particularly important for the operation of district heating systems and the assessment of energy renovation measures. It also supports long-term energy planning and the evaluation of building decarbonisation strategies. District heating has an important role in this context, particularly in urban areas and regions with high space-heating demand [3].
Building heating demand can be estimated using simplified calculation procedures or detailed dynamic simulation models. Simplified methods require less input data and computational effort, while dynamic simulation models describe transient heat transfer, thermal storage, solar and internal gains, and changes in operating and climatic conditions [4,5,6,7]. Dynamic simulation is therefore suitable for examining how indoor temperature, air exchange, and weather conditions affect heating demand.
TRNSYS enables the dynamic representation of building thermal behaviour, heating, ventilation, and air conditioning (HVAC) systems, renewable energy technologies, and time-dependent operating conditions. Previous studies have applied it to residential buildings, heating and cooling systems, thermal comfort analysis, and energy retrofit assessment [6,7,8].
However, simulation results depend strongly on the selected input assumptions. Indoor temperature, air infiltration, natural ventilation associated with window opening, occupancy, and climatic data may significantly affect the predicted heating demand [9,10,11,12,13,14,15,16,17,18].
This study examines the influence of indoor temperature setpoint, effective air-change rate, and climatic conditions on the seasonal heating energy demand of an existing multi-apartment residential building connected to the district heating system in Osijek, Croatia. In this study, the effective air-change rate is defined as a whole-building modelling parameter representing the combined effect of uncontrolled air infiltration through the building envelope and natural ventilation associated with occupant window opening.
Literature Review and Research Gap
Building energy performance depends on building geometry, envelope properties, climatic conditions, system operation, and occupant-related parameters. While the geometric and thermal characteristics of a building can usually be obtained from technical documentation, actual operating conditions are more difficult to determine. Differences in indoor temperature, occupancy, ventilation habits, and equipment use may therefore lead to considerable differences in energy consumption between otherwise similar buildings [9,10,11].
Occupant behaviour is an important source of uncertainty in building energy simulations. Occupants interact with thermostats, windows, shading devices, lighting, and household appliances, and these interactions vary over time and between dwellings. Consequently, simplified schedules and fixed operating assumptions may contribute to discrepancies between simulated and measured energy consumption [10,11,12,13,14,15].
Among occupant-related parameters, indoor temperature setpoint has a direct effect on heating demand. A higher setpoint increases the indoor–outdoor temperature difference and, consequently, transmission and air-exchange heat losses. Even relatively small changes in indoor temperature may therefore produce noticeable changes in seasonal heating demand. Nevertheless, standard temperature values are commonly used in building energy assessments, although they may not represent actual conditions in multi-apartment residential buildings [9,10,11].
Air exchange is another uncertain parameter, particularly in existing buildings. It comprises uncontrolled air infiltration through the building envelope and natural ventilation associated with occupant window opening. Infiltration depends on envelope airtightness, wind exposure, stack effects, window condition, and construction joints, whereas window ventilation depends primarily on occupant behaviour and window-opening practices. Because these contributions are rarely measured separately at the whole-building level, their combined effect can be represented by an effective air-change rate. Assumptions regarding air exchange may significantly affect predicted heating demand, particularly in colder climates and in buildings with lower airtightness [16,19].
Indoor temperature and air exchange are physically related because air-exchange heat losses depend on both the airflow rate and the indoor–outdoor temperature difference. The effect of an increased air-change rate is therefore expected to become greater at higher indoor temperatures. However, these parameters are often analysed separately, while fewer studies examine their combined effect over a wider range of operating conditions.
Climatic conditions also strongly affect heating energy demand. Outdoor temperature, solar radiation, wind conditions, and heating-season duration influence both heat losses and available solar gains [17,18]. Croatia is suitable for such an analysis because continental, maritime, and Mediterranean climatic conditions occur within a relatively small geographical area [20]. Applying the same building model to different locations makes it possible to examine climatic effects while keeping the building characteristics and operating assumptions unchanged.
Many parametric studies are based on reference buildings or hypothetical cases and are not compared with measured operational data. Comparison with measured energy consumption is an important step in assessing the performance of building energy models. Previous studies have used measured data and statistical indicators such as MBE, NMBE, RMSE, and CV(RMSE) to evaluate or calibrate whole-building energy models [21,22,23]. In the present study, the model is evaluated rather than formally calibrated because the reference indoor temperature and effective air-change rate were defined in advance and were not adjusted to improve agreement with measured consumption.
Studies combining an existing district-heated multi-apartment building, measured heating consumption, regional climatic comparison, and a full-factorial analysis of indoor temperature and effective air-change rate remain limited. In particular, few studies have examined how the influence of air exchange changes with indoor temperature and climatic location. To address this gap, all combinations of nine indoor temperature setpoints and nine effective air-change rates were simulated for six Croatian locations, resulting in 486 scenarios. The physical relationship between indoor temperature and air exchange is well established, since air-exchange heat losses depend on both airflow rate and the indoor–outdoor temperature difference. Therefore, the contribution of the present study does not lie in identifying this relationship, but in quantifying the magnitude and non-additive interaction of indoor temperature and effective air-change rate for an existing district-heated multi-apartment residential building under six different Croatian climatic conditions. This is achieved through a full-factorial 9 × 9 analysis using an evaluated TRNSYS model based on measured building-level heating consumption.
2. Materials and Methods
2.1. Case Study Building
The analysed case study is a multi-apartment residential building located at Sjenjak 101 in Osijek, Croatia. The building was selected as the case study primarily because sufficiently detailed design, renovation, and energy-performance documentation was available for model development, together with building-level monthly district-heating consumption data for model evaluation. In addition, its characteristics as an existing district-heated multi-apartment building that had undergone an energy retrofit while retaining a heterogeneous combination of renovated and original envelope components made it suitable for investigating the sensitivity of heating demand to operating and climatic parameters. The building was therefore used as a well-documented case study rather than as a statistically representative sample of the Croatian multi-apartment building stock. Constructed in 1980, the building consists of a basement, a ground floor, and eleven upper storeys. Space heating is supplied by the district heating network of the City of Osijek, operated by HEP Toplinarstvo d.o.o., Osijek, Croatia.
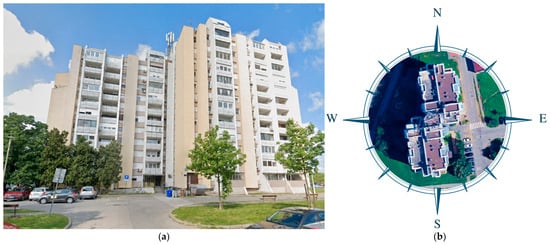
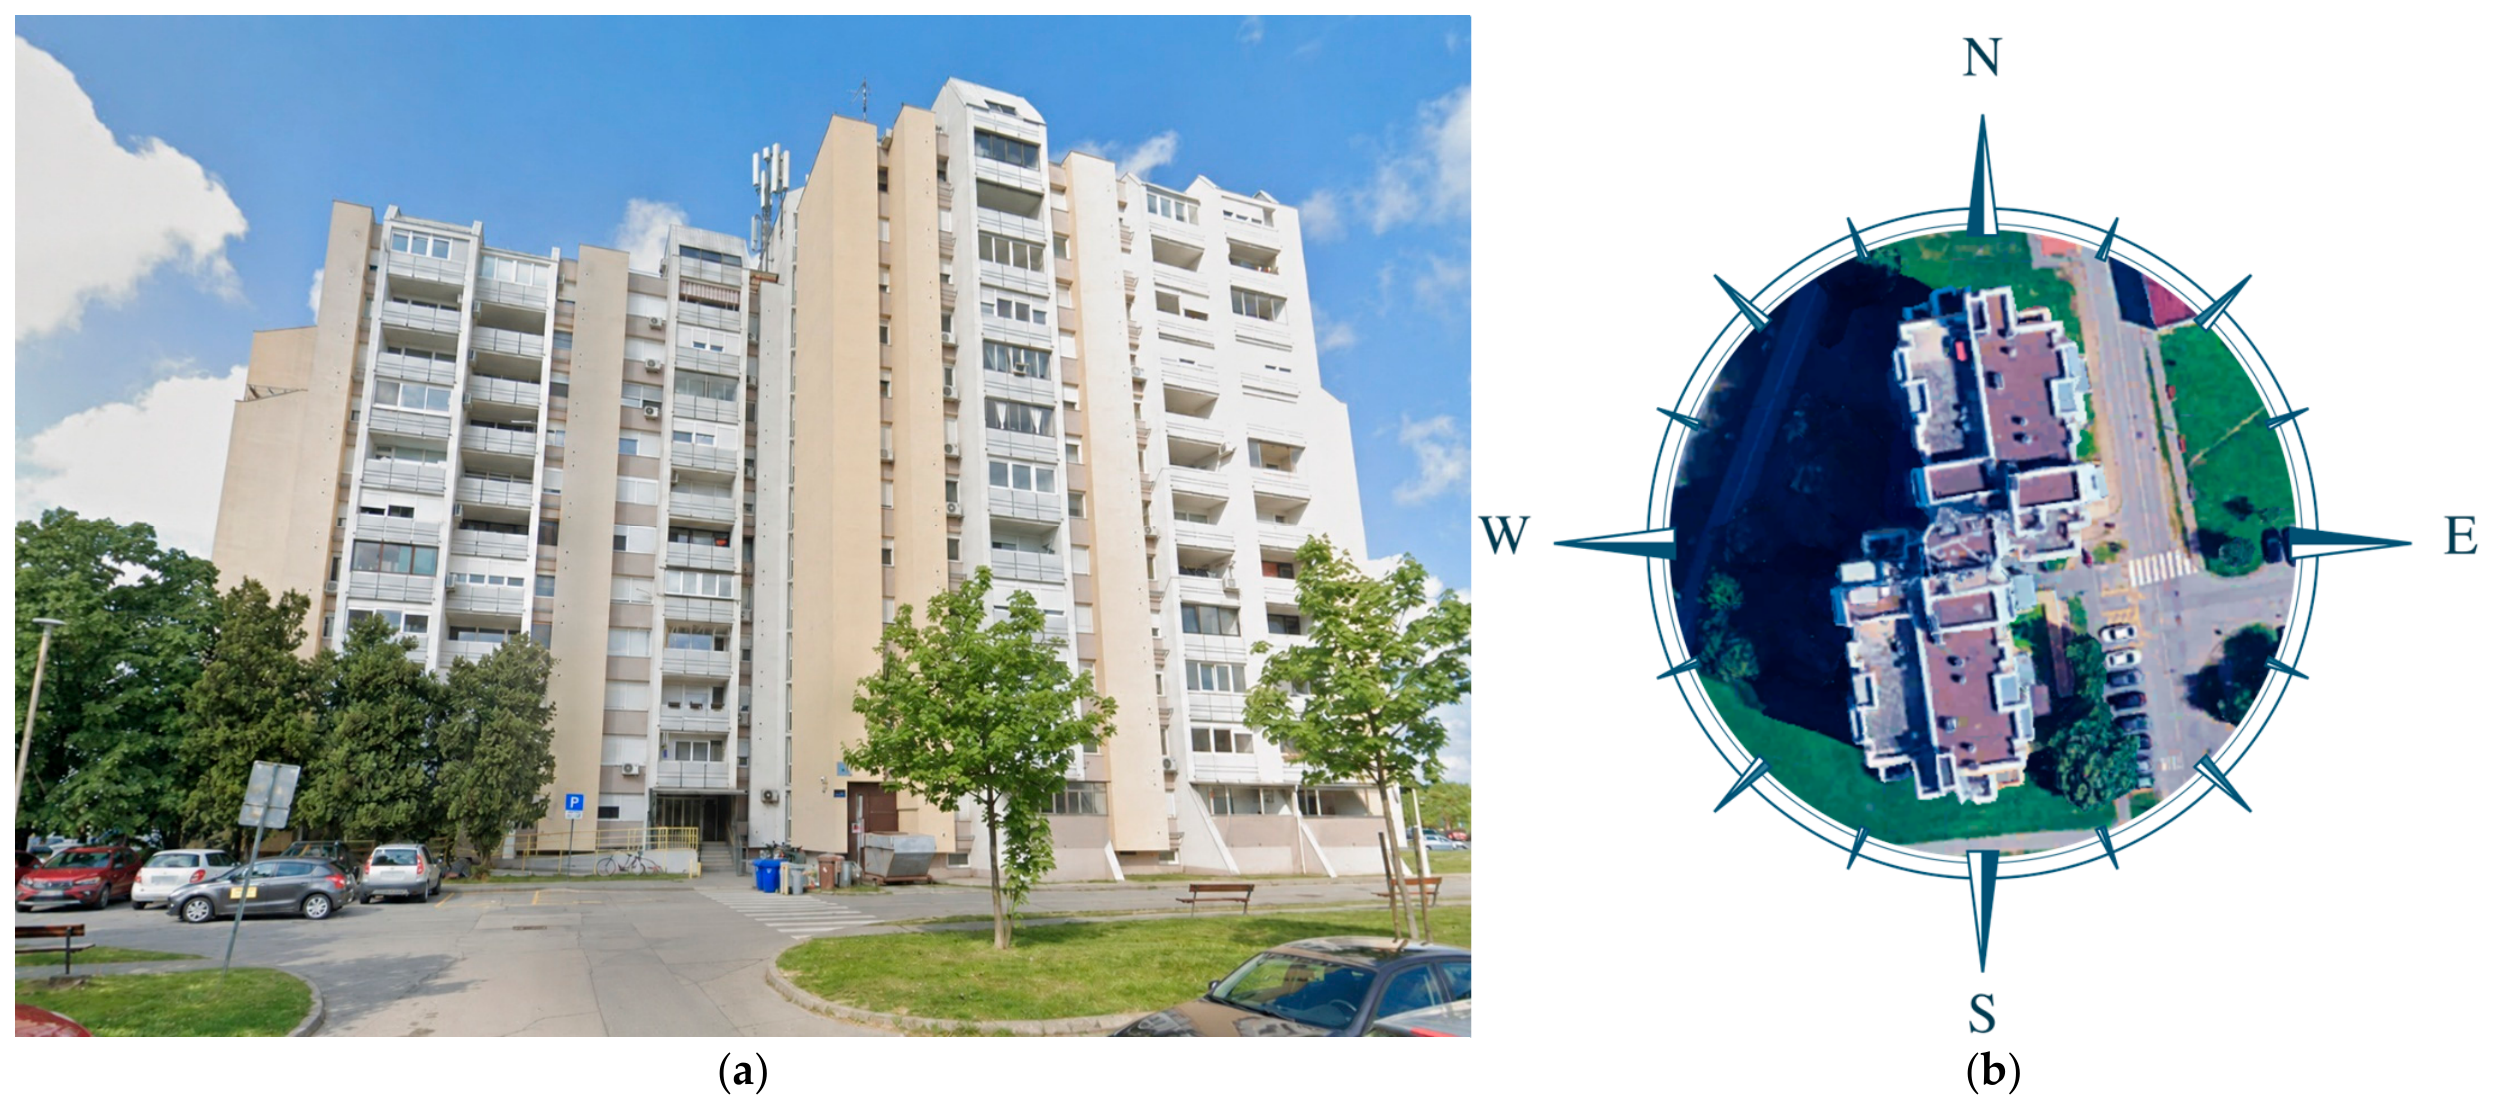
Figure 1 shows the analysed multi-apartment residential building, while its main geometric and operational characteristics are summarised in Table 1.
Figure 1.
Case-study multi-apartment residential building at Sjenjak 101 in Osijek, Croatia: (a) building photograph; (b) aerial view of the building showing its orientation relative to the cardinal directions.
Table 1.
Geometric and operational characteristics of the analysed building.
The total heated floor area is 8976 m2 and the heated volume is 24,684 m3. The floor-to-floor height is 2.75 m. The building has an elongated geometry, with its longitudinal axis approximately aligned north–south and its longer façades facing approximately east and west. This orientation affects the temporal distribution of solar gains during the analysed heating period and was explicitly represented in the simulation model.
The reference indoor air temperature was set to 22 °C for the comparison between simulated and measured heating energy consumption. This value was adopted as a representative whole-building operating setpoint because the building contains 135 apartments and a single uniform indoor temperature cannot be determined for all dwellings. Actual indoor temperatures may vary among apartments because of differences in occupant preferences, heating-system control, apartment position, solar exposure, and window-opening behaviour. Therefore, the selected value represents a modelling assumption for the building as a whole rather than a directly measured temperature common to all apartments.
2.2. Building Envelope Characteristics
The energy retrofit was completed in 2017 and included improvements to the thermal insulation of the building envelope and partial replacement of existing windows. Mineral wool with a thickness of 15 cm was installed over most façade surfaces. Owing to architectural and geometric constraints, reduced thicknesses were applied locally: 8 cm around selected window openings to preserve opening dimensions and 6 cm near the fire staircase to maintain the required clear width.
The roof was upgraded by installing a new 10 cm thermal insulation layer above the existing 10 cm layer, thereby increasing the thermal resistance of the roof assembly.
During renovation, part of the original glazing was replaced with PVC windows, while some existing windows remained. The envelope therefore contains transparent components with different thermal properties. Several balconies were also enclosed. Balconies integrated into heated apartments were insulated and included in the conditioned volume, whereas enclosed but unheated balconies were represented as buffer zones between the heated interior and the outdoor environment.
The thermal transmittance values reported in Table 2 were obtained from the building technical documentation and the 2017 energy-renovation documentation provided by HEP Toplinarstvo, Osijek. Because the building envelope comprises both renovated and original components, the U-values vary with construction type and façade position. External-wall U-values range from 0.17 to 0.46 W/(m2·K), window U-values from 1.4 to 4.0 W/(m2·K), roof U-values from 0.17 to 0.60 W/(m2·K), and floor U-values from 0.31 to 3.50 W/(m2·K). These documented post-retrofit values were used directly as TRNSYS input data, with individual construction assemblies represented separately where differences in construction type or boundary conditions required specific treatment.
Table 2.
Thermal transmittance ranges of the building envelope after retrofit.
Internal partitions separating conditioned and unconditioned spaces were also included. Their total area is 3352.8 m2, with an average thermal transmittance of 2.65 W/(m2·K). These elements account for heat transfer from heated zones to corridors, buffer spaces, and enclosed unheated balconies.
2.3. District Heating System and Energy Measurement Boundary
The analysed building is connected to the district heating network operated by HEP Toplinarstvo d.o.o. Thermal energy is delivered to a central heat substation located within the building and subsequently distributed to the apartments through a vertical-riser heating system.
The building does not contain an individual heat-generation system. The thermal energy used for space heating is supplied by the district heating network and measured at the building level by the utility provider. Monthly consumption records obtained from the heat meter were used as the reference dataset for comparison with the TRNSYS simulation results.
To ensure a consistent comparison, the system boundary adopted in this study corresponds to the thermal energy used for space heating at the whole-building level. Domestic hot-water preparation was not included in either the measured dataset or the TRNSYS model. Therefore, the measured monthly consumption data represent thermal energy supplied exclusively for space heating.
The TRNSYS model employed an ideal heating system that supplied the thermal energy required to maintain the prescribed indoor temperature. Consequently, the simulated values represent the useful thermal energy demand of the conditioned building zones and do not explicitly include heat-generation efficiency, distribution losses, pumping electricity, or auxiliary energy use.
Because the measured energy was recorded at the building heat substation, minor differences between the measured and simulated values may also reflect heat losses within the internal distribution system, variations in heating-system control, and other operational effects that were not explicitly represented in the idealised TRNSYS heating model.
2.4. Measured Heating Energy Consumption
Monthly space-heating energy consumption data for the analysed building were obtained from utility records based on the building-level heat metre located at the district heating substation. The dataset covers October 2024 to April 2025 and was used to evaluate the TRNSYS model.
The analysis was limited to October–April because complete monthly consumption records were available for this period. All measured and simulated seasonal totals reported in this study therefore refer to this analysed period, which should be distinguished from the broader official heating-season framework of 15 September to 15 May.
Measured and simulated values were compared both monthly and over the entire analysed period. The total measured space-heating energy consumption amounted to 666.16 MWh, with monthly values presented in Table 3. Consumption increased towards winter, peaked in January, and decreased during spring. The lowest values were recorded in October and April.
Table 3.
Measured monthly heating energy consumption during the analysed period from October 2024 to April 2025.
2.5. Climatic Data
Hourly weather data required for the TRNSYS simulations were obtained from the Climate.OneBuilding.org database. The database provides typical meteorological year weather files generated using the TMYx methodology and containing hourly values of outdoor air temperature, relative humidity, solar radiation, wind speed, and other meteorological parameters required for dynamic building energy simulation.
For the comparison between simulated and measured heating energy consumption, the TMYx weather file for Čepin was selected because it represents the closest available weather dataset to the building location in Osijek. The file was used to provide representative climatic boundary conditions for the Osijek area. However, because a typical meteorological year consists of representative months selected from a multi-year observation period, it does not reproduce the exact weather conditions that occurred during the analysed October 2024–April 2025 period. Therefore, the comparison should be interpreted as an assessment of model consistency rather than as an exact historical validation of the October 2024–April 2025 heating season.
For the climatic sensitivity analysis, weather files representing Osijek/Čepin, Slavonski Brod, Zagreb, Rijeka, Zadar, and Split were used. The locations were selected to span the principal Köppen–Geiger climate types relevant to the investigated Croatian regions, including the temperate fully humid climate of the continental locations, the warmer humid climate of the northern Adriatic, and the Mediterranean climate of the central and southern Adriatic. This selection therefore provides an objective climatic gradient from inland continental conditions to the warmer coastal conditions represented by Rijeka, Zadar, and Split [24].
The same building model and identical modelling assumptions were used for all six climatic locations, including building geometry, envelope characteristics, thermal zoning, internal gains, occupancy schedules, heating operation, indoor temperature setpoints, and effective air-change-rate combinations. Only the corresponding TMYx weather file was changed for each location. Therefore, differences among the simulated heating energy demands can be attributed to the climatic boundary conditions represented by the respective weather datasets.
2.6. TRNSYS Model Development
A dynamic simulation model of the analysed multi-apartment residential building was developed in TRNSYS 18 [6]. The building was represented using Type 56, the standard multizone building component, which calculates transient heat transfer through the envelope while accounting for solar and internal gains, infiltration, ventilation, and weather-dependent boundary conditions.
Building geometry was defined from the available design and energy-audit documentation. The model comprised four thermal zones: one heated residential zone with a floor area of 8976 m2 and three unheated zones comprising corridors (1356 m2), enclosed unheated loggias (432 m2), and the basement (900 m2), giving a total unheated floor area of 2688 m2. The overall window-to-wall ratio (WWR) was approximately 35.5%. Internal heat gains from occupants, lighting, household appliances, and other internal sources were represented by an aggregate specific heat gain of 5 W/m2, applied from 06:00 to 23:00. Building orientation and façade exposure were explicitly represented to account for orientation-dependent solar gains during the analysed heating period.
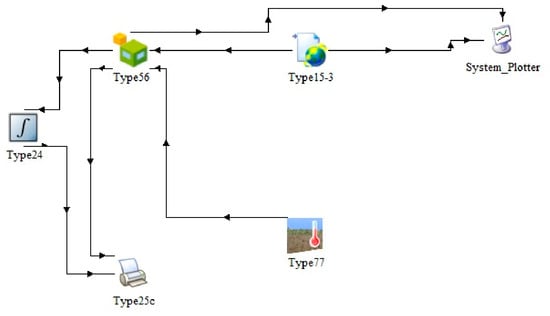
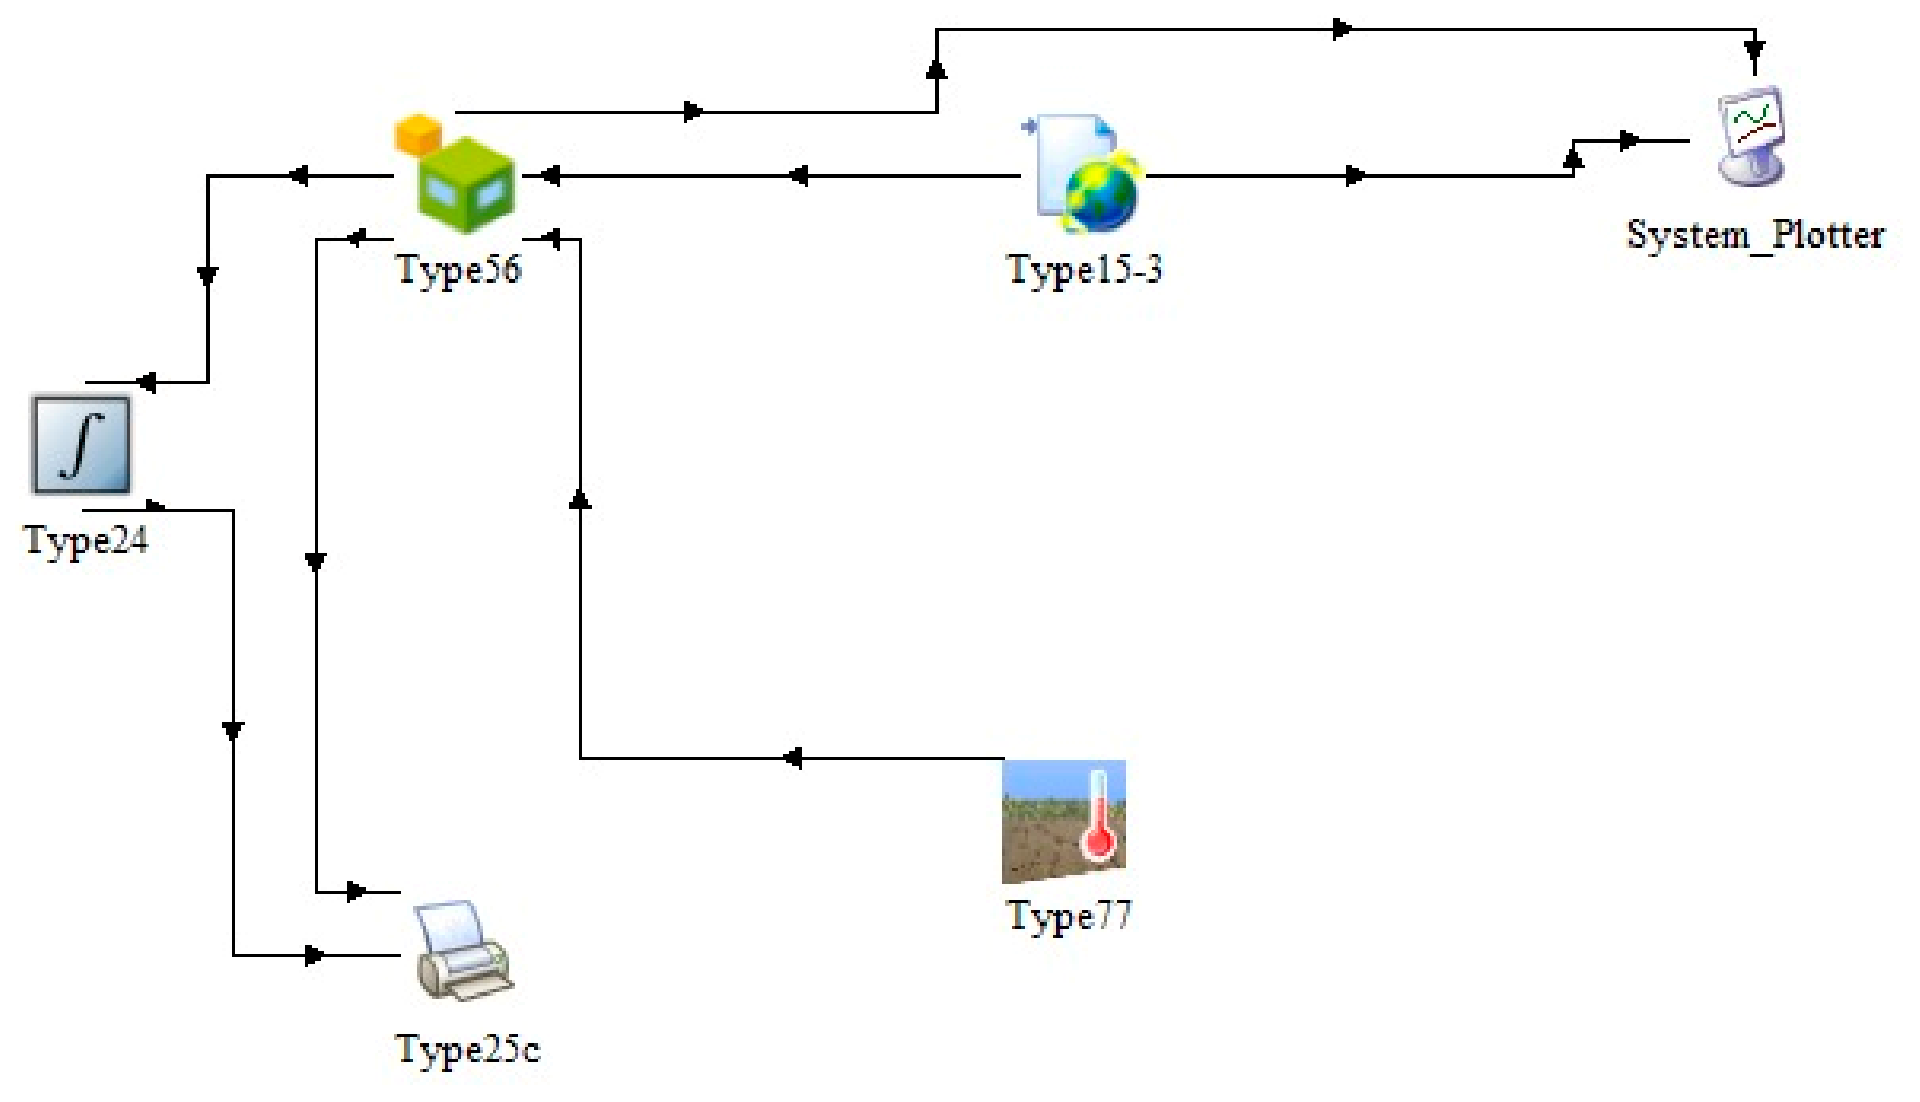
Figure 2 illustrates the structure of the TRNSYS model used in the analysis. The Type 56 multizone building component is coupled with the components required for weather-data input, data processing, and result output, enabling hourly simulation of the building thermal response under the investigated operating and climatic conditions.
Figure 2.
TRNSYS simulation model of the analysed multi-apartment residential building, including the Type 56 multizone building component and the main components used for weather data input, data processing, and result output.
Thermal properties of walls, windows, roofs, floors, and partitions towards unconditioned spaces were assigned according to the post-retrofit characteristics presented in Section 2.2. Individual construction assemblies were used where differences in insulation thickness, glazing type, or boundary conditions required separate representation.
Hourly weather boundary conditions were introduced using the TMYx files described in Section 2.5. The corresponding dataset was selected for each climatic scenario without changing the building model or operating assumptions.
Continuous availability of space heating was assumed during the analysed heating period. The heating system was represented as an ideal heating component that supplied the thermal energy required to maintain the prescribed indoor air temperature setpoint. The simulated output therefore represents the useful space-heating energy demand of the building zones rather than the primary energy consumption or the energy input of a specific heat-generation system. Heat-generation efficiency, internal distribution losses, pumping electricity, and auxiliary energy use were not explicitly modelled.
Internal heat gains from occupants, appliances, and lighting were included using a consistent residential schedule. Solar gains were calculated dynamically from façade orientation, glazing properties, and hourly solar radiation. Type 56 was used to calculate transient heat transfer through opaque and transparent elements and between heated and adjacent unheated zones.
Air exchange was represented by a constant effective air-change rate throughout the analysed heating period. In the present model, this parameter represents the combined effect of uncontrolled air infiltration through the building envelope and natural ventilation associated with occupant window opening. These two contributions were not modelled separately because airtightness measurements, continuous air-change measurements, and detailed data on window-opening behaviour were not available for the analysed building.
A reference effective air-change rate of 0.50 h−1 was specified for the comparison with measured heating consumption. This value was adopted as a representative whole-building modelling assumption for an existing partially renovated multi-apartment residential building rather than as a directly measured parameter.
For the parametric analysis, the effective air-change rate was varied from 0.30 to 0.70 h−1 in increments of 0.05 h−1, resulting in nine air-change levels. The selected range was centred around 0.50 h−1, which corresponds to the minimum air-change rate specified for occupied residential buildings in the Croatian technical regulation on rational energy use and thermal protection in buildings [25]. The wider range of 0.30–0.70 h−1 was adopted for sensitivity analysis rather than as a regulatory compliance interval. It is also consistent with measured variability reported for renovated multi-apartment residential buildings in Central Europe, where winter air-change rates after renovation have been reported to range approximately from 0.21 to 0.76 h−1 [26]. The investigated range therefore represents plausible lower and higher whole-building air-exchange conditions associated with differences in envelope airtightness and occupant window-opening behaviour.
2.7. Reference Model Assumptions and Evaluation Procedure
The reference model was defined using an indoor temperature of 22 °C and an effective air-change rate of 0.50 h−1. The reference indoor temperature of 22 °C was selected as a representative heating setpoint for occupied residential spaces and is consistent with the thermal comfort conditions specified in HRN EN 16798-1:2019 [27]. The reference effective air-change rate of 0.50 h−1 was adopted based on published residential air-exchange data; Nazaroff [28] reported a geometric mean residential air-change rate of approximately 0.50 h−1 based on a review of around 40 studies and approximately 10,000 homes. Since building-specific measurements of indoor temperature and air-change rate were not available, both values were treated as reference assumptions. Their influence was subsequently examined through sensitivity ranges of 18–26 °C and 0.30–0.70 h−1, respectively. Neither the indoor temperature setpoint nor the effective air-change rate was adjusted to improve agreement between measured and simulated energy consumption.
Consequently, the procedure applied in this study represents a comparison-based model evaluation rather than a formal calibration process. The simulated monthly and total heating energy demands over the analysed heating period were compared with measured building-level district heating consumption.
The main assumptions used in the reference simulation are summarised in Table 4. These assumptions define the baseline case against which the model was evaluated and subsequently provide a consistent reference for the parametric analysis.
Table 4.
Main modelling assumptions.
2.8. Statistical Indicators
The agreement between measured and simulated monthly heating energy consumption was evaluated using the mean bias error (MBE), normalised mean bias error (NMBE), root mean square error (RMSE), and coefficient of variation of the root mean square error [CV(RMSE)]. The relative deviation of total seasonal heating energy consumption was also calculated. These statistical indicators are commonly used to evaluate the performance of building energy simulation models [21,22,23].
The mean bias error was calculated as:
where Si is the simulated heating energy consumption for month i, Mi is the corresponding measured value, and n is the number of monthly observations. Positive MBE values indicate overall model overprediction, whereas negative values indicate underprediction.
The normalised mean bias error (NMBE) was determined according to:
where is the average measured heating energy consumption. NMBE provides a normalised measure of systematic error and facilitates comparison between different models.
The root mean square error (RMSE) was calculated using:
RMSE represents the overall magnitude of the monthly simulation errors and gives greater weight to months with larger deviations.
Coefficient of variation of the root mean square error was determined as:
The relative deviation of total seasonal heating energy consumption was determined as:
These indicators were used to evaluate systematic bias, the magnitude of monthly deviations, and the agreement between measured and simulated seasonal heating energy consumption.
2.9. Full-Factorial Parametric Analysis
Following model evaluation, a full-factorial parametric analysis was defined to quantify the individual and combined effects of indoor temperature setpoint, effective air-change rate, and climatic conditions on heating energy demand.
Indoor air temperature was varied from 18 to 26 °C in increments of 1 °C, resulting in nine temperature levels. The investigated temperature range was selected to encompass a broad spectrum of residential heating conditions and occupant-related temperature settings. EN 16798-1 specifies winter operative-temperature ranges extending down to 18 °C for residential spaces, while previous residential monitoring studies have considered heating-season indoor temperatures up to 26 °C. Ryti et al. reported 18–26 °C as the acceptable heating-season range used in Finnish residential health regulations and observed substantial variation among monitored apartments [29]. The selected range was therefore intended for sensitivity analysis and should not be interpreted as a recommended comfort range.
The effective air-change rate was varied from 0.30 to 0.70 h−1 in increments of 0.05 h−1, resulting in nine levels centred on the reference value of 0.50 h−1. The rationale for this range is provided in Section 2.6. It was adopted for sensitivity analysis and should not be interpreted as a regulatory compliance interval. All air-change-rate values were simulated at every indoor temperature setpoint.
The analysis was repeated for six Croatian locations: Osijek/Čepin, Slavonski Brod, Zagreb, Rijeka, Zadar, and Split. Building geometry, envelope properties, occupancy schedules, internal gains, and heating operation were kept unchanged across all scenarios.
The full-factorial design enables assessment of main effects and parameter interactions. For each location, all 81 combinations of indoor temperature and effective air-change rate were simulated, allowing the influence of air exchange to be evaluated at every temperature level and vice versa.
The combination of nine indoor temperature levels, nine effective air-change rates, and six climatic locations produces 486 simulation scenarios in total.
Table 5 summarises the investigated parameter ranges and the resulting factorial design.
Table 5.
Parameters included in the full factorial sensitivity analysis.
2.10. Analysed Outputs and Sensitivity Indicators
For each scenario, the analysed model outputs included total heating energy demand for the analysed heating period and specific heating energy demand per unit of heated floor area.
Relative sensitivity was expressed as ΔQH = (QH,i − QH,ref)/QH,ref × 100, where QH,i denotes the result for an investigated scenario and QH,ref is the corresponding reference value. Main effects were evaluated by varying one parameter while controlling the remaining factors, whereas combined effects were examined using the complete temperature–air-change-rate matrices for each climatic location.
A finite-difference interaction term was calculated to quantify the non-additive combined effect of indoor temperature and effective air-change rate:
Here QT,n denotes the seasonal heating energy demand calculated at indoor temperature T and effective air-change rate n. A positive value of I indicates that the combined effect of increasing both parameters exceeds the sum of their individual effects evaluated relative to the baseline combination of 18 °C and 0.30 h−1.
To provide a relative measure of interaction strength, the interaction term was additionally expressed relative to the sum of the individual temperature and air-change-rate effects:
The relative interaction term therefore represents the additional combined effect of indoor temperature and effective air-change rate as a percentage of the sum of their individual effects.
To quantify the relative importance of the investigated factors across the complete factorial design, an effect-size analysis based on variance decomposition was additionally performed. Because the dataset consists of deterministic simulation outputs with one result for each factor combination, inferential ANOVA p-values were not considered appropriate. Instead, eta-squared (η2) was calculated for the three main effects and their interactions as the ratio of the sum of squares associated with each effect to the total sum of squares. The resulting η2 values therefore represent the proportion of the total variation in seasonal heating energy demand attributable to each factor or interaction within the investigated parameter ranges.
3. Results
3.1. Model Evaluation Results
The reference TRNSYS model was evaluated by comparison with measured district heating consumption for the analysed October 2024–April 2025 period. The comparison included total seasonal energy consumption, monthly energy consumption, and statistical performance indicators.
The simulated seasonal heating energy demand was 670.61 MWh, whereas the measured district heating consumption was 666.16 MWh. The model therefore overestimated the measured seasonal value by 4.45 MWh, corresponding to a relative deviation of 0.67%.
Table 6 presents the measured and simulated monthly heating energy consumption. The model underestimated consumption in October, November, March, and April, while overprediction occurred from December to February. The largest absolute monthly deviation occurred in October, followed by January and December. Very close agreement was obtained for March and April.
Table 6.
Comparison of measured and simulated monthly heating energy consumption.
Although the seasonal totals were similar, the monthly results show that part of the seasonal agreement resulted from the partial cancellation of monthly underprediction and overprediction. These differences may partly reflect the use of representative TMYx weather data rather than the actual meteorological conditions recorded during the analysed period.
Positive deviations indicate model overprediction, while negative deviations indicate underprediction.
The calculated MBE and NMBE were 0.64 MWh and 0.67%, respectively, indicating close agreement at the seasonal level. However, the RMSE amounted to 13.57 MWh, and the CV(RMSE) was 14.26%, indicating greater variability between measured and simulated heating consumption at the monthly scale.
The model-evaluation indicators are summarised in Table 7.
Table 7.
Statistical indicators of the TRNSYS model evaluation.
Overall, the model reproduced the magnitude of seasonal heating energy consumption and the general monthly consumption pattern sufficiently well for the subsequent comparative parametric analysis. However, the observed monthly deviations should be considered when interpreting the sensitivity-analysis results.
3.2. Influence of Climatic Conditions
The influence of climatic conditions was evaluated under the reference operating conditions, defined by an indoor temperature setpoint of 22 °C and an effective air-change rate of 0.50 h−1. Building geometry, envelope characteristics, internal gains, occupancy schedules, and heating operation were maintained unchanged for all six locations. Consequently, the observed differences can be attributed to the climatic boundary conditions represented by the corresponding TMYx weather files.
Table 8 summarises the seasonal and specific heating energy demands for all six climatic locations under the reference operating conditions. The highest seasonal heating energy demand was obtained for Osijek/Čepin, amounting to 670.61 MWh, followed by Zagreb and Slavonski Brod, with 668.44 MWh and 658.69 MWh, respectively. Rijeka exhibited a moderately lower heating demand of 626.94 MWh. Considerably lower values were obtained for the Mediterranean coastal locations, amounting to 375.24 MWh for Zadar and 329.10 MWh for Split.
Table 8.
Heating energy demand under reference operating conditions for the considered climatic locations.
Compared with the Osijek/Čepin reference case, the seasonal heating energy demand was 0.32% lower in Zagreb, 1.78% lower in Slavonski Brod, 6.51% lower in Rijeka, 44.05% lower in Zadar, and 50.93% lower in Split. The difference between the highest and lowest simulated values amounted to 341.52 MWh.
The corresponding specific heating energy demand ranged from 74.71 kWh/m2 for Osijek/Čepin to 36.66 kWh/m2 for Split. The relatively similar results obtained for the continental locations indicate comparable heating requirements under the selected weather datasets. In contrast, the substantially lower values obtained for Zadar and Split reflect the milder winter conditions represented by the Mediterranean coastal weather files. Rijeka showed a smaller reduction than the other coastal locations, indicating that coastal location alone does not necessarily result in equally low heating demand and that the specific characteristics of the local weather dataset remain important.
3.3. Influence of Indoor Temperature
The influence of the indoor temperature setpoint on seasonal heating energy demand was analysed at a constant effective air-change rate of 0.50 h−1. The indoor temperature was varied from 18 to 26 °C in increments of 1 °C for all six climatic locations.
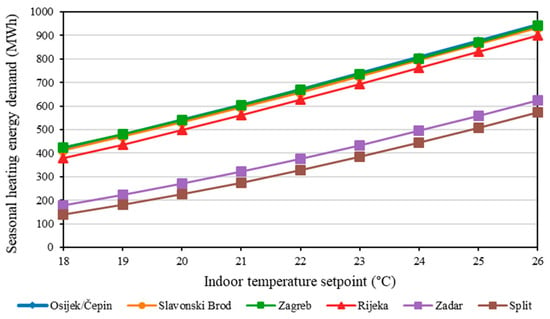
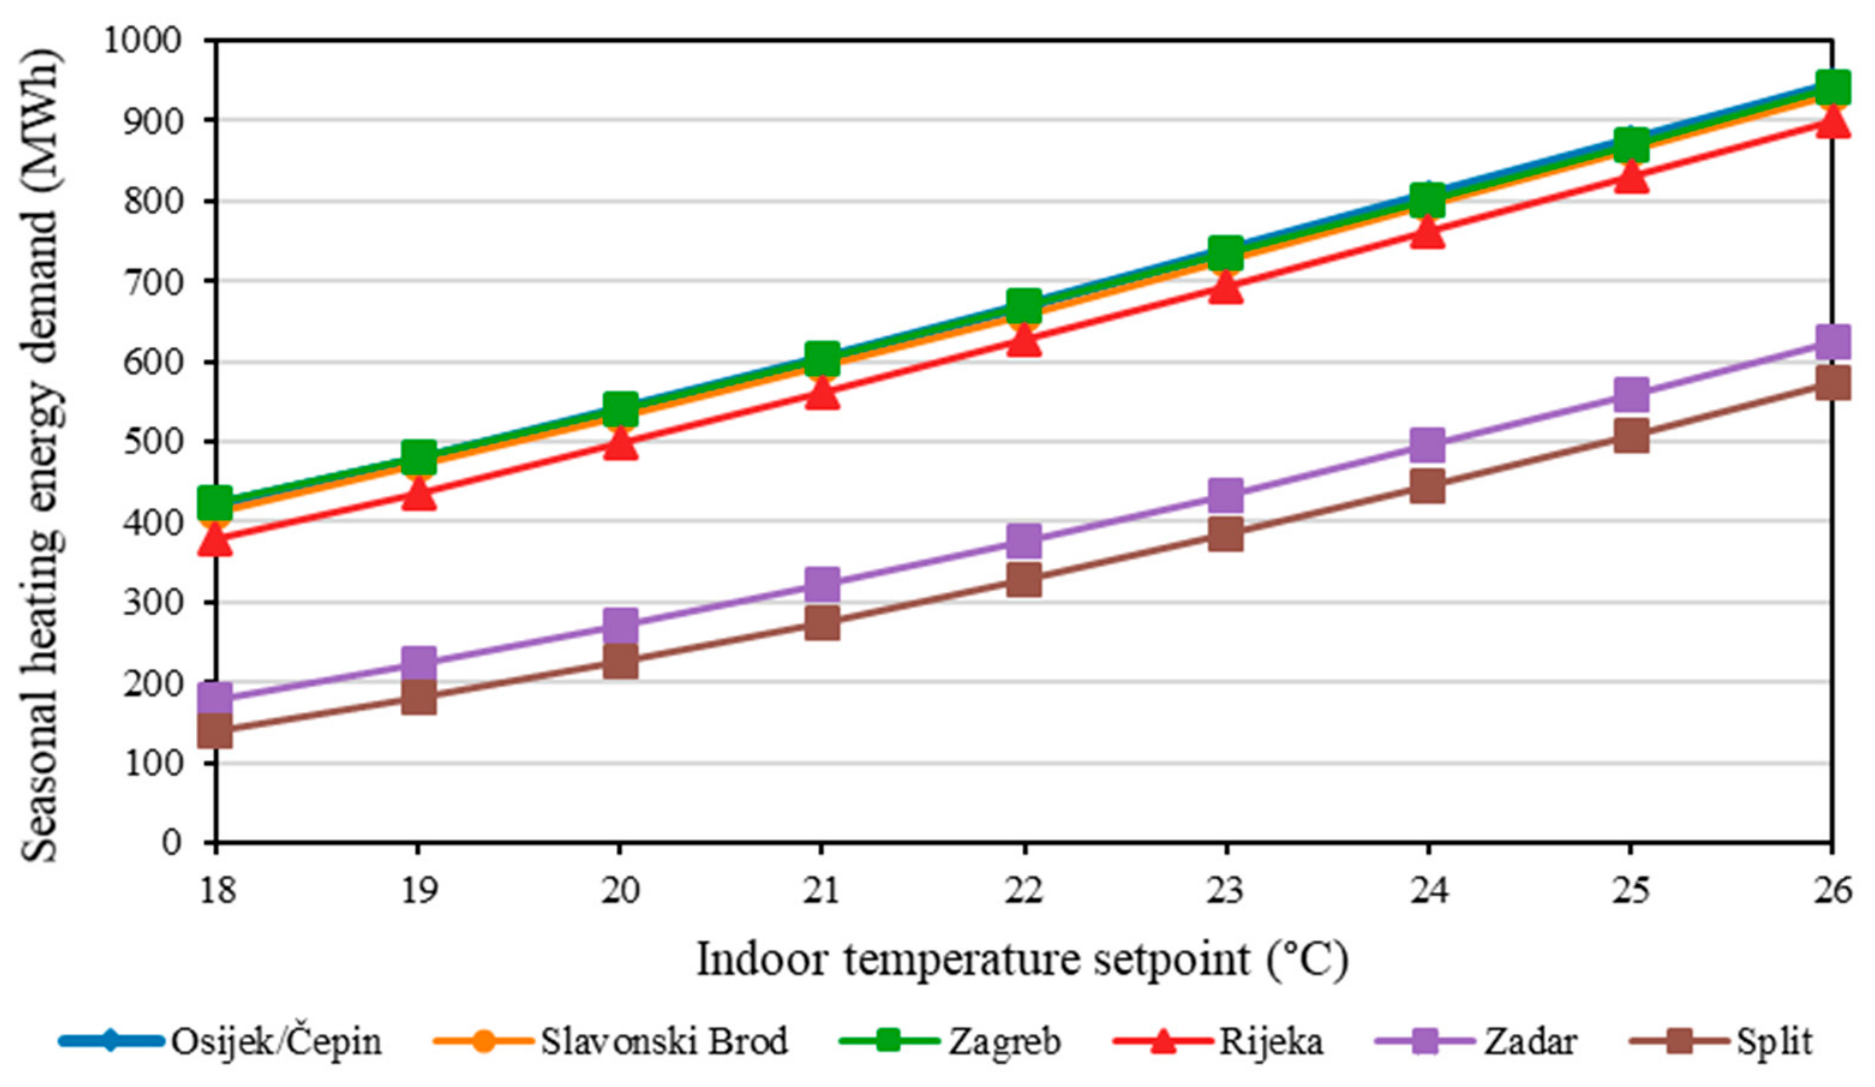
Seasonal heating energy demand increased continuously with increasing indoor temperature in all climatic locations, as shown in Figure 3. At an indoor temperature of 18 °C, the simulated heating demand ranged from 140.54 MWh in Split to 423.52 MWh in Zagreb. At the reference temperature of 22 °C, the corresponding values ranged from 329.10 MWh in Split to 670.61 MWh in Osijek/Čepin. When the indoor temperature was increased to 26 °C, the heating demand ranged from 573.17 MWh in Split to 945.41 MWh in Osijek/Čepin.
Figure 3.
Influence of indoor temperature setpoint on seasonal heating energy demand for the six considered Croatian climatic locations at a constant effective air-change rate of 0.50 h−1. Each curve represents one climatic location.
Over the complete temperature range from 18 to 26 °C, the largest absolute increase was obtained for Osijek/Čepin, amounting to 525.32 MWh. Similar absolute increases were obtained for Rijeka, Slavonski Brod, and Zagreb, ranging from 517.20 to 522.59 MWh. The corresponding average increase ranged from 64.65 to 65.66 MWh per 1 °C increase in indoor temperature for the continental and maritime locations.
Lower absolute increases were obtained for the Mediterranean locations. Seasonal heating energy demand increased by 447.25 MWh in Zadar and 432.63 MWh in Split, corresponding to average increases of 55.91 and 54.08 MWh/°C, respectively. However, because the heating demand at 18 °C was substantially lower in these locations, the corresponding relative increases were considerably larger, reaching 252.15% in Zadar and 307.83% in Split.
Table 9 summarises the heating energy demand and temperature sensitivity for all six climatic locations at a constant effective air-change rate of 0.50 h−1.
Table 9.
Heating energy demand and temperature sensitivity at the reference effective air-change rate for the considered climatic locations.
3.4. Influence of Effective Air-Change Rate
The influence of the effective air-change rate on seasonal heating energy demand was analysed at a constant indoor temperature setpoint of 22 °C. The effective air-change rate was varied from 0.30 to 0.70 h−1 in increments of 0.05 h−1 for all six climatic locations.
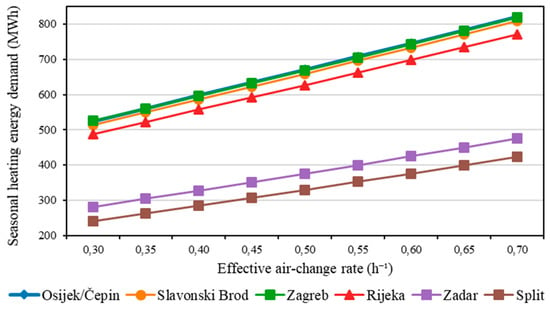
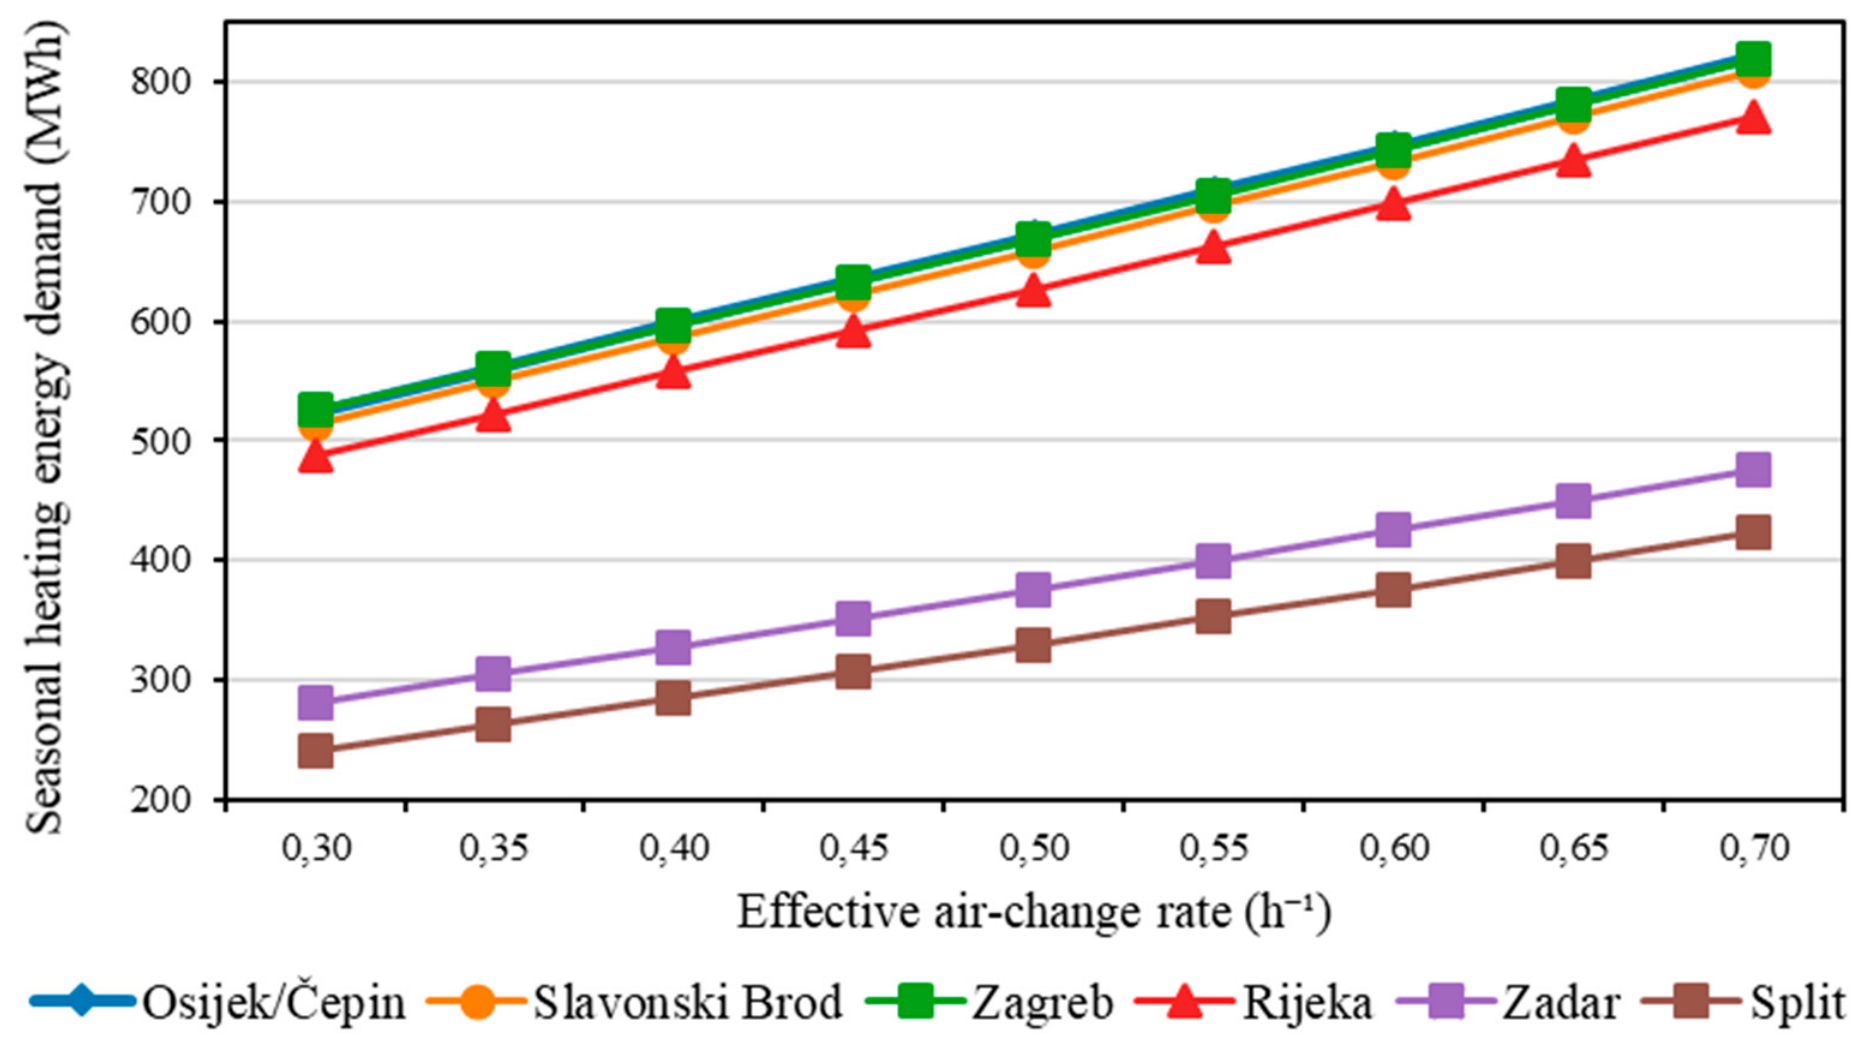
Seasonal heating energy demand increased continuously with increasing effective air-change rate in all climatic locations, as shown in Figure 4. At an effective air-change rate of 0.30 h−1, the simulated heating demand ranged from 239.87 MWh in Split to 524.86 MWh in Zagreb. At the reference effective air-change rate of 0.50 h−1, the corresponding values ranged from 329.10 MWh in Split to 670.61 MWh in Osijek/Čepin. When the effective air-change rate was increased to 0.70 h−1, the heating demand ranged from 422.54 MWh in Split to 821.02 MWh in Osijek/Čepin.
Figure 4.
Influence of effective air-change rate on seasonal heating energy demand for the six considered Croatian climatic locations at a constant indoor temperature setpoint of 22 °C. Each curve represents one climatic location.
Over the complete air-change-rate range from 0.30 to 0.70 h−1, the largest absolute increase was obtained for Osijek/Čepin, amounting to 296.55 MWh. Similar increases were obtained for Slavonski Brod and Zagreb, amounting to 294.50 and 293.42 MWh, respectively, while the corresponding increase for Rijeka was 282.45 MWh. For these locations, the average increase ranged from 70.61 to 74.14 MWh per 0.10 h−1 increase in effective air-change rate.
Lower absolute increases were obtained for the Mediterranean locations. Seasonal heating energy demand increased by 195.16 MWh in Zadar and 182.67 MWh in Split, corresponding to average increases of 48.79 and 45.67 MWh per 0.10 h−1, respectively. However, because the heating demand at an effective air-change rate of 0.30 h−1 was substantially lower in these locations, the relative increases were larger, reaching 69.60% in Zadar and 76.16% in Split.
The relationship between effective air-change rate and seasonal heating energy demand was approximately linear, with slightly larger energy increments generally occurring at higher air-change rates. These results demonstrate that air exchange substantially affects heating energy demand under all considered climatic conditions.
Table 10 summarises the heating energy demand and air-change-rate sensitivity for all six climatic locations at a constant indoor temperature setpoint of 22 °C.
Table 10.
Heating energy demand and air-change-rate sensitivity at the reference indoor temperature for the considered climatic locations.
3.5. Combined Effects of Indoor Temperature and Effective Air-Change Rate
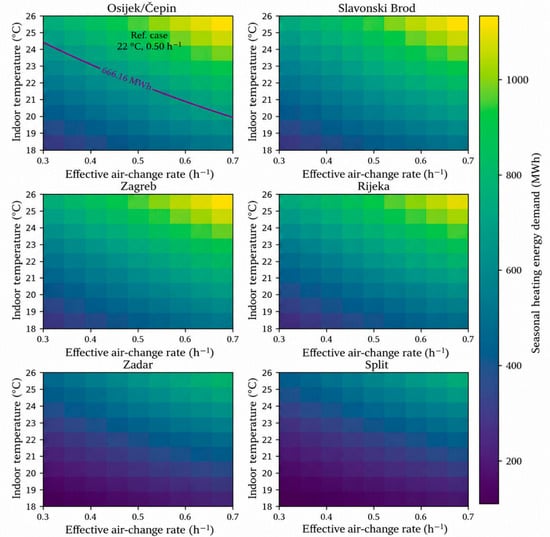
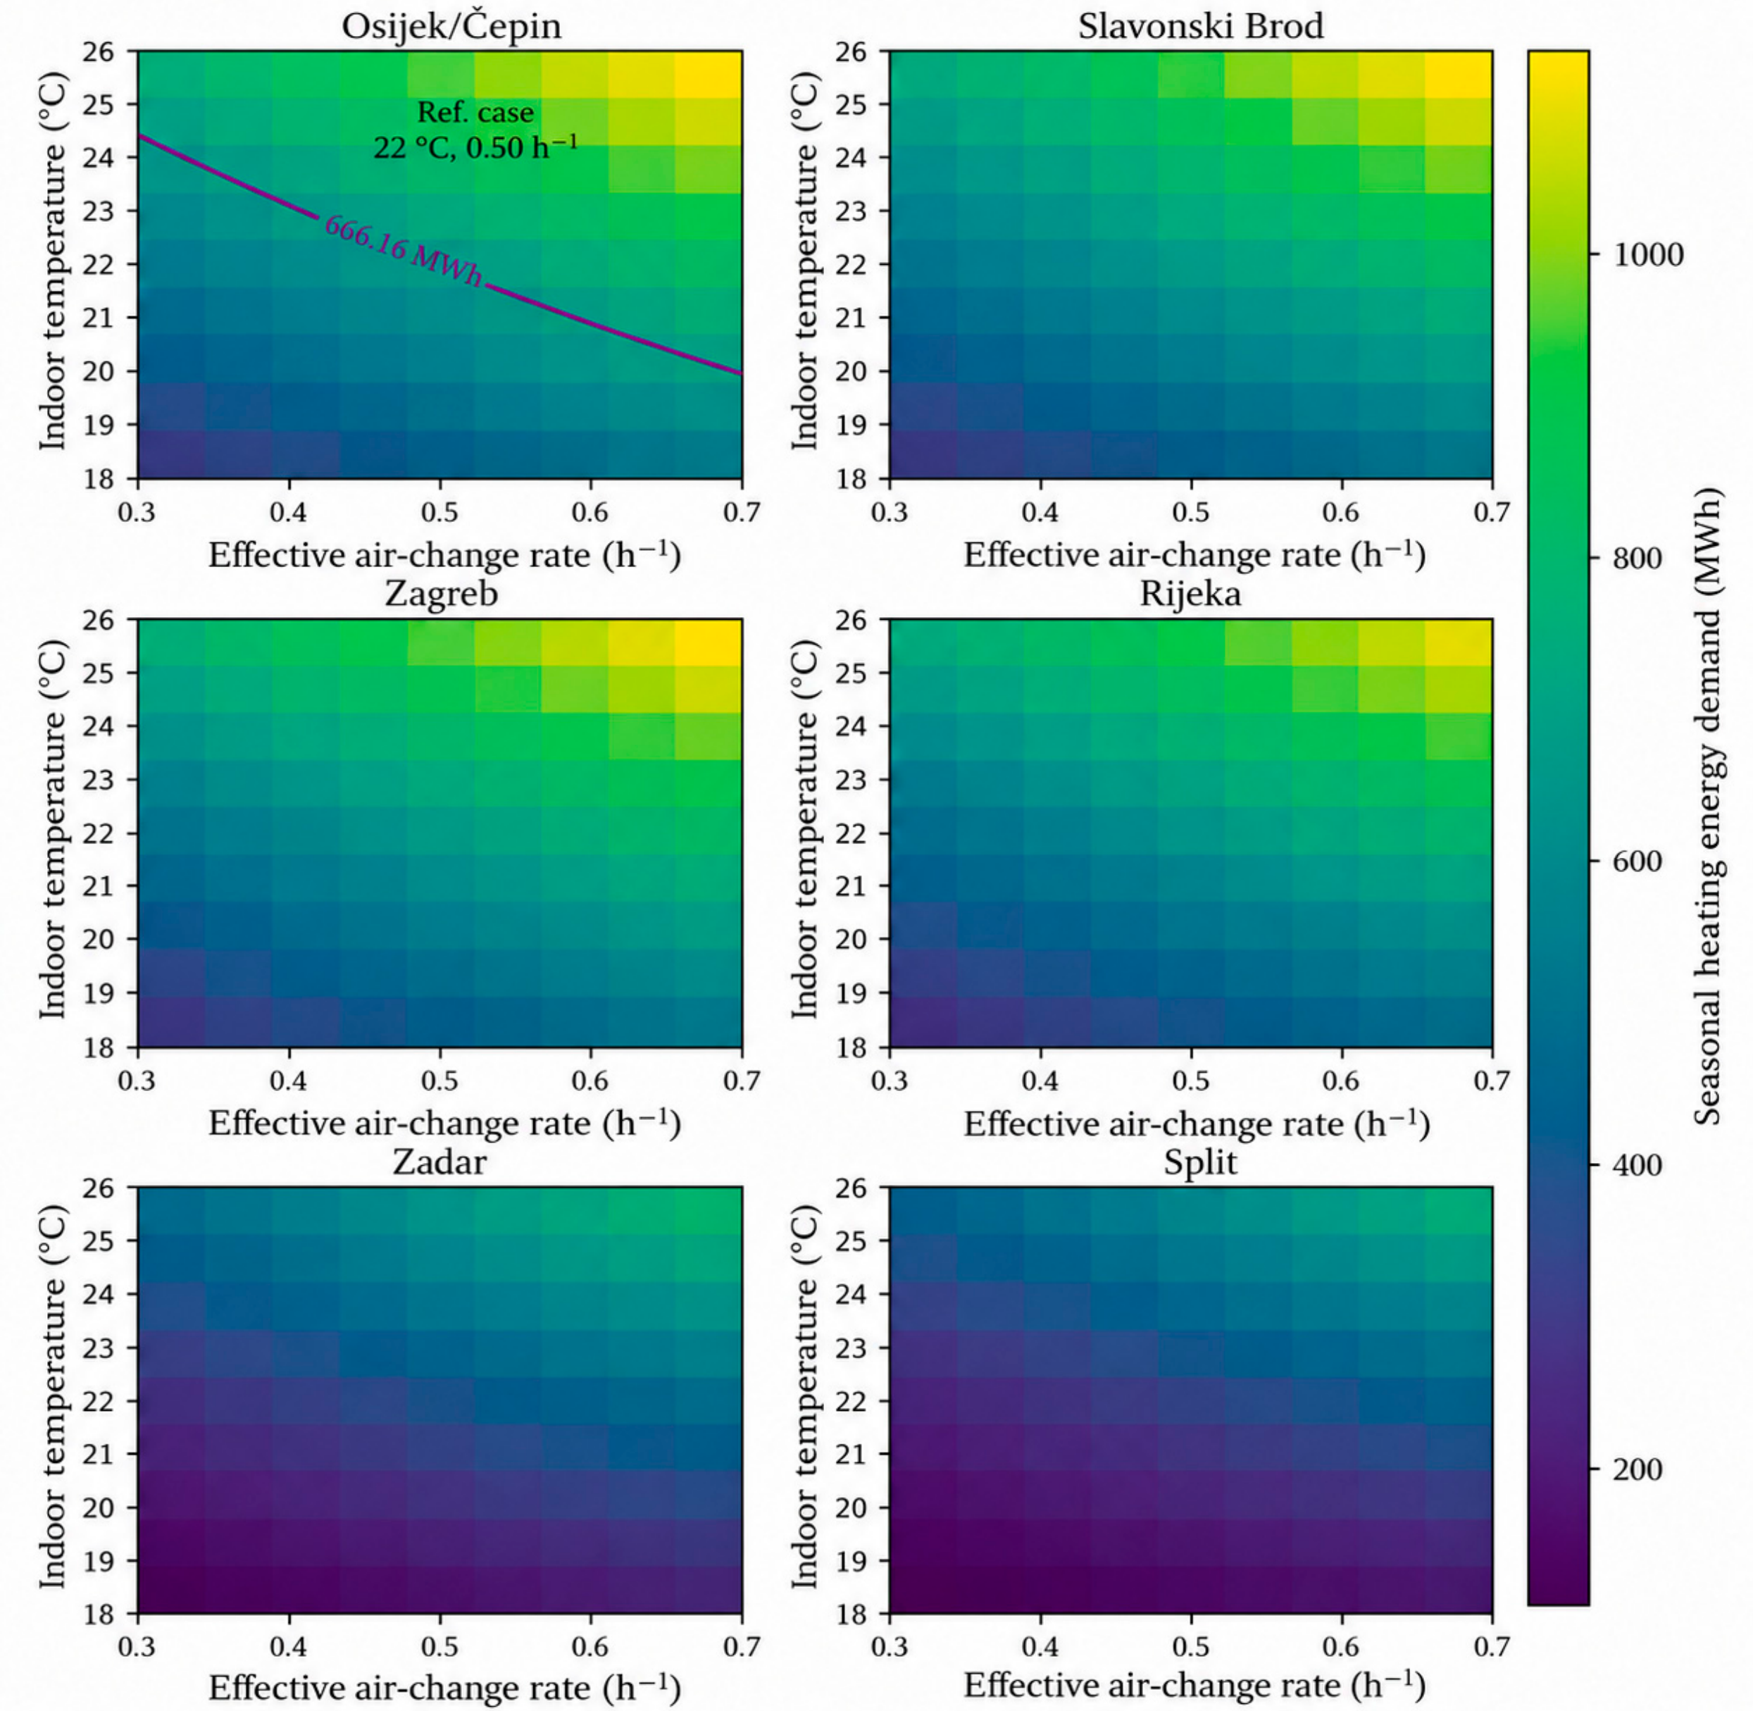
The combined effects of indoor temperature setpoint and effective air-change rate were analysed using the complete 9 × 9 simulation matrix for each climatic location. Seasonal heating energy demand was calculated for all combinations of indoor temperature from 18 to 26 °C and effective air-change rate from 0.30 to 0.70 h−1. The resulting response matrices are presented in Figure 5.
Figure 5.
Combined effects of indoor temperature setpoint and effective air-change rate on seasonal heating energy demand for the considered climatic locations. A common colour scale is used for all panels. For Osijek/Čepin, the measured seasonal heating consumption of 666.16 MWh is indicated as an additional reference. The complete numerical values underlying the response matrices are provided in Supplementary File S1.
For all climatic locations, the lowest heating energy demand was obtained for the combination of an indoor temperature of 18 °C and an effective air-change rate of 0.30 h−1, whereas the highest demand occurred at 26 °C and 0.70 h−1. The seasonal heating demand ranged from 318.41 to 1135.27 MWh for Osijek/Čepin, from 311.67 to 1121.75 MWh for Slavonski Brod, from 319.70 to 1129.80 MWh for Zagreb, and from 282.08 to 1085.01 MWh for Rijeka. Lower absolute values were obtained for the Mediterranean locations, ranging from 120.49 to 769.15 MWh in Zadar and from 92.30 to 710.17 MWh in Split.
The largest absolute difference between the minimum and maximum operating scenarios was obtained for Osijek/Čepin and amounted to 816.85 MWh. Comparable absolute increases were obtained for Slavonski Brod, Zagreb, and Rijeka, ranging from 802.94 to 810.10 MWh. The corresponding increases were 648.66 MWh for Zadar and 617.87 MWh for Split. However, because of the considerably lower baseline heating demand in the Mediterranean locations, the relative increases were substantially higher, reaching 538.36% in Zadar and 669.41% in Split.
The influence of air exchange became progressively greater as the indoor temperature setpoint increased. At 18 °C, increasing the effective air-change rate from 0.30 to 0.70 h−1 increased seasonal heating demand by between 99.45 MWh in Split and 212.38 MWh in Zagreb. At 26 °C, the same change in effective air-change rate produced increases ranging from 269.41 MWh in Split to 374.75 MWh in Osijek/Čepin. Similarly, the effect of increasing the indoor temperature became greater at higher effective air-change rates.
The calculated finite-difference interaction effect was positive for all climatic locations and ranged from 159.67 MWh in Zagreb to 169.96 MWh in Split. When expressed relative to the sum of the individual temperature and effective air-change-rate effects, the interaction contribution ranged from 24.55% in Zagreb to 37.95% in Split. The corresponding values were 25.33% for Osijek/Čepin, 25.42% for Slavonski Brod, 25.99% for Rijeka, and 34.56% for Zadar. These results indicate that the simultaneous increase in indoor temperature and effective air-change rate produced an additional increase in seasonal heating demand beyond the sum of their individual effects. The relative interaction contribution was greater in the Mediterranean locations, particularly in Split and Zadar, indicating a stronger non-additive contribution relative to the summed individual parameter effects. This non-additive behaviour is consistent with previous sensitivity analyses of building energy models, which have shown that parameter interactions and higher-order effects may contribute substantially to model response [30].
The measured seasonal heating consumption of 666.16 MWh was additionally used as a reference when interpreting the 9 × 9 temperature–air-change-rate matrix for Osijek/Čepin. Since only one whole-building seasonal consumption value was available, the measured demand could not be associated independently with each simulated combination of indoor temperature and effective air-change rate. Instead, the measured value was used as a common reference to identify combinations producing a comparable seasonal heating demand. As illustrated in Figure 5, several combinations of indoor temperature and effective air-change rate yield values close to the measured consumption. This demonstrates that similar seasonal energy use may result from different combinations of these parameters and, consequently, that the actual operating conditions cannot be uniquely inferred from seasonal energy consumption alone. The complete numerical 9 × 9 temperature–air-change-rate matrices for all six climatic locations are provided as machine-readable Supplementary File S1 to facilitate reuse and independent analysis of the simulation results.
3.6. Effect-Size Analysis of the Full-Factorial Design
The effect-size analysis of all 486 simulation scenarios showed that indoor temperature was the dominant source of variation in seasonal heating energy demand, accounting for 48.06% of the total variance. Climatic location accounted for 37.76%, while the effective air-change rate accounted for 12.89%. Together, the three main effects explained 98.71% of the total variation within the investigated factorial design. The results of the effect-size analysis for all main factors and their interactions are summarized in Table 11.
Table 11.
Effect-size analysis of factors affecting seasonal heating energy demand.
The contributions of the interaction terms were considerably smaller when evaluated over the complete factorial dataset. The temperature × effective air-change-rate interaction accounted for 0.55% of the total variance, the effective air-change rate × climatic location interaction for 0.44%, and the temperature × climatic location interaction for 0.30%. The three-way interaction contributed less than 0.01%. These results confirm that indoor temperature, climatic location, and effective air-change rate are the principal determinants of the simulated heating demand, while the previously identified positive temperature–air-change-rate interaction represents a comparatively smaller contribution to the total variance across the complete parameter space.
4. Discussion
The results demonstrate that indoor temperature setpoint, effective air-change rate, and climatic conditions substantially affect the seasonal heating energy demand of the analysed multi-apartment residential building. The full-factorial analysis further showed that indoor temperature and air exchange should not be considered independently, because the influence of air exchange increased at higher indoor temperatures. By applying an identical building model and operating assumptions to six Croatian locations, the climatic effect was separated from differences in building geometry, envelope properties, internal gains, and occupancy schedules.
The reference TRNSYS model predicted seasonal heating energy demand within 0.67% of the measured consumption. However, the monthly CV(RMSE) of 14.26% shows that this close seasonal agreement partly resulted from the cancellation of monthly underprediction and overprediction. Monthly deviations may reflect differences between the representative TMYx weather data and the actual weather conditions, as well as variations in heating-system operation, indoor temperatures, window-opening behaviour, and internal distribution losses. The comparison should therefore be interpreted as a model evaluation rather than an exact historical validation of the October 2024–April 2025 heating season.
The full temperature-air-change-rate matrix also shows that different combinations of these parameters can produce similar seasonal heating demands. Consequently, the measured consumption of 666.16 MWh does not uniquely identify the building’s actual operating conditions. The reference values of 22 °C and 0.50 h−1 were predefined whole-building modelling assumptions and were not adjusted to improve agreement with measured consumption; the model was therefore evaluated rather than formally calibrated.
Climatic conditions had a pronounced influence on heating demand, with substantially lower values obtained for the Mediterranean locations than for the continental locations. However, the intermediate result obtained for Rijeka indicates that a simple distinction between continental and coastal climates is insufficient to explain local heating requirements. The specific combination of outdoor temperature, solar radiation, wind conditions, and heating-season characteristics represented by each weather dataset therefore remains important [17,18].
Indoor temperature had a strong and consistent effect in all locations. The absolute influence was greater in locations with higher heating requirements, whereas the relative increase was greatest in the Mediterranean locations because of their lower baseline demand. This distinction is important when interpreting sensitivity results, as a large percentage increase does not necessarily correspond to the largest absolute increase in energy consumption. The findings support previous studies identifying indoor temperature assumptions as a major source of uncertainty in residential building energy simulations, particularly where actual temperatures vary among dwellings [9,10,11,12,13,14,15].
The effective air-change rate also substantially affected heating demand. The absolute influence was greater in locations with higher heating requirements, whereas the relative effect was more pronounced in the Mediterranean locations because of their lower baseline demand. These findings confirm that the use of a single assumed air-change rate may introduce considerable uncertainty into predicted heating demand, particularly in existing buildings where envelope airtightness, window condition, wind exposure, and occupant window-opening behaviour are uncertain [16,19].
The main contribution of the full-factorial analysis is the quantified interaction between indoor temperature and effective air-change rate. The positive interaction effect of 159.67–169.96 MWh confirms that their combined influence was greater than the sum of their separate effects evaluated from the low-temperature and low-air-change-rate reference condition. The physical basis of this interaction follows directly from the sensible heat loss associated with air exchange, which is proportional to both the volumetric air-exchange rate and the indoor–outdoor temperature difference. Consequently, for the same increase in effective air-change rate, the additional heating load becomes larger as the indoor temperature setpoint increases because each unit volume of incoming outdoor air must be heated through a larger temperature difference. Conversely, increasing the indoor temperature produces a greater energy penalty when the air-change rate is high because a larger volume of outdoor air must be heated to the higher indoor setpoint. The two parameters therefore enter the air-exchange heat-loss term multiplicatively rather than independently, producing the observed positive interaction. In the present model, the effective air-change rate was prescribed independently of indoor temperature; therefore, this interaction represents a thermal heat-balance effect rather than a temperature-induced change in infiltration or occupant window-opening behaviour. Differences among climatic locations arise because the magnitude and duration of the indoor–outdoor temperature difference vary with the outdoor climatic conditions. This finding is consistent with previous sensitivity analyses of building energy models, which have shown that interactions between input parameters can contribute substantially to the overall model response [30].
The wide range between the minimum and maximum scenarios demonstrates that a deterministic calculation based on a single set of standard indoor-temperature and air-change-rate assumptions may conceal substantial variability in heating energy demand. This is particularly relevant for multi-apartment residential buildings, where indoor temperatures and window-opening behaviour vary among apartments and occupants.
From a practical and policy perspective, the findings are relevant to both building-renovation and district-heating decarbonisation objectives. The recast Energy Performance of Buildings Directive (Directive (EU) 2024/1275) establishes a framework for improving the energy performance and reducing the greenhouse-gas emissions of the European building stock, while explicitly recognising the importance of local climatic conditions and indoor environmental quality [1]. In this context, the present results show that assessments of existing residential buildings should account not only for envelope performance but also for realistic indoor-temperature and air-exchange assumptions, since these parameters can substantially modify heating demand and interact non-additively.
For Croatia, these findings are also relevant to the revised National Energy and Climate Plan for 2021–2030 and to national measures aimed at improving energy efficiency and decarbonising heating and cooling systems [31,32]. For district-heated multi-apartment buildings, more realistic representation of indoor temperature, effective air-change rate, and local climatic conditions can support demand forecasting, evaluation of renovation measures, and assessment of future heat-demand reductions. Such information may also assist district-heating operators and planners when evaluating network operation and decarbonisation measures. At the same time, reductions in uncontrolled air leakage and excessive indoor temperatures should not compromise thermal comfort or indoor air quality; therefore, energy-efficiency measures should be accompanied by an appropriate ventilation strategy.
Limitations and Future Research
Several limitations should be considered when interpreting the results. First, the analysis was based on a single multi-apartment residential building constructed in 1980 and energy-retrofitted in 2017. Its specific geometry, envelope characteristics, heating system, and occupancy assumptions limit the direct transferability of the reported numerical sensitivities to other building types. Second, indoor temperature and effective air-change rate were not measured directly in the analysed building. The reference values of 22 °C and 0.50 h−1 were therefore predefined whole-building modelling assumptions rather than measured operating conditions. Third, the effective air-change rate was assumed to remain constant throughout each simulation scenario. In reality, infiltration and natural ventilation vary over time as a function of wind conditions, indoor–outdoor temperature differences, building airtightness, and occupant window-opening behaviour. In addition, representative TMYx weather data were used instead of the actual meteorological conditions of the 2024–2025 heating season, and the heating system was represented using an idealised heating component without explicit modelling of distribution losses, control behaviour, pumping energy, or auxiliary consumption.
Future studies should address these limitations by analysing a larger sample of buildings with different construction periods, envelope characteristics, and heating systems. Continuous indoor-temperature monitoring in representative apartments, airtightness testing, direct air-change measurements, and monitoring of occupant window-opening behaviour would enable more realistic representation of operating conditions. Time-varying infiltration and natural ventilation models could then replace the constant effective air-change-rate assumption. The use of measured meteorological data and multi-year district-heating consumption records would support formal model calibration and assessment of interannual variability, while a more detailed representation of the district-heating system and internal distribution losses would improve the comparison between measured and simulated energy use.
5. Conclusions
This study investigated the sensitivity of seasonal heating energy demand to indoor temperature setpoint, effective air-change rate, and climatic conditions using an evaluated TRNSYS model of an existing district-heated multi-apartment residential building in Osijek, Croatia. The full-factorial analysis comprised 486 simulation scenarios covering nine indoor temperature setpoints, nine effective air-change rates, and six Croatian locations.
For the analysed case-study building, the reference model reproduced the overall seasonal heating consumption with a deviation of 0.67%. However, this close seasonal agreement was accompanied by larger month-to-month differences, with a CV(RMSE) of 14.26%, and partly resulted from the compensation between monthly underpredictions and overpredictions. The seasonal agreement should therefore be interpreted together with the monthly model-performance indicators rather than as evidence of uniformly close agreement throughout the heating period. Within the investigated parameter ranges, increasing the indoor temperature from 18 to 26 °C increased seasonal heating demand by 432.63–525.32 MWh, while increasing the effective air-change rate from 0.30 to 0.70 h−1 increased it by 182.67–296.55 MWh, depending on climatic location. These numerical values, as well as the absolute and relative differences among locations, are specific to the geometry, envelope characteristics, operating assumptions, and heating-system representation of the analysed building.
At the level of general thermal behaviour, the results are consistent with established heat-transfer principles. A higher indoor temperature increases the indoor–outdoor temperature difference and therefore increases transmission and air-exchange heat losses. Similarly, a higher effective air-change rate increases the amount of outdoor air that must be heated. Because air-exchange heat loss depends simultaneously on the air-exchange rate and the indoor–outdoor temperature difference, the energy penalty associated with increased air exchange becomes greater at higher indoor temperature setpoints. Climatic conditions further modify heating demand through differences in outdoor temperature, solar radiation, wind conditions, and heating-season characteristics.
The findings highlight the importance of realistic operating and climatic assumptions in building energy assessments. Appropriate indoor temperature control and reduced uncontrolled air leakage may contribute to lower heating demand, while ventilation behaviour also influences the overall air-exchange rate. Energy-saving measures should therefore maintain adequate thermal comfort and indoor air quality.
Future studies should incorporate measured weather conditions, continuous indoor-temperature monitoring, airtightness and air-change measurements, and detailed information on occupant window-opening behaviour, together with multi-year heating-consumption records, to reduce the remaining modelling uncertainty.
Supplementary Materials
The following supporting information can be downloaded at: https://www.mdpi.com/article/10.3390/su182010445/s1. Supplementary File S1: Machine-readable numerical dataset containing the complete 9 × 9 indoor-temperature-effective-air-change-rate matrices for Osijek/Čepin, Slavonski Brod, Zagreb, Rijeka, Zadar, and Split.
Author Contributions
Conceptualization, M.Ž. and M.Đ.; methodology, M.Đ. and A.B.; software, M.Đ.; validation, A.B., M.Đ. and K.Š.; formal analysis, M.Đ.; investigation, M.Đ. and A.B.; resources, K.Š.; data curation, M.Ž.; writing—original draft preparation, M.Đ. and A.B.; writing—review and editing, M.Ž. and K.Š.; visualisation, A.B.; supervision, K.Š.; project administration, M.Ž.; funding acquisition, K. Š. All authors have read and agreed to the published version of the manuscript.
Funding
This research paper was funded by the University of Slavonski Brod through the institutional research projects Advanced modelling and optimisation of compact heat exchangers for integration into renewable energy systems (MOKIT) and Research and modelling of processes in the context of Industry 4.0 and 5.0 (Smartmod4IND45), financed by the European Union– NextGenerationEU. The views and opinions expressed in this paper are those of the author and do not necessarily reflect the official position of the European Union or the European Commission. Neither the European Union nor the European Commission can be held responsible for them.
Institutional Review Board Statement
Not applicable.
Informed Consent Statement
Not applicable.
Data Availability Statement
The data supporting the findings of this study are available from the corresponding author upon reasonable request. The measured district-heating consumption data were obtained from utility records and are not publicly available due to third-party restrictions. The TMYx weather files used in the simulations are publicly available from the Climate.OneBuilding.org database. The numerical dataset underlying the full-factorial sensitivity analysis, including the complete 9 × 9 temperature–air-change-rate matrices for all six climatic locations, is provided as Supplementary File S1.
Conflicts of Interest
The authors declare no conflicts of interest.
Abbreviations
The following abbreviations are used in this manuscript:
| CV(RMSE) | Coefficient of Variation of the Root Mean Square Error |
| EPBD | Energy Performance of Buildings Directive |
| HVAC | Heating, Ventilation, and Air Conditioning |
| MBE | Mean Bias Error |
| NMBE | Normalised Mean Bias Error |
| RMSE | Root Mean Square Error |
| TMY | Typical Meteorological Year |
| TMYx | Typical Meteorological Year weather data generated using the TMYx methodology |
| TRNSYS | Transient System Simulation Tool |
References
- European Parliament and Council of the European Union. Directive (EU) 2024, 1275, of 24 April 2024 on the Energy Performance of Buildings (Recast). Off. J. Eur. Union 2024, 1275. [Google Scholar]
- International Energy Agency (IEA). Energy Efficiency 2024; International Energy Agency (IEA): Paris, France, 2024. [Google Scholar]
- Werner, S. International Review of District Heating and Cooling. Energy 2017, 137, 617–631. [Google Scholar] [CrossRef] [Scilit]
- Crawley, D.B.; Hand, J.W.; Kummert, M.; Griffith, B.T. Contrasting the Capabilities of Building Energy Performance Simulation Programs. Build. Environ. 2008, 43, 661–673. [Google Scholar] [CrossRef] [Scilit]
- EN ISO 52016-1:2017; Energy Performance of Buildings—Energy Needs for Heating and Cooling, Internal Temperatures and Sensible and Latent Heat Loads—Part 1: Calculation Procedures. European Committee for Standardization (CEN): Brussels, Belgium, 2017.
- Klein, S.A.; Beckman, W.A.; Mitchell, J.W.; Duffie, J.A.; Freeman, T.L. TRNSYS 18: A Transient System Simulation Program; Solar Energy Laboratory, University of Wisconsin–Madison: Madison, WI, USA, 2017. [Google Scholar]
- Rashad, M.; Żabnieńska-Góra, A.; Norman, L.; Jouhara, H. Analysis of Energy Demand in a Residential Building Using TRNSYS. Energy 2022, 254, 124357. [Google Scholar] [CrossRef] [Scilit]
- Tiltay, C.; Michailos, S.; Ozdemir, I.H.; Ingham, D.B.; Pourkashanian, M. Estimating Dynamic Energy Consumption in European Residential Houses: A Transient TRNSYS Model. Sustain. Energy Technol. Assess. 2026, 91, 105080. [Google Scholar] [CrossRef] [Scilit]
- Zhang, Y.; Bai, X.; Mills, F.P.; Pezzey, J.C.V. Rethinking the Role of Occupant Behavior in Building Energy Performance: A Review. Energy Build. 2018, 172, 279–294. [Google Scholar] [CrossRef] [Scilit]
- Ahmed, O.; Sezer, N.; Ouf, M.; Wang, L.; Hassan, I.G. State-of-the-Art Review of Occupant Behavior Modeling and Implementation in Building Performance Simulation. Renew. Sustain. Energy Rev. 2023, 185, 113558. [Google Scholar] [CrossRef] [Scilit]
- Mylonas, A.; Tsangrassoulis, A.; Pascual, J. Modelling Occupant Behaviour in Residential Buildings: A Systematic Literature Review. Build. Environ. 2024, 265, 111959. [Google Scholar] [CrossRef] [Scilit]
- Azar, E.; Menassa, C.C. A Comprehensive Analysis of the Impact of Occupancy Parameters in Energy Simulation of Office Buildings. Energy Build. 2012, 55, 841–853. [Google Scholar] [CrossRef] [Scilit]
- Hong, T.; Yan, D.; D’Oca, S.; Chen, C. Ten Questions Concerning Occupant Behavior in Buildings: The Big Picture. Build. Environ. 2017, 114, 518–530. [Google Scholar] [CrossRef] [Scilit]
- Yan, D.; O’Brien, W.; Hong, T.; Feng, X.; Burak Gunay, H.; Tahmasebi, F.; Mahdavi, A. Occupant Behavior Modeling for Building Performance Simulation: Current State and Future Challenges. Energy Build. 2015, 107, 264–278. [Google Scholar] [CrossRef] [Scilit]
- Gaetani, I.; Hoes, P.-J.; Hensen, J.L.M. Occupant Behavior in Building Energy Simulation: Towards a Fit-for-Purpose Modeling Strategy. Energy Build. 2016, 121, 188–204. [Google Scholar] [CrossRef] [Scilit]
- Guillén-Lambea, S.; Rodríguez-Soria, B.; Marín, J.M. Air Infiltrations and Energy Demand for Residential Low Energy Buildings in Warm Climates. Renew. Sustain. Energy Rev. 2019, 116, 109469. [Google Scholar] [CrossRef] [Scilit]
- Ascione, F.; De Masi, R.F.; Gigante, A.; Vanoli, G.P. Resilience to the Climate Change of Nearly Zero Energy-Building Designed According to the EPBD Recast: Monitoring, Calibrated Energy Models and Perspective Simulations of a Mediterranean NZEB Living Lab. Energy Build. 2022, 262, 112004. [Google Scholar] [CrossRef] [Scilit]
- Aşıkoğlu Metehan, A.; Şenel Solmaz, A.; Gök, O.; Tokuç, A. Adapting to Climate Change: Assessing Future Residential Energy Demands for Different Climate and Occupancy Scenarios in Turkey. Buildings 2025, 15, 1255. [Google Scholar] [CrossRef] [Scilit]
- Jokisalo, J.; Kurnitski, J.; Korpi, M.; Kalamees, T.; Vinha, J. Building Leakage, Infiltration, and Energy Performance Analyses for Finnish Detached Houses. Build. Environ. 2009, 44, 377–387. [Google Scholar] [CrossRef] [Scilit]
- Croatian Meteorological and Hydrological Service (DHMZ). Climate of Croatia: General Characteristics. Available online: https://meteo.hr/klima_e.php?param=k1§ion=klima_hrvatska (accessed on 15 July 2026).
- Raftery, P.; Keane, M.; Costa, A. Calibrating Whole Building Energy Models: Detailed Case Study Using Hourly Measured Data. Energy Build. 2011, 43, 3666–3679. [Google Scholar] [CrossRef] [Scilit]
- Eguía-Oller, P.; Martínez-Mariño, S.; Granada-Álvarez, E.; Febrero-Garrido, L. Empirical Validation of a Multizone Building Model Coupled with an Air Flow Network under Complex Realistic Situations. Energy Build. 2021, 249, 111197. [Google Scholar] [CrossRef] [Scilit]
- Heo, Y.; Choudhary, R.; Augenbroe, G.A. Calibration of Building Energy Models for Retrofit Analysis under Uncertainty. Energy Build. 2012, 47, 550–560. [Google Scholar] [CrossRef] [Scilit]
- Beck, H.E.; Zimmermann, N.E.; McVicar, T.R.; Vergopolan, N.; Berg, A.; Wood, E.F. Present and Future Köppen-Geiger Climate Classification Maps at 1-km Resolution. Sci. Data 2018, 5, 180214. [Google Scholar] [CrossRef] [Scilit] [PubMed]
- Ministry of Construction and Physical Planning Technical Regulation on Rational Use of Energy and Thermal Protection in Buildings. Off. Gaz. Repub. Croat. 2015, 128, 2428.
- Sanka, I.; Petras, D. Indoor Air Quality and Energy Audit and in an Apartment Building in Slovakia. IOP Conf. Ser. Mater. Sci. Eng. 2019, 471, 062022. [Google Scholar] [CrossRef] [Scilit]
- HRN EN 16798-1:2019; Energy Performance of Buildings-Ventilation for Buildings-Part 1: Indoor Environmental Input Parameters for Design and Assessment of Energy Performance of Buildings Addressing Indoor Air Quality, Thermal Environment, Lighting And Acoustics-Module M1-6. Croatian Standards Institute (HZN): Zagreb, Croatia, 2019.
- Nazaroff, W.W. Residential Air-change Rates: A Critical Review. Indoor Air 2021, 31, 282–313. [Google Scholar] [CrossRef] [Scilit] [PubMed]
- Ryti, N.R.I.; Korpelainen, A.; Seppänen, O.; Jaakkola, J.J.K. Paradoxical Home Temperatures during Cold Weather: A Proof-of-Concept Study. Int. J. Biometeorol. 2020, 64, 2065–2076. [Google Scholar] [CrossRef] [Scilit] [PubMed]
- Menberg, K.; Heo, Y.; Choudhary, R. Sensitivity Analysis Methods for Building Energy Models: Comparing Computational Costs and Extractable Information. Energy Build. 2016, 133, 433–445. [Google Scholar] [CrossRef] [Scilit]
- Republic of Croatia. Integrated National Energy and Climate Plan for the Republic of Croatia for the Period 2021–2030; Ministry of Environment and Energy of the Republic of Croatia: Zagreb, Croatia, 2025. Available online: https://mzozt.gov.hr/UserDocsImages//KLIMA//NECP_Update%20_CRO_EN_FINAL.pdf?utm_source=chatgpt.com (accessed on 13 August 2026).
- Croatian Parliament. Act on Energy Efficiency in Buildings. Off. Gaz. Repub. Croat. 2025, 155, 2317. [Google Scholar]

Disclaimer/Publisher’s Note: The statements, opinions and data contained in all publications are solely those of the individual author(s) and contributor(s) and not of MDPI and/or the editor(s). MDPI and/or the editor(s) disclaim responsibility for any injury to people or property resulting from any ideas, methods, instructions or products referred to in the content. |
© 2026 by the authors. Licensee MDPI, Basel, Switzerland. This article is an open access article distributed under the terms and conditions of the Creative Commons Attribution (CC BY) license.