


Abstract
This study investigates how digital transformation in healthcare shapes sustainable customer value by analyzing the role of digital quality and its influence on satisfaction and loyalty within an AI-based diabetes prognostic service. Drawing on system, information, and service quality as core dimensions of digital quality, the study examines their direct effects on satisfaction and their contribution to loyalty formation relative to traditional service factors. Using survey data collected from over 1000 users of a digital healthcare platform equipped with an AI-driven diabetes prognostic algorithm, 800 valid responses were analyzed through PLS-SEM in SmartPLS 4.0. The results show that both traditional service attributes and digital quality significantly enhance customer satisfaction, which in turn promotes loyalty. However, digital quality does not strengthen the satisfaction–loyalty linkage, indicating that its value lies in establishing baseline trust and usability rather than amplifying loyalty outcomes. Environmental uncertainty—captured as technological and market uncertainty—also positively affects loyalty. This study contributes to digital healthcare research by providing empirical evidence from an AI-based long-term prognostic service and clarifying that digital quality operates as a foundational hygiene factor essential for sustainable customer value, rather than as a competitive differentiator.
1. Introduction
Digital transformation in the era of the Fourth Industrial Revolution has reshaped how healthcare organizations create value, accelerating the integration of artificial intelligence (AI), data analytics, digital twin models, multimodal disease prediction, and digital platforms into clinical and preventive services [1,2]. These technological developments, supported in Korea by national initiatives such as the Bioeconomy Innovation Strategy 2025 and the Regulatory Innovation Plan for Medical Devices, have facilitated the rapid emergence of digital healthcare ecosystems that emphasize accuracy, personalization, and long-term patient engagement [3].
Despite these advances, prior research on service quality, brand equity, and customer loyalty has largely focused on traditional determinants such as perceived quality, reliability, and satisfaction within conventional healthcare or general service settings—where service quality is shaped mainly by face-to-face interactions with medical professionals and treatment outcomes—or within general service contexts [4]. In contrast, a dual branch attention network-based diagnostic study [5] empirically demonstrates that AI systems enhance predictive performance and trust, while research on innovation networks clearly explains how digital transformation ecosystems reshape sustainable service value and structures of patient engagement [6]. Nevertheless, only limited empirical work has examined how digital transformation—particularly the quality of digital interfaces, information, and system capabilities—shapes customer value, satisfaction, and loyalty in AI-based preventive or prognostic healthcare environments.
Moreover, although digital quality has been conceptually recognized as a new dimension of service experience in digital platforms, existing studies rarely test its combined direct, mediating, and moderating effects within a unified structural model, nor do they address whether digital quality strengthens or merely enables the satisfaction–loyalty relationship. This gap is especially important as healthcare delivery shifts from treatment-focused services to prevention-oriented models, where sustained customer engagement and stable service value are essential for long-term sustainability.
To address these research gaps, the present study investigates how digital quality—operationalized through system quality, information quality, and service quality—affects satisfaction and loyalty within an AI-driven diabetes prognostic platform. In addition, the study examines whether digital quality not only enhances satisfaction but also moderates the satisfaction–loyalty link, thereby clarifying whether it functions as a value-creating differentiator or merely a hygiene factor that prevents dissatisfaction. Partial Least Squares Structural Equation Modeling (PLS-SEM) is employed to test both direct effects and underlying mechanisms, offering predictive rigor suited to complex constructs analyzed with moderately sized datasets.
Theoretically, this research advances existing work by integrating brand equity theory [7], SERVQUAL [8], and perspectives on sustainable digital innovation to conceptualize how digital transformation influences customer value formation. Empirically, it contributes novel evidence from an AI-based prognostic healthcare context—an area where quantitative customer-experience studies remain sparse. The findings reveal that digital quality operates as a core antecedent to satisfaction but does not significantly reinforce the satisfaction–loyalty pathway, highlighting its role as a baseline condition for cognitive trust rather than an amplifier of loyalty [9,10].
Three major insights emerge from this investigation. First, it extends the discourse on digital transformation in healthcare by empirically exploring how digital quality influences service quality and brand equity formation [1]. Second, it provides evidence that AI-based preventive platforms enhance sustainable customer value by improving service reliability and early detection capabilities [2,6]. Third, it simultaneously tests the mediating and moderating mechanisms of digital quality, clarifying its role as a determinant of satisfaction but a limited facilitator of loyalty transition. This highlights that digital transformation is not merely a technological upgrade but a cultural and ethical shift toward trust-based, patient-centered care [5,11].
Based on the research context and goals previously described, the work is organized into a six-chapter framework. Section 1 discusses the current situation, the problem statement, and the purpose of the research. Section 2 addresses the main concepts and theoretical background, including brand equity, service quality, and digital quality. Section 3 describes the research methods, such as the research model and variable measurements, and presents the main hypotheses of this study. Section 4 reports the statistical analysis results based on empirical data collected through the questionnaire survey. Section 5 interprets the study’s empirical evidence and discusses its broader implications for theory and practice. Section 6 concludes the work by identifying its limitations and suggesting potential pathways for future scholarly inquiry.
2. Theoretical Background and Hypothesis Generation
2.1. Theoretical Background
2.1.1. Brand Equity
Brand equity signifies the surplus value attributed to a product or service due solely to its brand, rather than to its functional performance [12]. Since services do not possess tangible attributes and offer limited opportunities for pre-purchase evaluation, the brand serves as a crucial extrinsic cue that helps consumers reduce perceived financial, social, and safety risks [13]. Through favorable brand associations, consumers develop trust and loyalty, reinforcing long-term relationships between customers and firms [3,14].
Aaker [7] proposed that brand equity is built upon four foundational pillars: consumers’ perceptions of quality, their recognition of the brand, the associations they form with it, and the degree of loyalty they exhibit. Building upon this foundation, Yoo et al. [15] empirically validated a consumer-based model of brand equity, demonstrating that these dimensions collectively enhance brand strength and consumer commitment. Keller [3] likewise argued that customer-based brand equity (CBBE) arises from the degree to which consumers’ knowledge of a brand shapes their responses to its marketing. He emphasized that this equity is fundamentally grounded in the cognitive judgments and emotional meanings consumers associate with the brand.
Research on brand equity has evolved along two principal approaches: the financial-based and customer-based perspectives. The financial perspective views brand equity as a measurable monetary asset that contributes to firm valuation and market performance [16,17,18]. In contrast, the customer-based perspective focuses on consumers’ perceptions, attitudes, and behaviors as the true source of brand value [3,14]. The evolving paradigm draws attention to the critical task of determining how perceptions of quality and the knowledge consumers hold about a brand ultimately shape their satisfaction and foster loyalty.
In the context of service and digital industries, scholars have further extended traditional brand equity models to incorporate digital quality as an emerging determinant of perceived value [8]. Digital quality encompasses the system, information, and service quality of digital interfaces that shape consumers’ overall brand experience. This reconceptualization reflects the transformation of brand equity in the digital era, where technological interaction and service personalization have become essential components of consumer trust and loyalty.
2.1.2. Service Quality and Digital Transformation
Service quality differs from product quality in that it is characterized by intangibility, heterogeneity, and inseparability, making it difficult to evaluate objectively [19,20]. At its core, it denotes a subjective appraisal grounded in the value consumers believe they receive and in their experiential evaluation of the service offering [21]. Thus, service quality can be defined as a cognitive judgment formed through the comparison between expectations and actual performance [8,22,23].
Grönroos [23] distinguished between technical quality and functional quality, arguing that consumers’ perceptions of overall image determine perceived service quality. Parasuraman et al. [8] advanced this idea by defining service quality as a form of attitude reflecting customers’ judgments about service excellence, introducing the SERVQUAL model based on expectation–performance gaps. Cronin and Taylor [24] later developed the SERVPERF approach, a performance-focused assessment of service quality designed to remedy the conceptual and measurement issues present in the earlier SERVQUAL model. These two models have become the foundation for understanding service quality as a key antecedent of customer satisfaction and loyalty [10].
According to Oliver’s expectation–disconfirmation theory [22], customers compare expected and perceived performance, leading to satisfaction or dissatisfaction. Bitner [25] further emphasized the importance of the service scape, noting that the design, cleanliness, and ambience of the physical environment significantly influence consumer perceptions and behavioral intentions. In recent years, the rise in digital transformation has introduced digital quality as a critical extension of service quality. The concept of digital transformation refers to a broad organizational shift in which firms employ digital technologies—ranging from analytics and artificial intelligence to cloud infrastructure and IoT systems—to reshape their business models and cultivate new value streams within industry [26,27]. Beyond mere technological adoption, digital transformation represents a strategic reconfiguration of organizational processes, structures, and cultures. In this context, customer interaction, personalized service delivery, and user experience have become central elements, highlighting the growing role of digital quality as a fundamental contributor to customer satisfaction and to the enhancement of brand value [28,29].
Digital quality captures the holistic evaluation consumers make of their digital experiences—including their emotional states, trust perceptions, behavioral reactions, and sense of convenience—when interacting with a brand or platform online [30]. It emphasizes customer-centric value creation, highlighting that digital transformation extends beyond technological innovation to encompass experiential and relational quality [31]. Earlier studies conceptualized websites as intermediaries between customers and organizations, focusing on website design, information reliability, and transactional security as indicators of quality [32]. Parasuraman et al. [30] later advanced the E-SERVQUAL approach, a model designed to capture online service quality through dimensions encompassing operational efficiency, system uptime, the safeguarding of information, and the assurance of privacy. This evolution extended the traditional notion of intangible service quality [33] into a hybrid framework applicable to both online and offline environments.
Within the healthcare context, this study defines digital quality through a triadic framework consisting of system functionality, the reliability and usefulness of information, and the overall caliber of service offered. System quality refers to the platform’s stability, accessibility, and responsiveness; information quality encompasses the accuracy, usefulness, and timeliness of medical information; and service quality includes user support, personalization, and interactive engagement. Collectively, these dimensions of digital quality serve as critical foundations for brand equity and customer satisfaction in the digital healthcare industry.
Along with the necessity of telemedicine, which has been actively promoted since COVID-19, technological advancements in the digital healthcare field, which have been accelerating in pace, have led to studies on telemedicine satisfaction [34,35], while at the same time stimulating research that examines the significance of customer experience for customer satisfaction and loyalty [36,37,38,39].
The “cognitive experience” distinguished within customer experience is measured, at the stage of operational definition, through experiences of knowledge acquisition, information acquisition, understanding of disease, and acquisition of medical information. In addition, the construction of “social experience” is composed of operational definitions that capture experiences such as a sense of intimacy with the platform, connectedness, consideration shown by platform members, and friendliness. Finally, “emotional experience” is operationally defined through components that involve experiencing reduced anxiety, a sense of relief, and calmness.
Among these three components of customer experience, cognitive experience corresponds to “information quality,” which is emphasized by the researchers of this study as sufficient, diverse, up-to-date, accurate, and useful information, while “social experience” corresponds to “relationship quality,” which is one of the components of traditional service quality.
Meanwhile, the “emotional experience” discussed within customer experience constitutes another antecedent of customer satisfaction that is distinct from traditional service quality, but it is also linked to “service quality,” which emphasizes whether the content provided by the platform proposed in this study is personalized.
Perspectives that emphasize customer experience constructs [37,38,39] regard them as mediating elements that connect traditional service quality constructs with customer satisfaction and loyalty. Considering that the “social experience” addressed in customer experience corresponds to traditional relationship quality, it appears that fully separating the digital quality construct from traditional service quality constructs requires further empirical examination. In the same context, this study seeks to examine the structural antecedent–consequence relationships among service quality, satisfaction, and loyalty by extending digital quality arising from digital transformation as one of the service quality constructs.
2.2. Literature Review and Hypotheses
2.2.1. Service Quality and Customer Satisfaction
Service quality captures the extent to which customers view a service as excellent, and the literature has long established it as a foundational predictor of both perceived value and satisfaction [8,21,40]. Zeithaml [21] conceptualized customer value as the perceived benefit obtained relative to the cost paid, suggesting that higher service quality enhances the customer’s perceived value. Grönroos [23] distinguished between technical and functional quality, arguing that functional quality—customers’ experiences of the service process—plays a critical role in shaping perceived value.
Drawing on Oliver’s expectation–disconfirmation theory, customer satisfaction and perceived value are shaped by the evaluation of whether actual service performance meets or exceeds prior expectations [19,22]. When the service experience goes beyond what customers anticipated, a state of positive disconfirmation occurs, thereby elevating their satisfaction and perceived value [19,22]. Findings from Cronin and Taylor’s SERVPERF model [24] corroborate that service quality substantially elevates both customers’ satisfaction and the value they perceive from the service.
This relationship has been similarly observed in healthcare contexts. Choi and Kim [40] found that perceived quality of medicine services positively affects patients’ trust and perceived value. In the case of Oriental medicine services, perceived service quality encompasses not only therapeutic outcomes but also process-related elements such as professionalism, empathy, and reliability, all of which contribute to the cognitive formation of customer value [41]. Accordingly, it is expected that higher perceived quality of Oriental medicine services will lead customers to perceive greater benefits and value from the service.
Customer value refers to a customer’s cognitive evaluation formed through the comparison between perceived benefits and costs when using a product or service, and this factor operates as a foundational antecedent that shapes perceptions of service quality and ultimately affects satisfaction levels [21,42]. In contrast, customer satisfaction represents an affective response and attitudinal evaluation that integrates perceived value and service experience, and it is regarded as a major outcome variable leading to repurchase intention and loyalty behaviors [19,43]. In other words, while customer value can be understood as a perceived exchange value, customer satisfaction represents an affective judgment formed through customers’ emotional interpretation of the experience they receive. Accordingly, this study recognizes the conceptual importance of customer value but focuses primarily on customer satisfaction as the key evaluative construct for examining service performance. Therefore, although customer value holds theoretical significance, this research designates customer satisfaction as the focal variable for evaluating service outcomes and accordingly formulates the hypothesis presented below:
Hypothesis 1.
Perceived quality in Oriental medicine services (H1-1: brand awareness, H1-2: brand availability, H1-3: brand image, H1-4: customer orientation, H1-5: physical environmental quality) will each positively influence customers’ satisfaction.
2.2.2. Digital Quality
In Oriental medicine services, the integration of traditional clinical methods with digital technologies has elevated the importance of digital quality, and this element is essential for fostering more meaningful communication and personalized care experiences between patients and medical service providers [44,45]. Within the digital service context, quality is often conceptualized through a triad of dimensions—system functionality, informational accuracy and usefulness, and the caliber of service delivery—and these dimensions collectively but differentially contribute to customer satisfaction [30,46].
This study adopts the definition of system quality as the degree to which a system is readily accessible, safeguarded by adequate security measures, and designed for effortless use. Enhanced accessibility enables patients to obtain medicine information and book treatments conveniently through mobile and online platforms [45]. Strong data security measures such as encryption or blockchain-based protection foster trust and satisfaction [47]. An intuitive user interface reduces cognitive effort, thereby improving the overall experience [48,49,50].
Hypothesis 2-1.
Perceived quality (digital system quality) in Oriental medicine services will positively influence customers’ satisfaction.
Information quality encompasses the sufficiency, diversity, timeliness, accuracy, and usefulness of information provided [51,52]. Providing sufficient and diverse treatment information helps patients better understand their conditions, while up-to-date and accurate data based on modern research enhances confidence and satisfaction. Useful and relevant information empowers patients to make informed health decisions, increasing overall satisfaction [53,54].
Hypothesis 2-2.
Perceived quality (digital information quality) in Oriental medicine services will positively influence customers’ satisfaction.
Service quality in digital contexts is characterized by customer support, personalization, and reliability [30,55]. Responsive and reliable service interactions meet patients’ expectations, while personalized treatment recommendations based on individual body type analyses foster greater satisfaction. Reliability, reflected in consistent and dependable service delivery, strengthens patient trust [8,56,57,58].
Hypothesis 2-3.
Perceived quality (digital service quality) in Oriental medicine services will positively influence customers’ satisfaction.
2.2.3. Customer Satisfaction and Brand Loyalty
Customer satisfaction is an important antecedent variable that affects behaviors such as repurchase intention, representing customers’ subjective evaluations or attitudes toward a particular product or service [19,22]. For Oriental medical service providers, two central benchmarks of service evaluation are the degree to which patient expectations are realized and the overall satisfaction patients derive from their treatment experience. Ultimately, this leads patients to form a favorable attitude toward Oriental medicine, a willingness to engage in word-of-mouth communication with others, and a behavioral tendency to prefer Oriental medicine hospitals over other medical institutions and to repeatedly use their services, thereby increasing customer loyalty [10,59,60,61].
Fulfilling customers’ expectations in Oriental medical services means that the unique diagnostic and treatment methods of Oriental medicine correspond to patients’ needs and demands [22]. In particular, providing personalized treatments such as herbal prescriptions and acupuncture that consider each patient’s constitution and health condition—treatments that are natural, eco-friendly, and have few side effects—along with convenient and courteous service during diagnosis and treatment, and the positive experience of treatment effectiveness, all contribute to meeting customers’ expectations. These features provide patients with a unique sense of satisfaction that differs from Western medicine.
Drawing on data from the Ministry of Health and Welfare’s 2023 [62] official report detailing patterns of Oriental medical service utilization, many patients who have used Oriental medical services showed generally high satisfaction [63]. Moreover, personalized treatment that considers individual constitutions and health conditions, as well as low side effects, not only builds strong trust but also serves as major motivations for choosing Oriental medical care, as they are associated with high treatment effectiveness, specialized care for specific diseases, and minimal side effects. Achieving high levels of expectation fulfillment and satisfaction within Oriental medical services fosters favorable customer dispositions toward the service, which subsequently motivates customers to engage in constructive word-of-mouth communication with those around them.
To conclude, the ability of Oriental medicine providers to fulfill expectations and raise satisfaction fosters long-term preference and recurrent use of their services, which over time consolidates and strengthens customer loyalty. Given these considerations, it is reasonable to expect that satisfaction with Oriental medicine services will strengthen customers’ loyalty. This expectation supports the development of the subsequent hypothesis:
Hypothesis 3.
Customers’ satisfaction in Oriental medicine services will positively influence brand loyalty.
2.2.4. Environmental Dynamism (Uncertainty)
Uncertainty refers to a state in which an event may occur, but its probability distribution is unknown [25,59,60]. A high level of uncertainty makes strategic decision-making difficult for managers, decreases firm performance, and ultimately threatens organizational survival [61,63,64,65]. Scholars commonly distinguish uncertainty into two broad domains—uncertainty arising from technological change and uncertainty stemming from market conditions [66,67]. The former refers to the degree of unpredictability and rapid change in products or service technologies, whereas the latter refers to the difficulty of predicting the degree of change in customer needs and preferences.
This distinction also applies to Oriental medicine services. The accelerated pace at which novel medical technologies are being developed and adopted—such as AI-based toxicity prediction, sensory analysis, pulse diagnosis, tongue diagnosis, facial and behavioral analysis, and olfactory or voice-based questioning—have increased technological uncertainty in Oriental medicine, transforming traditional diagnostic and treatment approaches [68,69,70]. Meanwhile, market uncertainty arises from shifts in patients’ health management behaviors, growing interest in wearable devices and digital diagnostics, and increasing demand for personalized treatments [25,59,71].
In today’s Oriental medicine environment, technological and market uncertainties coexist and evolve rapidly. Although uncertainty can sometimes act as a risk factor, an appropriate level of uncertainty can also serve as an enabler that stimulates organizational agility and innovation. In other words, uncertain environments encourage medical institutions to proactively adopt new technologies and respond swiftly to changing patient needs, thereby strengthening their long-term competitiveness [72,73,74,75].
Therefore, Oriental medicine institutions should not merely perceive uncertainty as a risk to be avoided but rather manage it as a strategic driver that promotes innovation and service improvement. Implementing this strategy enables persistent upgrades in service quality, facilitates the design of tailored diagnostic solutions, and propels innovation within digital healthcare. Collectively, these advancements elevate patient satisfaction and strengthen loyalty over time. Given these considerations, the research formulates the subsequent hypothesis:
Hypothesis 4.
Environmental uncertainty in Oriental medicine services will positively influence brand loyalty.
2.2.5. Moderating Effect of Digital Quality
Digital quality reflects the comprehensive performance of digital services in terms of accessibility, protection of information, user-centered design, and timely responsiveness [38,76]. Superior levels of digital quality not only heighten users’ satisfaction but also help establish a service environment perceived as trustworthy, transparent, and easy to navigate [30]. In the context of Oriental medicine services, digital quality encompasses the technological, informational, and experiential dimensions that collectively determine the perceived value and trustworthiness of the digital healthcare experience [54].
High digital quality enhances the degree to which customers’ satisfaction translates into sustained loyalty by providing a seamless, trustworthy, and engaging service experience that reinforces positive evaluations formed through satisfaction [30,76]. When digital systems are stable and easy to navigate, information is accurate and timely, and digital interactions are responsive and personalized, customers are more likely to translate their satisfaction into enduring loyalty behaviors. This occurs because superior digital quality enhances customers’ perceived value, reinforces trust, and fosters emotional attachment, thereby amplifying the satisfaction–loyalty relationship [38,77,78,79,80].
Conversely, when digital quality is low—characterized by unstable systems, confusing interfaces, outdated information, or impersonal service experiences—customer satisfaction may not readily translate into loyalty. In such cases, customers’ positive evaluations remain fragile and are easily disrupted by frustration or doubt regarding the service’s reliability and credibility. Therefore, digital quality functions as a strengthening moderator that reinforces extent to which heightened satisfaction contributes to stronger customer loyalty when high, but weakens it when low [81].
Hypothesis 5.
Digital quality (H5-1: System Quality × Satisfaction, H5-2: Information Quality × Satisfaction, H5-3: Service Quality × Satisfaction) will moderate the connection between satisfaction and loyalty, such that when digital quality is elevated, the degree to which satisfaction translates into enhanced customer loyalty is expected to intensify, but when digital quality is poor, this effect will be substantially reduced.
3. Research Methodology
3.1. Measures
Instead of analyzing healthcare institutions, this study focuses on individual consumers as the unit of analysis. Data collection was conducted using a structured survey administered to people who had previously used a digital healthcare platform equipped with AI-enabled prognostic diagnostic capabilities. A purposive sampling method was employed to recruit respondents with actual usage experience, as such experience was essential for ensuring that their evaluations were relevant and valid for the purposes of this study.
To develop the questionnaire, this study synthesized insights from earlier works examining brand equity, various dimensions of service quality, customer satisfaction and loyalty, as well as digital transformation within healthcare and other service sectors. The questionnaire items were derived and tailored from validated instruments proposed in prior work—including those of Aaker [7], Keller [3], Parasuraman, Zeithaml and Berry [20], Seck and Philippe [82], von Leipzig et al. [83], and Moghavvemi, Lee and Lee [84]—to secure content accuracy and appropriateness for the study’s context.
Each latent construct was represented by three to five observed indicators, and the overall survey instrument consisted of eight constructs: (1) brand awareness, (2) brand availability, (3) brand image, (4) customer orientation, (5) physical environment quality, (6) digital quality (comprising system, information, and service quality), (7) customer satisfaction, and (8) brand loyalty. In addition, technological and market uncertainty were measured as control variables to account for potential environmental influences.
In total, the instrument consisted of 58 measurement indicators plus five demographic questions. Participants provided their responses using a seven-point Likert scale, with scores from 1 (strongly disagree) to 7 (strongly agree), which is widely recognized for providing superior reliability, sensitivity, and discriminant validity compared to alternative scaling methods [85].
3.2. Research Model
The central objective of this study is to empirically explore how distinct facets of brand equity in digital healthcare influence customer loyalty, operating through the mechanism of customer satisfaction. Guided by the theoretical model and hypotheses outlined in Section 2, brand equity is operationalized using six primary dimensions: consumers’ awareness of the brand, accessibility or availability of the brand, perceptions of brand image, the degree of customer orientation, the perceived quality of the physical environment, and the level of digital service quality.
The proposed model is designed to explore three central questions: (1) Do the six identified dimensions produce significant effects on customers’ satisfaction levels? (2) Does satisfaction function as a mediating pathway through which perceived quality shapes brand loyalty? (3) Does the degree of digital quality modify how strongly satisfaction translates into customer loyalty?
To capture the fluid conditions surrounding digital transformation in healthcare, the analysis also incorporates technological and market uncertainty as control variables that may affect customer loyalty. These elements, along with the hypothesized paths among the core constructs, are visualized in the conceptual framework shown in Figure 1.
Figure 1.
Research model. Note: Solid lines denote hypothesized direct relationships, while dotted lines depict moderating influences. Source: Figure prepared by the author.
3.3. Operational Definitions and Measurement of Variables
All constructs used in this study were operationalized based on validated scales from prior research. Each construct was represented by three to five reflective indicators measured on a seven-point Likert scale (1 = strongly disagree, 7 = strongly agree). The selection and adaptation of each item followed established conceptual definitions as proposed in previous studies, ensuring both theoretical consistency and contextual relevance for AI-based Oriental medicine digital platforms.
All measurement items used were adapted from established and validated scales in prior research. The dimensions of brand equity (brand awareness, brand availability, brand image, customer orientation, physical environment quality) were adapted from Aaker [7], Keller [3], and Yoo and Donthu’s consumer-based brand equity scales [15]. Digital service quality (system, information, and service quality) was adapted from Parasuraman, Zeithaml, and Berry’s SERVQUAL/E-SERVQUAL framework [8], and subsequent digital quality studies. Customer satisfaction items were adapted from Oliver’s expectation–disconfirmation model [22] and Cronin and Taylor’s SERVPERF scale [24]. Brand loyalty items followed Oliver [10] and Morgan and Hunt [11]. Environmental uncertainty items were adapted from established scales developed by Lisboa, Skarmeas and Lages [86]. Table 1 presents an expanded conceptual description of each construct together with the variables used to measure them.
Table 1.
Conceptual framework and operational measures for brand equity.
3.3.1. Brand Awareness
In essence, brand awareness captures consumers’ ability to both distinguish a brand from others and recall it from memory when prompted. Drawing on Aaker’s conceptualization [7], five items were adapted to measure this construct: (1) I regularly come across various advertising or promotional content featuring the Oriental medicine hospital I mainly use; (2) the brand name of the Oriental medicine hospital I rely on is highly memorable to me; (3) the emblem or logo associated with my main Oriental medicine hospital is distinctive enough for quick recognition; (4) the Oriental medicine hospital I frequent is widely recognized as a prominent and influential brand in the industry; (5) I possess sufficient knowledge about the core treatment areas and specialty services offered by the Oriental medicine hospital I rely on (see Table 1).
3.3.2. Brand Availability
At its core, brand availability reflects the degree to which an organization’s services are readily accessible and usable for customers without difficulty. Following the frameworks proposed by Smith [87] and Yoo and Donthu [15], four items were employed: (1) the hospital I rely on in the Oriental medicine sector provides strong patient accessibility due to its ample network of branches and associated clinics; (2) the hospital I frequent in Oriental medicine delivers a wider variety of health treatments than most other comparable institutions; (3) compared with other hospitals, the Oriental medicine hospital I rely on is perceived to provide treatments that yield greater effectiveness and benefits for patients’ health; (4) patients tend to perceive the treatments at the Oriental medicine hospital I frequent as safer and more dependable compared with treatments available at other medical facilities (see Table 1).
3.3.3. Brand Image
In essence, brand image captures the holistic set of perceptions and meanings that customers associate with a given brand. Following the measurement approach proposed by Cho and Lim [88], the construct was operationalized through a set of five indicators: (1) the hospital I frequent in the Oriental medicine field is perceived as having an elegant and highly professional brand image; (2) the Oriental medicine hospital I rely on provides me with a consistent feeling of familiarity and ease; (3) the hospital I depend on for Oriental medicine care is broadly perceived as highly trustworthy and dependable; (4) the hospital I rely on within the Oriental medicine sector is widely recognized for its leadership and innovation in digital healthcare technologies; (5) the hospital I frequent in the Oriental medicine field is broadly acknowledged for its solid and reliable reputation (see Table 1).
3.3.4. Customer Orientation
Customer orientation represents the extent to which an organization understands and fulfills customer needs and expectations. Following Saxe and Weitz [89] and Williams [90], five items were used: (1) the healthcare professionals at the Oriental medicine hospital I rely on are warm, personable, and communicate with ease; (2) the clinicians at the Oriental medicine hospital I depend on are quick and thorough in addressing any questions I raise; (3) the medical team at the Oriental medicine hospital I use demonstrates a clear desire to understand customers’ expectations and preferences; (4) the practitioners at my main Oriental medicine hospital deliver well-considered, effective solutions tailored to customer problems; (5) the healthcare team at my main Oriental medicine hospital addresses and resolves my problems with speed and efficiency (see Table 1).
3.3.5. Physical Environment Quality
This study defines physical environment quality as the set of tangible features and environmental conditions within the service area that an organization can design or control. In alignment with the conceptualizations offered by Bitner [25], Baker, Grewal and Parasuraman [59], and Lee and Kim [91], four indicators were adopted for measurement: (1) the physical spaces within the Oriental medicine hospital I rely on are hygienic, well cared for, and visibly clean; (2) the atmosphere of the Oriental medicine hospital I frequent is pleasant and welcoming enough that I feel inclined to stay there for longer durations; (3) the process of booking appointments and undergoing treatment at the Oriental medicine hospital I rely on is structured in a way that feels smooth and highly convenient; (4) the indoor environment of the Oriental medicine hospital I frequent provides a pleasant, welcoming, and comfortable setting (see Table 1).
3.3.6. Digital Quality
Digital quality is conceptualized as a multi-faceted framework encompassing the performance of the system, the reliability and usefulness of digital information, and the overall caliber of service delivered. The measurement indicators were adapted from prior research by Lee [53], Kwak, and Lee [92], Hwang and Lee [55], and Kim [93]. Specifically, system quality reflects the functional performance of digital platforms and includes the dimensions of accessibility, security, and ease of use. Digital information quality pertains to the informational aspects of the platform, such as sufficiency, variety, timeliness, accuracy, and usefulness. Lastly, service quality represents the experiential dimension of user interaction and includes responsiveness, customization, and reliability in digital service delivery. A detailed summary of how each sub-dimension was operationally defined, along with the items used to measure them, is presented in Table 2.
Table 2.
Conceptual framework and operational measures for digital quality.
3.3.7. Customer Satisfaction
Existing literature conceptualizes customer satisfaction in two primary ways: as a cognitive assessment of how well expectations have been met [94], or as an affective response characterized by feelings of pleasure and enjoyment following service encounters [95,96]. For the purposes of this study, satisfaction is treated as a combined construct reflecting both perspectives—the evaluative component of satisfaction and the emotional aspect of consumption-related feelings. Satisfaction occurs when a consumer’s perceived service performance meets or surpasses prior expectations, and the extent to which the attributes of a service fulfill individual needs determines the overall level of satisfaction. From an affective perspective, Richins [97] identified emotional responses closely associated with satisfaction in consumption contexts, suggesting that positive affective reactions reinforce the perceived value of the service experience.
Customer satisfaction is treated as a dual construct: one component reflects judgments tied to specific service encounters, while the other captures the overall satisfaction that emerges from repeated and ongoing interactions with the service [98]. The measurement items for customer satisfaction were adapted from Oliver [22], Ragunathan and Irwin [99], and Lee and Ra [100]. Four items were used to capture satisfaction in the context of Oriental medicine services: (1) using this Platform usually meets my expectations; (2) this Platform’s service is more satisfactory than other medicine services; (3) my overall level of satisfaction with this Platform’s service is high; and (4) using this Platform is fun and enjoyable and reflect both my expectations and needs (see Appendix A Table A3).
3.3.8. Brand Loyalty
This study adopts the framework of Bowen and Chen [101], which conceptualizes customer loyalty as comprising attitudinal and behavioral components. Attitudinal loyalty refers to a customer’s favorable disposition toward an organization, encompassing emotional attachment, preference, and the intention to maintain a long-term relationship [102,103]. In contrast, behavioral loyalty represents the customer’s observable actions, including repeated usage and positive word-of-mouth recommendations toward the brand [104,105]. Accordingly, brand loyalty is defined as a combination of favorable attitudes, advocacy behavior, and repeat usage intention toward an Oriental medicine service provider. Following the work of Sirgy and Samli [106] and Cho and Lim [88], this construct was measured using four items: (1) I have a very favorable (good) attitude towards this Platform; (2) I once told others that this Platform is good; (3) I have may other Platform to choose from, but I tend to use this Platform; and (4) I will continue to use this Platform (see Appendix A Table A3).
3.3.9. Uncertainty
This study included two control variables—technological uncertainty and market uncertainty—to account for external environmental factors that may independently influence customer loyalty. The selection of these control variables is theoretically grounded in prior research in strategic management and digital transformation, which demonstrates that environmental dynamism affects customer evaluations and behavioral intentions regardless of service quality or satisfaction [69,70].
Uncertainty is conceptualized as a two-dimensional construct comprising technological uncertainty and market uncertainty. Technological uncertainty refers to the extent of change, instability, and unpredictability associated with advancements in medical or digital technologies, while market uncertainty reflects the degree of fluctuation and unpredictability in patient needs and preferences.
The measurement items were adapted and refined from the work of Lisboa, Skarmeas, and Lages [86]. Uncertainty was assessed using four indicators: (1) it is very difficult to predict technological developments applied to Oriental medicine industry; (2) technologies in the Oriental medicine and digital healthcare industries are changing rapidly; (3) it is challenging to anticipate shifts in patient demands and preferences in the Oriental medicine industry; and (4) patients’ needs in the Oriental medicine service market are evolving quickly (see Appendix A Table A4).
3.4. Research Tool
To test the proposed research model, this study employed a variance-based structural equation modeling (SEM) approach using the SmartPLS 4.0 software package for several methodological reasons. First, the data were collected using multi-item Likert-scale measures, and preliminary data screening indicated potential deviations from normality, for which PLS-SEM is more robust than covariance-based SEM (CB-SEM). Second, this study adopts a prediction-oriented approach, aiming to explain and predict customer satisfaction and loyalty in an emerging AI-based digital healthcare context rather than to strictly confirm an established theory. Finally, considering the complexity of the research model with multiple latent constructs and structural paths, as well as the moderate sample size, PLS-SEM was deemed an appropriate analytical technique.
SEM allows researchers to simultaneously examine complex causal relationships among latent constructs and assess both the measurement and structural components of a model [107]. The Partial Least Squares (PLS) method underlying SmartPLS is particularly suitable for exploratory and prediction-oriented studies because it: (1) does not require a large sample size, (2) imposes minimal distributional assumptions, and (3) provides robust estimates even when the measurement quality of survey data is limited [108]. In contrast to covariance-based SEM (CB-SEM), which emphasizes model fit and theory confirmation, the PLS approach focuses on maximizing explained variance (R2) and predictive relevance (Q2), making it appropriate for developing or formative constructs such as digital quality.
A total of 800 valid responses were analyzed, exceeding the minimum threshold recommended by Hair et al. [109] for PLS-SEM (10 times the maximum number of paths directed toward any latent construct). The final sample size of 800 respondents is statistically adequate for PLS-SEM analyses. First, following the “10-times rule” proposed by Hair et al. [109], the minimum required sample is ten times the largest number of structural paths directed toward a latent construct. In this model, the maximum number of incoming paths is six, resulting in a minimum threshold of 60 observations—well below the 800 responses collected. Second, recent simulation studies recommend between 200 and 500 cases for complex PLS-SEM models with multiple latent constructs, reflective indicators, and moderating effects. The present sample exceeds these recommendations, ensuring stable parameter estimates and high statistical power. Finally, an a priori statistical power analysis (effect size f2 = 0.15, α = 0.05, power = 0.95) indicates that approximately 220 responses are sufficient to detect medium effects in SEM models. Therefore, a sample of 800 substantially improves detection power for both direct and moderating effects, reduces sampling error, and enhances the reliability of bootstrapping procedures. Together, these considerations confirm that the sample size is more than sufficient for robust estimation, hypothesis testing, and generalizable interpretation within the PLS-SEM framework.
All latent constructs in the study were modeled as reflective rather than formative constructs. This specification is theoretically grounded in the nature of the underlying phenomena: the indicators are manifestations of the construct and are expected to covary. For example, perceptions of digital system quality (stability, responsiveness, and ease of use) are reflective outcomes of an underlying evaluation of digital quality rather than independent dimensions forming the construct. Similarly, satisfaction and loyalty are conceptualized as affective and attitudinal responses, making reflective measurement appropriate.
The moderating effect of digital quality on the satisfaction–loyalty relationship was included to test whether digital service experiences strengthen or weaken customers’ translation of satisfaction into behavioral loyalty. This inclusion is theoretically grounded in digital service and relationship marketing literature, which suggests that high-quality digital interactions enhance trust, perceived value, and relational commitment, thereby amplifying the effect of satisfaction on loyalty. Empirically, moderation enables the model to determine whether digital quality acts merely as an antecedent or also as a boundary condition shaping relational outcomes.
3.5. Sample Design and Data Collection
This study conducted a structured survey of 800 general users from April 2025 to September 2025. The respondents were individuals who had experience using an Oriental medicine digital platform equipped with a deep learning-based diabetes prognostic detection algorithm, one of the most representative cases of digital transformation in the field of Oriental medicine that this research focuses on.
A non-probability sampling approach was employed, which is common in exploratory studies on digital healthcare platforms. Participation was voluntary and based on user availability; therefore, randomization was not applied. Survey responses were collected from users with diverse demographic and technological backgrounds, and participation was not restricted to technologically proficient users. Anonymity was ensured to mitigate potential self-selection bias.
The sample was composed of 416 males (52.0%) and 384 females (48.0%), showing a balanced gender distribution (see Table 3). In terms of age, 40 years or older accounted for 60.0% of respondents, with 25.0% aged 20–29, 15.0% aged 30–39, 17.5% aged 40–49, 23.8% aged 50–59, and 18.7% aged 60 or above. This composition reflects the actual user structure of digital healthcare platforms, which tend to be more actively used by middle-aged and elderly populations interested in chronic disease management.
Table 3.
Demographic characteristics.
Regarding education, 40.0% were college graduates, 20.5% held graduate degrees, 14.0% were junior college graduates, 24.0% were high school graduates, and 1.5% had middle school education or below. The occupational composition showed office workers (21.3%), students (22.0%), self-employed or business owners (17.0%), professionals (16.5%), civil servants (3.8%), service workers (3.5%), homemakers (4.0%), and smaller proportions of those in agriculture, fishery, forestry, or livestock industries (2.0%), the unemployed (5.0%), and others (5.0%). This distribution suggests a diverse yet realistic representation of digital healthcare users, with a relatively high proportion of economically active and educated participants.
In terms of monthly income, 28.0% of respondents earned less than USD 925, 12.0% earned between USD 925–1385, 16.0% between USD 1385–1845, 14.0% between USD 1845–2305, and 30.0% earned USD 2305 or more. This indicates that the majority of respondents belonged to the middle- to upper-income segments, which aligns with the affordability and accessibility of AI-based healthcare platforms.
Overall, the sample represents a diverse cross-section of digital healthcare users with varying demographic and socioeconomic characteristics, making it suitable for empirical analysis of service quality, satisfaction, and loyalty within the context of Oriental-medicine digital platforms.
4. Empirical Results
4.1. Model Evaluation and Verification
Before proceeding with the structural analysis, the research model and its constructs were subjected to a series of reliability and validity assessments. Specifically, internal consistency, convergent validity, and discriminant validity were evaluated to confirm the robustness of the measurement model, and a multicollinearity diagnosis was also performed to verify the independence among indicators.
4.1.1. Multicollinearity: Pearson Correlation and Variance Inflation Factor (VIF)
Before evaluating the measurement model, multicollinearity diagnostics were conducted to ensure the statistical independence of the observed indicators. Multicollinearity inflates the variance of regression coefficients, increases standard errors, and may distort the estimation of structural relationships [110]. Following common statistical conventions, a Pearson correlation coefficient below 0.70 is generally considered to indicate the absence of serious multicollinearity (see Table 4).
Table 4.
Pearson’s correlation.
To further validate this result, the Variance Inflation Factor (VIF) was examined. A VIF value greater than 5.0 is often used as an upper threshold for potential collinearity [111], while more conservative criteria suggest that multicollinearity may be suspected when the average VIF exceeds 3.3 [112,113]. The diagnostic analysis results showed that the maximum VIF was 3.766, the minimum was 1.002, and the mean was 2.260. These findings indicate that the data meet acceptable thresholds and that no significant multicollinearity issue existed among the measurement variables, confirming the adequacy of the indicators for subsequent PLS-SEM analysis.
4.1.2. Reliability and Convergent Validity: Cronbach’s Alpha, Synthetic Reliability, Average Variance Extracted (AVE)
The evaluation of the measurement model began with factor analyses to verify the adequacy and internal consistency of the construct measurements. An Exploratory Factor Analysis (EFA) was first performed to determine whether the observed indicators were properly grouped into their respective latent constructs, thereby assessing the reliability and convergent validity of the developed measurement instrument. Subsequently, a Confirmatory Factor Analysis (CFA) was conducted using the Partial Least Squares (PLS) estimation approach, which allows the simultaneous assessment of the measurement and structural components of a model [114].
PLS is particularly suitable for complex models with relatively small sample sizes or non-normal data distributions, as it imposes minimal assumptions regarding residuals, normality, and model specification [109]. Factor analysis was performed on 11 latent variables and 58 observed indicators (see Appendix B, Table A5). A factor represents a set of variables exhibiting high intercorrelations, effectively reducing the dimensionality of the data into theoretically meaningful components.
The adequacy of factor loadings was examined to ensure that each indicator was properly aligned with its intended construct. Loadings of 0.4 or higher are generally regarded as acceptable, whereas values above 0.5 indicate strong significance [115]. All measurement items in this study displayed loadings exceeding 0.5, confirming satisfactory construct reliability.
As summarized in Table 5, all Composite Reliability (CR) coefficients exceeded the threshold value of 0.70, as recommended by Nunnally and Bernstein [116]. The Average Variance Extracted (AVE) values also surpassed the 0.50 criterion, consistent with the standards proposed by Fornell and Larcker [111] and Chin [108], thereby supporting convergent validity. Furthermore, Cronbach’s alpha coefficients for all constructs were above 0.70, satisfying the minimum threshold for internal consistency [117]. None of the latent variables exhibited alpha values above 0.95, indicating that common method bias (CMB) was not a significant concern.
Table 5.
Reliability and validity.
Overall, these results confirm that the measurement model demonstrates high internal reliability and adequate convergent validity, providing a robust foundation for subsequent structural model analysis.
4.1.3. Discriminant Validity: Fornell–Larcker’s [117] Criteria
To ensure that each construct was empirically distinct from the others, discriminant validity was assessed using two complementary approaches. First, the cross-loading analysis was examined to verify whether the loading of each indicator on its intended construct exceeded its loadings on any other construct. The results confirmed that all outer loadings were higher for their corresponding constructs than for any cross-loadings with unrelated constructs, thereby satisfying the discriminant validity requirement [114,118].
As a more conservative validation procedure, the Fornell–Larcker criterion was also applied [117]. This criterion evaluates whether the square root of the Average Variance Extracted (AVE) for each construct is greater than the corresponding inter-construct correlations. As shown in Table 6, the diagonal elements—representing the square roots of the AVE values—were consistently higher than the correlation coefficients located below the diagonal.
Table 6.
Discriminant validity verification (Fornell–Larcker method).
This finding indicates that the amount of variance shared by a construct and its own indicators was greater than that shared with other constructs, confirming the Fornell–Larcker condition [104,105]. Additionally, the Heterotrait–Monotrait (HTMT) ratio of correlations was examined as a robustness check, with all values below the recommended threshold of 0.85, further supporting discriminant validity [119].
In summary, all constructs in the proposed model demonstrated adequate discriminant validity, confirming that each latent variable captured a unique and theoretically coherent dimension within the model framework.
4.2. Robustness Verification
To confirm the stability and reliability of the empirical findings, several robustness procedures were performed. Specifically, the study implemented non-response bias analysis, common method bias assessment, bootstrapping, Sobel mediation testing, and effect size (f2) analysis to verify the consistency of the results across alternative statistical conditions.
4.2.1. Non-Response Bias Test: Early–Late Respondent Comparison
To assess the potential risk of non-response bias, an early–late respondent comparison was conducted, following the general logic proposed by Armstrong and Overton [120], which assumes that late respondents may serve as proxies for non-respondents. Consistent with prior empirical studies adopting this approach, independent-sample t-tests were employed to examine whether systematic differences existed between early and late respondents.
Approximately 25% of the primary measurement variables were randomly selected, and the mean values of the first half and the second half of collected responses were compared. The results indicated no statistically significant differences between early and late respondents across the examined constructs at the 95% confidence level. These findings suggest that the risk of non-response bias in the present study is limited and unlikely to substantially distort the empirical results, although the complete absence of non-response bias cannot be definitively established.
4.2.2. Common Method Bias: Check for over/Under Estimation Errors
To examine whether Common Method Bias (CMB) might have inflated or deflated the observed relationships due to data being collected from a single source, Harman’s single-factor test was conducted following the procedures of Podsakoff et al. [121]. An Exploratory Factor Analysis (EFA) was performed using all 58 measurement items (Brand, Availability, Image, Customer, Physical, System, Infor, Service, Satis, Loyal, and Uncertainty).
The analysis revealed that the first unrotated factor accounted for 46.29% of the total variance—below the recommended threshold of 50%—indicating that no single factor dominated the variance structure (see Table 7). Therefore, common method variance was not considered a serious concern, and the subsequent structural equation modeling (PLS-SEM) results could be interpreted with confidence. Additionally, the variance inflation factor (VIF) values for all constructs were below the conservative threshold of 3.3, further supporting the absence of CMB-related estimation bias [122].
Table 7.
Total variance.
4.2.3. Bootstrapping
Because the Partial Least Squares Structural Equation Modeling (PLS-SEM) technique does not require data normality, a bootstrapping procedure was employed to evaluate the statistical significance and stability of the estimated path coefficients [103]. Bootstrapping provides a non-parametric resampling method that estimates standard errors and significance levels without relying on normality assumptions, making it particularly appropriate for studies with moderate to small sample sizes, such as the present one involving 800 valid observations [123].
To ensure analytical robustness, 5000 bootstrap subsamples were generated, and the standard errors of the estimated parameters were calculated from these repeated resamplings. The resulting t-values and p-values were used to determine the significance of the structural paths in the model (see Table 8 and Table 9). This approach enhances the statistical reliability of PLS-SEM results by providing stable estimates independent of distributional assumptions [114].
Table 8.
Bootstrapping (a) of basic model.
Table 9.
Bootstrapping (b) of moderator model (digital quality as a moderator).
The bootstrapping results based on 5000 resamples revealed that, among traditional brand equity dimensions, brand image (β = 0.259, p < 0.001), customer orientation (β = 0.110, p = 0.026), and physical environment quality (β = 0.142, p = 0.001) exerted significant positive effects on customer satisfaction. In contrast, brand awareness and brand availability did not exhibit statistically significant effects, suggesting that traditional accessibility-based brand attributes have become less influential in the digital healthcare context.
Regarding digital quality, all three components—system quality (β = 0.151, p = 0.005), information quality (β = 0.138, p = 0.005), and service quality (β = 0.306, p < 0.001)—showed significant positive effects on satisfaction, confirming that digital functionality plays a critical role in enhancing the patient experience (see Table 8). The path from customer satisfaction to customer loyalty was highly significant (β = 0.580, p < 0.001), demonstrating that satisfaction acts as a strong determinant of loyalty formation. Conversely, the direct effects of digital quality factors on loyalty were statistically non-significant or marginal, indicating that digital quality contributes to loyalty indirectly via satisfaction rather than through direct influence. Meanwhile, environmental uncertainty (β = 0.186, p = 0.021) exhibited a significant positive relationship with loyalty, suggesting that under uncertain conditions, patients may display stronger commitment to trusted healthcare providers. Collectively, these findings indicate that while the effects of traditional brand factors are limited, digital quality dimensions significantly enhance satisfaction, which in turn strongly drives loyalty—emphasizing the mediating role of satisfaction in digital healthcare service relationships.
In the moderator model (see Table 9), bootstrapping results showed that digital quality did not significantly moderate the relationship between customer satisfaction and loyalty. Although digital quality—particularly its information and service components—remains an essential antecedent of satisfaction, its role as a stabilizer or amplifier of the satisfaction–loyalty linkage was not statistically supported in this model. This implies that the loyalty-enhancing effect of satisfaction remains robust regardless of digital service quality levels. Nevertheless, the consistently strong direct path from satisfaction to loyalty (β = 0.572, p < 0.001) underscores that cultivating satisfaction itself remains the most critical driver of loyalty in digital healthcare environments.
Furthermore, environmental uncertainty continued to exert a significant positive effect on loyalty (β = 0.208, p = 0.011), implying that patients may exhibit compensatory loyalty behavior under uncertain external conditions by relying more heavily on trusted digital healthcare services.
4.2.4. Verification of Mediation Effect (Sobel Test)
To examine the mediating role of customer satisfaction, this study applied the Sobel test, which evaluates the significance of indirect effects using the multivariate delta method proposed by Sobel [124]. The Sobel statistic was calculated using the following equation:
where a and b represent the unstandardized path coefficients of the independent–mediator and mediator–dependent relationships, respectively, Sa and Sb denote their corresponding standard errors.
As summarized in Table 10, the results revealed that the Sobel Z-values for Availability and Brand Awareness were −0.32 (p = 0.749) and 0.03 (p = 0.975), respectively, indicating that the indirect effects through satisfaction were not statistically significant. This finding suggests that accessibility and brand recognition alone are insufficient to meaningfully mediate the link between satisfaction and loyalty.
Table 10.
Mediator test (Sobel test).
In contrast, Customer Orientation exhibited a Sobel Z-value of 1.99 (p = 0.047), confirming a significant mediating effect at the 5% level. This implies that when healthcare institutions provide more patient-centered services, patient satisfaction increases, which in turn enhances loyalty. Moreover, both Brand Image and Physical Environment demonstrated significant mediation effects, with Z = 3.97 (p < 0.001) and Z = 3.26 (p = 0.001), respectively. These results confirm that perceived service quality and the physical environment positively influence loyalty through the mediating role of satisfaction.
Regarding digital quality, the Service Quality → Satisfaction → Loyalty path produced a Sobel Z-value of 5.73 (p < 0.001), indicating a highly significant mediating effect. This finding underscores that responsiveness and reliability—core attributes of Oriental medicine service delivery—enhance patient satisfaction and, consequently, foster long-term loyalty. Furthermore, Information Quality and System Quality also showed statistically significant mediation effects, with Z = 2.75 (p = 0.006) and Z = 2.68 (p = 0.008), respectively. This indicates that the accuracy of digital information, the stability of the system, and user convenience substantially improve patient satisfaction, thereby strengthening loyalty within digital healthcare platforms.
Taken together, both the traditional brand equity components—including brand image, physical environment, and customer orientation—and the digital quality dimensions—comprising information quality, system quality, and service quality—were found to significantly influence customer loyalty through the mediating role of satisfaction. These results empirically demonstrate that in the digitally transforming Oriental medicine industry, customer satisfaction functions not merely as an outcome variable but as a central mediating mechanism linking traditional service quality and digital quality to patient loyalty.
4.2.5. Effect Size: f2 Test
The effect size (f2) test was conducted to assess the relative contribution of each exogenous construct to the endogenous variables within the structural model. This analysis determines whether excluding a particular predictor meaningfully changes the model’s explanatory power (R2) by comparing the R2 values obtained with and without the construct of interest [125]. According to Cohen’s guideline, f2 values of 0.02, 0.15, and 0.35 represent small, medium, and large effect sizes, respectively (see Table 11).
Table 11.
Effect size (f2 test result).
As shown in Table 11, the results revealed that Service Quality (f2 = 0.157) exerted the largest influence on Customer Satisfaction, corresponding to a medium-to-large effect size. This suggests that improvements in service responsiveness, reliability, and assurance substantially enhance patient satisfaction within digital healthcare services. Similarly, Brand Image (f2 = 0.079) exhibited a moderate effect, indicating that patients’ perceptions of an institution’s professional and trustworthy image meaningfully affect satisfaction formation.
Meanwhile, Physical Environment Quality (f2 = 0.028), System Quality (f2 = 0.025), and Information Quality (f2 = 0.027) showed small but meaningful effects, suggesting that environmental comfort, platform stability, and information accuracy contribute incrementally to satisfaction. In contrast, Brand Awareness (f2 = 0.000), Brand Availability (f2 = 0.000), and Customer Orientation (f2 = 0.016) demonstrated negligible effects, implying that these variables have limited influence on satisfaction when considered alongside stronger predictors.
With respect to Customer Loyalty as the dependent variable, Customer Satisfaction (f2 = 0.316) emerged as the most influential predictor, approaching a large effect size. This finding reaffirms the pivotal role of satisfaction as the key determinant of loyalty in digital healthcare service contexts. Other predictors—Information Quality (f2 = 0.009), Service Quality (f2 = 0.001), System Quality (f2 = 0.000), and Uncertainty (f2 = 0.016)—showed very small or negligible direct effects, suggesting that their contributions to loyalty are minimal compared to satisfaction’s mediating role. Furthermore, the interaction terms (Information Quality × Satisfaction, Service Quality × Satisfaction, and System Quality × Satisfaction) all yielded f2 < 0.005, confirming that the moderation effects on loyalty were practically insignificant.
Overall, the f2 analysis confirms that Service Quality is the dominant determinant of Satisfaction, while Customer Satisfaction itself is the strongest driver of Loyalty. These results further emphasize the central mediating role of satisfaction: although various traditional and digital quality factors incrementally enhance satisfaction, it is satisfaction that ultimately exerts the most substantial influence on patient loyalty within the digitally transformed healthcare environment.
4.3. Results
4.3.1. Empirical Results
The results of the structural equation modeling (SEM) for the digital healthcare industry in Oriental medicine are presented in Figure 2. The analysis revealed that among the five traditional components of brand equity, brand availability and brand awareness did not have a direct effect on customer satisfaction. In contrast, customer orientation, perceived quality, and physical environment showed statistically significant positive (+) relationships with customer satisfaction.
Figure 2.
Results of research model. Notes: p < 0.001 †, p < 0.01 ***, p < 0.05 **. Source: Created by the author.
Furthermore, all three components of digital quality—information quality, system quality, and service quality—were found to have statistically significant positive (+) effects on customer satisfaction, confirming the functional role of digital quality across all dimensions. Customer satisfaction, which demonstrated varying degrees of statistical significance depending on its antecedent factors, was also found to have a statistically significant positive (+) relationship with customer loyalty, indicating that higher levels of satisfaction strengthen customer loyalty.
Interestingly, uncertainty was found to have a statistically significant positive (+) effect on customer loyalty, suggesting that, contrary to conventional expectations, uncertainty in the healthcare context can act as a factor that reinforces patient loyalty. In examining the moderating effects of digital quality, none of its three subdimensions—information quality, service quality, and system quality—showed statistically significant moderating effects on the relationship between customer satisfaction and customer loyalty.
4.3.2. Summary of Hypothesis Testing
The results of hypothesis verification based on the results of the empirical analysis of this study are summarized in Table 12. Hypotheses 1-1, 1-2, and 5 were not supported, but all other hypotheses were supported.
Table 12.
Brief summary of results.
5. Discussion
5.1. Theoretical Implications
This study identified the relationship between brand equity components in the digital healthcare industry through an empirical analysis using a survey. It is significant that the existing brand equity component model was applied to the digital healthcare industry to construct and verify the variables that can evaluate the perceived quality measurement items of the Oriental medicine service. This provides the following implications.
First, this study demonstrates that digital quality—composed of system quality, information quality, and service quality—contributes strongly to customer satisfaction, but exhibits only a limited effect in strengthening the process through which satisfaction is transferred to loyalty. This result somewhat contrasts with recent Digital Experience Quality-based theories, which suggest that digital touchpoints reinforce the satisfaction–loyalty relationship.
Recent studies on AI-based healthcare adoption and digital service quality emphasize that users place primary importance on Digital Experience Quality (DEXQ) when evaluating medical platforms, including factors such as algorithmic transparency, information reliability, data privacy protection, and emotional support during digital interactions [126,127,128,129]. Transparency, information reliability, and data privacy protection are components that are linked to customer value at the functional dimension, whereas emotional support can be classified as customer value at the experiential dimension. According to DEXQ theory, digital experience quality derived from digital transformation in the healthcare sector stimulates not only customer satisfaction based on the fulfillment of functional value—such as transparency, information reliability, and data privacy protection—but also customer loyalty grounded in the fulfillment of experiential value induced by emotional support.
AI-based digital platforms in Oriental medicine are primarily used for preventive and diagnostic purposes; therefore, utilitarian functions tend to be emphasized more than services premised on long-term relationship formation. Accordingly, digital quality is more likely to function as a basic prerequisite factor that must be satisfied, rather than as a differentiating factor. According to Aaker [7] and Keller [3], perceived quality is a higher-order construct encompassing both cognitive judgments (usefulness, performance expectancy) and affective responses (assurance, pleasure, comfort). In contrast, the digital quality—comprising information, system, and service quality—represents a lower-order functional quality that is predominantly utilitarian, focusing on attributes such as accuracy, stability, and responsiveness. Thus, digital quality constitutes a core input of the cognitive pathway within perceived quality but does not sufficiently capture the affective and relational pathways (e.g., attachment, trust, empathy with medical staff, and healing communication) [3,4].
Second, digital quality functions not as a moderating factor in the transition from satisfaction to loyalty, but rather as a direct determinant of customer satisfaction. Prior studies on digital service quality have suggested that system stability, information reliability, and service responsiveness enhance customer loyalty [30,130]. However, the results of the present study indicate that the moderating effect of digital quality is not statistically significant. This finding suggests the following interpretation: in AI-based platforms, digital services are more likely to be perceived as tools that provide functional utility rather than as channels for forming emotional relationships. In other words, digital quality is closer to a basic hygiene factor than to a loyalty amplification factor, such that once a certain threshold level is satisfied, it does not generate additional increases in loyalty.
This pattern is commonly observed in early-stage platforms where digital touchpoints have not yet matured to a level that elicits emotional commitment. During the initial phase of technological implementation, users may still experience cognitive uncertainty or skepticism toward AI-based prognostic systems, which can weaken the strength of the transfer from satisfaction to affective loyalty. Satisfaction is generally formed through cognitive evaluation based on expectation–disconfirmation, whereas loyalty is reinforced by cumulative emotional and relational factors such as attitude strength, affective attachment, trust, relational norms, and identity congruence [5,6,7,8]. The buffering effect of digital quality—reducing inconvenience and perceived risk—is highly effective for preventing dissatisfaction (a hygiene factor) but limited in intensifying emotional bonding once satisfaction has been achieved. Improvements in infrastructural quality tend to reach a diminishing return or ceiling effect, which is theoretically consistent with Herzberg’s motivation–hygiene theory [9]. In this context, the absence of a moderating effect is theoretically coherent rather than anomalous [5,6].
Third, the finding that environmental uncertainty exerts a positive effect on customer loyalty contrasts with conventional theoretical perspectives. Mainstream theories in management and marketing generally argue that uncertainty increases perceived risk, undermines trust in decision-making, and weakens relational commitment, ultimately reducing customer loyalty [131,132,133,134,135]. From this perspective, higher uncertainty is expected to induce skepticism toward service providers and encourage customers to search for alternative options.
However, the results of this study suggest that such traditional interpretations may not fully apply in the specific context of AI-driven digital healthcare platforms. When technological and health-related uncertainty increases, users may not simply attempt to avoid risk; rather, they tend to seek tools that can help them interpret, predict, and manage that uncertainty. In particular, AI-based platforms that provide early-warning signals, long-term risk forecasts, and personalized health diagnostics function as critical decision-support mechanisms, offering users cognitive reassurance in uncertain environments.
In this context, uncertainty does not necessarily weaken loyalty but can instead reinforce platform dependence and continuance intention. Users are likely to perceive predictive healthcare platforms as a form of “safety net” or “risk management partner,” especially when facing ambiguity regarding their future health conditions. This perception encourages repeated usage and long-term engagement, as users increasingly rely on the platform’s diagnostic insights to navigate uncertainty rather than switching to alternative services.
Moreover, these findings indicate that the effect of uncertainty on loyalty is nonlinear and context-dependent, varying according to service characteristics and technological maturity. Unlike traditional consumer goods or transaction-oriented services, digital healthcare platforms derive their core value from long-term data accumulation and learning effects. As uncertainty rises, users become less inclined to abandon platforms that have already accumulated extensive personal data and diagnostic histories. Instead, uncertainty strengthens relational lock-in effects, as users recognize that continued engagement enhances personalization accuracy and predictive reliability over time.
To sum up, the results highlight the limitations of a unidirectional interpretation of uncertainty as a purely detrimental factor. In the context of AI-based digital healthcare services, uncertainty can paradoxically function as a catalyst that deepens user–platform relationships and fosters customer loyalty. This finding provides an important extension to existing theories by demonstrating that uncertainty may play a fundamentally different role in data-intensive, predictive service environments.
5.2. Managerial Implications
This study classifies customers’ perceived quality into six factors and empirically analyzes the factors that affect customer satisfaction and brand loyalty. The following suggestions can be made to digital healthcare practitioners and executives regarding which factors should be the focus of management and improvement.
First, from the perspective of hospitals and healthcare organizations, managing digital quality as a basic hygiene factor is strategically rational. Herzberg’s [9] Motivator–Hygiene Factor Theory distinguishes between factors that create satisfaction (motivators) and those that prevent dissatisfaction (hygiene factors). When applied to the service-quality context, technical stability, informational reliability, and system security prevent customer dissatisfaction but, even when improved beyond a certain level, do not necessarily act as motivators that enhance loyalty or emotional attachment [3,5]. In this sense, digital quality serves as a basic expectation—a prerequisite condition that customers take for granted when fulfilled but react to immediately with dissatisfaction when deficient [10].
Applied to Oriental medicine services, patients perceive questions such as “Does the platform operate properly?”, “Is the information accurate?”, and “Is my personal data secure?” as the minimum trust conditions for the service. Meeting these expectations does not generate delight, but failure to do so leads directly to dissatisfaction and defection [7,10]. At the functional level, digital quality is fixed within a hygienic mechanism that prevents dissatisfaction by securing cognitive trust and process certainty. Specifically, information quality—through accuracy, timeliness, and relevance—helps patients interpret medical information without misdiagnosis or confusion; system quality—through accessibility, speed, and security—reduces technological inconvenience; and service quality—through responsiveness and problem-solving ability—prevents operational dissatisfaction [11].
Given these characteristics, digital-quality management as a hygiene factor can be divided into three strategic frames: (1) Standardization management, (2) Preventive control, and (3) Diminishing-return management. Standardization management involves integrating international quality and security standards—such as ISO 13485 and ISO/IEC 27001—into internal operations; establishing service-quality manuals that define key performance indicators (e.g., uptime, data accuracy, response time); and maintaining continuous monitoring systems that record and manage system failures, user complaints, and error logs in real time. Preventive control emphasizes proactive risk management—detecting and mitigating data errors, security breaches, or system failures before they occur—along with predictive maintenance (e.g., server-load prediction through log analytics) and UX stability testing for vulnerable users such as the elderly or low digital-literacy patients. Diminishing-return management recognizes that the marginal utility of digital-quality improvement perceived by customers is limited.
Therefore, beyond a certain threshold, resource allocation should focus on maintaining basic reliability, quality assurance, and system updates rather than on excessive investment. In other words, “a system that never crashes” contributes more to satisfaction retention than “a faster system.” For instance, when Hospital A experienced three server outages in its online appointment system, patient satisfaction declined by 25%. After implementing cloud migration and backup systems, revisit rates recovered by 18%. By contrast, Oriental Medicine Platform B improved payment simplicity and record retrieval speed, which increased satisfaction but did not significantly affect loyalty indicators. These cases illustrate the inherent characteristics of digital quality as a hygiene factor and provide a rational direction for hospitals to manage digital quality through standardization, prevention, and efficiency optimization frameworks.
Second, hospitals and healthcare organizations must enhance emotional and relational experiences to strengthen customer loyalty. To improve loyalty beyond satisfaction, it is not sufficient to merely upgrade digital quality; rather, organizations should focus on strengthening healing communication, trust building with medical staff, and personalized counseling. This aligns with Grönroos’s [23] relationship marketing perspective, which emphasizes transforming digital platforms from information delivery tools into media for sustaining relationships. In other words, a strategic balance is needed between a technology-centered approach and a human-centered (patient-centered) approach.
Oliver [10] conceptualized customer loyalty as a four-stage process—cognitive, affective, conative, and behavioral. Satisfaction primarily forms the early cognitive and affective stages, but sustained loyalty (repeat usage, positive word-of-mouth, long-term relationship maintenance) is stabilized only when affective bonds, trust, and attachment are mediated through relational factors [6,7,8]. Thus, while digital quality may induce cognitive satisfaction, the subsequent stage of emotional experience and relationship quality becomes the key driver of loyalty conversion [7,10].
Customers (or patients) do not exhibit long-term loyalty simply because “the system works well.” Instead, a set of psychological mechanisms operates: (1) Affective trust—an emotional assurance and comfort toward the physician or brand; the feeling that “this hospital understands and cares for me.” (2) Identification—he extent to which the patient identifies with the hospital’s values and philosophy; for example, when the patient’s lifestyle resonates with the Oriental-medicine philosophy of natural balance and holistic healing, loyalty is reinforced. (3) Social bonding—continuous interaction, follow-up communication, and personalized feedback that cultivate the perception of a “hospital that remembers me.”
These mechanisms are all strengthened through empathic and relational experiences that cannot be replaced by purely technical quality. Oriental medicine, by nature, places intrinsic value on healing communication and personalized treatment. Therefore, an Oriental-medicine digital platform should evolve beyond its functional role of appointment booking or prescription tracking to serve as a medium for emotional empathy and ongoing relationship continuity.
Emotional and relational experiences are irreplaceable drivers of customer loyalty that cannot be replicated by technical excellence alone [8,10]. For instance, a platform could send personalized messages based on treatment history—such as, “The weather is cold today; your doctor recommends having a warm herbal tea.” After consultations, the system could implement a post-consultation care loop, tracking changes in skin condition, sleep, or blood sugar levels and providing feedback. In addition, hospitals could develop empathy-based chatbots or direct messaging systems that respond to patients’ emotional states (e.g., anxiety, hope, fatigue). Such strategies transcend functional excellence, positioning healing empathy and relational continuity as the core sources of customer loyalty in the digital transformation of Oriental medicine.
Third, the positive effect of environmental uncertainty on platform dependence and customer loyalty observed can be more rigorously theorized through the lenses of the Resource-Based View (RBV) and the Dynamic Capabilities View (DCV). According to RBV, sustainable competitive advantage arises from resources that are valuable, rare, inimitable, and non-substitutable [136]. In the context of digital healthcare, AI-based predictive algorithms, longitudinally accumulated personal health data, and individualized risk-diagnosis capabilities constitute strategic core resources that are difficult for competitors to replicate.
When environmental uncertainty is low, the relative value of such resources may not be fully recognized by users. However, as technological and health-related uncertainty increases, users become more attentive to higher-order resources that enable them to anticipate and manage future risks rather than merely access static information. Under these conditions, the platform’s data intensity, algorithmic learning history, and personalized predictive outputs are increasingly perceived as irreplaceable assets, thereby strengthening users’ cognitive and functional dependence on the platform.
From a DCV perspective, this growing dependence is not merely a consequence of resource possession but rather reflects the platform’s ability to continuously reconfigure and deploy its resources in response to environmental change [137]. AI-driven digital healthcare platforms internalize dynamic capabilities that allow them to sense emerging risks, seize diagnostic and predictive opportunities through adaptive analytics, and transform their algorithms and service architectures over time. These capabilities become more salient as uncertainty intensifies, repeatedly signaling to users the platform’s reliability and adaptive competence.
As a result, uncertainty does not function as an exogenous risk factor that undermines customer loyalty but instead operates as a conditional trigger that activates the platform’s dynamic capabilities. In uncertain environments, users are more likely to remain with platforms that have already accumulated personalized data and learning effects, rather than incur the cognitive and practical costs associated with switching to alternative services. This perception not only increases switching costs but also enhances the expected utility derived from maintaining a long-term relationship with the platform, ultimately translating into higher customer loyalty.
In summary, the findings suggest a coherent theoretical mechanism in which environmental uncertainty enhances the perceived value of strategic resources, amplifies users’ experience of dynamic capabilities, strengthens platform dependence, and ultimately fosters customer loyalty. This study extends prior literature that has predominantly treated uncertainty as a negative external condition by showing that, in data- and AI-intensive industries such as digital healthcare, uncertainty may function as a structural condition that reinforces relational stability and sustainable competitive advantage.
6. Conclusions
This study examined the strategic implications of brand equity—encompassing both the traditional components of perceived quality and the digital quality dimensions emphasized in digital transformation, namely system quality, information quality, and service quality—for customer satisfaction and customer loyalty, using cases from the digital healthcare industry.
The results of this study confirm that digital quality serves as a critical antecedent in forming customer satisfaction, yet no significant moderating effect was found in the transition from satisfaction to loyalty. This indicates that digital quality functions as a foundational element of the service experience, while the conversion from satisfaction to loyalty is mediated by relational factors such as emotional attachment and trust. In other words, digital quality directly influences satisfaction through cognitive evaluations, but it has limited impact on strengthening loyalty that requires emotional commitment.
From this perspective, healthcare institutions should recognize that digital quality must be managed as a basic hygiene factor rather than as a differentiating factor. System stability, information reliability, and service responsiveness constitute the basic quality attributes that patients naturally expect when selecting Oriental-medicine healthcare services. According to Herzberg’s [9] Motivator–Hygiene Theory, such factors cause dissatisfaction when they fall below an acceptable threshold, yet improvements beyond that level do not substantially enhance satisfaction or loyalty. Therefore, medical institutions should treat digital quality not as a source of differentiation but as an essential maintenance element—a prerequisite for patient satisfaction and trust in the digital era of healthcare.
Despite the research results and beneficial implications, the limitations of this study and future research directions are as follows. First, the empirical findings identified in this study are not substantially different from a series of findings reported in recent customer experience research that has attracted increasing attention [37,38,39]. Just as customers’ cognitive experiences have a positive effect on service satisfaction, digital quality resulting from digital transformation—particularly information quality—stimulates customer satisfaction and leads to customer loyalty. Among the elements of system quality and service quality provided by digital quality, some elements lead to satisfaction and loyalty through customers’ emotional experiences. Positive evaluations by customers derived from traditional relationship quality lead to satisfaction and loyalty through customers’ social experiences. Nevertheless, this study did not examine customers’ cognitive, social, and emotional experiences as mediating elements that connect the structural relationships among service quality, customer satisfaction, and loyalty. Therefore, it is necessary to more closely examine the structural relationships among these elements through extended research.
Second, several follow-up verification analyses can be proposed. The first is refinement of the measurement model. Perceived quality should be modeled as a second-order construct, separating its subdimensions into cognitive (usefulness, ease of use) and affective (assurance, liking, enjoyment) components, and testing discriminant validity using the HTMT criterion. Another recommended analysis involves alternative moderator comparisons. A competitive model could test whether the interaction terms of Satisfaction × Trust/Attachment/Physician–Patient Bond are significant, while Satisfaction × Digital Quality remains non-significant, thereby identifying the more dominant relational moderators.
Third, a serial mediation model can serve as a parsimonious alternative framework. In the present context, a sequential chain such as Digital Quality → (Higher-Order) Perceived Quality → Satisfaction → Trust/Attachment → Loyalty may offer a more theoretically appropriate structure. This implies that the mechanism is multi-stage mediation rather than moderation. Empirically, it is expected that (a) digital quality functions as an antecedent of satisfaction, and (b) trust and attachment (affective factors) operate as pure mediators in the satisfaction–loyalty linkage [103].
Fourth, several extended model designs can be considered to overcome the limitations of the present framework. One direction is to analyze nonlinear or threshold effects. Specifically, a Kano-type asymmetry—where dissatisfaction rises sharply when digital quality falls below expectations but plateaus when expectations are met—could be tested through quadratic or piecewise regression terms [9]. Another promising approach is contextual analysis, examining whether the moderating effects of emotional and relational factors become stronger in specific patient segments—such as elderly or chronically ill patients, first-time users, or high-uncertainty treatment conditions—through multi-group analysis.
Fifth, methodological improvements can be expected. Above all, future studies need to strengthen external validity by employing samples that include cross-national comparisons or multiple platforms. In addition, the present study is based on cross-sectional data collected at a single point in time. However, in digital healthcare environments, the relationship between satisfaction and loyalty changes over time. Follow-up studies using longitudinal designs or panel data would allow this relationship to be examined more precisely.
Finally, interpretation of the relationship between AI quality and user behavior remains insufficient. Future research should expand the model by incorporating AI-related attributes such as algorithmic transparency, explainability (XAI), perceived fairness, and error tolerance, and should analyze how AI diagnostic results influence user behavior. Recent studies point out that how patients interpret AI diagnostic outcomes, the extent to which they trust them, and how they actually act upon them are closely associated with satisfaction and loyalty.
A comprehensive understanding of how service-quality antecedents in the digital healthcare industry shape customer satisfaction and loyalty will only be achieved through these complementary lines of inquiry. This study is expected to provide a conceptual foundation and inspiration for such future research endeavors.
Author Contributions
Conceptualization, O.S.Y. and S.H.K.; methodology, S.H.K.; writing and editing, S.H.K.; funding acquisition, O.S.Y. All authors have read and agreed to the published version of the manuscript.
Funding
This research was supported by the Regional Innovation System & Education (RISE) program through the Gangwon RISE Center, funded by the Ministry of Education (MOE) and the Gangwon State (G.S.), Republic of Korea (2025-RISE-10-002).
Institutional Review Board Statement
Ethical review and approval were waived for this study by Institution Committee due to Public Institutional Review Board (Public IRB) regulations of the Korea National Institute for Bioethics Policy (KoNIBP).
Informed Consent Statement
Digital informed consent was obtained from all participants prior to their participation in the offline survey, which was administered remotely rather than on-site.
Data Availability Statement
All data generated or analyzed during this study are available from the corresponding authors upon reasonable request.
Acknowledgments
The authors would like to thank the anonymous reviewers and editor.
Conflicts of Interest
The authors declare no conflicts of interest.
Appendix A. Survey Questionnaire
Table A1.
Brand equity.
Table A2.
Digital transformation (digital quality). Please respond to the survey by comparing your main Oriental medicine hospital’s digital products and services with those of other hospitals based on the last three years.
Table A3.
Customer satisfaction and brand loyalty.
Table A4.
Uncertainty.
Appendix B
Table A5.
Indicator loading and cross loading.
References
- Parida, V.; Sjödin, D.; Reim, W. Reviewing literature on digitalization, business model innovation, and sustainable industry: Past achievements and future promises. Sustainability 2019, 11, 391. [Google Scholar] [CrossRef] [Scilit]
- Agarwal, R.; Gao, G.; DesRoches, C.; Jha, A.K. The digital transformation of healthcare: Current status and the road ahead. Inf. Syst. Res. 2022, 33, 1–19. [Google Scholar]
- Keller, K.L. Conceptualizing, measuring, and managing customer-based brand equity. J. Mark. 1993, 57, 1–22. [Google Scholar] [CrossRef] [Scilit]
- Park, H.-S. Determinants of patients satisfaction and intent to revisit oriental medical hospitals. J. Korea Acad. Ind. Coop. Soc. 2015, 16, 2726–2736. [Google Scholar] [CrossRef] [Scilit]
- Chen, X.; Chen, C.; Tian, X.; He, L.; Zuo, E.; Liu, P.; Xue, Y.; Yang, J.; Chen, C.; Lv, X. DBAN: An improved dual branch attention network combined with serum Raman spectroscopy for diagnosis of diabetic kidney disease. Talanta 2024, 266, 125052. [Google Scholar] [CrossRef] [Scilit] [PubMed]
- Hu, F.; Yang, H.; Qiu, L.; Wang, X.; Ren, Z.; Wei, S.; Zhou, H.; Chen, Y.; Hu, H. Innovation networks in the advanced medical equipment industry: Supporting regional digital health systems from a local–national perspective. Front. Public Health 2025, 13, 1635475. [Google Scholar] [CrossRef] [Scilit] [PubMed]
- Aaker, D.A. Building Strong Brands; The Free Press: New York, NY, USA, 1996. [Google Scholar]
- Parasuraman, A.; Zeithaml, V.A.; Berry, L.L. SERVQUAL: A multiple-item scale for measuring consumer perceptions of service quality. J. Retail. 1988, 64, 12–40. [Google Scholar]
- Herzberg, F. The Motivation to Work; John Wiley & Sons: New York, NY, USA, 1959. [Google Scholar]
- Oliver, R.L. Whence consumer loyalty? J. Mark. 1999, 63, 33–44. [Google Scholar] [CrossRef] [Scilit]
- Morgan, R.M.; Hunt, S.D. The commitment-trust theory of relationship marketing. J. Mark. 1994, 58, 20–38. [Google Scholar] [CrossRef] [Scilit]
- Farquhar, P.H. Managing brand equity. Mark. Res. 1989, 1, 24–33. [Google Scholar]
- Berry, L.L. Cultivating service brand equity. J. Acad. Mark. Sci. 2000, 28, 128–137. [Google Scholar] [CrossRef] [Scilit]
- Goyal, A.; Verma, P. The relationship between brand engagement, brand loyalty, overall brand equity and purchase intention. J. Strateg. Mark. 2024, 32, 65–79. [Google Scholar] [CrossRef] [Scilit]
- Yoo, B.; Donthu, N.; Lee, S. An examination of selected marketing mix elements and brand equity. J. Acad. Mark. Sci. 2000, 28, 195–211. [Google Scholar] [CrossRef] [Scilit]
- Simon, C.J.; Sullivan, M.W. The measurement and determinants of brand equity: A financial approach. Mark. Sci. 1993, 12, 28–52. [Google Scholar] [CrossRef] [Scilit]
- Sum, J.-H. A study on the links among brand, brand capability, brand performance, and financial performance-from the perspectives of resource-based view and dynamic capability. J. Brand Des. Assoc. Korea 2023, 9, 249–258. [Google Scholar] [CrossRef]
- Cheng, B.; Hou, S. Brand equity and financial performance: An institutional view. Mark. Intell. Plan. 2024, 42, 1433–1463. [Google Scholar] [CrossRef] [Scilit]
- Dodds, W.B.; Monroe, K.B. The effect of brand and price information on subjective product evaluations. Adv. Consum. Res. 1985, 12, 85–90. [Google Scholar]
- Parasuraman, A.; Zeithaml, V.A.; Berry, L.L. A conceptual model of service quality and its implications for future research. J. Mark. 1985, 49, 41–50. [Google Scholar] [CrossRef] [Scilit]
- Zeithaml, V.A. Consumer perceptions of price, quality, and value: A means–end model and synthesis of evidence. J. Mark. 1988, 52, 2–22. [Google Scholar] [CrossRef] [Scilit]
- Oliver, R.L. A cognitive model of the antecedents and consequences of satisfaction decisions. J. Mark. Res. 1980, 17, 460–469. [Google Scholar] [CrossRef] [Scilit]
- Grönroos, C. A service quality model and its marketing implications. Eur. J. Mark. 1984, 18, 36–44. [Google Scholar] [CrossRef] [Scilit]
- Cronin, J.J.; Taylor, S.A. Measuring service quality: A reexamination and extension. J. Mark. 1992, 56, 55–68. [Google Scholar] [CrossRef] [Scilit]
- Bitner, M.J. Servicescapes: The impact of physical surroundings on customers and employees. J. Mark. 1992, 56, 57–71. [Google Scholar] [CrossRef] [Scilit]
- Berman, S.J.; Bell, R. Digital transformation: Creating new business models where digital meets physical. IBM Inst. Bus. Value Rep. 2011, 1, 1–20. [Google Scholar]
- Yoo, J.; Cho, H. Digital innovation and corporate performance in Korea: The moderating role of organizational agility. Technol. Forecast. Soc. Change 2018, 135, 158–168. [Google Scholar]
- Che, T.; Cai, J.; Yang, R.; Lai, F. Digital transformation drives product quality improvement: An organizational transparency perspective. Technol. Forecast. Soc. Change 2023, 197, 122888. [Google Scholar] [CrossRef] [Scilit]
- Zhao, Y.; Xu, H.; Liu, G.; Zhou, Y.; Wang, Y. Can digital transformation improve the quality of enterprise innovation in China? Eur. J. Innov. Manag. 2025, 28, 1034–1060. [Google Scholar] [CrossRef] [Scilit]
- Parasuraman, A.; Zeithaml, V.A.; Malhotra, A. E-S-QUAL: A multiple-item scale for assessing electronic service quality. J. Serv. Res. 2005, 7, 213–233. [Google Scholar] [CrossRef] [Scilit]
- Dwivedi, Y.K.; Hughes, D.L.; Wang, Y.; Sun, J.A.; Ahn, G.; Balakrishnan, J.; Barta, S.; Belk, R.; Buhalis, D.; Dutot, V.; et al. Metaverse marketing: How the metaverse will shape the future of consumer research and practice. Psychol. Mark. 2023, 40, 625–862. [Google Scholar] [CrossRef] [Scilit]
- Jarvenpaa, S.L.; Tractinsky, N.; Vitale, M. Consumer trust in an Internet store. Inf. Technol. Manag. 2000, 1, 45–71. [Google Scholar] [CrossRef] [Scilit]
- Zeithaml, V.A.; Parasuraman, A.; Malhotra, A. Service quality delivery through web sites: A critical review of extant knowledge. J. Acad. Mark. Sci. 2002, 30, 362–375. [Google Scholar] [CrossRef] [Scilit]
- Nguyen, M.; Waller, M.; Pandya, A.; Portnoy, J. A review of patient and provider satisfaction with telemedicine. Curr. Allergy Asthma Rep. 2020, 20, 72. [Google Scholar] [CrossRef] [Scilit] [PubMed]
- Kim, S.M.; Byeon, G.W.; Jeong, S.M.; Kim, Y.M.; Lee, K.U. Satisfaction Survey of Telemedicine Services for the Patients with Dementia in the Vulnerable Area for Medical Service. J. Korean Neuropsychiatr. Assoc. 2021, 60, 366–378. [Google Scholar] [CrossRef] [Scilit]
- Lemon, K.N.; Verhoef, P.C. Understanding customer experience throughout the customer journey. J. Mark. 2016, 80, 69–96. [Google Scholar] [CrossRef] [Scilit]
- Becker, L.; Jaakkola, E. Customer experience: Fundamental premises and implications for research. J. Acad. Mark. Sci. 2020, 48, 630–648. [Google Scholar] [CrossRef] [Scilit]
- O’Connor, G.E.; Myrden, S.; Alkire, L.; Lee, K.; Köcher, S.; Kandampully, J.; Williams, J.D. Digital Health Experience: A Regulatory Focus Perspective. J. Interact. Mark. 2021, 56, 121–136. [Google Scholar] [CrossRef] [Scilit]
- Verleye, K. The co-creation experience from the customer perspective: Its measurement and determinants. J. Serv. Manag. 2015, 26, 321–342. [Google Scholar] [CrossRef] [Scilit]
- Choi, B.J.; Kim, H.S. The Impact of Outcome Quality, Interaction Quality, and Peer-to-Peer Quality on Customer Satisfaction with a Hospital Service. Manag. Serv. Qual. 2013, 23, 188–204. [Google Scholar] [CrossRef] [Scilit]
- Cho, Y.-S.; Kweon, J.-H. A study on relationship between health services quality and customer’s satisfaction in oriental medicine hospitals. J. Korean Med. 2006, 27, 86–95. [Google Scholar] [CrossRef] [Scilit] [PubMed]
- Yum, K.; Kim, J. The influence of perceived value, customer satisfaction, and trust on loyalty in entertainment platforms. Appl. Sci. 2024, 14, 5763. [Google Scholar] [CrossRef] [Scilit]
- Anderson, R.E.; Srinivasan, S.S. E-satisfaction and e-loyalty: A contingency framework. Psychol. Mark. 2003, 20, 123–138. [Google Scholar] [CrossRef] [Scilit]
- Sebastian, I.M.; Moloney, K.G.; Ross, J.W.; Fonstad, N.; Beath, C.; Mocker, M. How big old companies navigate digital transformation. MIS Q. Exec. 2020, 19, 31–54. [Google Scholar]
- Yang, O.S.; Kim, C.G. The impact of corporate digital transformation on corporate performance: Focusing on the mediating effects of functional, symbolic, experiential, emotional, and social values. Korean Manag. Consult. Rev. 2023, 10, 113–133. [Google Scholar]
- Davis, F.D. Perceived usefulness, perceived ease of use, and user acceptance of information technology. MIS Q. 1989, 13, 319–340. [Google Scholar] [CrossRef] [Scilit]
- Na, D.; Park, S. Fusion chain: A decentralized lightweight blockchain for IoT security and privacy. Electronics 2021, 10, 391. [Google Scholar] [CrossRef] [Scilit]
- Bhandari, U.; Neben, T.; Chang, K.; Chua, W.Y. Effects of interface design factors on affective responses and quality evaluations in mobile applications. Comput. Hum. Behav. 2017, 72, 525–534. [Google Scholar] [CrossRef] [Scilit]
- Marbouh, D.; Swarnakar, V.; Simsekler, M.C.E.; Antony, J.; Lizarelli, F.L.; Jayaraman, R.; Garza-Reyes, J.A.; Shokri, A.; Cudney, E.; Ellahham, S. Healthcare 4.0 digital technologies impact on quality of care: A systematic literature review. Total Qual. Manag. Bus. Excell. 2023, 34, 2157–2182. [Google Scholar] [CrossRef] [Scilit]
- Erku, D.; Khatri, R.; Endalamaw, A.; Wolka, E.; Nigatu, F.; Zewdie, A.; Assefa, Y. Digital health interventions to improve access to and quality of primary health care services: A scoping review. Int. J. Environ. Res. Public Health 2023, 20, 6854. [Google Scholar] [CrossRef] [Scilit] [PubMed]
- Gopal, G.; Suter-Crazzolara, C.; Toldo, L.; Eberhardt, W. Digital transformation in healthcare–architectures of present and future information technologies. Clin. Chem. Lab. Med. (CCLM) 2019, 57, 328–335. [Google Scholar] [CrossRef] [Scilit]
- Abbasi, R.; Khajouei, R.; Sadeqi Jabali, M. Timeliness and accuracy of information sharing from hospital information systems to electronic health record in Iran. J. Health Adm. 2019, 22, 28–40. [Google Scholar]
- Lee, J.W. A study on quality evaluation of digital libraries. J. Korean Soc. Libr. Inf. Sci. 2004, 38, 143–172. [Google Scholar] [CrossRef] [Scilit]
- Syed, R.; Eden, R.; Makasi, T.; Chukwudi, I.; Mamudu, A.; Kamalpour, M.; Geeganage, D.K.; Sadeghianasl, S.; Leemans, S.J.J.; Goel, K.; et al. Digital health data quality issues: Systematic review. J. Med. Int. Res. 2023, 25, e42615. [Google Scholar] [CrossRef] [Scilit]
- Hwang, J.Y.; Lee, E.B. A review of studies on the service quality evaluation of digital libraries: On the basis of evaluation models and measures methodologies. J. Korean Libr. Inf. Sci. Soc. 2009, 40, 243–265. [Google Scholar] [CrossRef] [Scilit]
- Ibrahim, M.S.; Mohamed Yusoff, H.; Abu Bakar, Y.I.; Thwe Aung, M.M.; Abas, M.I.; Ramli, R.A. Digital health for quality healthcare: A systematic mapping of review studies. Digit. Health 2022, 8, 20552076221085810. [Google Scholar] [CrossRef] [Scilit]
- Butcher, C.J.; Hussain, W. Digital healthcare: The future. Future Healthc. J. 2022, 9, 113–117. [Google Scholar] [CrossRef] [Scilit]
- Wulandari, R.; Doddy, I.; Indaryani, L. Measuring the impact of healthcare service quality of hospitals on customer satisfaction. Corp. Bus. Strategy Rev. 2024, 5, 336–345. [Google Scholar] [CrossRef] [Scilit]
- Baker, J.; Grewal, D.; Parasuraman, A. The influence of store environment on quality inferences and store image. J. Acad. Mark. Sci. 1994, 22, 328–339. [Google Scholar] [CrossRef] [Scilit]
- Li, L. Digital transformation and sustainable performance: The moderating role of market turbulence. Ind. Mark. Manag. 2022, 104, 28–37. [Google Scholar] [CrossRef] [Scilit]
- Courtney, H.; Kirkland, J.; Viguerie, P. Strategy under uncertainty. Harv. Bus. Rev. 1997, 75, 66–79. [Google Scholar] [PubMed]
- Ministry of Health and Welfare. 2023 Survey on Herbal Medicine Consumption in Korea; Ministry of Health and Welfare: Sejong, Republic of Korea, 2024. Available online: https://www.mohw.go.kr/board.es?mid=a10503010100&bid=0027&act=view&list_no=1480827&nPage=1 (accessed on 9 January 2026).
- Bloom, N. The impact of uncertainty shocks. Econometrica 2009, 77, 623–685. [Google Scholar] [CrossRef] [Scilit]
- Yousuf, A.; Lorestani, V.Z.; Oláh, J.; Felföldi, J. Does uncertainty moderate the relationship between strategic flexibility and companies’ performance? evidence from small and medium pharmaceutical companies in Iran. Sustainability 2021, 13, 9157. [Google Scholar] [CrossRef] [Scilit]
- Hawrysz, L.; Kludacz-Alessandri, M.; Kluczka, A.Z.; Żak, K. Perceived environmental uncertainty and job involvement: The mediating role of digital technology and organizational trust-a cross-sectional study in primary care facilities in the UK. BMC Health Serv. Res. 2024, 24, 1151. [Google Scholar] [CrossRef] [Scilit] [PubMed]
- Kang, D.-K. An analysis of the relationship between level of information oriented, environmental uncertainty, market orientation and performance in firm. J. E-Bus. 2008, 9, 47–67. [Google Scholar]
- Aarninkhof-Kamphuis, A.; Voordijk, H.; Dewulf, G. Coping with uncertainties: Challenges for decision makers in healthcare. J. Facil. Manag. 2024, 22, 883–899. [Google Scholar] [CrossRef] [Scilit]
- Youn, Y.-S. Development of oriental medical CRM system-based wire/wireless for digital oriental hospital. J. Korea Soc. Ind. Inf. Syst. 2007, 12, 131–137. [Google Scholar]
- Yoo, S.-G. A study on the internet marketing strategy for medical tourism in the digital era. J. E-Bus. 2010, 11, 83–104. [Google Scholar]
- Jo, G.; Yoon, S.; Bae, J.W.; Kim, B.J. Using US patent analysis to monitor the technological trend in the field of gastrointestinal microbiome-implications on Korean medicine research and development. J. Korean Med. 2023, 44, 38–55. [Google Scholar] [CrossRef] [Scilit]
- Kim, W.-S.; Lee, S.-M. Success factors for localization in the healthcare medical device industry: Focusing on blood glucose monitoring system industry. Korea Bus. Rev. 2021, 25, 33–52. [Google Scholar] [CrossRef] [Scilit]
- Stephens, K.K.; Jahn, J.L.; Fox, S.; Charoensap-Kelly, P.; Mitra, R.; Sutton, J.; Waters, E.D.; Xie, B.; Meisenbach, R.J. Collective sensemaking around COVID-19: Experiences, concerns, and agendas for our rapidly changing organizational lives. Manag. Commun. Q. 2020, 34, 426–457. [Google Scholar] [CrossRef] [Scilit]
- Stieglitz, N.; Knudsen, T.; Becker, M.C. Adaptation and inertia in dynamic environments. Strateg. Manag. J. 2016, 37, 1854–1864. [Google Scholar] [CrossRef] [Scilit]
- Park, J.-M.; Yang, O.-S. Global firm’s exploitative & exploratory capabilities and contextual ambidexterity as buffer stock for uncertainty. Int. Bus. Rev. 2017, 21, 129–174. [Google Scholar] [CrossRef] [Scilit]
- Loureiro, R.; Ferreira, J.J.; Simões, J. Understanding healthcare sector organizations from a dynamic capabilities perspective. Eur. J. Innov. Manag. 2023, 26, 588–614. [Google Scholar] [CrossRef] [Scilit]
- DeLone, W.H.; McLean, E.R. The DeLone and McLean model of information systems success: A ten-year update. J. Manag. Inf. Syst. 2003, 19, 9–30. [Google Scholar]
- Gefen, D.; Karahanna, E.; Straub, D.W. Trust and TAM in online shopping: An integrated model. MIS Q. 2003, 27, 51–90. [Google Scholar] [CrossRef] [Scilit]
- Khan, W.A.; Abideen, Z.U. Effects of behavioural intention on usage behaviour of digital wallet: The mediating role of perceived risk and moderating role of perceived service quality and perceived trust. Future Bus. J. 2023, 9, 73. [Google Scholar] [CrossRef] [Scilit]
- Al-Okaily, M.; Alghazzawi, R.; Alkhwaldi, A.F.; Al-Okaily, A. The effect of digital accounting systems on the decision-making quality in the banking industry sector: A mediated-moderated model. Glob. Knowl. Mem. Commun. 2023, 72, 882–901. [Google Scholar] [CrossRef] [Scilit]
- Venkatakrishnan, J.; Alagiriswamy, R.; Parayitam, S. Web design and trust as moderators in the relationship between e-service quality, customer satisfaction and customer loyalty. TQM J. 2023, 35, 2455–2484. [Google Scholar] [CrossRef] [Scilit]
- Liu, Y.; Jiang, Y. The Impact of Supply Chain Quality Management on Firm Performance in Manufacturing Business: The Moderating Role of Digital Intelligence. Sustainability 2025, 17, 4165. [Google Scholar] [CrossRef] [Scilit]
- Seck, A.M.; Philippe, J. Service quality and satisfaction in online banking: An empirical investigation. Serv. Bus. 2013, 7, 345–360. [Google Scholar]
- von Leipzig, T.; Gamp, M.; Manz, D.; Schöttle, K.; Ohlhausen, P.; Oosthuizen, G.; Palm, D.; von Leipzig, K. Initialising customer-oriented digital transformation in enterprises. Procedia Manuf. 2017, 8, 517–524. [Google Scholar] [CrossRef] [Scilit]
- Moghavvemi, S.; Lee, S.T.; Lee, S.P. Perceived overall service quality and customer satisfaction in Islamic banking: The mediating role of customer loyalty. Int. J. Bank Mark. 2018, 36, 823–848. [Google Scholar]
- Preston, C.C.; Colman, A.M. Optimal number of response categories in rating scales: Reliability, validity, discriminating power, and respondent preferences. Acta Psychol. 2000, 104, 1–15. [Google Scholar] [CrossRef] [Scilit] [PubMed]
- Lisboa, A.; Skarmeas, D.; Lages, C. Entrepreneurial orientation, resource-based view, and performance in manufacturing firms. Ind. Mark. Manag. 2011, 40, 1296–1305. [Google Scholar]
- Smith, D.C. Brand extensions and advertising efficiency: What can and can’t be expected. J. Advert. Res. 1992, 32, 11–20. [Google Scholar] [CrossRef] [Scilit]
- Cho, S.; Lim, Y. Effects of hospital brand image on patient satisfaction and trust. Korean J. Health Serv. Manag. 2011, 5, 1–16. [Google Scholar]
- Saxe, R.; Weitz, B.A. The SOCO scale: A measure of the customer orientation of salespeople. J. Mark. Res. 1982, 19, 343–351. [Google Scholar] [CrossRef] [Scilit]
- Williams, P. The effect of relational factors on consumer trust and loyalty in services. J. Serv. Mark. 2002, 16, 307–319. [Google Scholar]
- Lee, H.; Kim, S. The impact of physical environment quality on patient satisfaction and revisit intention. Healthc. Manag. Rev. 2015, 40, 115–123. [Google Scholar]
- Kwak, K.Y.; Lee, Y.J. A study on the factors affecting the usage intention of the mobile banking service in the digital convergence age. Inf. Syst. Rev. 2005, 7, 85–100. [Google Scholar]
- Kim, Y. Digital service quality and patient satisfaction in AI-based medical platforms. Health Inform. J. 2022, 28, 442–456. [Google Scholar]
- Yi, Y. A critical review of consumer satisfaction. Rev. Mark. 1990, 4, 68–123. [Google Scholar]
- Westbrook, R.A. Product/consumption-based affective responses and postpurchase processes. J. Mark. Res. 1987, 24, 258–270. [Google Scholar] [CrossRef] [Scilit]
- Oliver, R.L. Measurement and evaluation of satisfaction processes in retail settings. J. Retail. 1981, 57, 25–48. [Google Scholar]
- Richins, M.L. Measuring emotions in the consumption experience. J. Consum. Res. 1997, 24, 127–146. [Google Scholar] [CrossRef] [Scilit]
- Johnson, M.D.; Fornell, C. A framework for comparing customer satisfaction across individuals and product categories. J. Econ. Psychol. 1991, 12, 267–286. [Google Scholar] [CrossRef] [Scilit]
- Raghunathan, R.; Irwin, J.R. Walking the hedonic product treadmill: The role of affective expectations in satisfaction. J. Consum. Res. 2001, 28, 355–368. [Google Scholar] [CrossRef] [Scilit]
- Lee, J.; Ra, K. The effects of perceived medical service quality on patient satisfaction and loyalty. Korean J. Hosp. Manag. 2019, 24, 11–29. [Google Scholar]
- Bowen, J.T.; Chen, S.L. The relationship between customer loyalty and customer satisfaction. Int. J. Contemp. Hosp. Manag. 2001, 13, 213–217. [Google Scholar] [CrossRef] [Scilit]
- Dick, A.S.; Basu, K. Customer loyalty: Toward an integrated conceptual framework. J. Acad. Mark. Sci. 1994, 22, 99–113. [Google Scholar] [CrossRef] [Scilit]
- Chaudhuri, A.; Holbrook, M.B. The chain of effects from brand trust and brand affect to brand performance: The role of brand loyalty. J. Mark. 2001, 65, 81–93. [Google Scholar] [CrossRef] [Scilit]
- Bloemer, J.; de Ruyter, K.; Wetzels, M. Linking perceived service quality and service loyalty: A multi-dimensional perspective. Eur. J. Mark. 1999, 33, 1082–1106. [Google Scholar] [CrossRef] [Scilit]
- Zeithaml, V.A.; Berry, L.L.; Parasuraman, A. The behavioral consequences of service quality. J. Mark. 1996, 60, 31–46. [Google Scholar] [CrossRef] [Scilit]
- Sirgy, M.J.; Samli, A.C. A path analytic model of store loyalty involving self-concept, store image, geographic loyalty, and socioeconomic status. J. Acad. Mark. Sci. 1985, 13, 265–291. [Google Scholar] [CrossRef]
- Gefen, D.; Straub, D.; Boudreau, M.-C. Structural equation modeling and regression: Guidelines for research practice. Commun. Assoc. Inf. Syst. 2000, 4, 7. [Google Scholar] [CrossRef] [Scilit]
- Chin, W.W. The partial least squares approach for structural equation modeling. In Modern Methods for Business Research; Marcoulides, G.A., Ed.; Lawrence Erlbaum Associates: Mahwah, NJ, USA, 1998; pp. 295–336. [Google Scholar]
- Hair, J.F.; Hult, G.T.M.; Ringle, C.M.; Sarstedt, M. A Primer on Partial Least Squares Structural Equation Modeling (PLS-SEM), 3rd ed.; Sage: Thousand Oaks, CA, USA, 2021. [Google Scholar]
- Mason, C.H.; Perreault, W.D. Collinearity, power, and interpretation of multiple regression analysis. J. Mark. Res. 1991, 28, 268–280. [Google Scholar] [CrossRef] [Scilit]
- Hair, J.F.; Black, W.C.; Babin, B.J.; Anderson, R.E. Multivariate Data Analysis, 8th ed.; Pearson Education: Harlow, UK, 2019. [Google Scholar]
- Kock, N.; Lynn, G. Lateral collinearity and misleading results in variance-based SEM: An illustration and recommendations. J. Assoc. Inf. Syst. 2012, 13, 546–580. [Google Scholar] [CrossRef] [Scilit]
- Diamantopoulos, A.; Siguaw, J.A. Formative indicators in structural equation modeling: An illustration using the perceived service quality construct. J. Bus. Res. 2006, 59, 713–721. [Google Scholar]
- Chin, W.W. How to write up and report PLS analyses. In Handbook of Partial Least Squares; Esposito Vinzi, V., Chin, W.W., Henseler, J., Wang, H., Eds.; Springer: Berlin, Germany, 2010; pp. 655–690. [Google Scholar]
- Stevens, J.P. Applied Multivariate Statistics for the Social Sciences, 5th ed.; Routledge: New York, NY, USA, 2012. [Google Scholar]
- Nunnally, J.C.; Bernstein, I.H. Psychometric Theory, 3rd ed.; McGraw-Hill: New York, NY, USA, 1994. [Google Scholar]
- Fornell, C.; Larcker, D.F. Evaluating structural equation models with unobservable variables and measurement error. J. Mark. Res. 1981, 18, 39–50. [Google Scholar] [CrossRef] [Scilit]
- Gefen, D.; Straub, D.W. A practical guide to factorial validity using PLS-Graph: Tutorial and annotated example. Commun. Assoc. Inf. Syst. 2005, 16, 91–109. [Google Scholar] [CrossRef] [Scilit]
- Henseler, J.; Ringle, C.M.; Sarstedt, M. A new criterion for assessing discriminant validity in variance-based structural equation modeling. J. Acad. Mark. Sci. 2015, 43, 115–135. [Google Scholar] [CrossRef] [Scilit]
- Armstrong, J.S.; Overton, T.S. Estimating nonresponse bias in mail surveys. J. Mark. Res. 1977, 14, 396–402. [Google Scholar] [CrossRef] [Scilit]
- Podsakoff, P.M.; MacKenzie, S.B.; Lee, J.-Y.; Podsakoff, N.P. Common method biases in behavioral research: A critical review of the literature and recommended remedies. J. Appl. Psychol. 2003, 88, 879–903. [Google Scholar] [CrossRef] [Scilit]
- Kock, N. Common method bias in PLS-SEM: A full collinearity assessment approach. Int. J. E-Collab. 2015, 11, 1–10. [Google Scholar] [CrossRef] [Scilit]
- Efron, B.; Tibshirani, R.J. An Introduction to the Bootstrap; Chapman & Hall: New York, NY, USA, 1993. [Google Scholar]
- Sobel, M.E. Asymptotic confidence intervals for indirect effects in structural equation models. Sociol. Methodol. 1982, 13, 290–312. [Google Scholar] [CrossRef] [Scilit]
- Cohen, J. Statistical Power Analysis for the Behavioral Sciences, 2nd ed.; Lawrence Erlbaum Associates: Hillsdale, NJ, USA, 1988. [Google Scholar]
- Witowska, J.; Ogden, R.; Schoetensack, C.; Goncikowska, K.; Wittmann, M.; Černohorská, V.; Codina, N.; Martin-Soelch, C.; Boente, M.F.; Giner, G.; et al. New measurements of digital technology use: The Immersion in Digital Life and Quality of Digital Experience scales. Front. Psychiatry 2025, 16, 1595536. [Google Scholar] [CrossRef] [Scilit] [PubMed]
- Peters, D.; Calvo, R.A.; Ryan, R.M. Designing for motivation, engagement and wellbeing in digital experience. Front. Psychol. 2018, 9, 300159. [Google Scholar] [CrossRef] [Scilit]
- Chauhan, S.; Akhtar, A.; Gupta, A. Customer experience in digital banking: A review and future research directions. Int. J. Qual. Serv. Sci. 2022, 14, 311–348. [Google Scholar] [CrossRef] [Scilit]
- Wang, T.; Giunti, G.; Melles, M.; Goossens, R. Digital patient experience: Umbrella systematic review. J. Med. Int. Res. 2022, 24, e37952. [Google Scholar] [CrossRef] [Scilit] [PubMed]
- Bolton, R.; Logan, C.; Gittell, J.H. Revisiting relational coordination: A systematic review. J. Appl. Behav. Sci. 2021, 57, 290–322. [Google Scholar] [CrossRef] [Scilit]
- Miller, D.; Friesen, P.H. Strategy-making and environment: The third link. Strateg. Manag. J. 1983, 4, 221–235. [Google Scholar] [CrossRef] [Scilit]
- Garbarino, E.; Johnson, M.S. The different roles of satisfaction, trust, and commitment in customer relationships. J. Mark. 1999, 63, 70–87. [Google Scholar] [CrossRef] [Scilit]
- Bloemer, J.M.; Kasper, H.D. The complex relationship between consumer satisfaction and brand loyalty. J. Econ. Psychol. 1995, 16, 311–329. [Google Scholar] [CrossRef] [Scilit]
- Anderson, E.; Weitz, B. Determinants of continuity in conventional industrial channel dyads. Mark. Sci. 1989, 8, 310–323. [Google Scholar] [CrossRef] [Scilit]
- Jaworski, B.J.; Kohli, A.K. Market orientation: Antecedents and consequences. J. Mark. 1993, 57, 53–70. [Google Scholar] [CrossRef] [Scilit]
- Barney, J. Firm resources and sustained competitive advantage. J. Manag. 1991, 17, 99–120. [Google Scholar] [CrossRef] [Scilit]
- Teece, D.J.; Pisano, G.; Shuen, A. Dynamic capabilities and strategic management. Strateg. Manag. J. 1997, 18, 509–533. [Google Scholar] [CrossRef] [Scilit]
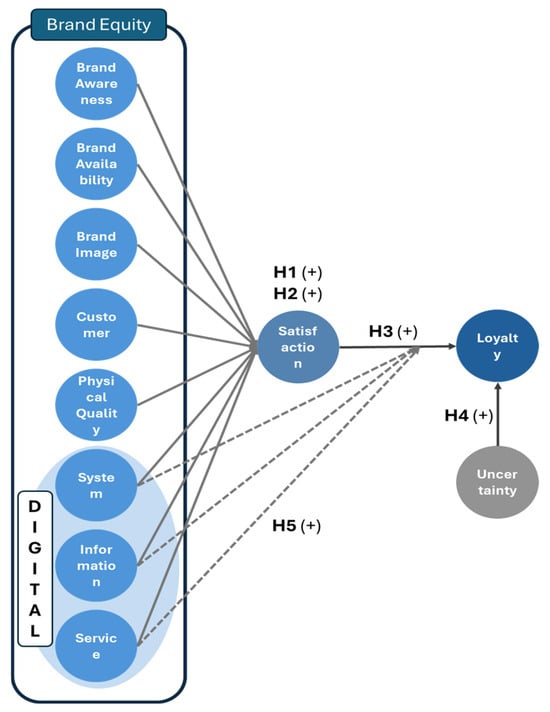
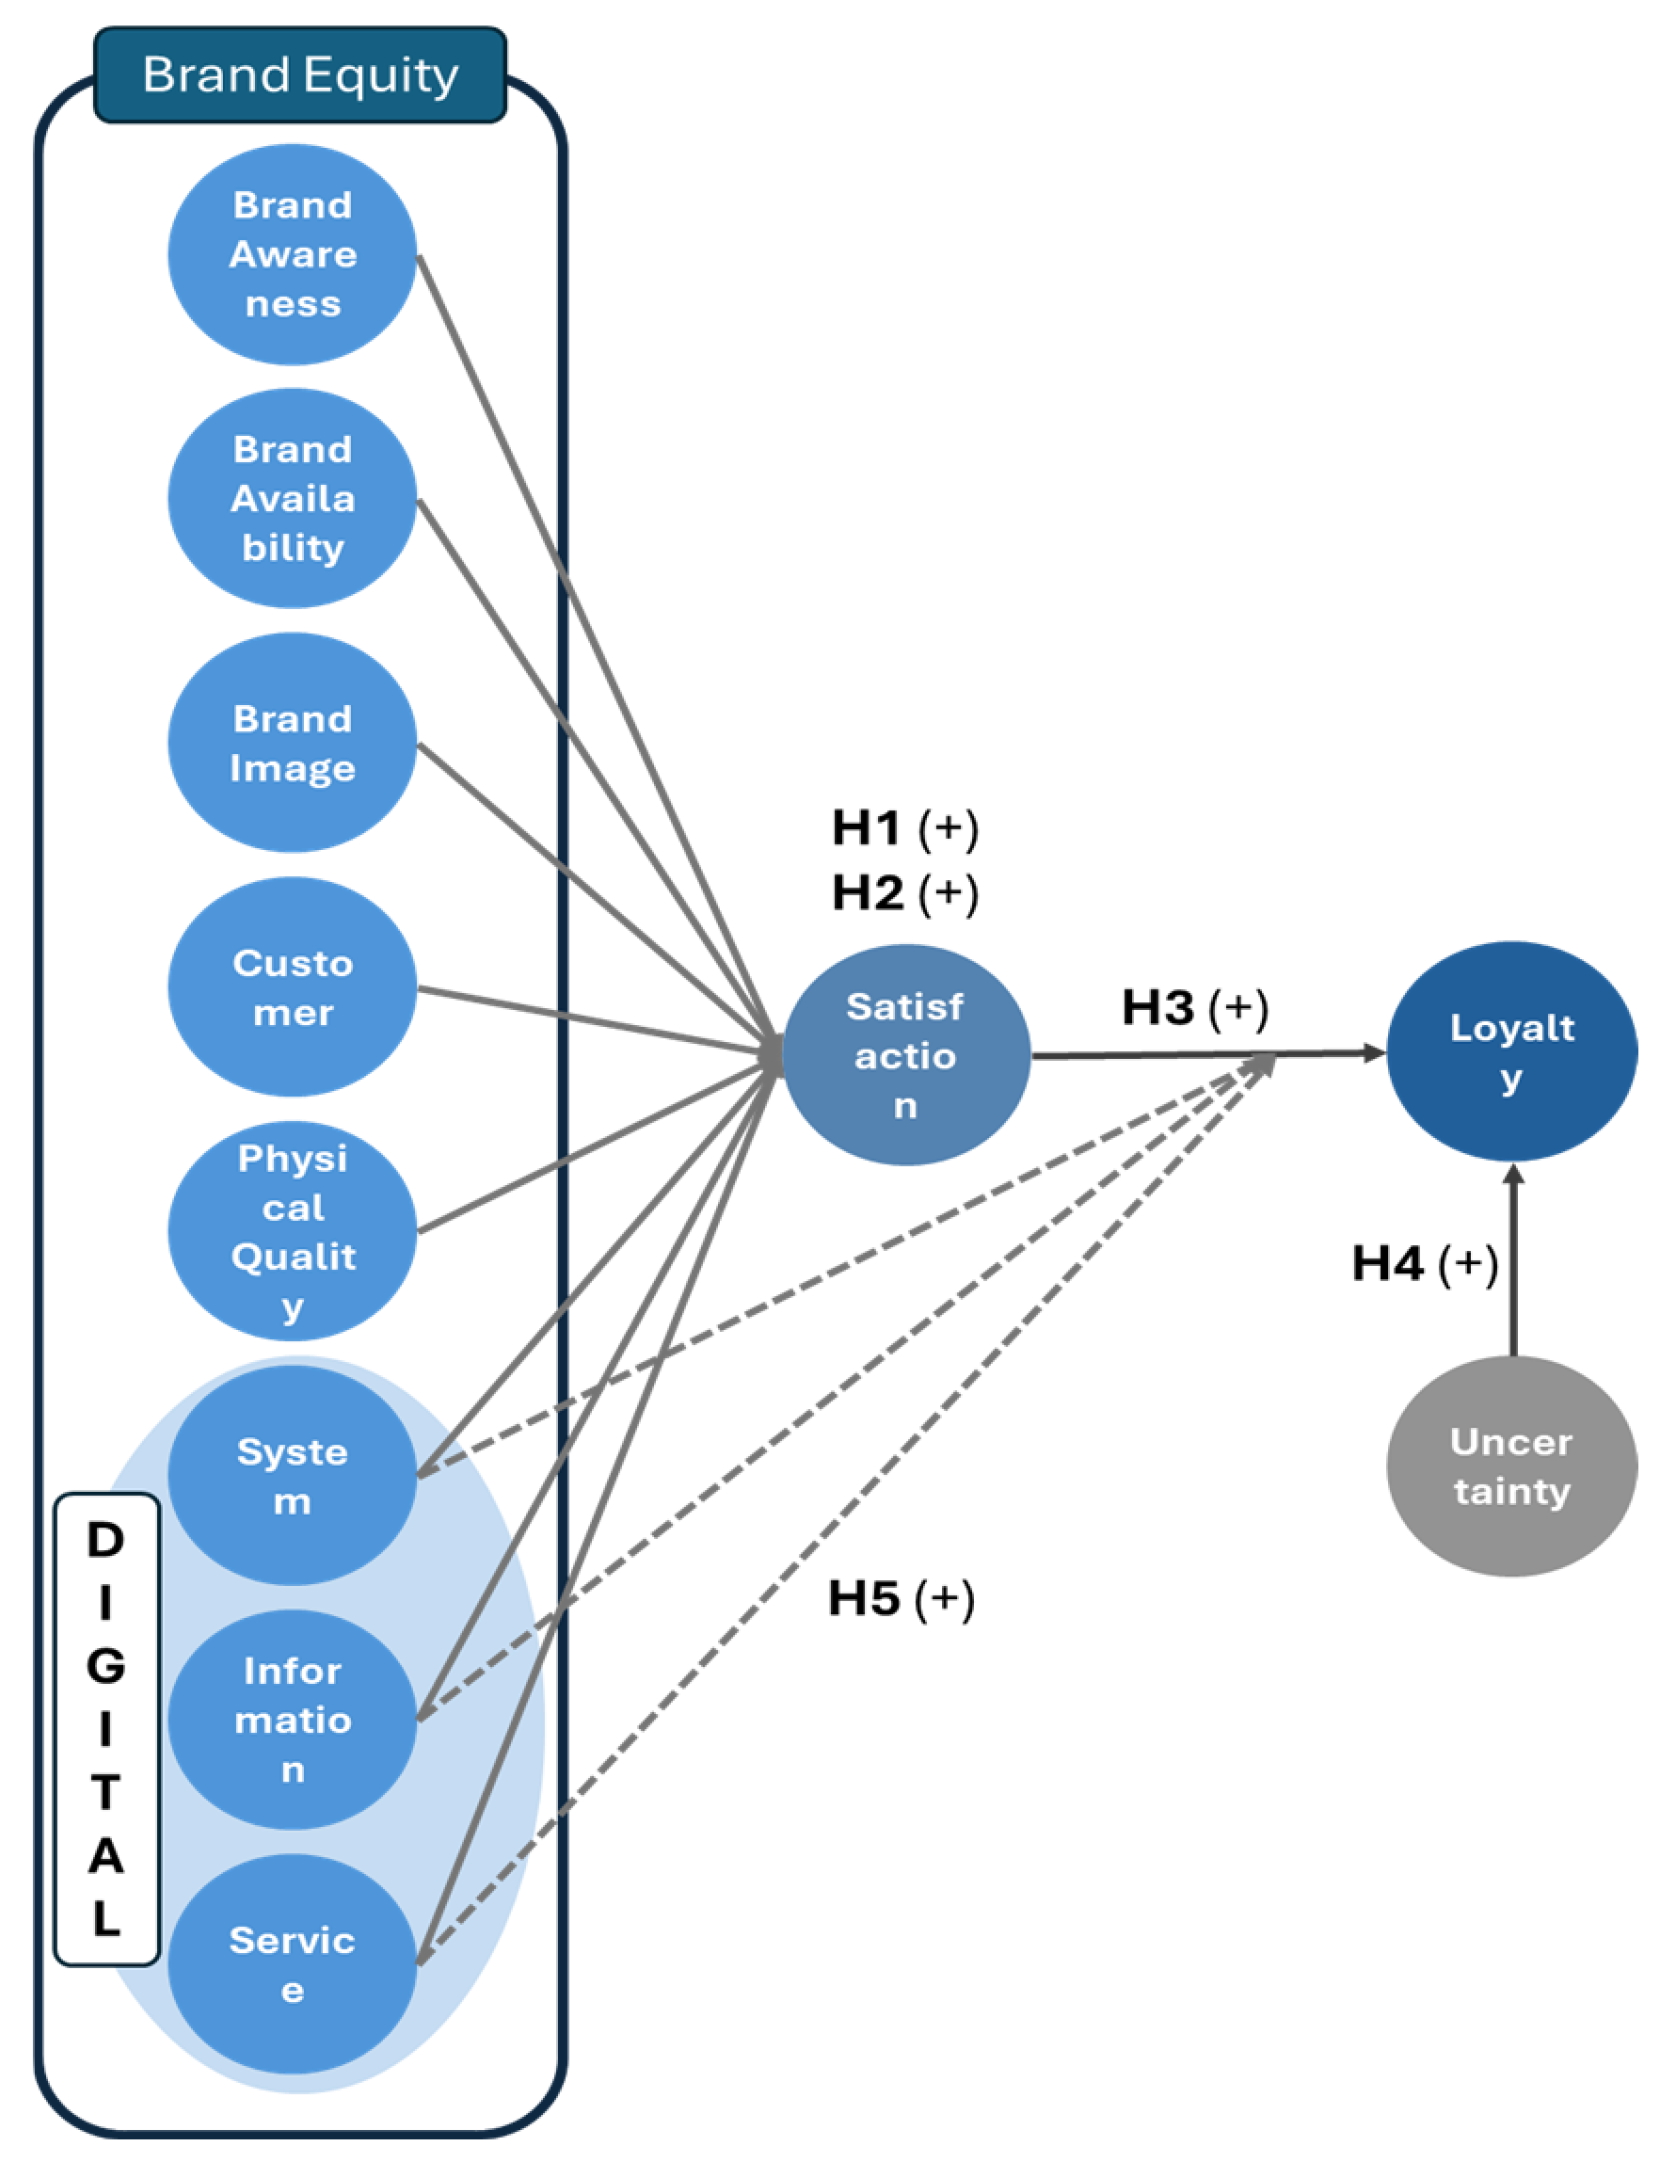
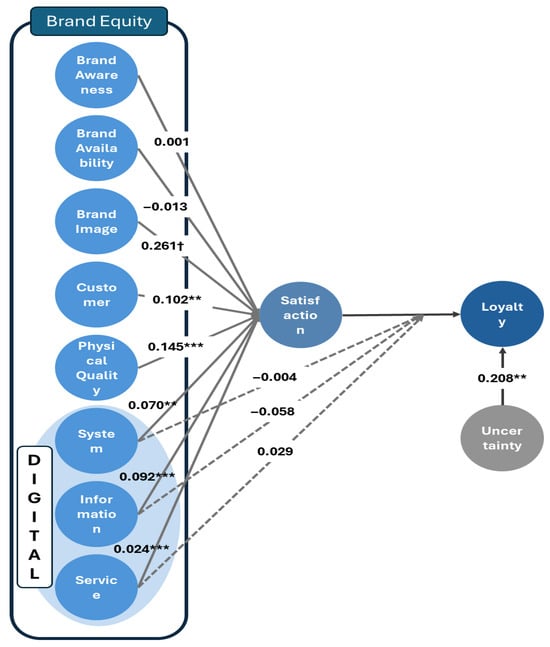
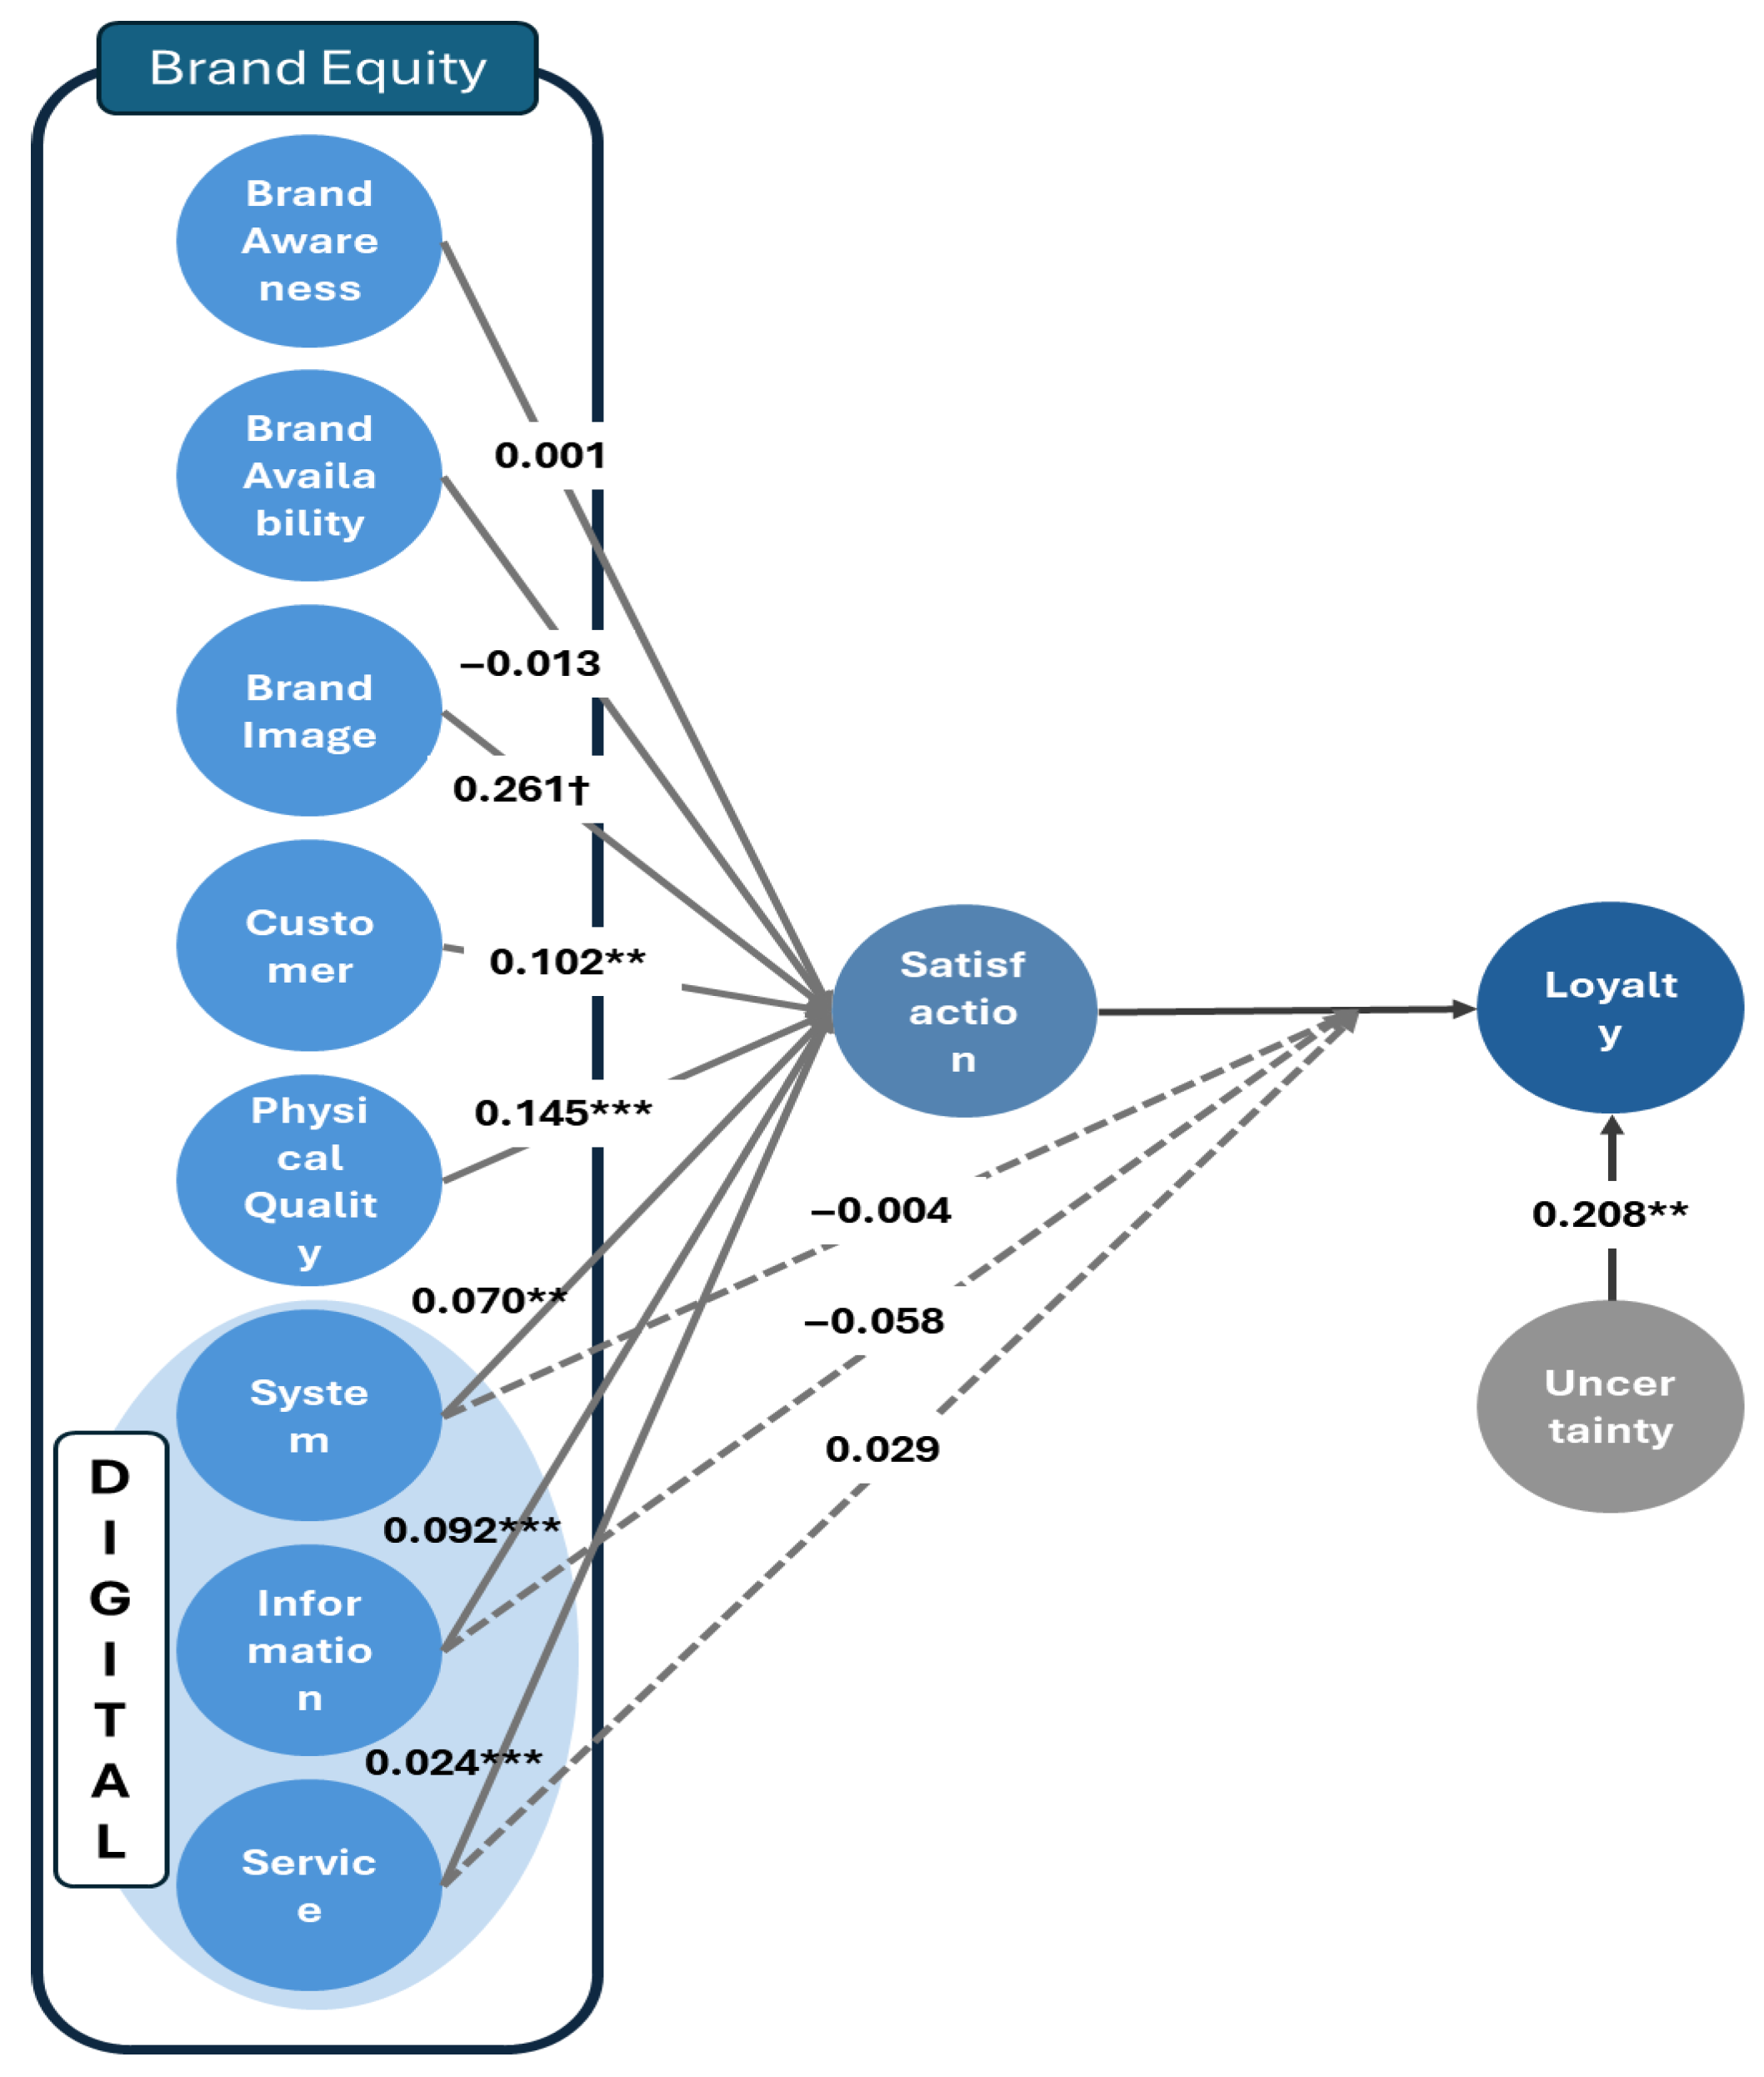

Disclaimer/Publisher’s Note: The statements, opinions and data contained in all publications are solely those of the individual author(s) and contributor(s) and not of MDPI and/or the editor(s). MDPI and/or the editor(s) disclaim responsibility for any injury to people or property resulting from any ideas, methods, instructions or products referred to in the content. |
© 2026 by the authors. Licensee MDPI, Basel, Switzerland. This article is an open access article distributed under the terms and conditions of the Creative Commons Attribution (CC BY) license.