


Abstract
Human Capital Agility is increasingly recognized as a critical capability for achieving sustainable project success in the highly dynamic construction sector, yet an original and empirically testable Human Capital Agility model rooted in Human Capital theory is still lacking. This study aims to develop and validate a Human Capital Agility framework that integrates Leadership Agility and Knowledge Management and to construct a hierarchical roadmap for the gradual development of Human Capital Agility. Using a multi-method design, survey data from 141 construction professionals were analyzed with Partial Least Squares Structural Equation Modeling to test the structural relationships among Knowledge Management, Leadership Agility, Human Capital Agility, Sustainable Project Success, and the moderating role of Firm Size, while expert judgments from nine practitioners were modeled using Modified Total Interpretive Structural Modeling to derive the internal hierarchy of Human Capital Agility components. The results show that Leadership Agility is a dominant driver of Human Capital Agility and that Human Capital Agility significantly enhances Sustainable Project Success, whereas the direct effect of tacit knowledge on Leadership Agility is not supported. The hierarchical model maps nine key components of Human Capital Agility into six levels, separating foundational drivers such as attitudes and predisposition from higher-level outcome capabilities such as generative behavior, responsiveness, adaptability, and resilience. These findings provide an integrated and empirically grounded Human Capital Agility model that offers both a causal explanation and a practical roadmap for strengthening human capital capabilities in construction projects.
1. Introduction
Indonesia continues to demonstrate solid economic growth despite global uncertainty. The OECD’s September 2024 report projected Indonesia’s real Gross Domestic Product (GDP) growth at 5.1% in 2024 and is expected to rise to 5.2% in 2025, exceeding the global average and that of G20 countries [1]. The construction sector plays a strategic role as the backbone of national infrastructure and economic development, contributing 9.63% to national GDP and economic growth of 0.67% in the second quarter of 2024 [2], and is considered as the ‘life of national development’ which requires high agility and adaptation [3,4].
Despite its significant contribution, the sector faces serious challenges such as project cost overruns and significant delays in completion [5,6], as well as the high number of work accidents which require improvements in safety governance and management [7]. These issues stem from external and internal factors, including the volatile and complex business environment (VUCA) and the adoption of the Construction 4.0 paradigm with digitalization and automation, which adds a new layer of complexity [8,9,10,11,12].
A paradigm shift is also occurring in measuring project success, which must now accommodate stakeholder needs and sustainability issues beyond the traditional iron triangle model [13,14,15,16]. In addition, internal aspects such as weak project governance and leadership are the main challenges for the construction sector [17,18], where the need for adaptive leadership capable of navigating technological change and organizational dynamics is increasingly pressing [19,20].
In this context, the concept of Leadership Agility, which is rooted in the effective management of knowledge—especially the management of tacit, implicit, and explicit knowledge—becomes very important to support collective learning and team adaptation [21,22,23,24]. The approach to developing adaptive capabilities with all human capital that is dynamically integrated encourages the need for the terminology Human Capital Agility as a collective responsive ability in facing change [25,26].
This paper is a direct continuation of our previous study [25], which identified and empirically validated the key components of Human Capital Agility, Leadership Agility, and Sustainable Project Success. Using those validated components as its foundation, the present study extends the work by integrating Knowledge Management, with particular attention to the distinct characteristics and roles of Tacit, Implicit, and Explicit Knowledge, and by including Firm Size as a moderating variable in the structural model. Within this extended framework, the study examines the effects of these constructs on Sustainable Project Success and develops a hierarchical Human Capital Agility model that provides a practical roadmap for the gradual development of collective human capital capabilities.
In line with these foundations, this paper has two specific aims. First, it empirically tests a structural model that links Knowledge Management, Leadership Agility, Human Capital Agility, and Sustainable Project Success, while also examining the moderating role of Firm Size. Second, it develops an internal hierarchical model of the elements that constitute Human Capital Agility to provide a step-by-step roadmap for its development. Together, these aims are intended to establish a clearer, theoretically grounded, and robust basis for the Human Capital Agility construct and its role in driving sustainable project success.
In this paper, two main research questions are raised to answer these needs, namely:
- RQ1: What is the structural relationship model between Knowledge Management, Leadership Agility, Human Capital Agility, and Sustainable Project Success, and does company size significantly moderate the model?
- RQ2: How can the internal hierarchical relationship model between the components of Human Capital Agility provide guidance for its gradual development?
Through the methodological approach of Partial Least Squares Structural Equation Modeling (PLS-SEM) and Modified Total Interpretive Structural Modeling (m-TISM), this study attempts to test the causal relationship between related variables and to construct a valid and applicable hierarchical structure of Human Capital Agility capabilities in the context of the construction sector.
This study proposes an original and integrated conceptual model of Human Capital Agility that combines Leadership Agility and Knowledge Management within the highly disrupted construction sector. The model is grounded in Human Capital theory and is designed to clarify how Human Capital Agility functions as a collective capability, rather than merely as an extension of Human Resource Management practices. In doing so, the study provides a detailed view of the internal hierarchical structure of Human Capital Agility components and explains how these components can be developed progressively to strengthen adaptive capacity at the project and organizational levels. Consequently, the main contribution of this research is to offer a new and theoretically robust framework that can guide the design, implementation, and evaluation of Human Capital Agility initiatives in construction project management.
2. Theoretical Background
A theoretical review of Human capital agility, Leadership agility, Project management, Project success in the Indonesian construction sector.
2.1. Sustainable Project Success
Based on the research results of Sumadireja et al. [25], the Project Success variable in the context of Indonesian construction projects is defined holistically beyond the traditional dimensions of the iron triangle (time, cost, quality) by incorporating aspects of sustainability, safety, and stakeholder satisfaction. This study identifies and validates the main components of Project Success that have a significant contribution to project success, namely: Time, Cost, Quality, Sustainability, Stakeholder satisfaction, Safety, Defects, Profitability, Customer satisfaction, Workplace organization, Health, Environmental performance, Participant satisfaction, and Customer expectations.
2.2. Leadership Agility
Based on the research results of Sumadireja et al. [25], the Leadership Agility variable in the context of Indonesian construction projects is defined through 22 main components that have been validated, namely: Critical thinker, Emotional intelligence, Managing anxiety/Anxiety-managing, Adaptable, Contextual intelligence, Resilient, Innovative, Fast/Speedy, Flexible, Sensitive, Creative, Feeling/Sensing, Adoption/Adoptive, Responsive, Effective in recognizing problems, Decisive, Collaborative, Change effectively, Active learner, Being a role model, Having a future-oriented mindset and Anticipate change. These components show that Leadership Agility is a comprehensive skill that combines cognitive, emotional, and situational aspects in managing dynamics and complexity.
Overall, these components portray Leadership Agility as an integrated, leader-focused capability that equips project leaders to sense and interpret change, make and coordinate timely decisions, and foster learning within the team, thereby providing the directional and behavioral impetus for Human Capital Agility to develop and manifest at the collective project-team level.
2.3. Human Capital Agility
Based on the research results of Sumadireja et al. [25], The components that form the Human Capital Agility variable in the context of Indonesian construction projects are defined through 13 main components of Human Capital that have been validated, namely: Talent, Education, Experience, Knowledge, Skills, Attitudes, Creativity, Leadership, Job tenure, Age, Informal on-the-job training, Predisposition, and Health. In addition to the Human Capital component, the Agility concept itself is formed by seven main capabilities that enable a fast and effective response to change, namely: Adaptability, Flexibility, Responsiveness, Proactive/Proactivity, Resilience, Generative, and Effectiveness. All these components reflect unique capabilities in managing human capital dynamically and adaptively to face change and ambiguity in the modern construction sector.
All these components together describe Human Capital Agility as a collective capability of the project team, capturing how project members as a group display adaptability, responsiveness, resilience, and generative behavior when facing change at the human-capital level. While Leadership Agility refers to how agile the project leader is in sensing change and directing the team, Human Capital Agility indicates how agile the project team itself is in carrying out and maintaining those adaptive responses in daily project work.
2.4. Knowledge Management
Knowledge Management is conceptually defined as a systematic process to ensure that relevant information is accessible to the right individuals at the right time [27]. In the context of a dynamic business environment, knowledge distribution is no longer sufficient if viewed as a transactional activity, but rather needs to be inherently integrated into the organization’s operational practices [27]. Conceptually, knowledge can be classified into two main types: explicit (tangible) and tacit (intangible) [28]. A deep understanding of this knowledge typology, along with its intermediate manifestations such as implicit knowledge, provides a theoretical basis for formulating an effective knowledge management strategy.
2.4.1. Tacit Knowledge
Tacit knowledge is highly personal, intuitive, and difficult to formalize or disseminate explicitly. This knowledge is deeply embedded in an individual’s actions, experiences, value systems, and emotions, making it difficult to express in words. Polanyi’s [29] view asserts that individuals often know more than they can formally articulate, so tacit knowledge is largely learned through reflection and learning from everyday experiences in the field. The strategic capabilities of tacit knowledge distinguish individuals within an organization because of its exclusive nature and its inability to be easily accessed or replicated by others. Various studies indicate that tacit knowledge has the following characteristics: The difficult-to-replicate nature of tacit knowledge makes it an essential resource and strategic capability for organizations [30].
Tacit knowledge is a type of knowledge that is difficult to access, difficult to articulate, hard to share, stored closely within the individual, based on individual personal experiences, skills, understanding, outlook, intuition personality that is uniquely shaped by cultural context and personal identity [31,32,33]. These characteristics emphasize that tacit knowledge is inherent and develops from a person’s experience, skills, expertise, understanding, intuition, insight, and cultural dimensions and personal identity. In project leadership, tacit knowledge shapes a leader’s ability to make superior and intuitive decisions, particularly in complex and ambiguous situations when formal frameworks or explicit data are insufficient.
2.4.2. Explicit Knowledge
Explicit knowledge, as the antithesis of tacit knowledge, refers to knowledge that is easy to document, codify, and share with others, such as in the form of working documents, data, or written materials [34]. Explicit knowledge is a type of knowledge that has been fully codified and articulated in formal form such as data, documents and procedures, so it can be easily shared, accessible, and transferred between individuals and organizations without losing its original meaning [31,32,33]. Within organizations, explicit knowledge serves as the primary foundation for operational standardization, training, and formal instruction. Leaders use explicit knowledge to communicate information and maintain consistency and efficiency in team management. While crucial for smooth operations, leaders who rely solely on explicit knowledge can experience limitations in adaptability and innovation. Therefore, an effective knowledge management strategy focuses not only on documenting knowledge but also on internalizing explicit knowledge into tacit knowledge through hands-on practice and experiential learning [28].
2.4.3. Implicit Knowledge
Implicit knowledge is positioned as a form of transitional knowledge that lies between the spectrum of tacit and explicit knowledge [23,35]. This knowledge is the result of tacit knowledge that has been successfully excavated, explored, and codified through a systematic process, but has not yet been fully formalized or documented [23]. The main characteristics/features of implicit knowledge include: transitional knowledge that bridges tacit and explicit, comes from tacit knowledge that has been successfully explored and codified through a systematic process, knowledge that is still stored in the individual’s mind, has not been utilized effectively by the organization, still has limitations in its distribution and knowledge that is still spread across various departments [23,30]
A leader’s ability to identify and transform implicit knowledge into explicit knowledge assets—using relevant techniques, tools, or methodologies—will have a significant impact on strengthening the structure and effectiveness of an organization’s management processes. Thus, implicit knowledge acts as a crucial bridge between subjective personal knowledge and structured formal knowledge, while enriching the organization’s learning process. In line with the knowledge-conversion perspective, this study assumes that explicit knowledge is progressively internalized and personalized as implicit knowledge, which then evolves into deeper tacit knowledge through hands-on practice and experiential learning [28]. This view underpins the directional relationships specified in the model, where Explicit Knowledge influences Implicit Knowledge, and Implicit Knowledge subsequently strengthens Tacit Knowledge.
2.5. Firm Size
Company Size (Firm Size), generally measured by the number of employees [36], is an important proxy that represents various organizational attributes [37]. Larger scale companies tend to be more established, have more complex and bureaucratic organizational structures [37], and supported by greater resources [38]. These fundamental differences cause the challenges faced and the way companies interact with their business environment to vary greatly depending on their size [37,38]. The existence of these varying influences indicates the important role of company size as a contextual factor. Therefore, many studies place company size as a significant moderating variable [38]. Specifically, company size has been shown to have a moderating effect on company performance [39,40] and on Human Capital [41,42]. Studies also show that larger companies tend to have more developed Human Capital factors [42]. Although its role as a moderator is quite clear, it should be noted that research findings regarding the direct relationship between company size and its performance still show mixed results [40].
2.6. Development of Hypotheses and Conceptual Research Models
This section aims to formulate the research hypotheses to be tested. The development of each hypothesis is based on a review of relevant literature and theoretical arguments linking the constructs in the research conceptual model.
2.6.1. Leadership Agility as a Driver of Human Capital Agility and Sustainable Project Success
In the dynamic construction industry, project success heavily depends on the team’s ability to adapt. Leadership plays a central role in this. An agile leader can effectively direct a team, facilitate rapid decision making, and navigate the inevitable changes in a project. Leadership is a direct predictor of project goal achievement [43]. A leader’s influence extends beyond strategic decisions to how they shape and develop their team’s capabilities. Leadership agility creates a work environment that allows HCA to grow and thrive. Agile leaders encourage autonomy, facilitate learning, and empower team members, all of which are essential for enhancing individual and collective agility. Thus, leadership agility serves as a key antecedent or trigger for the development of HCA [44]. Based on these arguments, the following hypothesis is formulated:
H1:
Leadership Agility has a positive effect on Sustainable Project Success.
H2:
Leadership Agility has a positive effect on Human Capital Agility.
2.6.2. Human Capital Agility as a Driver of Sustainable Project Success
Human Capital Agility (HCA), defined as an individual’s capacity to be responsive, adaptive, and generative, is a strategic asset in facing project challenges. Teams composed of agile individuals are better able to solve problems, innovate, and contribute effectively to the successful completion of projects. Thus, HCA is seen as a direct driver of project success [17].
H3:
Human Capital Agility has a positive effect on Sustainable Project Success.
2.6.3. Knowledge Management as an Antecedent of Leadership Agility
An agile leader must be able to make the right decisions amid uncertainty, which requires a solid knowledge base. Knowledge management is the foundation for developing leadership agility [21]. This research model describes knowledge management into three theoretical dimensions: Explicit Knowledge, Implicit Knowledge and Tacit Knowledge [23,28]:
- Explicit Knowledge: Formal, codified, and easily shared knowledge (e.g., procedures, manuals, and reports). Mastery of this knowledge provides a structured basis for leaders to make data- and fact-based decisions, which are essential for effective leadership.
- Implicit Knowledge: Knowledge derived from personal experience that has been personalized and can be articulated. A leader’s ability to leverage their experiences and implicit insights enables more nuanced and contextual responses, which is the essence of agility.
- Tacit Knowledge: Knowledge that is intuitive, deep, and difficult to express in words, often referred to as “intuition” or “gut feeling.” In highly complex and ambiguous situations, a leader’s ability to rely on tacit knowledge can be a differentiator. Therefore, theoretically, tacit knowledge is crucial to shaping Leadership Agility.
Based on the theoretical role of each type of knowledge in decision making, the following hypothesis is proposed:
H4:
Explicit Knowledge has a positive effect on Leadership Agility.
H5:
Implicit Knowledge has a positive effect on Leadership Agility.
H6:
Tacit Knowledge has a positive effect on Leadership Agility.
This model also adopts the knowledge conversion process from the SECI framework, where knowledge can be transformed from one form to another. Explicit knowledge can be internalized into implicit knowledge [22], which can then be socialized and developed into tacit knowledge through shared experiences [28].
H7:
Explicit Knowledge has a positive effect on Implicit Knowledge.
H8:
Implicit Knowledge has a positive effect on Tacit Knowledge.
2.6.4. The Moderating Role of Firm Size
The impact of organizational capabilities can vary depending on the context, including company size. Organizational theory suggests that larger companies tend to have higher bureaucracy and complexity, which can hinder agility and speed of execution. Conversely, smaller companies are often more flexible, allowing the impact of HCA to be felt more directly on project performance. The literature has shown that company size can moderate the effectiveness of various organizational capabilities [39,40,41]. Therefore, it is hypothesized that the benefits of having agile human resources will be maximized in smaller organizations.
H9:
Company size negatively moderates the relationship between Human Capital Agility and Sustainable Project Success.
2.6.5. Conceptual Research Model
Based on the series of theoretical arguments and hypothesis development outlined previously, this section presents a comprehensive conceptual model of the study. This model integrates several key constructs: Sustainable Project Success, Leadership Agility, Human Capital Agility, Knowledge Management, and Firm Size, to explain their influence on project success in the context of the construction industry. The conceptual model of the research can be seen in the illustration in Figure 1.
Figure 1.
Conceptual Research Model.
This model is rooted in the premise that project success is directly influenced by Leadership Agility (H1) and Human Capital capabilities, embodied in Human Capital Agility (H3). Furthermore, this model positions Leadership Agility not only as a direct driver of success but also as a crucial antecedent that shapes and develops Human Capital Agility (H2).
As the foundation of a leader’s ability to act agilely, this model proposes Knowledge Management as the primary antecedent variable. Specifically, knowledge management is broken down into three theoretical dimensions: Explicit Knowledge (H4), Implicit Knowledge (H5), and Tacit Knowledge (H6), each of which is hypothesized to have a positive effect on Leadership Agility. Furthermore, this model also depicts the internal knowledge conversion pathway, where Explicit Knowledge influences Implicit Knowledge (H7), and Implicit Knowledge, in turn, influences Tacit Knowledge (H8).
Finally, to account for organizational contextual factors, this model incorporates Firm Size as a moderating variable. Firm Size is hypothesized to negatively moderate the relationship between Human Capital Agility and Sustainable Project Success (H9), implying that the positive impact of Human Capital Agility will be more pronounced in smaller, more flexible firms. The figure below visualizes the overall causal relationships and hypotheses proposed in the conceptual framework. This comprehensive model will be empirically tested using quantitative data analysis through the Partial Least Squares Structural Equation Modeling (PLS-SEM) approach to validate each formulated hypothesis.
3. Research Methodology
This research method is divided into two main stages. Section 3.1 describes the method for answering RQ1., namely testing the causal relationship model between constructs using PLS-SEM, where the validation results of the Human Capital Agility components from this stage will form the basis for the next stage. Section 3.2 discusses the method for answering RQ2., namely the development of a hierarchical model of HCA components using the m-TISM approach, including the expert panel selection process and MICMAC analysis.
3.1. Method for Addressing RQ1: Structural Model Testing for Causal Relationships Using PLS-SEM
This phase aims to answer the first research question (RQ1), namely, to test the hypothesized causal relationship model between Knowledge Management (as an antecedent), Leadership Agility (LA), Human Capital Agility (HCA), and Sustainable Project Success (SPS), as well as the moderating role of Firm Size. This study uses a cross-sectional survey and is analyzed using Partial Least Squares Structural Equation Modeling (PLS-SEM).
3.1.1. Rationalization of PLS-SEM Use
PLS-SEM was selected as the primary data analysis technique, instead of CB-SEM (Covariance-Based SEM), because it aligns better with several crucial methodological considerations in this study. It is a variance-based approach that is highly suitable for research focused on prediction and theory development (exploratory research), particularly when the research model is relatively complex and has not yet been thoroughly tested in a specific context, such as HCA and LA in the Indonesian construction sector. In addition, PLS-SEM is robust to data that may deviate from normality and can accommodate models with many constructs and indicators without imposing overly strict sample size requirements. It is also well suited for examining the effects of moderating variables, such as Firm Size, on relationships between latent variables.
3.1.2. Instrument Design, Population, and Sample
This stage explains how quantitative data is collected for model testing.
- Questionnaire Development: The questionnaire used in this study was constructed from 49 key element items that had previously been validated using the Fuzzy Delphi Method (FDM) in Phase 1, as reported in our earlier paper [25]. Each item was measured on a 7-point Likert scale (ranging from “highly disagree” to “highly agree”) to enhance response sensitivity.
- Population and Sample:
- Population: Professionals involved in project management in the construction sector in Indonesia.
- Sample: Sampling was conducted using purposive sampling techniques to ensure that respondents are individuals with relevant experience and knowledge.
- Sample Size: A total of 141 valid data samples (including the initial 72 items) were obtained after the data cleaning process, which was deemed adequate based on the rules of thumb for PLS-SEM (such as the 10-times rule or Gpower analysis). The details of the demographic data of the 141 respondents can be seen in Table 1.Table 1. Demographic information.
3.1.3. PLS-SEM Data Analysis Technique
Data analysis was performed using SmartPLS software version 4.1.1.2 and involved two main stages:
- Measurement Model Analysis (Outer Model)
Objective this stage is to test the validity and reliability of each latent construct:
- Indicator Reliability (Outer Loading): The main criterion for indicator reliability is the loading value, which is usually expected to be at least 0.7. However, because this research is exploratory, a loading value between 0.4 and 0.7 is still acceptable as long as the construct reliability and the Average Variance Extracted (AVE) as a whole meet decent standards, according to Hair and Alamer [45]. Therefore, indicators with loading values below 0.40 were eliminated. In this study, 23 indicators were eliminated to improve model quality.
- Construct Reliability: Measured through Composite Reliability (CR) and Cronbach’s Alpha (CA). The CR value must be ≥0.70 and CA must be ≥0.60 for new construction.
- Convergent Validity: Measured through Average Variance Extracted (AVE). A construct is considered valid if the AVE value is ≥0.50, meaning the variance explained by the construct is greater than the error variance.
- Structural Model Analysis (Inner Model)
Once the measurement model is validated, this stage tests the causal relationships and research hypotheses:
- Hypothesis Testing: Conducted using bootstrapping technique with 5000 samples. The hypothesis is accepted if the p-value ≤ 0.05 or the t-statistic value ≥ 1.96.
- Path Coefficient (β): Indicates the strength and direction of the causal relationship.
Model Predictive Power: Assessed through the coefficient of determination (R2) to explain the variance of endogenous variables and Q-square (Q2) through the Blindfolding procedure, where the Q2 value > 0 indicates adequate predictive relevance of the model.
3.2. Method for Addressing RQ2: Hierarchical Model Construction Using Modified Total Interpretive Structural Modeling (m-TISM)
This study aims to answer the second research question (RQ2), namely developing a model of internal hierarchical relationships between the components of Human Capital Agility (HCA). This objective was achieved using the Modified Total Interpretive Structural Modeling (m-TISM) methodology, complemented by Matrice d’Impacts Croisés Multiplication Appliquée à un Classement (MICMAC) analysis.
3.2.1. Rationalization of Using m-TISM
The m-TISM methodology was chosen because of its advantages in analyzing complex systems.
- Interpretation of Complex Relationships: m-TISM can describe the complex interactions and intricate relationships between components, clearly distinguishing between driving and dependent components. This provides a deep understanding of which components should be prioritized in an HCA development strategy.
- Methodological Efficiency: m-TISM is an improvement of TISM, whose main innovation is to perform transitivity checks simultaneously with pairwise comparisons, thus significantly reducing the number of comparisons required by the expert panel without sacrificing logical consistency.
3.2.2. m-TISM Implementation Procedures
The implementation of m-TISM involved designing a specific instrument aimed at a panel of experts in the construction sector to obtain interpretive data. The procedure involved seven main steps that were sequential and iterative:
- Formation of Expert/Practitioner Panel: A panel of nine construction practitioners with diverse education, experience, and job positions was established to ensure the validity and breadth of perspectives.
- Pairwise Comparison (SSIM): Experts assessed the relationships between each pair of HCA components that had passed the FDM, using a verbal scale V (i affects j), A (j affects i), X (mutual influence), and O (no relationship) to construct the Structural Self-Interaction Matrix (SSIM).
- Convergence and Direct Reachability Matrix (DRM): Individual SSIMs were aggregated into a final consensus SSIM (based on the most frequently selected option), which was then converted into a binary Direct Reachability Matrix (DRM) with values 0 and 1.
- Final Reachability Matrix (FRM) and Transitivity: The DRM was checked for transitivity (if A → B and B → C, then A → C), producing a Final Reachability Matrix (FRM) that captures both direct and implied relationships among components.
- Successive Comparison: The FRM was used to examine successive causal chains, where entries of “1” indicate unidirectional causal links, revealing the pattern of influence and dependence among HCA components.
- Hierarchical Level Partition: Based on each component’s Reachability Set and Intersection Set derived from the FRM, components were iteratively assigned to hierarchical levels until all HCA elements were positioned.
- Hierarchical Digraph Model (m-TISM): Finally, a hierarchical digraph was constructed that places key driving components at the lower levels and the most dependent components at the upper levels, with arrows indicating the direction of confirmed causal influence after removing insignificant or purely reciprocal links.
3.2.3. MICMAC Analysis
MICMAC (Matrice d’Impacts Croisés Multiplication Appliquée à un Classement) analysis was used to complement the m-TISM findings by analyzing the properties of each HCA component based on two main metrics:
- Driving Power: Measured by the total influence that the component has on other components in the system (the number of ‘1’s in the FRM row).
- Dependence Power: Measured by the total influence that the component receives from other components in the system (the number of ‘1’s in the FRM column).
Mapping results of these two metrics will classify HCA components into four strategic quadrants: Driving Components, Dependent Components, Linkage Components, and Autonomous Components. This classification is crucial for providing strategic guidance on which components are the foundation to build first
4. Results and Discussion
4.1. Results of SEM Analysis (RQ2)
4.1.1. Construct Validity of Measurements
The results of the cross-loading tests (Table 2) consistently confirm that the model has adequate discriminant validity. The basic principle is that each indicator shows the highest loading on the construct it is intended to measure, compared with its loadings on other latent variables, which indicates that each construct represents a unique and distinct concept. Overall, these cross-loading results provide strong empirical evidence that all latent variables in the model are measured by distinct sets of indicators and satisfy the requirements of discriminant validity.
Table 2.
Loadings and cross-loadings of items.
4.1.2. Analysis of the Measurement Model (Outer Model)
Measurement model analysis (Outer Model) is an essential step in PLS-SEM to verify the reliability and convergent validity of the indicators used to measure each latent construct. This evaluation is a mandatory prerequisite before testing the structural relationships. As shown in Table 3, all multi-item constructs meet the recommended thresholds for Composite Reliability (CR ≥ 0.70) and Average Variance Extracted (AVE ≥ 0.50), indicating satisfactory internal consistency and convergent validity for Human Capital Agility, Leadership Agility, Sustainable Project Success, Tacit Knowledge, Implicit Knowledge, and Explicit Knowledge. Although a few indicators have loadings between 0.40 and 0.70, they are retained because the overall CR and AVE values remain within acceptable limits for exploratory research, and Firm Size is treated as a single-indicator manifest variable for which CR and AVE are not required.
Table 3.
Scales for reliability and convergent validity of the model.
4.1.3. Discriminant Validity
Discriminant validity was assessed using both the Fornell–Larcker criterion and the Heterotrait–Monotrait Ratio (HTMT) to ensure that each latent construct is conceptually and empirically distinct from the others. According to the Fornell–Larcker criterion, validity is supported when the square root of the Average Variance Extracted (AVE), shown in bold on the diagonal, is higher than the correlations between that construct and all other constructs. As reported in Table 4, this condition is satisfied for all construct pairs except the combination of Human Capital Agility (HCA) and Leadership Agility (LA), whose correlation (0.799) slightly exceeds the square roots of their AVEs (0.707 and 0.708).
Table 4.
Discriminant Validity.
To further address this concern, discriminant validity was additionally evaluated using the Heterotrait–Monotrait Ratio (HTMT). The HTMT value for the pair Human Capital Agility (HCA) and Leadership Agility (LA) is 0.888, which remains below the recommended threshold of 0.90 [46]. This result indicates that, despite the strong empirical association and potential conceptual proximity between HCA and LA, discriminant validity is still statistically supported, and both constructs can therefore be retained as empirically distinct entities in the model.
4.1.4. Analysis of the Structural Model (Inner Model)
Structural model analysis using SmartPLS 4.1.1.2 produced a model with clear causal relationships between variables (see Figure 2). These results empirically confirmed the research hypothesis by demonstrating the direction, strength, and significance of the relationships between variables. The statistical significance of the path coefficients was confirmed through bootstrapping tests (see Figure 3).
Figure 2.
Path coefficients’ results. Source: Analysis results using SmartPLS4.1.1.2 software.
Figure 3.
Path coefficients’ T-values. Source: Analysis results using SmartPLS4.1.1.2 software.
- The Power and Significance of Agility Relationships
- Leadership Agility (LA) to Human Capital Agility (HCA): This relationship is proven to be very strong with the highest path coefficient in all models (β = 0.799) and highly significant (p = 0.000). This provides strong evidence that LA is the most dominant predictor in forming HCA.
- Influence on Sustainable Project Success (SPS): Both Agility variables have a significant positive influence on SPS.
- ○
- LA to SPS: Coefficientβ = 0.356, Significant (p = 0.001).
- ○
- HCA to SPS: Coefficientβ = 0.346, Significant (p = 0.003).
- Knowledge Management (KM) Path
Knowledge management shows a significant relationship path to Agility:
- Explicit Knowledge (EK) to Implicit Knowledge (IK): The relationship is very significant (β = 0.571, p = 0.000).
- Implicit Knowledge (IK) to Tacit Knowledge (TK): Very significant relationship (β = 0.409, p = 0.000).
- EK to LA: Significant relationship (β = 0.257, p = 0.003).
- IK to LA: Significant relationship (β = 0.289, p = 0.002).
- Anomaly (TK to LA): The path from TK to LA shows less influence (β = 0.148) and was statistically insignificant (p = 0.097).
- Model Predictive Power (R-Squared)
- HCA: The R-squared value is 0.639. This means that 63.9% of the variation in human capital agility can be explained by the predictor variables.
- SPS: The R-squared value is 0.423. This indicates that 42.3% of the variation in project success can be explained by the variables in the model.
- The Moderating Effect of Firm Size
- Significant Moderation: Firm Size variable is proven to be a significant moderating variable on the relationship between HCA and SPS (p = 0.003). The negative path coefficient (β = −0.143) shows that increasing company size weakens the positive influence of HCA on Sustainable Project Success.
- Direct Effect: The direct effect of Firm Size on SPS is proven to be statistically insignificant (p = 0.860).
4.1.5. Hypothesis Testing Results
Hypothesis testing in Partial Least Squares Structural Equation Modeling (PLS-SEM) analysis is conducted using the bootstrapping method. This method produces t-values and p-values that are used to determine the statistical significance of each path coefficient between variables. Bootstrapping results are used to test the validity of the hypothesis stating a significant influence between the independent and dependent variables. Decision making is based on a predetermined significance level of α = 5% (0.05). The hypothesis will be accepted if the resulting p-value is ≤0.05 or if the t-value is ≥1.96. Conversely, the hypothesis will be rejected if the p-value is >0.05 or the t-value is <1.96.
Of the nine hypotheses proposed, eight were accepted because they had a statistically significant influence (see Table 5).
Table 5.
Hypothesis testing results of the structural model.
- H1: LA → SPS: This hypothesis is accepted (p-value = 0.001; t-value = 3.192). This indicates that Leadership Agility has a positive and significant effect on Sustainable Project Success, with a path coefficient of 0.356.
- H2: LA → HCA: This hypothesis is accepted (p-value = 0.000; t-value = 26.883). These results indicate that Leadership Agility has a strong and significant influence on Human Capital Agility, with the highest path coefficient among all hypotheses, namely 0.799.
- H3: HCA → SPS: This hypothesis is accepted (p-value = 0.003; t-value = 3.020). There is a positive and significant influence of Human Capital Agility on Sustainable Project Success, with a path coefficient of 0.346.
- H4: Explicit Knowledge → LA: This hypothesis is accepted (p-value = 0.003; t-value = 3.015). This indicates that Explicit Knowledge has a positive and significant effect on Leadership Agility, with a path coefficient of 0.257.
- H5: Implicit Knowledge → LA: This hypothesis is accepted (p-value = 0.002; t-value = 3.044). There is a positive and significant influence of Implicit Knowledge on Leadership Agility, with a path coefficient of 0.289.
- H7: Explicit Knowledge → Implicit Knowledge: This hypothesis is accepted (p-value = 0.000; t-value = 7.268). There is a strong positive and significant influence of Explicit Knowledge on Implicit Knowledge, with a path coefficient of 0.571.
- H8: Implicit Knowledge → Tacit Knowledge: This hypothesis is accepted (p-value = 0.000; t-value = 4.917). These results indicate that Implicit Knowledge has a positive and significant effect on Tacit Knowledge, with a path coefficient of 0.409.
- H9: Firm Size x Human Capital Agility → SPS: This hypothesis is accepted (p-value = 0.003; t-value = 2.967). There is a significant moderating effect of Firm Size on the relationship between Human Capital Agility and Sustainable Project Success. Interestingly, the negative path coefficient (−0.143) indicates that this moderation is negative, meaning Firm Size weakens the positive influence of Human Capital Agility on Sustainable Project Success.
And for the rejected hypothesis is: H6: Tacit Knowledge→Leadership Agility: This hypothesis is rejected (p-value = 0.097; t-value = 1.660). A p-value greater than 0.05 and a t-value smaller than 1.96 indicate that Tacit Knowledge does not have a statistically significant influence on Leadership Agility. This indicates that in the context of this study, Tacit Knowledge is not a relevant predictor of Leadership Agility.
4.2. Results of m-TISM Analysis (RQ2)
4.2.1. Step 1: Formation of Practitioners Panel
The study involved nine practitioners with diverse profiles, reflecting a broad representation of diverse backgrounds and experiences. The majority of respondents (7 out of 9) had a tertiary education (D4/S1 or S2), providing solid insights from both academic and professional perspectives (see Table 6). In terms of experience, most respondents (6 out of 9) had between 6 and 15 years of experience, while several had more than 25 years of experience, ensuring a balance between senior practitioners and those in their mid-career. This distribution was also evident across job levels, from staff to top managers, and across company sizes, from small companies with fewer than 10 employees to large companies with more than 250 employees. This diversity in education, tenure, job level, and company size was crucial to ensuring the research findings were relevant and applicable to a variety of organizational contexts.
Table 6.
Practitioners involved in m-TISM.
4.2.2. Step 2: Pairwise Comparison (SSIM)
These practitioners were asked to assess the level of interconnectedness between elements of the Human Capital Agility variable. The relationship level values were given in the form of linguistic variables, represented by values as shown in Table 7 below:
Table 7.
Verbal rating scale.
- Table 7 presents four possible relationships between two components, i and j:
- V (Component i contributes to component j): Indicates that component i is a driving or causal component that influences component j.
- A (Component j contributes to component i): Indicates that component j is a driving or causal component that influences component i.
- X (Component i contributes to component j): Indicates that there is a reciprocal relationship or mutual influence between component i and component j.
- O (Component i does not contribute to each other with component j): States that there is no significant direct or reciprocal relationship between component i and component j.
Kamble et al. [47] conducting a matrix convergence process by forming a final matrix based on the consensus of experts/practitioners, where the most frequently submitted entries (the most frequently proposed relationship types) are agreed upon as the final relationship choices. From Table 8, the results of the convergence of opinions of all practitioners in the construction sector industry in Indonesia can be explained as follows:
Table 8.
SSIM matrix of convergence results from all practitioners.
Attitudes (C1): The Attitudes component (C1) shows diverse relationships with other HCA components. Attitudes contribute directly to Generative (C9), Resilience (C8), Adaptability (C7), Responsiveness (C6), Creativity (C4), and Leadership (C2). Attitudes also have a mutually contributing relationship with Predispositions (C5), indicating that attitudes and predispositions influence each other. However, Attitudes do not contribute to each other with Skill (C3).
Leadership (C2): The Leadership component (C2) is an important contributor. Leadership contributes to Generative (C9), Resilience (C8), Adaptability (C7), Responsiveness (C6), and Creativity (C4). Furthermore, Leadership is also influenced by Predispositions (C5) and Skills (C3), indicating that effective leadership is partly shaped by pre-existing tendencies and expertise.
Skill (C3): The Skill component (C3) plays a significant role in the HCA ecosystem. Skills contribute to Leadership (C2), Generative (C9), Resilience (C8), Adaptability (C7), Responsiveness (C6), and Creativity (C4). Furthermore, Skills are influenced by Predispositions (C5), indicating that an individual’s tendencies can determine their skill development.
Creativity (C4): The Creativity component (C4) plays a strong contributory role. Creativity contributes to Generative (C9), Resilience (C8), Adaptability (C7), and Responsiveness (C6). Furthermore, Creativity is also influenced by Predispositions (C5) and Skills (C3), underscoring the importance of a strong foundation (tendencies and skills) to fuel creativity.
Predispositions (C5): The Predispositions component (C5) serves as a crucial link. Predispositions contribute to Leadership (C2), Skills (C3), Creativity (C4), Generative (C9), Resilience (C8), Adaptability (C7), and Responsiveness (C6). Furthermore, Predispositions have a mutually contributing relationship with Attitudes (C1), indicating a strong interdependence between the two.
Responsiveness (C6): The Responsiveness component (C6) plays a contribution-oriented role. Responsiveness contributes to Generative (C9) and Adaptability (C7). However, Responsiveness (C6) is influenced by Resilience (C8). This suggests that the ability to respond quickly and appropriately is a key component in building higher HCA capabilities.
Adaptability (C7): The Adaptability component (C7) is also a major contributor. Adaptability contributes to Generative (C9) and Resilience (C8). Furthermore, Adaptability is influenced by Responsiveness (C6), implying that adaptability is enhanced by the speed and accuracy of response.
Resilience (C8): The Resilience component (C8) contributes directly to Generative (C9). However, Resilience is influenced by Attitudes (C1), Leadership (C2), Skills (C3), Creativity (C4), Predispositions (C5), and Adaptability (C7).
Generative (C9): The Generative component (C9) is influenced by all other HCA components, namely Attitudes (C1), Leadership (C2), Skills (C3), Creativity (C4), Predispositions (C5), Responsiveness (C6), Adaptability (C7), and Resilience (C8). This makes Generative the final result or culmination of the integration of all HCA components.
4.2.3. Step 3: Convergence and Direct Reachability Matrix (DRM)
An essential step in the Modified Total Interpretive Structural Modeling (m-TISM) methodology is converting the Structural Self-Interaction Matrix (SSIM), which contains qualitative assessments from practitioners, into a Direct Affordability Matrix (DRM) (see Table 9). This process translates interpretation-based data (using the symbols V, A, X, and O) into a binary representation (0 or 1), which is crucial for subsequent mathematical analysis.
Table 9.
Direct Reachability Matrix (DRM).
The conversion rules applied to each pair of elements (i and j) are as follows:
- V (Component i contributes to j): If cell (i, j) in SSIM contains ‘V’, this means that the component in row i influences the component in column j. In DRM, the value of cell (i, j) is set to ‘1’ (influence exists), and cell (j, i) is set to ‘0’ (reverse influence does not exist). Example: The relationship C1 (Attitudes) to C2 (Leadership) which has a value of ‘V’ is converted to (C1, C2) = ‘1’ and (C2, C1) = ‘0’.
- A (Component j contributes to i): If cell (i, j) in SSIM contains ‘A’, this means the component in column j influences the component in row i. In DRM, cell (i, j) is set to ‘0’, and cell (j, i) is set to ‘1’. Example: The relationship C2 (Leadership) and C3 (Skill) with value ‘A’ is converted to (C2, C3) = ‘0’ and (C3, C2) = ‘1’.
- X (Mutual contribution): Indicates a reciprocal relationship. Both cells (i, j) and (j, i) are set to ‘1’. Example: The relationship between C1 (Attitudes) and C5 (Predispositions) that has a value of ‘X’ is converted to (C1, C5) = ‘1’ and (C5, C1) = ‘1’.
- O (No relationship): Indicates the absence of a significant causal relationship. Both cells (i, j) and (j, i) are set to ‘0’. Example: The relationship between C1 (Attitudes) and C3 (Skill) that has a value of ‘O’ is converted to (C1, C3) = ‘0’ and (C3, C1) = ‘0’.
In addition, each component is considered to have a relationship with itself (self-loop), so that all diagonal elements (i, i) in the DRM always have a value of ‘1’. The resulting DRM represents the direct causal relationship between the nine components of Human Capital Agility (HCA) based on the collective assessment of practitioners.
4.2.4. Step 4: Final Reachability Matrix (FRM) and Transitivity
Once the Direct Reachability Matrix (DRM) is formed, a crucial step in m-TISM is to iteratively perform transitivity checks to obtain the Final Reachability Matrix (FRM) (see Table 10). This check ensures the logical consistency and completeness of the causal relationships in the system.
Table 10.
Final reachability matrix with direct and transitive links.
- Transitivity Process
The principle of transitivity states that if component A affects component B (A→B) and component B affects component C (B → C), then implicitly and logically, component A also influences component C (A → C).
- Iteration: This process is performed by checking each pair of components in the DRM. If there is a transitive relationship that has not been recorded (for example, A → B → C exists, but A → C does not exist yet), then the value ‘0’ in the relevant cell is changed to ‘1’.
- Result: This process continues until there is no further change, resulting in a FRM. The FRM represents all causal relationships, both directly visible and implicit, and new links added are marked with an asterisk.
- Specific Example: The transitivity check found four additional links. For example, although cell (C1, C3) has a value of ‘0’ in the DRM (C1: Attitudes, C3: Skill), it is changed to ‘1*’ in the FRM because there is a transitive path through C5 (Predispositions), which is C1 → E5 → E3.
- Component Strength Analysis
FRM is the fundamental foundation for the next stage, namely the analysis of the characteristics of each HCA component based on the strength of its influence.
- Driving Power: Calculated from the total number of ‘1’s’ in a component’s row in the FRM. This value represents the total influence (direct and indirect) that the component has on other components in the system. A high Driving Power value indicates the component’s ability to influence and drive other HCA components.
- Dependence Power: Calculated from the total number of ‘1’s’ in the component column in the FRM. This value represents the degree to which the component is dependent on the influence of other components in the system. A high Dependence Power value indicates a high degree of dependence on other HCA components.
4.2.5. Step 5: Successive Comparison
After the Final Reachability Matrix (FRM) has been validated and the driving power and dependency power of each component calculated, the next step in Modified Total Interpretive Structural Modeling (m-TISM) is to develop a structural model that represents the hierarchy among Human Capital Agility (HCA) components. This process involves successive comparisons aimed at uncovering layers of influence and dependency. The results of this model are summarized visually in Figure 4.
Figure 4.
The successive comparison M-TISM model.
- Interpretation of Hierarchical Causal Relationships
This model is built based on the unidirectional relationship indicated by the value ‘1’ in the Final Reachability Matrix (FRM). Each arrow in the visual model (Figure 4) represents a structured cause-and-effect relationship verified from the matrix data.
- Principle of Unidirectional Relationship: If the matrix shows a value of ‘1’ from component i to component j, and ‘0’ from component j to component i, then this is interpreted as component i influencing component j in a unidirectional manner.
- Direction Example (C1 → C2): The matrix shows that Attitudes (C1) has a value of ‘1’ to Leadership (C2), but a value of ‘0’ from C2 to C1. This is confirmed by the directional arrow from C1 to C2 in the visual model, which means that Attitudes influence Leadership, but not vice versa.
- Causal Influence Chain: This model identifies a structured chain of influence between components:
- ○
- Skills (C3) have a unidirectional relationship with Leadership (C2), confirming that skills are an important prerequisite for effective leadership.
- ○
- Next, Leadership (C2) influences Creativity (C4).
- ○
- Creativity (C4), in turn, influences Resilience (C8).
This pattern creates a domino effect, indicating that strengthening one component at a lower level will trigger a cascade of positive effects on other components at higher levels in the HCA system. Thus, this hierarchical comparison model accurately represents the complex interdependencies between HCA components, providing a deeper understanding of how these components influence each other.
4.2.6. Step 6: Hierarchical Level Partition
The Final Reachability Matrix (FRM) data, which meets the transitivity rule, is then processed to determine the partition level of each component included in the HCA. This process is carried out tabularly, with each component going through a series of steps. First, based on the FRM data, two sets are created for each component: the Reachability Set (the set of all reachable components) and the Antecedent Set (the set of all components that can reach that component).
These two sets are then combined to form an Intersection Set, which contains the components present in both sets. At each iteration, if a component’s Intersection Set exactly matches its Reachability Set, it means the component has reached its level. The component is then assigned a level according to its iteration number and removed from the process. For example, in the first iteration, one HCA component (Generative (E9)) met this criterion, so it was assigned to level 1 and excluded from subsequent calculations. This process continues until all HCA components have been successfully assigned to their respective levels. Overall, the iteration process occurred six times, with details of the iterations shown in Table 11.
Table 11.
Partitioning the reachability matrix into different levels.
The driving components, which have the highest influence, are placed at the bottom (the level with the highest number), while the dependent components, which are the final outcome, are at the top (the level with the lowest number). This structure serves as a practical roadmap for building an HCA step-by-step (see Table 12):
Table 12.
Levels obtained by the element after partitioning of final reachability matrix.
- Foundation Level (Level VI): HCA strengthening strategies must begin at this foundational level. Level VI contains the main components: Attitudes (C1) and Predispositions (C5). These two components reflect an individual’s tendencies and attitudes, have the highest driving force, and are the foundation for the formation of the components at the higher levels.
- Cascading Influence Flow: Influence from Level VI flows cascadingly to the subsequent levels:
- ○
- Level V: Filled by Skills (C3).
- ○
- Level IV: Filled by Leadership (C2). This placement emphasizes that effective leadership must be supported by adequate technical skills (Level V).
- ○
- Level III: Filled by Creativity (C4).
- Final Result Level (Levels I and II): The most dependent components are placed at Level II and Level I, namely Responsiveness (C6), Adaptability (C7), Resilience (C8), and Generative (C9). These components are the final results of the system and demonstrate the team’s ability to quickly respond, adapt, and innovate despite project challenges.
4.2.7. Step 7: Hierarchical Digraph Model (m-TISM)
The Modified Total Interpretive Structural Modeling (m-TISM) model (Figure 5) is a visual representation of a causal structure that organizes the nine components of Human Capital Agility (HCA) into six hierarchical levels. Driving components are placed at the bottom level as the foundation, while dependent components or outcomes are at the top. Arrows in this model indicate the direction of influence, both direct (Direct Links) and indirect (Transitive Links).
Figure 5.
Hierarchical Digraph Model (m-TISM).
Hierarchical Causal Influence Flow (Level VI to Level I)
This digraph model analysis reveals complex interdependencies at each level, confirming that HCA development must start from the most basic foundations of attitudes and predispositions and then progressively build skills, leadership, creativity, and higher-level functional capabilities such as responsiveness, adaptability, resilience, and generative behavior. This hierarchical progression is visually depicted in Figure 5 (Hierarchical Digraph Model, m-TISM), which summarizes the directional influence from foundational components to higher-order outcomes in the HCA system.
4.2.8. MICMAC Analysis
After the m-TISM hierarchical model was constructed, MICMAC Analysis was applied as a validation step to gain a deeper understanding of the strategic position of each component in the Human Capital Agility (HCA) system. This analysis categorizes HCA components into four main quadrants based on the calculated Driving Power (Y-axis) and Dependence Power (X-axis) values.
The MICMAC diagram (Figure 6) provides strategic insights through the following grouping of components:
Figure 6.
MICMAC analysis.
Driving Components: These components are located in the upper left quadrant, characterized by high driving force and low dependency. They are the primary or key foundation of the system, possessing extensive influence over other components. Investment in these components will have the greatest and broadest cascading impact on the HCA system. The HCA components included in this quadrant are: Attitudes (C1), Skills (C3), Leadership (C2), Creativity (C4), and Predispositions (C5).
Dependent Components: These components are located in the lower right quadrant, characterized by low driving force and high dependency force. They function as ‘outputs’ or results of the system, heavily influenced by other components and lacking the ability to significantly influence the system. The HCA components included in this quadrant are: Responsiveness (C6), Adaptability (C7), Resilience (C8), and Generative (C9). These components represent agility capabilities, which are a manifestation of strengthening the driving components.
Linkage Components: These components are located in the upper right quadrant, with equally high driving force and dependency values. They are highly unstable because they influence and are strongly influenced by other components. Interestingly, no HCA components were identified in this category. This indicates that the model has a relatively stable structure, with no single component simultaneously acting as a primary input and output, susceptible to a domino effect.
Autonomous Components: These components are located in the lower left quadrant, with equally low driving force and dependency values. They are relatively isolated from the system, and changes to them would not significantly impact other components. No HCA components were identified as autonomous. This indicates that the nine identified components have a significant degree of interconnectedness, underscoring the systemic and holistic nature of HCA in the context of this study.
4.3. Discussion
There are four interrelated aspects that merit further discussion considering the study’s findings. First, the very strong effect of Leadership Agility on Human Capital Agility confirms that agile leadership is a central lever for developing agile human capital in construction projects, indicating that leadership development initiatives need to explicitly target agility-related capabilities if organizations wish to strengthen Human Capital Agility at the team and organizational levels. Second, the hierarchical Human Capital Agility model, which distinguishes foundational drivers (such as attitudes and predisposition) from higher-level outcome capabilities (such as generative behavior, responsiveness, adaptability, and resilience), offers a structured roadmap that can guide staged interventions; at the same time, its stability across different industries, project types, and cultural contexts remains an open question that calls for further empirical testing. Third, the non-significant relationship between tacit knowledge and Leadership Agility contrasts with much of the existing literature that highlights the importance of tacit experience for effective leadership, suggesting that contextual conditions in construction projects, measurement choices, or the interaction with implicit and explicit knowledge may shape this link and warrant more detailed qualitative and longitudinal investigation. Fourth, when viewed together, the structural relationships and the hierarchical model position Human Capital Agility as a strategic bridge between knowledge practices, leadership behavior, and sustainable project success, pointing to the need for integrated programs that combine knowledge management, leadership development, and human capital strategies to operationalize this bridge in practice.
From a theoretical perspective, these results sharpen the conceptualization of Human Capital Agility as a collective capability grounded in human capital theory and extend knowledge-management scholarship by showing that tacit experience must be supported by systematic articulation and internalization of explicit and implicit knowledge before it can effectively inform agile leadership in complex project settings. From a practical standpoint, the integrated structural and hierarchical models offer project-based organizations a concrete roadmap for staged capability development, enabling managers to diagnose team strengths and weaknesses along the HCA hierarchy, prioritize foundational development, and align leadership-agility programs and knowledge-management practices to progressively enhance sustainable project success in a more targeted and evidence-based manner.
5. Limitations and Future Research
5.1. Limitations
This research has several limitations that should be considered. First, this study is confined to construction projects in Indonesia. The industry’s specific characteristics and the Indonesian institutional context may shape the observed relationships, so the results should be generalized to other sectors or countries only with caution and after further empirical validation. Second, the analysis is conducted at the project level using self-reported data from project leaders and team members, and the hierarchical Human Capital Agility model is derived from expert judgments. While this combination provides nuanced insight into team-level behavior and the internal structure of Human Capital Agility, the reliance on expert interpretation introduces potential subjectivity and does not fully capture firm-level strategic factors such as organizational culture and investment priorities. Third, the structural relationships are tested with a quantitative cross-sectional survey, which permits examination of associations at a single point in time but cannot track how Human Capital Agility and Leadership Agility develop or provide strong causal claims. Longitudinal and mixed-method studies are therefore needed to examine capability evolution and to clarify results such as the nonsignificant effect of tacit knowledge on Leadership Agility. Fourth, the model focuses deliberately on a limited set of core constructs—Knowledge Management (explicit, implicit, and tacit knowledge), Leadership Agility, Human Capital Agility, Sustainable Project Success, and Firm Size. Other potentially influential factors, including organizational culture, external stakeholder pressure, and broader market or environmental dynamics, are not modeled and should be incorporated in future extensions to obtain a more comprehensive understanding of Human Capital Agility in project-based organizations.
5.2. Future Research
The results of this study indicate that tacit knowledge does not significantly influence leadership agility in the construction sector. Therefore, further research is highly recommended to explore the role of tacit knowledge using qualitative approaches, such as interviews or case studies, to more comprehensively explain its mechanisms and contributions. Furthermore, the development of longitudinal studies to review real-time changes and developments in human capital agility and leadership agility, as well as their impact on project success, is recommended.
Moreover, future studies are encouraged to explicitly model and test the mediating roles of Leadership Agility and Human Capital Agility in the relationships between Knowledge Management and Sustainable Project Success, so as to unlock the full explanatory potential of the proposed framework and further strengthen its theoretical grounding. Expanding the research context to other industry sectors and different geographic locations is also crucial to test the reliability and flexibility of the Human Capital Agility model globally. Practical testing of the Human Capital Agility roadmap in various organizations with diverse company and project characteristics is also necessary to identify effective development strategies. Finally, the development of comprehensive and internationally valid measurement instruments should be a focus of future research to ensure the HCA model can be widely and reliably applied across various global contexts.
6. Conclusions
In response to RQ1, this study confirms that Human Capital Agility (HCA) has a significant and positive influence on the success of sustainable projects in the construction sector. Empirically, HCA is composed of nine main components, namely: Attitudes, Leadership, Skill, Creativity, Predispositions, Responsiveness, Adaptability, Resilience, and Generative. The integration of these nine components significantly impacts all key dimensions of project success, including time, cost, quality, safety, and stakeholder satisfaction. Leadership Agility is proven to be the most influential predictor in shaping HCA, with a path coefficient of 0.799.
Adaptive and responsive leadership is an important foundation for agile human capital development, supported by the role of explicit and implicit knowledge management. In addition, aspects of knowledge management, especially explicit and implicit, are proven to strengthen the role of Leadership Agility in building HCA, supporting the holistic success of construction sector projects. In contrast, tacit knowledge does not show a statistically significant direct effect on Leadership Agility, indicating that in this study, its role is weaker than that of explicit and implicit knowledge in explaining the application of agile leadership in the construction sector.
The moderating effect of firm size indicates that the positive influence of HCA on project success is reduced in larger firms. Smaller firms with leaner structures and minimal bureaucracy can maximize the effect of HCA to support project outcomes. This finding aligns with Haar and O’Kane [42], who highlight the advantages of innovation and adaptation in small firms when KSA capabilities are high.
To answer RQ2, mapping the HCA hierarchical structure using the m-TISM method places the generative component at the top level (level I), which is clearly identified as the core and ultimate goal of HCA development. Facing the VUCA environment and the era of disruption, generative capabilities have become the “new mecca” for human capital development: not only adaptive and resilient, but also capable of generating sustainable value, solutions, and innovation. These findings reorient the structure and priorities of human capital development in the construction sector and serve as an important reference for future organizational development theory and practice. This research can be expanded and generalized to various industrial sectors and cross-national contexts, thereby strengthening the theoretical basis of Human Capital Agility globally.
Author Contributions
Conceptualization, G.C.S.; Methodology, G.C.S., M.D., F.F. and A.M.; Validation, M.D., F.F., A.M. and J.J.P.; Formal analysis, G.C.S.; Investigation, F.F., A.M. and J.J.P.; Resources, A.M. and J.J.P.; Data curation, G.C.S., F.F., A.M. and J.J.P.; Writing—original draft, G.C.S.; Writing—review & editing, M.D.; Visualization, A.M. and J.J.P.; Supervision, M.D. and F.F. All authors have read and agreed to the published version of the manuscript.
Funding
Research Funding by University of Indonesia. PUTI UI 2025.
Institutional Review Board Statement
Ethical review and approval were waived for this study by Institution Committee due to Legal Regulations (The principles of the Declaration of Helsinki (1975), as revised in 2013, and complies with national and institutional ethical guidelines).
Informed Consent Statement
Informed consent was obtained from all subjects involved in the study.
Data Availability Statement
The raw data supporting the conclusions of this article will be made available by the authors on request.
Conflicts of Interest
The authors declare no conflicts of interest.
References
- OECD Economic Outlook, Interim Report September 2024. Available online: https://www.oecd.org/en/publications/oecd-economic-outlook-interim-report-september-2024_1517c196-en.html (accessed on 30 October 2024).
- BPS. Produk Domestik Bruto Indonesia Triwulanan 2020–2024. Badan Pusat Statistik: Indonesia, 2024. Available online: https://www.bps.go.id/id/publication/2024/10/09/7290b829d2eaa972e4968d19/produk-domestik-bruto-indonesia-triwulanan-2020-2024.html (accessed on 30 October 2024).
- Sukawarna. Buka Pameran KI 2024, AHY: Sektor Konstruksi Merupakan Nyawa Pembangunan Nasional. 2024. Available online: https://sakawarta.com/buka-pameran-ki-2024-ahy-sektor-konstruksi-merupakan-nyawa-pembangunan-nasional/7221/2024/ (accessed on 30 October 2024).
- PUPR. Tingkatkan Daya Saing, Kementerian PU Gelar Konstruksi Indonesia 2024 di ICE BSD. 2024. Available online: https://pu.go.id/berita/tingkatkan-daya-saing-kementerian-pu-gelar-konstruksi-indonesia-2024-di-ice-bsd (accessed on 30 October 2024).
- Winata, L.E.; Gultom, Y.M.L. The effects of governance on performance: The case of Public–Private Partnership (PPP) toll roads in Indonesia. Int. J. Constr. Manag. 2023, 24, 1398–1406. [Google Scholar] [CrossRef] [Scilit]
- Aulia, D.; Husin, A.E. Dynamic Model-Based Risk Manageability in the Modular Construction of High-Rise Residential Buildings to Improve Project time Performance. Civ. Eng. Arch. 2022, 10, 2541–2553. [Google Scholar] [CrossRef] [Scilit]
- PAKKI. Kecelakaan Kerja Konstruksi Masih Mengancam di 2025, Perlu Evaluasi Sistemik dan Kepemimpinan K3 Yang Kuat. 2025. Available online: https://pakki.org/berita_detail/kecelakaan-kerja-konstruksi-masih-mengancam-di-2025-perlu-evaluasi-sistemik-dan-kepemimpinan-k3-yang-kuat (accessed on 30 October 2024).
- Oesterreich, T.D.; Teuteberg, F. Understanding the implications of digitisation and automation in the context of Industry 4.0: A triangulation approach and elements of a research agenda for the construction industry. Comput. Ind. 2016, 83, 121–139. [Google Scholar] [CrossRef] [Scilit]
- Joiner, B. Leadership Agility for Organizational Agility. J. Creating Value 2019, 5, 139–149. [Google Scholar] [CrossRef] [Scilit]
- Forcael, E.; Ferrari, I.; Opazo-Vega, A.; Pulido-Arcas, J.A. Construction 4.0: A Literature Review. Sustainability 2020, 12, 9755. [Google Scholar] [CrossRef] [Scilit]
- Sinaga, T.; Husin, A.E. Analysis of Time Efficiency with CCPM Method and BIM in Construction Projects Construction of High-Rise Residential Building Basement. Civ. Eng. Arch. 2021, 9, 1465–1477. [Google Scholar] [CrossRef] [Scilit]
- Whiteman, W.E. Project Training and Educating Army Officers for the Military Academy. USAWC Strategy Research Project, 1998; p. 32. Available online: https://apps.dtic.mil/sti/tr/pdf/ADA345812.pdf (accessed on 30 October 2024).
- Ghanbaripour, A.N.; Langston, C.; Tumpa, R.J.; Skulmoski, G. Validating and testing a project delivery success model in construction: A mixed-method approach in Australia. Smart Sustain. Built Environ. 2023, 13, 532–559. [Google Scholar] [CrossRef] [Scilit]
- Serrador, P.; Pinto, J.K. Does Agile work?—A quantitative analysis of agile project success. Int. J. Proj. Manag. 2015, 33, 1040–1051. [Google Scholar] [CrossRef] [Scilit]
- Diogo, B.B.; Carlos, A.P.S.; Najjar, M.; da Costa, B.B.F.; Tam, V.W.Y.; Haddad, A.N. Project success and critical success factors of construction projects from the perspective of a multicultural team: A case study in Guyana. Int. J. Constr. Manag. 2024, 25, 1115–1129. [Google Scholar] [CrossRef] [Scilit]
- Waqar, A.; Bin Othman, I.; Mansoor, M.S. Building information modeling (BIM) implementation and construction project success in Malaysian construction industry: Mediating role of project control. Eng. Constr. Arch. Manag. 2024, 32, 6095–6114. [Google Scholar] [CrossRef] [Scilit]
- Han, H.; Ma, F.; Liu, X. Transformational leadership and project success: The serial meditating roles of team flexibility and team agility. Front. Built Environ. 2024, 9, 1334413. [Google Scholar] [CrossRef] [Scilit]
- DJBK. Kementerian PUPR Kembali Gelar Konstruksi Indonesia 2024. 2024. Available online: https://binakonstruksi.pu.go.id/informasi-terkini/kementerian-pupr-kembali-gelar-konstruksi-indonesia-2024/ (accessed on 15 October 2024).
- Whyte, J.; Naderpajouh, N.; Clegg, S.; Matous, P.; Pollack, J.; Crawford, L. Project leadership: A research agenda for a changing world. Proj. Leadersh. Soc. 2022, 3, 100044. [Google Scholar] [CrossRef] [Scilit]
- Syamsir, S.; Saputra, N.; Mulia, R.A. Leadership agility in a VUCA world: A systematic review, conceptual insights, and research directions. Cogent Bus. Manag. 2025, 12, 4. [Google Scholar] [CrossRef] [Scilit]
- Al-Faouri, A.H. Green knowledge management and technology for organizational sustainability: The mediating role of knowledge-based leadership. Cogent Bus. Manag. 2023, 10, 6. [Google Scholar] [CrossRef] [Scilit]
- Nonaka, I. “The Knowledge-Creating Company” 2007, July-August, 165. Available online: https://lumsa.it/sites/default/files/UTENTI/u95/LM51_ITA_The%20Knowledge-Creating%20Company.pdf (accessed on 30 October 2024).
- Frappaolo, C. Implicit knowledge. Knowl. Manag. Res. Pract. 2008, 6, 23–25. [Google Scholar] [CrossRef] [Scilit]
- Hennel, P.; Rosenkranz, C. Investigating the “Socio” in Socio-Technical Development: The Case for Psychological Safety in Agile Information Systems Development. Proj. Manag. J. 2020, 52, 11–30. [Google Scholar] [CrossRef] [Scilit]
- Sumadireja, G.C.; Dachyar, M.; Farizal, F.; Ma’aram, A.; Park, J.J. Identifying Key Assessment Factors for Human Capital Agility and Leadership Agility. Sustainability 2025, 17, 3849. [Google Scholar] [CrossRef] [Scilit]
- Kański, Ł.; Chadam, J.; Kłosowski, G. Intellectual Capital: A New Predictive Indicator for Project Management Improvement. Sustainability 2022, 14, 15182. [Google Scholar] [CrossRef] [Scilit]
- Jones, E.O. Indigenous knowledge management practices in subsistence farming: A comprehensive evaluation. Sustain. Technol. Entrep. 2023, 3, 100058. [Google Scholar] [CrossRef] [Scilit]
- Nonaka, I.; Takeuchi, H. The Knowledge-Creating Company: How Japanese Companies Create the Dynamics of Innovation; Oxford University Press: Oxford, UK, 1995. [Google Scholar]
- Polanyi, M. The Logic of Tacit Inference. Philosophy 1966, 41, 4. [Google Scholar] [CrossRef] [Scilit]
- Stokvik, H.; Adriaenssen, D.J.; Johannessen, J.-A.; Skålsvik, H. Aspects of a knowledge theory for new venture creation: Management, policy and methodological implications. Probl. Perspect. Manag. 2016, 14, 155–163. [Google Scholar] [CrossRef] [Scilit]
- Shahzad, F.; Chilba, S.; Arslan, A. Tacit knowledge exchange among senior management educators: A qualitative study. Int. J. Manag. Educ. 2024, 22, 2. [Google Scholar] [CrossRef] [Scilit]
- Lei, H.; Saeheng, P.; Le, P.B. Stimulating knowledge sharing behaviors for frugal innovation: The roles of inclusive leadership and competitive intensity. J. Knowl. Manag. 2023, 28, 1468–1489. [Google Scholar] [CrossRef] [Scilit]
- Zahoor, K.; Hameed, I.; John, A.; Qadeer, F. How transactional leadership impacts tacit and explicit knowledge hiding: The role of perceived competition and leader knowledge hiding. J. Appl. Struct. Equ. Model. 2024, 8, 4. [Google Scholar] [CrossRef] [Scilit]
- Bhatti, S.H.; Gavurova, B.; Ahmed, A.; Marcone, M.R.; Santoro, G. The impact of digital platforms on the creativity of remote workers through the mediating role of explicit and tacit knowledge sharing. J. Knowl. Manag. 2024, 28, 2433–2459. [Google Scholar] [CrossRef] [Scilit]
- Rutten, W.; Blaas-Franken, J.; Martin, H. The impact of (low) trust on knowledge sharing. J. Knowl. Manag. 2016, 20, 199–214. [Google Scholar] [CrossRef] [Scilit]
- Karlsson, J. Firm size and growth barriers: A data-driven approach. Small Bus. Econ. 2020, 57, 1319–1338. [Google Scholar] [CrossRef] [Scilit]
- Hartono, B.; Sulistyo, S.R.; Chai, K.H.; Indarti, N. Knowledge Management Maturity and Performance in a Project Environment: Moderating Roles of Firm Size and Project Complexity. J. Manag. Eng. 2019, 35, 5. [Google Scholar] [CrossRef] [Scilit]
- Kweh, Q.L.; Lu, W.-M.; Ting, I.W.K.; Le, H.T.M. The cubic S-curve relationship between board independence and intellectual capital efficiency: Does firm size matter? J. Intellect. Cap. 2021, 23, 1025–1051. [Google Scholar] [CrossRef] [Scilit]
- Baeshen, Y.; Soomro, Y.A.; Bhutto, M.Y. Determinants of Green Innovation to Achieve Sustainable Business Performance: Evidence from SMEs. Front. Psychol. 2021, 12, 10. [Google Scholar] [CrossRef] [Scilit]
- Yao, Y.; Feng, J.; Yang, Q. Impact of Financing Constraints on Firm Performance: Moderating Effect Based on Firm Size. Comput. Intell. Neurosci. 2022, 2022, 2. [Google Scholar] [CrossRef] [Scilit]
- Haar, J.; Schmitz, A.; Di Fabio, A.; Daellenbach, U. The Role of Relationships at Work and Happiness: A Moderated Moderated Mediation Study of New Zealand Managers. Sustainability 2019, 11, 3443. [Google Scholar] [CrossRef] [Scilit]
- Haar, J.; O’kAne, C. Understanding New Zealand firm innovation: Exploring human resource factors by firm size and strength. J. R. Soc. N. Z. 2023, 54, 350–367. [Google Scholar] [CrossRef] [Scilit]
- Malik, A.A.; Muneeb, D.; Khan, N.; Usman, M.; Latif, K.F. The nexus of servant leadership and project success: The mediation of emotional intelligence and job stress and moderation of team effectiveness. Leadersh. Organ. Dev. J. 2022, 43, 1186–1200. [Google Scholar] [CrossRef] [Scilit]
- Pasamar, S.; Diaz-Fernandez, M.; de la Rosa-Navarro, M.D. Human capital: The link between leadership and organizational learning. Eur. J. Manag. Bus. Econ. 2019, 28, 25–51. [Google Scholar] [CrossRef] [Scilit]
- Hair, J.; Alamer, A. Partial Least Squares Structural Equation Modeling (PLS-SEM) in second language and education research: Guidelines using an applied example. Res. Methods Appl. Linguist. 2022, 1, 6. [Google Scholar] [CrossRef] [Scilit]
- Henseler, J.; Ringle, C.M.; Sarstedt, M. A new criterion for assessing discriminant validity in variance-based structural equation modeling. J. Acad. Mark. Sci. 2015, 43, 115–135. [Google Scholar] [CrossRef] [Scilit]
- Kamble, S.S.; Gunasekaran, A.; Sharma, R. Analysis of the driving and dependence power of barriers to adopt industry 4.0 in Indian manufacturing industry. Comput. Ind. 2018, 101, 107–119. [Google Scholar] [CrossRef] [Scilit]
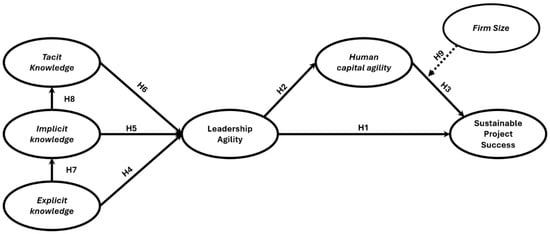
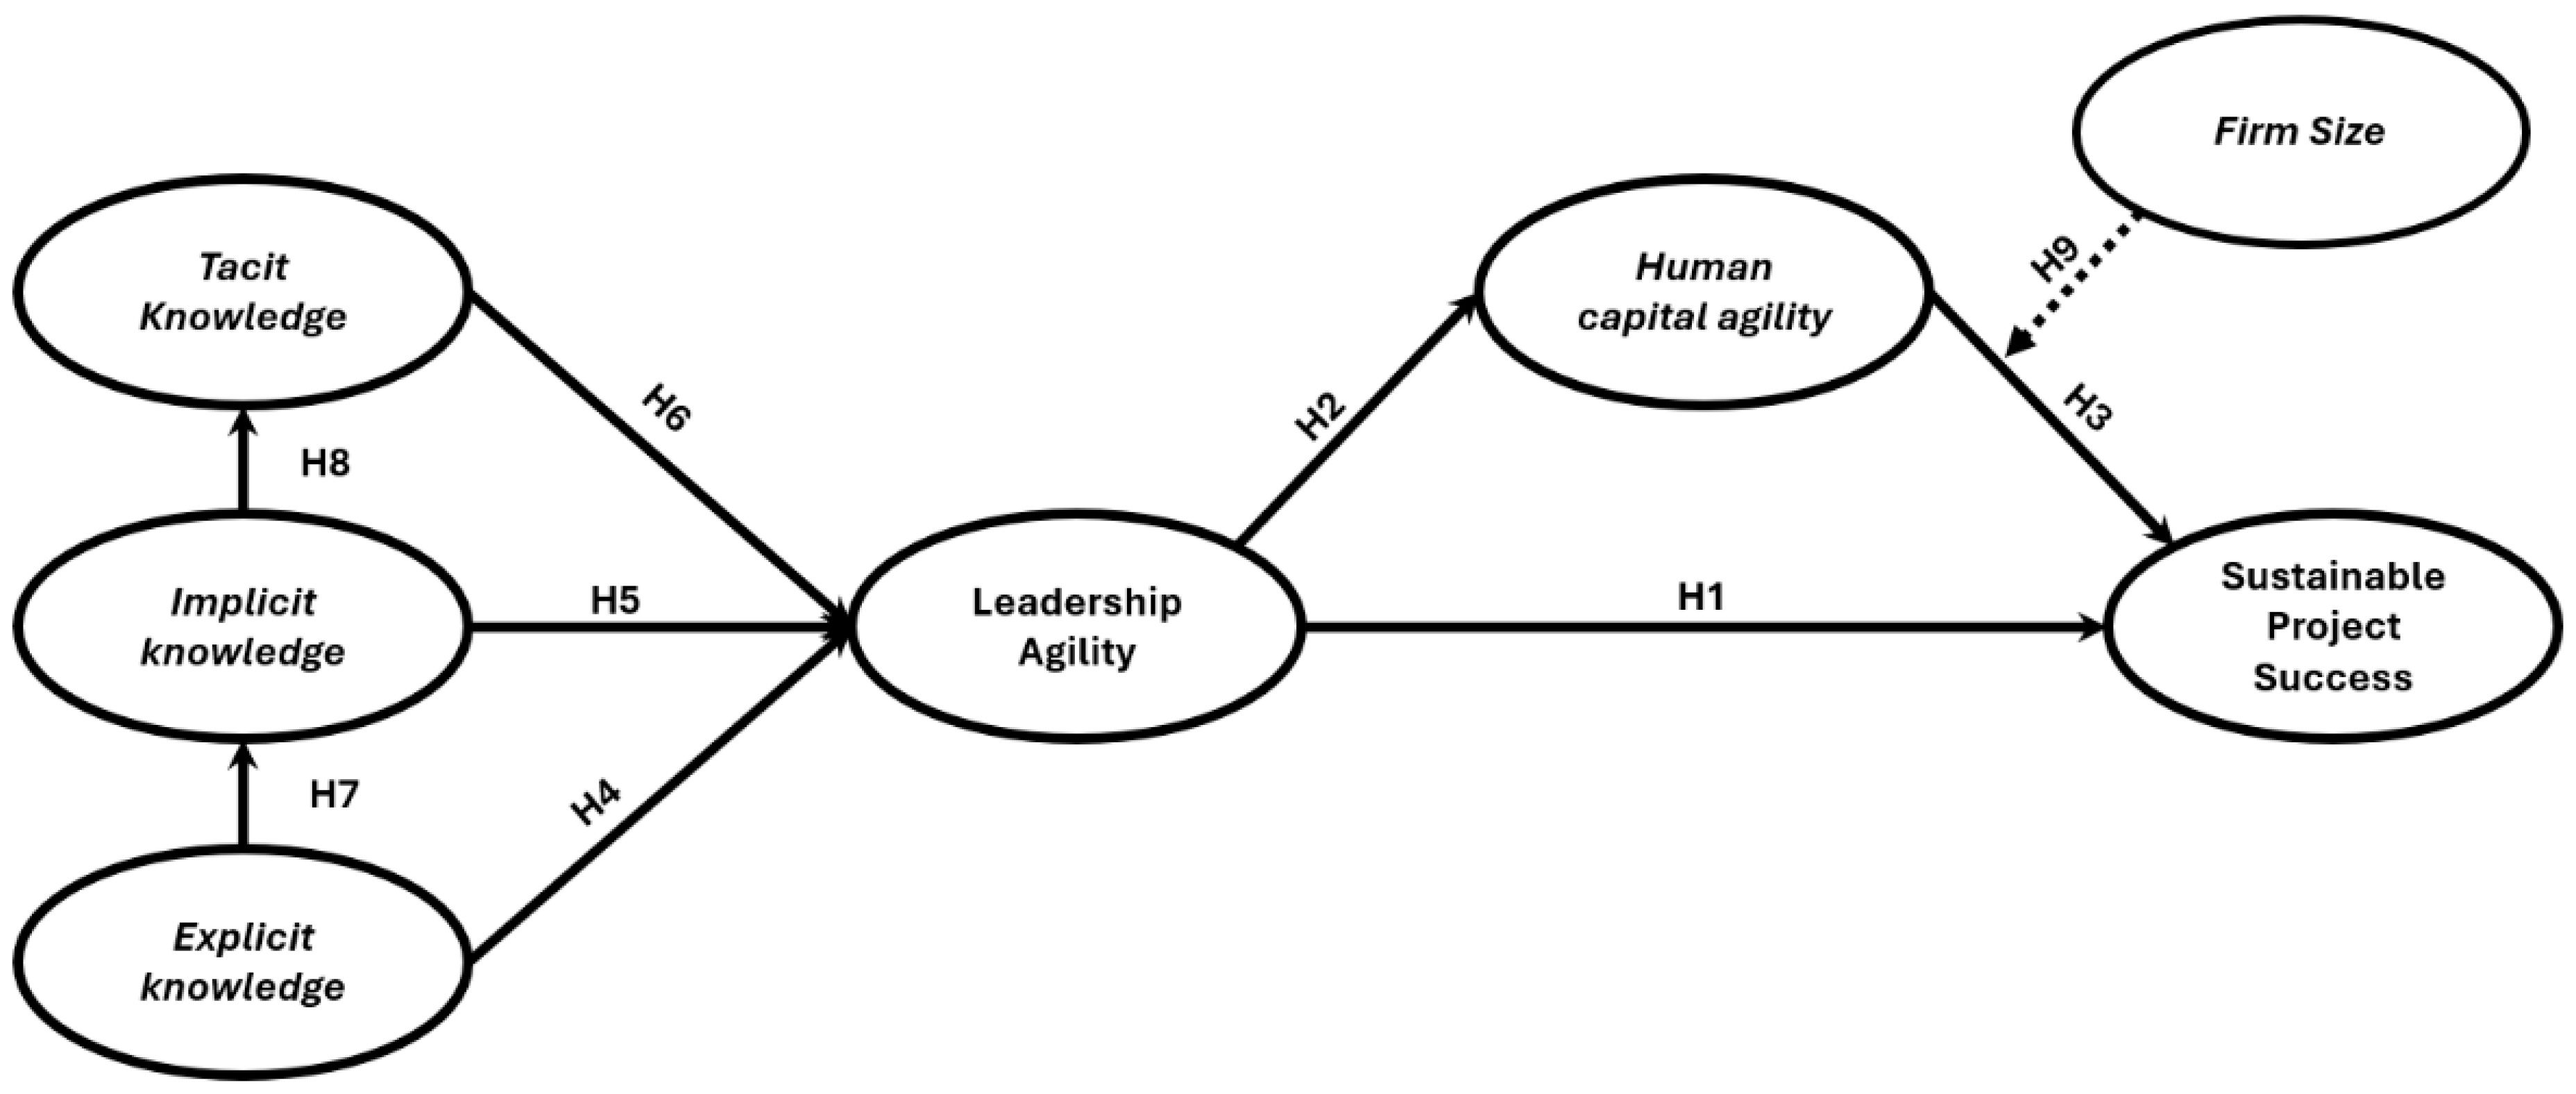
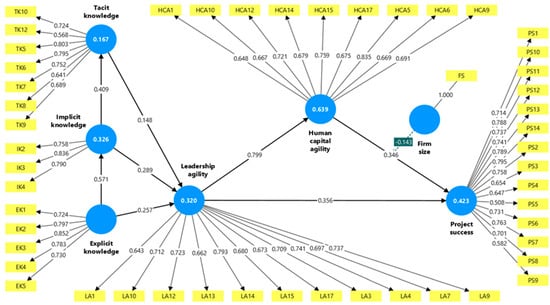
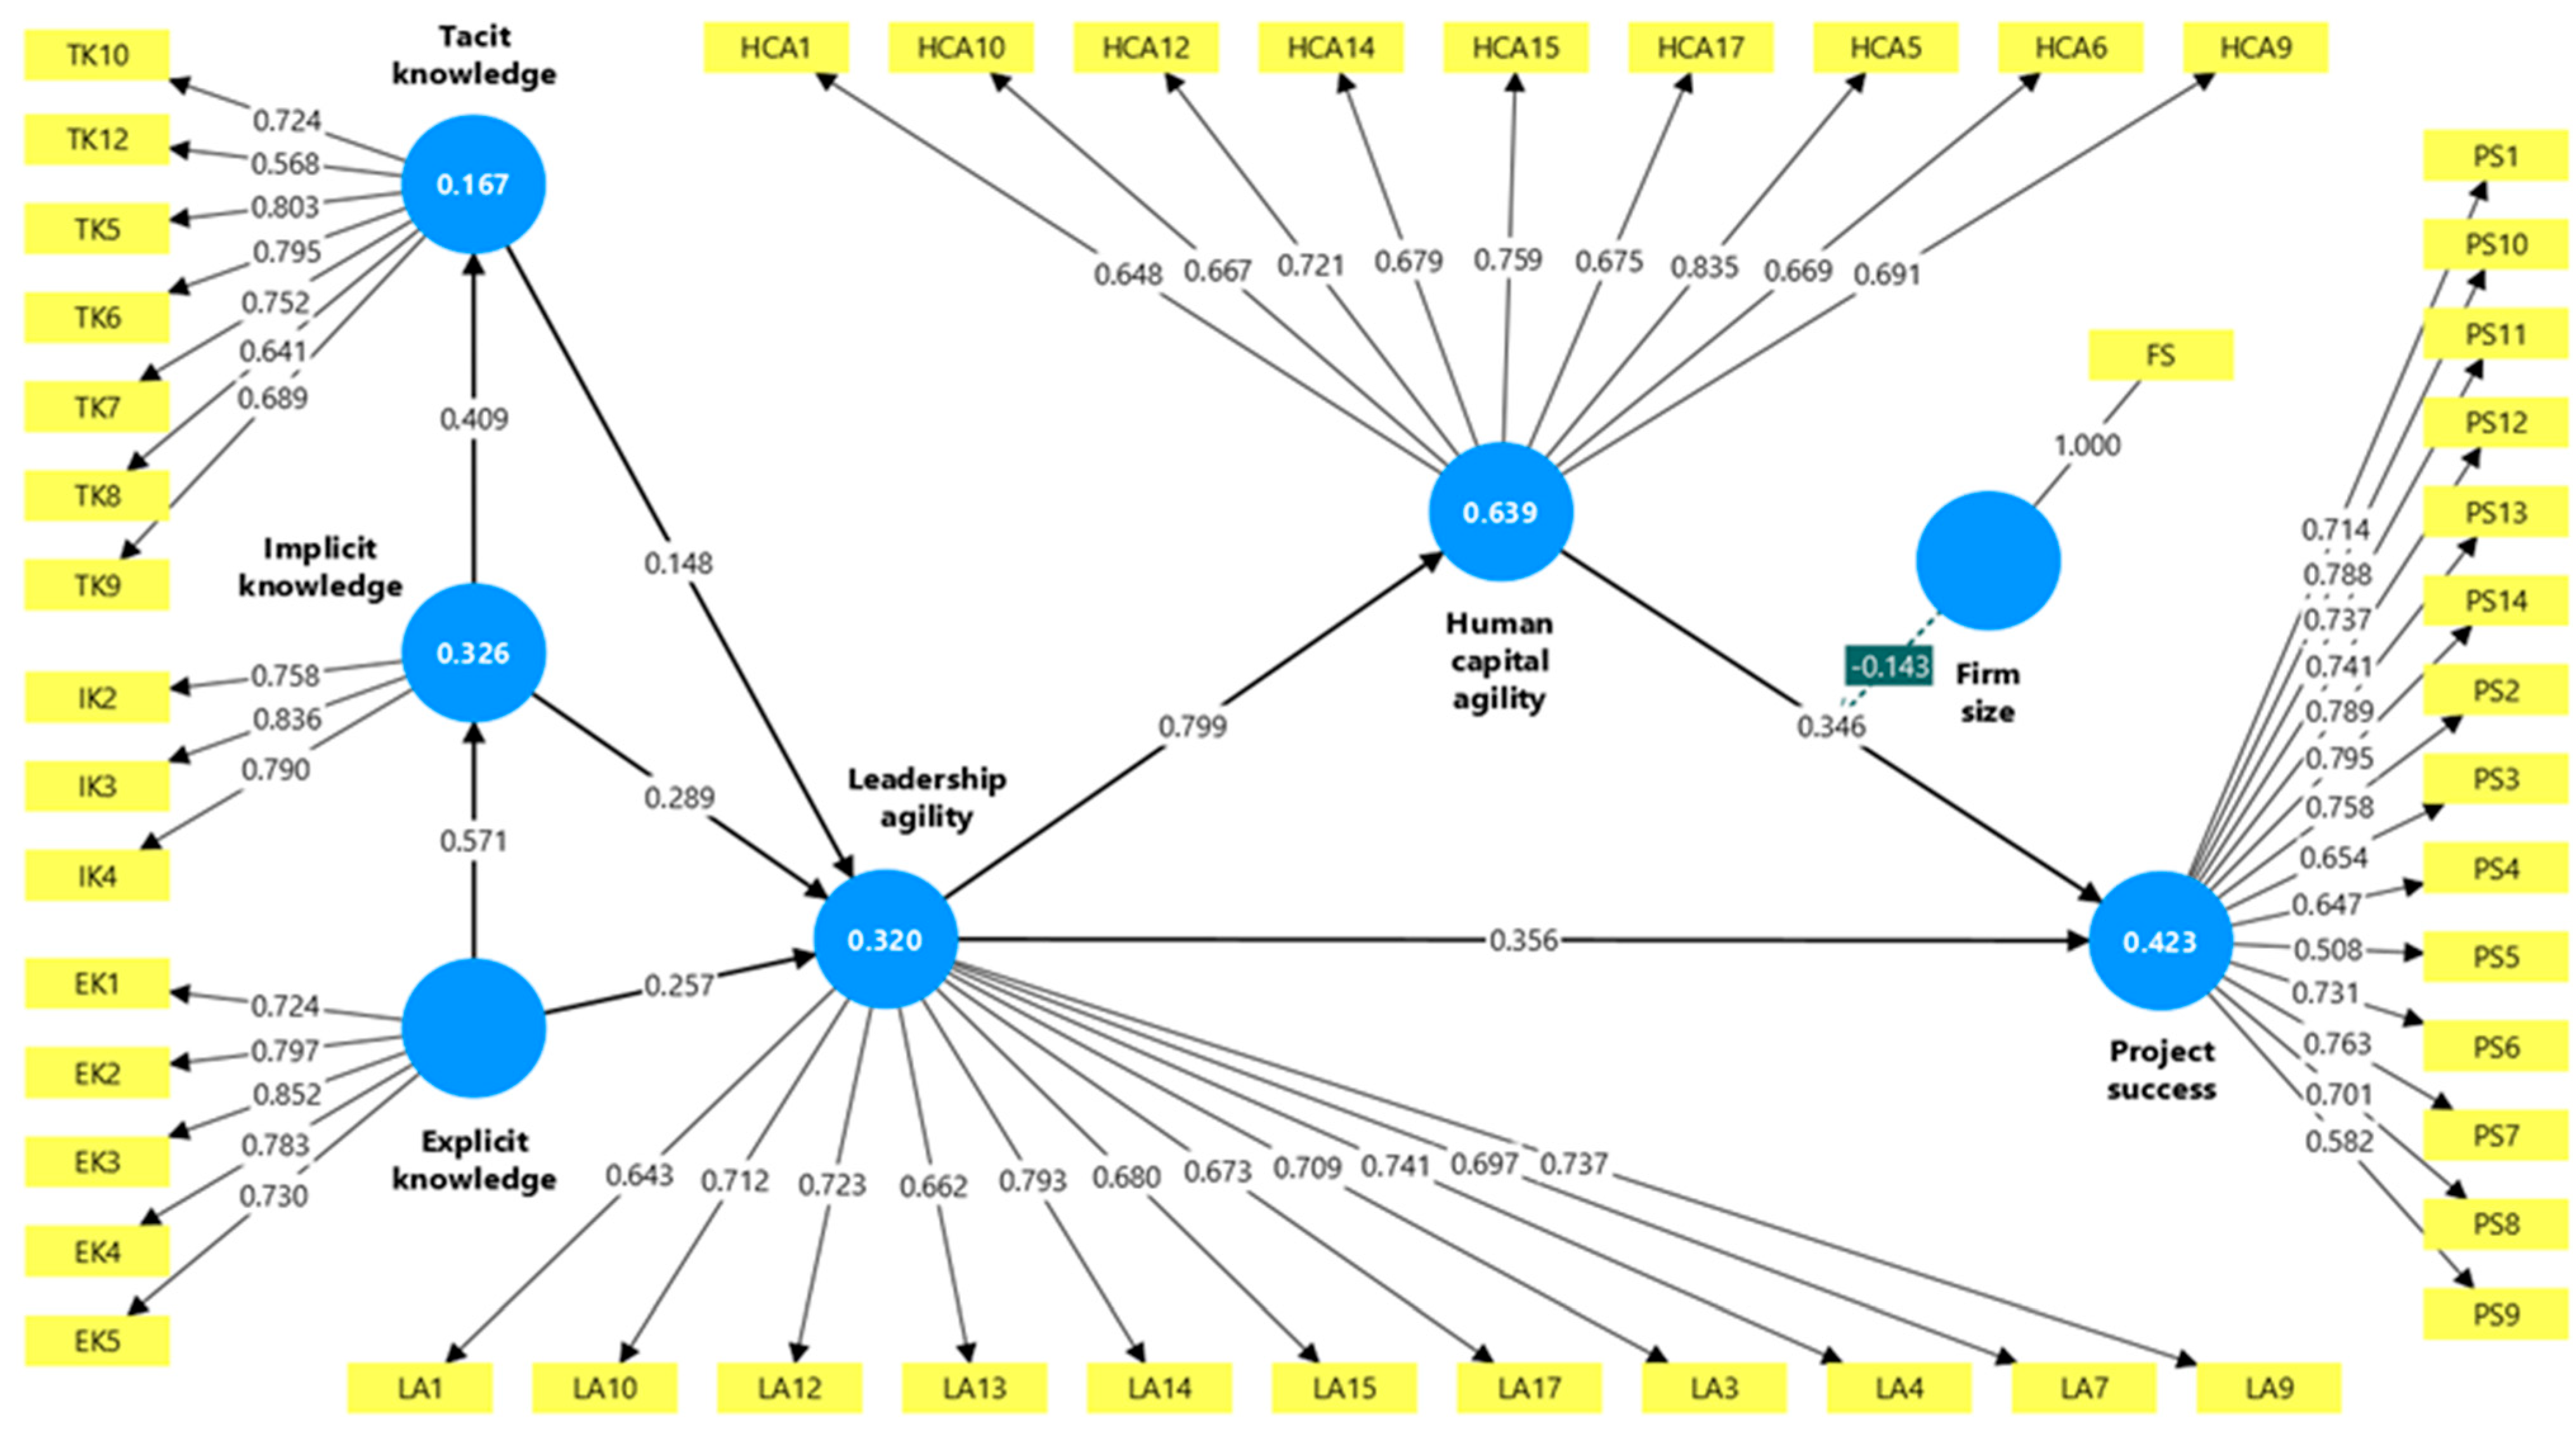
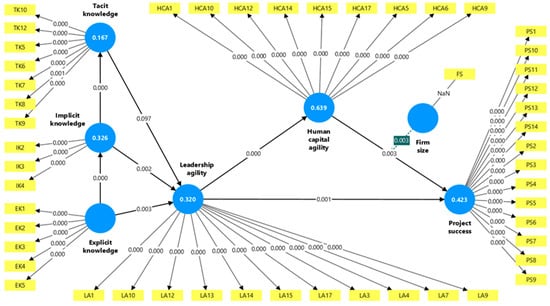
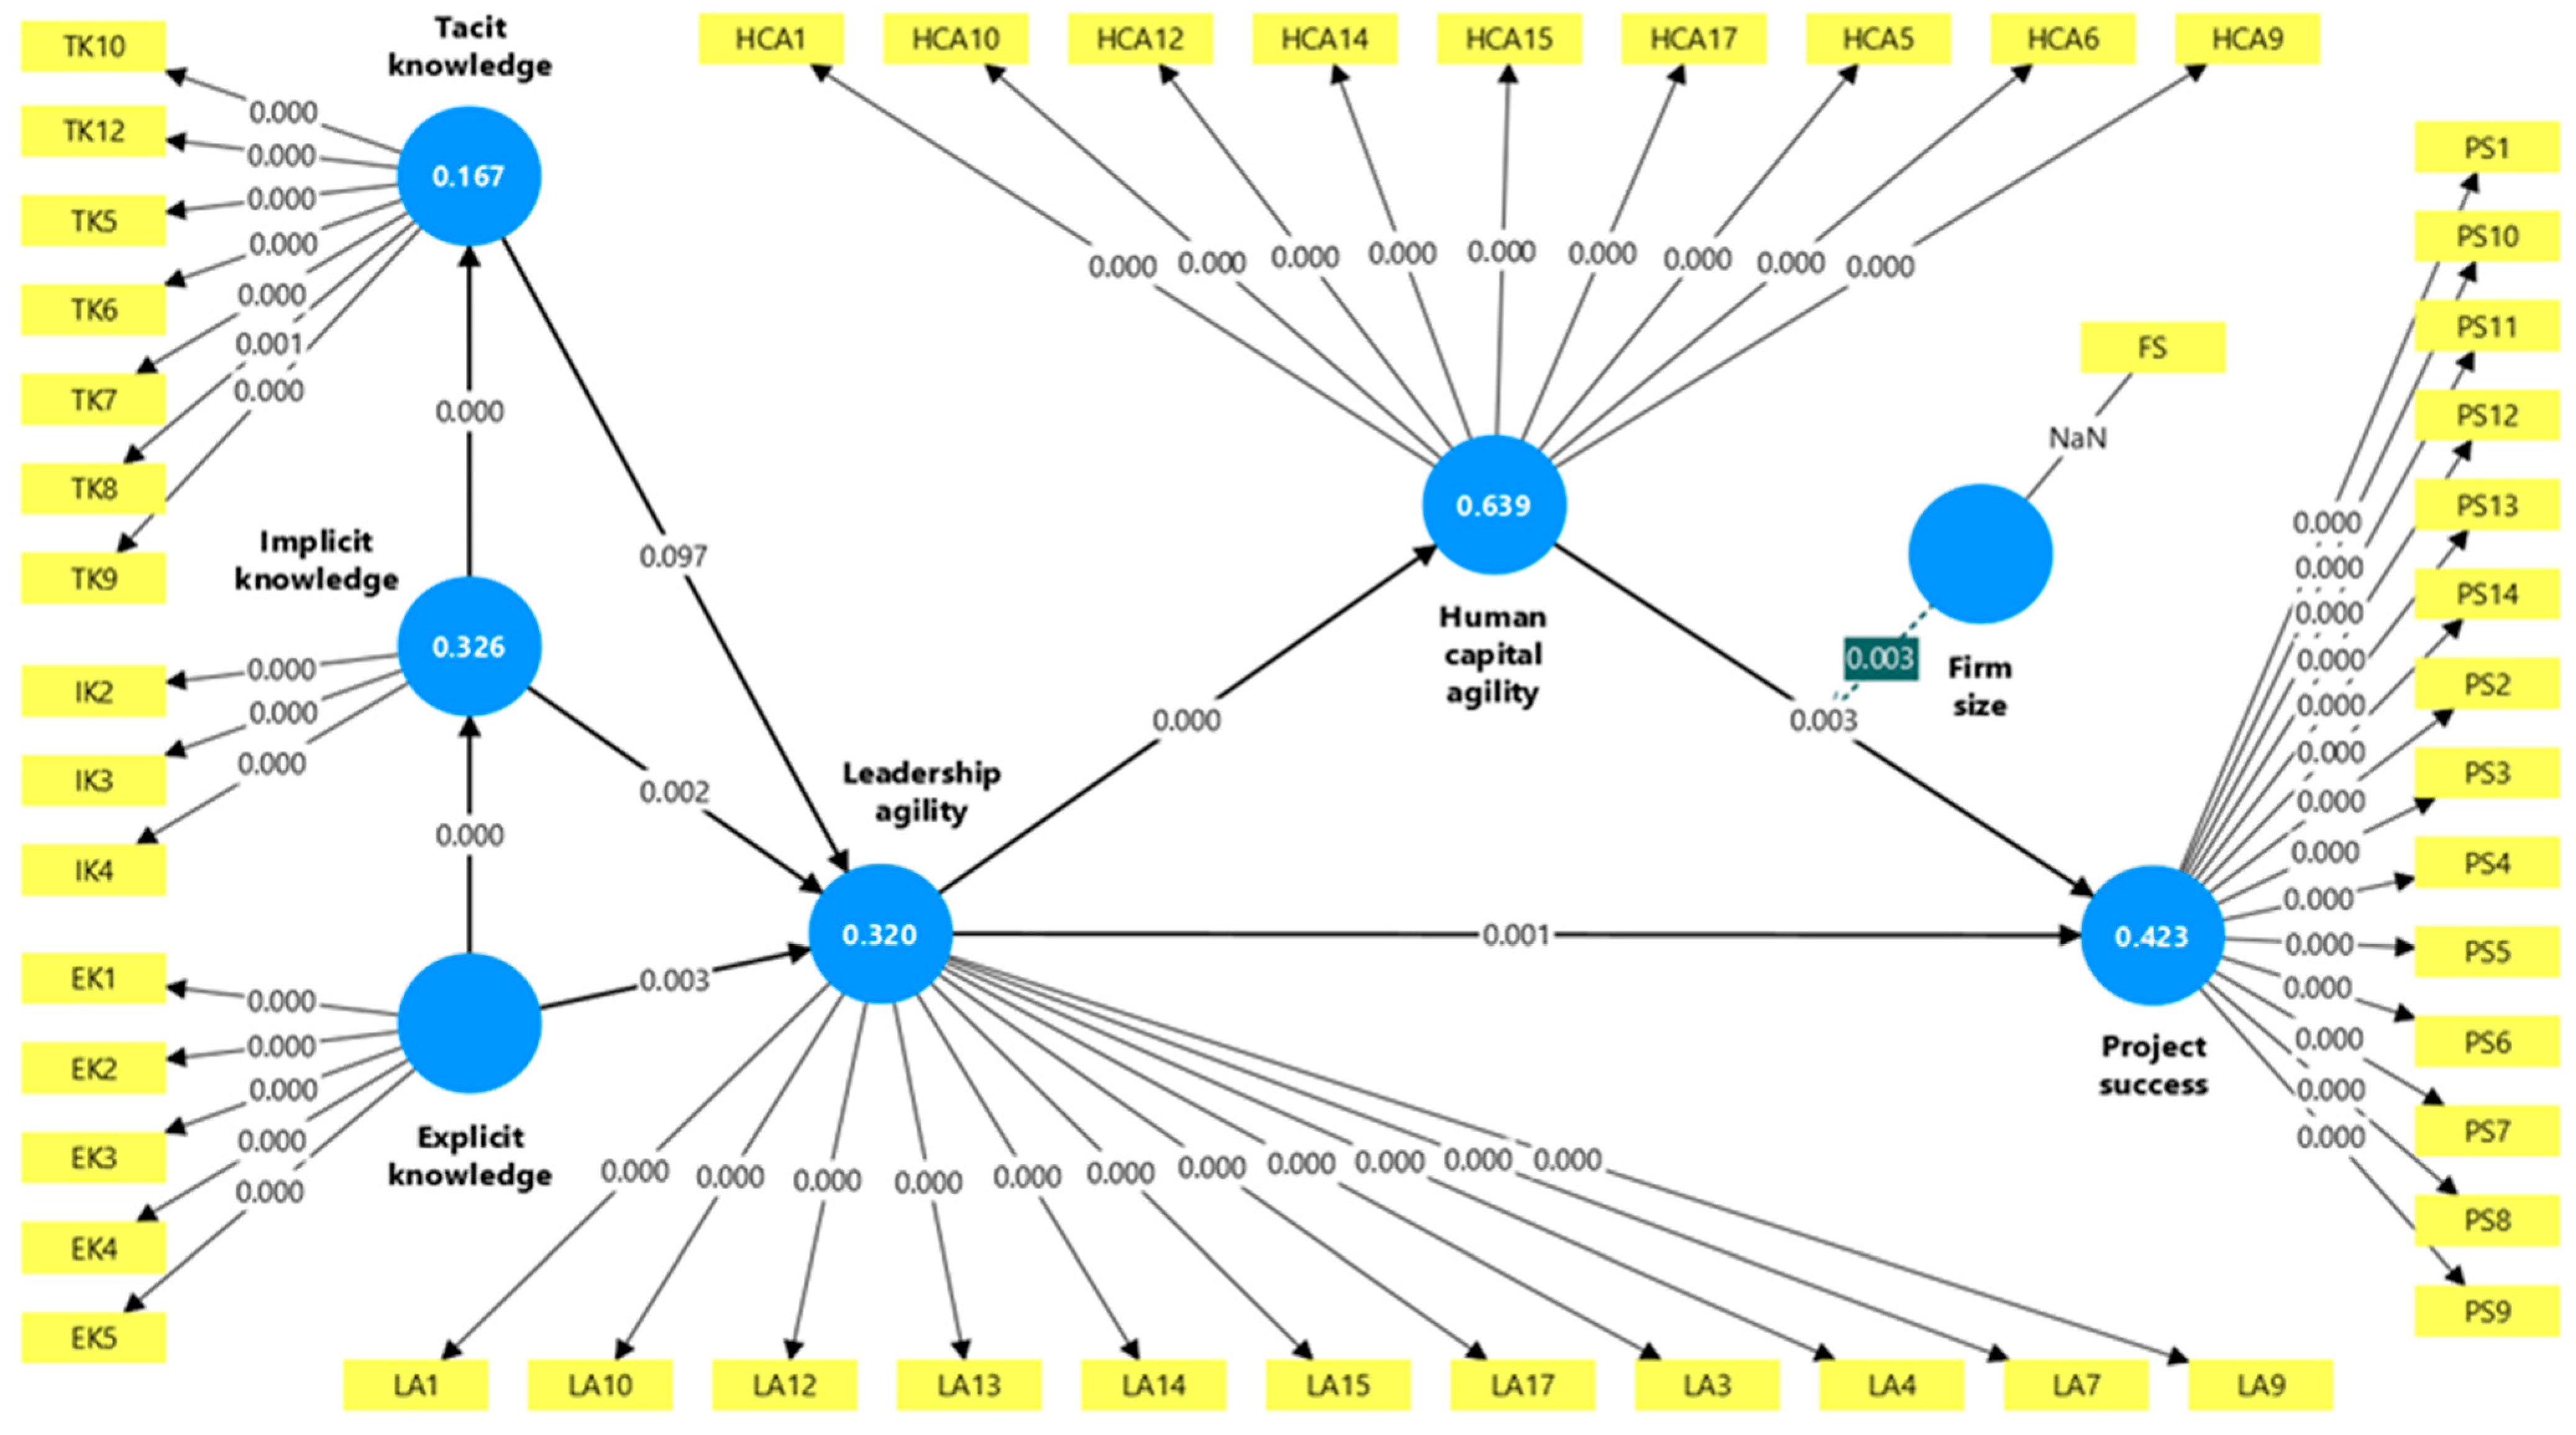
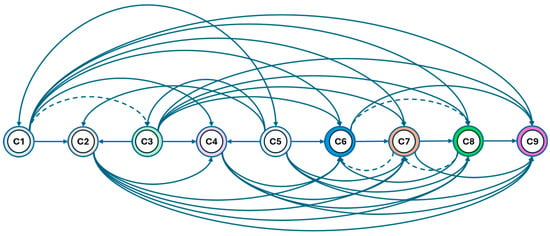
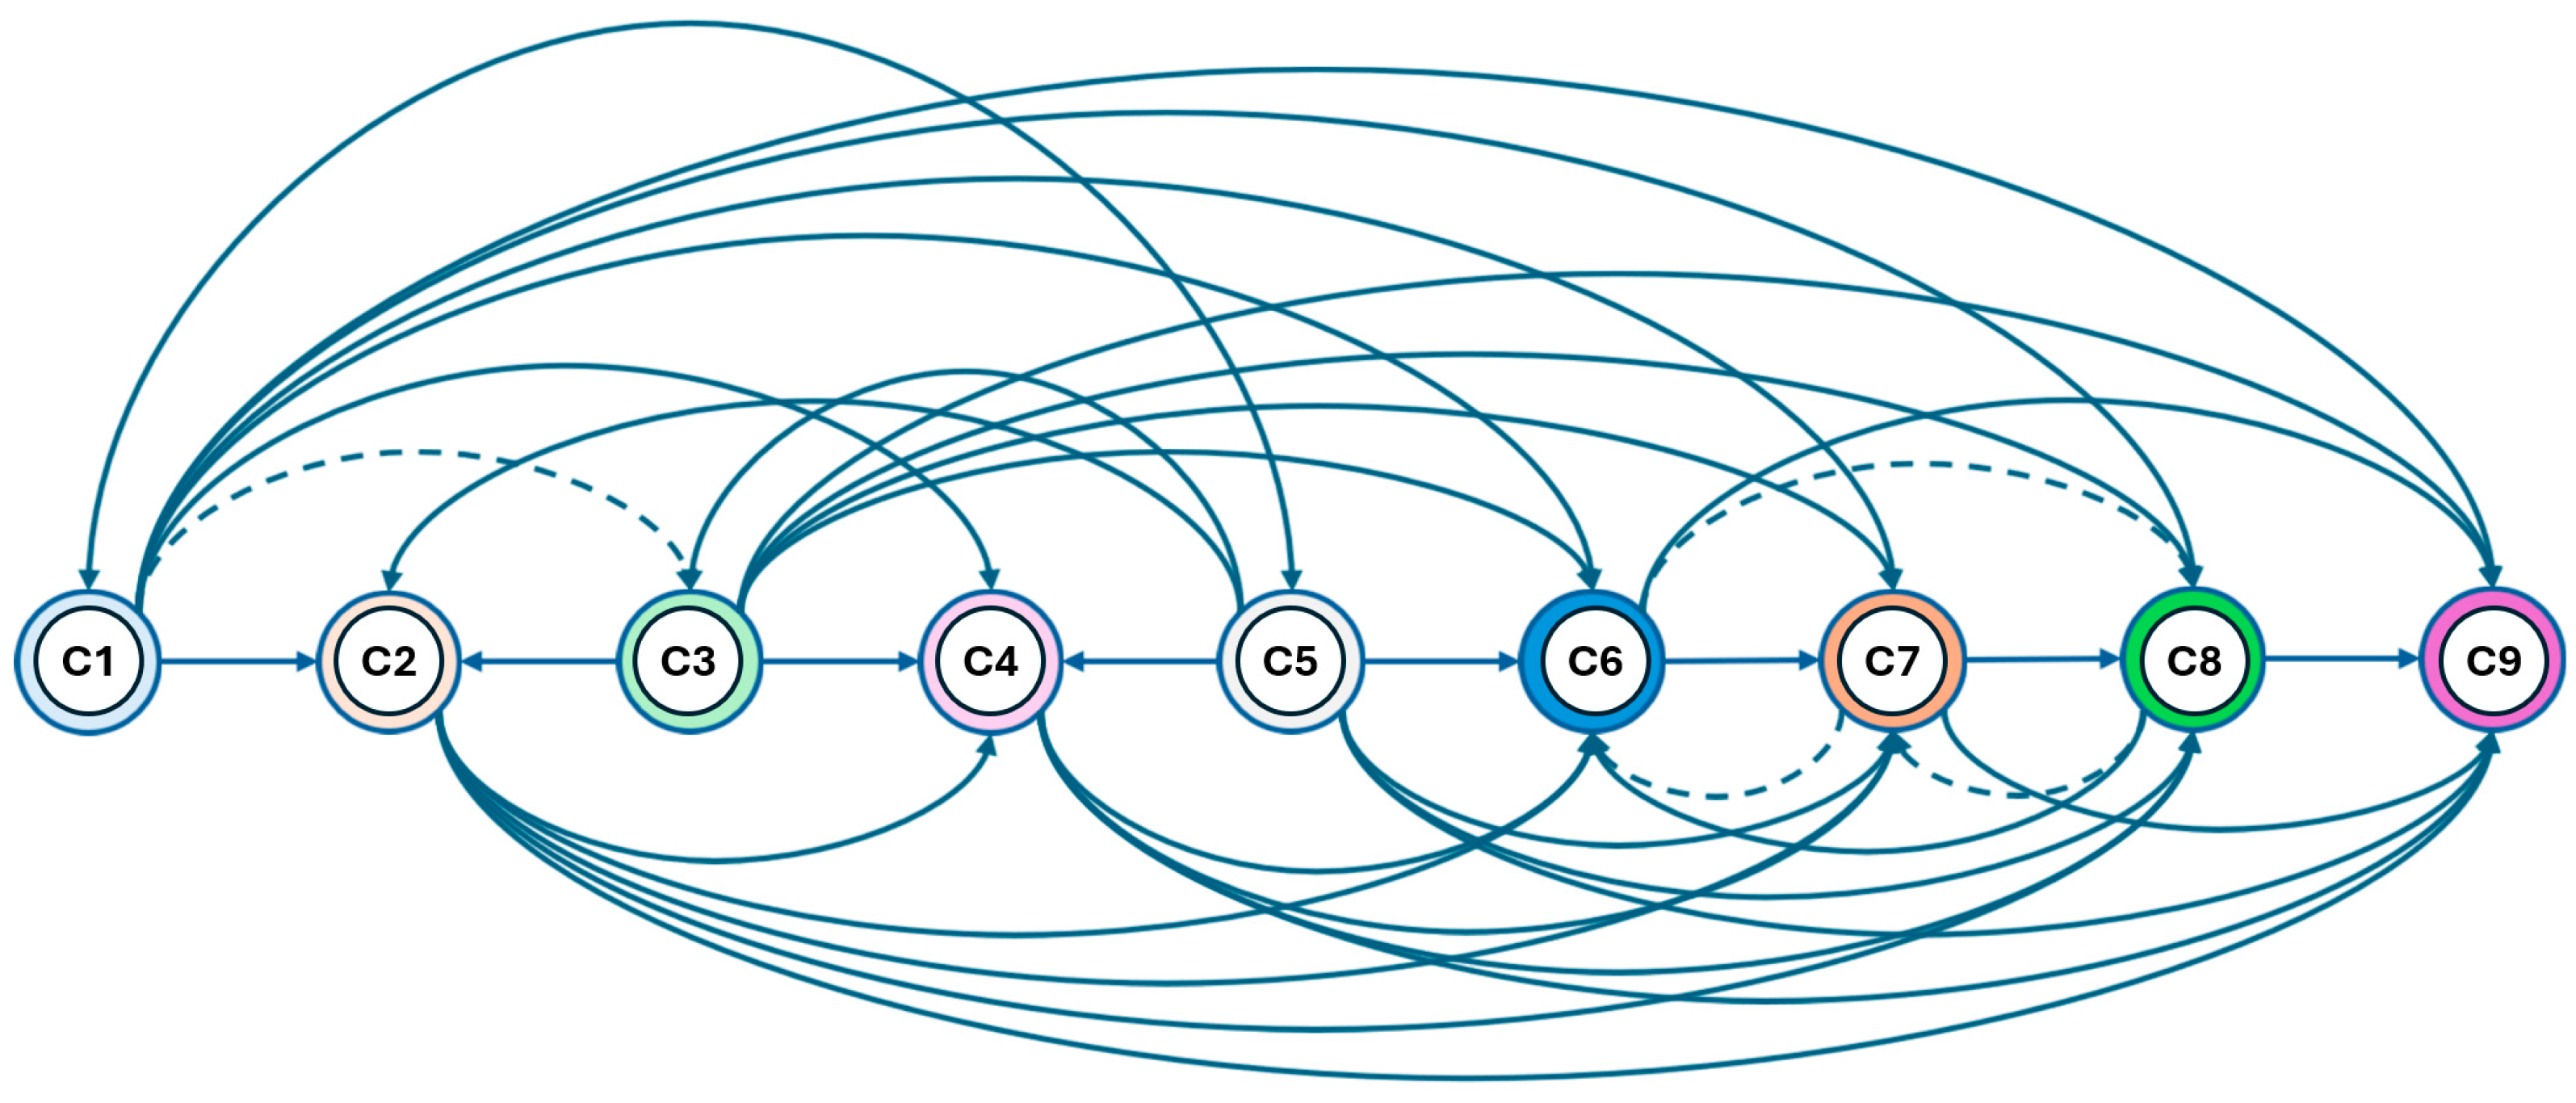
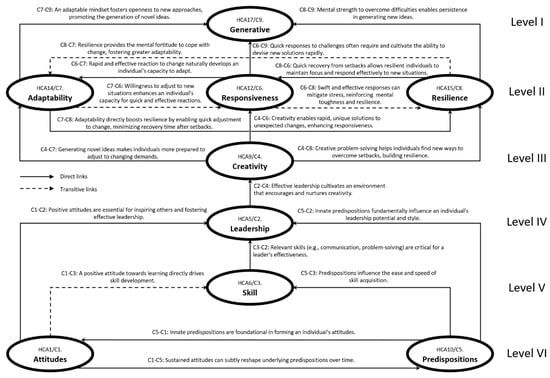
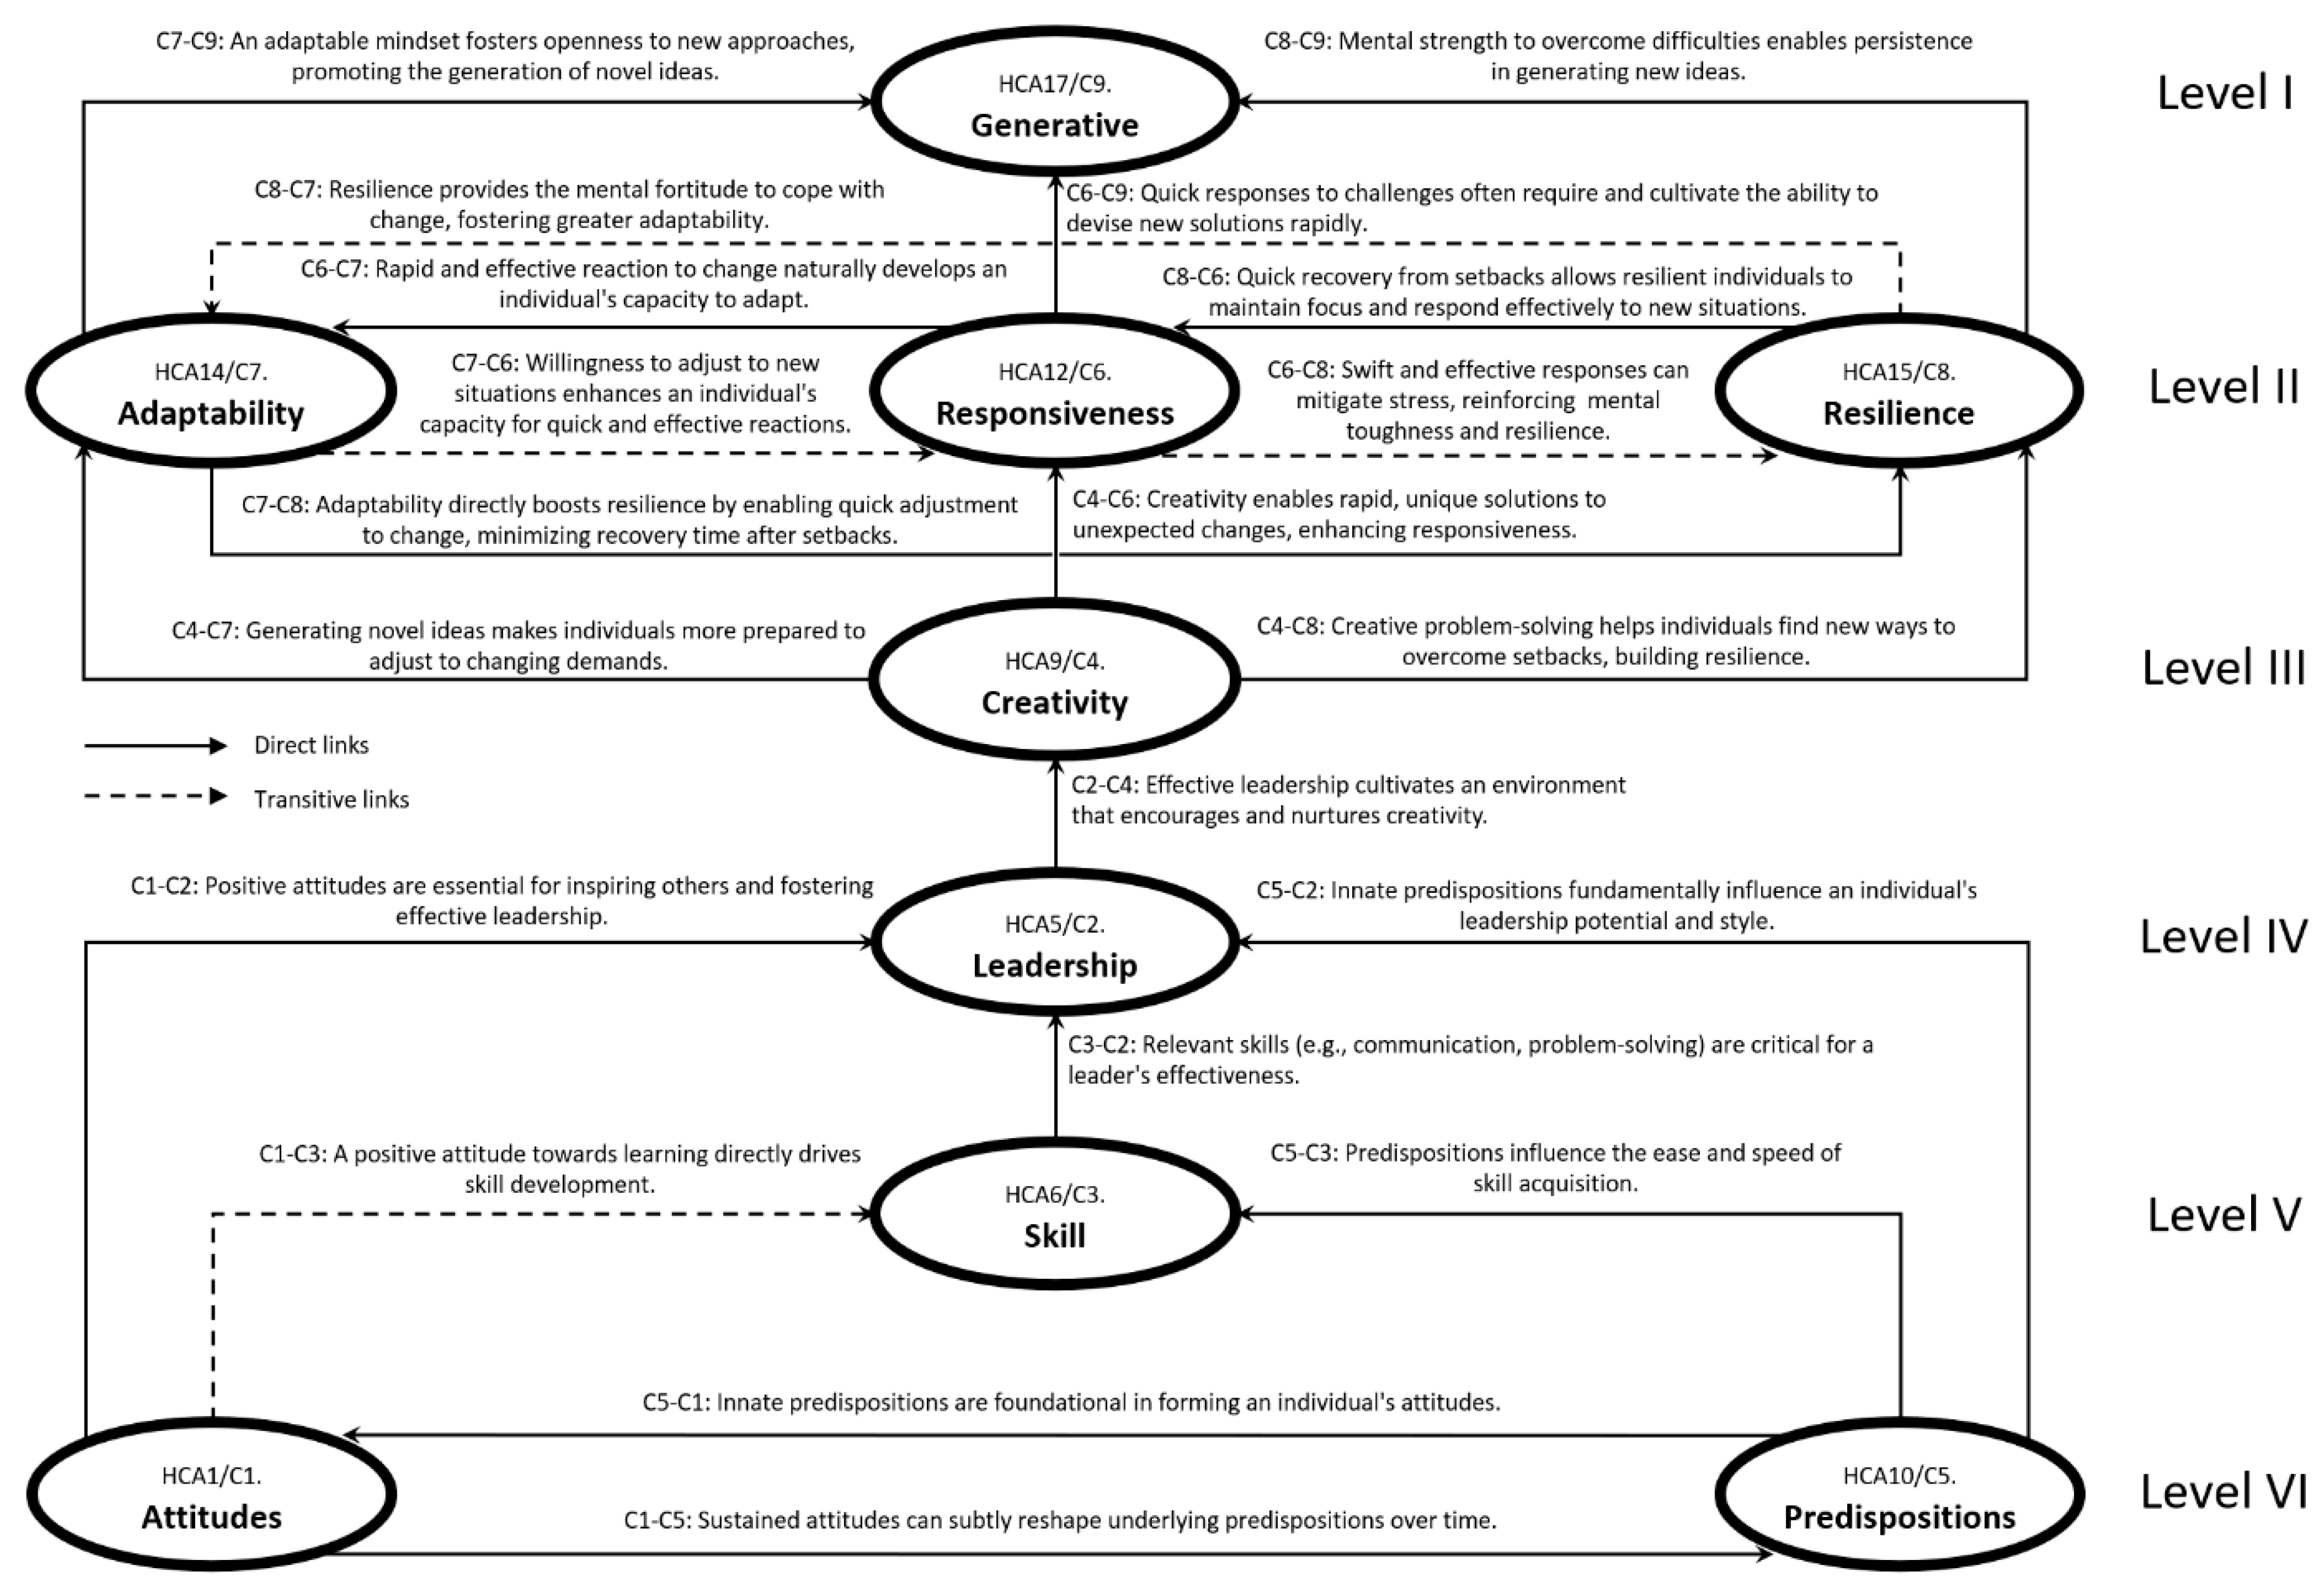
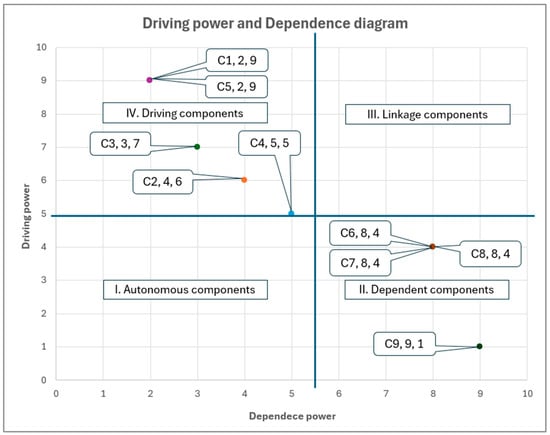
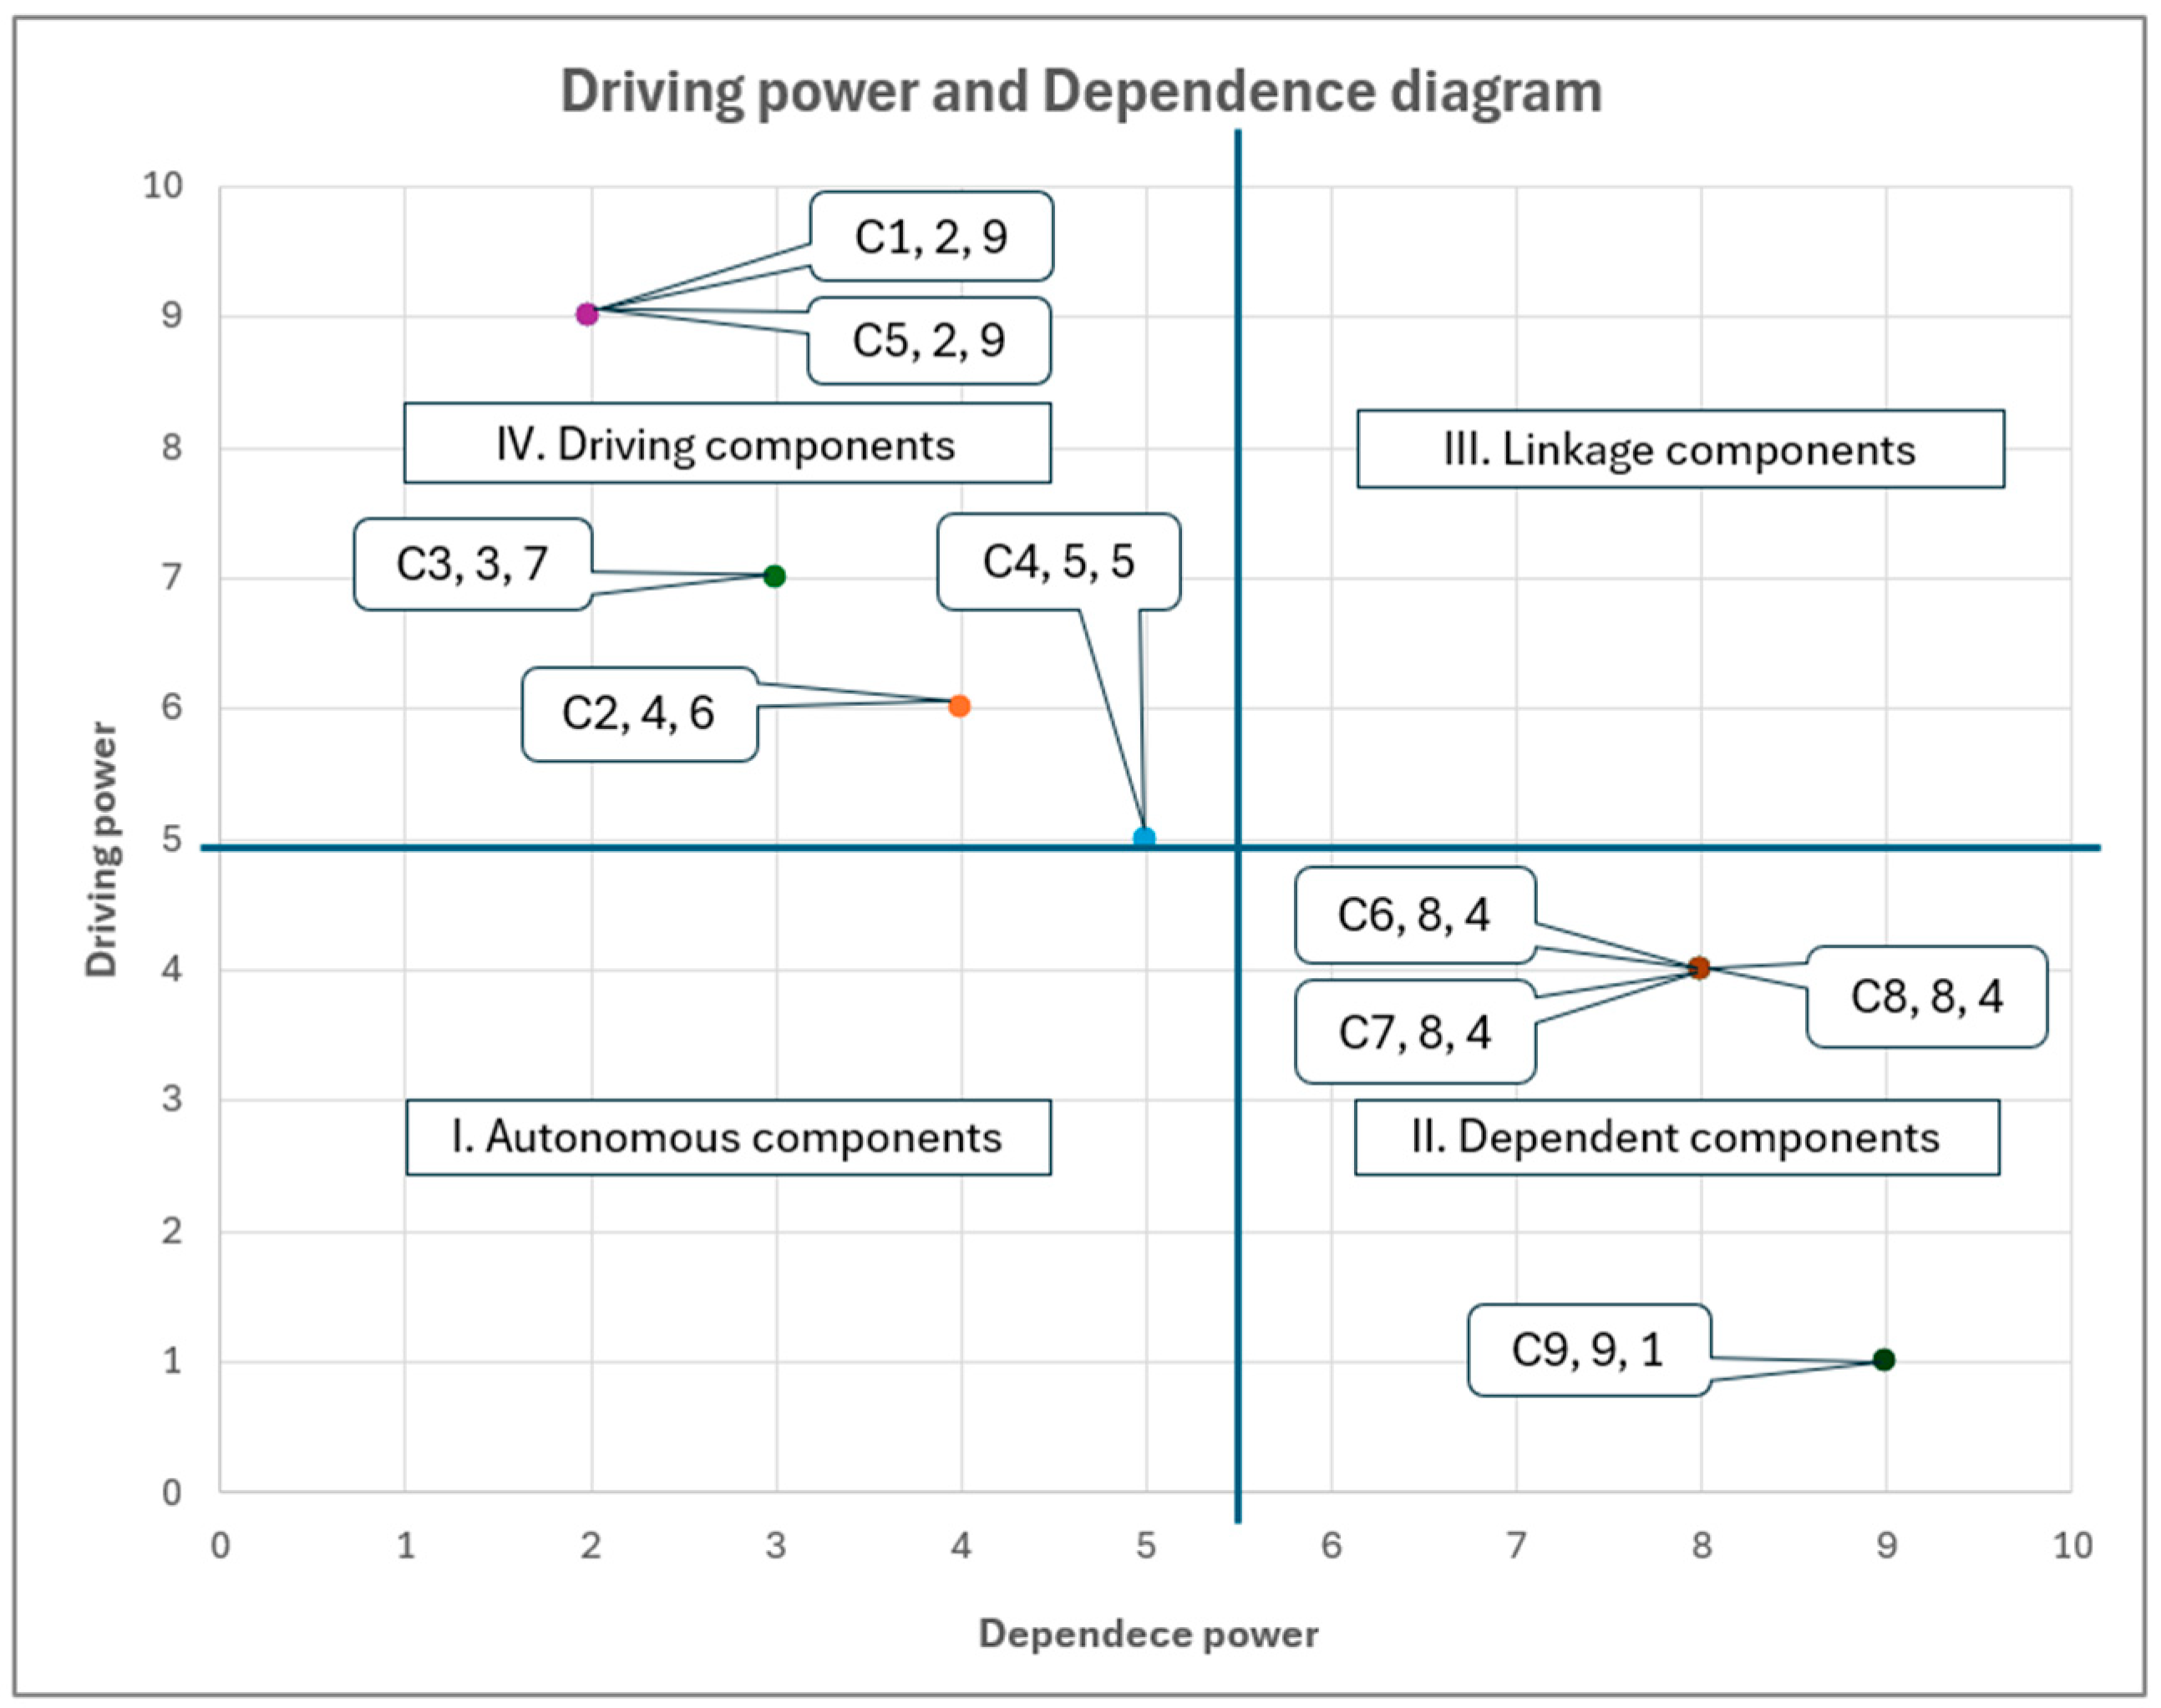

Disclaimer/Publisher’s Note: The statements, opinions and data contained in all publications are solely those of the individual author(s) and contributor(s) and not of MDPI and/or the editor(s). MDPI and/or the editor(s) disclaim responsibility for any injury to people or property resulting from any ideas, methods, instructions or products referred to in the content. |
© 2026 by the authors. Licensee MDPI, Basel, Switzerland. This article is an open access article distributed under the terms and conditions of the Creative Commons Attribution (CC BY) license.