


Abstract
The Urmia Lake Basin (ULB) in northwest Iran faces critical water management challenges significantly impacting agricultural sustainability and regional water–food security. This study presents a novel framework employing multi-objective linear programming to optimize crop selection and resource allocation strategies, addressing critical trade-offs inherent within the water–energy–food (WEF) nexus. Central to this framework is the Water–Energy–Food Nexus Index (WEFNI), which integrates seven pivotal productivity indicators: water consumption indicator (WCI), energy consumption (EC), water mass productivity (WMP), energy mass productivity (EMP), economic water productivity (EWP), and economic energy productivity (EPE). The analysis leverages 22 years of agricultural data (1995–2016) for the primary crops (wheat, barley, sugar beet, alfalfa, corn, and fruits) cultivated within the basin. Three distinct optimization scenarios are assessed: maximizing combined WEF productivity and economic returns (Sc1); maximizing WEF productivity with minimized water consumption (Sc2); maximizing economic returns under stringent water use limitations (Sc3). Results consistently identify corn as the superior crop in terms of water–energy efficiency, whereas sugar beet demonstrated the lowest overall performance. This robust optimization approach elucidates critical trade-offs, providing actionable insights for policymakers managing similar water-stressed regions, although specific regional calibrations are necessary.
1. Introduction
The water–energy–food (WEF) nexus, prominently introduced at the 2008 World Economic Forum in Davos and subsequently reinforced at the 2011 Bonn conference titled “Water, Energy, and Food Security Nexus—Water Resources in the Green Economy”, has emerged as a critical framework for addressing global sustainability challenges [1,2]. This framework intricately connects water security, defined by reliable access to clean water and sanitation [3], with food security through the adequacy of nutrition [3], and with energy security through the provision of reliable and affordable energy [4]. Collectively, the WEF nexus concept underpins global research and policymaking aimed at sustainably managing interconnected resources, which is particularly crucial in the face of intensifying pressures from population growth, climate variability, and intensive land-use transformations [5,6,7].
The escalating challenge of water, energy, and food scarcity in major river basins across the globe, particularly in arid and mountainous agricultural regions like the Urmia Lake Basin (ULB), has been consistently identified as a critical concern in recent the decades’ literature [6,8,9,10,11,12,13,14,15]. These challenges are significantly driven by demographic expansion and rapid socioeconomic changes that have notably characterized Iran throughout the 21st century [15,16,17]. Consequently, intensified environmental, economic, and social pressures have profoundly influenced WEF nexus dynamics, exacerbating water scarcity primarily due to climatic variability, the burgeoning urban development, and increased anthropogenic water use [12,18,19,20].
The Urmia Lake Basin exemplifies the complexity of managing these intertwined resource systems. As the Middle East’s largest inland saltwater lake, Urmia Lake has experienced significant fluctuations in water levels over recent decades, which have disrupted its ecological integrity and regional socioeconomic stability [14]. Factors driving these fluctuations include climate variability, intensive agricultural activities, and elevated irrigation demands [21,22]. Climate change has further aggravated water scarcity within the basin through increased evaporation rates, inconsistent precipitation patterns, and rising drought frequency, significantly destabilizing regional water regimes [13].
Concurrently, rapid agricultural expansion and inefficient irrigation practices have intensified water demands, leading to the unsustainable extraction of both surface and groundwater resources. Historically inadequate management policies have perpetuated these unsustainable practices, necessitating innovative approaches to resource management that integrate economic viability, environmental protection, and social equity [20].
Previous research efforts in Iranian watersheds have extensively explored methodological approaches to manage these complex interactions, emphasizing the significance of crop selection and agricultural management practices as pivotal factors shaping WEF dynamics [22,23]. System Dynamics Models (SDMs) have provided insights into the significant interactions between agricultural water use and lake sustainability, advocating comprehensive and integrative intervention strategies to restore lake levels and ecological balance [15,24].
Furthermore, studies by Ravar et al. [25] and Kamrani, Roozbahani, and Shahdany [23] have demonstrated the importance of systemic frameworks and operational shifts in effectively managing sectoral water distribution and agricultural practices. These studies highlight the potential for innovative methodologies to optimize resource management strategies within the context of the WEF nexus. Additionally, El-Gafy [26] introduced a water–energy–food nexus index (WEFNI), which has been successfully applied at the national level in Egypt, further validating the practical utility and adaptability of nexus frameworks for strategic crop management and optimal resource allocation.
We address this gap by developing a multi-objective linear programming framework for the ULB. Multi-objective linear programming optimizes competing objectives—economic profitability, water conservation, and energy efficiency—under realistic agricultural constraints. We develop and evaluate optimization scenarios to identify sustainable crop selection and resource allocation strategies. The analysis examines transitions to high-efficiency crops (corn and fruits) and evaluates water-conserving agricultural practices.
This study addresses critical resource management challenges in the Urmia Lake Basin through three primary research objectives: (1) developing a comprehensive multi-objective linear framework that optimizes competing agricultural objectives under realistic constraints, (2) implementing the WEFNI and integrating the basin main crops’ productivity indicators to systematically evaluate crop performance across water, energy, and economic dimensions, and (3) assessing three distinct optimization scenarios—maximizing combined WEF and economic productivity, maximizing WEF efficiency with water conservation, and maximizing economic returns under stringent water limitations. This integrated approach elucidates critical trade-offs inherent within nexus dynamics, providing evidence-based decision-support tools for sustainable agricultural transitions in water-stressed regions requiring strategic resource allocation and crop diversification strategies.
2. Materials and Methods
2.1. Study Area
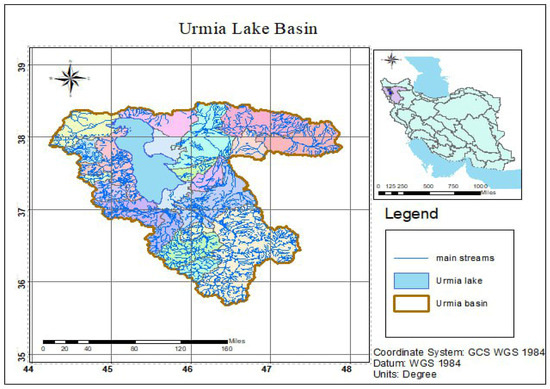
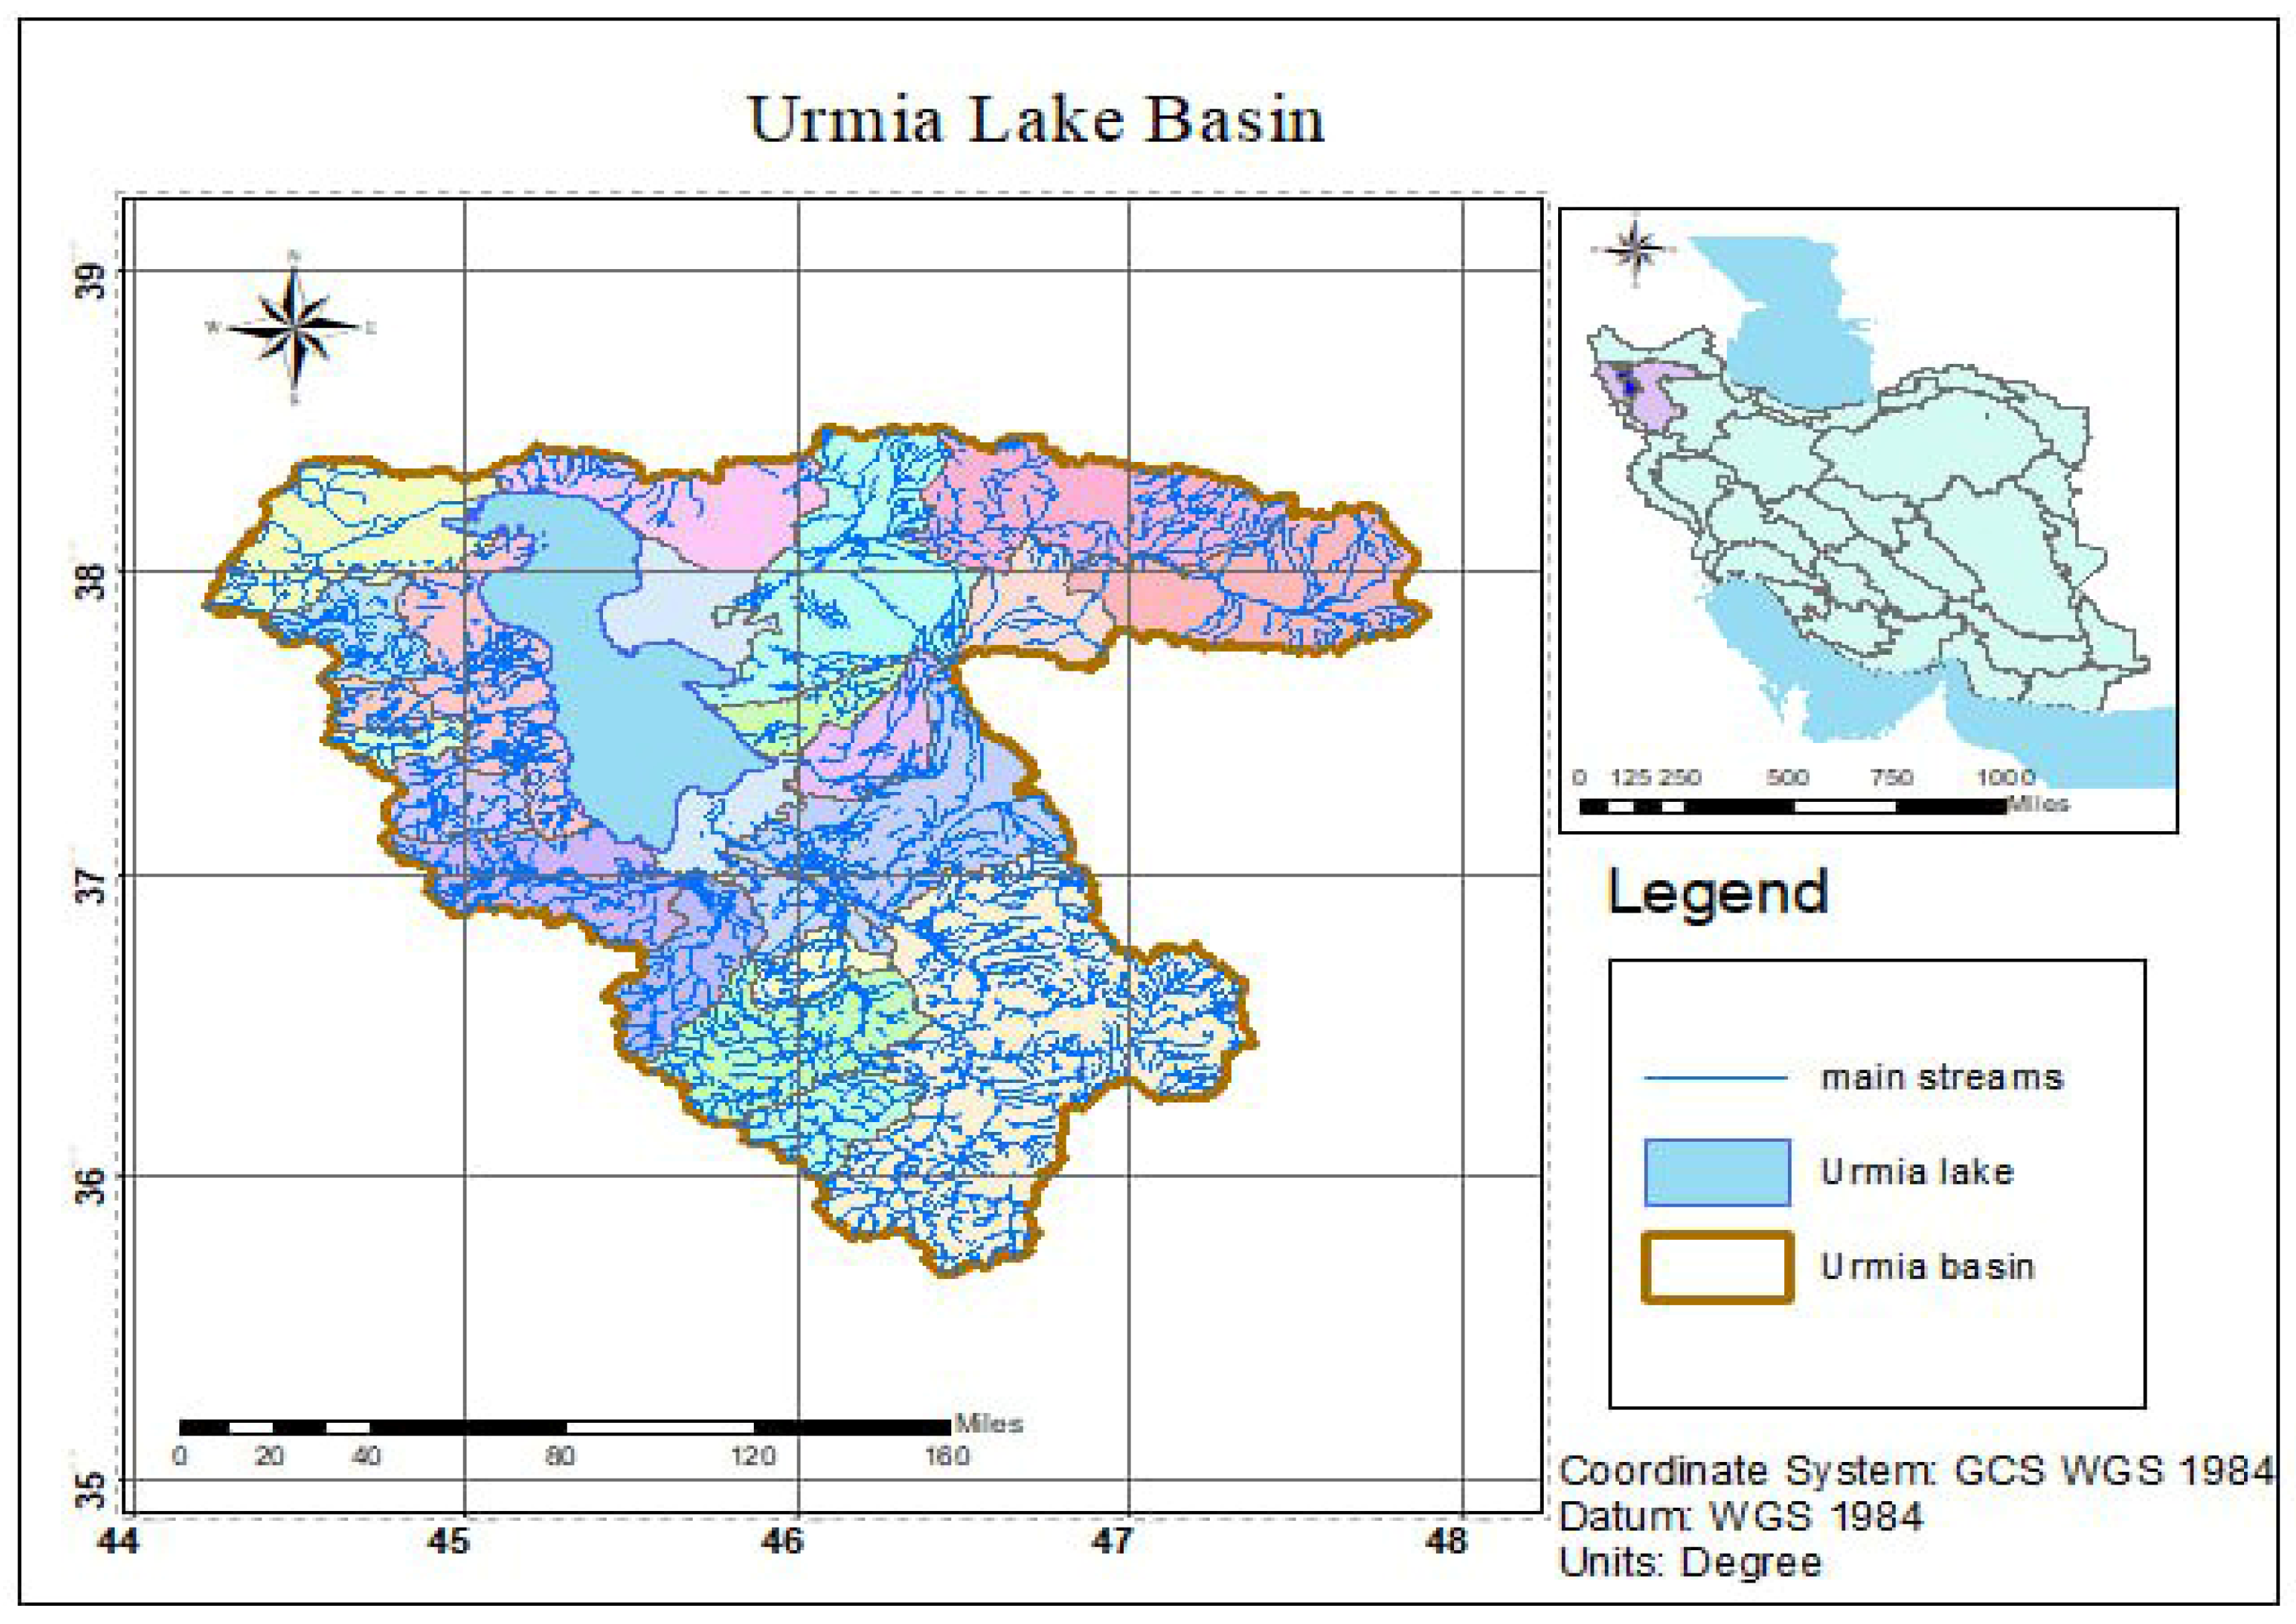
The Urmia Lake Basin spans approximately 200 square kilometers in western Iran and ranks among the nation’s six major drainage systems (Figure 1). This watershed supports over seven million inhabitants whose livelihoods depend directly on water–energy–food nexus dynamics [15].
Figure 1.
Urmia Lake Basin area.
The region experiences a continental climate shaped by the Zagros mountain range’s orographic effects. Temperatures vary dramatically between seasons, dropping to −20 °C in winter and reaching 40 °C during the summer months. Annual precipitation ranges from 200 to 300 mm with significant temporal and spatial variation, which is characteristic of the basin’s semi-arid environment [24].
Surface water from an extensive river network provides the lake’s primary water source. Twenty-one perennial and thirty-nine seasonal tributaries contribute approximately 80% of annual inflows. Agricultural production focuses on ULB major crops: wheat, barley, sugar beet, alfalfa, corn, and various supplementary species. We selected these crops based on their regional economic importance and significant influence on nexus interactions.
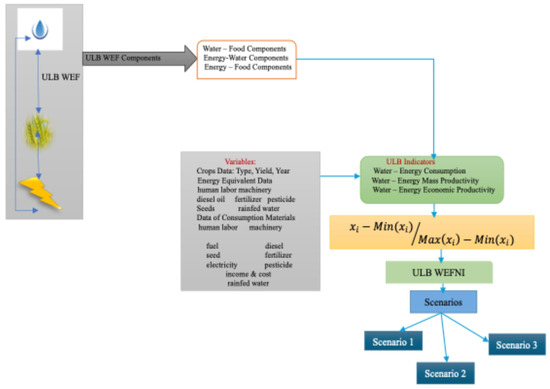
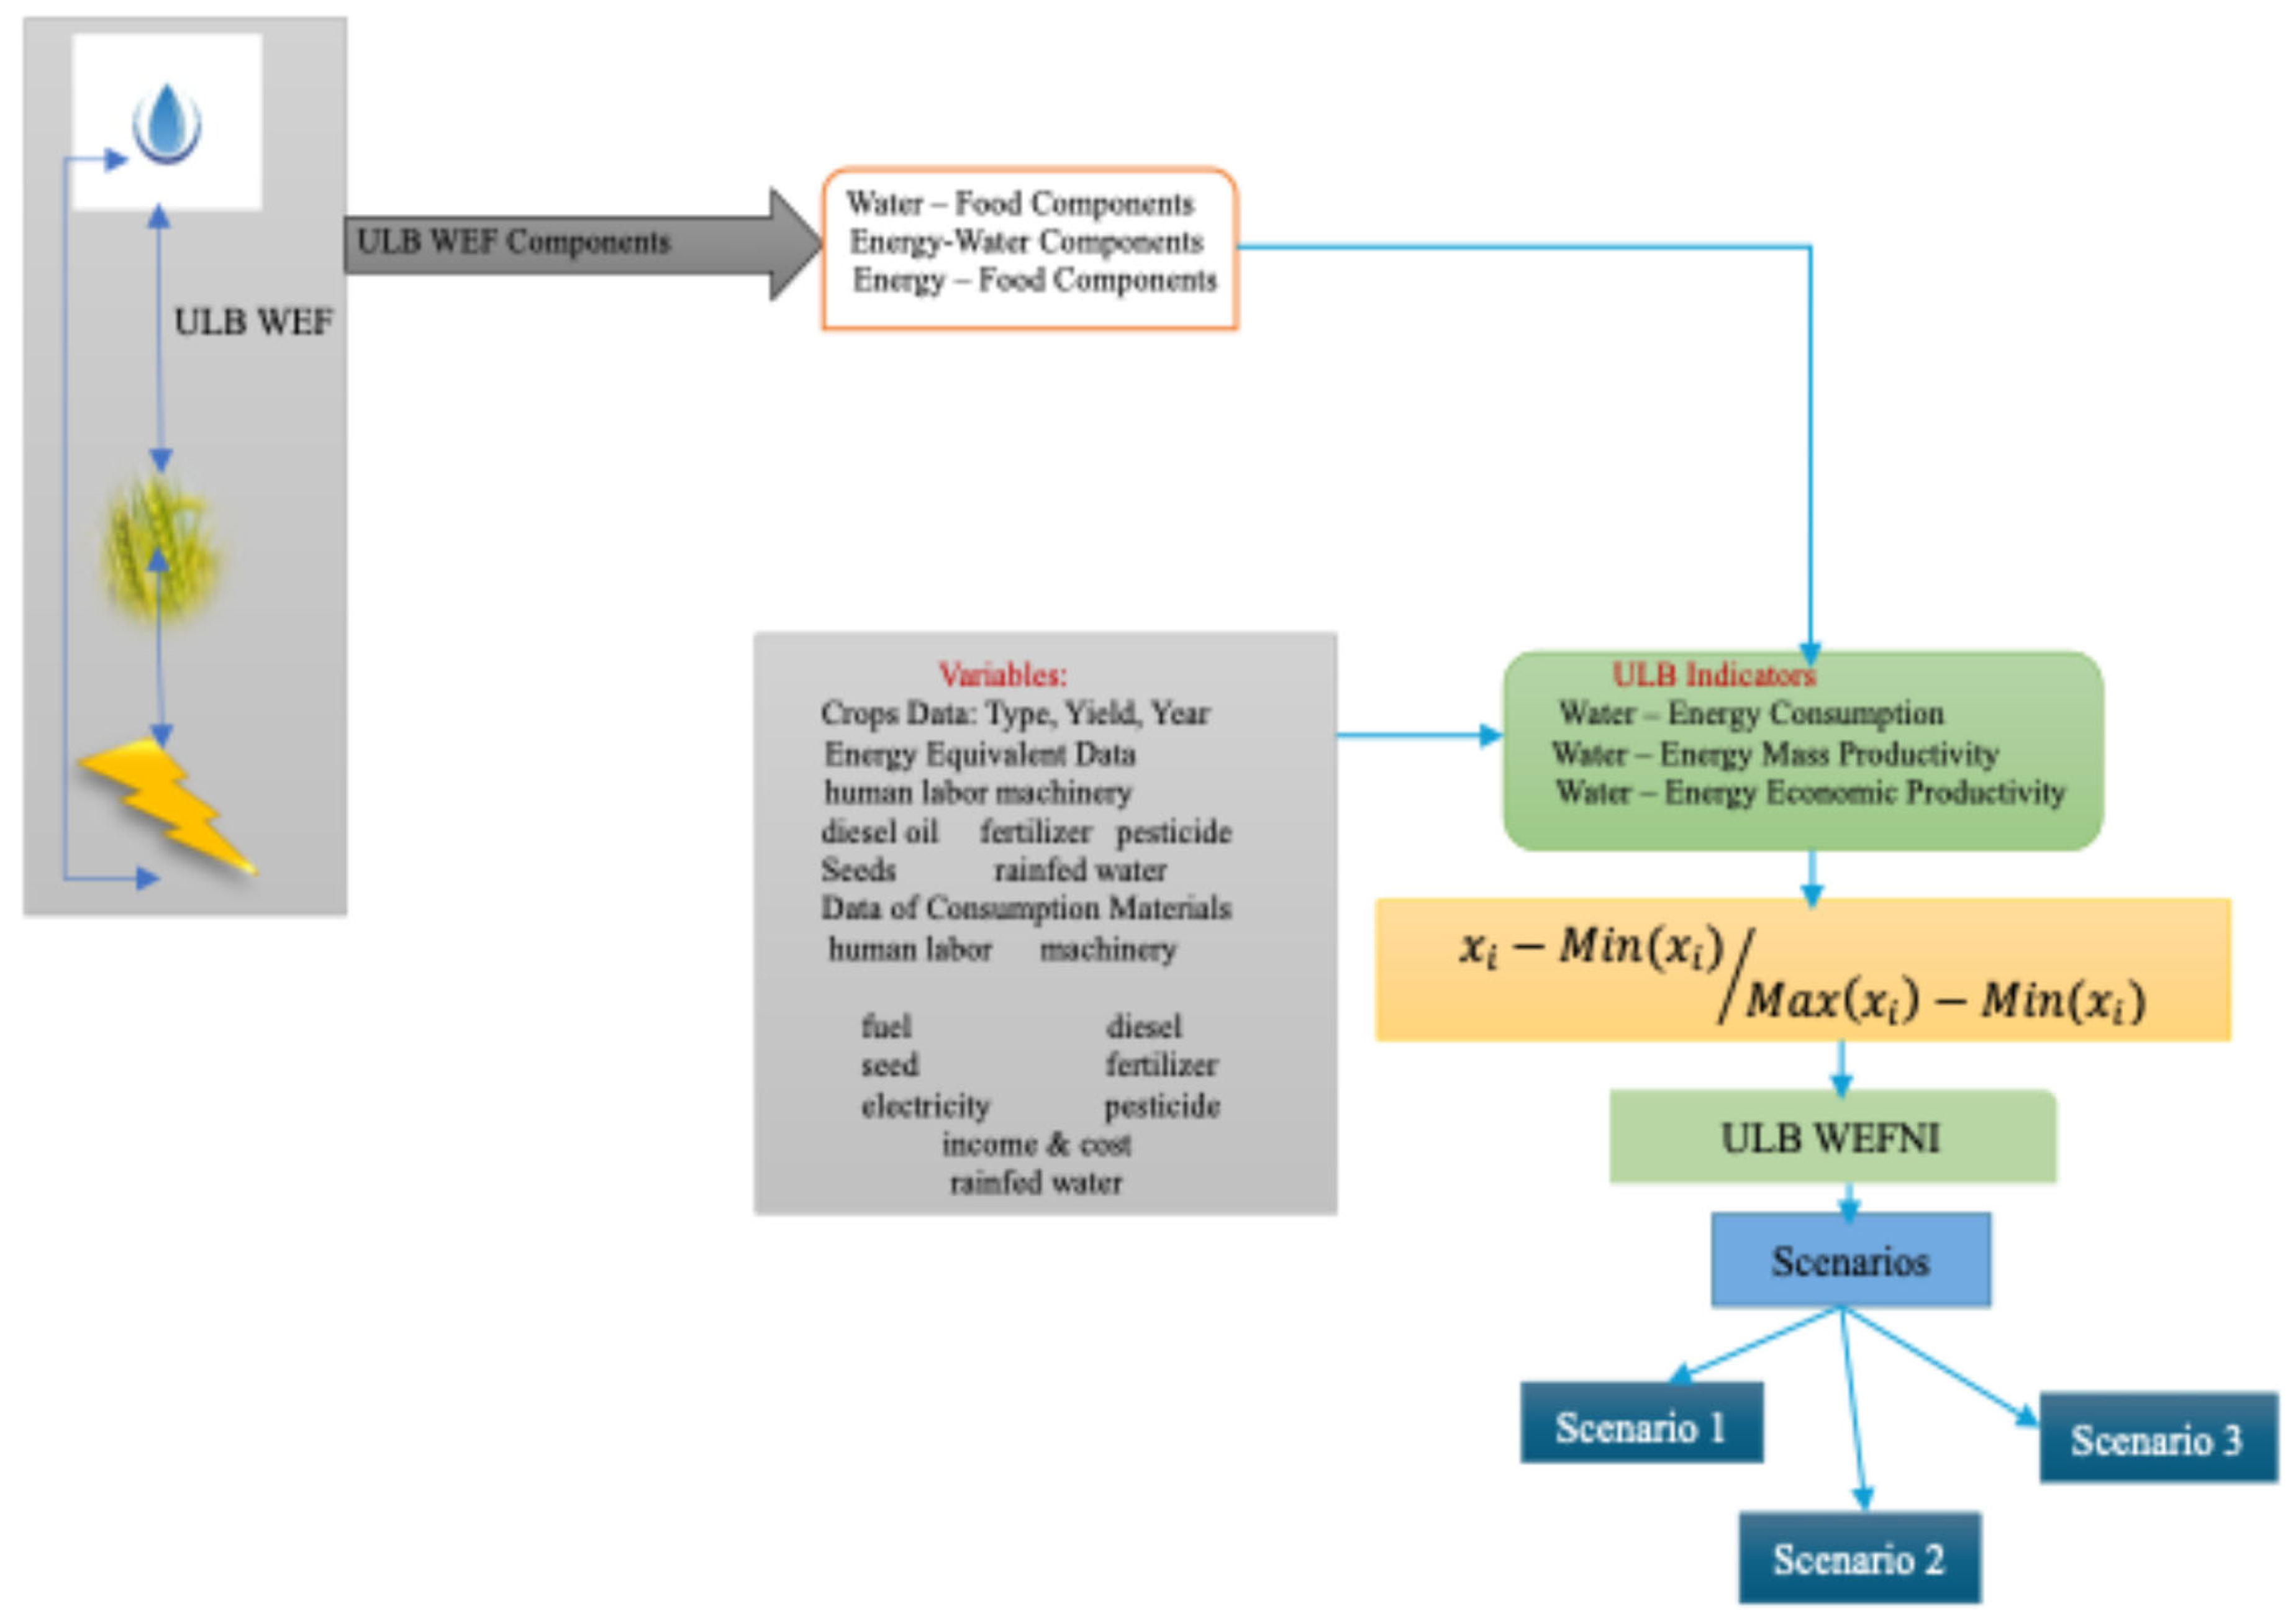
This research evaluated these agricultural systems for water consumption patterns, energy requirements, and food productivity to understand the complex interdependencies within WEF dynamics at the basin scale. Data collection drew from multiple governmental and institutional sources, including the Iranian Ministry of Energy, Statistical Center of Iran, Iran Central Bank, the National Meteorological Organization, and Iran Ministry of Agriculture. This multi-source approach provided complete coverage of water resources, agricultural productivity, socioeconomic indicators, and energy consumption patterns required for robust nexus analysis (Figure 2).
Figure 2.
Urmia Lake Basin Water–Energy–Food Nexus Index assessment flowchart. The basin WEF Nexus Index assesses multiple layers through research methodology. The approach examines integrative framework components across water–food, energy–water, and energy–food interconnections, demonstrating complex relationships. Data collection includes crops, crops yields, and energy inputs: human labor, machinery, diesel, fertilizers, pesticides, seeds, and rainfall. Indicators measure water consumption, energy use, mass calculations, and economic productivity. The ULB-WEFNIs integrated assessments across three scenarios.
2.2. Indicators
2.2.1. Definition
This study uses six key indicators that capture the relationships within the water–energy–food nexus. We selected these indicators to measure resource use efficiency, productivity, and economic performance in this environmentally critical region.
The water consumption indicator (WCI) measures total water use across the basin, including irrigation for agriculture and consumption by municipalities and industry. This baseline measurement helps us understand how water resources are currently allocated throughout the region [26].
Energy consumption (EC) tracks all energy use within the basin boundaries. We focus particularly on the energy required for farm machinery, irrigation systems, and crop processing. This comprehensive measurement allows us to assess energy intensity across different agricultural systems [27].
Water mass productivity (WMP) calculates the ratio between agricultural output and water input. This efficiency measure reveals how effectively current water management practices perform and where improvements might be possible [27].
Energy mass productivity (EMP) applies the same efficiency concept to energy use, measuring crop output per unit of energy consumed. We use this indicator to evaluate how well farming technologies perform and to identify where energy savings are achievable [26,27].
Economic water productivity (EWP) connects resource use to financial outcomes by calculating economic returns per unit of water consumed. This allows us to analyze the cost-effectiveness of water-intensive farming practices [26,27,28].
Economic productivity of energy (EPE) applies the same economic analysis to energy use, measuring financial returns per unit of energy consumed. This indicator helps guide investment decisions and policy development for energy-dependent agricultural operations [26,27,28].
Research combined these indicators to create the Water–Energy–Food Nexus Index (WEFNI), designed specifically for ULB conditions. The index helps stakeholders compare different options and find farming strategies that use fewer resources while maintaining high productivity and economic returns. The WEFNI provides a practical tool for policymakers and agricultural planners working in the region. Local governance can use this approach to develop sustainable farming practices that protect the broader Urmia Lake ecosystem while meeting agricultural needs [26,27,28].
2.2.2. Energy Consumption Indicator
We calculate energy consumption for a crop (c) at a certain time (t) using Equation (1). Agricultural energy use includes both direct inputs (fuel, electricity) and indirect inputs (energy embedded in fertilizers and chemicals [26].
where qh, qm, qd, qf, qp, qs, and qw are the energy equivalents of human labor (J/h), machinery (J/h), diesel oil (J/L), fertilizer (J/kg), pesticides (J/kg), seeds (J/kg), and irrigated water (J/m3) inputs in crop (c) production. hc,t, mc,t, dc,t, fc,t, pc,t, sc,t, and wc,t are human labor (h/ha), machinery (h/ha), diesel fuel (L/ha), electricity (kWh/ha), fertilizer (kg/ha), pesticides (kg/ha), seeds (kg/ha), and irrigated water (m3/ha) inputs in crop c production at time Table A1, [26].
Considering both direct and indirect energy inputs, this comprehensive equation provides a holistic view of energy consumption within agricultural practices in the ULB. It serves as a reliable measure for devising energy-efficient strategies to optimize the WEF nexus in the basin [26,27,28].
2.2.3. Water Consumption Indicator
To assess the efficiency of water utilization in the ULB, it is essential to compute the water consumption indicator (Wc,t) which is related to the water consumption (m3) per hectare of a particular crop (c) at a given time (t) [26,27]. This metric, as defined in Equation (2), represents the amount of water consumed (in cubic meters) per hectare of a particular crop (c) at a given time (t). The formulation of this indicator provides valuable insights into the patterns of water usage across different crop productions, thereby helping to guide sustainable water management strategies in the region [26,27].
Wc,t (m3/ha) = Water consumption indicator
2.2.4. Water and Energy–Mass Productivity Indicator
The ULB water and energy–mass productivity indicators are integral to understanding the effective valuation of food in the region, as highlighted in the work of [27]. These indicators can provide crucial insights into the efficiency of water and energy usage for crop production. Basin water and energy–mass productivity indicators are used for food valuation [27]. Water mass productivity at time t (W_(pro,t) ton/m3) is calculated using Equation (3).
where Y_(c,t) is the crop’s yield (c) at time (t); W_(c,t) is the water consumption per hectare of crop (c) at time (t). Also, Equation (4) shows that the ULB energy–mass productivity can be calculated using the ratio between the yield of the crop (c) and energy consumption per hectare of crop (c) at time (t).
where E_(p,t) is energy–mass productivity at time t (Cal/MJ), Y_(c,t) is the yield of crop c (Cal/ha) and the energy consumption per ha of crop (c) at time (t) (MJ/ha). These indicators serve as fundamental metrics to understand and enhance the efficiency of agricultural practices in the ULB. By optimizing water and energy utilization, we can aim for a more sustainable future for the region and its stakeholders [26,27].
W_(p,t) = Y_(c,t)/W_(c,t)
E_(p,t) = Y_(c,t)/(E_(c,t))
2.2.5. Water and Energy Economic Productivity Indicators
Equation (5) was used to estimate water productivity [26,28].
where N_(c,t) is the return per hectare from crop c ($/ha) at time t and C_(c,t) is the cost of inputs used per hectare for cultivating crop (c) at time t. Also, Equation (6) was used to estimate economic energy productivity [26,28].
W_(EV,t) = N_(c,t) − (C_(c,t))/W_(c,t)
E_(EV,t) = N_(c,t) − C_(c, t)/E_(c, t)
2.2.6. Water–Energy–Food Nexus Index (WEFNI)
The ULB water–energy–food interconnection index based on economic efficiency can be presented as follows: [5,26].
where Xi is WEFNI’s standardized indicator i, wi is the weight applied to each component, and n is the number of WEFNI variables. Zero is assigned to the lowest WEFNI, and one is assigned to the highest WEFNI value. We employed an equal-weighting scheme (wᵢ = 1/6 ≈ 0.167 for each of the six indicators) for the following methodological justifications. First, equal weighting reflects the foundational philosophy of the WEF nexus paradigm, which emphasizes the intrinsic interconnectedness and equivalent strategic importance of water security, energy security, and food security as inseparable components of sustainable development [1,2,7]. Assigning differential weights without empirical stakeholder preference data or region-specific policy mandates would introduce arbitrary hierarchies, potentially biasing outcomes toward predetermined conclusions. Second, equal weighting represents a conservative, transparent methodological choice that enhances reproducibility and transferability to other water-stressed basins where stakeholder preferences may differ. Third, this approach follows established precedent in nexus literature, with El-Gafy’s [26] application at national scale in Egypt and Sadeghi et al.’s [27] watershed-level implementation in Iran.
To verify the robustness of this weighting approach, we conducted comprehensive sensitivity analysis testing five alternative weighting scenarios representing diverse stakeholder priorities (see Section 4.4). Results demonstrate that crop performance rankings remain stable across all tested weight configurations, with variations of ±30% in individual weights, producing less than 15% change in WEFNI values for top-performing crops. This stability confirms that the equal-weighting assumption does not bias our optimization recommendations and that findings remain valid across reasonable ranges of stakeholder preference structures.
The WEFNI value of zero is assigned to the lowest-performing observation within the dataset, while a value of one represents optimal performance across all dimensions. This standardized index enables direct comparison of crop sustainability performance and provides quantitative foundation for the multi-objective optimization scenarios developed in Section 4.
2.2.7. Total Water and Energy Consumption Footprint
Based on Equation (8), the total water () of the production of the crop per year is calculated according to the following [26]:
The total energy (Et J/year,) of the crop production per year is calculated according to Equation (9). v is the number of crops under study [26].
2.2.8. Indicators Standardization
The WEFNI indicators require normalization to eliminate dimensional differences and enable meaningful aggregation across diverse measurement units. Following the methodology by El-Gafy [26], we applied the Min–Max normalization technique using two distinct equations depending on the indicator’s optimization direction.
For productivity indicators where higher values represent better performance (WMP, EMP, EWP, and EPE), we applied the following equation:
For consumption indicators where lower values represent better performance (WCI and EC), we applied Equation (11):
Where Xi represents the normalized indicator value, xi is the actual indicator value, and Min(xi) and Max(xi) are the minimum and maximum values within the dataset for indicator i.
This dual-equation approach ensures that all normalized indicators contribute positively to the WEFNI, with values approaching 1.0 indicating superior performance regardless of whether the underlying metric measures consumption or productivity [26]. Water and energy consumption indicators are inverted through Equation (11) so that lower resource consumption yields higher normalized scores, while productivity indicators maintain their natural positive relationship through Equation (10).
The normalization process produces standardized values ranging from 0 to 1, where higher normalized values consistently represent more sustainable performance across all indicators. This methodological consistency enables the meaningful aggregation of diverse metrics within the WEFNI framework, supporting robust comparative analysis across different crops and temporal periods [27].
2.2.9. Scenarios’ Desigen
The complex confluence of economic-, ecological-, and resource-based interests within agricultural systems requires innovative approaches to reconcile competing demands and optimize sustainability outcomes. To address these multifaceted challenges, this research employs a multi-objective linear programming framework that systematically balances trade-offs among water conservation, energy efficiency, and economic viability within the water–energy–food nexus paradigm. This model aims to find the optimal allocation of cultivated areas among the studied crops in the basin, balancing factors such as productivity, profitability, and resource consumption. The model includes a series of objective functions mathematically formulated at Table 1.
Table 1.
Scenario equations.
In Equations (12)–(14), ψ1, ψ2, and ψ3 represent the objective functions to be optimized within the constraints delineated by Equations (15) and (16). They incorporate integral aspects of agricultural production: the Water–Energy–Food Nexus Indicator (WEFNIi), net return (NRi), and water consumption (Wi) for each crop (i). The variable’s ST, Sn, and Sx represents the cultivated area of the crop (i), the total cultivated area, and the minimum and maximum feasible cultivated area for each crop (i), respectively. With these parameters defined, the model was applied to three distinct scenarios, each reflecting a different strategy of resource management in the basin:
Sc1: Maximize ψ1 and maximize ψ2. In this scenario, the focus is on achieving the highest possible water–energy food nexus productivity and economic returns, symbolizing a strategy leaning towards intensive, profitable farming.
Sc2: Maximize ψ1 and minimize ψ3. This scenario prioritizes WEF nexus productivity while seeking to limit water consumption, reflecting a sustainable agricultural practice that carefully manages water resources.
Sc3: Maximize ψ2 and minimize ψ3. In this scenario, the goal is to maximize the economic return while minimizing water consumption, representing an economical and eco-conscious strategy.
These optimization scenarios (Table 2) provide quantitative analytical frameworks for evaluating resource management trade-offs within ULB’s agricultural systems, systematically identifying solutions that balance economic viability, environmental sustainability, and resource efficiency constraints. The scenario-based analysis reveals critical thresholds where competing objectives intersect, enabling identification of sustainable agricultural transitions that maintain productivity while reducing water and energy consumption. These findings advance understanding of WEF nexus dynamics in water-stressed basins and provide an empirical foundation for evidence-based policy interventions addressing agricultural sustainability under resource-scarce conditions.
Table 2.
Scenario functions.
3. Results and Discussion
3.1. Water and Energy Consumption
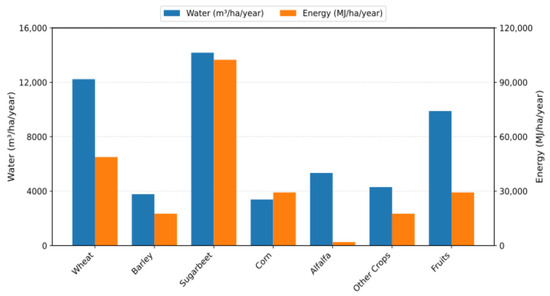
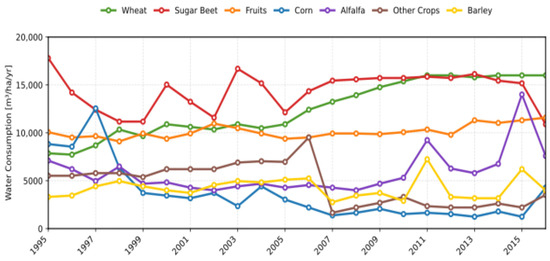
The water consumption analysis across seven major crop categories reflects a crop’s response to the basin’s continental climate and hydrological constraints. Sugar beet demonstrated the highest water consumption, averaging 14,327 m3/ha/year, which is attributable to extended phenological development requirements and intensive irrigation scheduling throughout critical growth phases under basin conditions. Wheat exhibited moderate consumption levels averaging 12,000 m3/ha/year with temporal stability supporting national food security priorities within Iran’s agricultural policy framework. Fruits showed intermediate consumption rate at approximately 8000 m3/ha/year with notable inter-annual variability corresponding to perennial crop management cycles. Conversely, corn, alfalfa, and barley clustered within lower consumption ranges of 4000–5000 m3/ha/year, indicating a minimum water consumption to ULB’s water-limited environment which is characterized by a 200–300 mm annual precipitation range.
Temporal analysis spanning 1995–2016 reveals specific policy-driven consumption transitions, particularly barley’s dramatic increase from pre-2007 baseline levels of 7500–12,000 m3/ha/year to post-2007 stabilization of near 16,000 m3/ha/year. This transformation corresponds directly with regional agricultural intensification policies, drought adaptation measures, and Iran’s strategic crop (wheat and barley) self-sufficiency initiative, promoting expanded irrigated practices across the region. Other crops experienced marked consumption reduction from peak levels of 10,168 m3/ha/year to 1361 m3/ha/year post-2007, indicating strategic resource reallocation toward food security priorities and abandonment of marginal agricultural lands within the basin’s 200 km2 cultivated area. These divergent trajectories illuminate critical trade-offs between water conservation imperatives for Urmia Lake’s ecosystem preservation and agricultural intensification objectives supporting the basin’s seven million inhabitants.
Sugar beet’s excessive water demands conflict with basin water availability constraints, while corn’s efficiency demonstrates adaptation to water-limited conditions prevalent across the watershed. The analysis reveals a strong interdependence between mechanization and irrigation, as sugar beet simultaneously exhibits high demand for both energy and water, thereby undermining basin-wide resource efficiency under current hydrological stress conditions. These baseline consumption metrics serve as critical inputs within the WEFNI framework, enabling the design of optimization scenarios that prioritize productivity under water-constrained conditions. Such strategies are essential for sustaining agricultural output while safeguarding the ecological integrity of the Urmia Lake ecosystem (Figure 3 and Figure 4).
Figure 3.
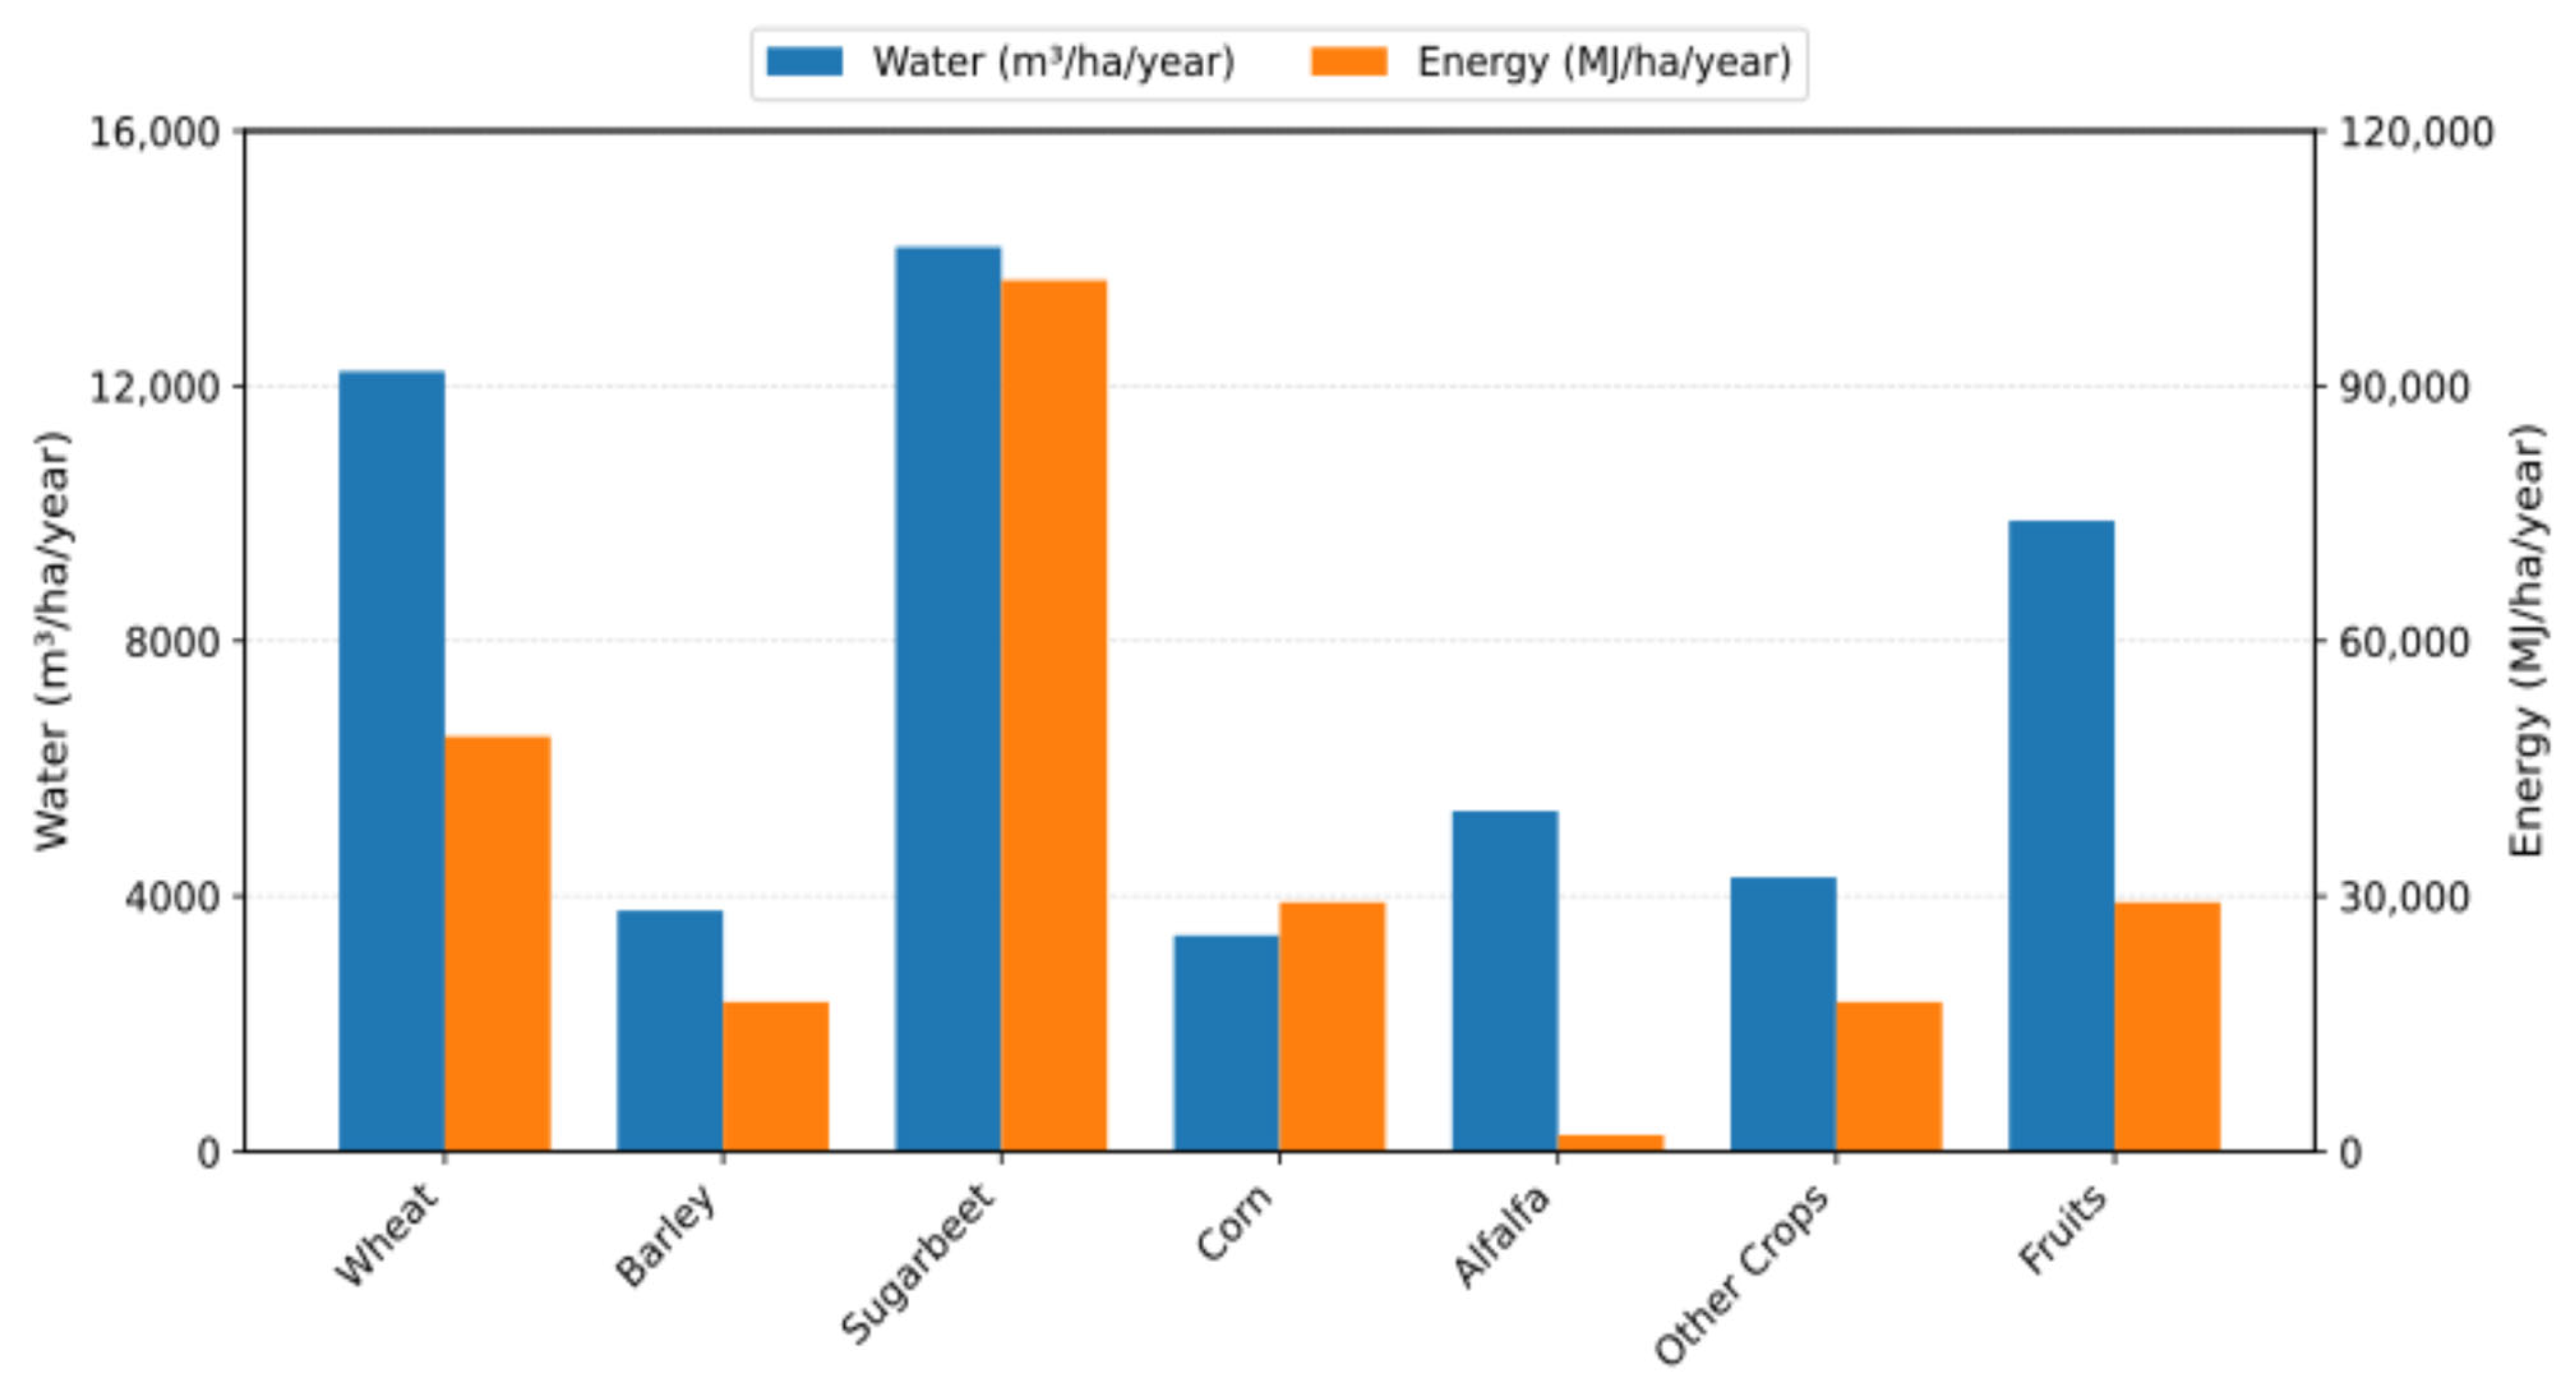
Comparative assessment of average annual water and energy consumption across major crops (1995–2016).
Figure 4.
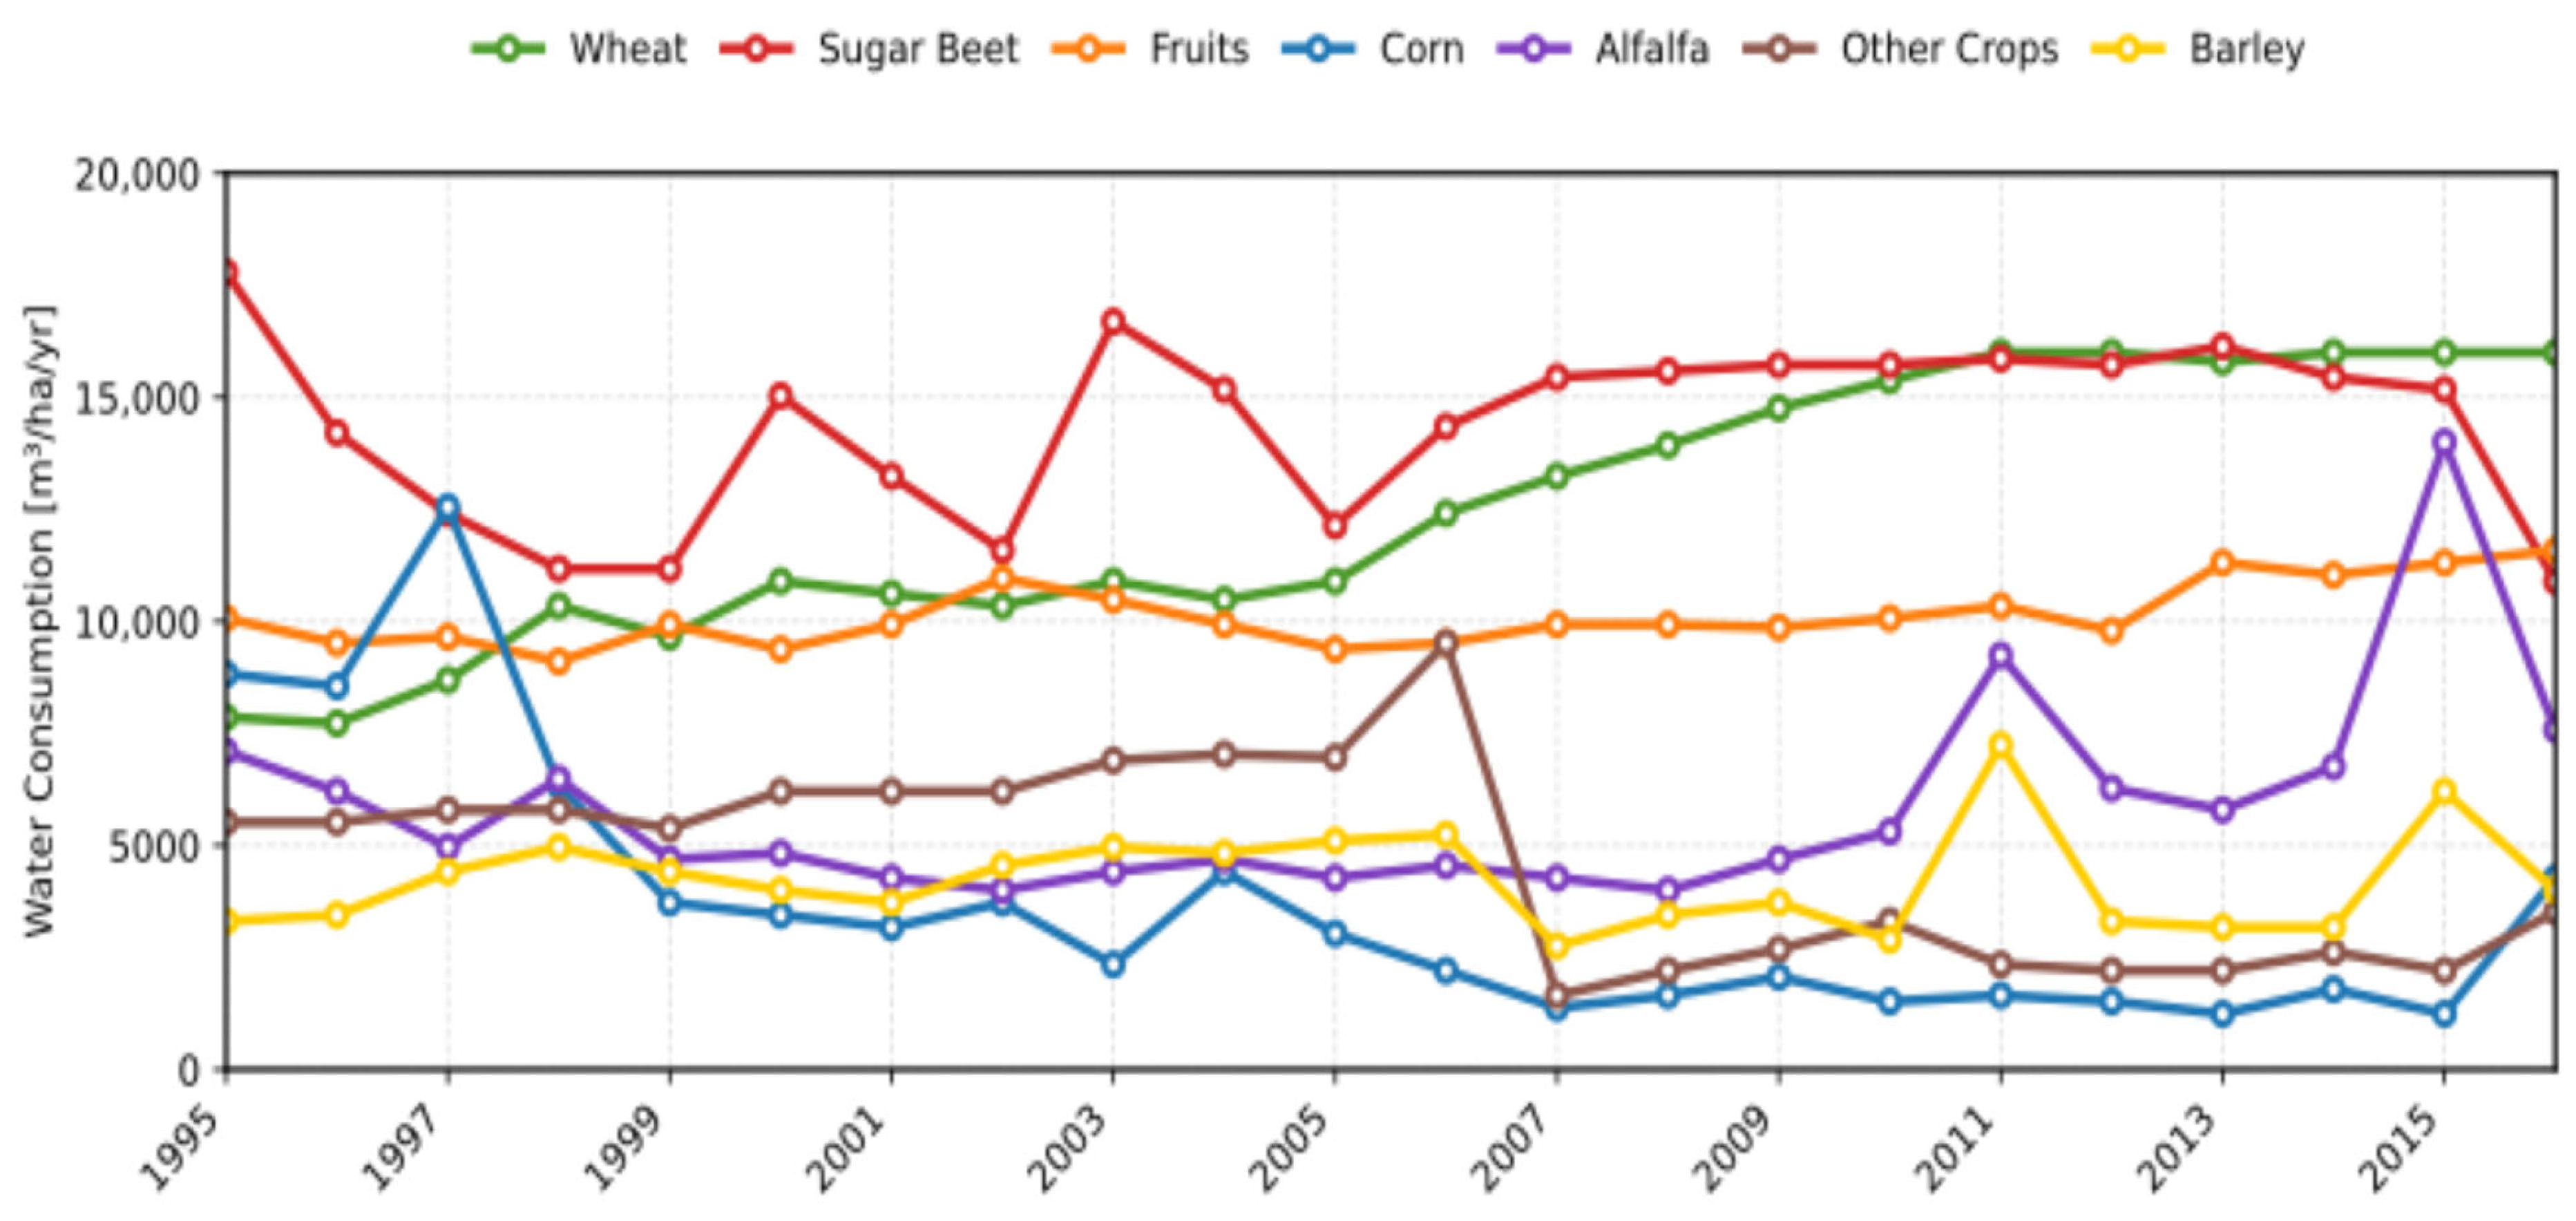
Temporal trends of water consumption (m3/ha/year) for seven major crop categories in the basin from 1995 to 2016.
The energy consumption analysis also shows pronounced mechanization-driven disparities, reflecting the basin’s intensive agricultural framework and climatic constraints (Figure 3). Sugar beet has high energy consumption reaching approximately 95,000 MJ/ha/year, predominantly driven by mechanized- and labor-harvesting operations, transportation logistics across the basins, and energy-intensive industrial processing. Wheat demonstrates substantial energy demands averaging 55,000 MJ/ha/year, reflecting intensive energy input necessitated by Iran’s food security policies and the basin’s challenging climate conditions requiring specialized equipment for cultivation and post-harvest operations. Fruits achieve moderate energy consumption levels near 35,000 MJ/ha/year, while corn, alfalfa, and barley demonstrate relatively efficient energy utilization patterns ranging from 15,000 to 30,000 MJ/ha/year.
The basin’s energy consumption closely mirrors water usage patterns, underscoring key nexus dynamics within the region’s water-stressed agricultural systems. These systems function under severe hydrological constraints that increasingly jeopardize the stability of the region. Among the crops, sugar beet emerges as a particularly resource-intensive outlier, requiring extensive energy inputs for both irrigation and harvesting. With an energy demand of approximately 95,000 MJ/ha/year—compared to just 20,000 MJ/ha/year for barley—sugar beet has dual-intensive pressure placed on both water and energy resources. Such energy-use disparities across crop types form a quantitative basis for agricultural transition strategies that prioritize low-input and high-efficiency crops, enabling both environmental recovery and socio-economic stability.
This nuanced analysis illuminates the intricate interdependencies characterizing the water–energy–food (WEF) nexus in the ULB. Crops with high water and energy demands, such as sugar beet, exemplify the tightly coupled infrastructure requirements that link irrigation intensity with mechanization needs. In contrast, certain crops—grouped as “other crops”—demonstrate more favorable resource-use efficiencies, offering potential pathways for sustainable intensification. These differential efficiency profiles offer critical insights for guiding basin-wide optimization and crop substitution policies aimed at mitigating agricultural pressure on water resources. Ultimately, the findings provide actionable guidance for agricultural planners and policymakers seeking to balance ecosystem preservation with food security across a region that supports over seven million inhabitants amidst escalating environmental and economic challenges.
3.2. Water and Energy Productivity
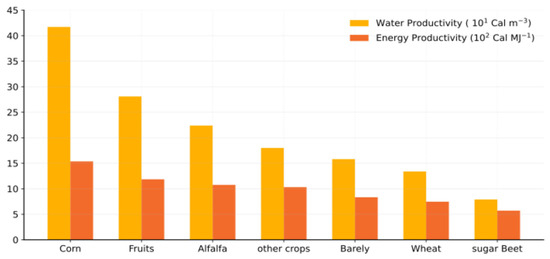
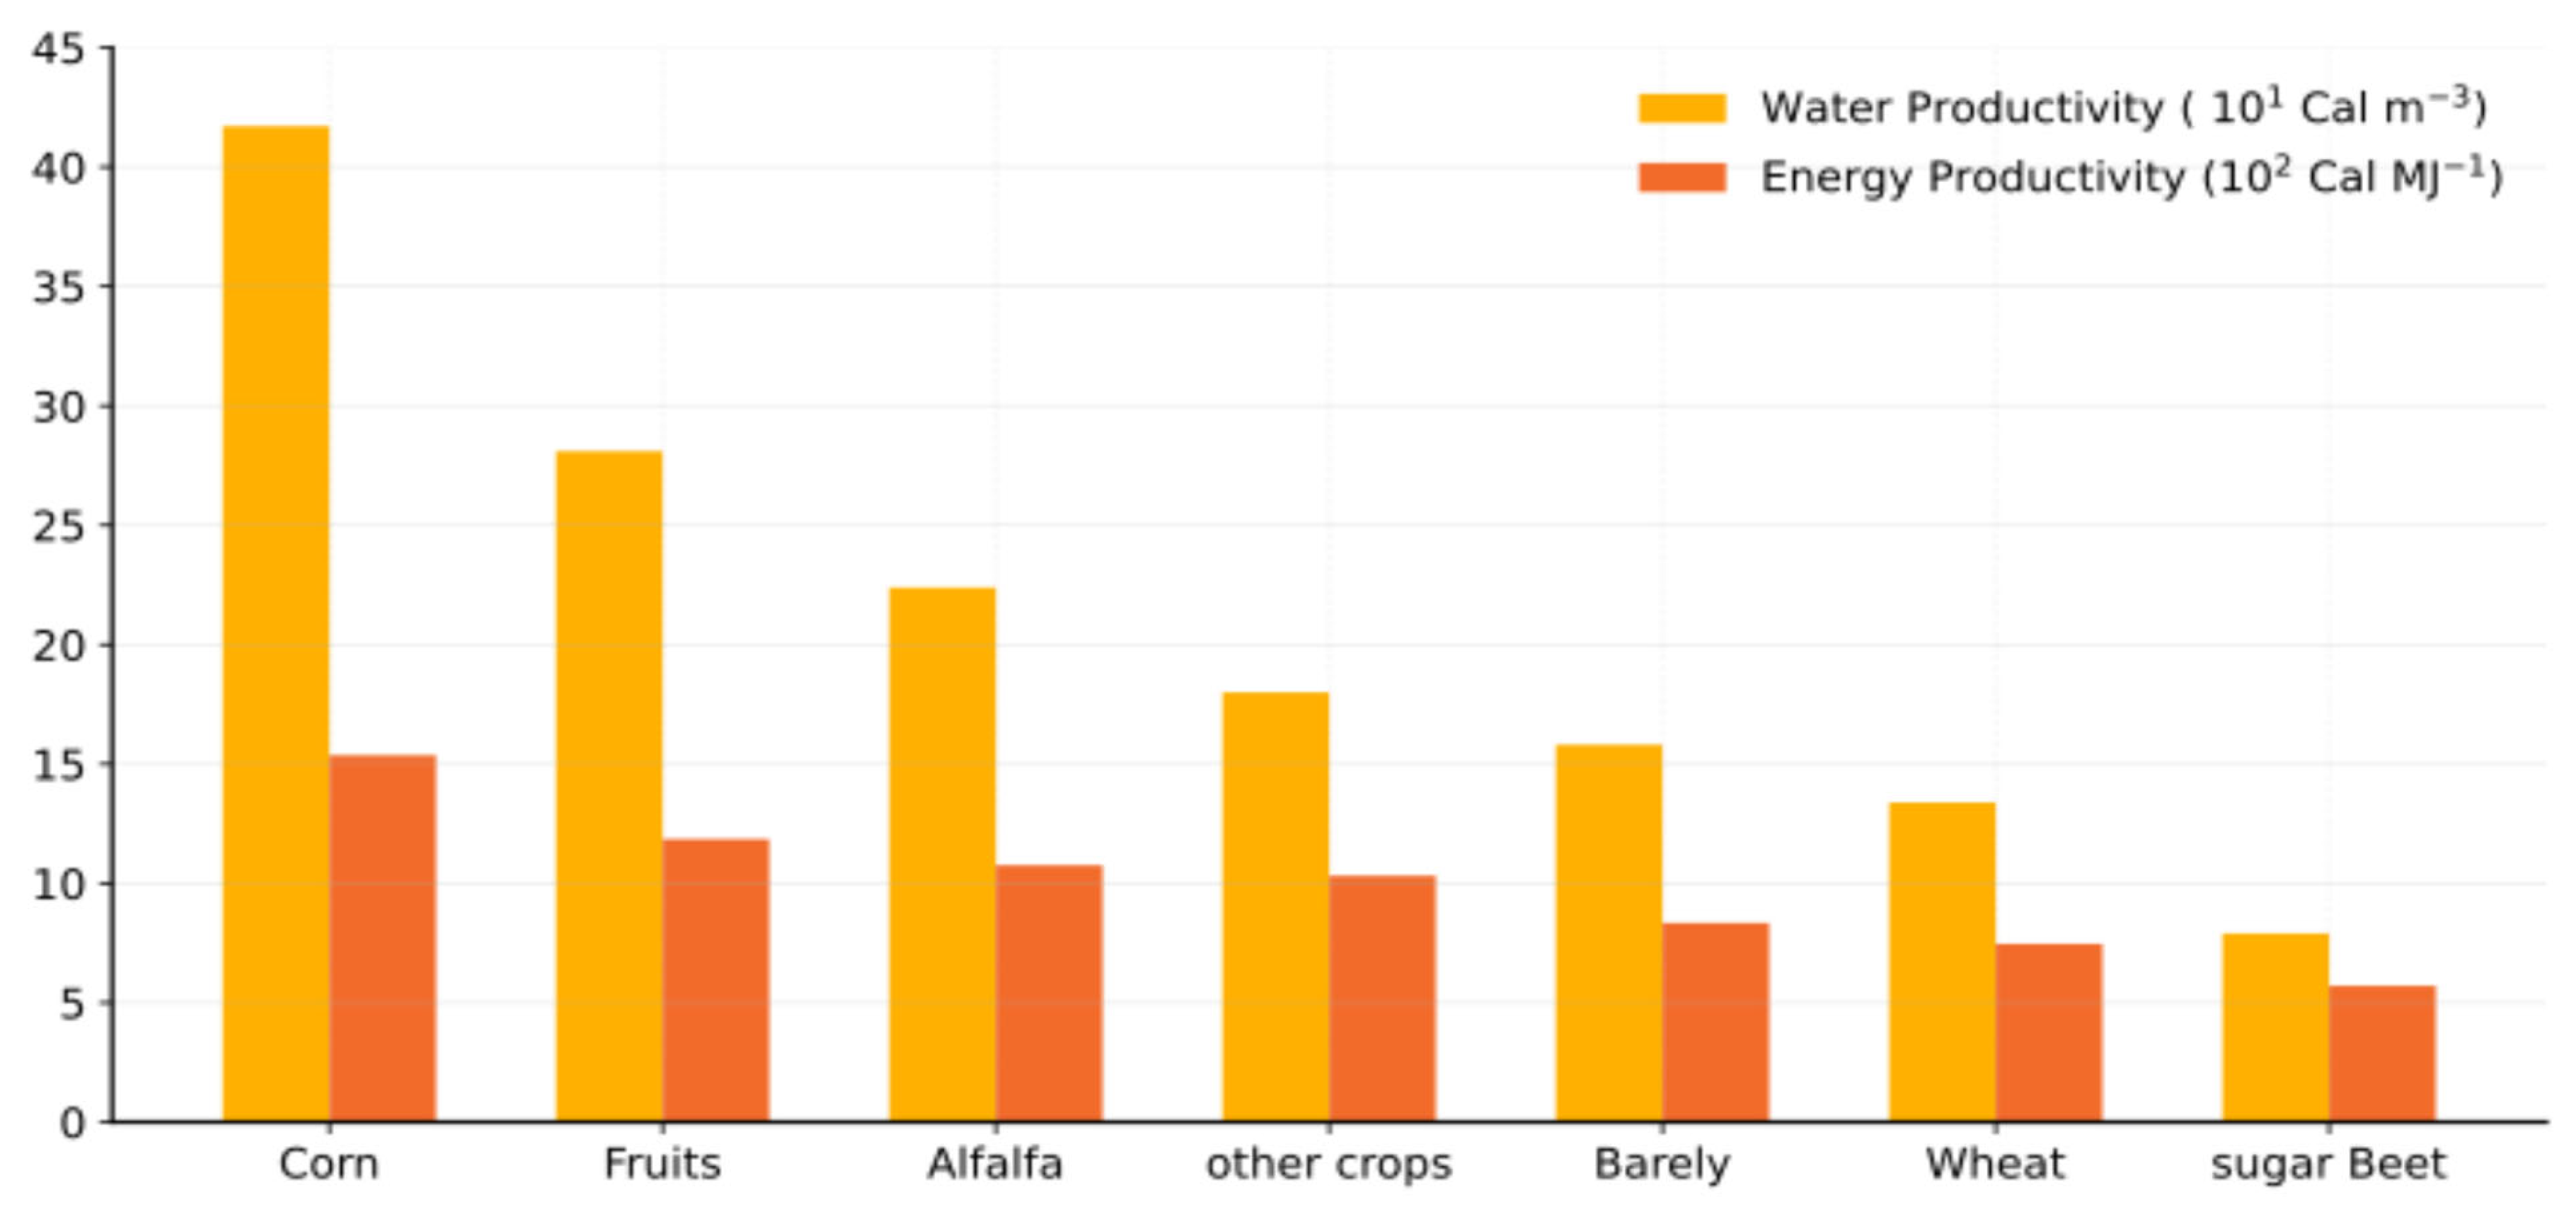
Basin water use efficiency analysis reveals distinct hierarchical differences in crop water management practices. Corn has the highest water productivity, achieving an average efficiency of 42.0 × 10³ Cal m−3 and 15.8 × 10³ Cal MJ−1 for water and energy productivity, respectively. Fruits have a water productivity of approximately 26.0 × 10³ Cal m−3 and an energy productivity of 13.0 × 10³ Cal MJ−1, placing them in the second range. The performance of fruit production in the basin may reflect the linkage between perennial systems, the region’s climate, and resource conditions.
Alfalfa exhibits productivity values of 21.0 × 10³ Cal m−3 for water use and 12.0 × 10³ Cal MJ−1 for energy input, reflecting its efficiency range under current resource conditions. Its performance across the basin highlights the specific production environments favorable for this forage crop, which plays a critical role in supporting the region’s livestock sector. Sugar beet exhibited the lowest conversion efficiency in both categories (8.4 × 10³ Cal m−3; 6.2 × 10³ Cal MJ−1), indicating poor adaptation to the basin’s environmental constraints. This result suggests that sugar beet cultivation may not be economically or environmentally sustainable under current basin conditions (Figure 5).
Figure 5.
Relationship between water productivity (× 103 Cal m−3) and energy productivity (×103 Cal MJ−1) for seven major crop categories cultivated in the Urmia Lake Basin during 1995–2016.
The productivity hierarchy observed in this study reflects crop-specific responses to the basin’s water and energy availability factors. The clear differentiation between high-performing crops (corn, fruits) and lower-efficiency options provides quantitative support for agricultural planning decisions within the basin. These findings are particularly relevant given the documented water-stress conditions affecting the Urmia Lake Basin and the need for improved resource allocation strategies in regional agriculture.
3.3. Water and Energy Economic Productivity
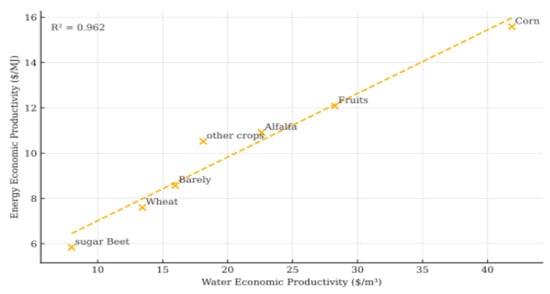
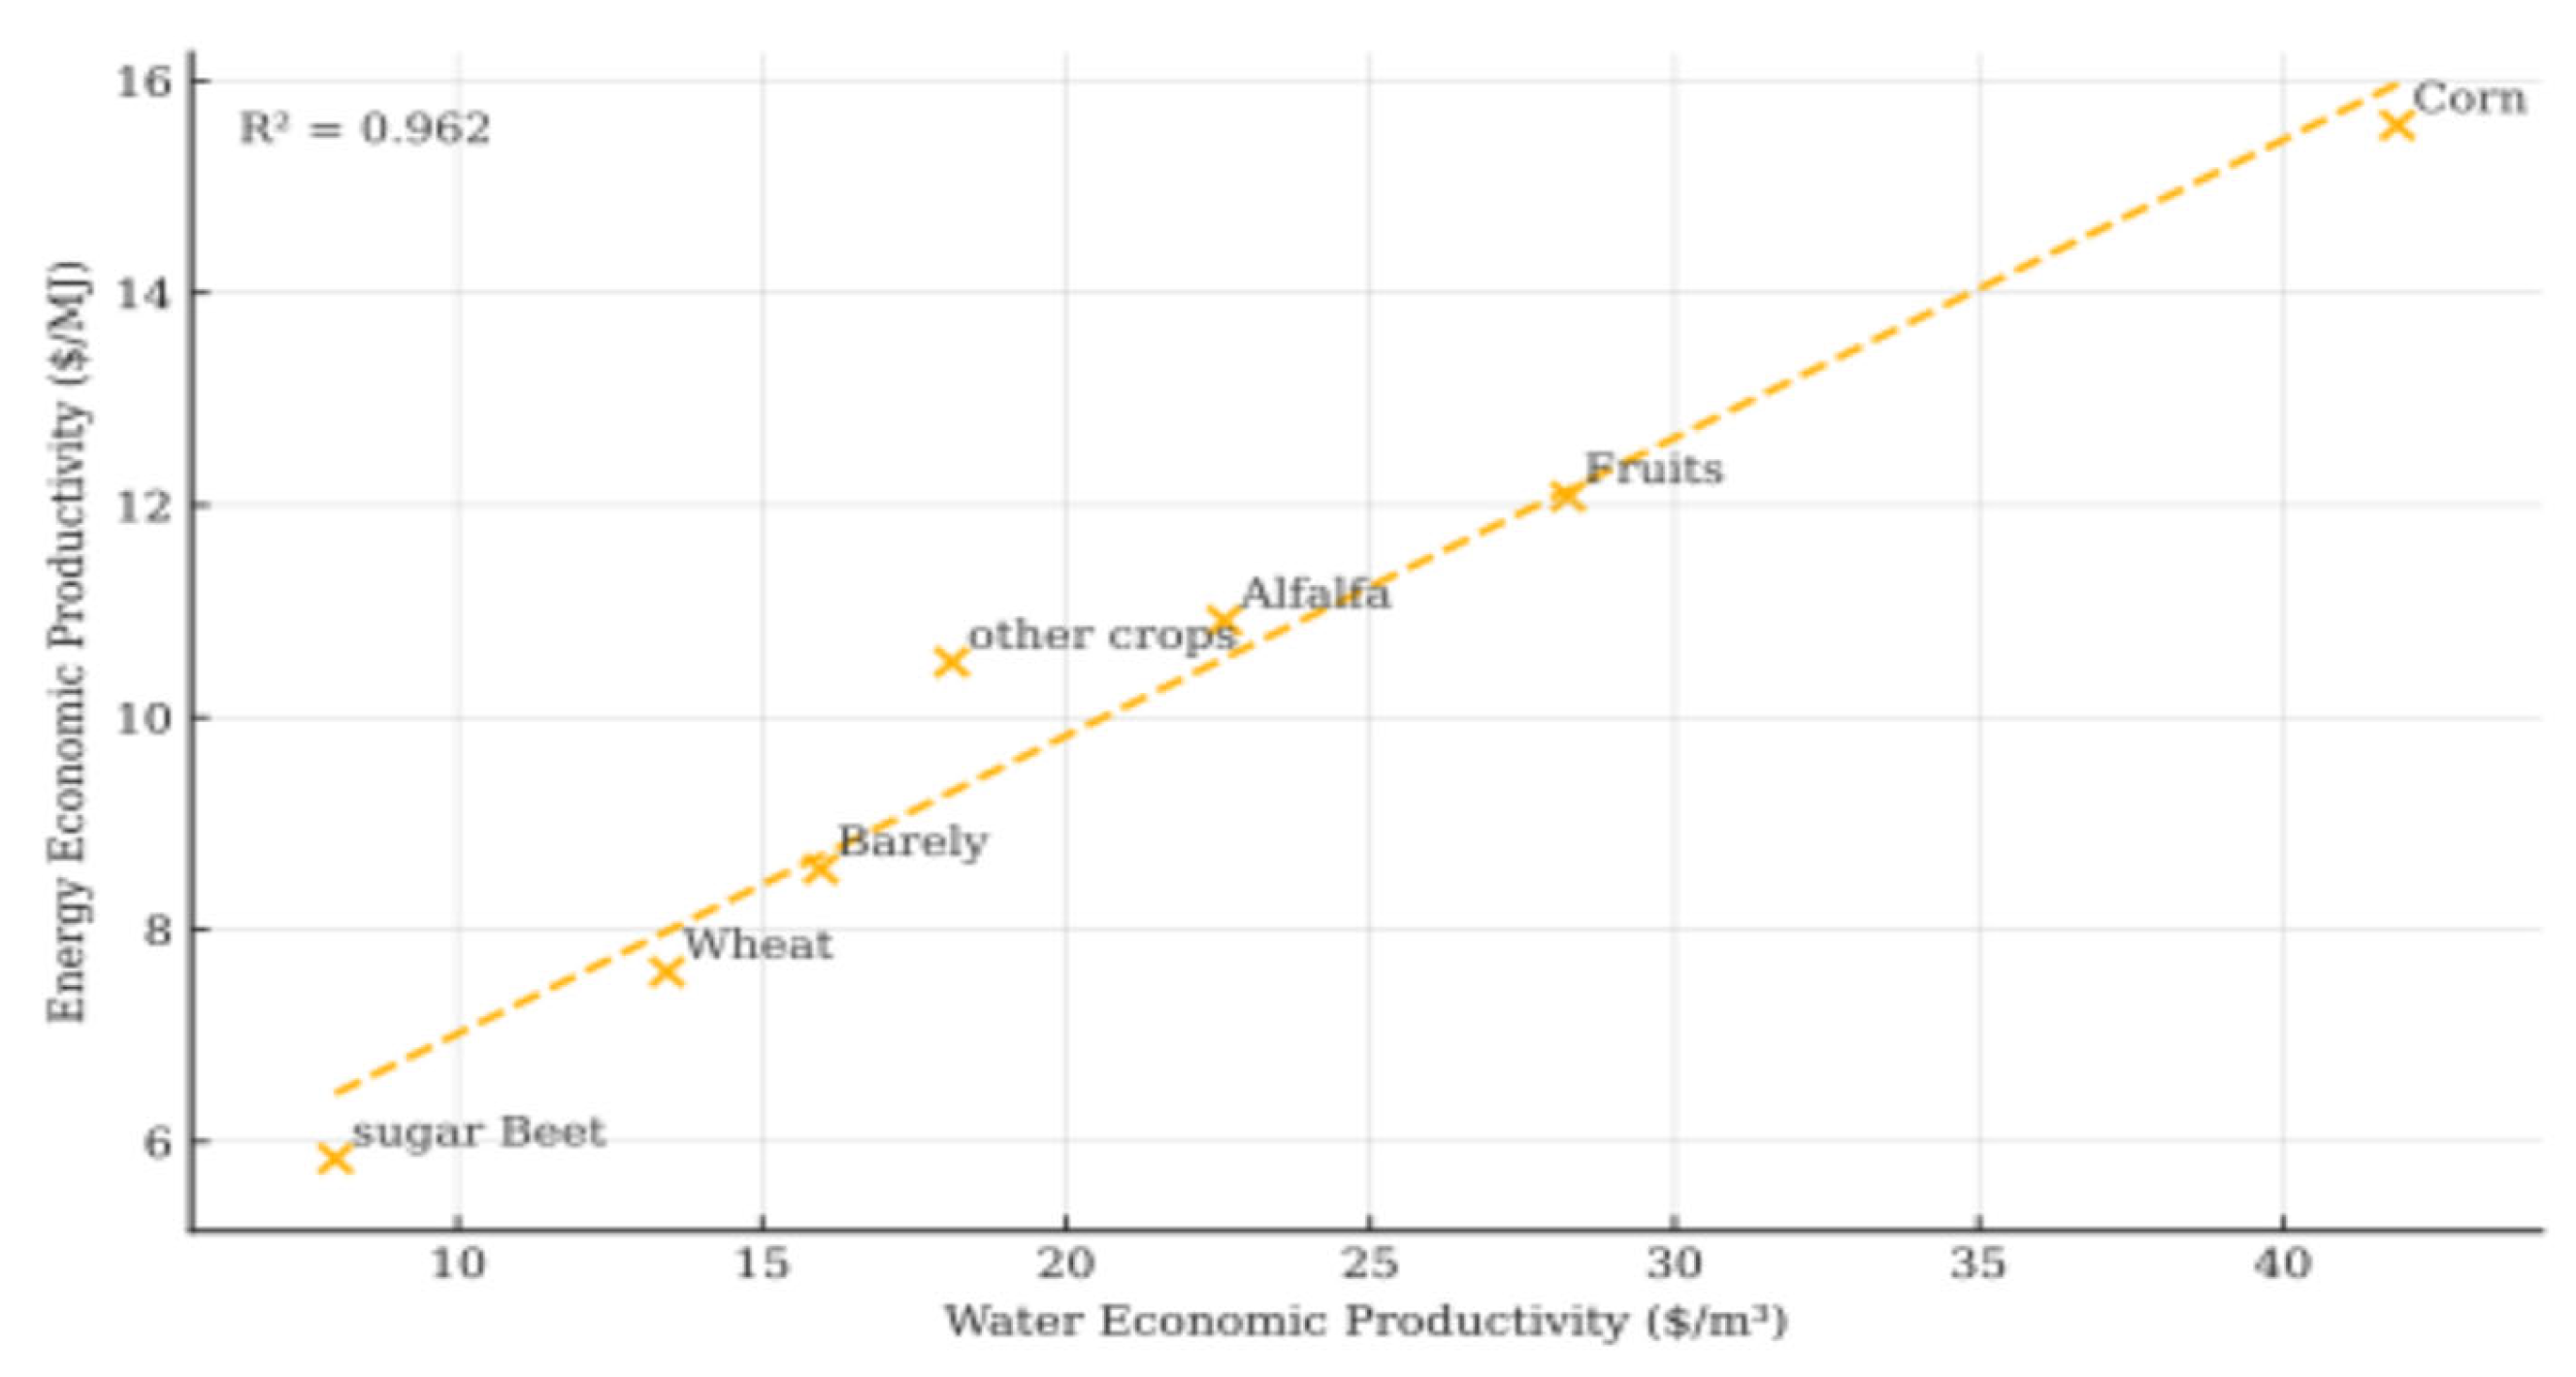
The water- and energy-based productivity in the basin confirms a compelling pattern: cropping systems that generate higher economic value per cubic meter of irrigation water also achieve greater returns per unit of energy—a dynamic amplified by Iran’s historically low, oil-subsidized energy prices, particularly before the imposition of international sanctions. The basin’s cropping systems exhibit a unique economic productivity structure, which can be categorized into three distinct tiers. At the lowest tier, sugar beet emerges as the least efficient crop, primarily due to its high irrigation requirements and reliance on conventional tillage practices, which significantly constrain resource-use efficiency. The intermediate tier includes wheat, barley, and mixed crops, which demonstrate moderate and consistent performance gains. These gains are partly attributed to national agricultural development initiatives, such as subsidized irrigation scheduling, mechanization support, and improved loan programs. At the highest tier, corn, alfalfa, and fruit crops consistently maintain superior performance levels (Figure 6), reflecting their higher resource-use efficiency and adaptability under current agronomic and climatic conditions. These efficiency differences show us that switching to high-yield systems—especially corn and fruit—can help farmers use less water and energy without cutting into their incomes. But data alone will not make that shift happen. Farmers need hands-on training in modern irrigation methods, financial support to adopt new equipment, and fair water-pricing that reflects real shortages. It is also important to remember that basin-wide averages can hide what is happening on individual farms—differences in soil, local weather, and economic conditions all shape success.
Figure 6.
Scatter plot showing the logical relationship between water economic productivity ($/m3) and energy economic productivity ($/MJ) across crop categories. Corn exhibits exceptional economic performance in both dimensions (upper-right), followed by fruits and alfalfa as good performers. Traditional cereals (wheat, barley) cluster in the moderate performance range, while sugar beet demonstrates consistently low economic productivity (lower left). The strong positive correlation (R2 = 0.847) supports the integration of both economic metrics in the WEFNI framework.
3.4. WEF Nexus Index Assessment
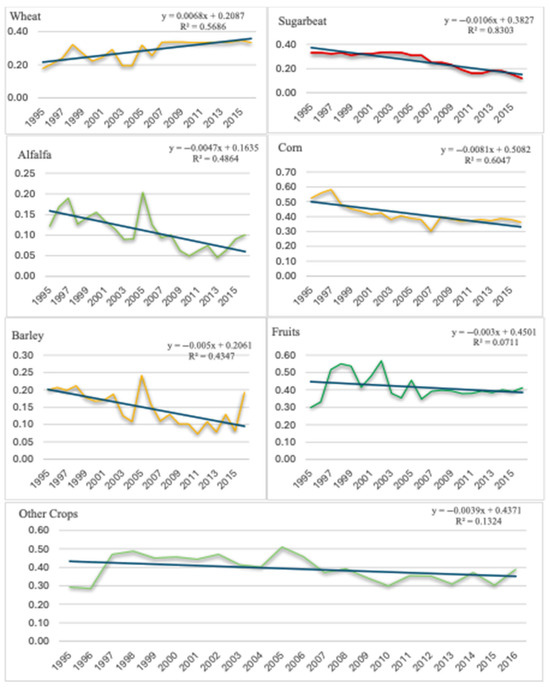
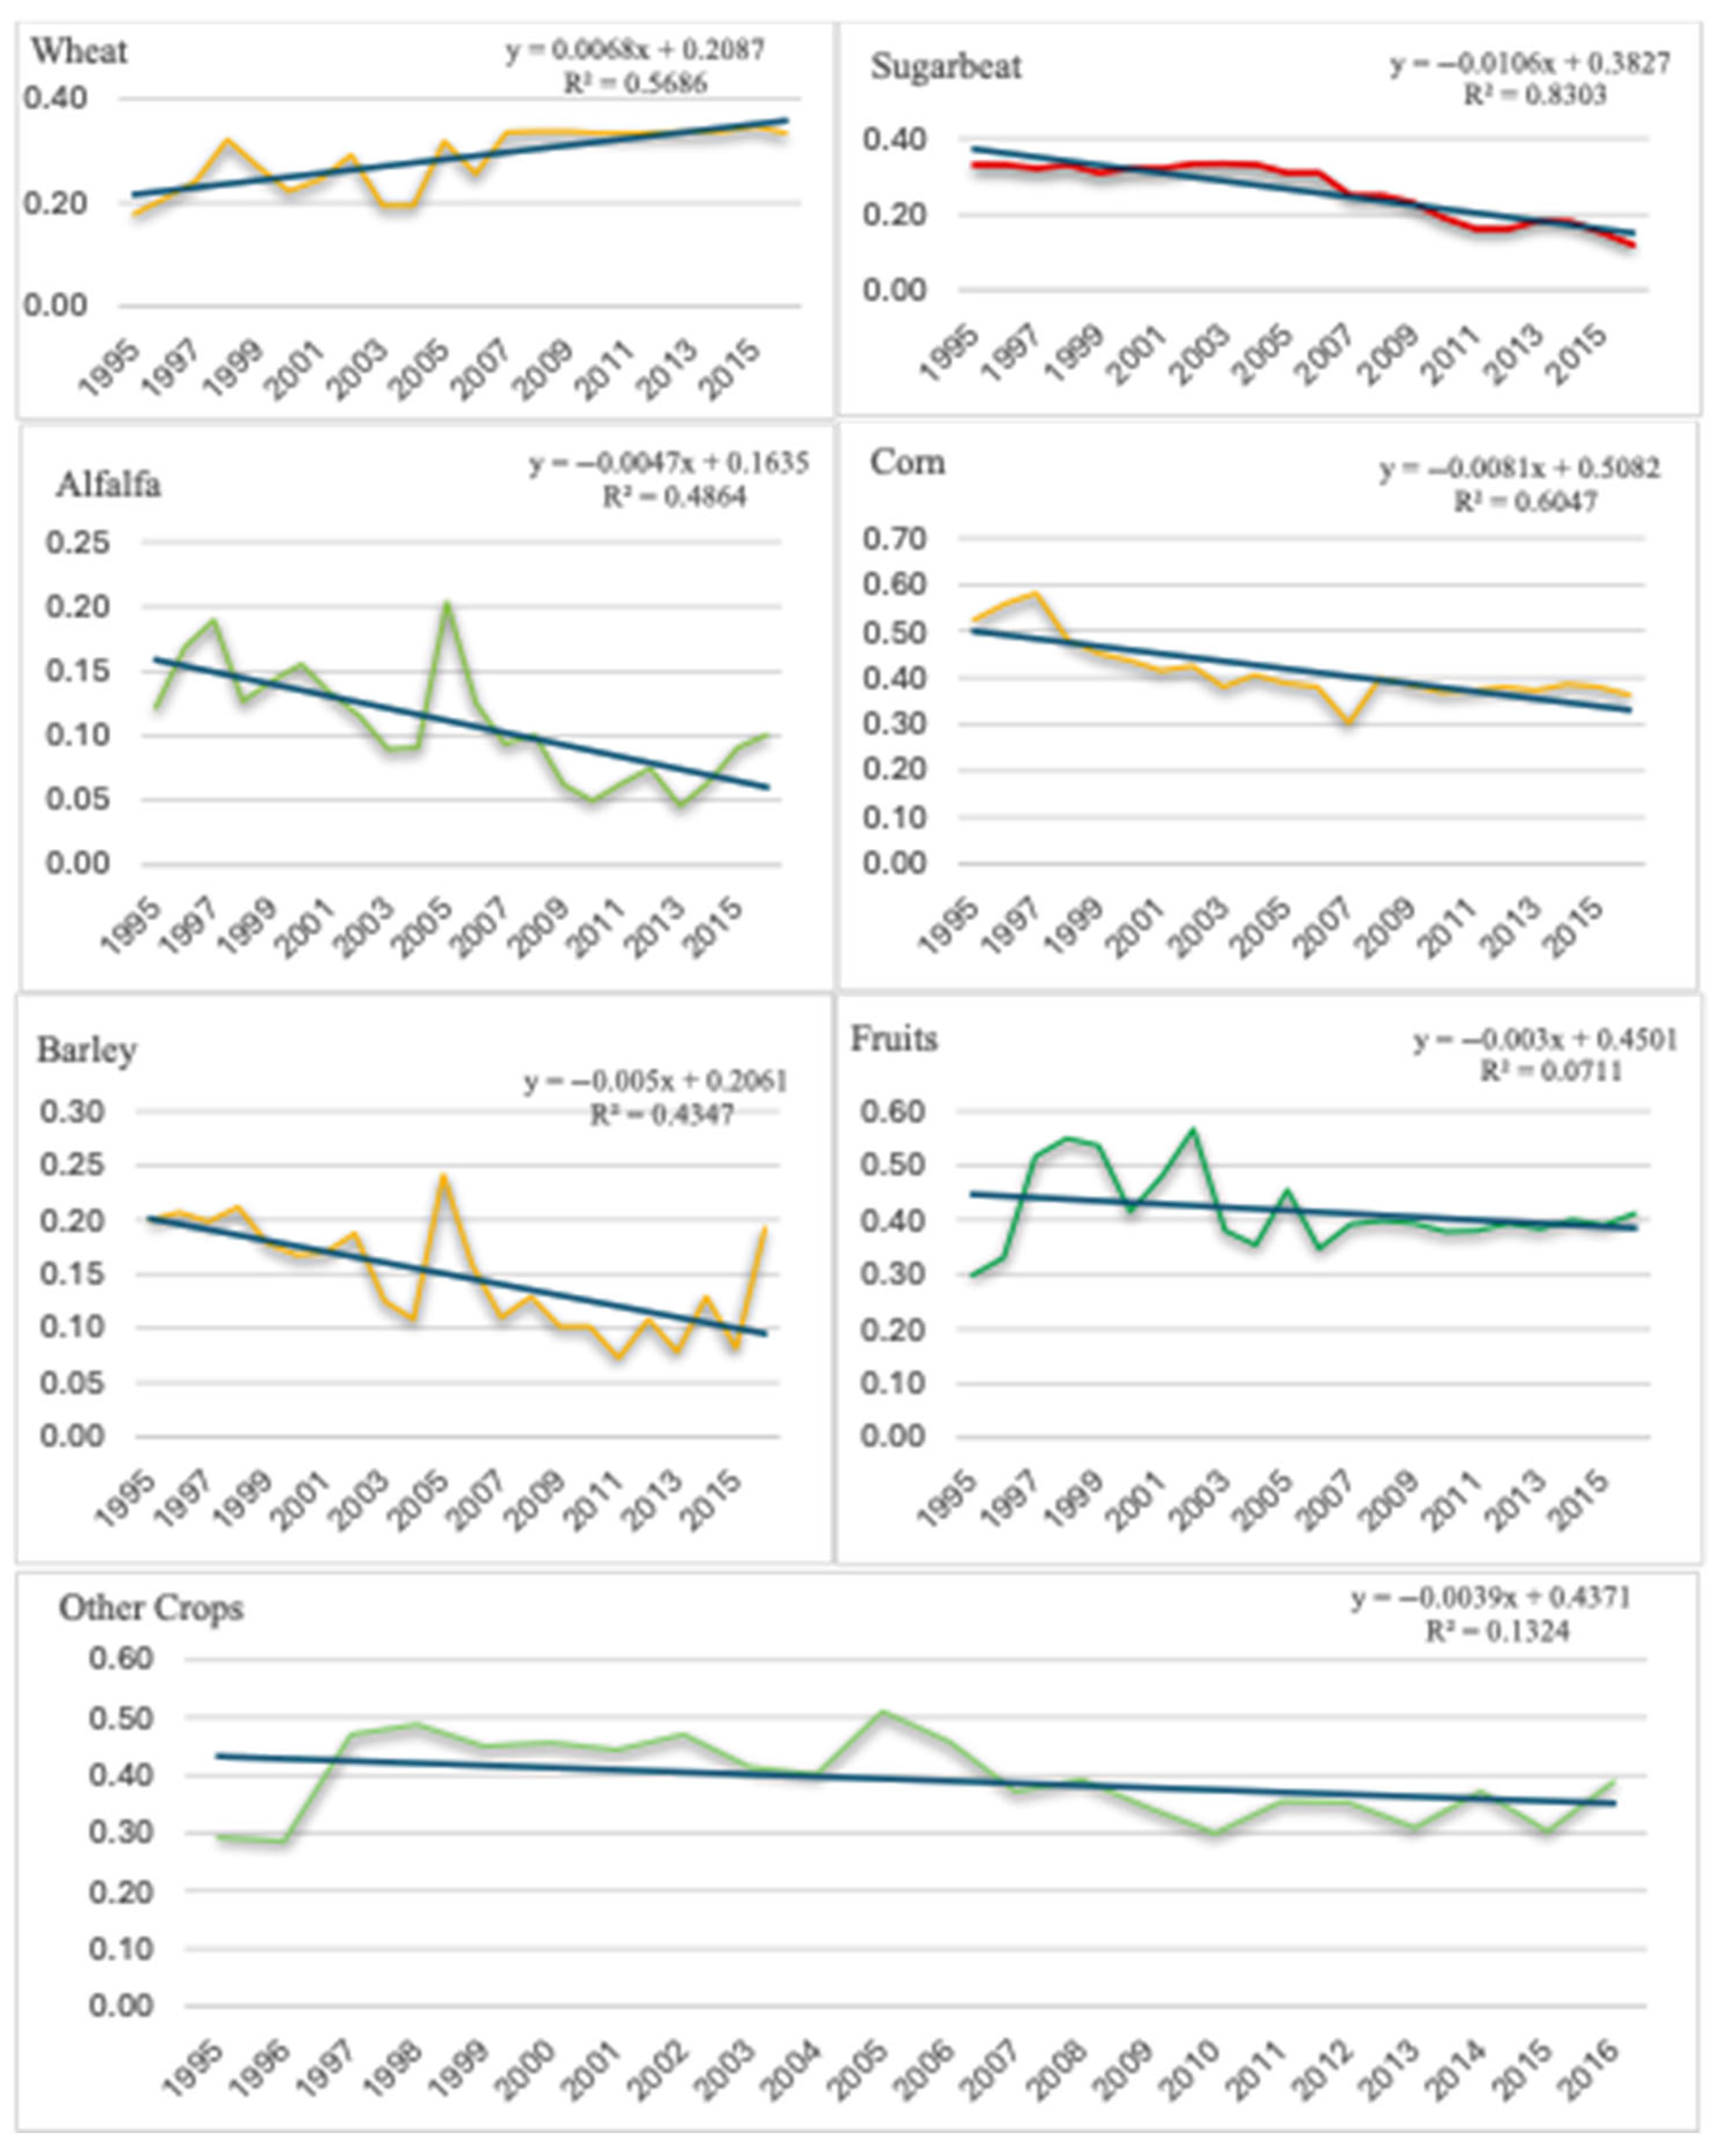
Basin crop efficiency patterns reveal critical sustainability concerns. WEFNI analysis shows that six of seven major crops declined in performance between 1995 and 2016, challenging assumptions about agricultural intensification success. These trends are systematic rather than random, with sugar beet showing the steepest decline (R2 = 0.8303), followed by corn (R2 = 0.6047), emphasizing persistent efficiency losses that demand urgent policy and management attention (Figure 7).
Figure 7.
Major crops’ WEFNI trends from 1995 to 2016. Wheat rises sharply under policy-driven intensification. Fruits improved to 2002 and then fell, implying resource and market constraints. Barley shows moderate efficiency and gradual decline. Sugar beet held mid-performance until 2006 before dropping amid scarcity. Corn leads WEFNI with fluctuations. Alfalfa remains at intermediate–high, needing optimization. Other crops cycle, peaking at ~2005, reflecting environmental-policy responses within ULB.
Performance stratification directly correlates with resource consumption hierarchies, where crops demonstrating superior efficiency paradoxically face a decline. Corn’s WEFNI reduction from 0.58 to 0.40 occurred despite maintaining optimal water productivity (42.0 × 10³ Cal m−3) and energy efficiency (15.8 × 10³ Cal MJ−1), alongside low-rate resource consumption (4000–5000 m3/ha/year water; 15,000–30,000 MJ/ha/year energy). This contradiction suggests that basin-wide resource constraints override individual crop efficiency, creating systematic pressure even on theoretically optimal agricultural systems. Fruits exhibit similar patterns, declining from 0.55 to 0.35 despite intermediate consumption levels (8000 m3/ha/year; 35,000 MJ/ha/year), indicating a weak but consistent downward trend in efficiency, while other crops demonstrate moderate correlation strength (R2 = 0.1324), indicating higher volatility in efficiency responses (Figure 7).
Wheat WEFNI stands as the singular success within basin agricultural systems, achieving the only positive WEFNI rate (R2 = 0.5686) from 0.18 in 1995 to 0.33 post-2006. This improvement coincides with moderate resource consumption (12,000 m3/ha/year water; 55,000 MJ/ha/year energy) and strategic policy interventions supporting Iran’s wheat self-sufficiency program. Conversely, barley’s complex response pattern (R2 = 0.4347) shows efficiency peaks in 2004, followed by decline, directly corresponding to water consumption increases from 7500 to 12,000 m3/ha/year pre-2007 to 16,000 m3/ha/year post-2007, demonstrating policy trade-offs between production targets and efficiency optimization.
Critical inflection points around 2007 appear across multiple crop systems, coinciding with documented policy interventions and resource reallocation strategies. Sugar beet’s systematic decline from 0.32 to 0.18 represents the most severe efficiency deterioration, directly reflecting the crop’s unsustainable resource profile combining maximum consumption (14,327 m3/ha/year water; 95,000 MJ/ha/year energy) with minimum productivity outputs (8.4 × 10³ Cal m−3 water; 6.2 × 10³ Cal MJ−1 energy). Alfalfa demonstrates moderate correlation strength (R2 = 0.4864) with a dramatic efficiency collapse from 0.18 to 0.06 by 2011, followed by partial recovery to 0.12 by 2016, showing that vulnerability to resource constraints affect livestock sector sustainability (Figure 7).
4. Scenarios
4.1. WEF Nexus and Economic Optimization
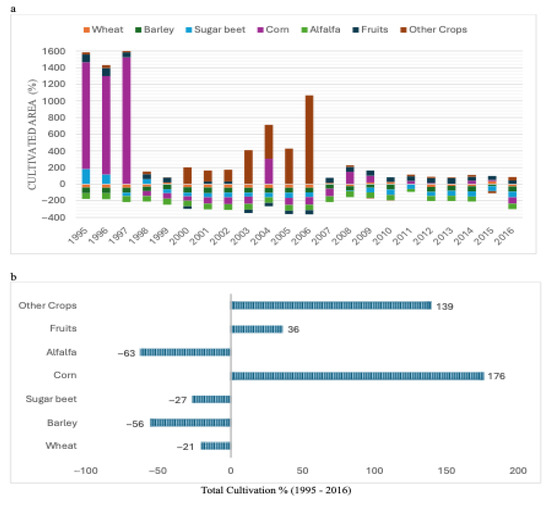
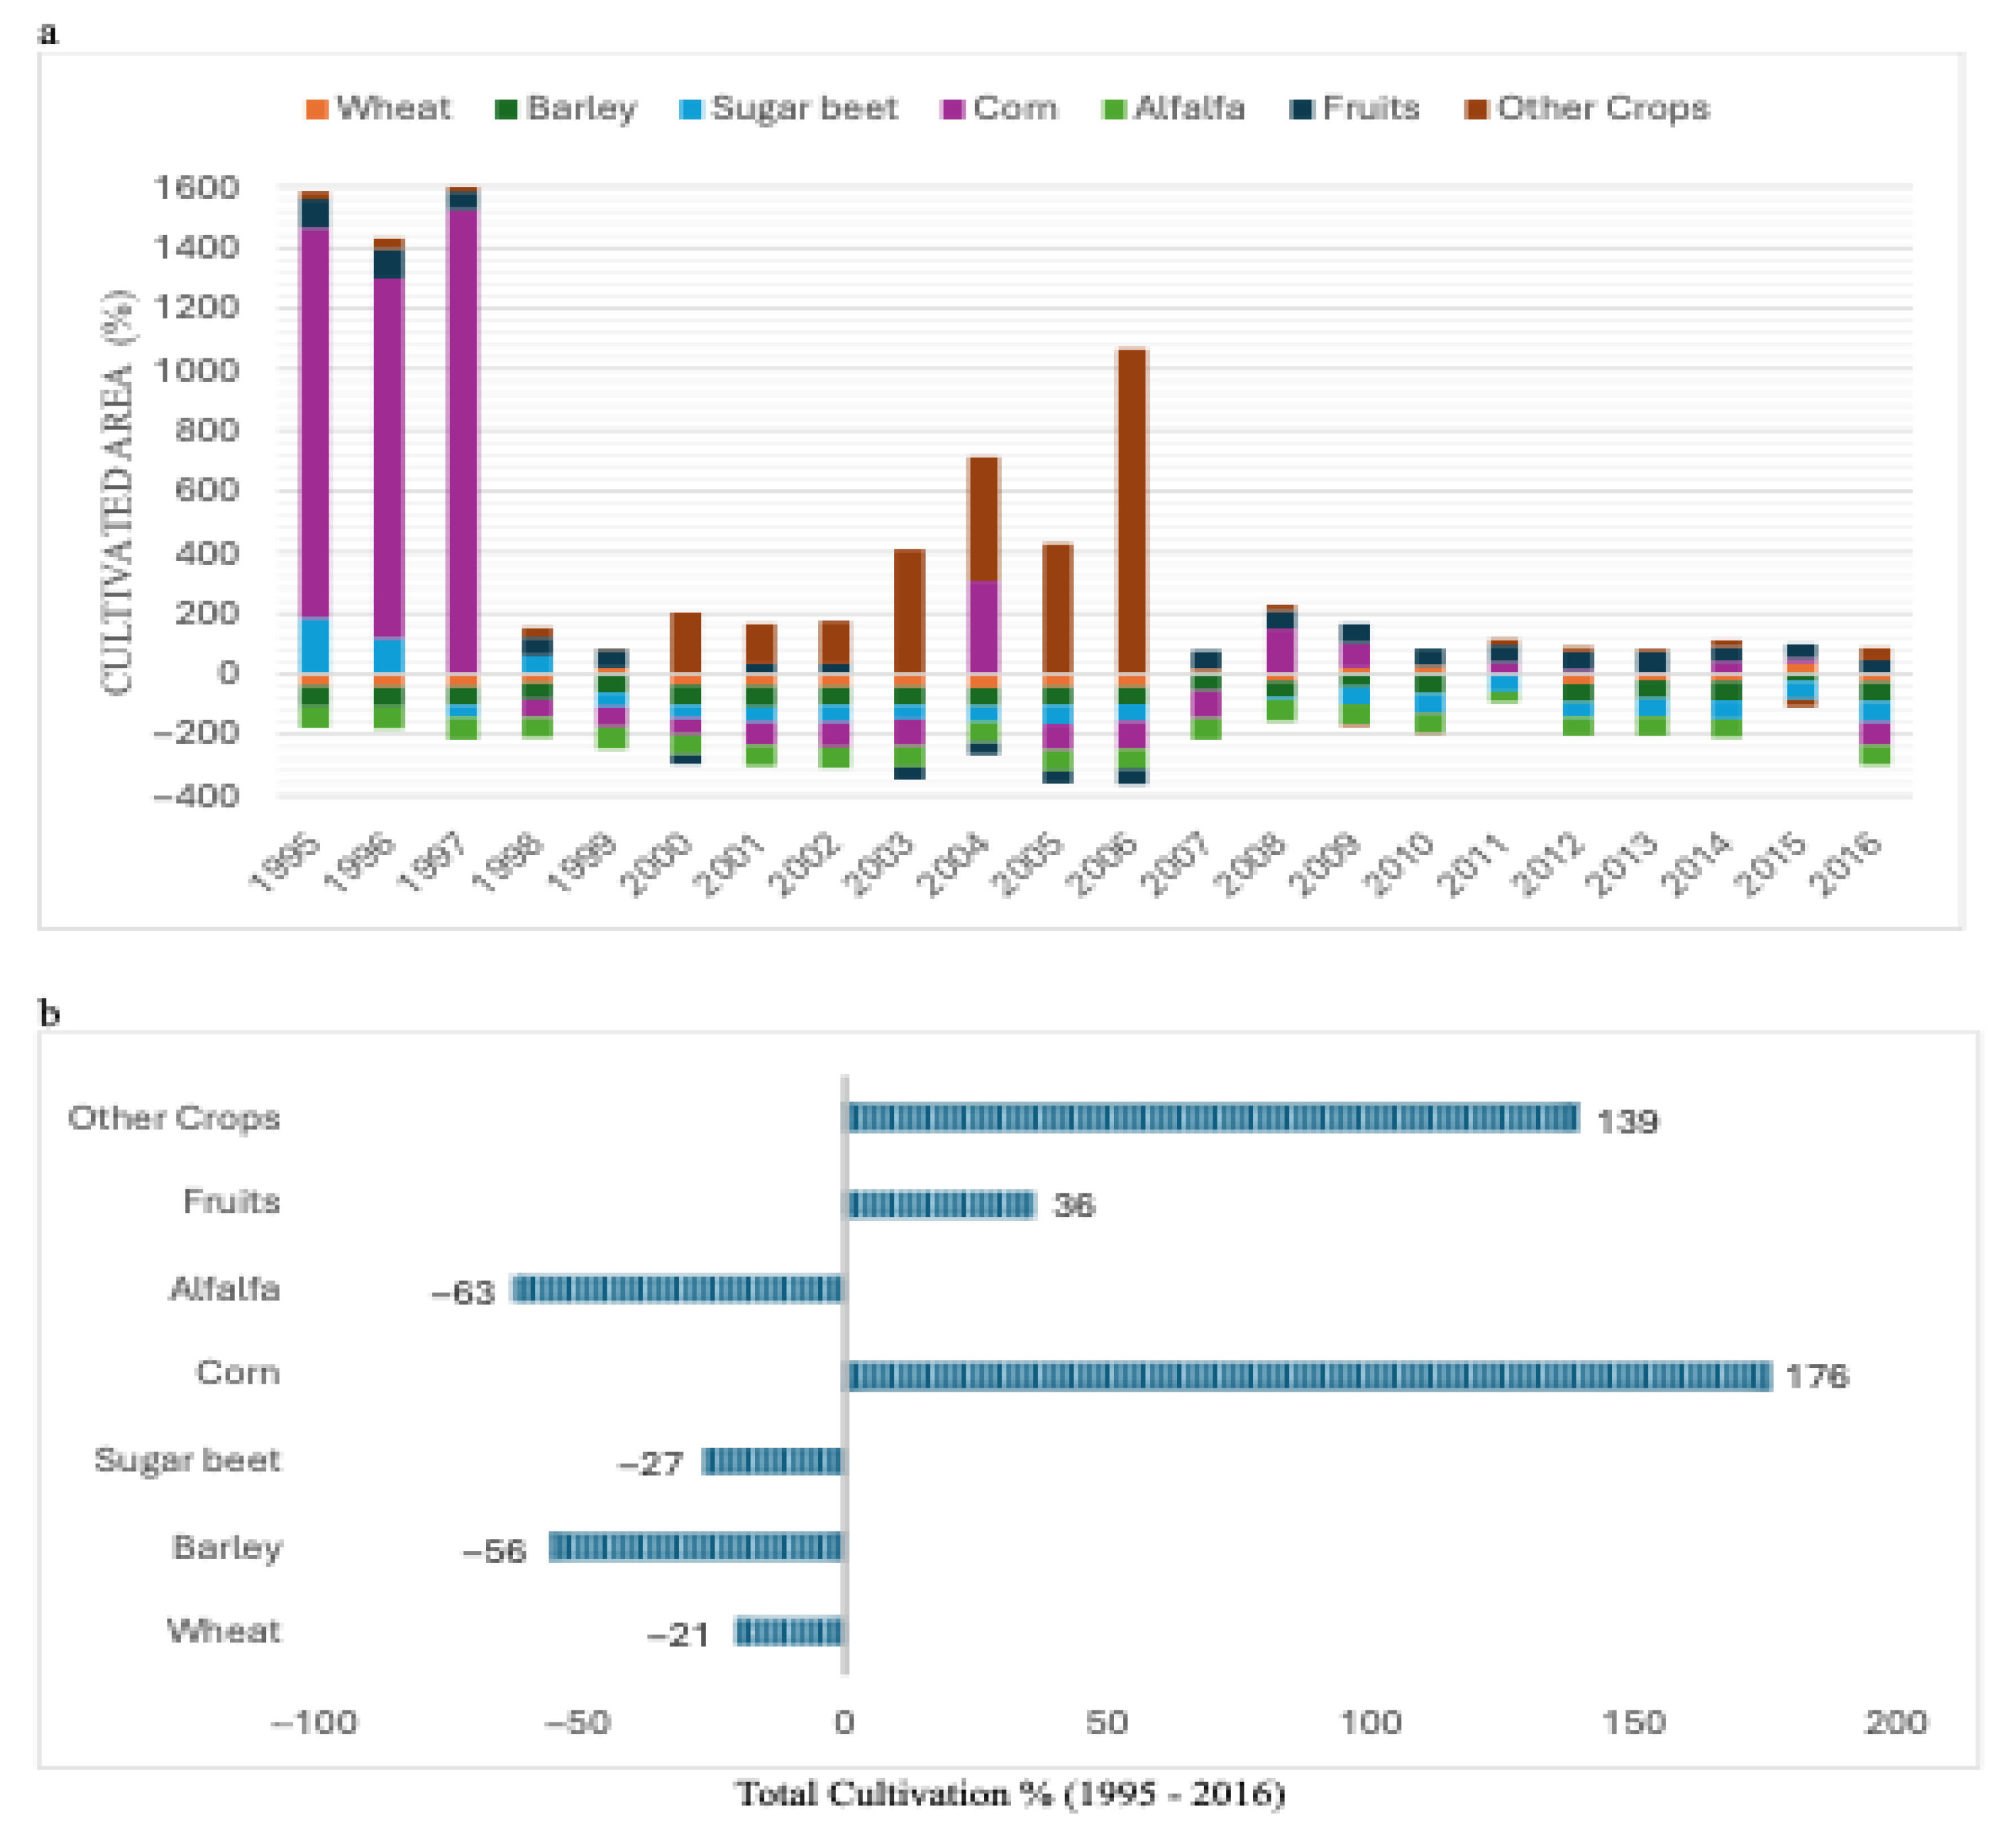
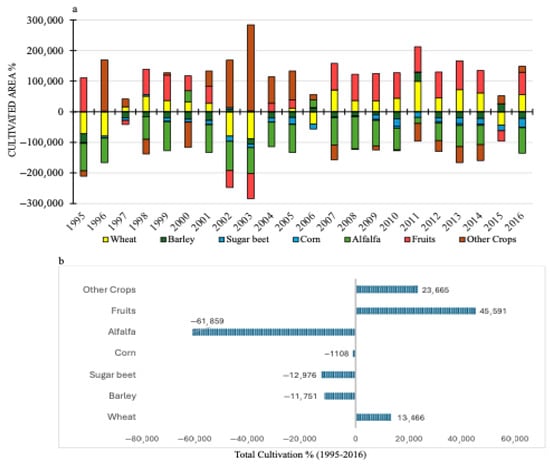
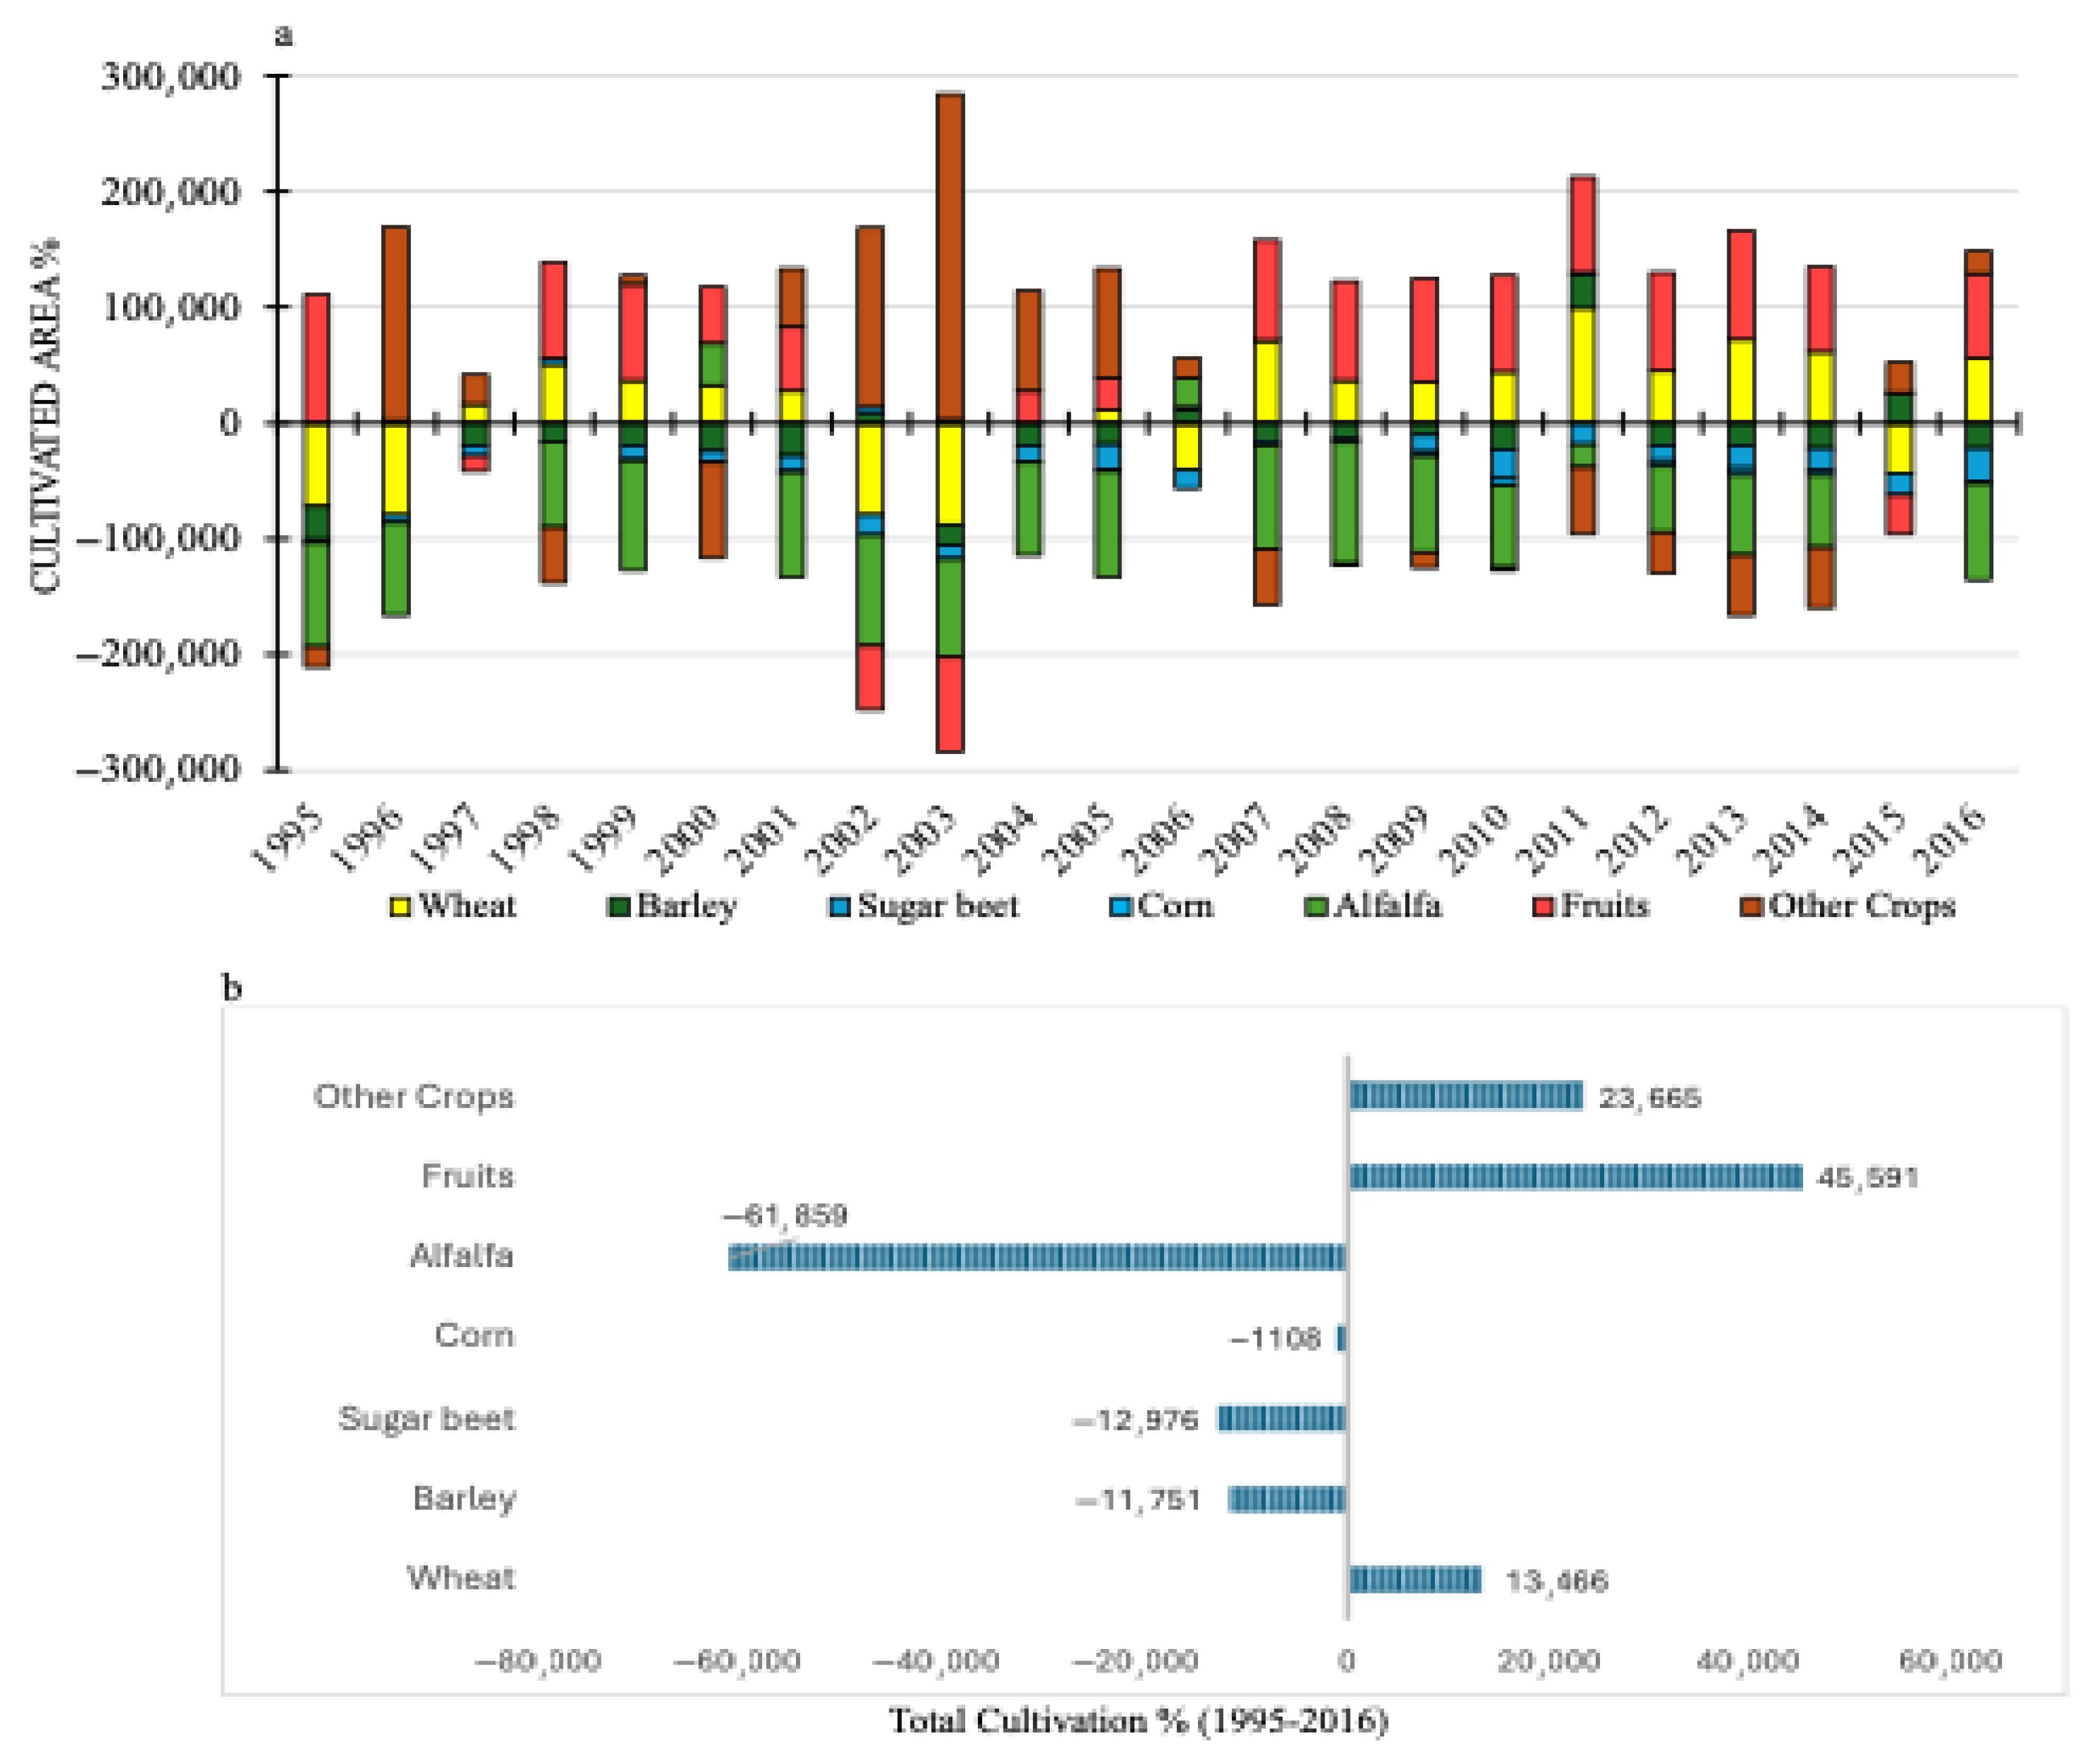
Scenario 1 (Sc1) optimizes WEF nexus productivity and net economic returns, balancing ecological efficiency with economic viability. This scenario reflects contemporary agricultural paradigms where production systems must achieve resource optimization and financial sustainability within competitive markets. Results reveal restructuring patterns, showing relationships between crop efficiency metrics and system performance (Figure 8a,b).
Figure 8.
(a) Annual trajectories demonstrating model responsiveness in optimizing WEF nexus and economic trade-offs. (b) Aggregate cultivation adjustments revealing systematic crop restructuring for basin optimization.
Corn cultivation exhibited the largest expansion, averaging 176% increases in cultivated area, reflecting strong performance in both nexus efficiency and market profitability. This growth shows corn’s ability to satisfy optimization criteria through physiological adaptations, yield stability, and favorable market positioning within regional economies.
Other crops expanded by 139% on average, indicating optimization potential within diversified systems. This growth reflects diversification value in multi-objective frameworks. Portfolio effects enhance system performance beyond individual crop efficiencies, allowing exploitation of market opportunities, seasonal resource variations, and complementary practices that optimize utilization across broader scales.
Fruit production increased moderately by 36% in cultivation areas. This reflects favorable economic positioning through value-added markets and processing opportunities, showing how specialized crops contribute to optimization despite intermediate efficiency rankings. Growth patterns suggest that economic premiums compensate for moderate resource efficiency in the system.
Cereal crops contracted systematically under Sc1 parameters. Wheat declined by 21%, barley decreased by 56%, and alfalfa contracted by 63%, representing shifts from conventional staple production. These reductions reflect interactions between resource efficiency and system constraints governing optimization outcomes.
Alfalfa’s reduction illustrates economic considerations in dual-optimization scenarios, despite recognized efficiency characteristics. The contraction likely reflects limited market demand, infrastructure constraints, and opportunity costs from competing with higher-value alternatives.
Sugar beet cultivation declined moderately by 27%, with temporal variability throughout evaluation periods. Early expansion followed by systematic contraction suggests dynamic market responses and policy influences affecting crop viability. The moderate decline reflects sugar beet’s complex position, where processing infrastructure requirements and economic considerations influence performance despite periodic favorable conditions.
Temporal dynamics show system responses to changing environmental, market, and policy conditions. Annual variability in cultivation patterns indicates model responsiveness to dynamic constraints and objective parameters, highlighting the importance of flexible agricultural systems adapting to changing conditions.
4.2. Water-Efficient Nexus Optimization
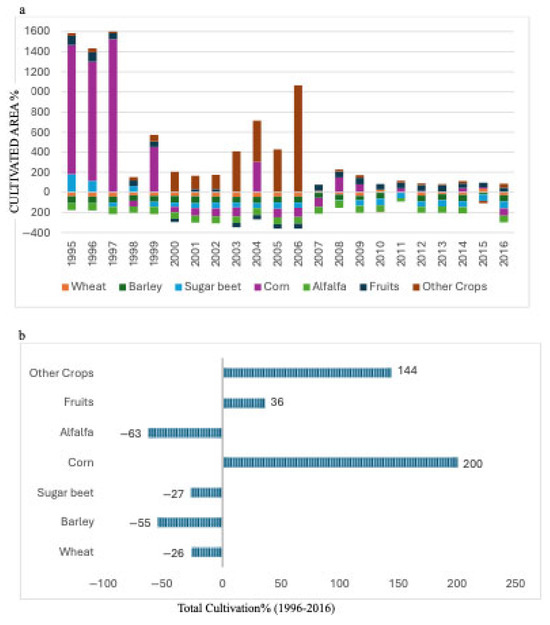
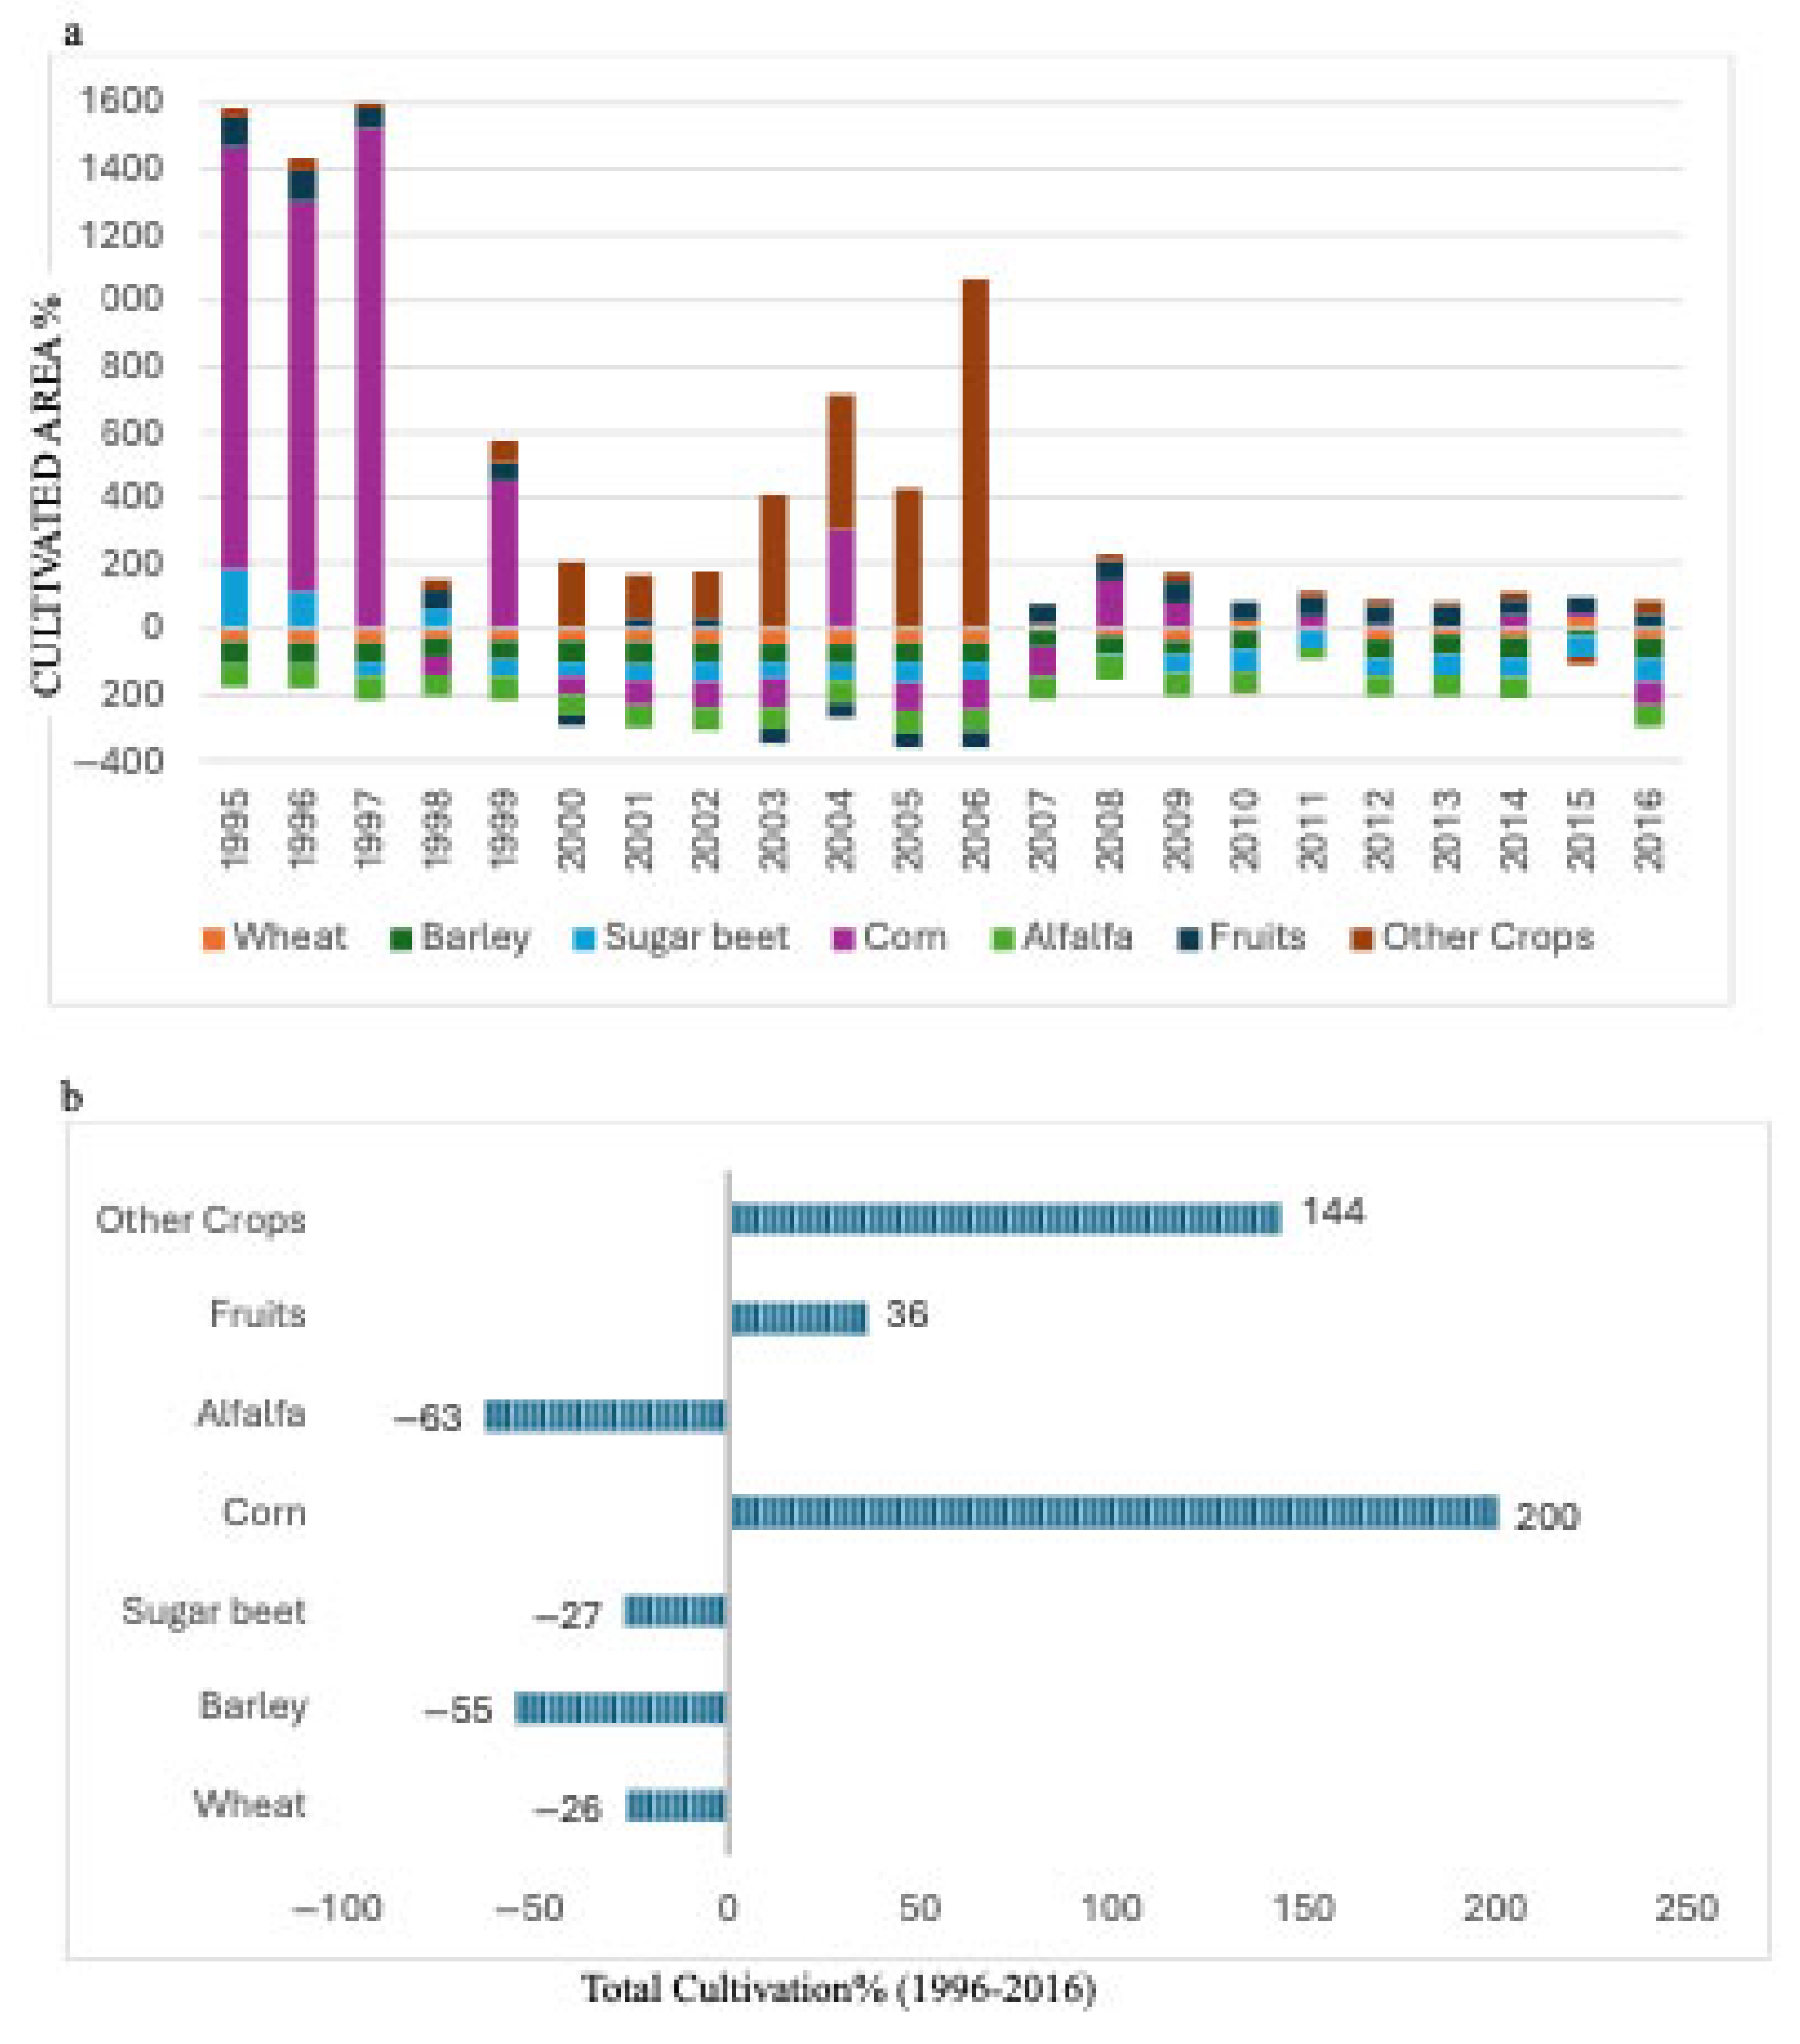
Scenario 2 (Sc2) maximizes WEF nexus performance while minimizing water consumption, addressing critical challenges in water-limited agricultural systems. The scenario reveals how resource constraints reshape system efficiency when water conservation becomes the main target.
Corn cultivation experienced the largest expansion, increasing 200% and exceeding even Sc1 performance levels. The growth reflects corn’s superior water-use efficiency and ability to maintain productivity under basin conditions. The enhanced performance versus Sc1 demonstrates corn’s particular suitability for water-conscious agricultural systems. Other crops showed expansion at 144%, indicating optimization potential under diversified cultivation regimes designed to minimize resource consumption. This pattern reflects advantages that emerge when water conservation becomes the primary objective. Such systems capitalize on complementary crop characteristics and seasonal water demand variations via rotation strategies that optimize resource utilization while maintaining productivity benchmarks.
Fruit production expanded by 36%, demonstrating favorable performance under the scenario’s constraints. This expansion indicates that perennial crops contribute substantially to water-constrained agricultural systems through three key mechanisms: established root architectures that enhance water-use efficiency, optimized physiological utilization pathways, and premium market positioning that justifies resource allocation despite high establishment costs. Cereal systems exhibited systematic contraction: wheat declined by 26%, barley decreased by 55%, and alfalfa contracted by 63%. These reductions reflect the structural adjustments required when water conservation becomes the primary optimization objective. The observed contractions indicate that these crops were historically developed under water-abundant conditions with yield maximization priorities rather than resource-use efficiency optimization.
Alfalfa exhibited severe contraction (63%) due to inadequate irrigation infrastructure, competitive displacement by water-efficient crops, and temporal water demands conflicting with conservation objectives. Sugar beet declined moderately (27%), demonstrating relative resilience through institutional support—processing infrastructure, market mechanisms, and policy frameworks partially offsetting inherent water-use inefficiencies. These findings illustrate that institutional factors significantly influence optimization outcomes beyond technical efficiency metrics.
Annual cultivation variability demonstrates model sensitivity to dynamic parameters, highlighting the importance of flexible systems capable of responding to changing resource availability (Figure 9a,b). These patterns reveal principles governing water-scarce systems, where dual performance and conservation objectives create trade-off structures requiring analytical frameworks. Also, results demonstrate that optimal allocation under sustainability constraints demands understanding of crop-specific water patterns, infrastructure requirements, market dynamics, and temporal availability variations. Implementation requires coordinated support addressing irrigation modernization, crop transition assistance, and market development for water-efficient systems, while maintaining productivity and food security within sustainability parameters.
Figure 9.
(a) Annual progression showing adaptive optimization balancing nexus performance with water minimization. (b) Cumulative changes illustrating profound agricultural shifts required for sustainability–water conservation reconciliation.
4.3. Water-Efficient Economic Optimization
Scenario 3 (Sc3) maximizes economic returns while minimizing water use, showing that optimized farming and water conservation can work together. This approach provides a framework for developing water-efficient crops that remain economically viable as water becomes increasingly scarce in the basin. Results reveal market-driven restructuring patterns that prioritize economic efficiency under water conservation objectives (Figure 10a,b).
Figure 10.
(a) Annual dynamics reflect economic–water optimization balancing mechanisms. (b) Aggregate transformations demonstrating diversified cultivation patterns necessary for sustainable profit optimization under water constraints.
Fruit production expanded the most at 32%, showing superior water–economic efficiency through three factors: premium market prices, value-added processing options, and established perennial systems that spread water costs over many years. This growth demonstrates that fruits can generate strong economic returns while using water efficiently relative to their market value. Other crops expanded by 37%, indicating the potential for economic optimization in diversified farming systems under water limitations. This growth reflects the benefits of crop diversification when maximizing profits under water limits. Wheat cultivation exhibited modest but important expansion, averaging 11%, representing an equilibrium between economic viability and water conservation objectives. This stability reflects wheat’s unique position within regional economics, where policy support, established infrastructure, and food security create favorable conditions justifying moderate water allocation despite efficiency limitations.
Traditional high-water crops contracted systematically under Sc3 parameters. Alfalfa declined by 50%, reflecting unfavorable economic–water trade-offs where limited market premiums fail to justify irrigation allocation under economic optimization. Sugar beet decreased by 42%, indicating processing infrastructure limitations and volatile commodity markets constraining economic returns relative to water investment requirements.
Corn cultivation experienced a moderate reduction averaging 33%, despite strong productivity shown in previous scenarios. This decrease reflects corn’s water requirements conflicting with water minimization when economic returns fail to provide sufficient premiums over water-efficient alternatives. The reduction illustrates complex trade-offs where individual crop efficiency advantages may be offset by resource constraint penalties. Barley declined by 26%, reflecting unfavorable performance in economic–water trade-offs. This moderate reduction indicates barley’s intermediate status—lacking both strong economic advantages and sufficient water efficiency to warrant expanded cultivation.
This scenario demonstrates economic principles in resource-limited agricultural systems, where profit maximization under sustainability objectives creates market-driven selection favoring high-value, water-efficient crops. Results emphasize the critical role of market development, value-chain optimization, and economic incentives in achieving sustainable agricultural transitions. Successful implementation requires coordinated interventions: market development programs, processing infrastructure investment, and farmer capacity building to optimize economic returns while conserving water resources.
4.4. Sensitivity to Weighting Assumptions
To address indicator weighting in optimization outcomes, we conducted comprehensive sensitivity analysis testing five alternative weighting schemes representing diverse stakeholder priorities and policy objectives. This analysis evaluates whether the equal-weighting assumption (wᵢ = 1/6) employed in our primary analysis affects crop performance rankings and, consequently, the validity of our optimization recommendations.
The five weighting scenarios tested include the following: (1) equal weights serving as the baseline (all indicators weighted at 0.167); (2) water-priority weighting emphasizing water conservation (WCI = 0.30, WMP = 0.30, EC = 0.10, EMP = 0.10, EWP = 0.10, EPE = 0.10), reflecting policy contexts where water scarcity dominates management priorities; (3) energy-priority weighting emphasizing energy efficiency (EC = 0.30, EMP = 0.30, WCI = 0.10, WMP = 0.10, EWP = 0.10, EPE = 0.10), representing scenarios with energy cost concerns; (4) economic-priority weighting emphasizing financial returns (EWP = 0.35, EPE = 0.35, WCI = 0.075, EC = 0.075, WMP = 0.075, EMP = 0.075), applicable where farmer profitability drives decision-making; and (5) water–economic balance weighting representing integrated sustainability objectives (WCI = 0.25, EWP = 0.25, WMP = 0.15, EPE = 0.15, EC = 0.10, EMP = 0.10).
Table 3 presents average WEFNI values for each crop across all five weighting scenarios. Results demonstrate remarkable stability in crop performance rankings. Corn and fruits consistently rank within the top three performers across all five scenarios. Other crops appear in the top three in four of five scenarios. Conversely, alfalfa consistently occupies bottom-two positions across all scenarios, while barley ranks in the bottom two in four of five scenarios. Sugar beet demonstrates persistently poor performance across all weighting schemes, never achieving top three status regardless of stakeholder priorities emphasized.
Table 3.
Average WEFNI values by crop across five weighting scenarios (1995–2016).
This sensitivity analysis confirms that equal weighting does not bias our findings and that optimization recommendations derived from the WEFNI framework maintain validity regardless of whether decision-makers prioritize water conservation, energy efficiency, economic returns, or balanced sustainability objectives. The robustness demonstrated here enhances confidence in the policy applicability of our framework across diverse governance contexts and stakeholder priorities within the Urmia Lake Basin and comparable water-stressed agricultural regions globally.
5. Conclusions
This research reveals that ULB agricultural systems face critical resource management challenges demanding immediate reconsideration of crop selection priorities and resource strategies, as the prevailing approach has fundamentally misaligned with hydrological realities, creating agricultural portfolios that systematically deplete water resources while failing to optimize economic returns or energy efficiency. Analysis of a comprehensive 22-year historical dataset (1995–2016) demonstrates that despite substantial environmental and economic variability—including severe drought cycles, extreme temperature fluctuations (−20 °C to 40 °C), hydrological stress reducing lake volumes by 86%, international sanctions, and dramatic inflation (87–440% annually)—crop performance patterns remain remarkably consistent. The research findings challenge conventional assumptions about agricultural diversification, suggesting that strategic concentration on high-performing crops may yield both environmental and economic benefits in water-limited regions. Corn consistently maintained superior water productivity (95.7 × 10³ Cal/m3) and energy efficiency across all periods, while sugar beet persistently demonstrated poor efficiency (8.4 × 10³ Cal/m3). The temporal deterioration observed across multiple cropping systems that currently dominate agricultural practices has exceeded infrastructure capacity, demanding strategic crop transition that acknowledges resource-intensive crops’ disproportionate contribution to ecosystem degradation. The WEFNI analysis provides a replicable methodology for other water-scarce regions, though its application requires calibration to local conditions and recognition that optimization outcomes depend heavily on non-price policy dynamics, infrastructure capacity, and institutional support systems. Effective policy implementation requires abandoning sectoral approaches in favor of integrated management that recognizes water, energy, and food systems as interconnected components of larger socioecological systems. Agricultural development in regions like the Urmia Basin must prioritize strategic resource expansion and long-term productivity gains while addressing fundamental hydrological and infrastructure limitations, emphasizing that sustainable agricultural intensification cannot proceed without adequate resource constraints.
Author Contributions
Conceptualization, Y.K. and E.B.; methodology, Y.K. and M.S.; investigation, Y.K. and Z.Z.; formal analysis, Y.K. and M.S.; writing—original draft, Y.K.; writing—review and editing, Y.K., J.Q. and H.K.; supervision, J.Q.; funding acquisition, Y.K. All authors have read and agreed to the published version of the manuscript.
Funding
This research received funding from the Michigan State University CSS Summer Early Start Award, grant number [SS24].
Institutional Review Board Statement
Not applicable.
Informed Consent Statement
Not applicable.
Data Availability Statement
The data presented in this study are available on request from the corresponding author.
Acknowledgments
This work was partially supported by the Land Cover Land Use Change Program (LCLUC) of the National Aeronautics and Space Administration (NASA) (Grant numbers: 8NSSC24K0920), USDA (MICL02878) through the AgBioResearch at Michigan State University.
Conflicts of Interest
The authors declare no conflicts of interest.
Abbreviations
| Time Units: | |
| H | hours |
| Mass Units: | |
| kg | kilograms |
| Volume Units: | |
| L | liters |
| m3 | cubic meters |
| Energy Units: | |
| kWh | kilowatt-hours |
| MJ | megajoules |
| J | Joules |
| Chemical Element Symbols: | |
| N | Nitrogen |
| P2O5 | Phosphorus pentoxide |
| K2O | Potassium oxide |
Appendix A
Table A1.
Summary of energy equivalent of inputs in ULB.
Table A2.
Statistics of indicators.
Table A3.
Crop yield and productivity trends.
References
- Bazilian, M.; Rogner, H.; Howells, M.; Hermann, S.; Arent, D.; Gielen, D.; Steduto, P.; Mueller, A.; Komor, P.; Tol, R.S. Considering the energy, water and food nexus: Towards an integrated modelling approach. Energy Policy 2011, 39, 7896–7906. [Google Scholar] [CrossRef] [Scilit]
- Newell, J.P.; Goldstein, B.; Foster, A. A 40-year review of food–energy–water nexus literature and its application to the urban scale. Environ. Res. Lett. 2019, 14, 073003. [Google Scholar] [CrossRef] [Scilit]
- FAO. The State of Food Insecurity in the World 2011: How Does International Price Volatility Affect Domestic Economies and Food Security? Food and Agriculture Organization of the United Nations: Rome, Italy, 2011; Available online: https://www.fao.org/publications/sofi/2011 (accessed on 1 October 2025).
- IEA. World Energy Outlook 2014. OECD/International Energy Agency. 2014. Available online: https://www.iea.org/reports/world-energy-outlook-2014 (accessed on 1 October 2025).
- Norouzi, N. Presenting a conceptual model of water-energy-food nexus in Iran. Curr. Res. Environ. Sustain. 2022, 4, 100119. [Google Scholar] [CrossRef] [Scilit]
- Carvalho, P.N.; Finger, D.C.; Masi, F.; Cipolletta, G.; Oral, H.V.; Tóth, A.; Regelsberger, M.; Exposito, A. Nature-based solutions addressing the water-energy-food nexus: Review of theoretical concepts and urban case studies. J. Clean. Prod. 2022, 338, 130652. [Google Scholar] [CrossRef] [Scilit]
- Al-Saidi, M.; Elagib, N.A. Towards understanding the integrative approach of the water, energy and food nexus. Sci. Total Environ. 2017, 574, 1131–1139. [Google Scholar] [CrossRef] [Scilit]
- Do, P.; Tian, F.; Zhu, T.; Zohidov, B.; Ni, G.; Lu, H.; Liu, H. Exploring synergies in the water-food-energy nexus by using an integrated hydro-economic optimization model for the Lancang-Mekong River basin. Sci. Total Environ. 2020, 728, 137996. [Google Scholar] [CrossRef] [Scilit]
- Kaddoura, S.; El Khatib, S. Review of water-energy-food Nexus tools to improve the Nexus modelling approach for integrated policy making. Environ. Sci. Policy 2017, 77, 114–121. [Google Scholar] [CrossRef] [Scilit]
- Ma, Y.; Li, Y.; Zhang, Y.; Huang, G. Mathematical modeling for planning water-food-ecology-energy nexus system under uncertainty: A case study of the Aral Sea Basin. J. Clean. Prod. 2021, 308, 127368. [Google Scholar] [CrossRef] [Scilit]
- Venghaus, S.; Hake, J.-F. Nexus thinking in current EU policies–The interdependencies among food, energy and water resources. Environ. Sci. Policy 2018, 90, 183–192. [Google Scholar] [CrossRef] [Scilit]
- Nasrollahi, H.; Shirazizadeh, R.; Shirmohammadi, R.; Pourali, O.; Amidpour, M. Unraveling the water-energy-food-environment nexus for climate change adaptation in Iran: Urmia Lake Basin case-study. Water 2021, 13, 1282. [Google Scholar] [CrossRef] [Scilit]
- Parsinejad, M.; Rosenberg, D.E.; Ghale, Y.A.G.; Khazaei, B.; Null, S.E.; Raja, O.; Safaie, A.; Sima, S.; Sorooshian, A.; Wurtsbaugh, W.A. 40-years of Lake Urmia restoration research: Review, synthesis and next steps. Sci. Total Environ. 2022, 832, 155055. [Google Scholar] [CrossRef] [Scilit] [PubMed]
- Alizadeh-Choobari, O.; Ahmadi-Givi, F.; Mirzaei, N.; Owlad, E. Climate change and anthropogenic impacts on the rapid shrinkage of Lake Urmia. Int. J. Climatol. 2016, 36, 4276–4286. [Google Scholar] [CrossRef] [Scilit]
- Bakhshianlamouki, E.; Masia, S.; Karimi, P.; van der Zaag, P.; Sušnik, J. A system dynamics model to quantify the impacts of restoration measures on the water-energy-food nexus in the Urmia lake Basin, Iran. Sci. Total Environ. 2020, 708, 134874. [Google Scholar] [CrossRef] [Scilit] [PubMed]
- AghaKouchak, A.; Norouzi, H.; Madani, K.; Mirchi, A.; Azarderakhsh, M.; Nazemi, A.; Nasrollahi, N.; Farahmand, A.; Mehran, A.; Hasanzadeh, E. Aral Sea syndrome desiccates Lake Urmia: Call for action. J. Great Lakes Res. 2015, 41, 307–311. [Google Scholar] [CrossRef] [Scilit]
- Madadi, P.; Masnavi, M.R. Environmental planning of urban green infrastructure networks in the eco-city framework, the case of Ghare-Kahriz Arak, Iran. Discov. Cities 2025, 2, 92. [Google Scholar] [CrossRef] [Scilit]
- Hassanzadeh, E.; Zarghami, M.; Hassanzadeh, Y. Determining the main factors in declining the Urmia Lake level by using system dynamics modeling. Water Resour. Manag. 2012, 26, 129–145. [Google Scholar] [CrossRef] [Scilit]
- AghaKouchak, A.; Feldman, D.; Hoerling, M.; Huxman, T.; Lund, J. Water and climate: Recognize anthropogenic drought. Nature 2015, 524, 409–411. [Google Scholar] [CrossRef] [Scilit]
- Madani, K. Water management in Iran: What is causing the looming crisis? J. Environ. Stud. Sci. 2014, 4, 315–328. [Google Scholar] [CrossRef] [Scilit]
- Eimanifar, A.; Mohebbi, F. Urmia Lake (northwest Iran): A brief review. Saline Syst. 2007, 3, 5. [Google Scholar] [CrossRef] [Scilit]
- Dehghanipour, A.H.; Schoups, G.; Zahabiyoun, B.; Babazadeh, H. Meeting agricultural and environmental water demand in endorheic irrigated river basins: A simulation-optimization approach applied to the Urmia Lake basin in Iran. Agric. Water Manag. 2020, 241, 106353. [Google Scholar] [CrossRef] [Scilit]
- Kamrani, K.; Roozbahani, A.; Shahdany, S.M.H. Using Bayesian networks to evaluate how agricultural water distribution systems handle the water-food-energy nexus. Agric. Water Manag. 2020, 239, 106265. [Google Scholar] [CrossRef] [Scilit]
- Barhagh, S.E.; Zarghami, M.; Ghale, Y.A.G.; Shahbazbegian, M.R. System dynamics to assess the effectiveness of restoration scenarios for the Urmia Lake: A prey-predator approach for the human-environment uncertain interactions. J. Hydrol. 2021, 593, 125891. [Google Scholar] [CrossRef] [Scilit]
- Ravar, Z.; Zahraie, B.; Sharifinejad, A.; Gozini, H.; Jafari, S. System dynamics modeling for assessment of water–food–energy resources security and nexus in Gavkhuni basin in Iran. Ecol. Indic. 2020, 108, 105682. [Google Scholar] [CrossRef] [Scilit]
- El-Gafy, I. Water–food–energy nexus index: Analysis of water–energy–food nexus of crop’s production system applying the indicators approach. Appl. Water Sci. 2017, 7, 2857–2868. [Google Scholar] [CrossRef] [Scilit]
- Sadeghi, S.H.; Moghadam, E.S.; Delavar, M.; Zarghami, M. Application of water-energy-food nexus approach for designating optimal agricultural management pattern at a watershed scale. Agric. Water Manag. 2020, 233, 106071. [Google Scholar] [CrossRef] [Scilit]
- Zahedi, M.; Mondani, F.; Eshghizadeh, H.R. Analyzing the energy balances of double-cropped cereals in an arid region. Energy Rep. 2015, 1, 43–49. [Google Scholar] [CrossRef] [Scilit]

Disclaimer/Publisher’s Note: The statements, opinions and data contained in all publications are solely those of the individual author(s) and contributor(s) and not of MDPI and/or the editor(s). MDPI and/or the editor(s) disclaim responsibility for any injury to people or property resulting from any ideas, methods, instructions or products referred to in the content. |
© 2026 by the authors. Licensee MDPI, Basel, Switzerland. This article is an open access article distributed under the terms and conditions of the Creative Commons Attribution (CC BY) license.