Article

Impact Analysis of Tunnel Sidewall Decoration on Driving Safety: An Exploration of Element Complexity and Pattern Spacing Coupling Coordination Using Driving Simulator Technology

1
Shanxi Transport Safety & Emergency Technology Center (Co., Ltd.), Taiyuan 030032, China
2
College of Metropolitan Transportation, Beijing University of Technology, Beijing 100124, China
3
Beijing Intelligent Transportation Development Center, Beijing 100073, China
*
Author to whom correspondence should be addressed.
Sustainability 2026, 18(2), 844; https://doi.org/10.3390/su18020844
Submission received: 26 October 2025 / Revised: 29 December 2025 / Accepted: 7 January 2026 / Published: 14 January 2026
(This article belongs to the Section Sustainable Transportation)

Abstract

As a novel traffic security facility to improve the environment of tunnels, the influence of tunnel sidewall decoration on drivers has been highly controversial. To analyze the impact of the multi-factor coupling of sidewall decoration effects on driving safety, eight combination schemes with different pattern elements and pattern spacings were designed to create a driving simulation environment. Twenty-seven drivers were recruited to obtain fine-grained driving behavior indicators via driving simulation experiments. The velocity following ratio, steering wheel angle, maximum deceleration, and accelerator power were selected to construct an index system. The visual information load of drivers was quantified by the landscape color quantified theory. Based on the analysis of the influence of the singular factor of the pattern element or pattern spacing on driving behavior, a coupling coordination degree model is introduced to quantify the relationship between the complexity of the pattern elements, the pattern spacing, and the coupling coordination degree, and a reasonable combination of their complexities is selected. The results show that the element complexity and pattern spacing of tunnel sidewall decoration have significant effects on driving behavior. Among the schemes considered in this study, the coupling effect of an element complexity of 562.1 and a pattern spacing of 5.5 m was found to be the optimal combination. The coupling coordination degree should be more than 0.8 as the threshold, and the model analysis results indicated that when the pattern spacing was fixed at about 10 m, the ideal element complexity was between 135.6–564.7. This study offers both theoretical and technical support for enhancing traffic safety through tunnel sidewall decoration. By defining optimal thresholds for information density and pattern spacing, it lays a solid foundation for the development of a standardized guideline on decoration content.

1. Introduction

As essential components of transportation infrastructure, tunnels offer distinct advantages in overcoming topographic barriers, optimizing road alignment, and reducing travel time. With China’s ongoing initiative to strengthen its transportation network, tunnel construction has expanded rapidly. By the end of 2024, the national highway system included 28,724 tunnels spanning 32,596.6 km, of which 2261 were extra-long tunnels with a combined length of 10,328.7 km [1]. However, the enclosed structure and semi-confined environment of tunnels create sharp contrasts in light levels between the interior and exterior. Sudden changes in illumination, combined with visually monotonous interior conditions, can induce visual illusions and psychological stress among drivers. This may lead to misjudgments of speed, direction, and following distance, increasing the likelihood of unsafe behaviors such as speeding, rear-end collisions, and other traffic conflicts. Previous research underscores the importance of traffic safety facilities in reducing tunnel accident severity, as they mitigate visual and physical disturbances, provide clear guidance, and improve overall driving conditions [2,3].
Building on this understanding, studies have systematically investigated the effects and design parameters of specific key facilities within tunnels, such as traffic signs [4,5], raised pavement markers [6,7], and retroreflective arches [8,9]. Research indicates that the informational load of traffic signs significantly influences driver visual behavior [10]. Specifically, speed limit signs containing 8.90–33.32 bits of information have been confirmed to be particularly effective for speed control [11], while the integration of prohibition signs with red pavement markings enhances speed regulation and driving smoothness at tunnel entrances [12]. Similarly, raised pavement markers have been demonstrated to improve driver alertness and speed perception within tunnels [13]. For the guidance of drivers in complex tunnel geometries, the use of three visible retroreflective arches has been proven effective in mitigating curve illusion and improving perceptual accuracy in curved sections [14]. Furthermore, the spatial perception of clearance can be enhanced through the combined or strategic placement of retroreflective arches and delineators [15]. In the most challenging environments, such as long spiral tunnels, a comprehensive visual guidance system incorporating edge markings alongside retroreflective arches has been shown to most effectively support driver spatial awareness [16].
In addition, the role of tunnel sidewall decoration in improving tunnel traffic safety has also been initially verified as a novel traffic safety facility to improve the tunnel environment. Empirical studies demonstrate that decorated sidewalls enhance drivers’ emotional state, spatial perception, and speed control compared to unadorned tunnel walls [17,18].
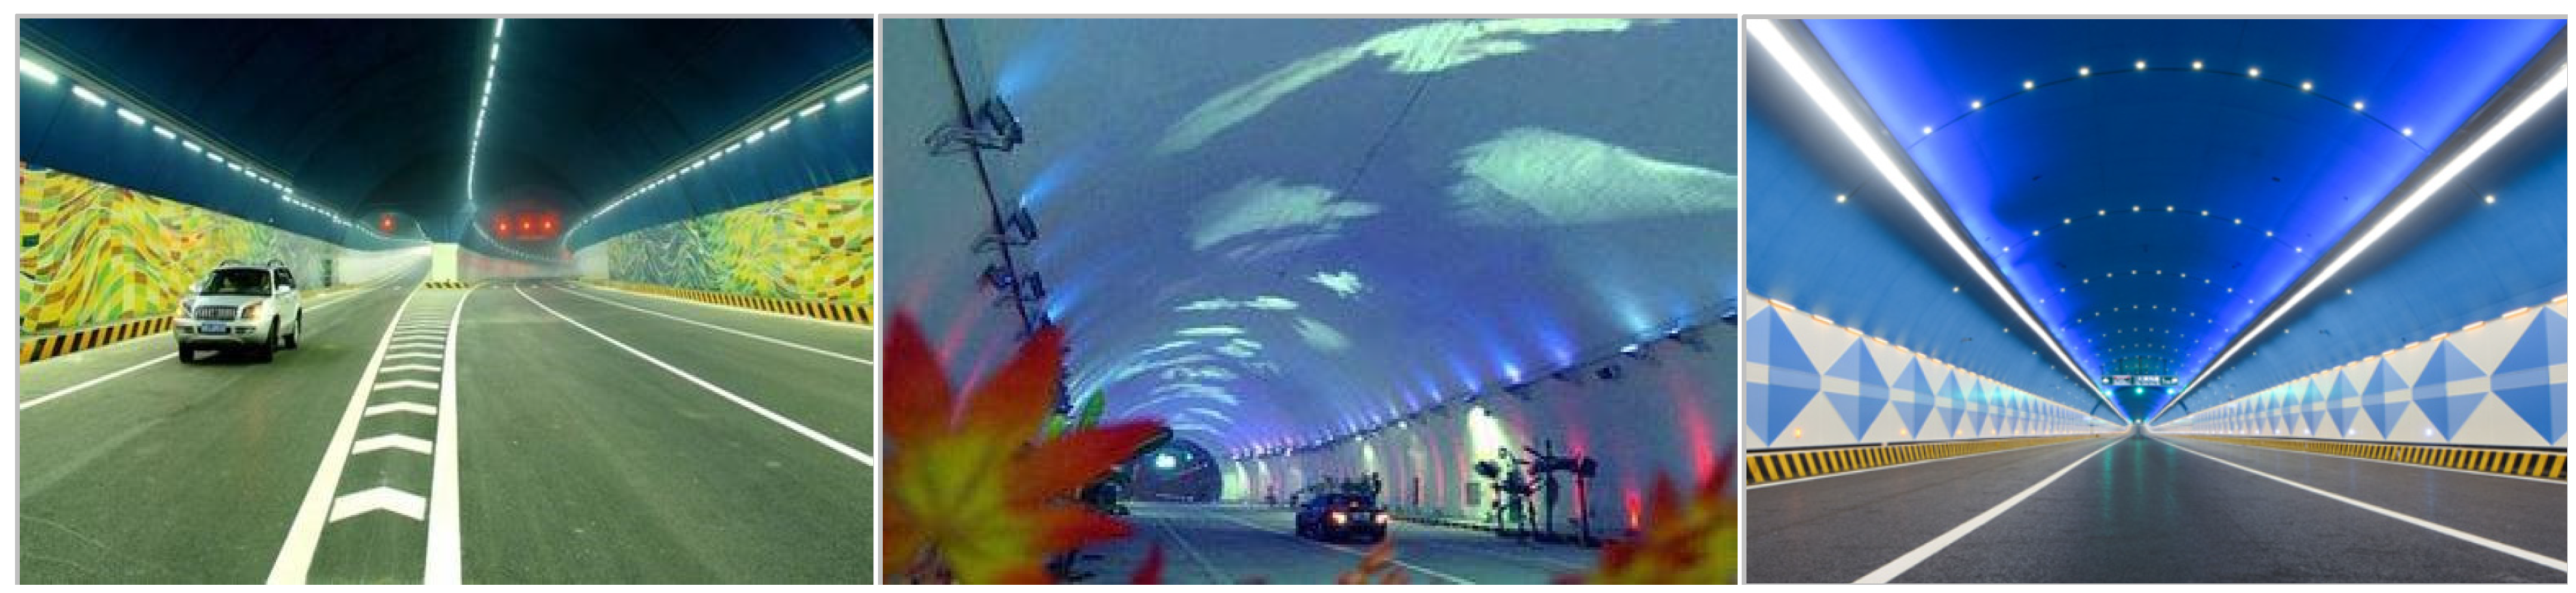
However, with the continuous development of highway tunnel construction, the existing design parameters for tunnel sidewall decoration are diversified, thus forming a variety of tunnel sidewall decorations whose safety and rationality remain to be studied (cf. Figure 1). In fact, the pattern elements, color, rhythm, and spacing of decorated sidewalls in tunnels are important factors to be considered in their design. Among these parameters, pattern elements have been shown to directly influence driving behavior. Studies indicate that pattern complexity affects speed regulation, operational stability, and attentional allocation [19], while different pattern types alter visual load and search efficiency [20]. Well-designed patterns, such as landscape themes, can guide attention without causing distraction [21]. Color also plays a critical role. Light-colored walls are known to better maintain driver focus [22], and specific schemes like blue-white combinations enhance perceptual performance [23]. Colored rhythmic markers further improve reaction times compared to monochromatic ones, whereas plain white walls may exacerbate visual fatigue [24]. Regarding rhythm and spacing, an optimal spatial interval of 10–20 m improves driving performance [25], and a temporal frequency of 4–8 Hz can induce mild speed overestimation to aid speed maintenance [26,27]. Rhythmically designed cues also help shorten reaction times and alleviate fatigue [28].
In summary, while prior studies have validated the safety benefits of sidewall decoration and examined the individual effects of parameters such as pattern, color, and spacing, they have largely relied on isolated, subjective, or static assessments. This fragmented approach overlooks the synergistic interactions among parameters, which are fundamental in real-world driving where behavior results from the coupled influence of multiple factors. Therefore, advancing toward a holistic, systems-level understanding requires a methodological framework capable of deciphering these multi-factor coupling mechanisms.
Driving simulation offers a practical and safe experimental platform for tunnel studies, balancing ecological limitations with procedural control and cost efficiency. Although differences between simulated and real-road conditions exist, simulator data have demonstrated trend-level consistency with naturalistic driving, supporting their validity for controlled investigation [29,30]. To analyze such data, coupling coordination models offer a systematic framework for quantifying interaction strength and synergy among design parameters. This approach enables a deeper understanding of the interdependent mechanisms in sidewall decoration and facilitates the translation of research into evidence-based engineering guidelines [31,32].
Based on the above, this study develops a typical extra-long tunnel scenario through driving simulation to design and evaluate sidewall decoration schemes. It investigates the coupling effects of pattern elements and spacing on driving behavior, with the aim of providing a theoretical basis for optimizing sidewall design and supporting the development of relevant specifications. The study addresses the following questions:
(1)
How can the parameters for tunnel sidewall decoration, such as pattern elements and spacing, be effectively determined to meet drivers’ visual and cognitive needs?
(2)
How do pattern elements and spacing interactively affect driving behavior?
(3)
Which combination of pattern and spacing delivers the best overall performance, and how can the findings contribute to improved traffic safety in tunnels?

2. Methodology

2.1. Driving Simulation Experiment

2.1.1. Scenario Design

To analyze the multi-factor coupling effects of tunnel sidewall decoration on driving behavior, a driving simulation experiment was conducted using the Xingyan Expressway as the scenario development prototype. This expressway served as one of the main routes for the Beijing 2022 Winter Olympic Games. The corresponding tunnel design parameters are presented in Table 1.
Concerning the choice of design elements for tunnel sidewall decoration, the Xingyan Expressway serves as a key corridor supporting the Winter Olympics and plays an important role in presenting Beijing’s Olympic and regional cultural identity. Accordingly, three representative decorative schemes were designed by sequentially incorporating Winter Olympics sports icons, the “Ice Ribbon” motif of the National Speed Skating Oval, and ice- and snow-themed figures, together with a baseline condition without any sidewall decoration. From the perspective of arousal theory, driving performance is optimized at a moderate level of arousal, which can be enhanced through appropriate visual stimulation in monotonous tunnel environments [33,34]. Therefore, the selected pattern elements were treated as graded levels of visual complexity to provide controlled visual stimulation while avoiding excessive distraction.
The selection of decorative pattern rhythm and spacing was guided by established findings from optical illusion theory and visual motion perception [35,36]. Previous studies indicate that distortions in speed and distance perception contribute substantially to drivers’ speeding behavior, and that inappropriate visual rhythms may exacerbate such effects [37]. In particular, edge rates above approximately 4 Hz may induce speed overestimation and degrade driving stability. In contrast, excessively low edge rates fail to provide adequate visual stimulation, which consequently impairs speed perception [38,39,40]. Accordingly, 4 Hz was adopted as the upper limit of visual rhythm, and a set of rhythm frequencies (4, 2, 1.26, 0.94, and 0.75 Hz) was selected to span the perceptually effective range reported in the literature.
The corresponding pattern spacing (s) was determined using the deterministic relationship between pattern rhythm (f), vehicle speed (v), and spacing:
s =   v f ,
Under the tunnel speed limit of 80 km/h, this resulted in pattern spacings of 5.5, 11.5, 17.5, 23.5, and 29.5 m. These values are consistent with previously reported effective spacing ranges for tunnel sidewall visual guidance and comply with practical engineering constraints in real tunnel environments [41,42].
Regarding the selection of pattern color for the tunnel sidewall decoration, color psychology suggests that color can directly influence emotional state and visual comfort in enclosed environments [43]. Previous studies have shown that light blue tones can stabilize emotions and alleviate visual fatigue during driving [44]. Accordingly, sky blue was selected as the primary color for all decoration schemes to mitigate the negative sidewall effect associated with closed tunnel environments, while avoiding confounding influences from color variation.
Based on the above considerations, the two experimental factors, decorative element complexity and pattern spacing, were combined to produce a total of eight tunnel sidewall decoration schemes, summarized in Table 2.
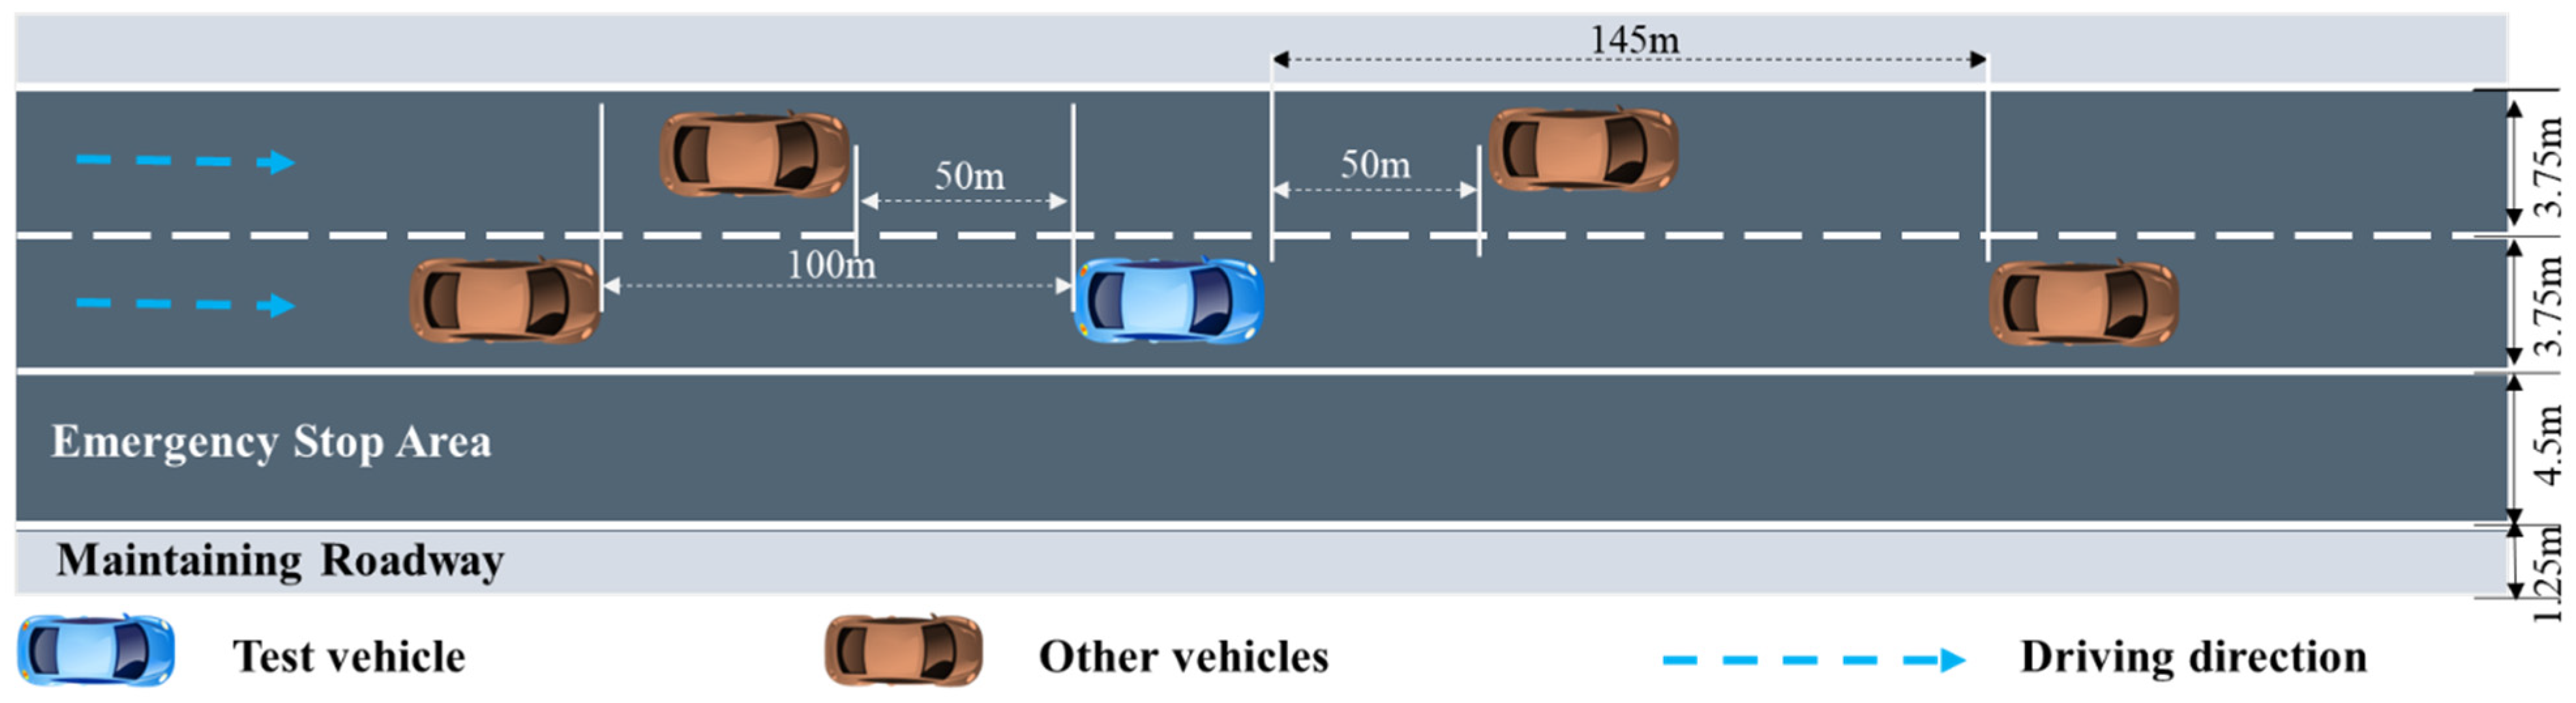
To enhance realism while minimizing potential interference from surrounding traffic, random traffic flow was introduced into the simulation. To ensure that the experimental vehicle was not affected by leading vehicles, the headway distance was maintained at more than 100 m, which exceeds the minimum safe stopping distance required for emergency braking. This setting allowed the driving environment within the tunnel to be realistically simulated without compromising the validity of the experimental data (Figure 2).

2.1.2. Experimental Facilities

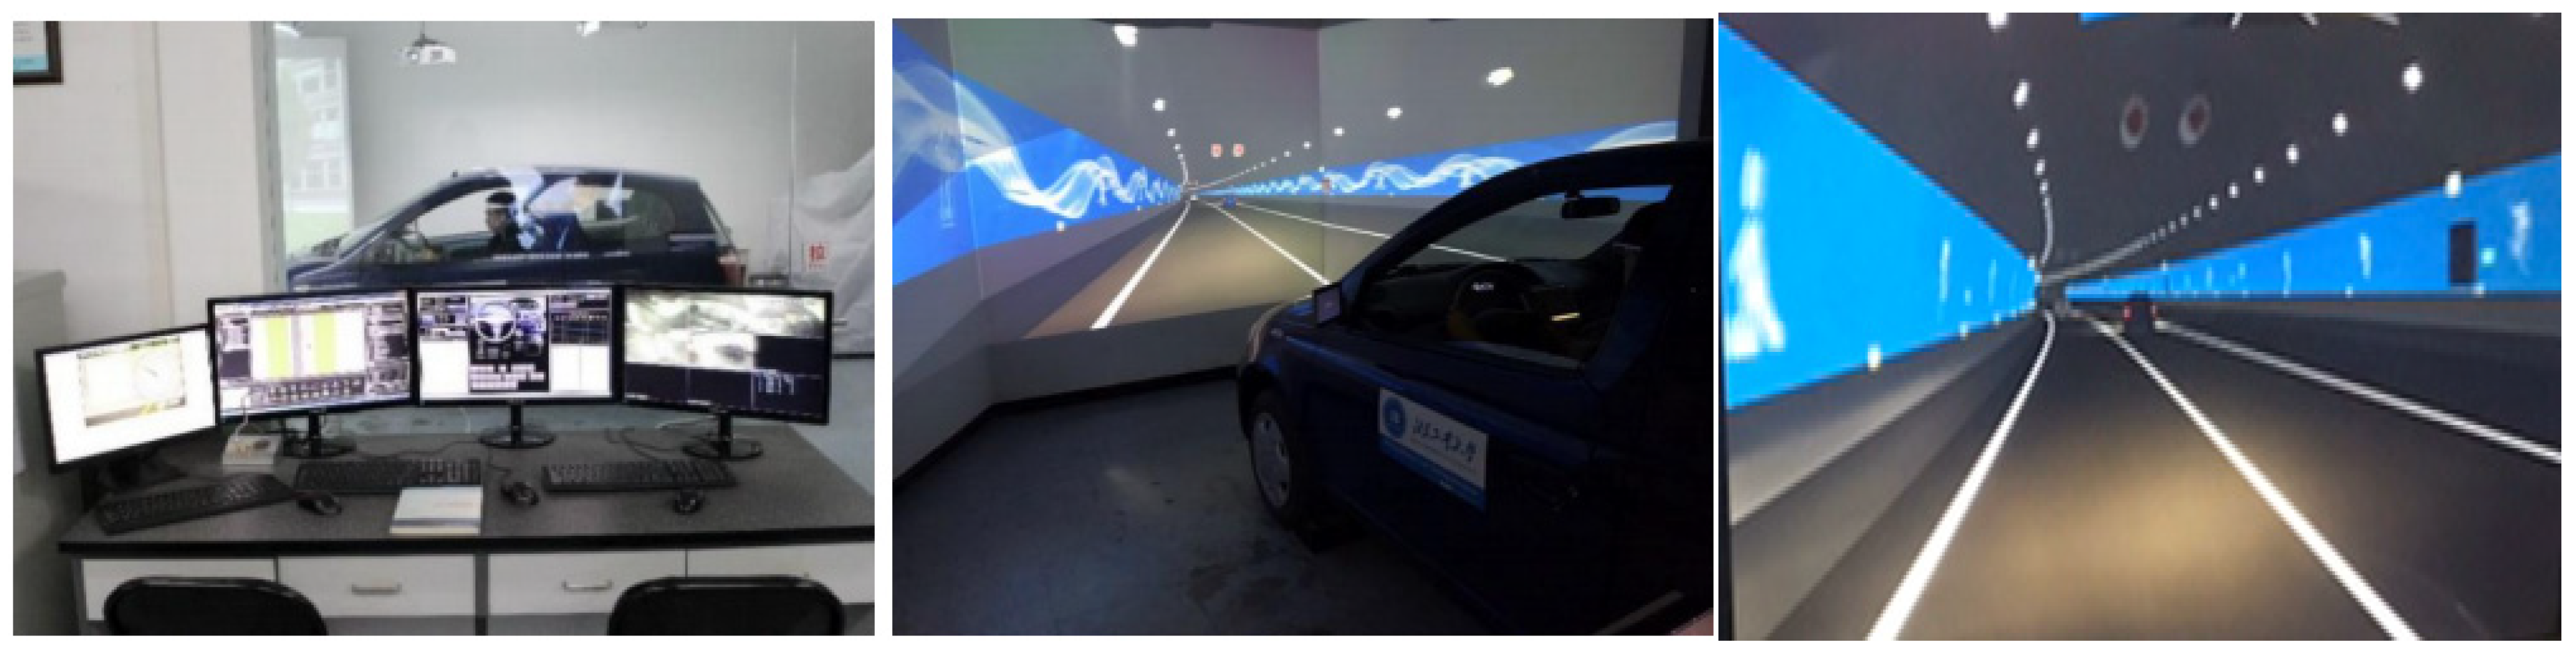
This experiment employed a fixed-pedal driving simulator (Figure 3) provided by Beijing University of Technology. The simulator operates at a 60 Hz sampling frequency to record vehicle operational parameters, including lateral position, braking, steering wheel angle, acceleration, speed, and throttle input. It features a screen resolution of 1920 × 1080 [45].
To verify the accuracy of the collected data, speed measurements from real vehicle tests and driving simulations were compared. The results confirm that the simulator provides accurate speed data [46,47]. Furthermore, the reliability of other key driving indicators obtained from simulators, such as acceleration, lateral position, and steering wheel angle, is well established in prior studies [48,49].

2.1.3. Participants

The study recruited twenty-seven participants from universities and the general community. Among them, 70.4% were male and 29.6% were female, a distribution consistent with the demographic characteristics of drivers in China. Importantly, all participants met the specified criteria for the driving simulator experiment, which included: (1) possessing a valid motor vehicle driving license; (2) having normal hearing and vision; (3) having at least 2 years of driving experience, including experience on highways; (4) being free from issues such as nausea or dizziness. A comprehensive description of their demographic information is provided in Table 3.
The required sample size was determined by considering the expected variance, target confidence level, and allowable margin of error, following the standard estimation approach [50]:
N   = ( Z α / 2 + Z β ) 2 σ 2 ε 2 ,
where N represents the required number of samples. Z α / 2 denotes the upper ( α / 2 ) th quantile of the standard normal distribution, and Z β denotes the upper (β)th quantile. σ is the population standard deviation, and ε is the difference between the true mean response and a reference value, which can be expressed as ε   = ±   δ σ . The parameter δ reflects the meaningful difference, typically selected within the range of 0.25 to 0.5 when prior information is unavailable [51].
A significance level of 10% was adopted, corresponding to a 90% confidence level for the estimated parameter. To maintain a balance between statistical power and experimental cost, a power of 80% and a meaningful difference of 0.5 were used. Under these conditions, the calculated sample size was 25. Therefore, the chosen sample size in this study ensures adequate reliability for the experimental analyses performed.

2.1.4. Procedure of Experiment

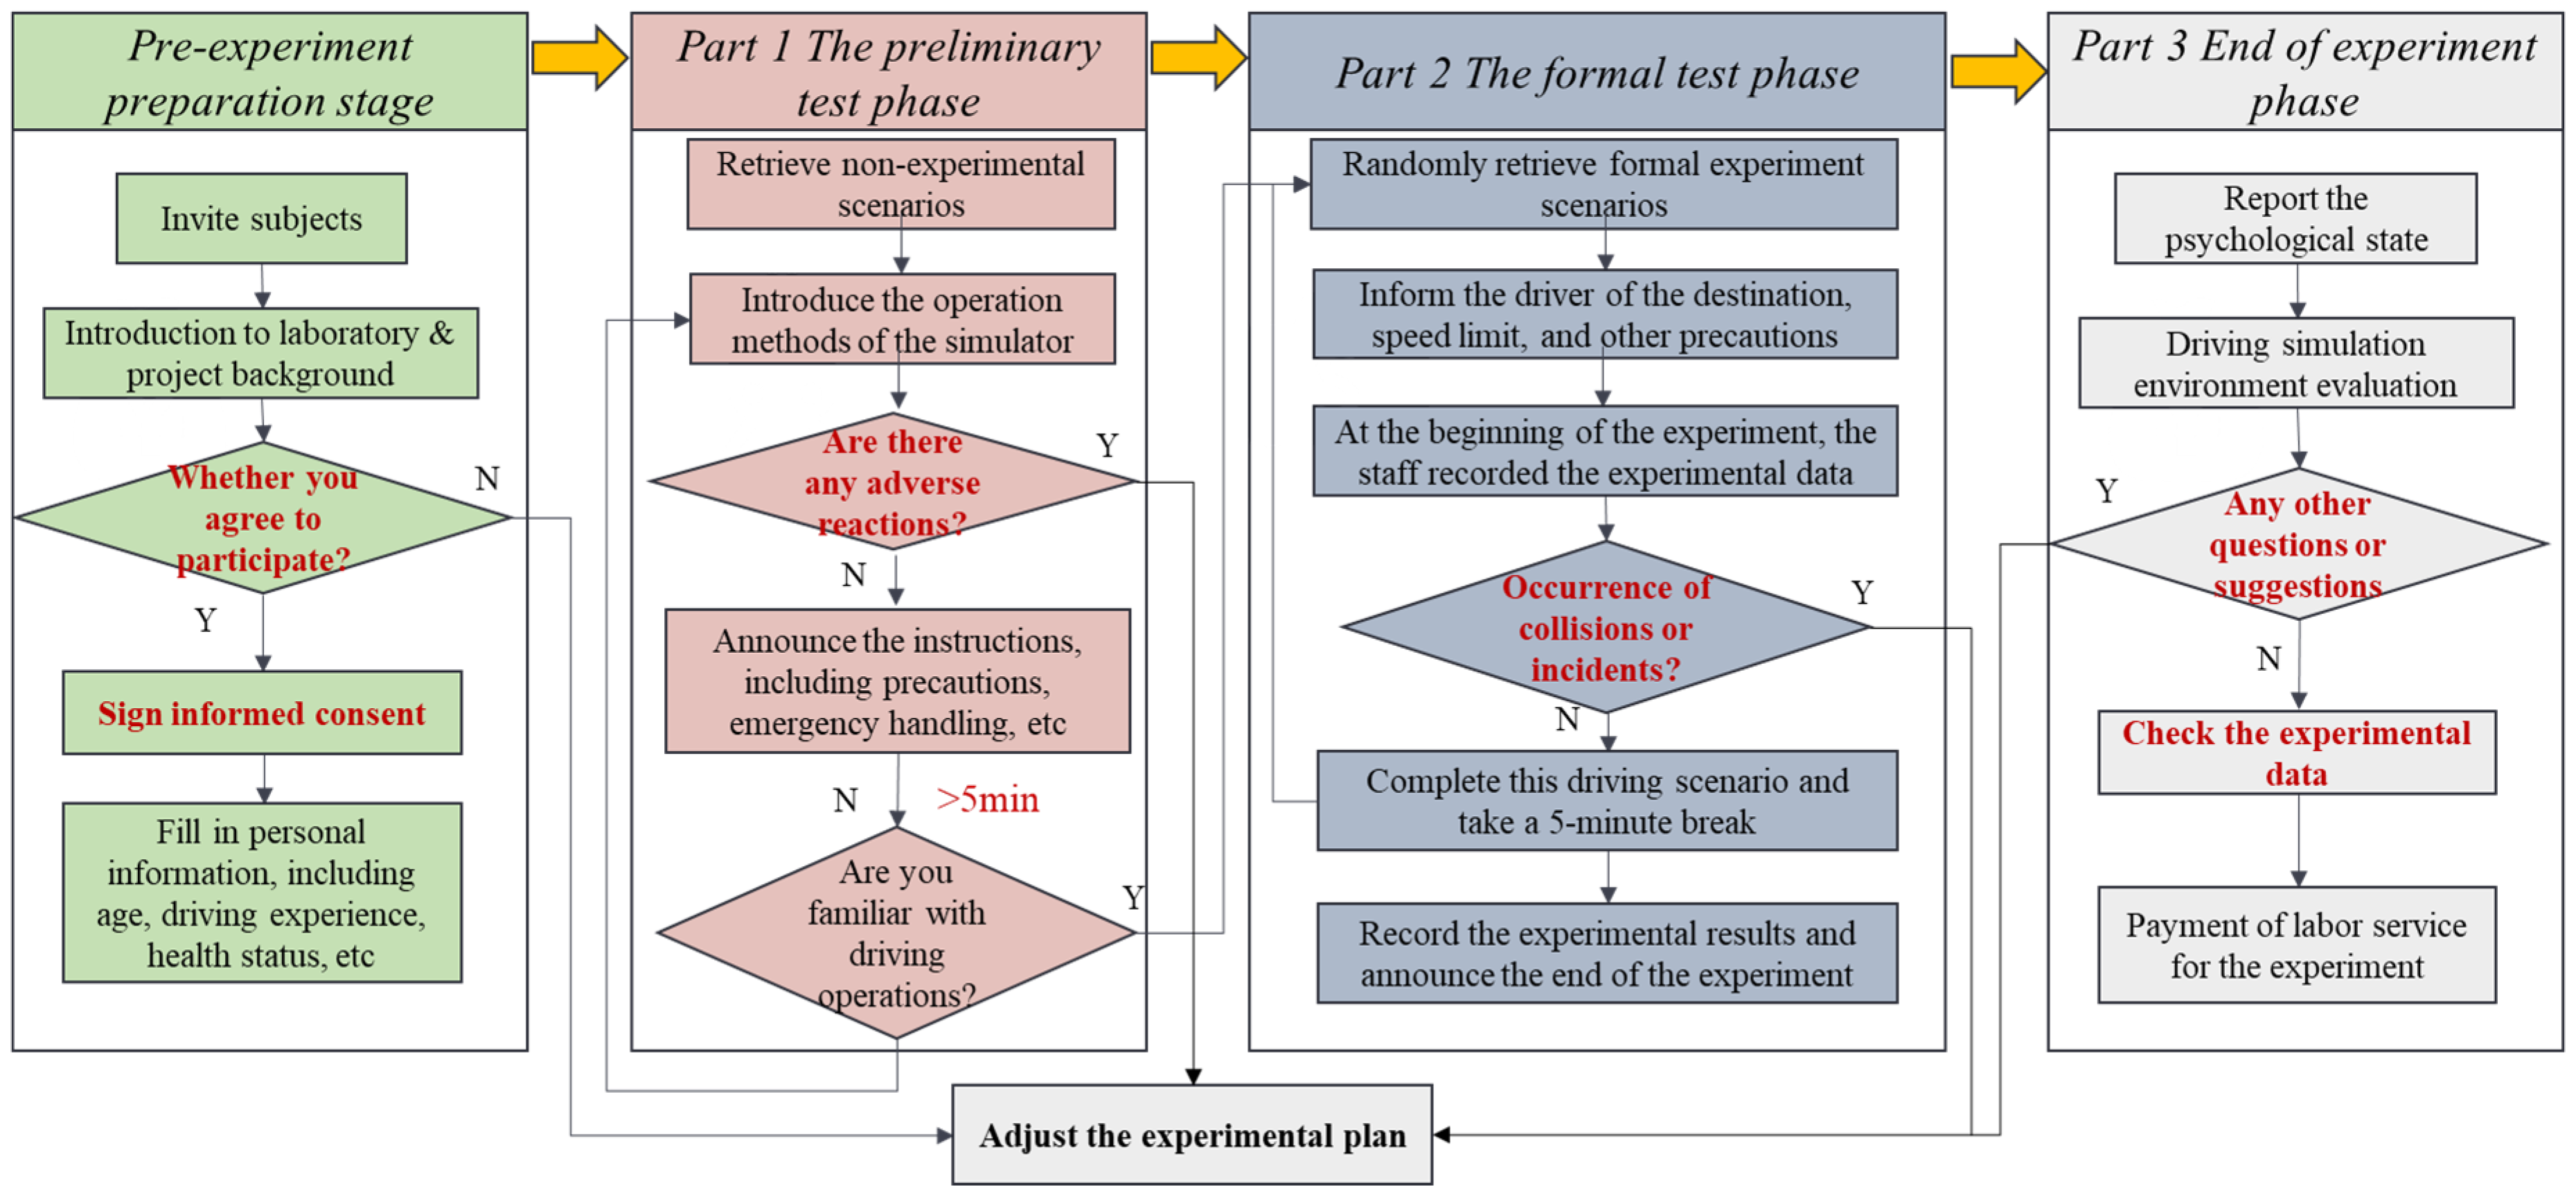
The content of the experiment consisted of a preliminary test, a formal test, and a subjective post-test questionnaire. Prior to participating in the driving simulator experiment, participants were informed about the experimental procedure and the potential risks associated with the study. They were also required to sign a written informed consent form.
During the preliminary test phase, participants were asked to provide their personal information and report their mental state before the experiment. Following this, a trial scenario was selected to assess the participants’ adaptability to the simulated driving environment. This phase allowed participants to become familiar with the experimental process, including safety precautions, emergency procedures, and equipment usage, through a period of practice driving.
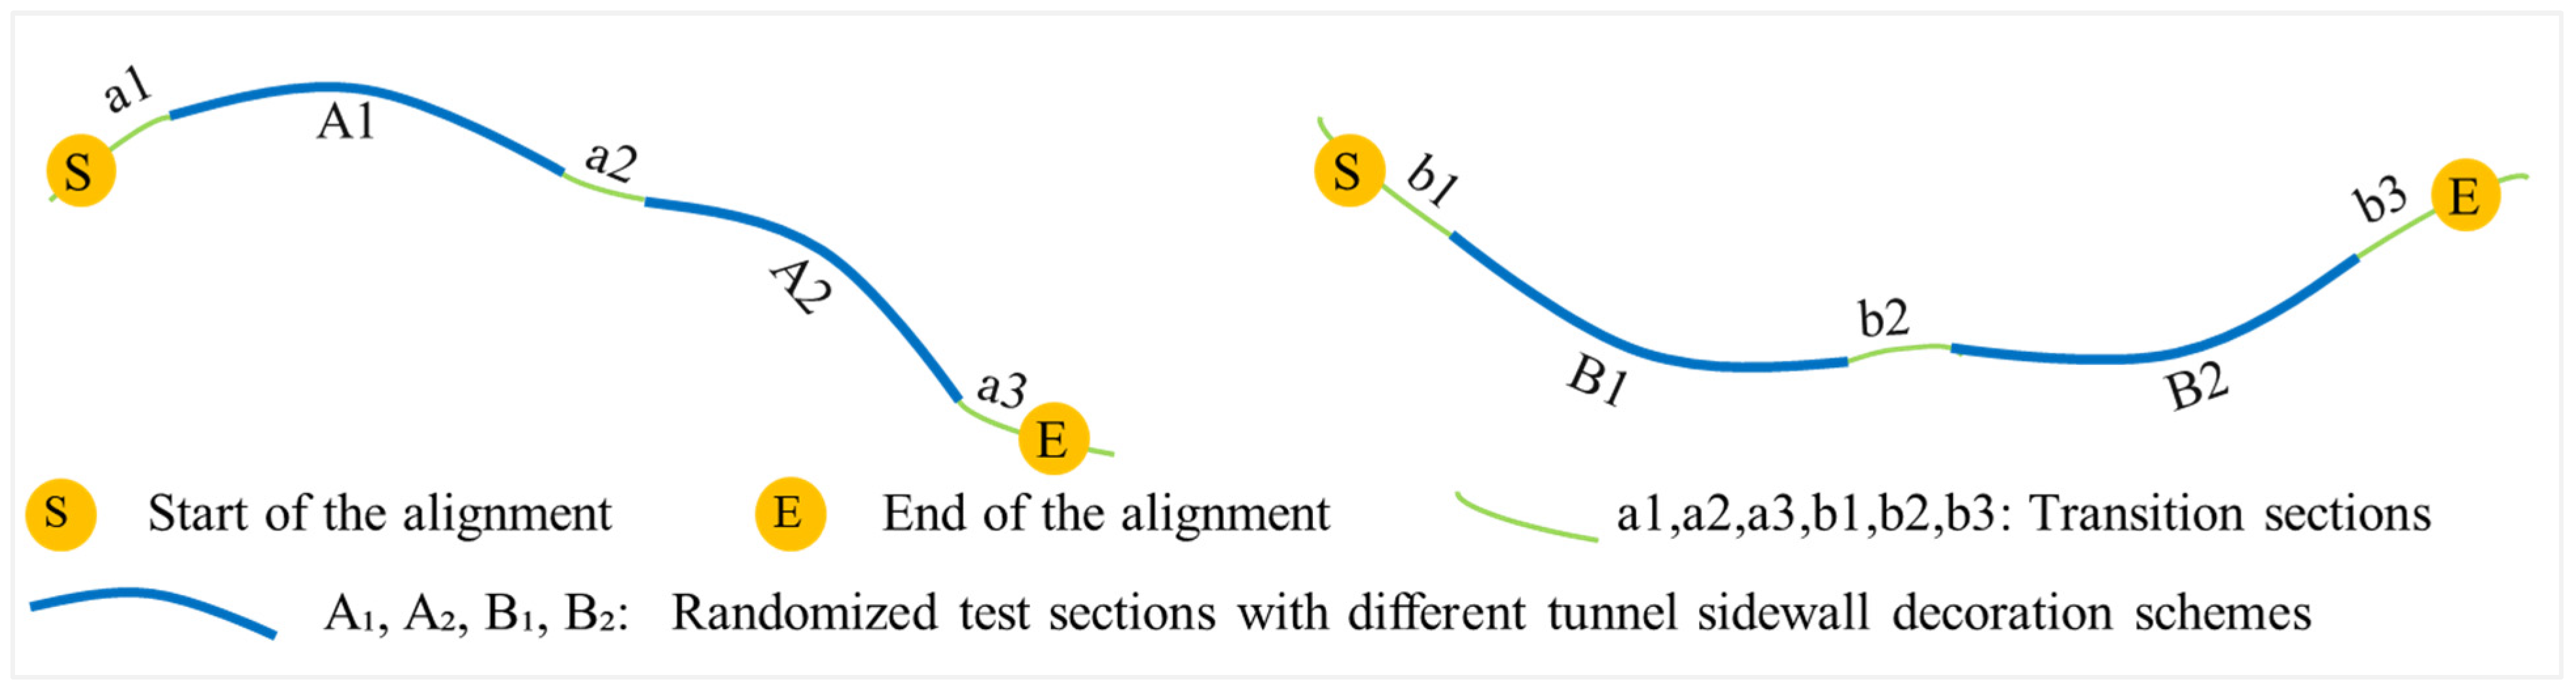
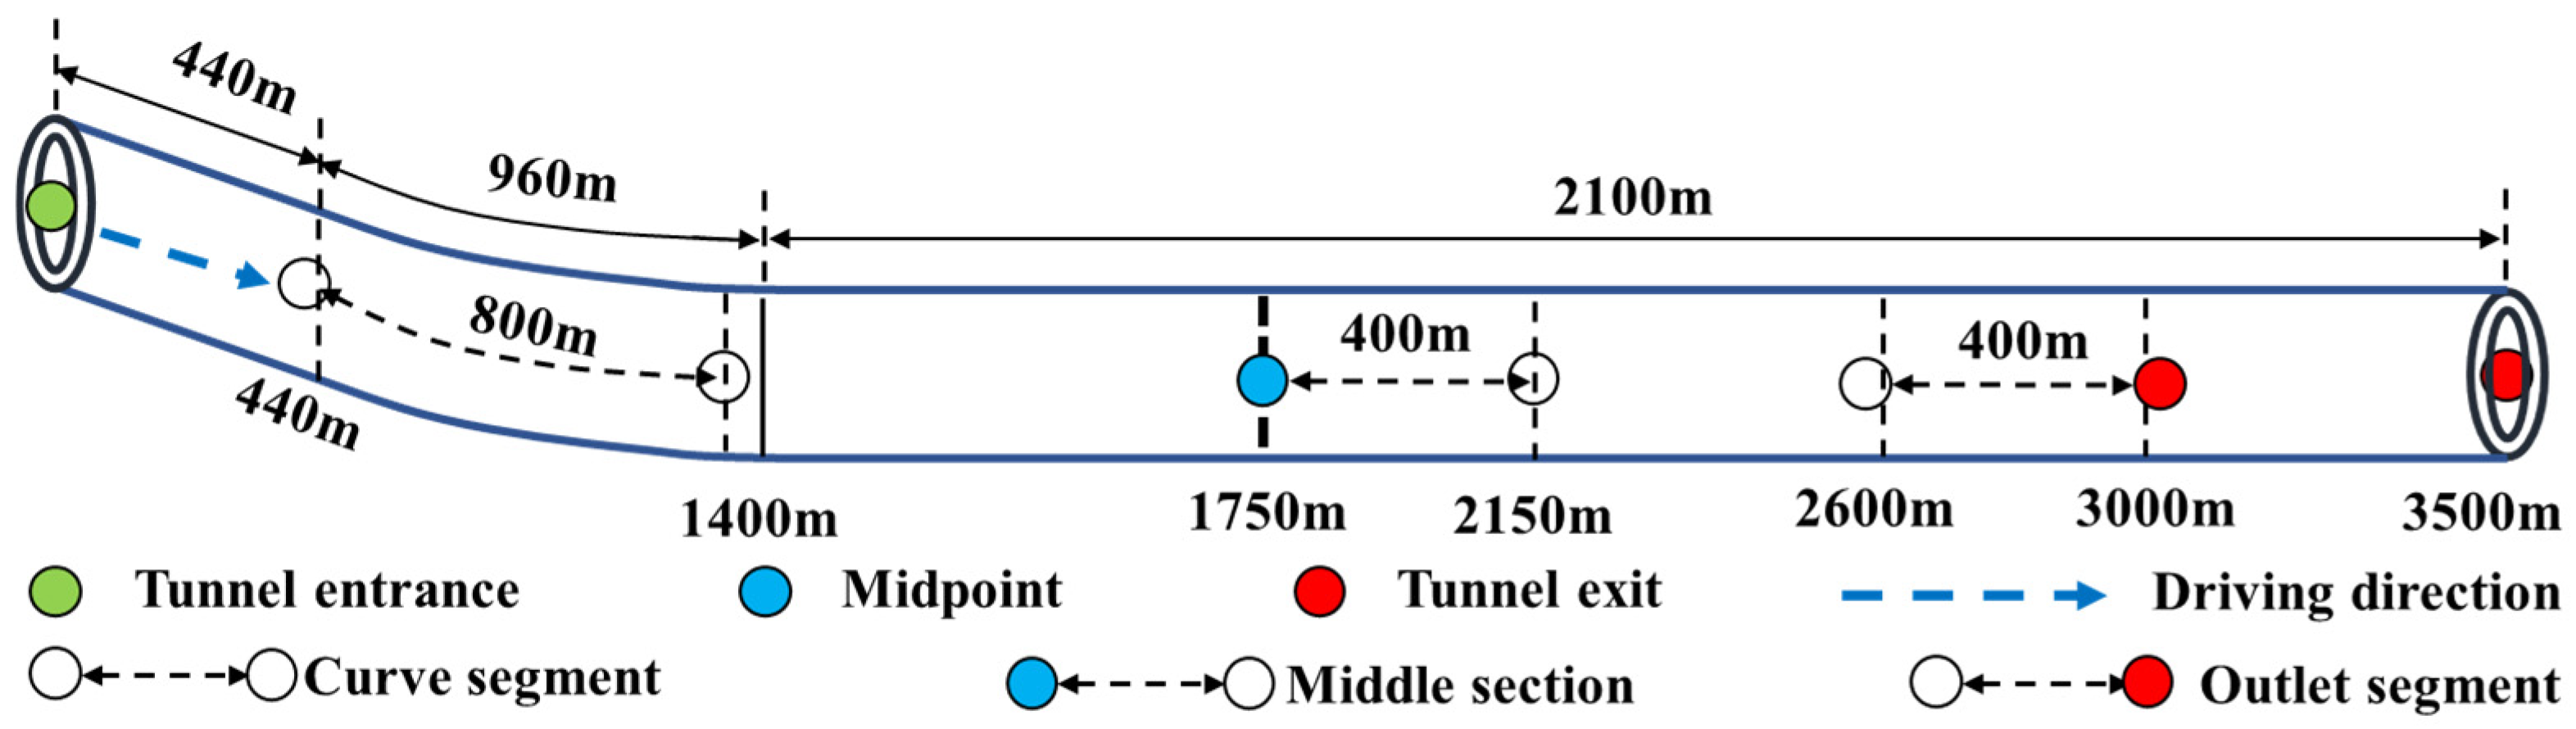
During the formal test phase, each driver needed to drive a total of eight tunnels. To prevent fatigue caused by prolonged driving, subjects were requested to participate for two tests more than two days apart. The path was randomly selected for each test, and the scenes in the path were randomly arranged. Furthermore, to maximize the independence between successive tunnel tests, transition sections of approximately 1.5 km were incorporated. This length was determined based on drivers’ visual adaptation and fatigue recovery characteristics in tunnel environments, supported by previous simulation and empirical studies [52]. The transition sections were intended to alleviate cumulative visual load and psychological confinement, rather than serving as experimental variables. The experimental scenario roadmap is shown in Figure 4.
After completing the tests, each driver was asked to fill out a questionnaire, providing subjective evaluations of the tunnel simulation scenario and sharing insights into their physical and psychological well-being following the experiment. The overall experimental procedure is illustrated in Figure 5.

2.2. Acquisition and Processing of the Experimental Data

Post-experiment questionnaire results indicated that the driving process did not induce fatigue or discomfort in the participants. In the simulation assessment of both the driving simulator and the experimental scenario, participants gave an average score of 9 points on a scale from 1 (not realistic) to 10 (highly realistic), demonstrating that the experimental findings offer meaningful reference value for the practical application of tunnel sidewall decoration.
Based on the features of the highway tunnels, the tunnel was segmented into inlet section, middle section and outlet section (Figure 6).

2.3. Indicators

To analyze the effects of decoration element complexity and pattern spacing on driving behavior, indicators were selected from four dimensions: speed regulation level, operation stability level, driving comfort level, and safety awareness level.
The velocity following ratio (%) was used to characterize the driver’s level of speed regulation, reflecting compliance with the posted speed limit under different tunnel sidewall decoration conditions. It is defined as:
v f r = v     v l i m i t v l i m i t ,
where v f r denotes the velocity following ratio, v represents the real-time speed of the vehicle, and v l i m i t denotes the speed limit of 80 km/h used in this experiment.
The steering wheel angle (rad) was adopted to assess operational stability, representing the magnitude of steering input required to maintain lateral vehicle control. Smaller fluctuations indicate more stable driving behavior.
The maximum deceleration (m/s2) was selected as an indicator of driving comfort, reflecting abrupt braking behavior within the tunnel environment. Lower values correspond to smoother vehicle operation and higher comfort levels.
The accelerator power (%·s) was used to characterize safety awareness, integrating both the intensity and duration of accelerator pedal input. Lower values and reduced variability indicate better speed control and enhanced safety awareness.

3. Results

3.1. The Effect of Pattern Elements’ Complexity on Driving Behavior

3.1.1. Information Quantification Method of the Complexity of Pattern Elements

The amount of information conveyed by tunnel sidewall decorations is a key factor influencing driver behavior. Prior to examining the effect of decoration complexity on driving performance, the visual information contained in each design scheme must be quantified. Accordingly, the complexity of pattern elements across all schemes was assessed using landscape color quantification theory [44]. During driving, drivers perceive the traffic environment primarily through dynamic vision, which involves both central and peripheral vision. As speed increases, visual attention heightens, the fixation point recedes, and the role of central vision diminishes. Consequently, variations in the perceived environment become more dependent on peripheral vision, which is strongly influenced by tunnel sidewall decorations [53]. For this reason, the quantitative analysis focused exclusively on the interior sidewall decorations on both sides.
To extract precise color features from the decoration schemes, RGB values were obtained using the Photoshop color selection tool, where R, G, and B represent the red, green, and blue color channels, respectively, each ranging from 0 to 255. The HSV color space was then applied to compute the visual information load, where H denotes hue with a value range of 0 to 255, and S and V represent saturation and brightness, respectively, both ranging from 0 to 100 percent. For consistency in data processing, these values were uniformly converted to the range of 0 to 255.
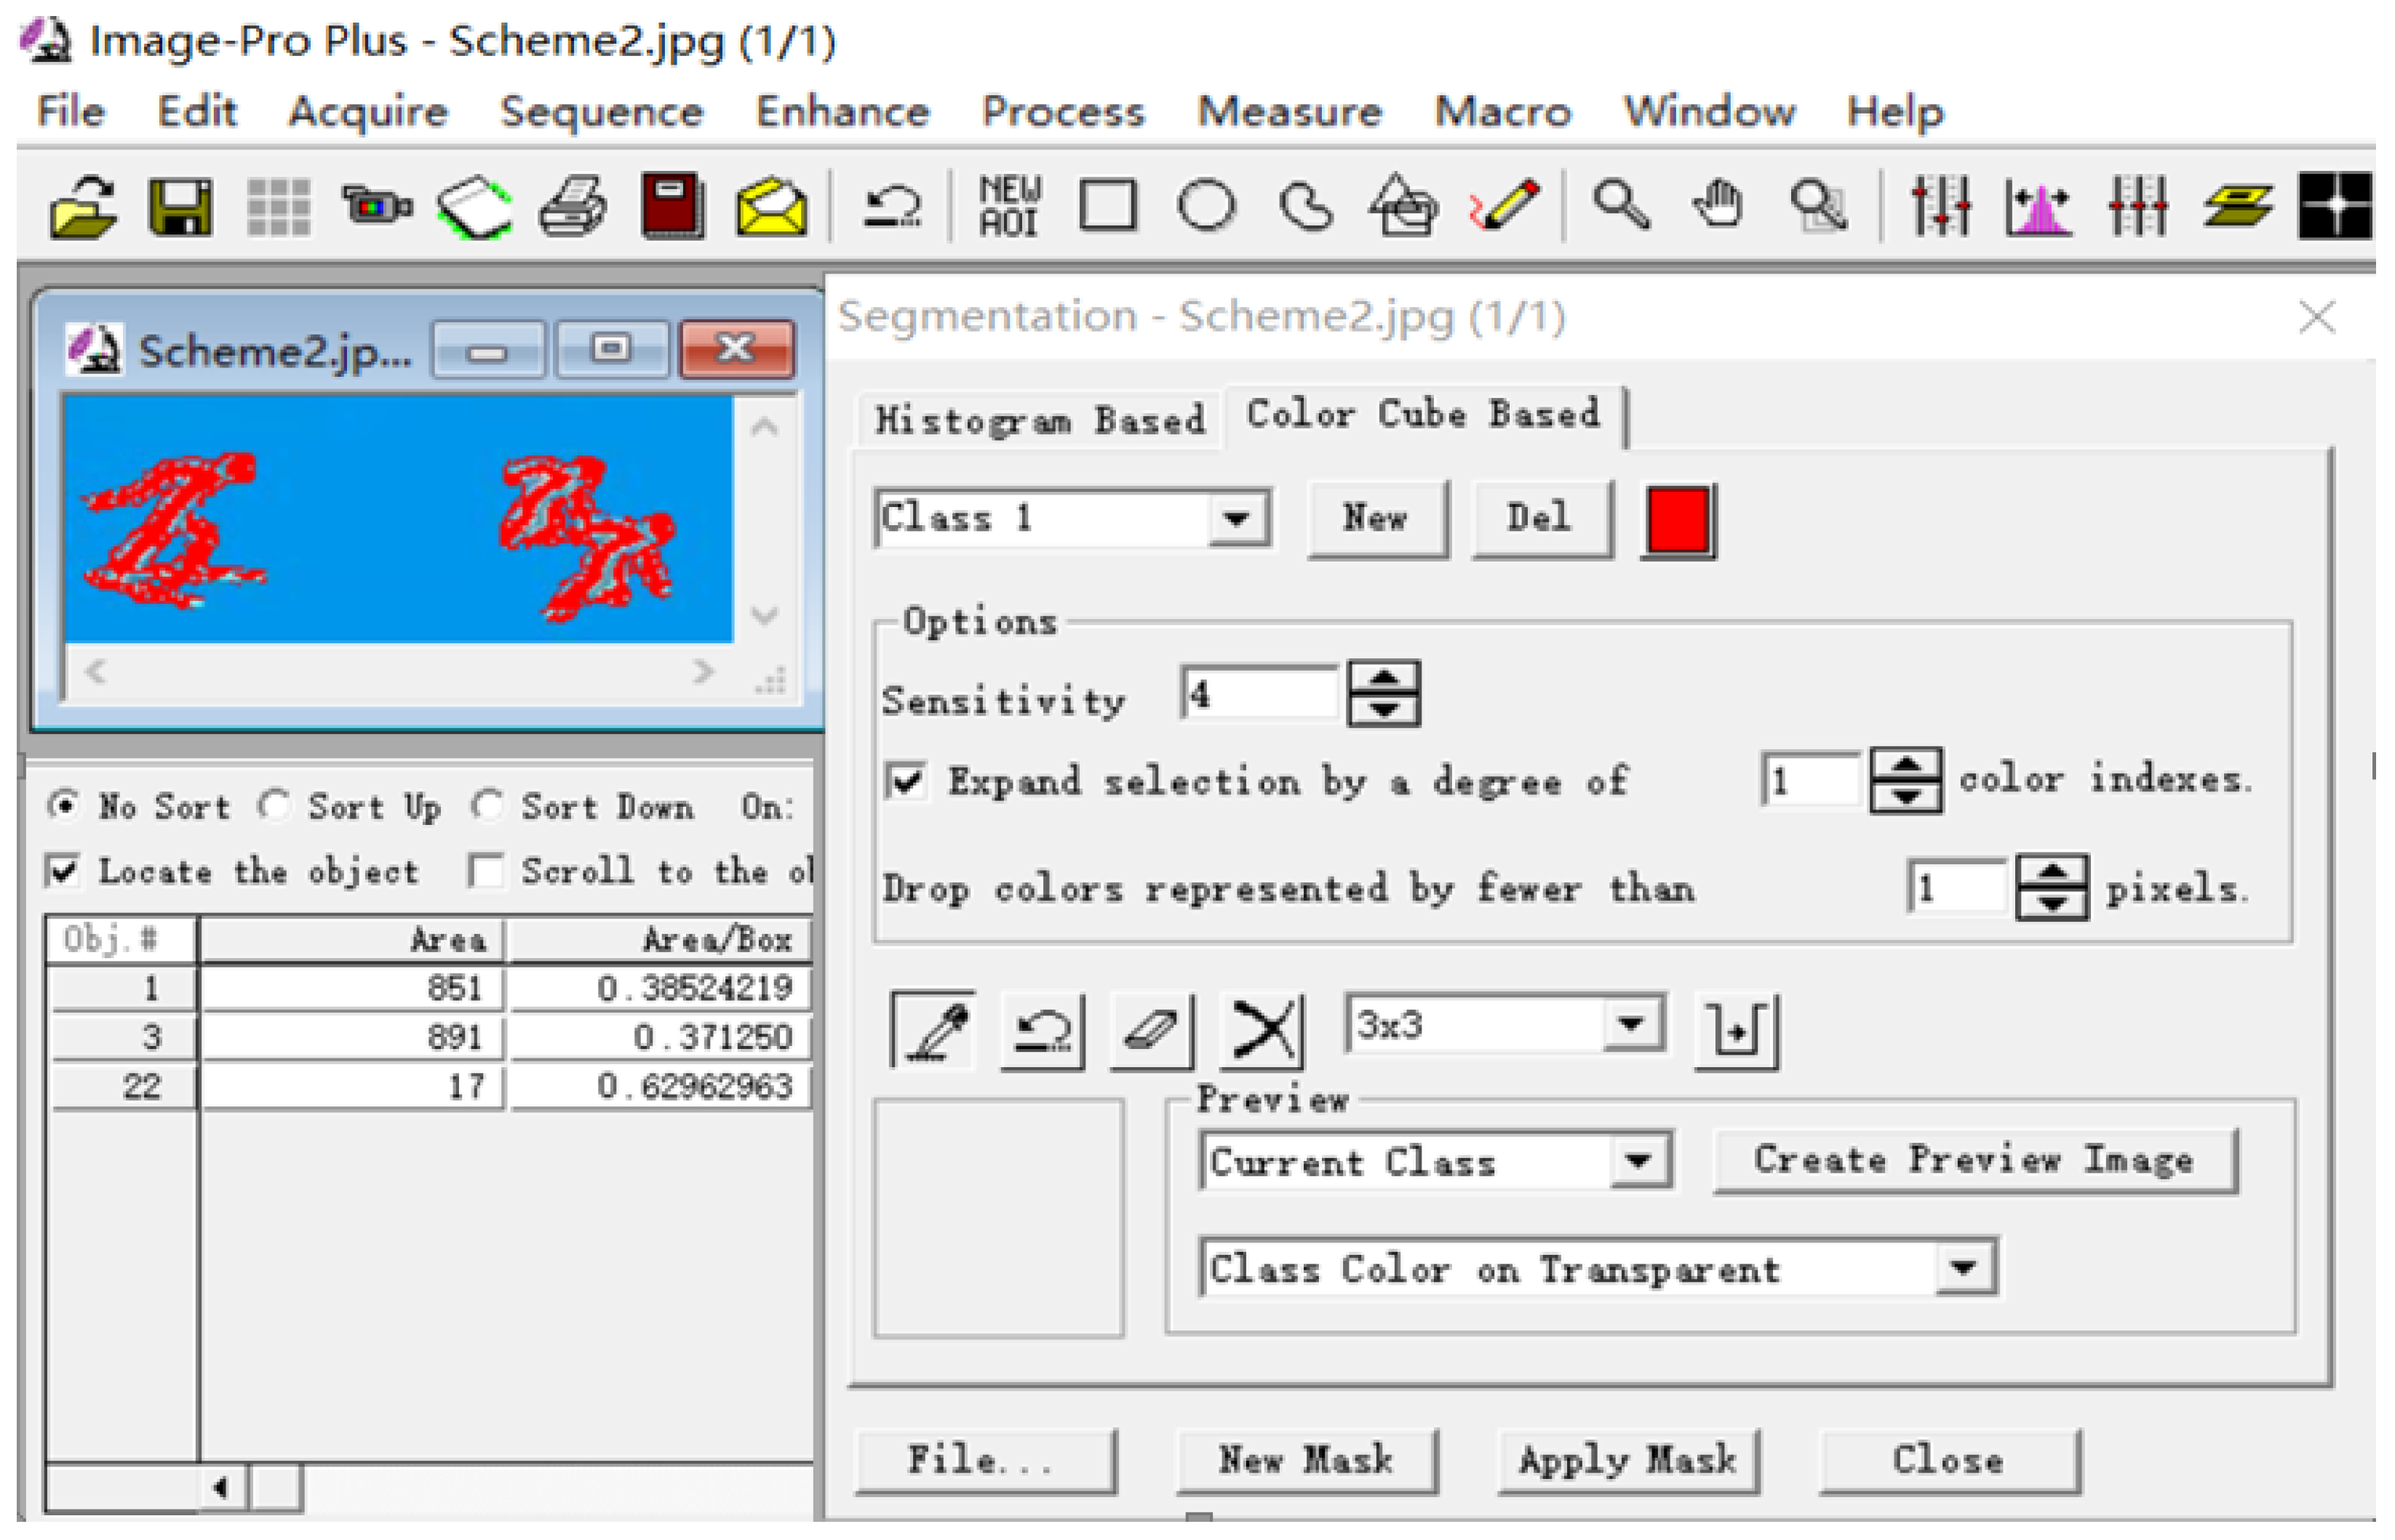
To quantify the visual proportion of each color used in the decoration schemes, Image-Pro Plus 6.0 software was employed to calculate the color area distribution within the driver’s field of view. The analysis was conducted using high-resolution calibrated images with standardized threshold settings. Under these conditions, the area measurement error was controlled within ±0.2%, as illustrated in Figure 7. The visual information load value ( F ) can be calculated as follows:
F   = H 1 + S 1 + V 1 × A 1 + + H n + S n + V n × A n A ,
where A is the total sidewall area visible to the driver, and A 1 , A 2 , and A n represent the visual areas corresponding to different colors on the tunnel sidewall. By applying this method, the visual information load of each tunnel sidewall decoration scheme was calculated, as presented in Table 4.

3.1.2. The Effect of Pattern Element Complexity on Driver Behavior

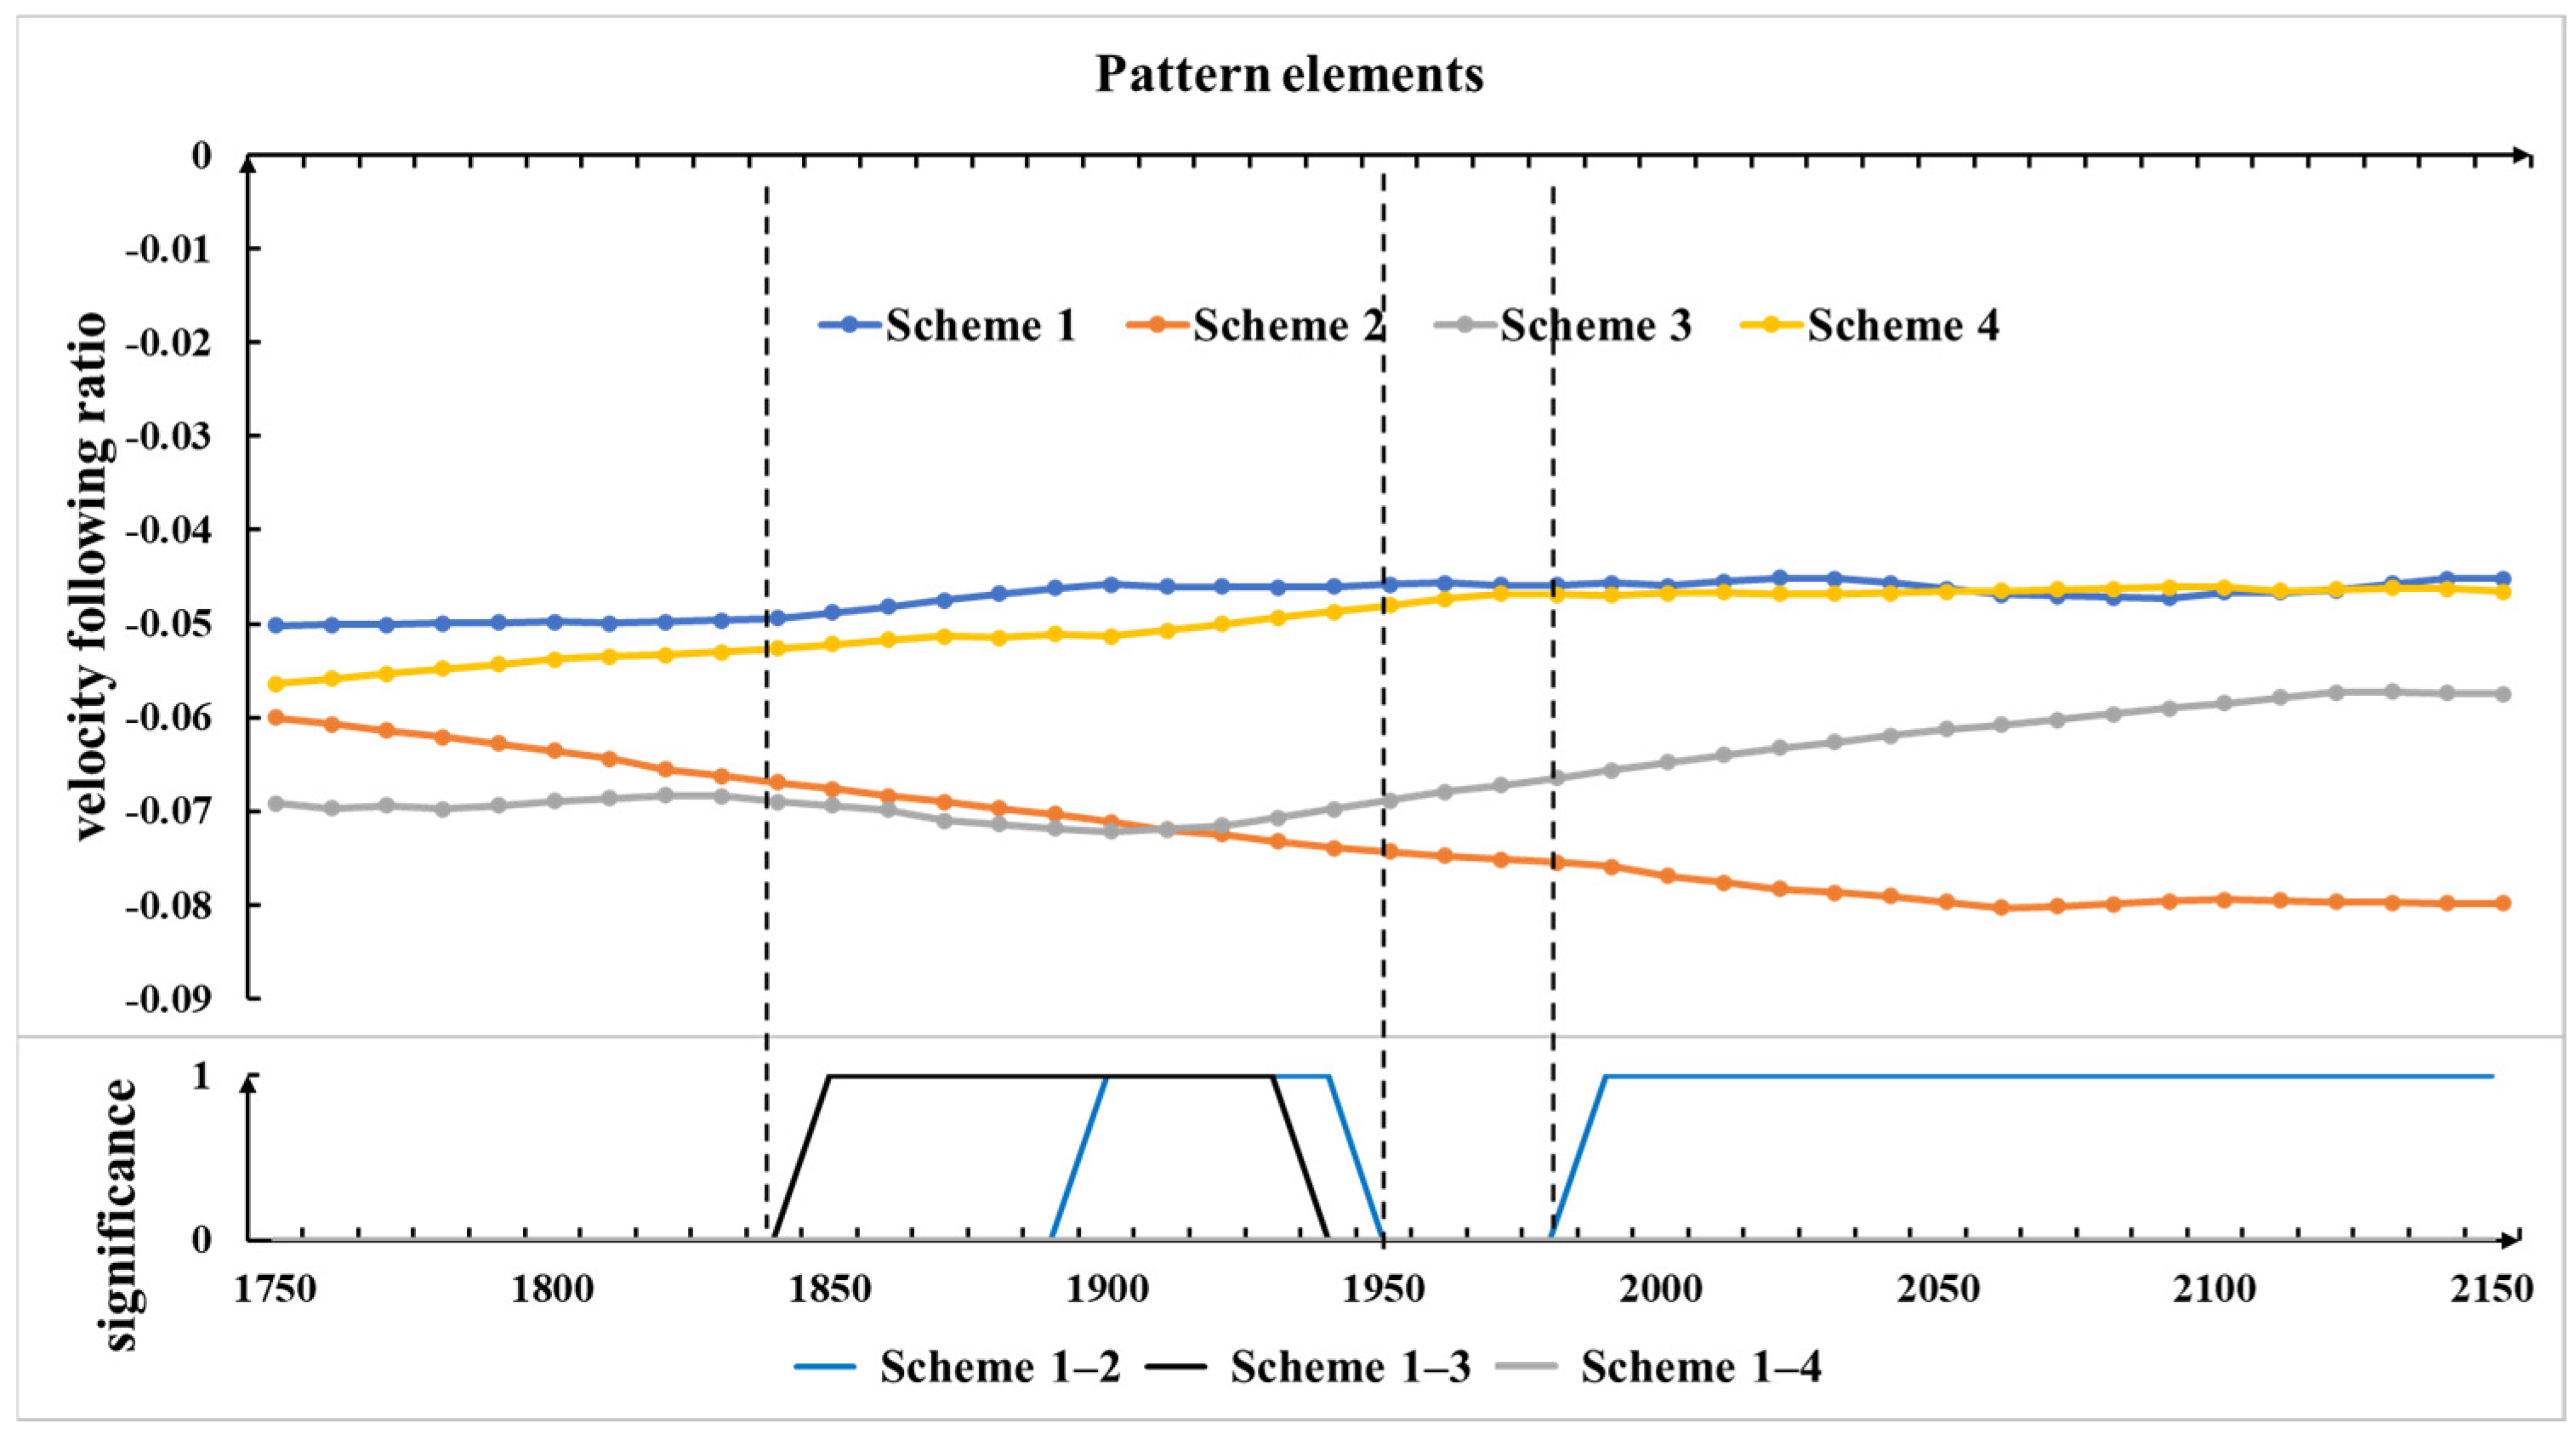
To illustrate the effects of tunnel sidewall decoration on driver performance, driving behavior indicators, including the velocity following ratio, steering wheel angle, maximum deceleration, and accelerator power, were extracted for analysis. A point-by-point significance test was performed for each data point across the four experimental scenarios. Data cells showing significant differences were assigned a value of 1, while nonsignificant differences were assigned a value of 0.
For instance, the velocity following ratio in the middle tunnel region is presented in Figure 8. The results indicate that the velocity following ratio remained relatively high in scenarios 1 and 4, with significant differences observed between scenarios 1 and 2 and between scenarios 1 and 3. Scenario 2 exhibited a lower velocity following ratio, reflecting more effective speed regulation behavior.
To further investigate how decoration element complexity affects driving performance, a single-factor repeated-measures ANOVA was applied to compare driving behavior under the four pattern element complexity schemes (Schemes 1–4). Data preprocessing confirmed that the dataset satisfied the fundamental requirements of this method. To evaluate the magnitude of the effects, the effect size index η 2 was adopted and calculated using:
η 2 = S b S t = S b S b + S w ,
where η 2 denotes the effect size, S b represents the between-group sum of squares, S w represents the within-group sum of squares, and S t is the total sum of squares.
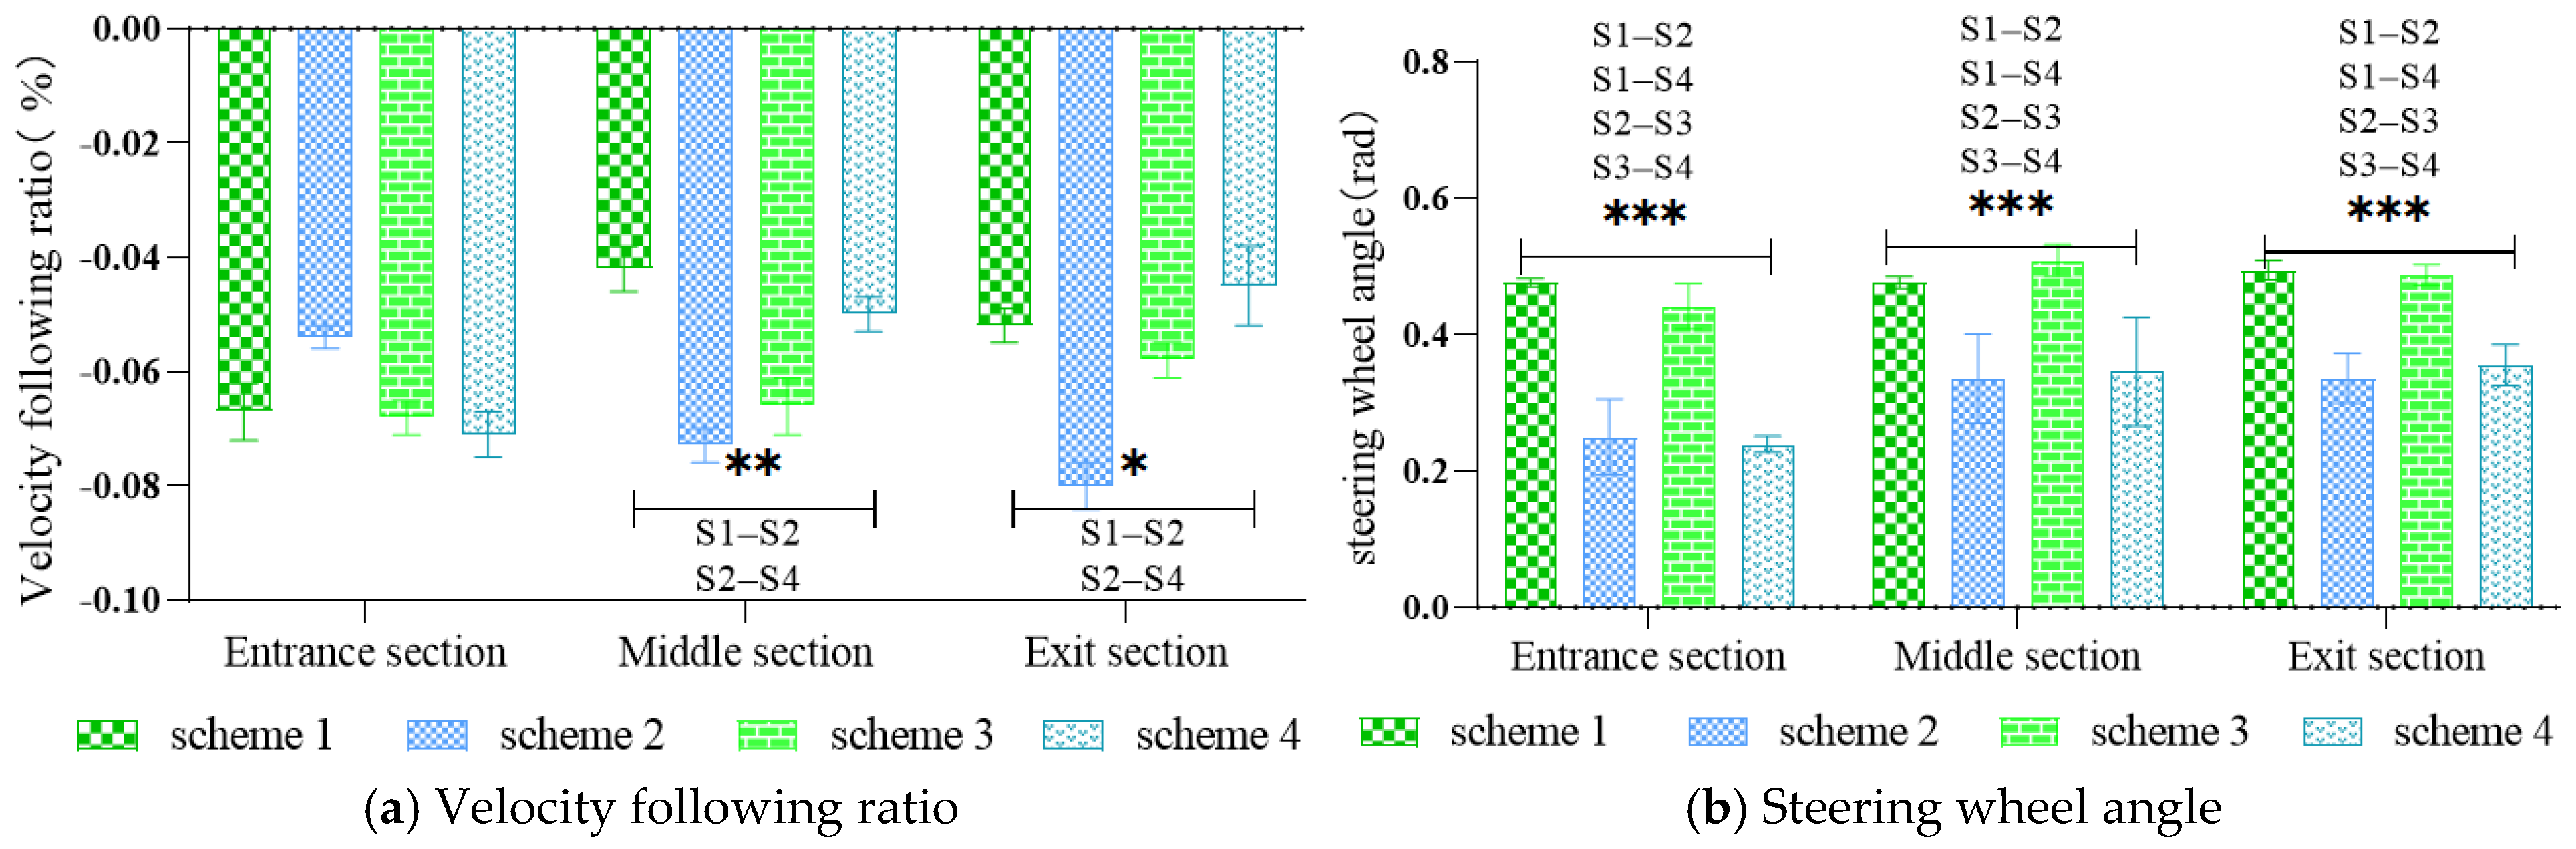
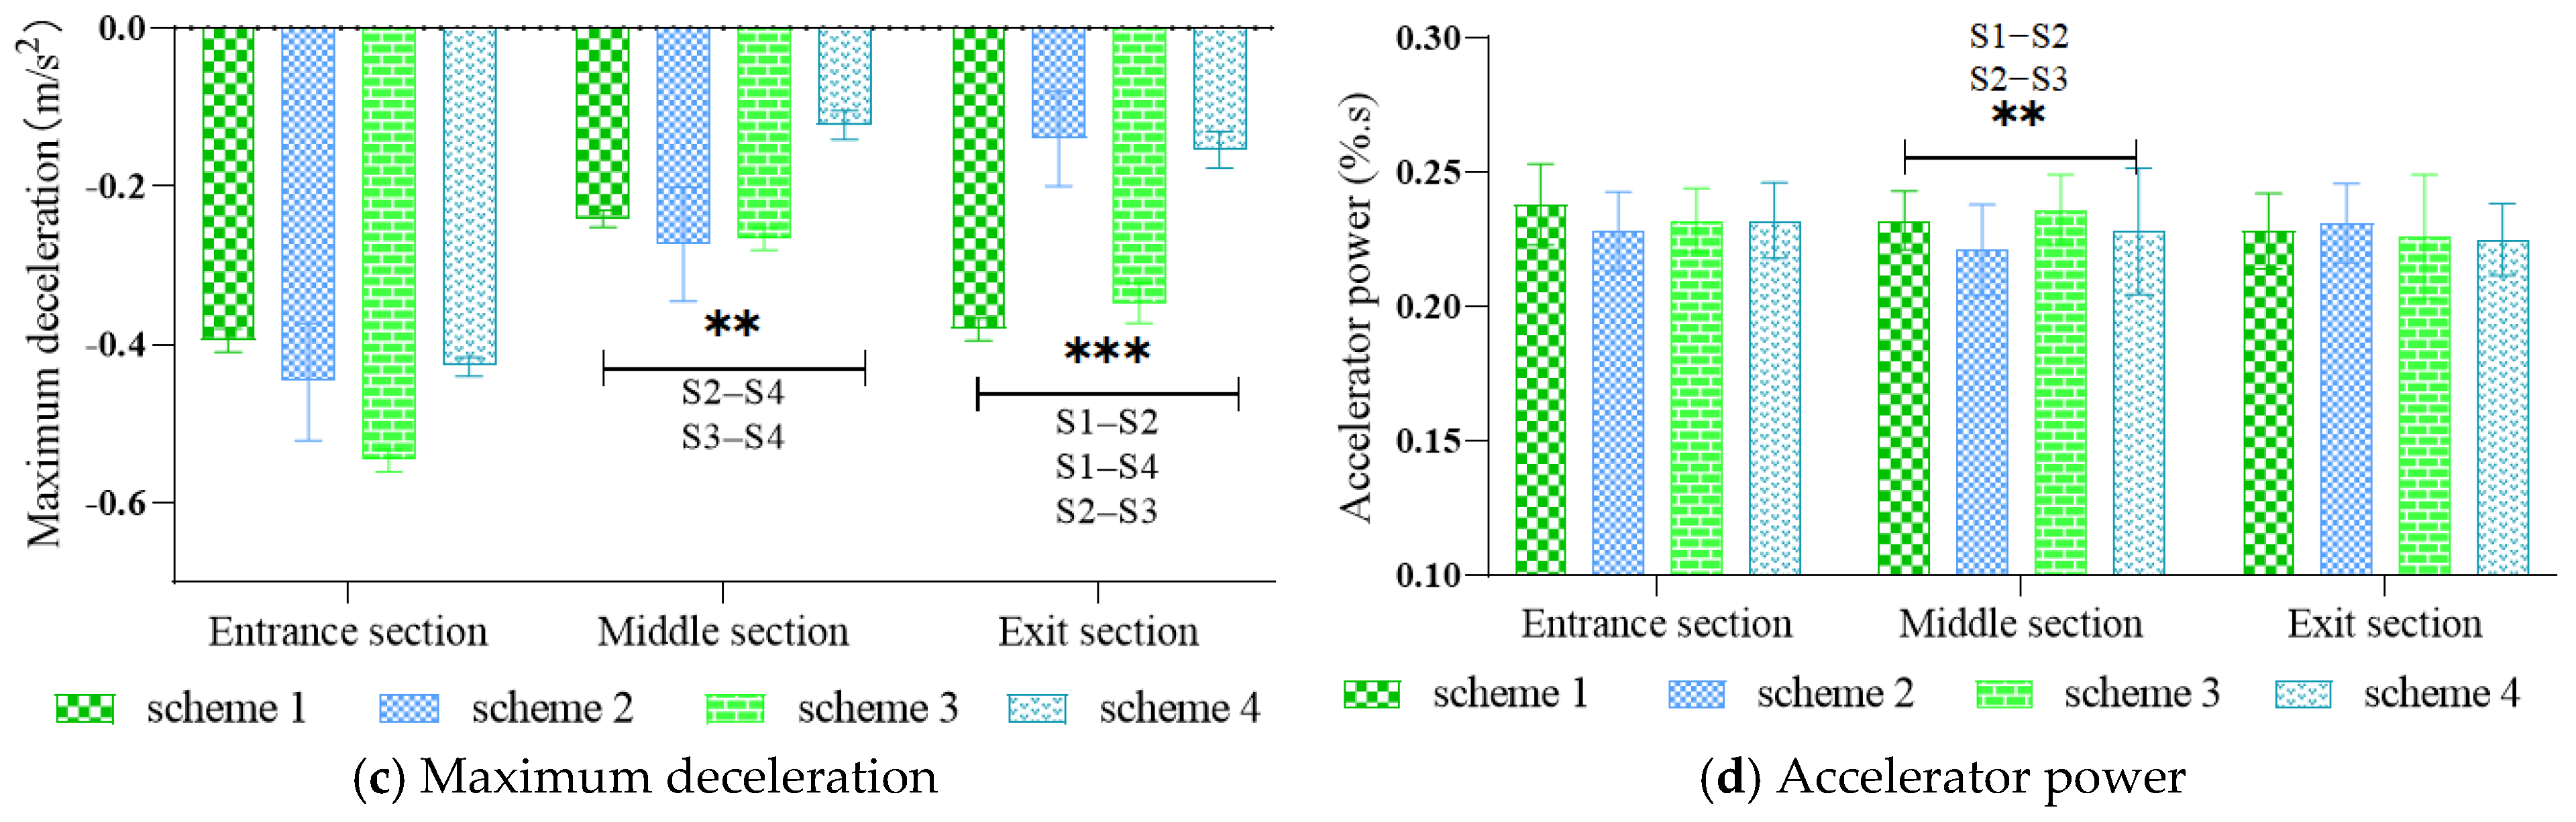
The results of the repeated-measures ANOVA are summarized in Table 5, including the F statistics, significance levels (p), and corresponding effect sizes (η2), while the effects of pattern element complexity on driving behavior indices are illustrated in Figure 9. The effect size estimates indicate that most significant and marginally significant results are associated with moderate to large effect magnitudes, confirming the practical relevance of the observed effects.
The results indicate that element complexity exerts a significant influence on driving behavior. Although schemes with sidewall decoration generally enhanced driving performance, higher complexity did not necessarily yield better safety outcomes. Drivers performed more effectively when the visual information conveyed by the design elements remained at a moderate level.
Specifically, the influence of element complexity on speed regulation level is represented by the velocity following ratio. A significant effect was identified in the middle section of the tunnel (F = 3.821, p = 0.018 < 0.05). Paired comparisons further showed a significant difference between Schemes 1 and 2 (p = 0.024 < 0.05), with a difference of 0.031 (95% CI: −0.001 to 0.053). Among the four schemes, Scheme 2 produced the lowest velocity following ratio, indicating more effective speed regulation.
The influence of element complexity on operational stability is represented by the steering wheel angle. A significant effect was observed in the tunnel entrance area (F = 10.244, p = 0.000 < 0.01). Subsequent paired comparisons revealed a significant difference between Schemes 1 and 2 (p = 0.000 < 0.01), with a difference of 0.227 (95% CI: 0.130–0.325). Schemes 2 and 4 exhibited smaller steering wheel angles, suggesting better operational stability under these conditions.
The influence of the element complexity on the driving comfort level of drivers in different tunnel areas is reflected by the maximum deceleration. A significant effect was found in the middle tunnel section (F = 3.119, p = 0.045 < 0.05). Pairwise analysis indicated a significant difference between Schemes 3 and 4 (p = 0.013 < 0.05), with a difference of 0.144 (95% CI: 0.032–0.255). Scheme 4 showed the lowest maximum deceleration, reflecting the highest level of driving comfort.
The influence of the element complexity on the safety awareness level of drivers in different tunnel areas is reflected by the accelerator power. A significant effect was detected in the middle tunnel area (F = 3.430, p = 0.021 < 0.05). Paired comparison results revealed a significant difference between Schemes 1 and 2 (p = 0.025 < 0.05), with a difference of 0.011 (95% CI: 0.002–0.020). Scheme 2 demonstrated the lowest accelerator power, indicating the strongest safety awareness among drivers.

3.2. The Influence of the Pattern Spacing on Driving Behavior

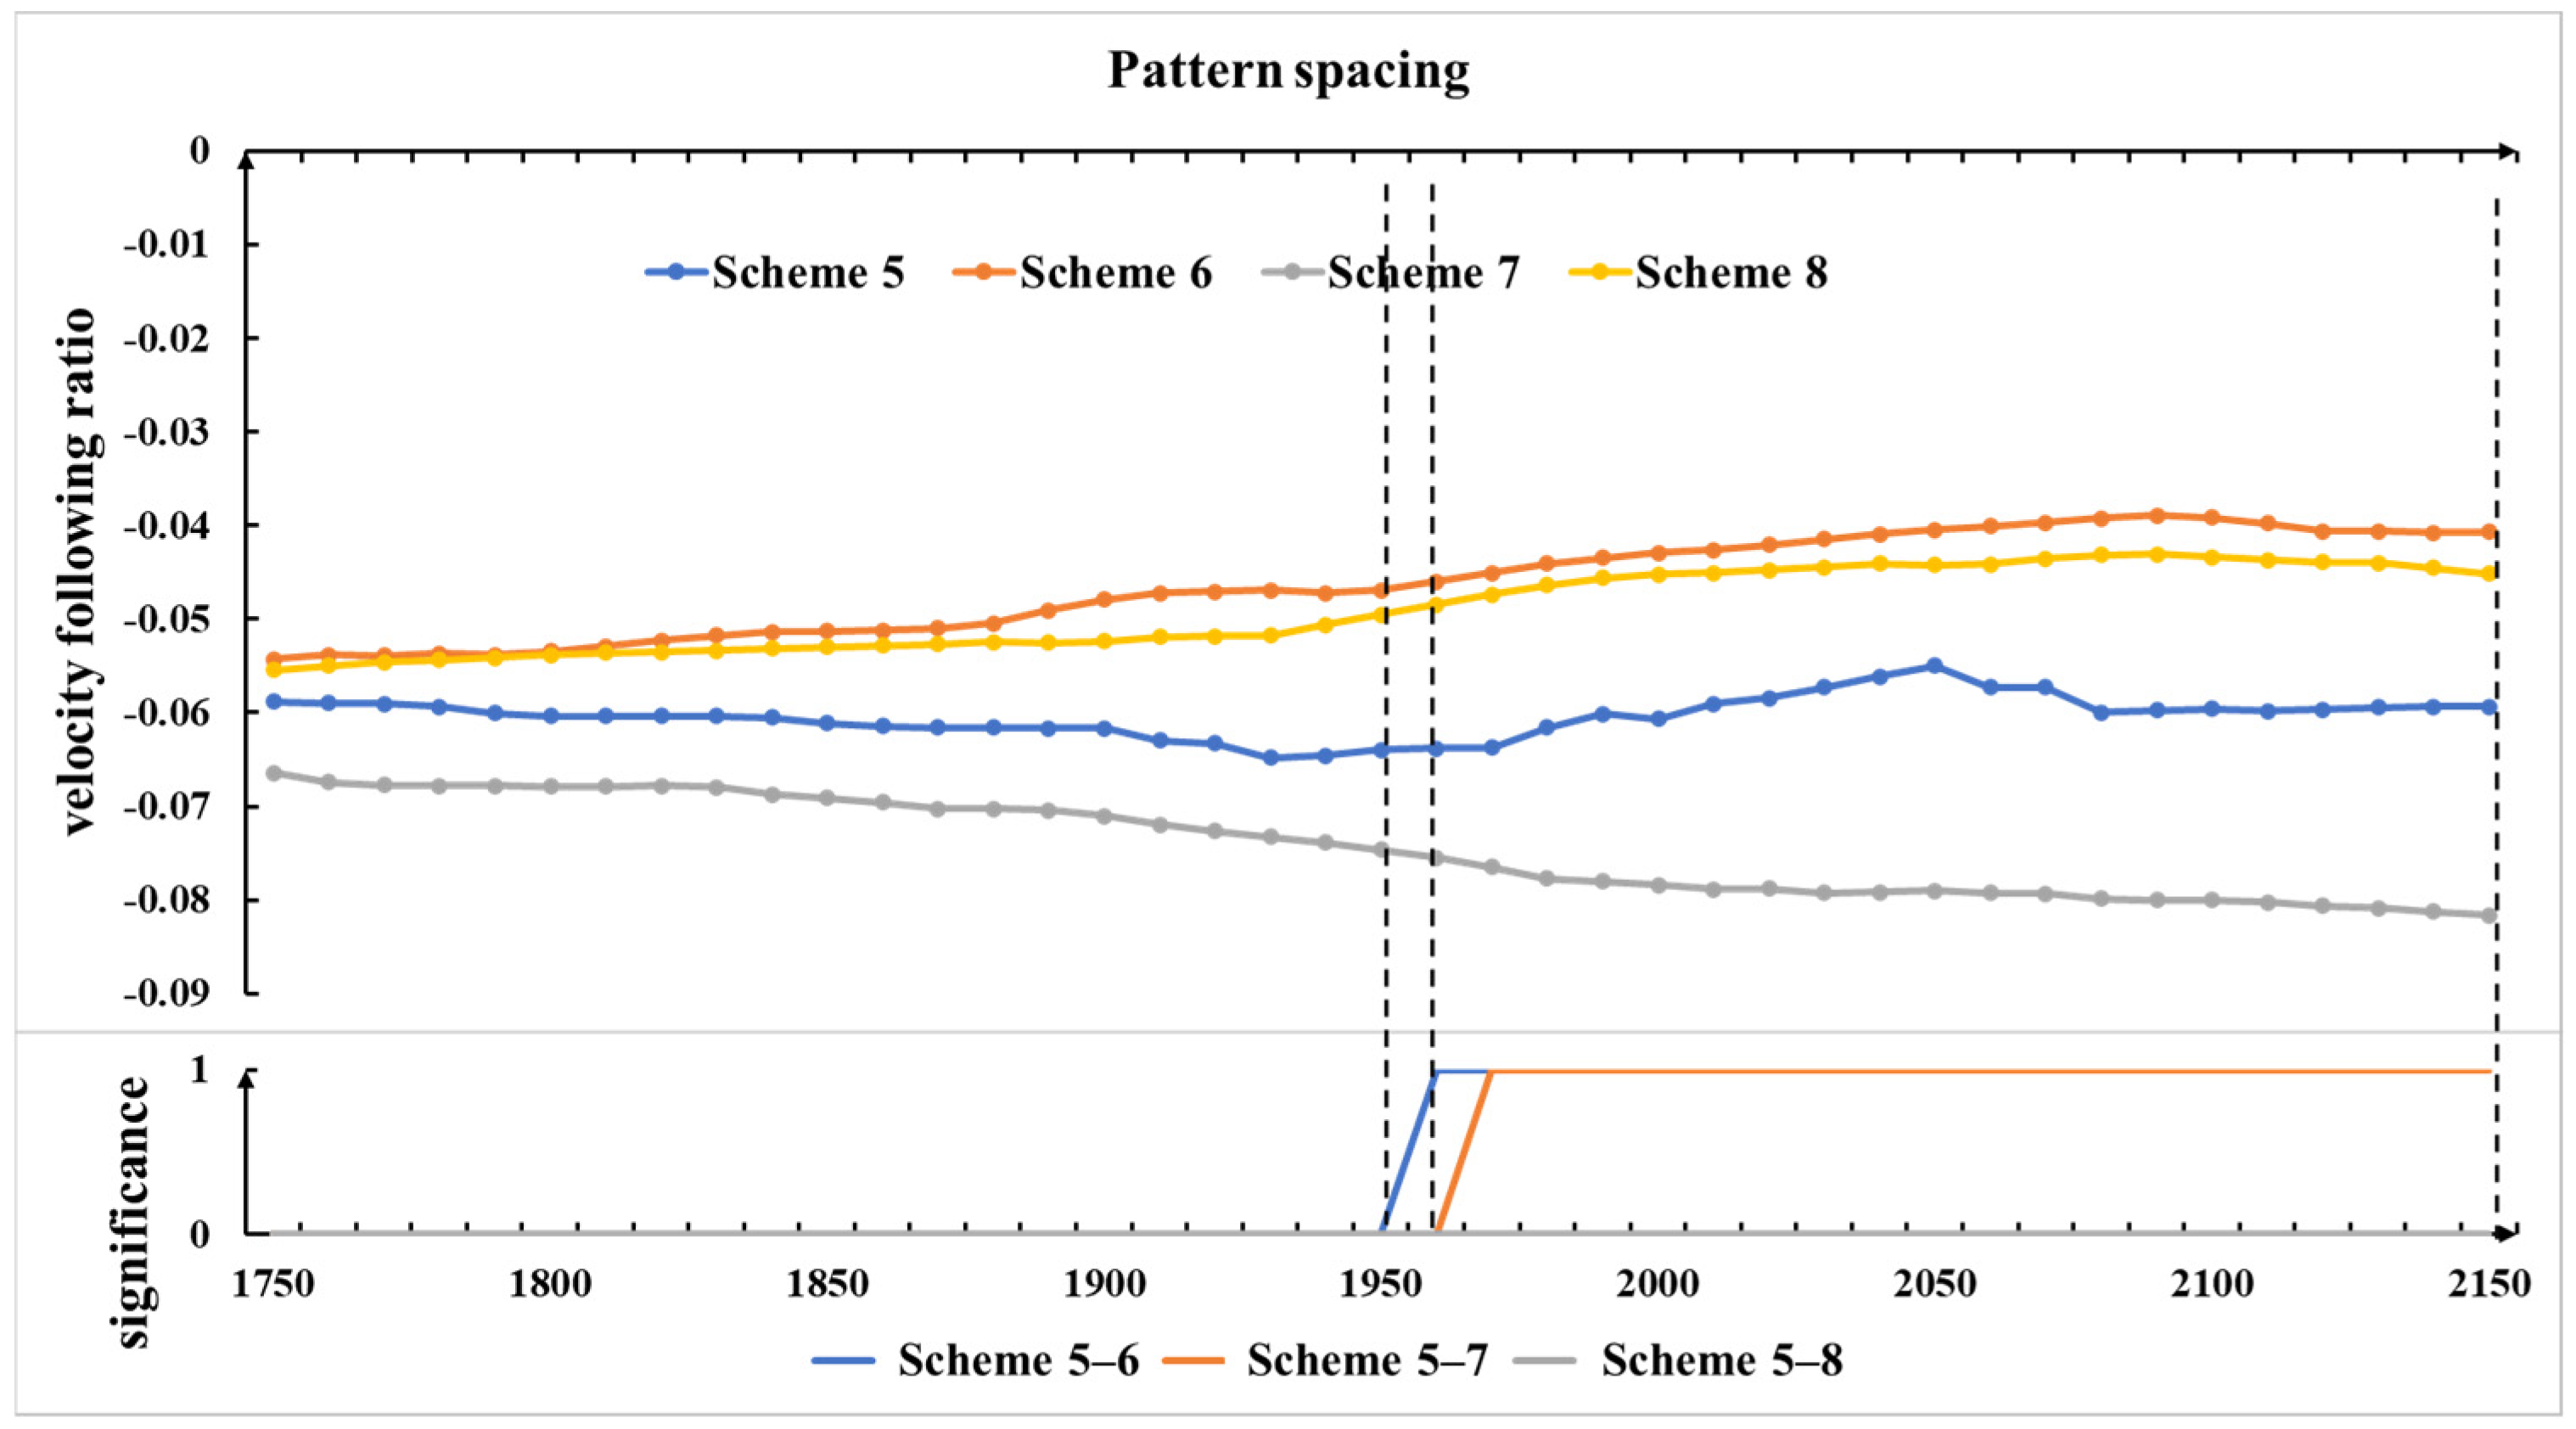
The pattern spacing is another important factor in decorative tunnel sidewall design. The influence on driving behavior cannot be ignored. Taking the velocity following ratio in the middle region as an example, the effect of the pattern spacing of the tunnel sidewall decoration on the driving behavior of drivers was visually portrayed by point-by-point significance, with a significant difference in the spatial axis position defined as 1 and no significant difference defined as 0. The analysis results are exhibited in Figure 10. The results show that the velocity following ratio remained higher under scenarios 6 and 8. There were significant differences between scenarios 5 and 7, as well as between scenarios 5 and 7. In order to make it more favorable to driving safety, the velocity following ratio was lower under scenario 7.
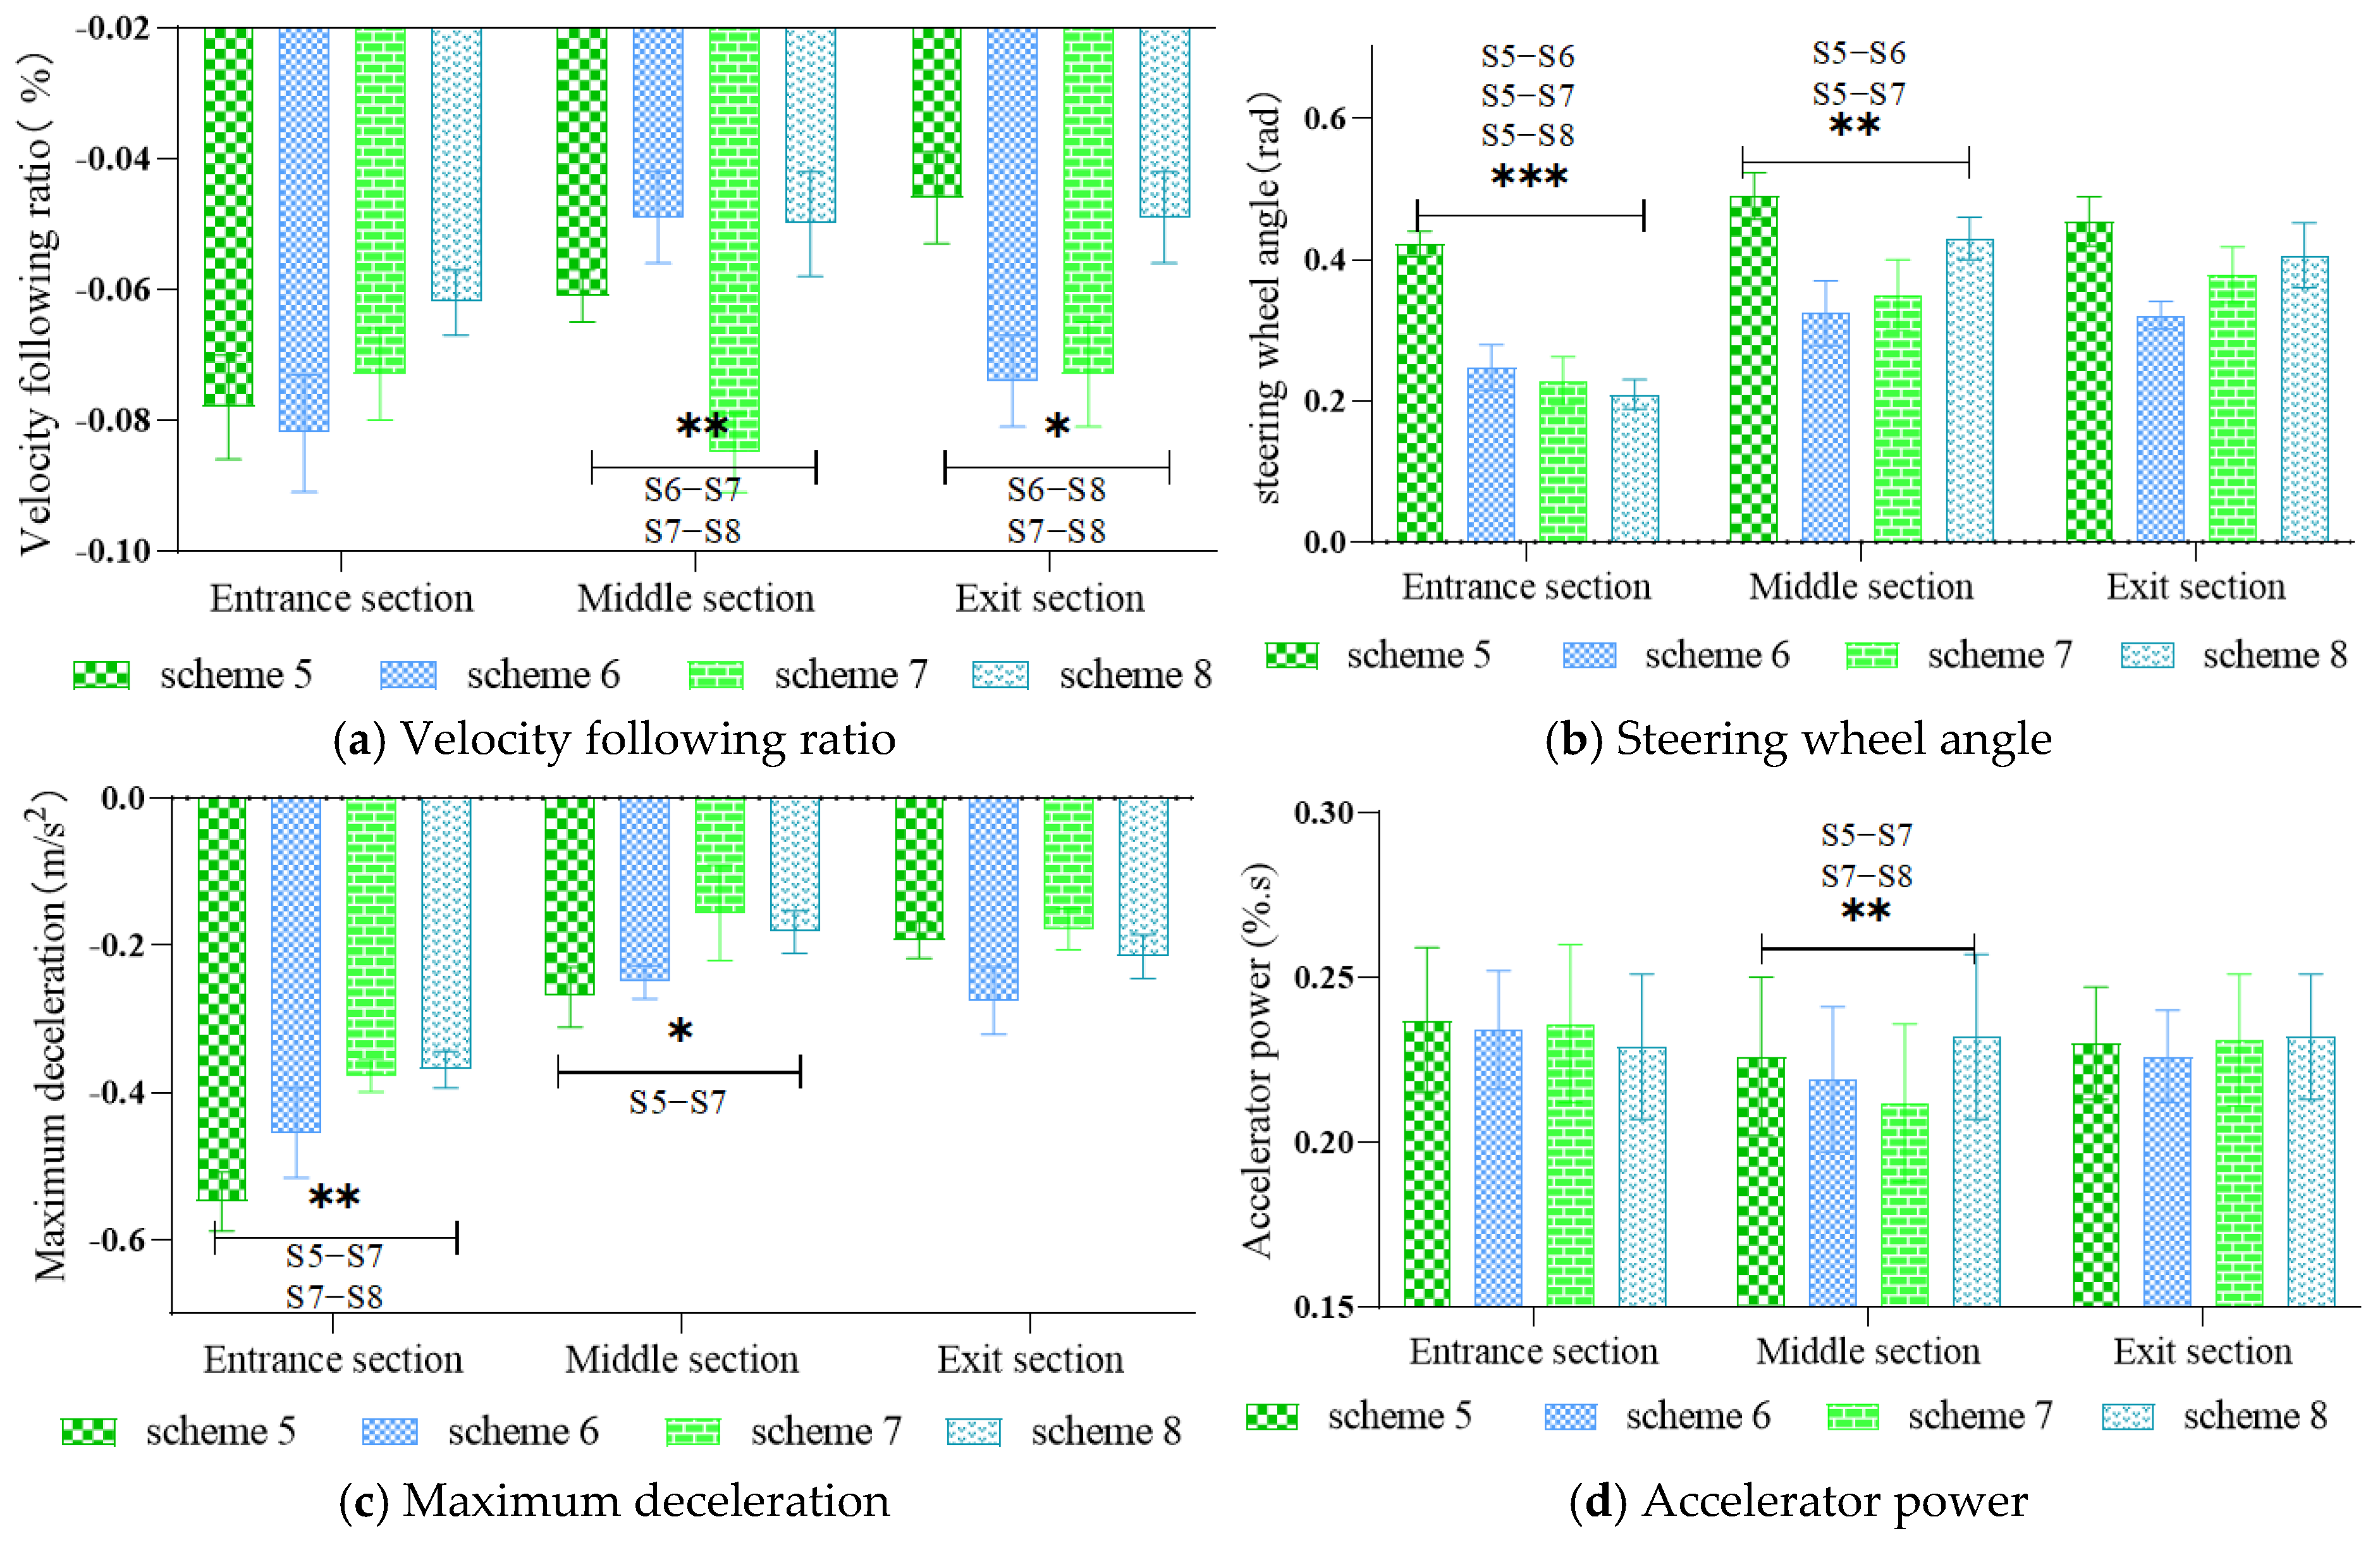
Similarly, a one-way repeated measures ANOVA was conducted to examine the influence of different pattern spacing schemes (Schemes 5–8) on driving behavior. The ANOVA results are summarized in Table 6, and the effects on driving behavior indices are illustrated in Figure 11.
The findings indicate that pattern spacing had a statistically significant effect on multiple aspects of driver performance. Within a given speed-limit condition, an appropriate spacing range was conducive to safer driving in the tunnel, whereas excessively small or large spacing tended to provoke unsafe behaviors such as speeding or steering wheel angle fluctuations.
Specifically, the influence of the pattern spacing on the speed adjustment level of the drivers in different tunnel areas is reflected by the velocity following ratio. A significant effect was observed in the middle section of the tunnel (F = 3.317, p = 0.024 < 0.05). Pairwise analysis revealed a significant difference between Schemes 6 and 7 (p = 0.009 < 0.01), with a difference of 0.036 (95% CI: 0.010–0.062). Among all spacing schemes, Scheme 7 produced the lowest velocity following ratio, suggesting the highest level of speed-adjustment performance.
The influence of the pattern spacing on the operation stability level of the drivers in different tunnel areas is reflected by the steering wheel angle. Significant effects were identified in both the tunnel entrance area (F = 7.759, p = 0.000 < 0.01) and the middle area (F = 3.331, p = 0.024 < 0.05). Pairwise comparison demonstrated a significant difference between Schemes 5 and 6 (p = 0.007 < 0.01), with a difference of 0.166 (95% CI: 0.050–0.281). Scheme 6 exhibited the smallest steering wheel angle, indicating the highest operational stability.
The influence of the pattern spacing on the driving comfort level of drivers in different tunnel areas is reflected by the maximum deceleration. a significant effect of spacing was detected in the tunnel entrance area (F = 3.028, p = 0.049 < 0.05). Among the four spacing schemes, Scheme 7 yielded the lowest maximum deceleration, reflecting superior comfort under this configuration.
The influence of the pattern spacing on the safety awareness level of drivers in different tunnel areas is reflected by accelerator power. A significant effect was found in the middle section of the tunnel (F = 3.445, p = 0.022 < 0.05). Pairwise comparison identified a significant difference between Schemes 5 and 7 (p = 0.047 < 0.05), with a difference of 0.014 (95% CI: 0.006–0.278). Scheme 7 showed the lowest accelerator power, indicating the strongest safety awareness among the spacing schemes.

3.3. Effects of the Combined Action of the Element Complexity and Pattern Spacing on Driving Behavior

Earlier analyses examined the effects of pattern element complexity and pattern spacing on driving behavior separately using one-way repeated measures ANOVA. However, in real tunnel environments, driver behavior is influenced by the joint action of multiple design features of tunnel sidewall decoration. To capture this combined effect, the coupling coordination degree model was adopted to analyze the interaction between pattern element complexity and pattern spacing and their collective impact on driving performance. Specific steps were as follows.
(1)
Establishment of the index system.
The complexity of the pattern elements and the pattern spacing were defined as first-level indicators. The velocity following ratio, steering wheel angle, maximum deceleration, and accelerator power were designated as second-level indicators. Together, these indicators form the coupling evaluation index system, covering four aspects of driving behavior: speed regulation, operational stability, driving comfort, and safety awareness.
(2)
Determination of index weights and calculation of the comprehensive evaluation indices.
The entropy method was employed to determine indicator weights and calculate the comprehensive evaluation indices. First, raw data were normalized to eliminate dimensional differences. The characteristic contribution of the ith scheme for the jth indicator was calculated as:
p i j = x i j 1 i   = 1 n x i j ,
where x i j denotes the value of indicator j for scheme i .
The entropy value of the jth indicator was then computed as:
e j = 1 ln n i   = 1 n p i j ln p i j , 0 e j 1
The difference coefficient and weight of each indicator were obtained as:
g j   =   1     e j
w j = g j i = 1 m g j , j = 1,2 , 3 m
Finally, the comprehensive evaluation indices for pattern element complexity and pattern spacing were calculated using a linear weighted method:
U 1,2   =   j   = 1 m w j   × x i j ,
where U 1 and U 2 denote the comprehensive index values corresponding to pattern element complexity and pattern spacing, respectively.
(3)
Calculation of the coupling coordination degree.
The coupling coordination degree was calculated using
D = C × T ,
where the coupling degree C is defined as
C = U 1 ×   U 2 U 1 + U 2 2 2 = 2 U 1 ×   U 2 U 1 + U 2 ,
and the coordination index T is expressed as
T = i = 1 n α i × U i , i = 1 n α i = 1 ,
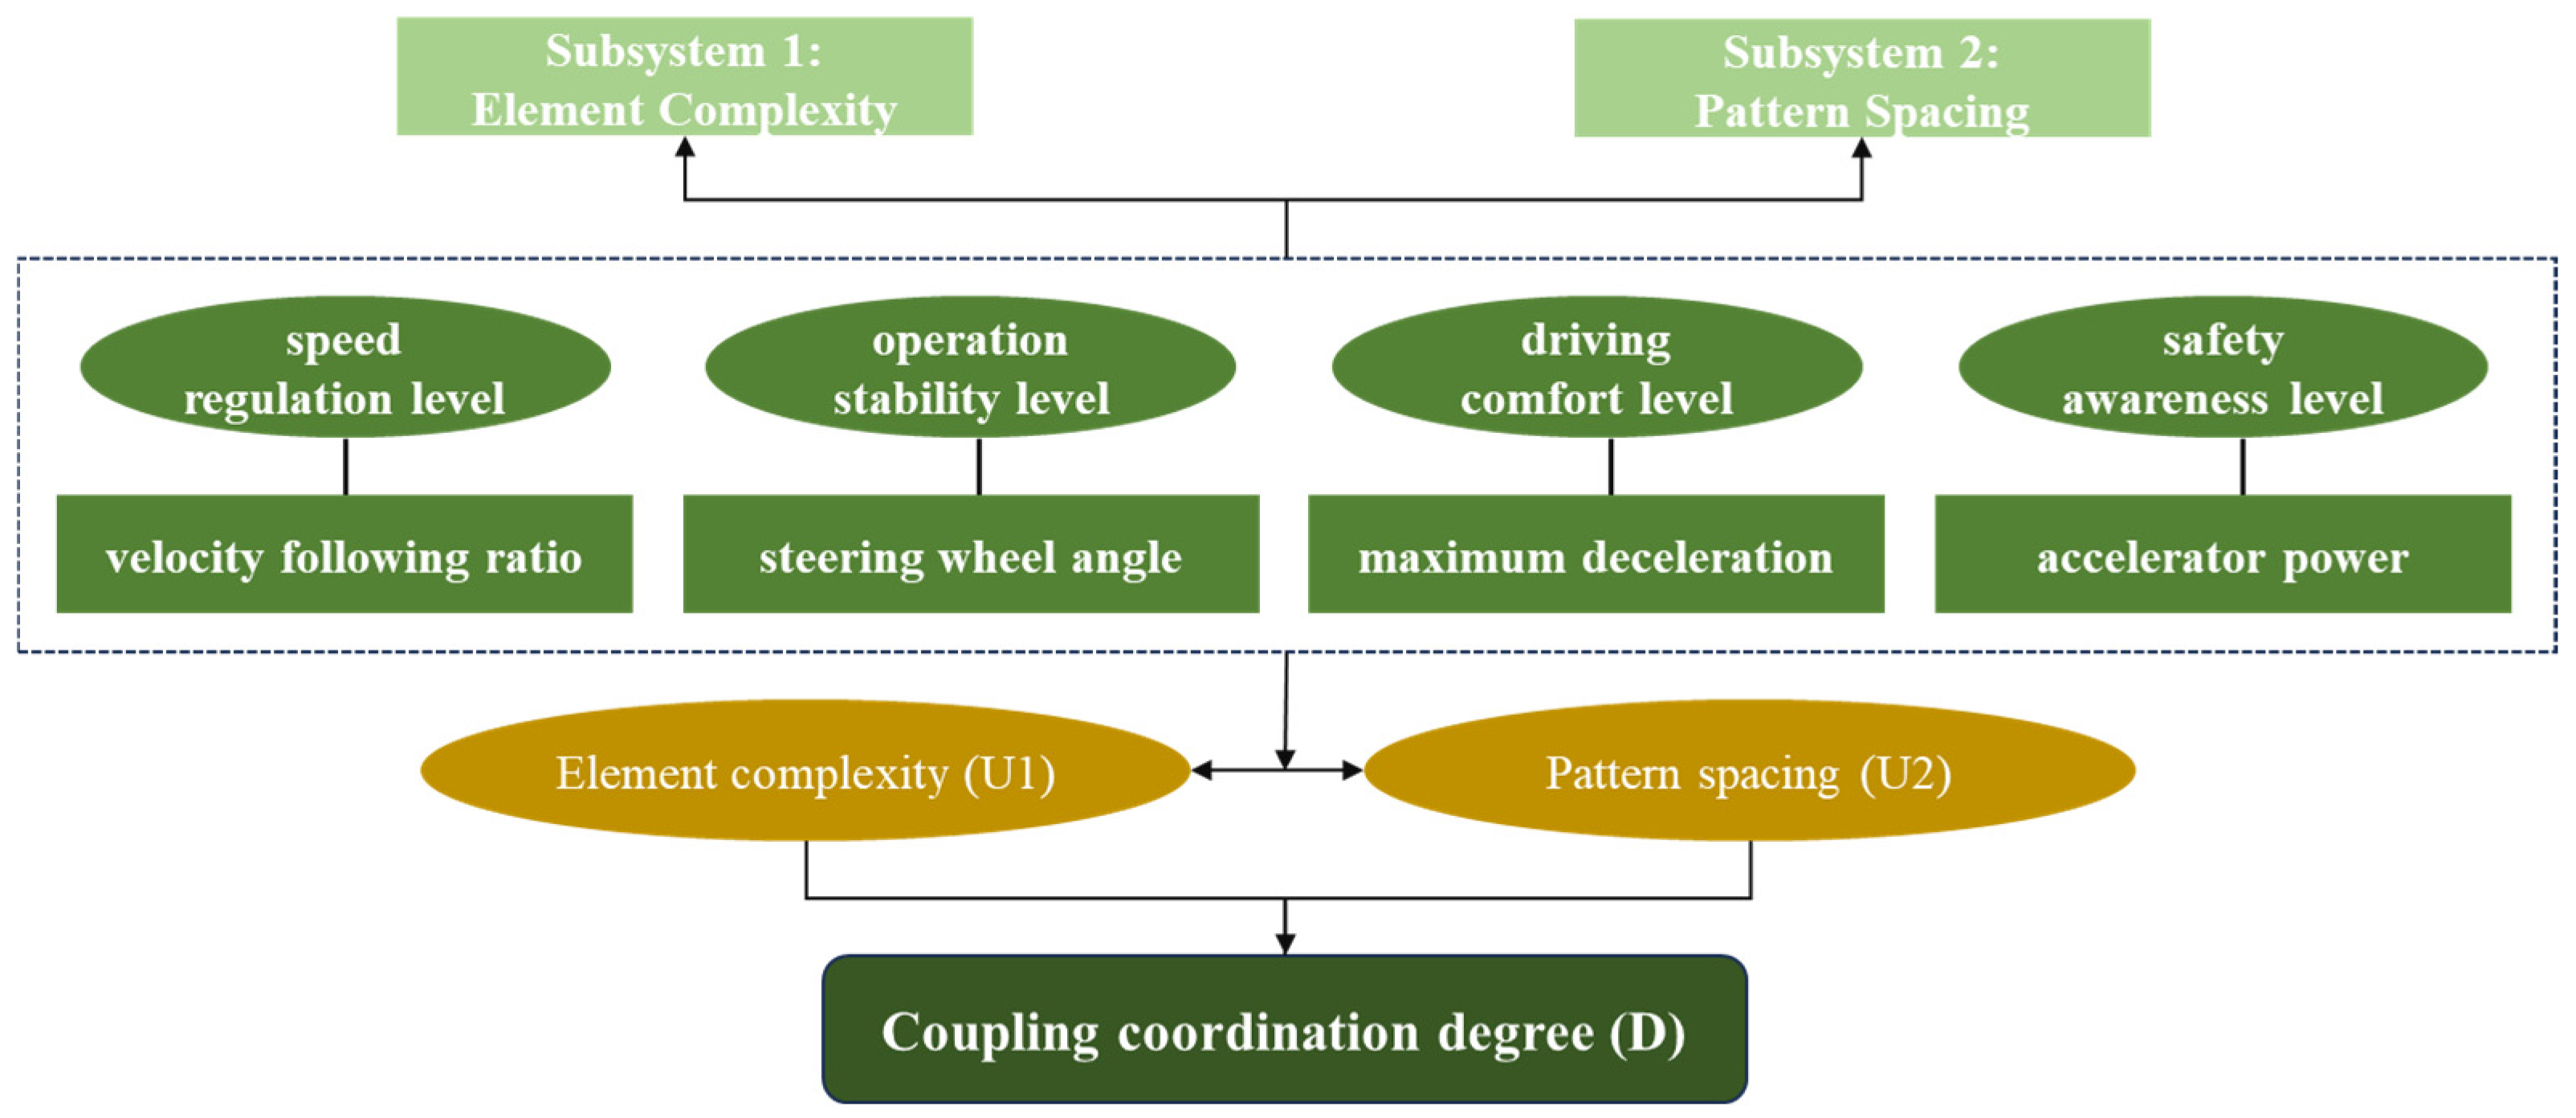
where D 0,1 . As illustrated in Figure 12, the coupling coordination degree model presents the computational structure linking pattern element complexity and pattern spacing through their comprehensive evaluation indices. By definition, the coupling coordination degree reflects both the interaction strength between pattern element complexity and pattern spacing and their combined contribution to driving behavior performance. Accordingly, higher values of D are obtained only when the two factors are well matched and jointly enhance multiple driving behavior indicators, quantitatively indicating a more stable and safer driving state [54,55].
Given the comparable influence of pattern element complexity and pattern spacing on driving behavior, equal weights were assigned to the two first-level subsystems, with α 1 = 0.5 and α 2 = 0.5 . The visual information load associated with each tunnel sidewall decoration scheme was adopted to quantify pattern element complexity. Based on this representation, the coupling coordination degree between pattern element complexity and pattern spacing was calculated for each experimental scheme, and the results are summarized in Table 7.
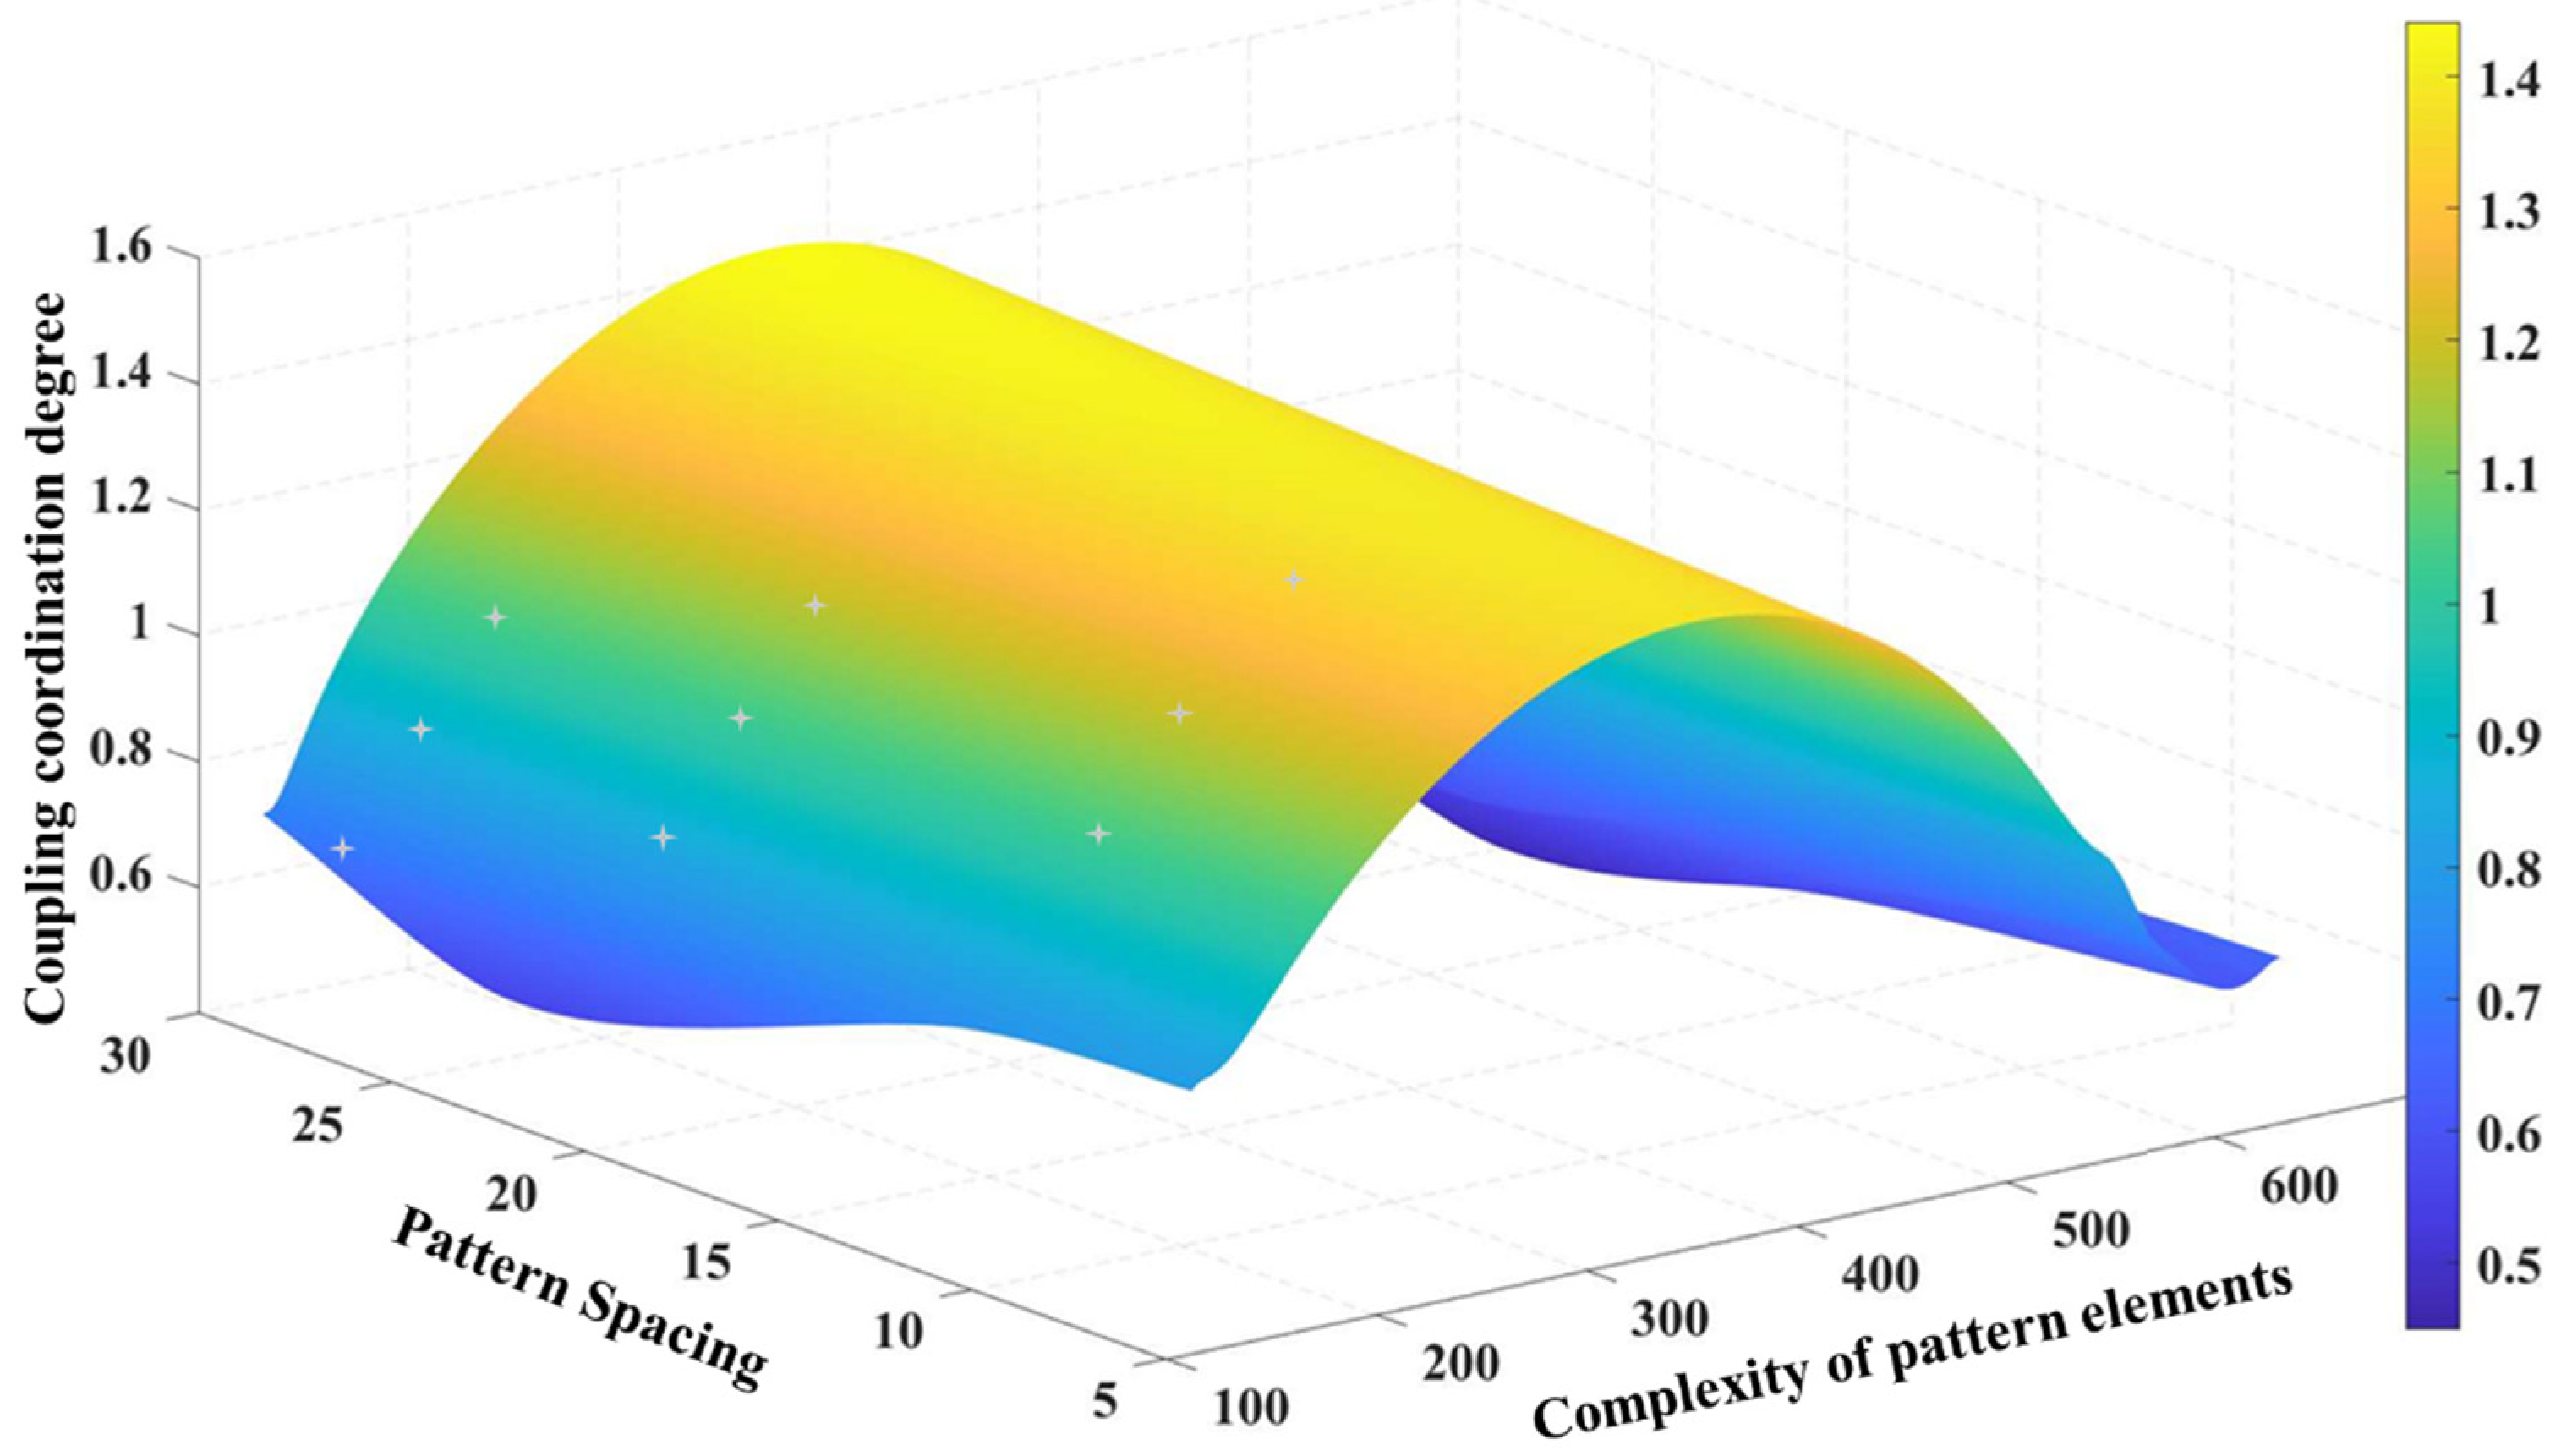
According to Table 7, with fixed element complexity, the coupling coordination degree initially declines before rising with increased pattern spacing, peaking at 5.5 m. With fixed spacing, it first rises then falls with increasing element complexity, maximizing at a visual information load of 562.1. The highest overall coordination degree (0.842) is obtained at an element complexity of 562.1 and a pattern spacing of 5.5 m, this suggests that driver performance is diminished by extreme parameter values but enhanced by an appropriately balanced combination.
To further quantify the influence of element complexity and pattern spacing on the coupling coordination degree, element complexity and pattern spacing were used as independent variables, and the coupling coordination degree served as the dependent variable. A regression model describing their relationships was established in MATLAB R2023a (Figure 13):
D = 0.2454 + 0.0093 x 1 0.0013 x 2 1.3 e 05 x 1 2 8.919 e 06 x 1 x 2 + 0.0015 x 2 2 ,
where D denotes the coupling coordination degree, x 1 represents the visual information load corresponding to the pattern element complexity, and x 2 is the pattern spacing. The coefficient of determination (R2 = 0.963) indicates a high level of model fit. In addition, the overall regression model passed the F-test (F = 52.05, p < 0.001), confirming that the fitted relationship is statistically significant.
Because the coupling coordination degree is closely associated with driving risk, higher values indicate a more stable and safer interaction between environmental stimuli and driving behavior. Within the established framework of coupling coordination theory and its widespread application in transportation and human–environment interaction studies, values exceeding 0.8 are generally regarded as representing a high-level coordination state [56,57,58]. Accordingly, for engineering application, a coupling coordination degree greater than 0.8 was adopted as the threshold in this study.
The model-based analysis indicates that when pattern spacing was approximately 10 m, the preferred element complexity ranged from 135.6 to 564.7. When the spacing increased to around 20 m, the corresponding optimal complexity ranged from 142.0 to 548.9. When element complexity was fixed at approximately 550, the ideal spacing fell between 5.5 and 17.2 m. These results provide practical guidance for selecting element complexity and pattern spacing to achieve high coupling coordination and enhanced driving safety.

4. Discussion

In this experiment, each driver completed eight tests corresponding to the eight experimental scenarios. Repeated exposure may induce a psychological expectation effect; therefore, an independent assessment was conducted to confirm that such an effect would not influence the results. During the formal experiment, the eight scenarios were randomly arranged for each driver. Based on the execution order, all data were divided into eight groups. For instance, the first completed scenario for all drivers constituted Group 1, the second completed scenario constituted Group 2, and so on. Because each participant completed all experimental scenarios, repeated measurements were obtained across different time points, resulting in within-subject correlation. Therefore, a one-way repeated-measures ANOVA was employed to test whether experimental order induced significant differences among groups [59]. The results showed no significant differences in any indicator across the eight sequence groups (p > 0.05), indicating that the psychological expectation effect did not have a significant impact on the experimental outcomes (Table 8).
The analysis indicates that an appropriate combination of pattern elements and pattern spacing does not induce excessive driver distraction and does not compromise driving safety, which is consistent with previous findings [19]. However, when the complexity of the pattern elements becomes excessively high, drivers’ attentional resources may become overly dispersed. Under normal driving conditions, high element complexity should not be used in isolation as a means to ensure safety. Drivers may intentionally shift their lateral position away from the sidewall to reduce perceived collision risk, which in turn affects speed control and operational stability, ultimately undermining safety. Within a given speed limit, when pattern spacing exceeds a certain threshold, drivers’ levels of speed control, operational stability, and safety awareness tend to decrease. This phenomenon may be attributed to the fact that inappropriate visual references can distort drivers’ perception of speed and distance. Consequently, the driver’s experience-based interpretation of environmental changes becomes less accurate, leading to suboptimal driving performance [60].
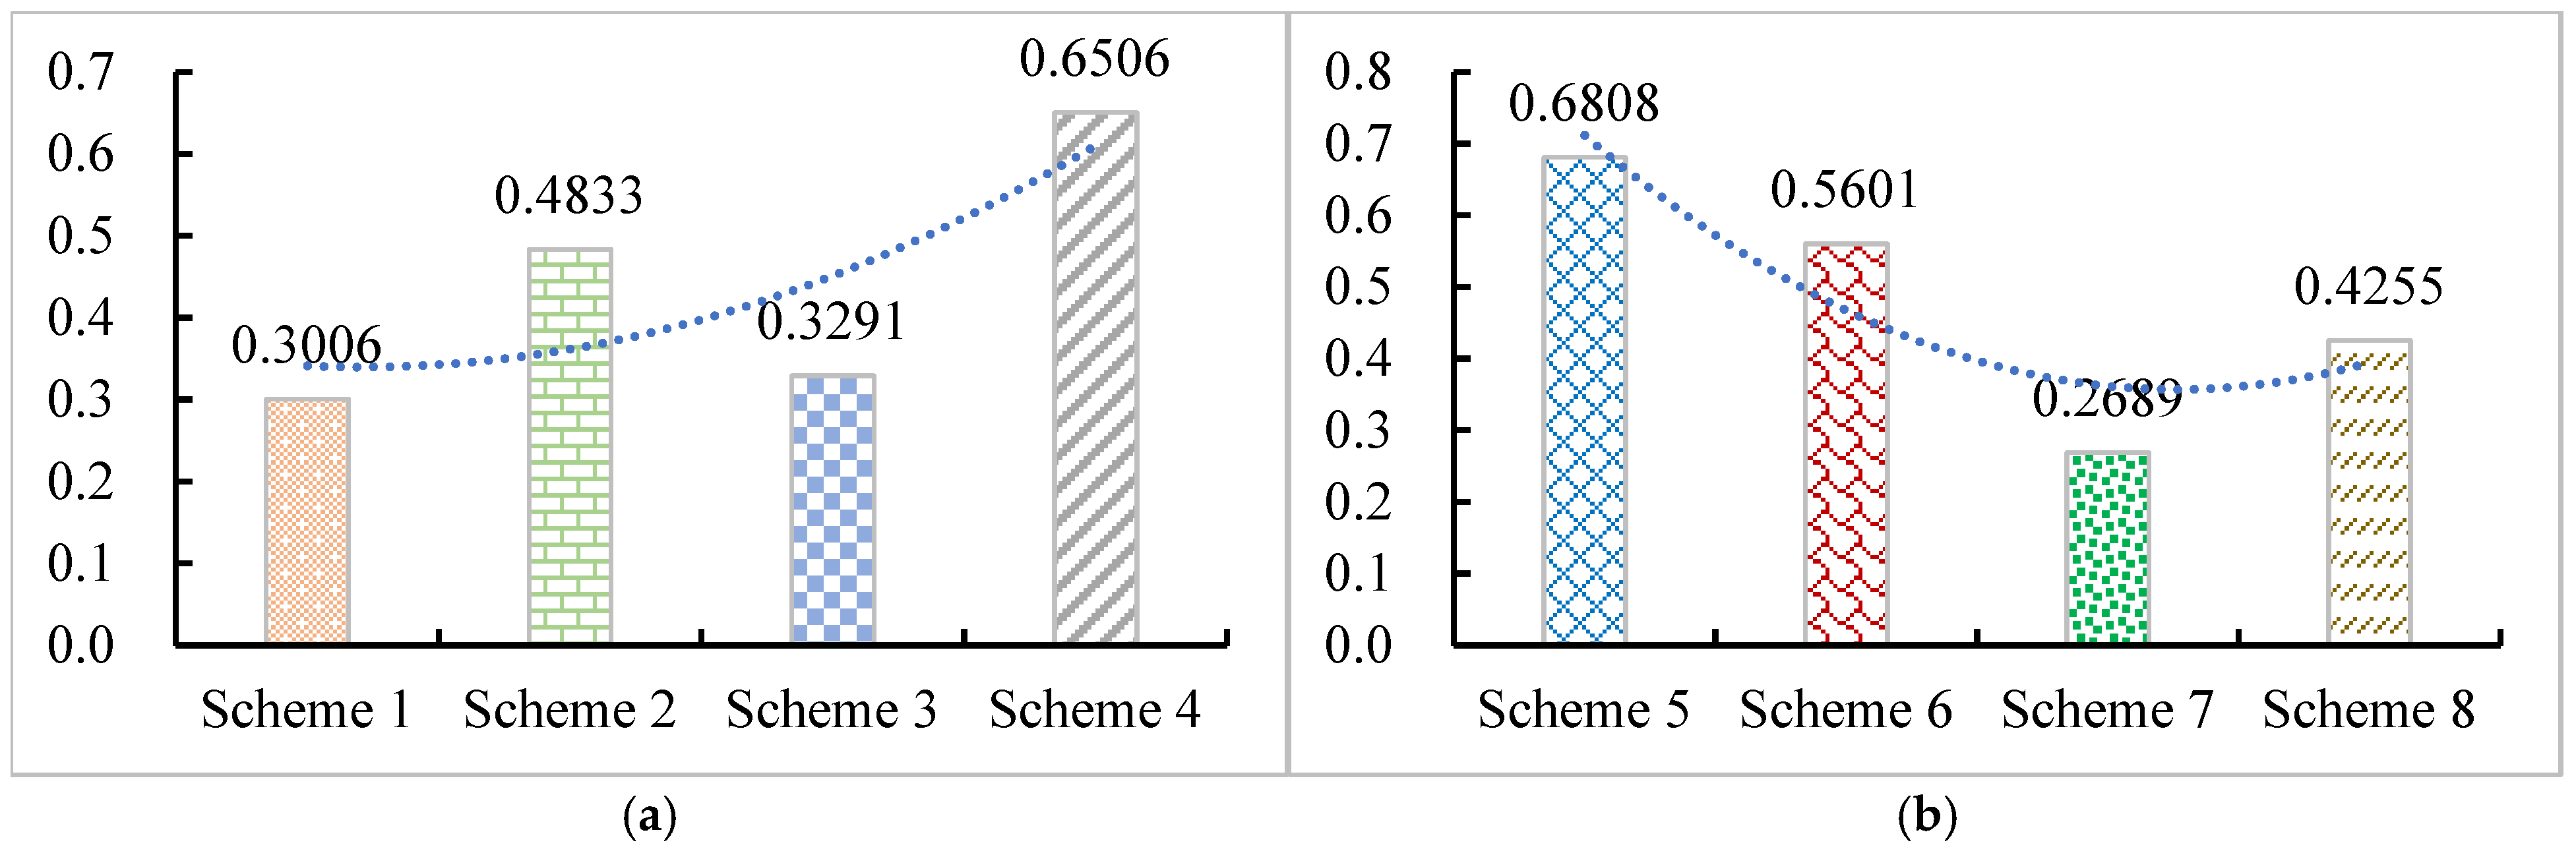
Second, to further examine the rationality and robustness of the coupling coordination model, the TOPSIS method was applied to evaluate the relative performance of different design scenarios [61], as it is widely used in comparative assessments of traffic safety schemes (Figure 14). The results indicate that Scheme 4 achieved the highest score among all pattern element complexity schemes. This finding is consistent with the coupling coordination analysis, in which Scheme 4 also presented the highest coordination value under the same pattern spacing. Moreover, the trend observed in the coupling coordination results, where the coordination degree first decreased and then increased as pattern spacing increased under fixed element complexity, was in agreement with the TOPSIS evaluation. This consistency further confirms the reliability of the coupling coordination model. It should be noted that TOPSIS assesses the superiority of single-factor schemes under controlled conditions but does not capture the interactive effects among multiple design variables. The coupling coordination model evaluates the coordinated performance of all combinations of pattern element complexity and pattern spacing, which allows for a more comprehensive analysis of interaction intensity and coordination levels among subsystems. Therefore, the coupling coordination model provides an essential analytical framework for examining multi-factor coupling mechanisms in tunnel sidewall decoration design.
However, this study focused on the overall effects of tunnel sidewall decoration on driving behavior at the population level. Although the sample size satisfied the minimum statistical requirements for driving simulator experiments and covered a wide range of ages and driving experience levels, it may still limit the generalizability of the findings, and group-specific responses, such as those of elderly or novice drivers, were not explicitly analyzed. Future studies will expand the sample size and include more diverse driver profiles to further validate the robustness of the results. In addition, incorporating psychological, physiological, and visual measures could help establish a more comprehensive evaluation framework. Finally, discrepancies between driving simulator experiments and real-world driving, as well as unavoidable psychological expectation effects, remain limitations of the present study and may be addressed in future work through field validation, increased scenario complexity, and extended rest intervals.

5. Conclusions

This study employed a driving simulation experiment to investigate the effects of tunnel sidewall decoration on driver behavior. An evaluation index system was established, encompassing four key aspects: speed adjustment, operational stability, driving comfort, and safety awareness. The effects of pattern element complexity and pattern spacing on these behavioral metrics were analyzed, and a coupling coordination degree model was developed to assess driving safety under their combined influence. The principal findings are summarized as follows:
(1)
Both element complexity and pattern spacing significantly affected driving behavior. Scheme 2 enhanced speed adjustment, operational stability, and safety awareness, while Scheme 4 primarily improved driving comfort. Regarding spacing schemes, Scheme 7 promoted speed regulation, comfort, and safety, whereas Scheme 6 improved operational stability. These effects were most pronounced in the central section of the tunnel.
(2)
Coupling coordination analysis identified the optimal combination: element complexity of 562.1 with pattern spacing of 5.5 m. Based on a coordination degree threshold of 0.8, further analysis indicated that the optimal element complexity ranged from 135.6 to 564.7 when the spacing was fixed at 10 m, whereas the ideal pattern spacing ranged from 5.5 to 17.2 m when the element complexity was fixed at 550.
This research provides a systematic framework integrating driving simulation, statistical analysis, and coordination modeling for evaluating and optimizing tunnel sidewall decorations. The findings offer practical guidance for engineering design and the development of relevant guidelines.

Author Contributions

F.Z.: The oversight for the research activity planning and execution; data analysis. Q.L.: The conceptualization of the work; data analysis; publication work writing. J.H.: Data analysis and interpretation; the translation of the published work. X.Z.: The conception of the work; W.D.: Data collection; the editing of the published work. All authors have read and agreed to the published version of the manuscript.

Funding

This research was supported by the Key R&D Program of Shanxi Province, Shanxi Science and Technology Department: Research and Application Demonstration of Active Warning, Prevention and Control Technology for Traffic Safety Risks on Special Sections of Freeways (No. 202202130501021).

Institutional Review Board Statement

The study was conducted in accordance with the Declaration of Helsinki and approved by the Institutional Review Board (Ethics Committee) of Beijing University of Technology (protocol code 202202130501021, date of approval: 13 November 2024).

Informed Consent Statement

Informed consent was obtained from all subjects involved in the study.

Data Availability Statement

The original contributions presented in this study are included in the article. Further inquiries can be directed to the corresponding author.

Conflicts of Interest

Author Fangyan Zhang was employed by Shanxi Transport Safety & Emergency Technology Center (Co., Ltd.). The remaining authors declare that the research was conducted in the absence of any commercial or financial relationships that could be construed as a potential conflict of interest.

References

  1. Ministry of Transport of the People’s Republic of China. Release of the 2024 Statistical Bulletin on the Development of China’s Transportation Industry. Tunn. Constr. 2025, 45, 1101–1102. [Google Scholar]
  2. Wang, S.; Du, Z.; Zheng, H.; Han, L.; Xia, X.; He, S. Improving Driving Safety in Freeway Tunnels: A Field Study of Linear Visual Guiding Facilities. Tunn. Undergr. Space Technol. 2024, 143, 105489. [Google Scholar] [CrossRef]
  3. Wang, S.; Mei, J.; He, S.; Du, Z. Do Visual Guiding Facilities in Freeway Tunnels Affect Drivers’ Perception of Longitudinal Safety Distance? A Simulation Experiment. Traffic Inj. Prev. 2025, 1–8. [Google Scholar] [CrossRef]
  4. Yang, Y.; Wu, X.; Yin, D.; Easa, S.M.; Zheng, X. Effect of Traffic Sign’s Information Supply Speed on Driver Performance at Tunnel Entrances. Transp. Res. Part F Traffic Psychol. Behav. 2025, 111, 217–237. [Google Scholar] [CrossRef]
  5. Kučina, I.; Babić, D.; Fiolić, M.; Babić, D. Application of Road Signs and Road Markings to Increase Safety in Horizontal Curves on Rural Roads. Transp. Res. Procedia 2023, 73, 186–194. [Google Scholar] [CrossRef]
  6. Feng, S.; Kan, D.; Zhou, L.; Liu, X.; Du, C.; Mao, W. Experimental Study on Effect of Pavement Background on Obstacle Visibility in LED Lighting Environment of Road Tunnel. Undergr. Space 2025, 22, 124–136. [Google Scholar] [CrossRef]
  7. Zhao, X.; Ju, Y.; Li, J.; Tao, P.; Wang, X.; Zhou, R. Evaluation of the Effect of RPMs in Extra-Long Tunnels Based on Driving Behavior and Visual Characteristics. China J. Highw. Transp. 2020, 33, 29–41. [Google Scholar]
  8. Zhao, X.; Ju, Y.; Zhang, C.; Li, J.; Ma, J.; Guo, J. Influence of the Tunnel Retro-Reflective Arch in Freeway Tunnels on Driving Behavior: A Driving Simulator Study. J. Transp. Saf. Secur. 2022, 14, 929–948. [Google Scholar] [CrossRef]
  9. Zhao, X.; Zhang, C.; Ju, Y.; Li, J.; Bian, Y.; Ma, J. Evaluation of Tunnel Retro-Reflective Arch in an Extra-Long Tunnel Based on the Matter-Element Extension Method. Accid. Anal. Prev. 2021, 150, 105913. [Google Scholar] [CrossRef] [PubMed]
  10. Han, L.; Du, Z.; Wu, K. Evaluation of Traffic Signs Information Volume at Highway Tunnel Entrance Zone Based on Driver’s Visual Characteristics. Transp. Res. Rec. J. Transp. Res. Board. 2024, 2678, 804–823. [Google Scholar] [CrossRef]
  11. Chen, Y.; Du, Z.; Xu, J.; Luo, S. Impact of Traffic Signs on Driving Speed at Mountain Highway Tunnel Entrances—The Role of Low-Volume Intermittent Information. Transp. Res. Part F Traffic Psychol. Behav. 2024, 106, 328–339. [Google Scholar] [CrossRef]
  12. Fang, Y.; Zhou, J.; Hu, H.; Hao, Y.; Xiao, D.; Li, S. Combination Layout of Traffic Signs and Markings of Expressway Tunnel Entrance Sections: A Driving Simulator Study. Sustainability 2022, 14, 3377. [Google Scholar] [CrossRef]
  13. Zhao, X.; Ju, Y.; Li, H.; Zhang, C.; Ma, J. Safety of Raised Pavement Markers in Freeway Tunnels Based on Driving Behavior. Accid. Anal. Prev. 2020, 145, 105708. [Google Scholar] [CrossRef] [PubMed]
  14. Du, Z.; Wang, S.; Yang, L.; Ni, Y.; Jiao, F. Experimental Study on the Efficacy of Retroreflective Rings in the Curved Freeways Tunnels. Tunn. Undergr. Space Technol. 2021, 110, 103813. [Google Scholar] [CrossRef]
  15. Wang, S.; Han, L.; Du, Z.; He, S.; Zheng, H.; Yang, L.; Jiao, F. Can Retroreflective Rings Enhance Drivers’ Safety Perception of Spatial Right-of-Way in Freeway Tunnels? A Simulation Exploration. Accid. Anal. Prev. 2025, 209, 107825. [Google Scholar] [CrossRef]
  16. Xing, G.; Ma, Y.; Chen, S.; Xing, Y.; Pang, Q.; Gao, L. Investigating the Self-Explaining Performance of Visual Guidance Facilities in Extra-Long Spiral Tunnels Based on Drivers’ Spatial Perception and Visual Attention Distribution. Accid. Anal. Prev. 2025, 217, 108040. [Google Scholar] [CrossRef] [PubMed]
  17. Zheng, Z.; Du, Z.; Yan, Q.; Xiang, Q.; Chen, G. The Impact of Rhythm-Based Visual Reference System in Long Highway Tunnels. Saf. Sci. 2017, 95, 75–82. [Google Scholar] [CrossRef]
  18. Chen, P.; Chen, F.; Zhang, L.; Ma, X.; Pan, X. Examining the Influence of Decorated Sidewaall in Road Tunnels Using FMRI Technology. Tunn. Undergr. Space Technol. 2020, 99, 103362. [Google Scholar] [CrossRef]
  19. Zhao, X.; Liu, Q.; Li, H.; Qi, J.; Dong, W.; Ju, Y. Evaluation of the Effect of Decorated Sidewall in Tunnels Based on Driving Behavior Characteristics. Tunn. Undergr. Space Technol. 2022, 127, 104591. [Google Scholar] [CrossRef]
  20. He, S.; Wan, H.; Du, Z.; Han, L. Impact of Sidewall Information on Drivers’ Visual Load among Different Lanes: Traditional Guiding Facilities and Decorated Pattern. Traffic Inj. Prev. 2024, 25, 1002–1012. [Google Scholar] [CrossRef]
  21. Zhu, S.; Liang, B.; Li, Z.; Zhu, S. Visual Effects of Landscape Decoration in the Middle Section of Extra-Long Tunnel Based on Driving Visual Characteristics. Traffic Inj. Prev. 2025, 1–9. [Google Scholar] [CrossRef] [PubMed]
  22. Kircher, K.; Ahlstrom, C. The Impact of Tunnel Design and Lighting on the Performance of Attentive and Visually Distracted Drivers. Accid. Anal. Prev. 2012, 47, 153–161. [Google Scholar] [CrossRef] [PubMed]
  23. Ye, F.; Ying, K.-C.; Liang, X.-M.; Su, E.-J.; Liang, X.; Wei, Y.-C. Vault Design of Highway Tunnels Based on the Driver’s Physiological Characteristics. J. Asian Archit. Build. Eng. 2022, 21, 839–848. [Google Scholar] [CrossRef]
  24. Wang, W.; Jia, L. Research on Sidewall Decoration for Extra-Long Highway Tunnels Based on Alleviating Visual Fatigue. Transp. Bus. China 2023, 3, 98–100. [Google Scholar]
  25. Xia, Z.; Lv, Y.; Pan, X.; Chen, F.; Xu, M.; Wu, G.; Feng, D. Research on Design Pattern of City Tunnel Side Wall Based on the Driver Visual Effect. In Proceedings of the AHFE 2016 International Conference on Human Factors in Transportation, Lake Buena Vista, FL, USA, 27–31 July 2016. [Google Scholar]
  26. Wan, H.; Du, Z.; Yan, Q. The Speed Control Effect of Highway Tunnel Sidewall Markings Based on Color and Temporal Frequency. J. Adv. Transp. 2016, 50, 1352–1365. [Google Scholar] [CrossRef]
  27. Zhao, X.; Dong, W.; Li, J.; Liu, Q.; Ju, Y. How Does the Mural Decoration of the Long Tunnel Sidewall Affect the Driver’s Speed Control Ability? Tunn. Undergr. Space Technol. 2022, 130, 104731. [Google Scholar] [CrossRef]
  28. Qin, P.; Wang, M.; Chen, Z.; Yan, G.; Yan, T.; Han, C.; Bao, Y.; Wang, X. Characteristics of Driver Fatigue and Fatigue-Relieving Effect of Special Light Belt in Extra-Long Highway Tunnel: A Real-Road Driving Study. Tunn. Undergr. Space Technol. 2021, 114, 103990. [Google Scholar] [CrossRef]
  29. Wynne, R.A.; Beanland, V.; Salmon, P.M. Systematic Review of Driving Simulator Validation Studies. Saf. Sci. 2019, 117, 138–151. [Google Scholar] [CrossRef]
  30. Yang, Y.; Hu, Y.; Xu, C.; Zhang, Y.; Zheng, T. How Do Freeway Tunnel Portal Locations and the Corresponding Horizontal Alignment Affect Traffic Safety? Insights from Driving Simulation Experiment and Reliability Analysis. Accid. Anal. Prev. 2025, 218, 108082. [Google Scholar] [CrossRef]
  31. Zhang, W.; Zhang, Y. Navigation Risk Assessment of Autonomous Ships Based on Entropy–TOPSIS–Coupling Coordination Model. J. Mar. Sci. Eng. 2023, 11, 422. [Google Scholar] [CrossRef]
  32. Lv, Q.; Shi, J. Application of Coupled Coordination Model in Development Evaluation of Station Area. J. Phys. Conf. Ser. 2022, 2381, 012091. [Google Scholar] [CrossRef]
  33. Miao, L.; Gu, Y.; He, L.; Wang, H.; Schwebel, D.C.; Shen, Y. The Influence of Music Tempo on Mental Load and Hazard Perception of Novice Drivers. Accid. Anal. Prev. 2021, 157, 106168. [Google Scholar] [CrossRef]
  34. Babić, D.; Babić, D.; Sucha, M.; Stanić, V.; Toman, M. The Influence of Music Genres on the Driving Behaviour of Young Drivers and Their Visual Scanning of the Environment. Transp. Res. Part F Traffic Psychol. Behav. 2021, 81, 396–407. [Google Scholar] [CrossRef]
  35. Redelmeier, D.A.; Raza, S. Optical Illusions and Life-Threatening Traffic Crashes: A Perspective on Aerial Perspective. Med. Hypotheses 2018, 114, 23–27. [Google Scholar] [CrossRef]
  36. McIntosh, R.D. Perceptual Illusions. In Encyclopedia of Behavioral Neuroscience, 2nd ed.; Elsevier: Amsterdam, The Netherlands, 2022. [Google Scholar]
  37. Jiao, F.; Du, Z.; Wong, Y.D.; He, S.; Xu, F.; Zheng, H. Self-Explaining Performance of Visual Guiding Facilities in Urban Road Tunnels Based on Speed Perception. Tunn. Undergr. Space Technol. 2022, 122, 104371. [Google Scholar] [CrossRef]
  38. Liu, B. Mechanism Study on the Vision-Based-Speed Control and Lane Keeping. Ph.D. Thesis, Wuhan University of Technology, Wuhan, China, 2008. [Google Scholar]
  39. Pan, F.; Wu, Q.; Wang, Z.; Wang, L.; Zhang, L.; Li, M. Effectiveness Evaluation of Optical Illusion Deceleration Markings for a V-Shaped Undersea Tunnel Based on the Set Pair Analysis Method and the Technique for Order Preference by Similarity to Ideal Solution Theory. Transp. Res. Rec. J. Transp. Res. Board. 2023, 2677, 308–324. [Google Scholar] [CrossRef]
  40. Shi, X.; Du, Z.; Zhou, L.; Li, P. Optimization of Deceleration Markings of Visual Illusion in a Highway Tunnel. J. Highw. Transp. Res. Dev. 2016, 10, 63–70. [Google Scholar] [CrossRef]
  41. Song, Z.; Pan, X.; Li, S.; Yu, Z. Study on Driving Safety Evaluation Based on Tunnel Sidewall Effect. Highw. Eng. 2010, 35, 10–13+18. [Google Scholar]
  42. Wu, Q.; Pan, X.; Yang, H.; Chen, C. Research on Driving Safety Experiment of Tunnel Based on Sidewall Effect. Highw. Eng. 2013, 38, 99–102+118. [Google Scholar]
  43. Zhang, J.; Si, D. On the Application of Color Psychology in Architectural Environment Design. Basic. Clin. Pharmacol. Toxicol. 2020, 127, 215–216. [Google Scholar]
  44. Qin, X.; Zhang, N.; Zhang, W.; Meitner, M. How Does Tunnel Interior Color Environment Influence Driving Behavior? Quantitative Analysis and Assessment Experiment. Tunn. Undergr. Space Technol. 2020, 98, 103320. [Google Scholar] [CrossRef]
  45. Zhao, X.; Chen, Y.; Li, H.; Ma, J.; Li, J. A Study of the Compliance Level of Connected Vehicle Warning Information in a Fog Warning System Based on a Driving Simulation. Transp. Res. Part F Traffic Psychol. Behav. 2021, 76, 215–237. [Google Scholar] [CrossRef]
  46. Dai, Y.; Bian, Y.; Wu, Y.; Zhao, X.; Zhang, J. How the Active Visual Guidance Device Affects Drivers on the Foggy Bridge: Safety Analysis Considering Emergency. Measurement 2023, 217, 113027. [Google Scholar] [CrossRef]
  47. Li, H.; Li, Y.; Chen, K.; Zhao, X. Driving Behavior of L3 Autonomous Vehicle Drivers in Fog Zones under Different Traffic Flow Conditions. Measurement 2023, 207, 112300. [Google Scholar] [CrossRef]
  48. Wu, Y.; Abdel-Aty, M.; Park, J.; Selby, R.M. Effects of Real-Time Warning Systems on Driving under Fog Conditions Using an Empirically Supported Speed Choice Modeling Framework. Transp. Res. Part C Emerg. Technol. 2018, 86, 97–110. [Google Scholar] [CrossRef]
  49. Filtness, A.J.; Larue, G.; Schramm, A.; Fuller, J.; Rakotonirainy, A.; Han, C.; Cairney, P. Safety Implications of Co-Locating Road Signs: A Driving Simulator Investigation. Transp. Res. Part F Traffic Psychol. Behav. 2017, 47, 187–198. [Google Scholar] [CrossRef]
  50. Bian, Y.; Zhang, X.; Wu, Y.; Zhao, X.; Liu, H.; Su, Y. Influence of Prompt Timing and Messages of an Audio Navigation System on Driver Behavior on an Urban Expressway with Five Exits. Accid. Anal. Prev. 2021, 157, 106155. [Google Scholar] [CrossRef]
  51. Chow, S.-C.; Shao, J.; Wang, H.; Lokhnygina, Y. (Eds.) Sample Size Calculations in Clinical Research, 3rd ed.; Series: Chapman & Hall/CRC biostatistics series|“A CRC title, part of the Taylor & Francis imprint, a member of the Taylor & Francis Group, the academic division of T&F Informa plc.,”; Chapman and Hall: Boca Raton, FL, USA; CRC: Boca Raton, FL, USA; Taylor & Francis: Boca Raton, FL, USA, 2017; ISBN 9781315183084. [Google Scholar]
  52. Chen, H.; Zhao, X.; Chen, C.; Li, Z.; Li, H.; Gong, J. How to Define the Threshold of Takeover Response Ability of Different Drivers in Conditional Automated Driving. Transp. Res. Part F Traffic Psychol. Behav. 2024, 106, 179–198. [Google Scholar] [CrossRef]
  53. Dong, Y.; Chen, Y. An Evaluation of Urban Traffic Environment Based on the Amount of Visual Information. J. Traffic Inf. Saf. 2014, 6, 146–152. [Google Scholar]
  54. Chen, Q.; Lu, S.; Xiong, K.; Zhao, R. Coupling Analysis on Ecological Environment Fragility and Poverty in South China Karst. Environ. Res. 2021, 201, 111650. [Google Scholar] [CrossRef]
  55. Zhang, Y.; Bian, Y.; Zhao, X.; Zhao, X. Integrating Safety and Efficiency: Design and Evaluation of Dynamic Emergency Evacuation Sign System in Urban Rail Transit. Sustainability 2024, 16, 10921. [Google Scholar] [CrossRef]
  56. Jiang, L.; Du, Z.; Mai, J. An Empirical Study on the Impact of Information Content of Traffic Signs in Entrance Areas of Highway Tunnels on Drivers’ Visual Behavior. J. Transp. Inf. Saf. 2025, 43, 19–27. [Google Scholar]
  57. Wang, Y.; Fu, Q.; Wang, X. A Traffic Status Evaluation Method of Expressway Merging Area Based on Improved Coupling Theory. Mod. Phys. Lett. B 2022, 36, 2150616. [Google Scholar] [CrossRef]
  58. Wang, C.; Yang, Q.; Wu, S. Coordinated Development Relationship between Port Cluster and Its Hinterland Economic System Based on Improved Coupling Coordination Degree Model: Empirical Study from China’s Port Integration. Sustainability 2022, 14, 4963. [Google Scholar] [CrossRef]
  59. Liu, Q.; Huang, J.; Zhao, X.; Li, J.; Chen, Y.; Wu, C. Study on Optimization Design of Guide Signs in Dense Interchange Sections of Eight-Lane Freeway. Accid. Anal. Prev. 2025, 209, 107828. [Google Scholar] [CrossRef] [PubMed]
  60. Kaber, D.B.; Liang, Y.; Zhang, Y.; Rogers, M.L.; Gangakhedkar, S. Driver Performance Effects of Simultaneous Visual and Cognitive Distraction and Adaptation Behavior. Transp. Res. Part F Traffic Psychol. Behav. 2012, 15, 491–501. [Google Scholar] [CrossRef]
  61. Huang, A.-C.; Huang, C.-F.; Shu, C.-M. A Case Study for an Assessment of Fire Station Selection in the Central Urban Area. Safety 2023, 9, 84. [Google Scholar] [CrossRef]
Figure 1. A variety of sidewall decoration cases in China.
Sustainability 18 00844 g001
Figure 2. Additional traffic on the periphery of the test vehicle.
Sustainability 18 00844 g002
Figure 3. Driving simulator used for testing.
Sustainability 18 00844 g003
Figure 4. The roadmap of the experimental scenario.
Sustainability 18 00844 g004
Figure 5. Testing Procedure for Driving Simulation Experiment.
Sustainability 18 00844 g005
Figure 6. Segment division of tunnel.
Sustainability 18 00844 g006
Figure 7. Color quantification method of tunnel sidewall.
Sustainability 18 00844 g007
Figure 8. Effect of pattern elements on velocity following ratio.
Sustainability 18 00844 g008
Figure 9. The effect of pattern element complexity on driver behavior. Note: * means p < 0.1 (significant margin), ** means p < 0.05, *** means p < 0.01.
Sustainability 18 00844 g009aSustainability 18 00844 g009b
Figure 10. Effect of pattern spacing on velocity following ratio.
Sustainability 18 00844 g010
Figure 11. The effect of pattern spacing on driver behavior. Note: * means p < 0.1 (significant margin), ** means p < 0.05, *** means p < 0.01.
Sustainability 18 00844 g011
Figure 12. Computational structure of the coupling coordination degree model for pattern element complexity and pattern spacing.
Sustainability 18 00844 g012
Figure 13. Coupling coordination degree under the combined action of complexity of pattern elements and pattern spacing. Note: Symbols in the figure represent specific data points from Table 7.
Sustainability 18 00844 g013
Figure 14. The evaluation results of the TOPSIS method. (a) The evaluation results of element complexity schemes. (b) The evaluation results of pattern spacing schemes. Note: Blue dotted lines represent the overall trend of the evaluation results for each scheme.
Sustainability 18 00844 g014
Table 1. Test section tunnel design parameters.
Tunnel CharacteristicDesign Parameters
TypeSingle hole, one-way three-lane extra-long tunnel
Length3.5 km
Speed Limit60 km/h–80 km/h
Height Limit5.0 m
WidthLane width: 3.75 m; emergency lane width: 4.5 m
Line and ElevationBased on actual tunnel conditions, the layout is predominantly straight with intermittent curves.
Table 2. Experimental schemes of tunnel sidewall decoration based on element complexity and pattern spacing.
Scheme Pattern
Elements
Pattern RhythmPattern
Spacing
Pattern
Schemes 1–4 are used to analyze the influence of element complexity on driving behavior
1Nothing---------
2Character1.26 Hz17.5 mSustainability 18 00844 i001
3Character and Ribbon1.26 Hz17.5 mSustainability 18 00844 i002
4Character, Ribbon and Snowflake1.26 Hz17.5 mSustainability 18 00844 i003
Schemes 5–8 are used to analyze the effect of pattern spacing on driving behavior
5Character, Ribbon and Snowflake4 Hz5.5 mSustainability 18 00844 i004
6Character, Ribbon and Snowflake2 Hz11.5 mSustainability 18 00844 i005
7Character, Ribbon and Snowflake0.94 Hz23.5 mSustainability 18 00844 i006
8Character, Ribbon and Snowflake0.75 Hz29.5 mSustainability 18 00844 i007
Table 3. Driver characteristic descriptive statistics.
VariableDescriptionNumber of ParticipantsPercentage
Age18–24829.6
25–341037.1
35–49518.5
50 or more414.8
GenderMale1970.4
Female829.6
Driving experience5 or below725.9
6–10518.5
11 or more1555.6
Professional driver or notYes1140.7
No1659.3
Table 4. Visual information load of tunnel sidewall decoration schemes.
ColorR ValueG ValueB ValueH ValueS ValueV ValueArea RadioF Value
Scheme 1Primary color13713713700121.51.00121.50
Scheme 2Blue0150235202252.5234.60.81640.8
White25525525518002550.19
Scheme 3Blue0150235202252.5234.60.62592.5
White25525525518002550.38
Scheme 4Blue0150235202252.5234.60.50562.1
White25525525518002550.50
Table 5. Results of repeated measures analysis of variance (Element Complexity).
DimensionIndex Element Complexity
Entrance SectionMiddle SectionExit Section
Speed regulation level v f r F0.4203.8212.632
p0.7390.018 **0.056 *
  η 2 0.0160.1270.092
Operation stability level S a F10.2445.0784.616
p0.000 ***0.003 ***0.005 ***
  η 2 0.2830.1630.151
Driving comfort level a m a x F1.0103.1194.075
p0.3930.045 **0.010 ***
  η 2 0.0370.2800.135
Safety awareness level P F1.1123.4300.555
p0.3500.021 **0.647
  η 2 0.0410.1170.021
Note: * means p < 0.1 (significant margin), ** means p < 0.05, *** means p < 0.01.
Table 6. Results of repeated measures analysis of variance (Pattern Spacing).
DimensionIndex Pattern Spacing
Entrance SectionMiddle SectionExit Section
Speed regulation level v f r F0.6033.3172.482
p0.5690.024 **0.085 *
  η 2 0.0230.1130.237
Operation stability level S a F7.7593.3311.407
p0.000 ***0.024 **0.247
  η 2 0.2260.1140.051
Driving comfort level a m a x F3.0282.4751.772
p0.049 **0.086 *0.179
  η 2 0.2660.2360.181
Safety awareness level P F0.8713.4450.942
p0.4700.022 **0.436
  η 2 0.0980.1200.105
Note: * means p < 0.1 (significant margin), ** means p < 0.05, *** means p < 0.01.
Table 7. The coupling coordination degree between element complexity and pattern spacing.
Pattern Spacing (m)
5.511.523.529.5
Complexity of pattern elements121.50.7990.7680.5590.712
562.10.8420.8090.5880.749
592.50.6730.6470.4700.599
640.80.6470.6220.4520.576
Table 8. Results of psychological expectation effect test.
Indexesp
Velocity following ratio (%)0.259
Steering wheel angle (rad)0.068
Maximum deceleration (m/s2)0.442
Accelerator power (%∙s)0.286
Disclaimer/Publisher’s Note: The statements, opinions and data contained in all publications are solely those of the individual author(s) and contributor(s) and not of MDPI and/or the editor(s). MDPI and/or the editor(s) disclaim responsibility for any injury to people or property resulting from any ideas, methods, instructions or products referred to in the content.