


Abstract
Converter gas is highly susceptible to leakage during the recovery and utilization process, which threatens personnel security and sustainable industrial development. To address this issue, a numerical model was established based on an actual converter fan room, and the accuracy of the simulation was verified through comparison with actual measurement data. In this study, the gas leakage flow field, diffusion trajectories, and hazard zone gradations were analyzed. Results showed that the gas contamination was significantly influenced by the leakage direction, leakage location, and structural boundary. The jet dominated the gas dispersion near the leakage source, with similar initial diffusion characteristics across different scenarios. Then, the diffusion velocity decayed rapidly within a distance of 0.6 m. Obstacles can significantly promote vortex formation, restrict the gas dispersion path, and reduce the extent of the hazardous area. In addition, it can be found that the far-field velocity under downward leakage was the highest, presenting the greatest risk of poisoning. At a height of 1.6 m, a lethal zone with a radius of 0.8 m was formed directly beneath the leakage hole. This work can guide the optimization of the monitoring program and emergency planning for converter gas leakage accidents.
1. Introduction
Steel is the basic industry of the national economy in modern society [1]. Converter steelmaking has become the mainstream steelmaking process in the world due to its high efficiency and environmentally friendly features [2]. Converter gas is a by-product gas produced in the process of converter steelmaking. Recovery of converter gas has always been one of the core processes in the iron and steel enterprise [3]. The recovered converter gas can meet the energy needs of many industries and avoid the greenhouse effect caused by direct emissions [4,5]. According to the World Steel Association [6], 71.1% of global crude steel production was made using the BF-BOF process. In China, nearly 90.1% is derived from the BF-BOF method. The Global Energy Monitor predicts that the share of crude steel produced by electric arc furnaces will only increase to 53% by 2050 [7], thereby demonstrating that the converter process still plays a crucial role in sustainable development. The converter gas is a mixed gas mainly composed of carbon monoxide (CO) [8]. Accidental leakage of converter gas may form a complex flow field with a high concentration of CO across an industrial site, causing varying degrees of health hazards to those present [9,10]. With the increase in crude steel production, the risk of converter gas leakage in the iron and steel enterprises is also increasing [11,12]. In this context, frequent gas leakage would lead to resource waste and affect health and the environment, which has an impact on industrial development and disaster management on sustainability.
The hazards of CO leakage and diffusion have attracted extensive attention from researchers, and in recent years, numerical simulation techniques based on computational fluid dynamics (CFD) have become the main method for analyzing the spatial and temporal distribution patterns of CO [13,14,15]. Studies of CO diffusion in indoor spaces have focused on vehicle exhaust [16,17,18]. Al-Waked et al. [19] investigated the concentration of CO generated from vehicle exhaust in a multi-story underground parking lot of a shopping center. Shi et al. [20] combined numerical simulation with field measurement to study the exhaust gas migration law of fuel vehicles under the action of airflow field in a confined space. In addition, some scholars focus on the CO diffusion patterns in residential indoor spaces [15,21,22]. Chang and Cheng [23] used a CFD program to predict CO concentrations and airflow fields in typical enclosed indoor rooms of a 3D-simulated residential building. Wang et al. [24] investigated the effect of air change rates on the CO production and diffusion of the generator in the shed. In terms of coal gas leakage in iron and steel enterprises, research has focused mainly on the gas diffusion through the plant area. Zhao et al. [25] simulated the 2D planar leakage diffusion process of storage tank coal gas to derive the law of CO concentration variation with time and space. Fu et al. [26] numerically modeled the diffusion of coal gas leakage in the plant area and concluded that converter gas diffuses more widely than coke oven gas. In the above research, revealing the gas diffusion laws and obtaining quantitative data were of great significance for safety guidance.
In the context of coal gas leaks in the converter fan rooms of iron and steel enterprises, there is a paucity of research on the diffusion laws of CO. On the one hand, the converter fan room is several or even more than ten times the volume of dwelling houses, and the column, ceiling screen, converter fan, and other obstacles would lead to differences in CO diffusion characteristics between the converter room and the general indoor space. On the other hand, the leakage risk is high at the pipe connection, rotating part, and sealing cover of each fan in the converter fan room. Due to variations in leakage direction and obstacle distribution, explaining the law under a single case is insufficient, so the CO leakage and dispersion law for each leakage case should be clarified for early warning and personnel safety.
Therefore, numerical simulation [27,28] was employed in this paper to study the leakage and diffusion characteristics of coal gas in a converter fan room. Firstly, a reasonable numerical model was established, including the selection of leakage and turbulence models, the construction of physical structures, etc. Then, the suitable computational grid and boundary conditions were set, and the numerical simulation was validated by using on-site measured data. Finally, by the simulation data obtained based on the above work, the flow field distribution, the CO diffusion path, and the hazard area were investigated. This paper can help to understand the development of coal gas leakage in typical industrial buildings, which is essential for accident prevention and emergency evacuation.
2. Numerical Model
For CFD simulation for gas leakage, the specific form of leakage needs to be determined according to the actual situation, and the species transport process still follows the mass conservation equation, momentum equation, and energy equation. In addition, choosing an appropriate turbulence model was also necessary for studying fluid flow.
2.1. Model Establishment
2.1.1. Small Hole Leakage Rate Model
Coal gas leakage accidents are usually caused by a small aperture or a large aperture/pipeline rupture. Levenspiel [29] proposed the small hole leakage rate model in 1984, and many researchers have been constantly improving it [30,31]. Since the small aperture leakage is very common compared with large aperture/pipeline rupture, this leakage mode can be considered and employed to investigate the coal gas leakage in the converter fan room. It is assumed that the upstream pressure in the pipeline is not affected by leakage, and the frictional heat generation is ignored. In this situation, the leakage rate is equal to the initial leakage rate and does not change with time.
The critical pressure ratio (CPR) is used to determine the flow pattern at the leak.
where CPR is the critical pressure ratio, and k is the specific heat of coal gas, 1.3 kJ/(kg·K).
When CPR < Pa/P, the gas flow at the leakage hole is subsonic.
where Q is the mass flow rate (kg/s); C0 is the coefficient of leakage, dimensionless; when the leakage hole is a circle, C0 is 1; P is the pressure of the pipeline, Pa; T is the gas temperature, K; M is the molar mass of converter gas, 0.031 kg/mol; Z is compression factor, Z = 1; R is gas constant, 8.314 J/(mol·K); A is the area of the leakage hole. P = Pa/CPR = 101,325/0.548 = 180,000 Pa. That is, when P < 180,000 Pa, the leakage velocity is subsonic. The pipeline pressure in this paper is 8000 Pa, and the mass flow rate can be obtained as in Equation (2).
2.1.2. Conservation Equation
The calculated Reynolds number of converter gas during small-orifice leakage is less than 0.3, indicating a subsonic incompressible flow regime. In the diffusion process, gases such as CO mix with ambient air, governed by the conservation equations of mass, momentum, and energy.
The continuity equation:
The momentum equation:
The energy equation:
where ρ is the gas density, kg/m3; t is the time, s; u is the gas component flow rate, m/s; μ and μt are the turbulent energy of Gk generated by the laminar velocity gradient, J; p is the gas pressure, Pa; g is the acceleration of gravity, m/s2; E is the total energy, J; keff is the effective conductivity; and hjJj represents the enthalpy and diffusion flux of the component j.
2.1.3. CFD Model Feasibility Validation
The CFD model should be validated against existing experimental results before conducting simulations of gas leakage and diffusion [32]. The diffusion process of coal gas is a turbulent motion. Different turbulence models will lead to different simulation results. For example, the standard k-ε model has been widely used by numerous scholars [33,34]. The RNG k-ε model has high simulation accuracy and wide practicability [20,35]. The Realizable k-ε model may be closer to the experimental data in some cases [28,36], which is as follows:
where k is the turbulence energy, J; ε is the turbulent dissipation rate, %; Gk represents the increment of turbulent kinetic energy k generated by the average velocity gradient. The values C1ε, C2ε, σk, and σε are constants. ν is the correction factor.
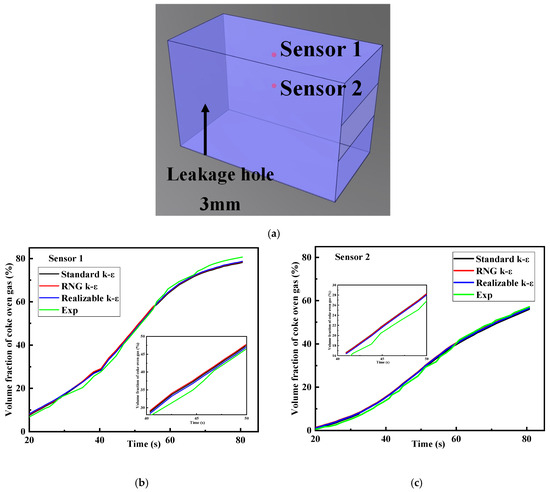
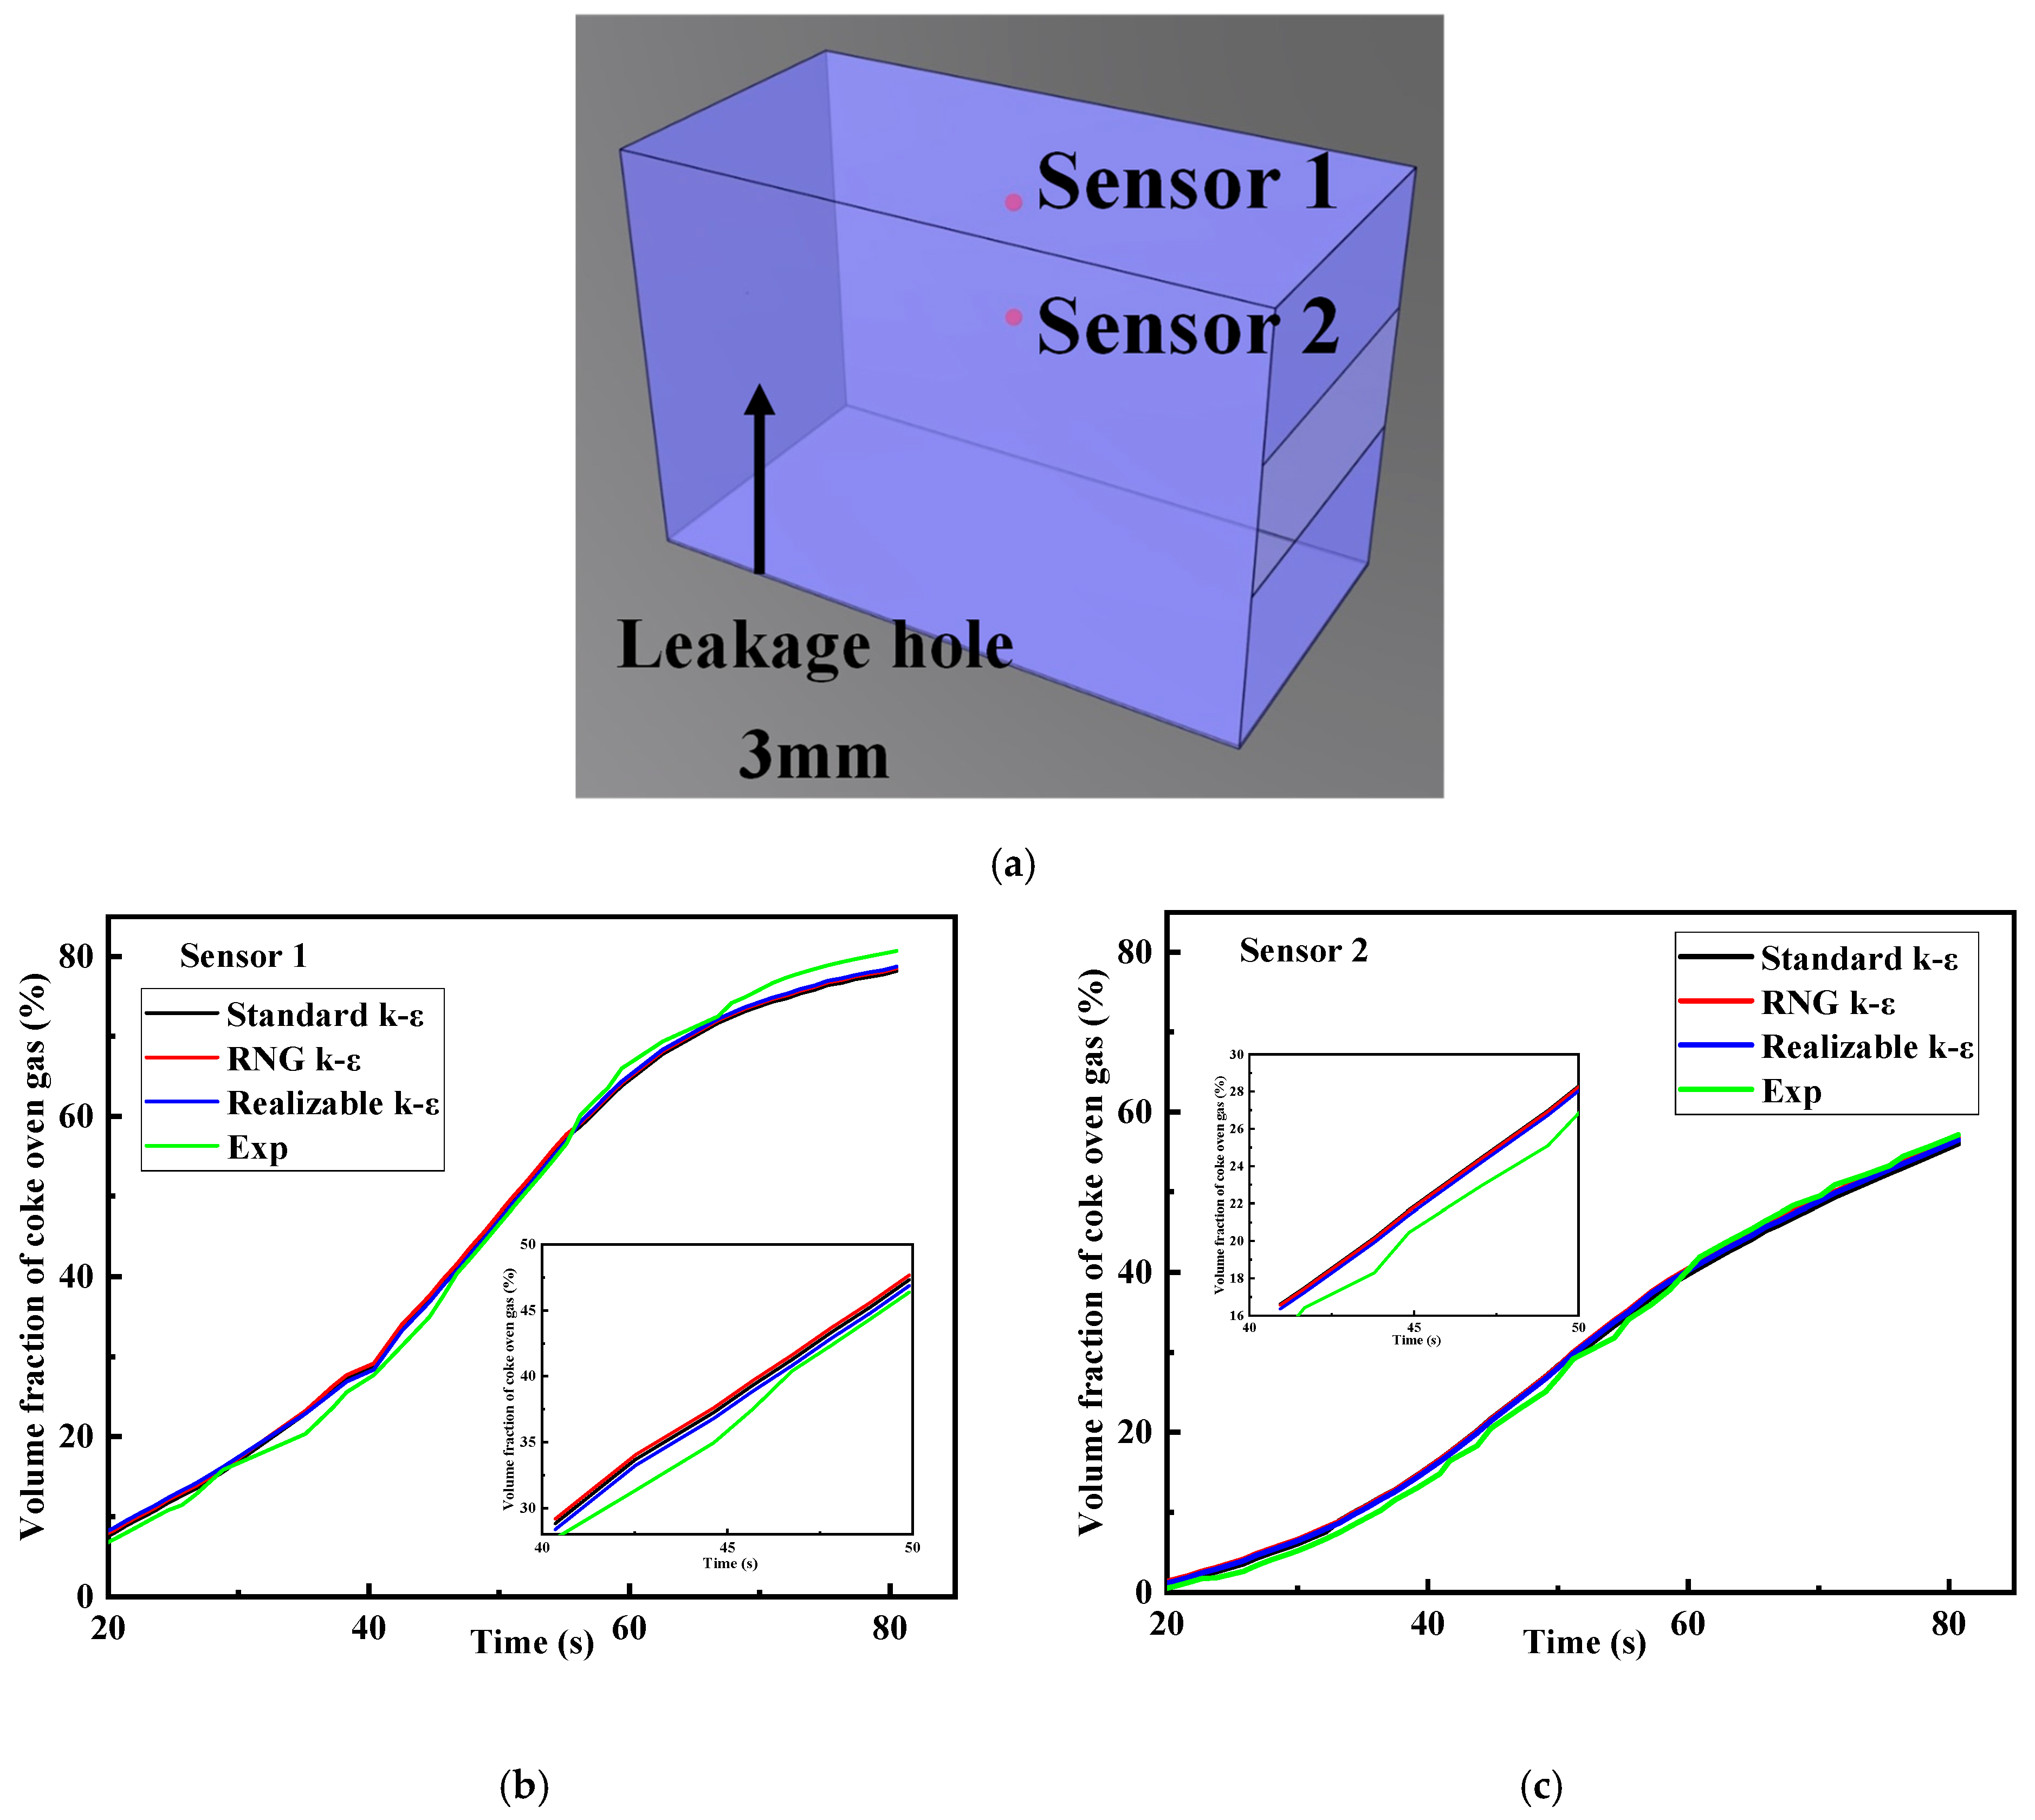
The above models can be compared and analyzed to obtain accurate simulation results. The experimental data were extracted for the determination of an accurate model based on the study of Wu et al. [37]. The dimensions of the 1/5th scale rectangular space were 1.2 m × 0.6 m × 0.8 m. One vent with a 3 mm diameter was located at the center of the left wall. Gas leakage velocity was set as 1.5 m/s, and the gas sensors were set at different heights, 600 mm away from the leakage source. The two gas sensors at the top were labeled as Sensor 1 and Sensor 2, which were shown in Figure 1a.
Figure 1.
Verification condition of turbulence model: (a) the experimental schematic, (b) comparison with experimental data from Sensor 1, and (c) comparison with experimental data from Sensor 2.
Figure 1b,c compare the CO molar fraction obtained from the experiment with the simulation results using three turbulence models (Standard k-ε, RNG k-ε, and Realizable k-ε), which are obviously closely aligned with the experimental data, showing that the CFD models can accurately simulate gas leakage in this environment [38]. There was only a small difference in the results of the three turbulence models, with less than 5%. In regions with large simulation deviations, the Realizable k-ε model was closest to experimental data. The Realizable k-ε model has advantages in capturing local flow separation and gas accumulation behavior, and requires lower computational resources and higher numerical stability. Therefore, the Realizable k-ε model was chosen in this study.
2.1.4. Physical Model Building
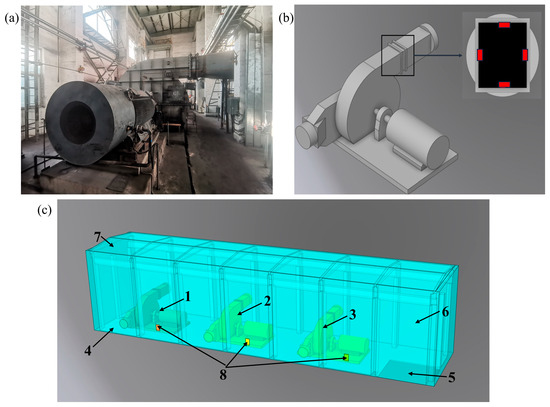
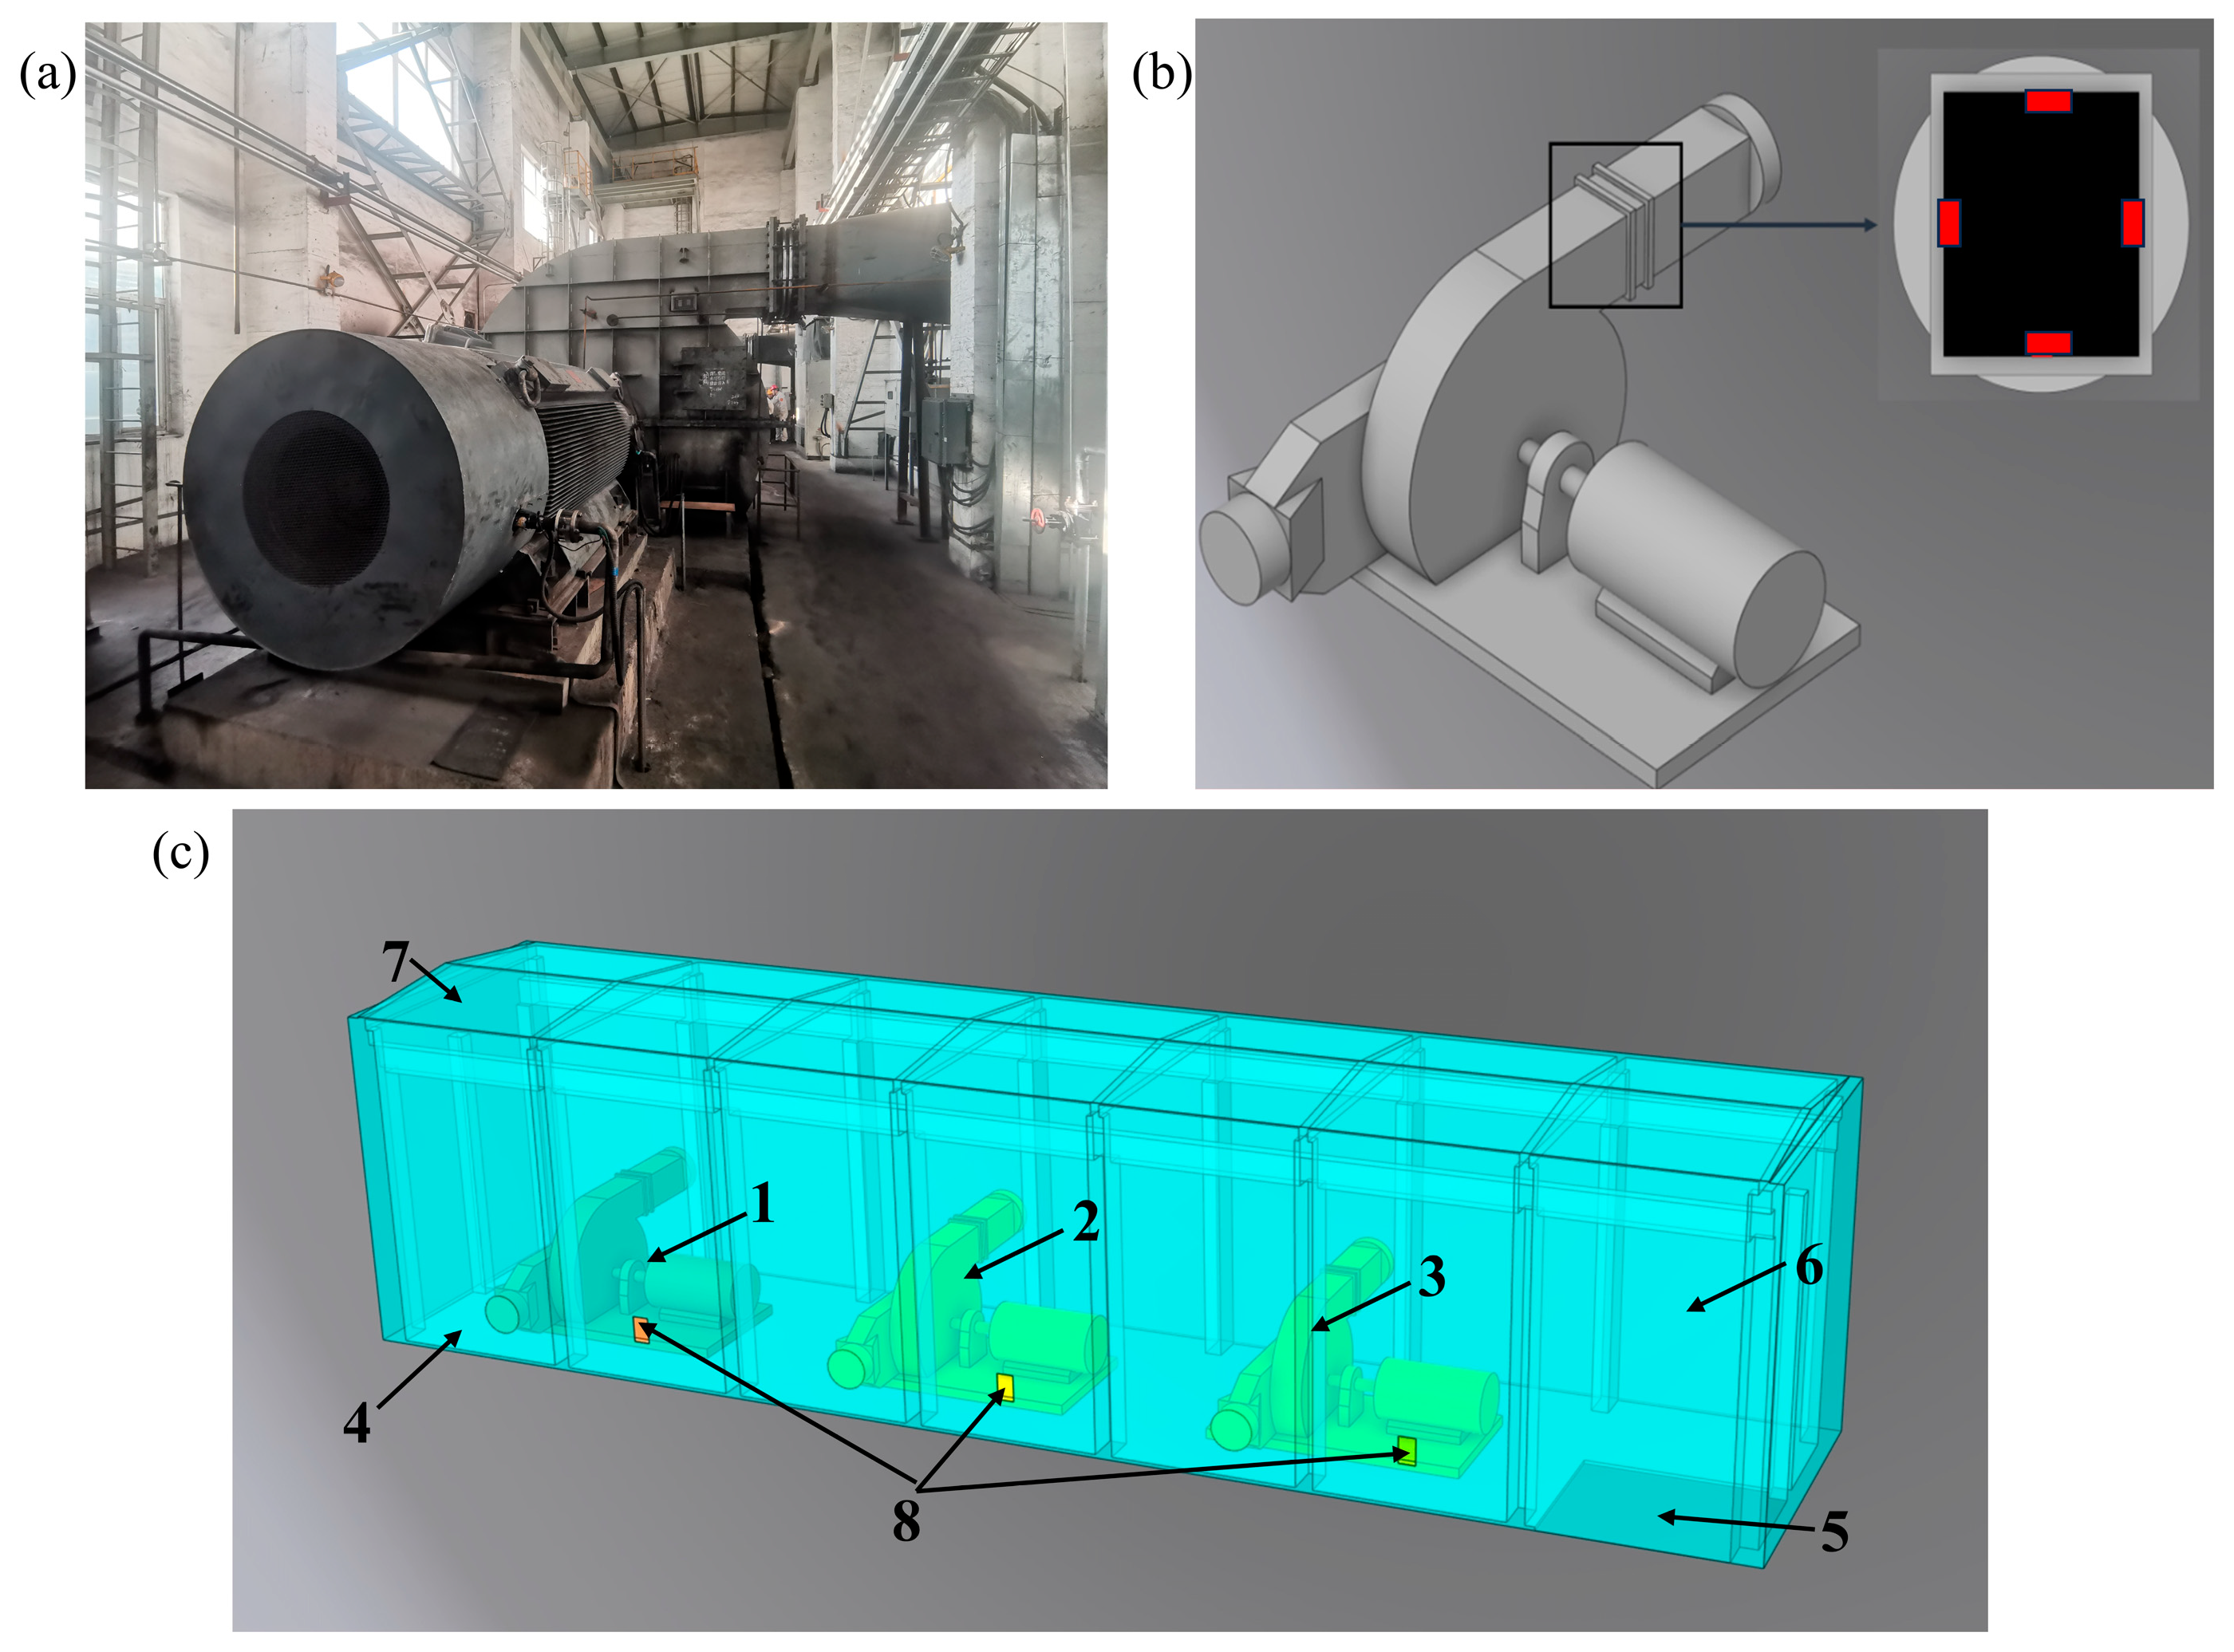
Based on the actual building structure in a certain steel enterprise (shown in Figure 2a), a physical model of the converter fan room was constructed by the SpaceClaim 2022 R1 software, with the dimensions of 42 m (length) × 9 m (width) × 10 m (height). Each window has a size of 2.0 m (width) × 1.5 m (height). The bottom edge of the windows is 3.0 m above the ground. The gas outlet is located on the ground at the southeast corner of the converter fan room, with 6 m (length) × 4.5 m (width). According to the on-site investigation, the fan outlet pipe connection, prone to gas leakage, can be set as a leakage hole, as shown in Figure 2b.
Figure 2.
(a) Indoor picture of the converter fan room. (b) Direction of the leakage hole on the pipeline. (c) Geometric model: (1) fan#1, (2) fan#2, (3) fan#3, (4) ground, (5) air outlet, (6) wall, (7) roof, and (8) window.
To calculate the diffusion of converter gas in the room, the established room and converter fan were simplified, and the ventilation mode was not considered. The fluid computational domain and the constructed model are shown in Figure 2c. The converter gas was directly discharged into the room space through the leakage hole, with a diameter of 4 mm. Owing to CO as the main component of converter gas, it was used as the observation indicator in this study due to its extremely great danger.
2.2. Grid Independence Testing
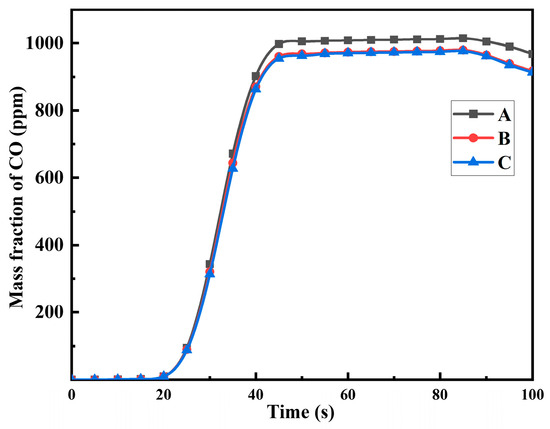
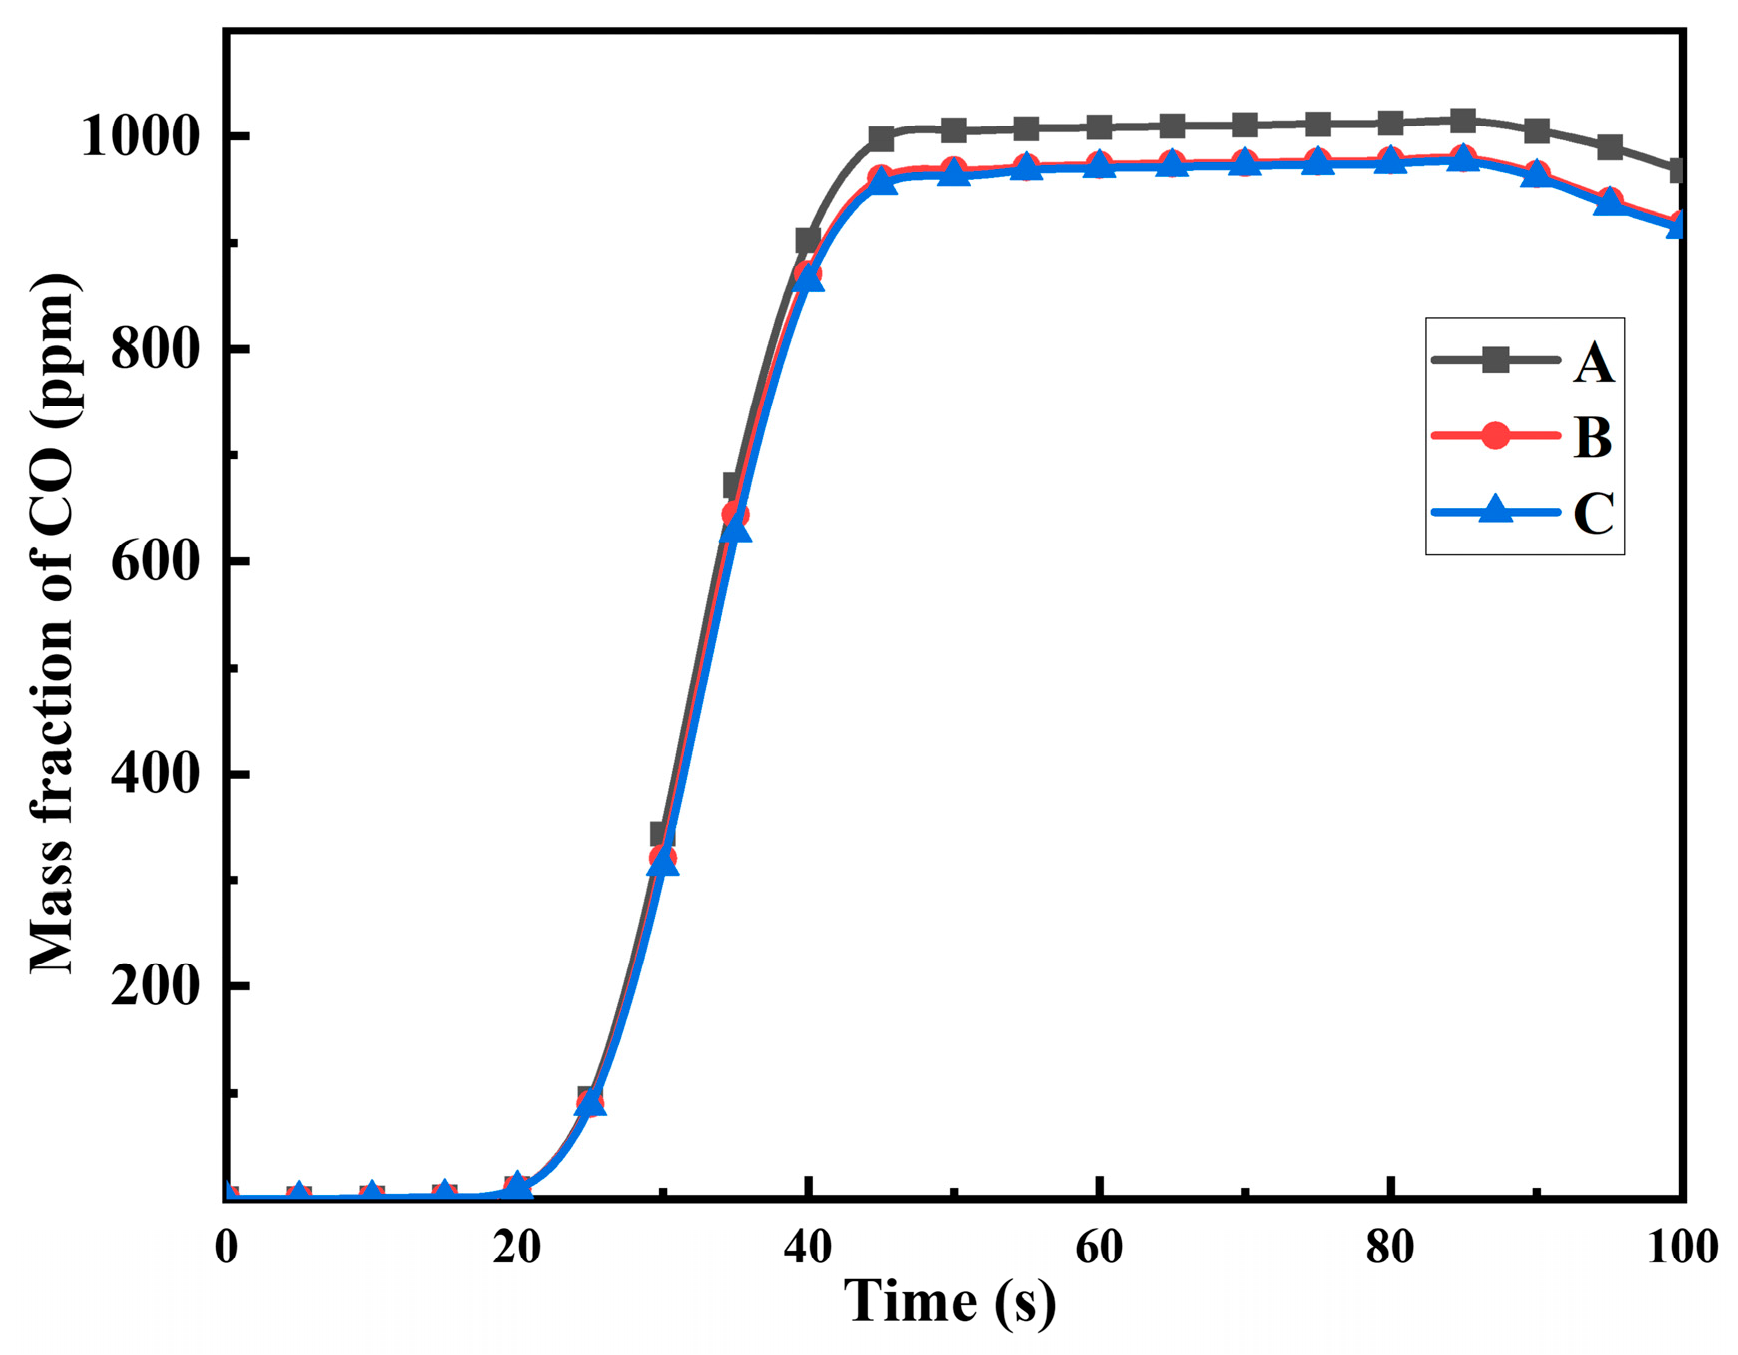
The quality of the mesh affects the accuracy of the calculation results to a certain extent. To save computing resources and ensure the accuracy of simulation results, it is necessary to divide the appropriate grid and quality. After constructing the geometry, hexahedral meshes were generated using ANSYS 2022 R1. Simulations of Fan#2’s upward leakage were performed using computational grids with different cell numbers, including 892,245, 1,042,415, and 1,155,245 (named A, B, and C, respectively). The skewness of the grids was 0.5, and the orthogonal quality was 0.25. The mass fraction of CO at 5 m above the leakage hole within 100 s is shown in Figure 3.
Figure 3.
The simulated results of CO mass fractions obtained by different mesh sizes.
The comparison of the results of the three grid numbers showed that the results of grid A were significantly different from those of grid B and grid C. The maximum relative errors for grids B and C were less than 2%. It showed that the final result of the calculation tended to be stable and was not affected by the increase in the number of cells. Thus, the total number of computational cells can be set as 1,042,415.
2.3. Boundary Conditions
After importing the physics model, the boundary conditions and physical parameters were set based on the field conditions. Because the outlet pipe pressure of the converter fan was 8 kPa, the leaking coal gas performed subsonic. Consequently, the mass flow rate could be obtained according to Equation (3). The main parameter settings are shown in Table 1.
Table 1.
Related parameter settings in the numerical model.
In general, the maximum time from the leakage of converter coal gas to the CO detector is 60 s, and the detector response, staff consideration, and staff action require additional time. Therefore, the simulation time in this study was set as 300 s [39]. The transient solver and the species transport model were selected to solve the process of gas diffusion.
2.4. Verification of Simulation Results
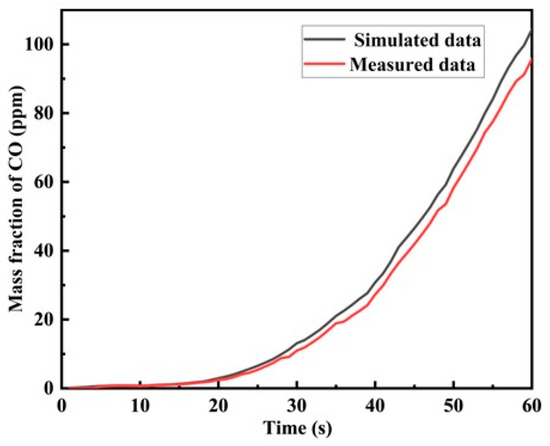
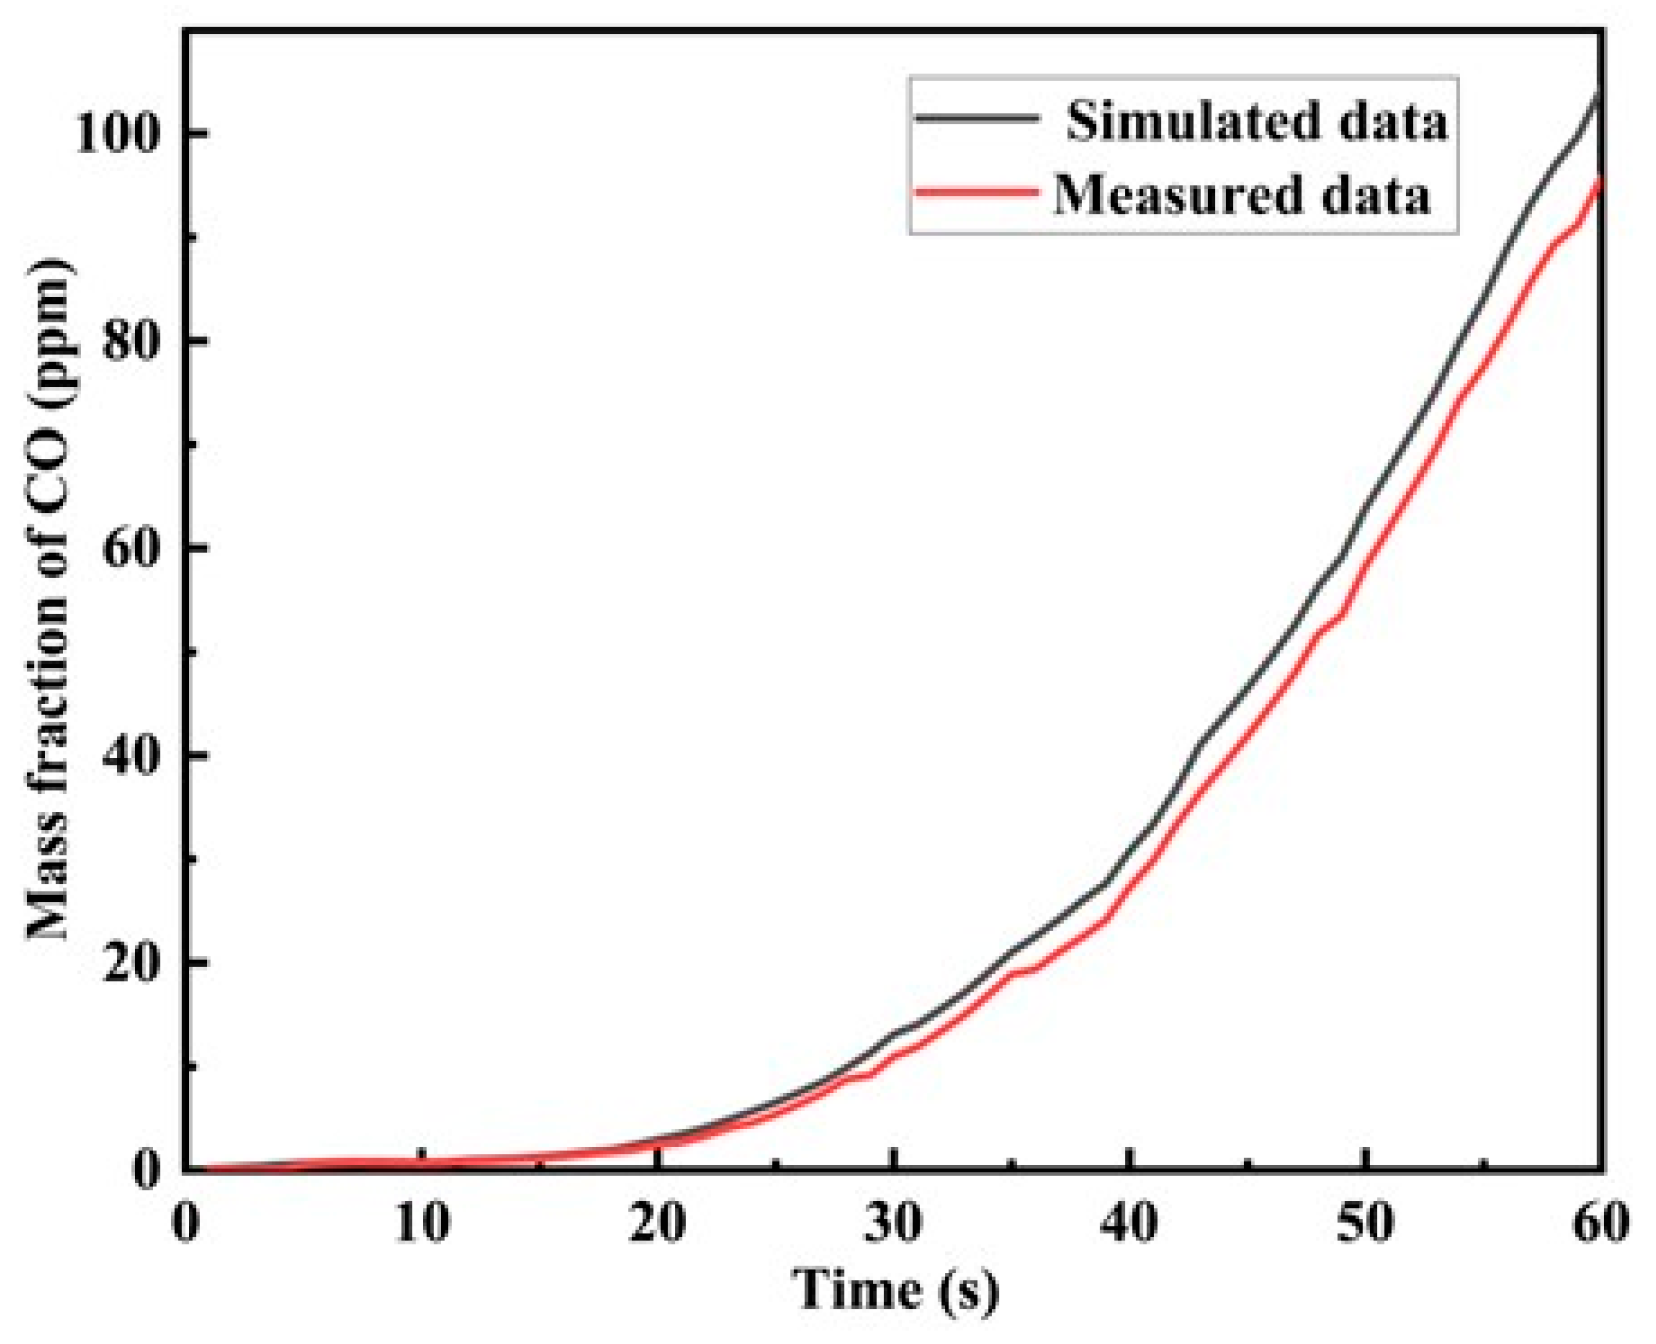
To ensure the reliability of the numerical model, a model accuracy check is required. Six monitoring points were deployed on the horizontal plane at a height of 1.8 m in the converter fan room, with the points symmetrically arranged along the long side walls on both sides of the converter fan. Fixed carbon monoxide (CO) detectors were adopted for concentration measurements, featuring a measurement resolution of 1 ppm. The actual measured data of CO mass fraction were compared with the numerical simulation results, as shown in Figure 4. Obviously, the numerical data at monitoring points is higher than the measured data on site, which can be explained by the fact that numerical simulation is an ideal gas diffusion environment with less energy consumption. On the whole, the measured and simulated data showed a similar trend, with the average difference less than 15%. The error can be acceptable based on previous studies [40,41], proving that the numerical model was accurate and reliable at predicting coal gas leakage and diffusion.
Figure 4.
Comparison of the measured and simulated CO gas concentrations.
3. Results and Discussion
3.1. Flow-Field Distribution of Gas Leakage
The converter fan room presents an asymmetric layout, with three fans tilted to the left wall, and the gas from Fan#1 near the left wall may be physically constrained. Therefore, the leftward and upward gas leakages of Fan#1 and Fan#2 were mainly analyzed to study the influence of the wall on gas flow field distribution.
3.1.1. Pressure and Velocity Flow Directions
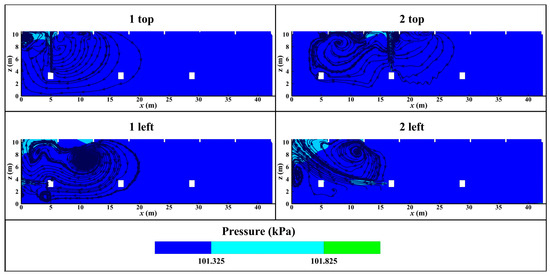
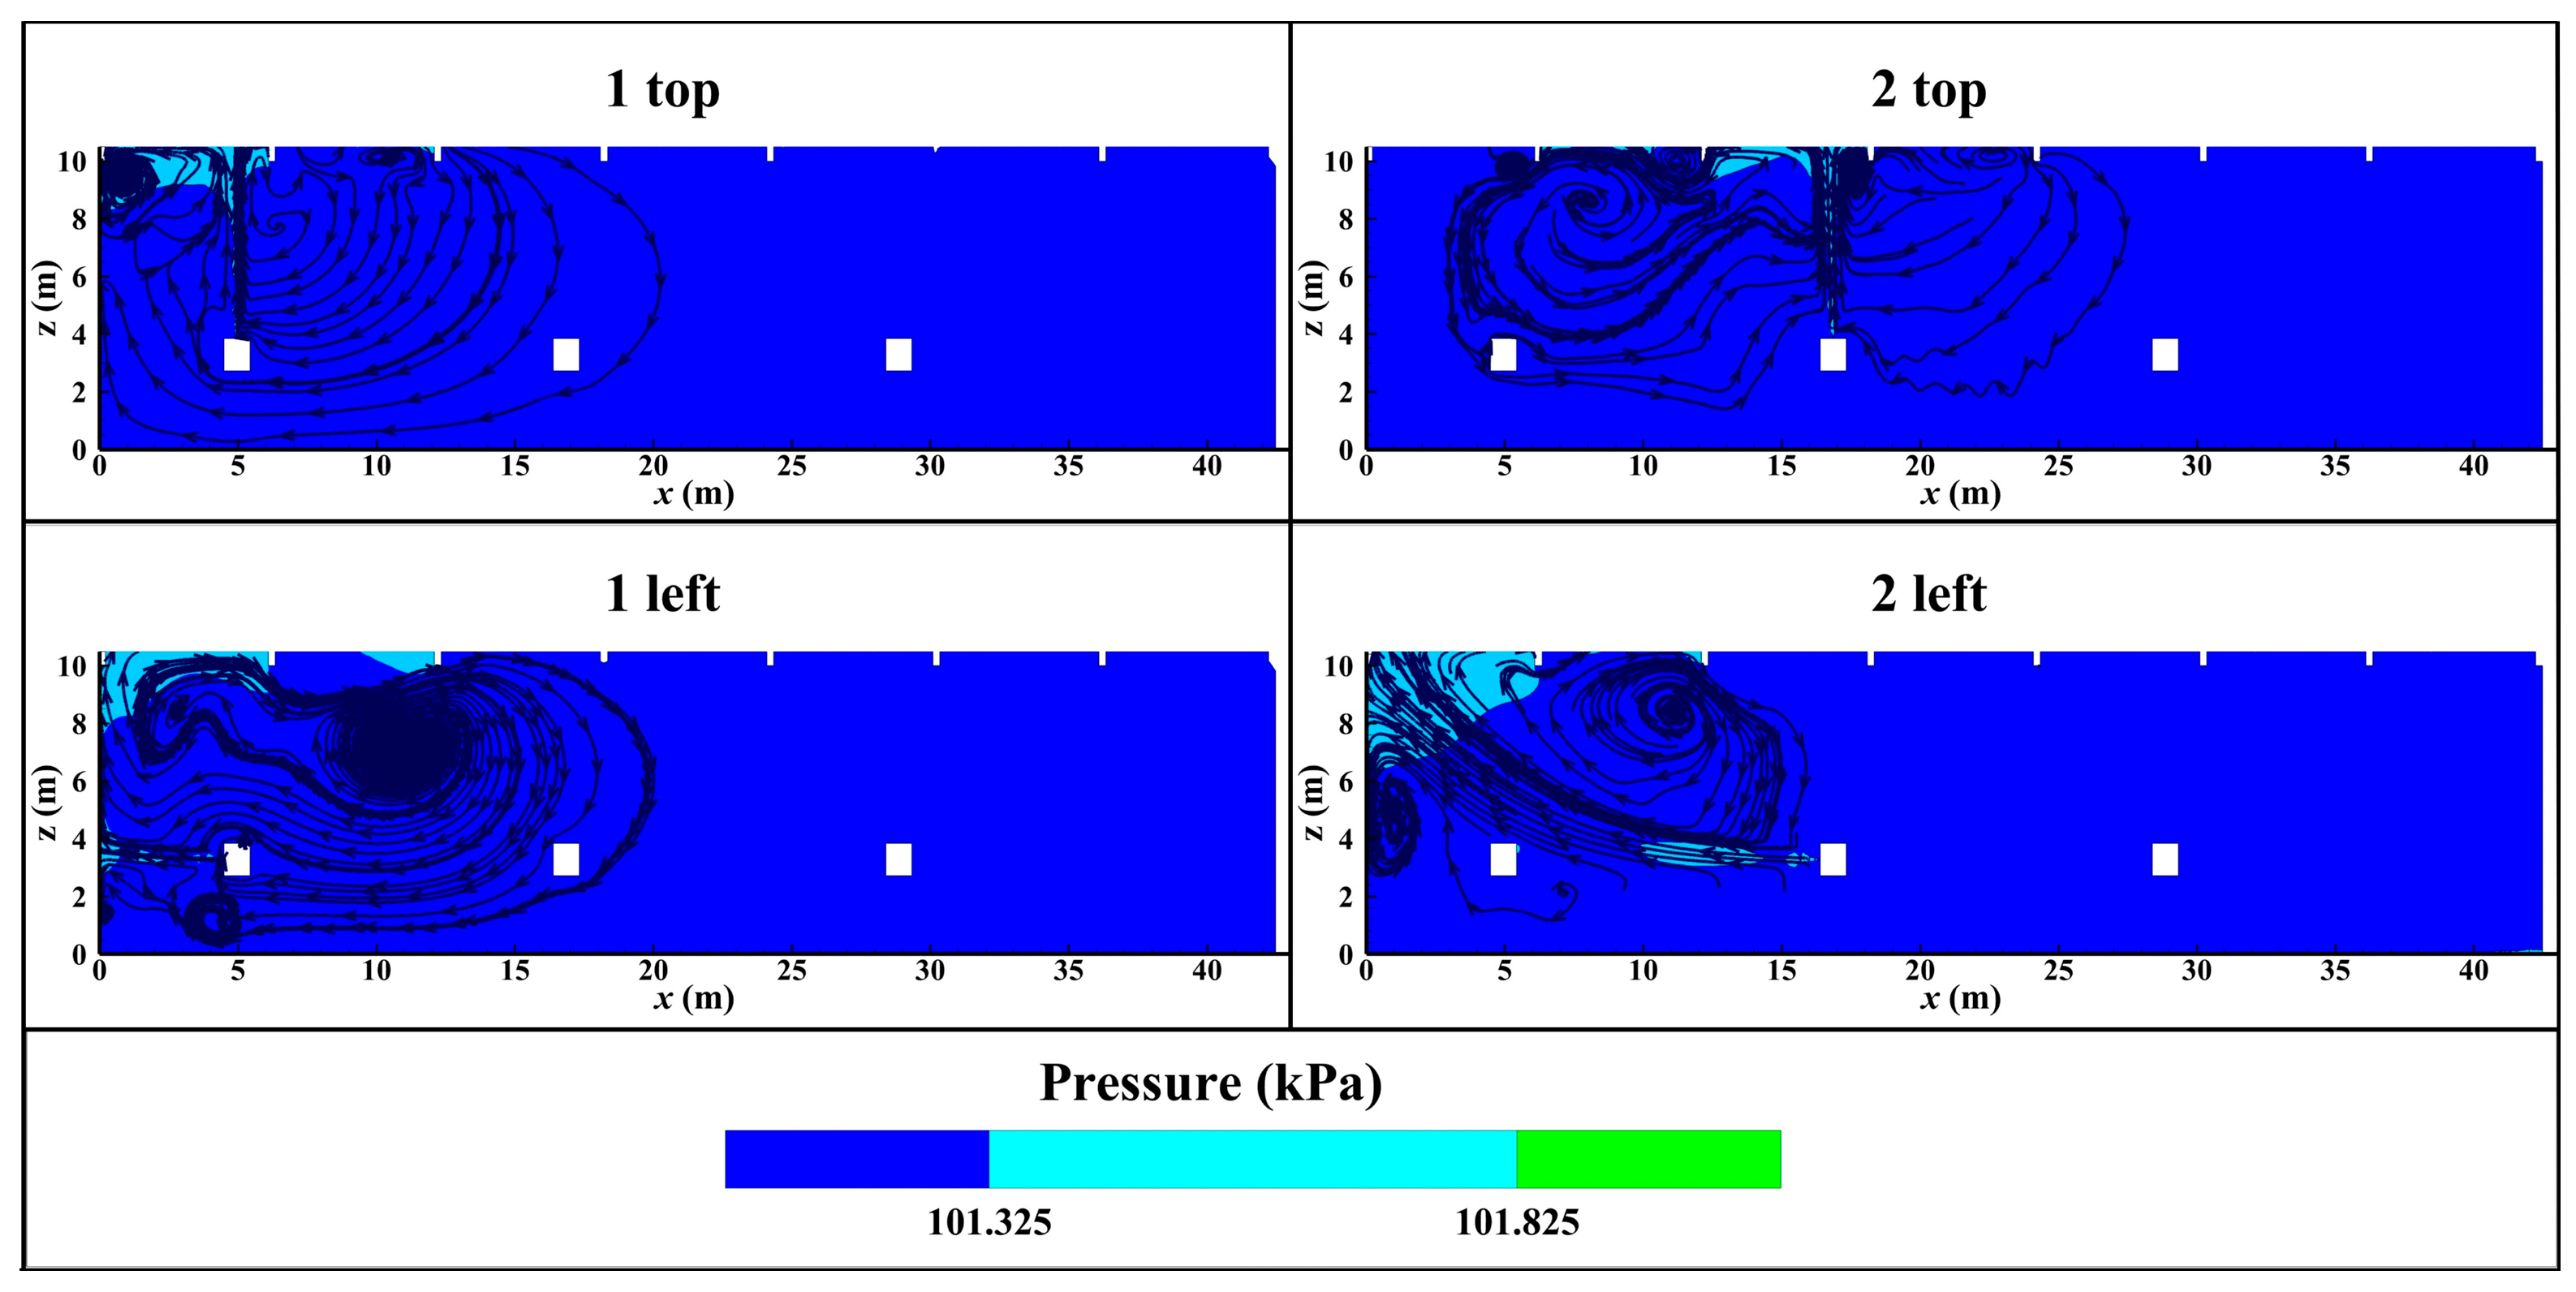
Figure 5 illustrates the pressure distribution for the leftward and upward leakage of Fan#1 and Fan#2. The position where the pressure changes significantly was where the leaking gas diffuses to the ceiling. The pressure change range was less than 500 Pa, which had less impact on the boundary of the plant structure. The velocity streamline distribution of leaking coal gas for the four cases at 300 s was also depicted in Figure 5. Due to the jet entrainment effect, the edge part of the leaked CO flowed back to the leak hole and formed eddy currents in the leakage direction of the pipeline. The coal gas formed a high concentration and stable complete jet field main body area, and gathered near the leak hole. This was most evident in the case of the upward leakage of Fan#1 and Fan#2. During the diffusion process, the flow lines of CO diffusion were disrupted by the structural boundaries of the fan room and the fans, creating vortical motions in the vicinity and resulting in a wider range of CO diffusion. Due to the influence of the left wall, the vortex range formed by the leftward leakage of Fan#1 was larger than that of Fan#2.
Figure 5.
The stream lines and pressure distribution under the leftward and upward leakage of Fan#1 and Fan#2 (t = 300 s).
3.1.2. Centerline Velocity in All Directions
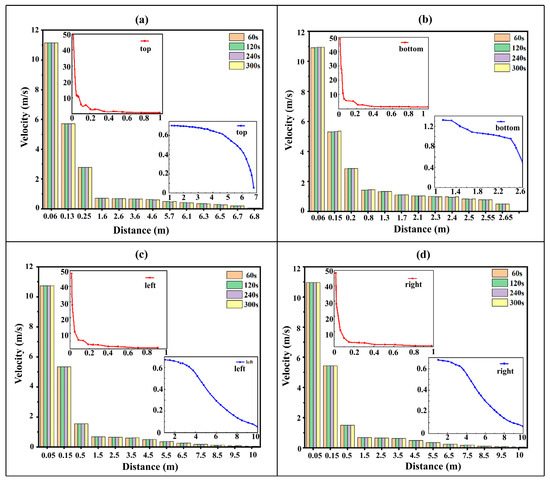
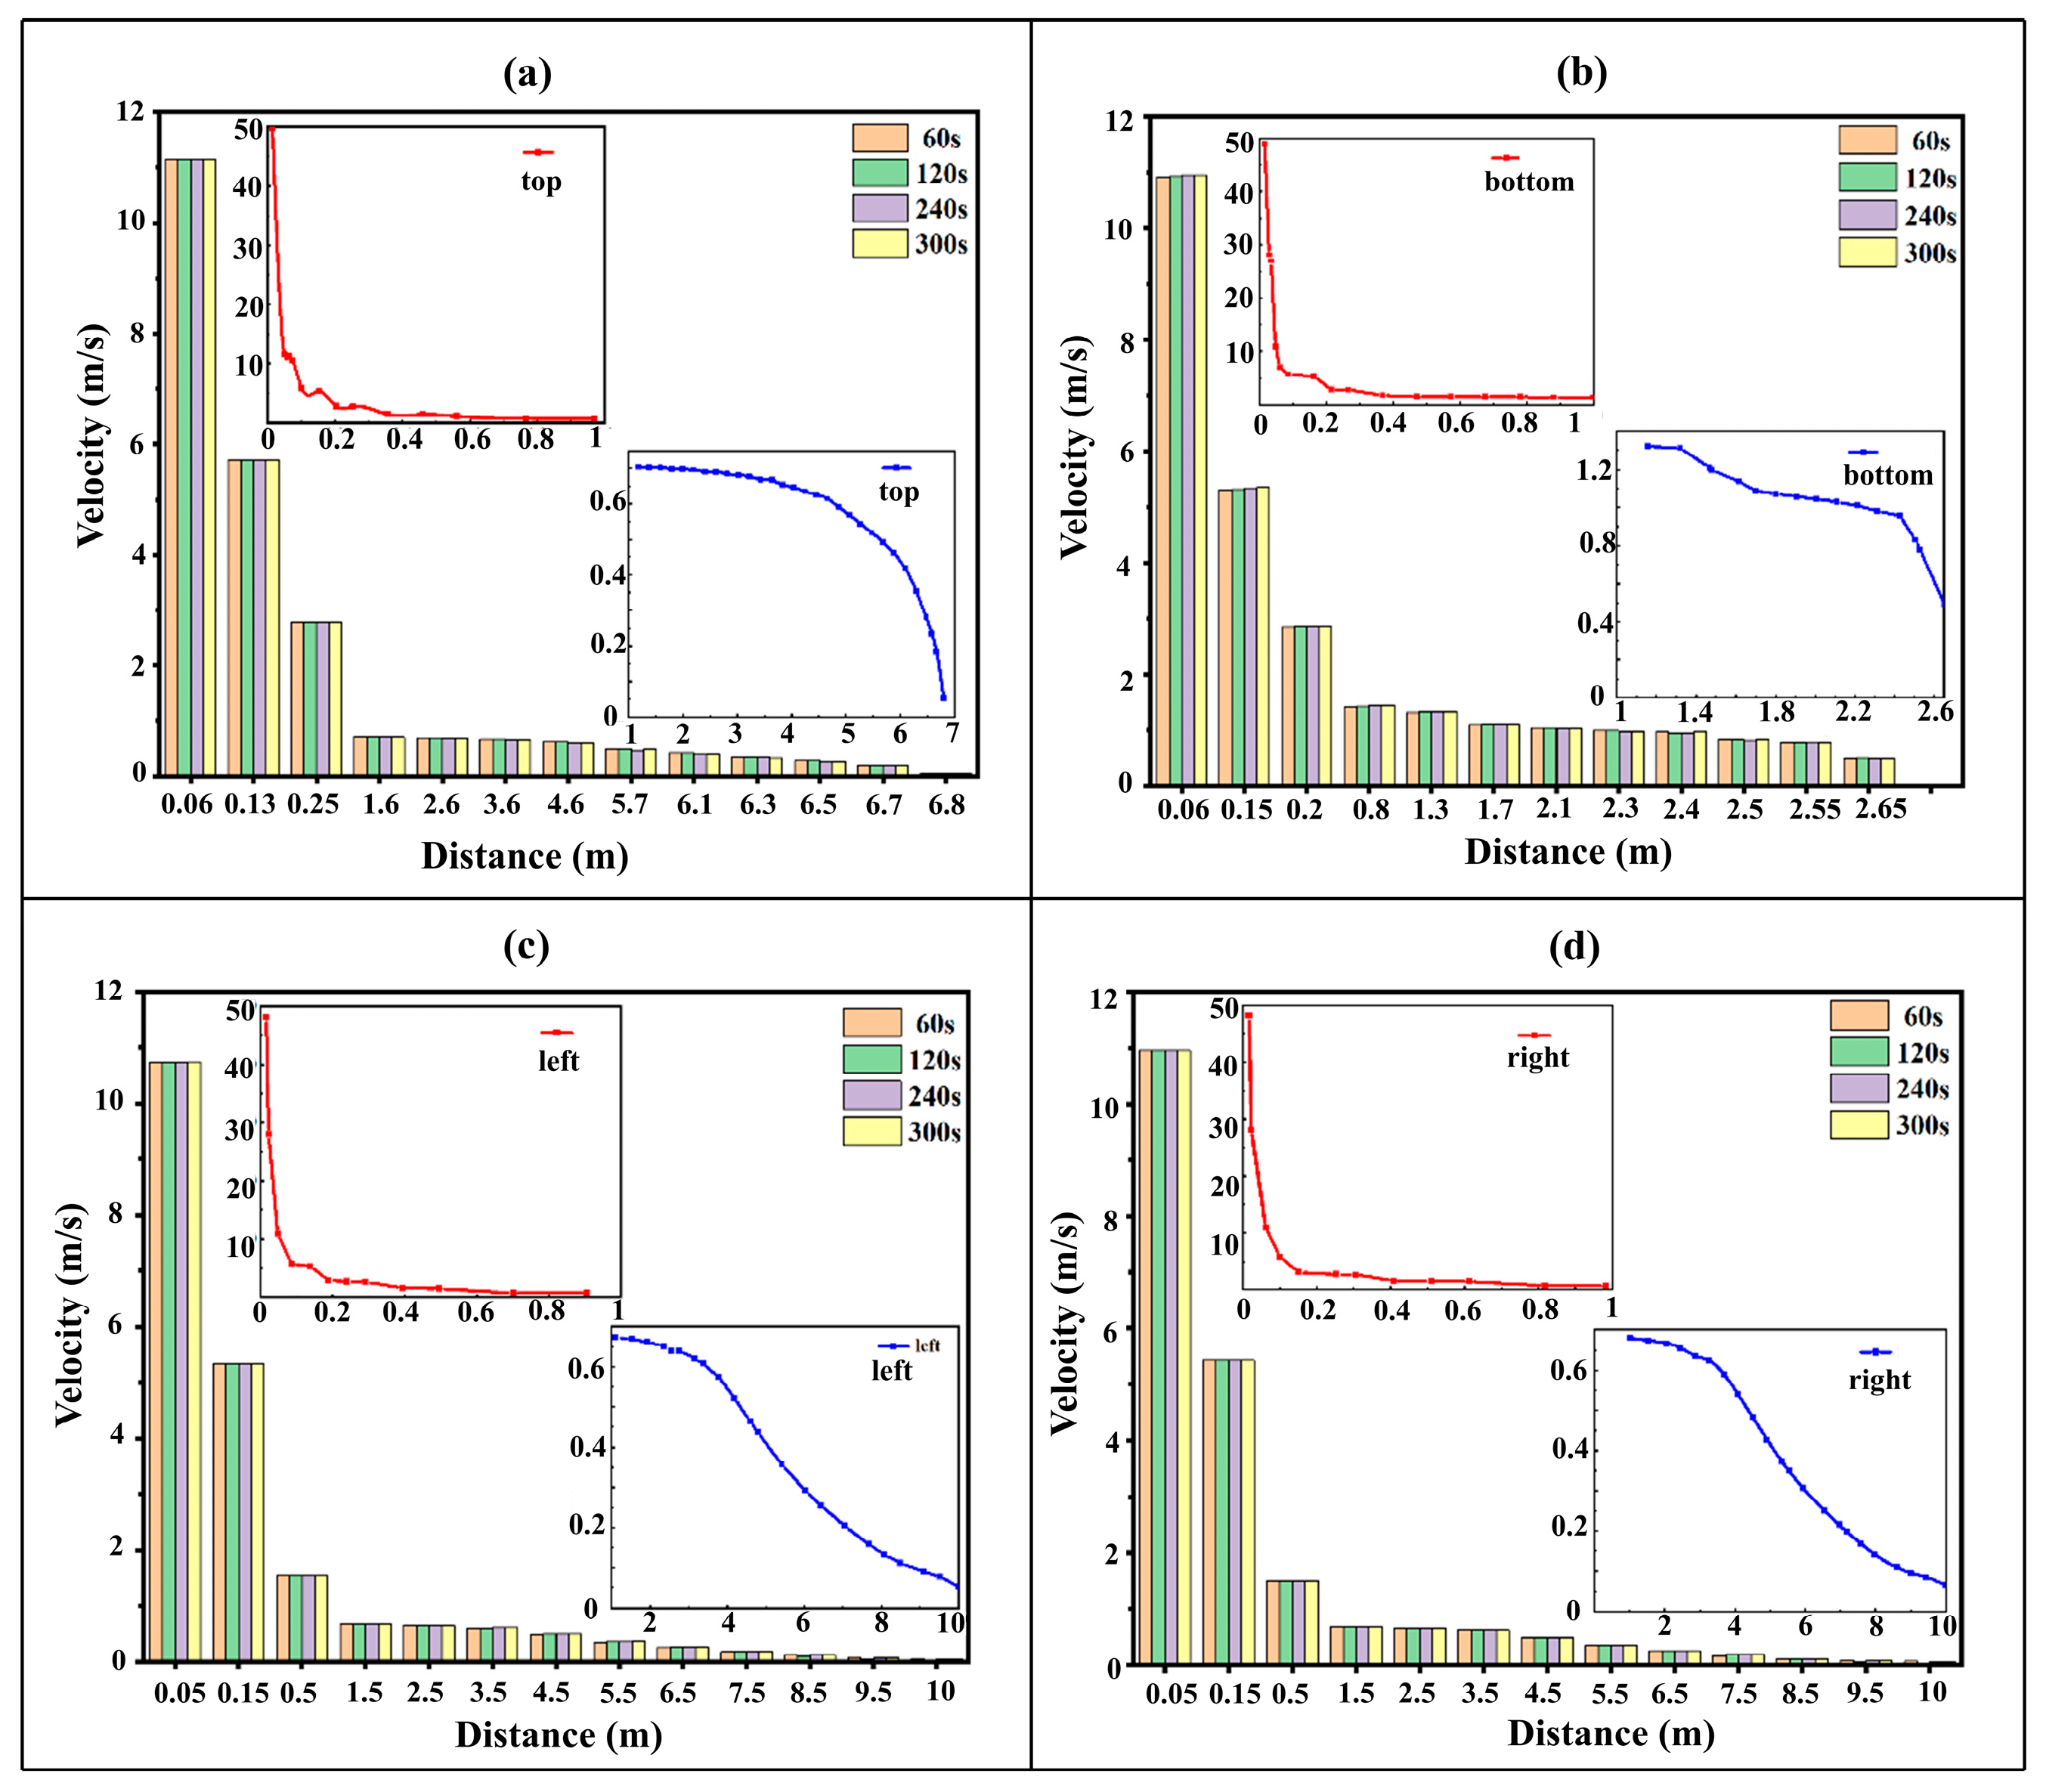
In order to obtain the velocity distribution of gas diffusion at different times, the leakage of Fan#2 less affected by obstacles was selected and analyzed. Figure 6 shows the relationship between the centerline velocity and the distance from the leakage orifice in all four directions of Fan#2. It can be seen that the variation in the centerline velocity with the distance from the leakage hole in different directions shows an initial rapid decrease, followed by a gradual leveling-off trend [42]. The values of the centerline velocity did not increase with the continuation of leakage and remained essentially unchanged after 60 s. Thus, the average of the centerline velocities at these four moments was taken. Considering that the initial distance velocity dropped too fast, the speed–distance line plots within 1 m and from 1 m to the furthest distance were drawn, respectively. The initial velocities were similar in all directions over a range of 1 m, all falling rapidly before the distance of 0.4 m. The results showed that different leakage directions affected the near-field jet velocity due to air resistance, and the velocity change at the structure boundary was mainly due to the different distances of the obstacles, leading to different velocity attenuation.
Figure 6.
Velocity along the centerline for different leakage directions for Fan#2 as a function of distance to the leakage orifice: (a) top; (b) bottom; (c) left; (d) right (t = 60 s, 120 s, 240 s, 300 s).
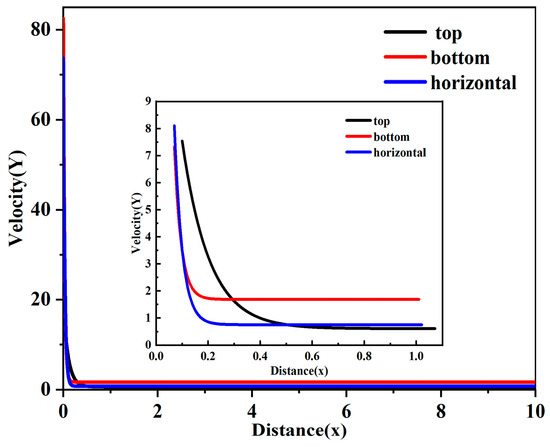
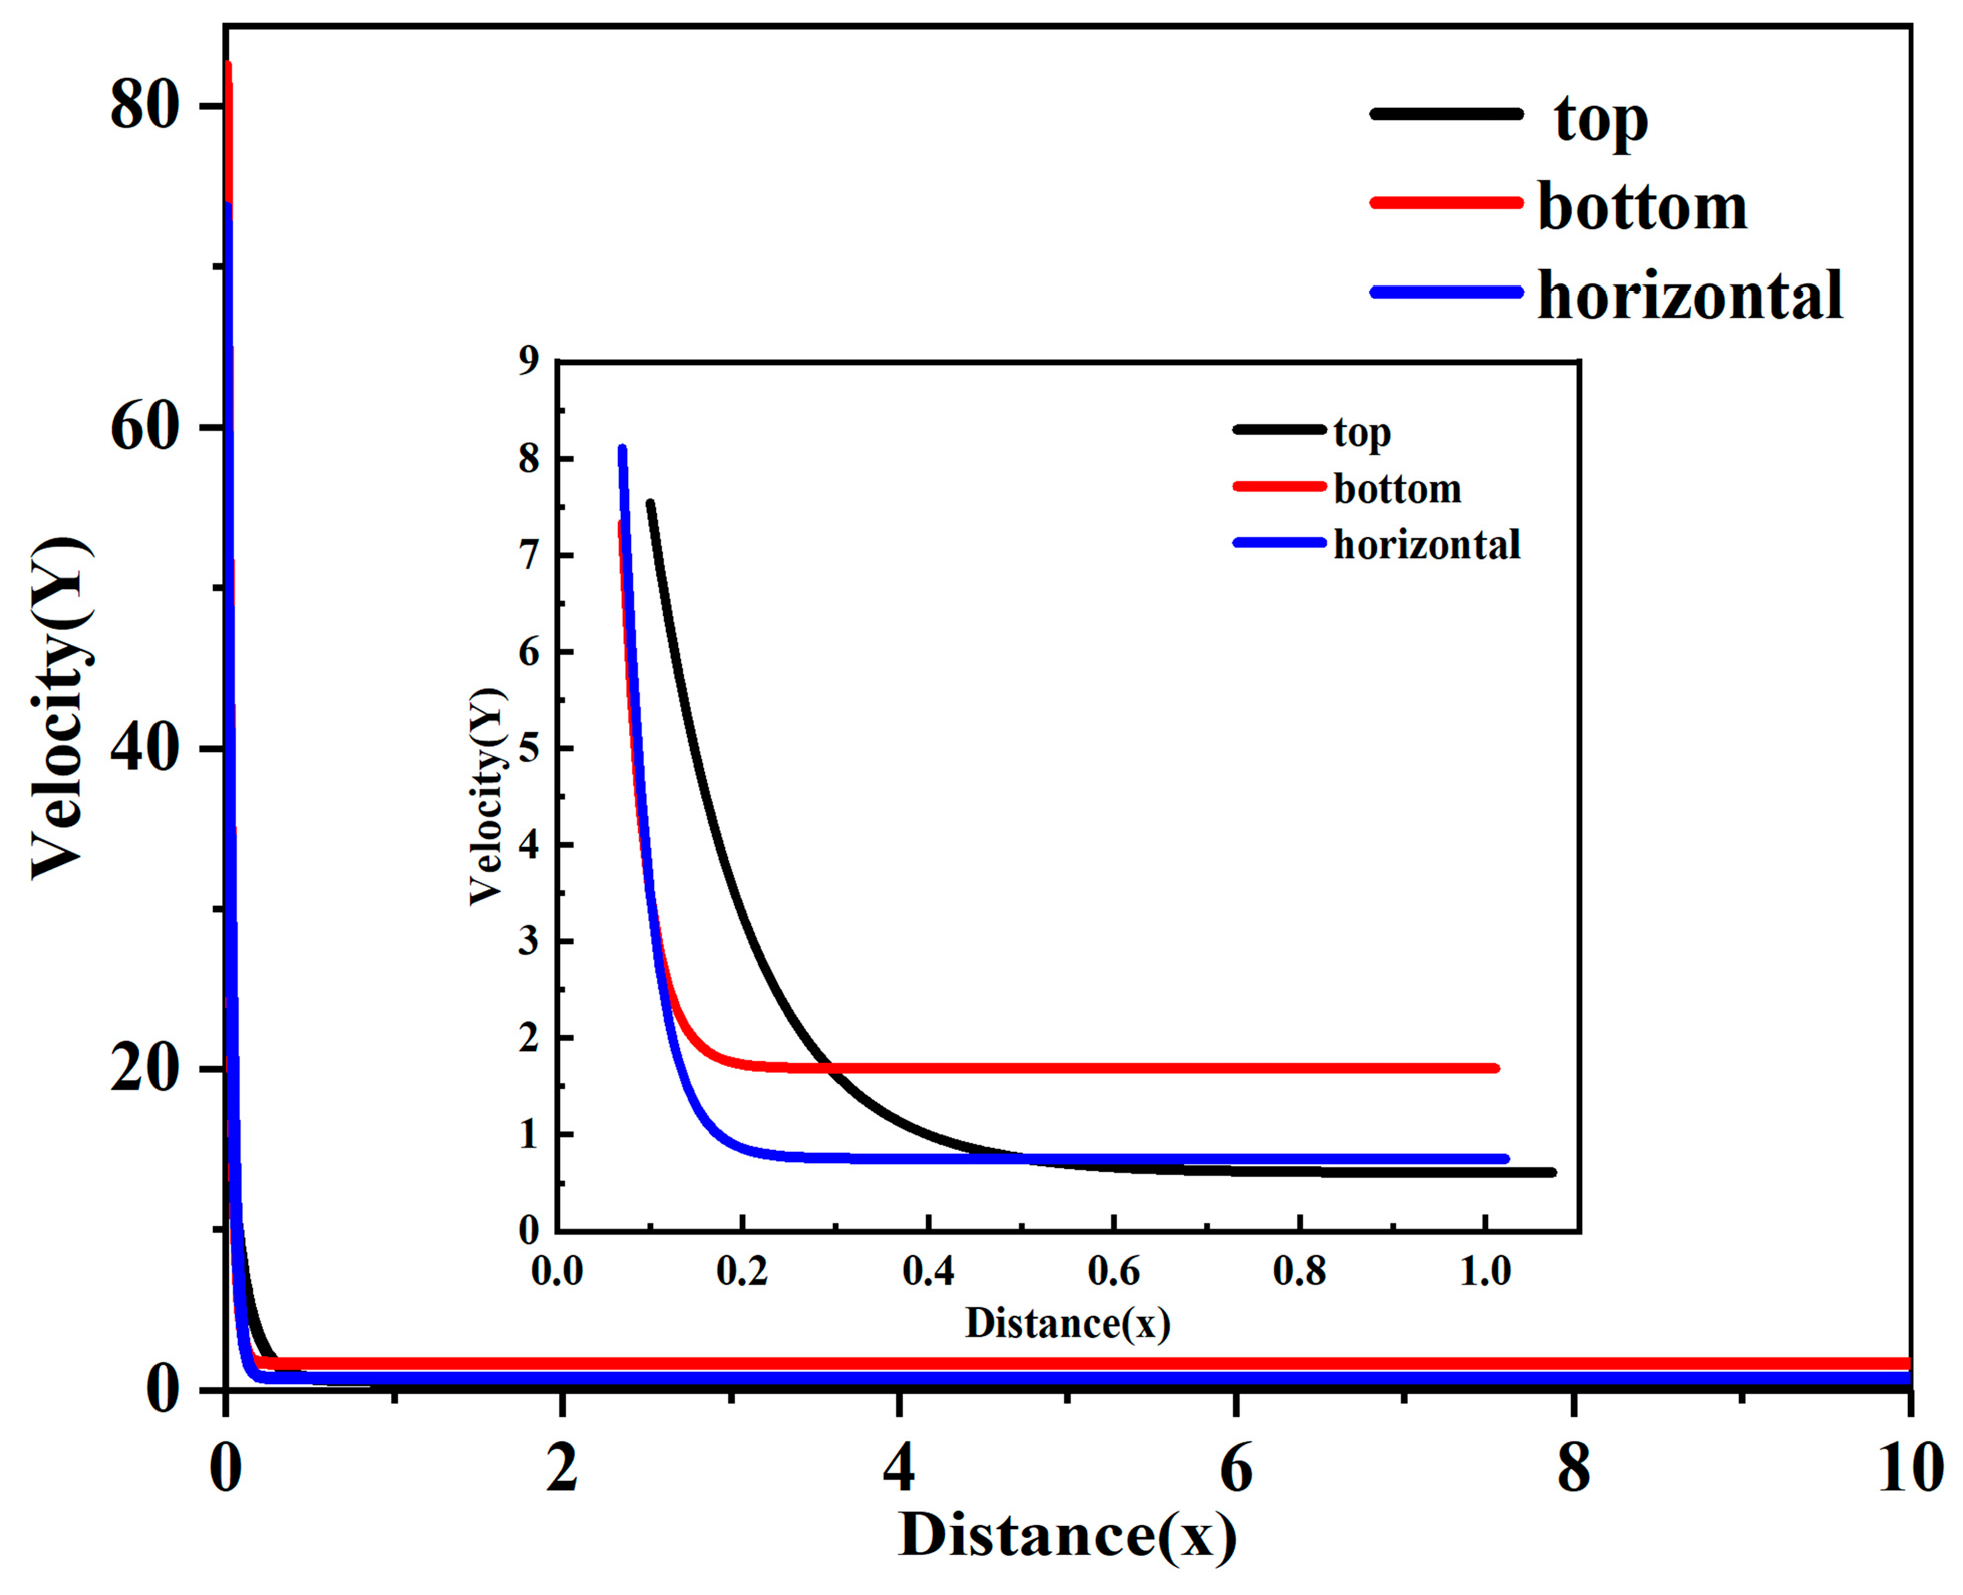
Furthermore, the centerline velocity in each direction and the distance from the leakage orifice were fitted without considering the effect of obstacles, which can predict the average velocity attenuation law in the far field [43]. Obviously, Figure 7 showed that the velocity decay in the centerline of the jet followed a non-linear function, which was consistent with the findings of Li et al. [43]. At 0.1 m < x < 0.2 m, a large velocity decay occurred under the downward gas leakage. As the distance from the leakage source increased, the velocity eventually tended to a constant value, and the final velocity of the leakage downward was the highest. The gas within 0.6 m from the leakage source had a high initial kinetic energy and exchanged energy more quickly due to air resistance, and the leakage direction mainly affected the decay speed and the magnitude of the final velocity.
Figure 7.
The function of the centerline velocity declines with distance.
3.2. Gas Diffusion Path Analysis
3.2.1. CO Diffusion with Time
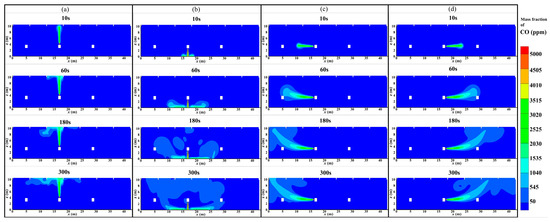
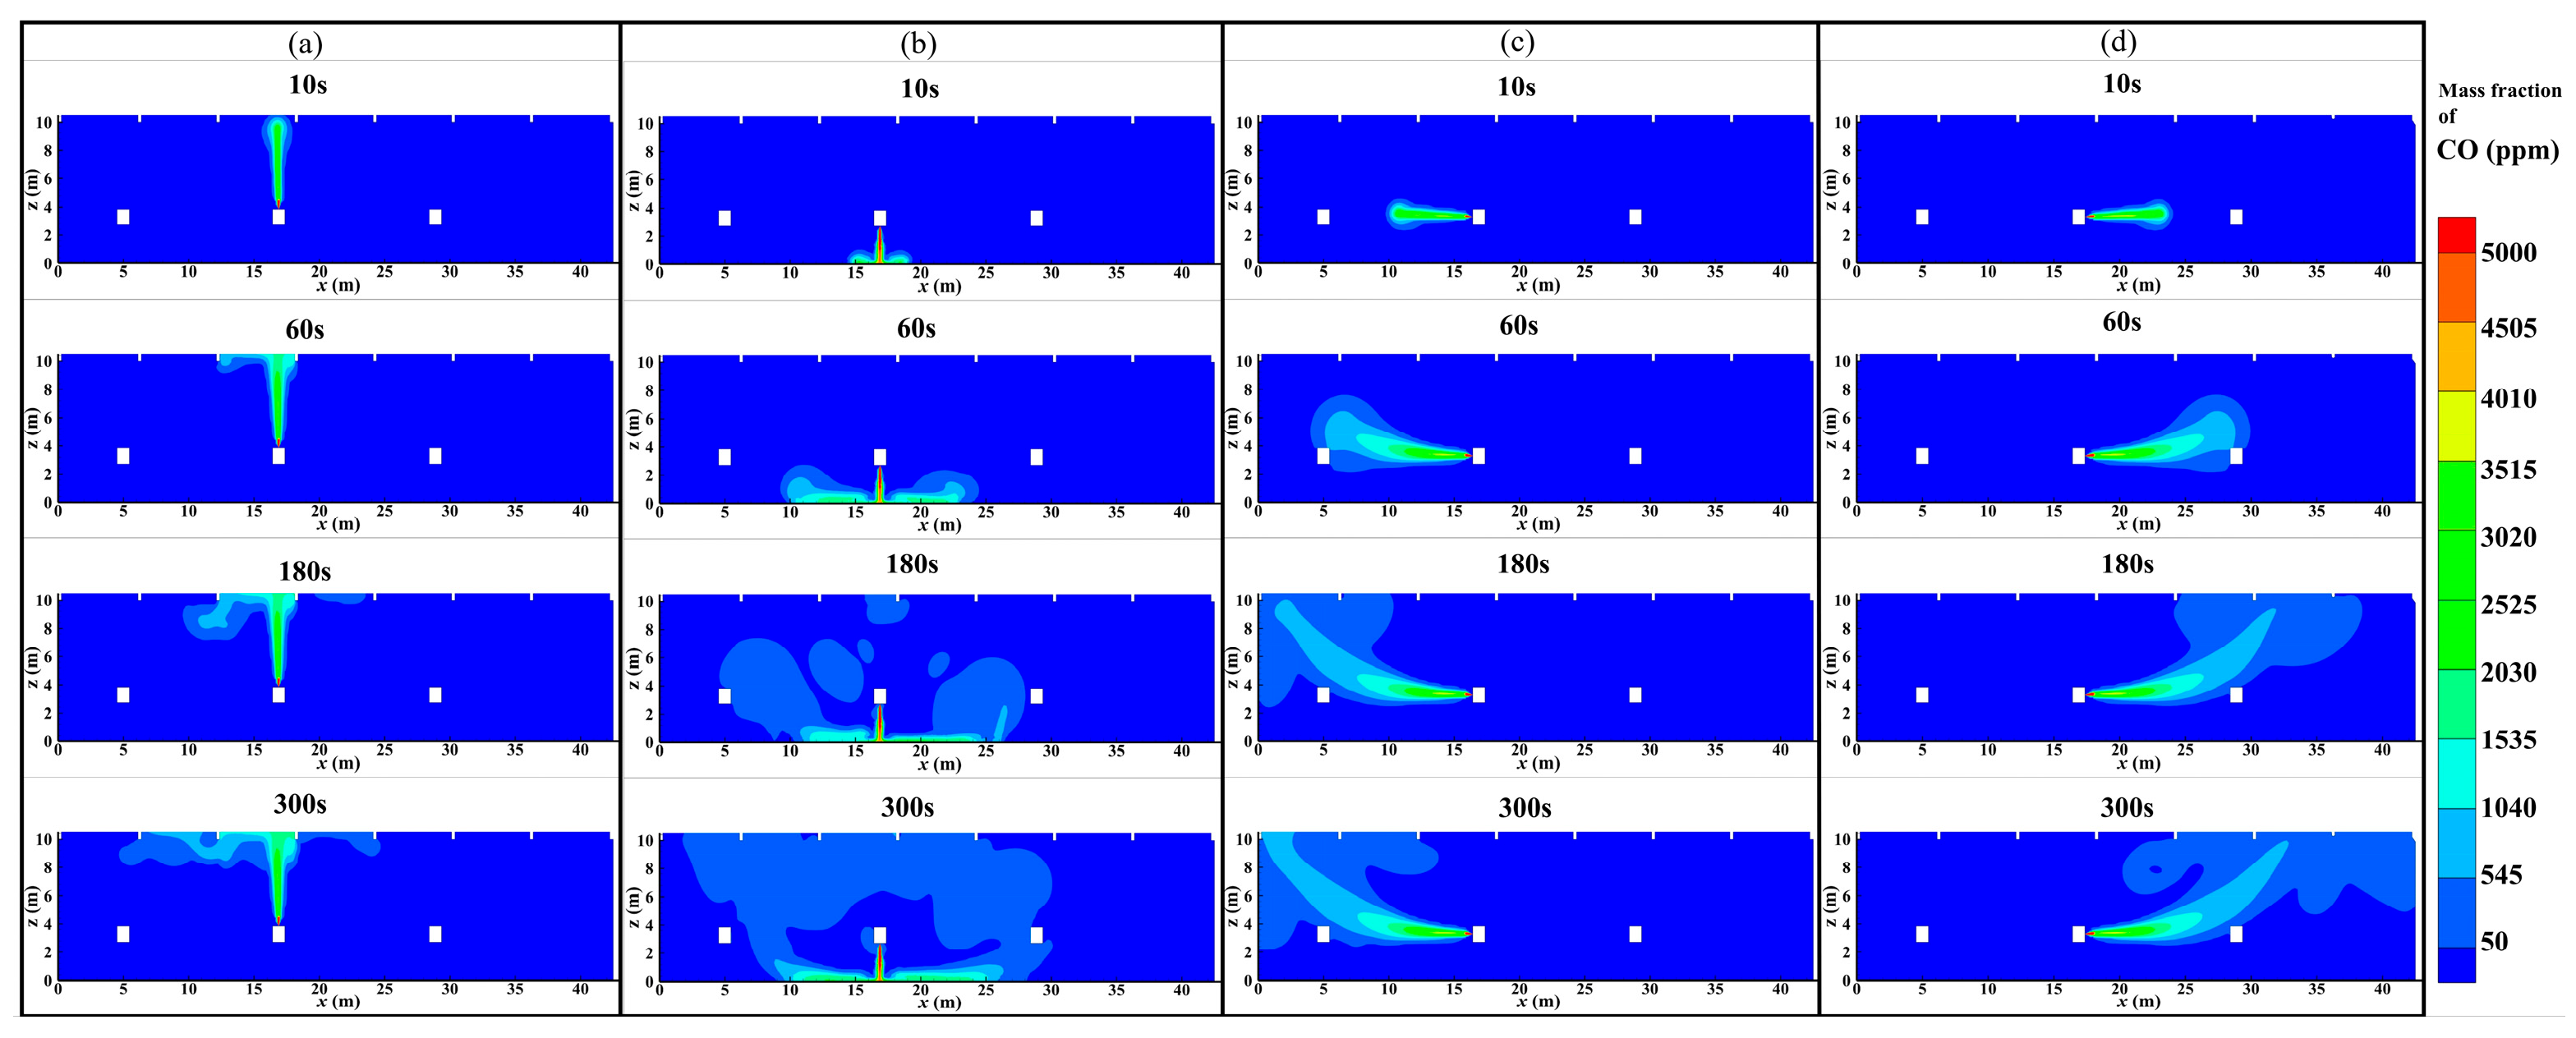
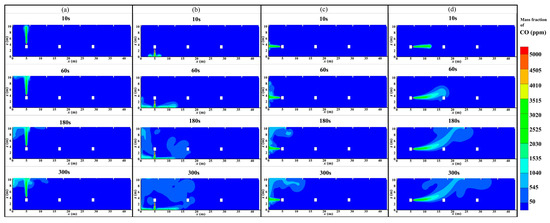
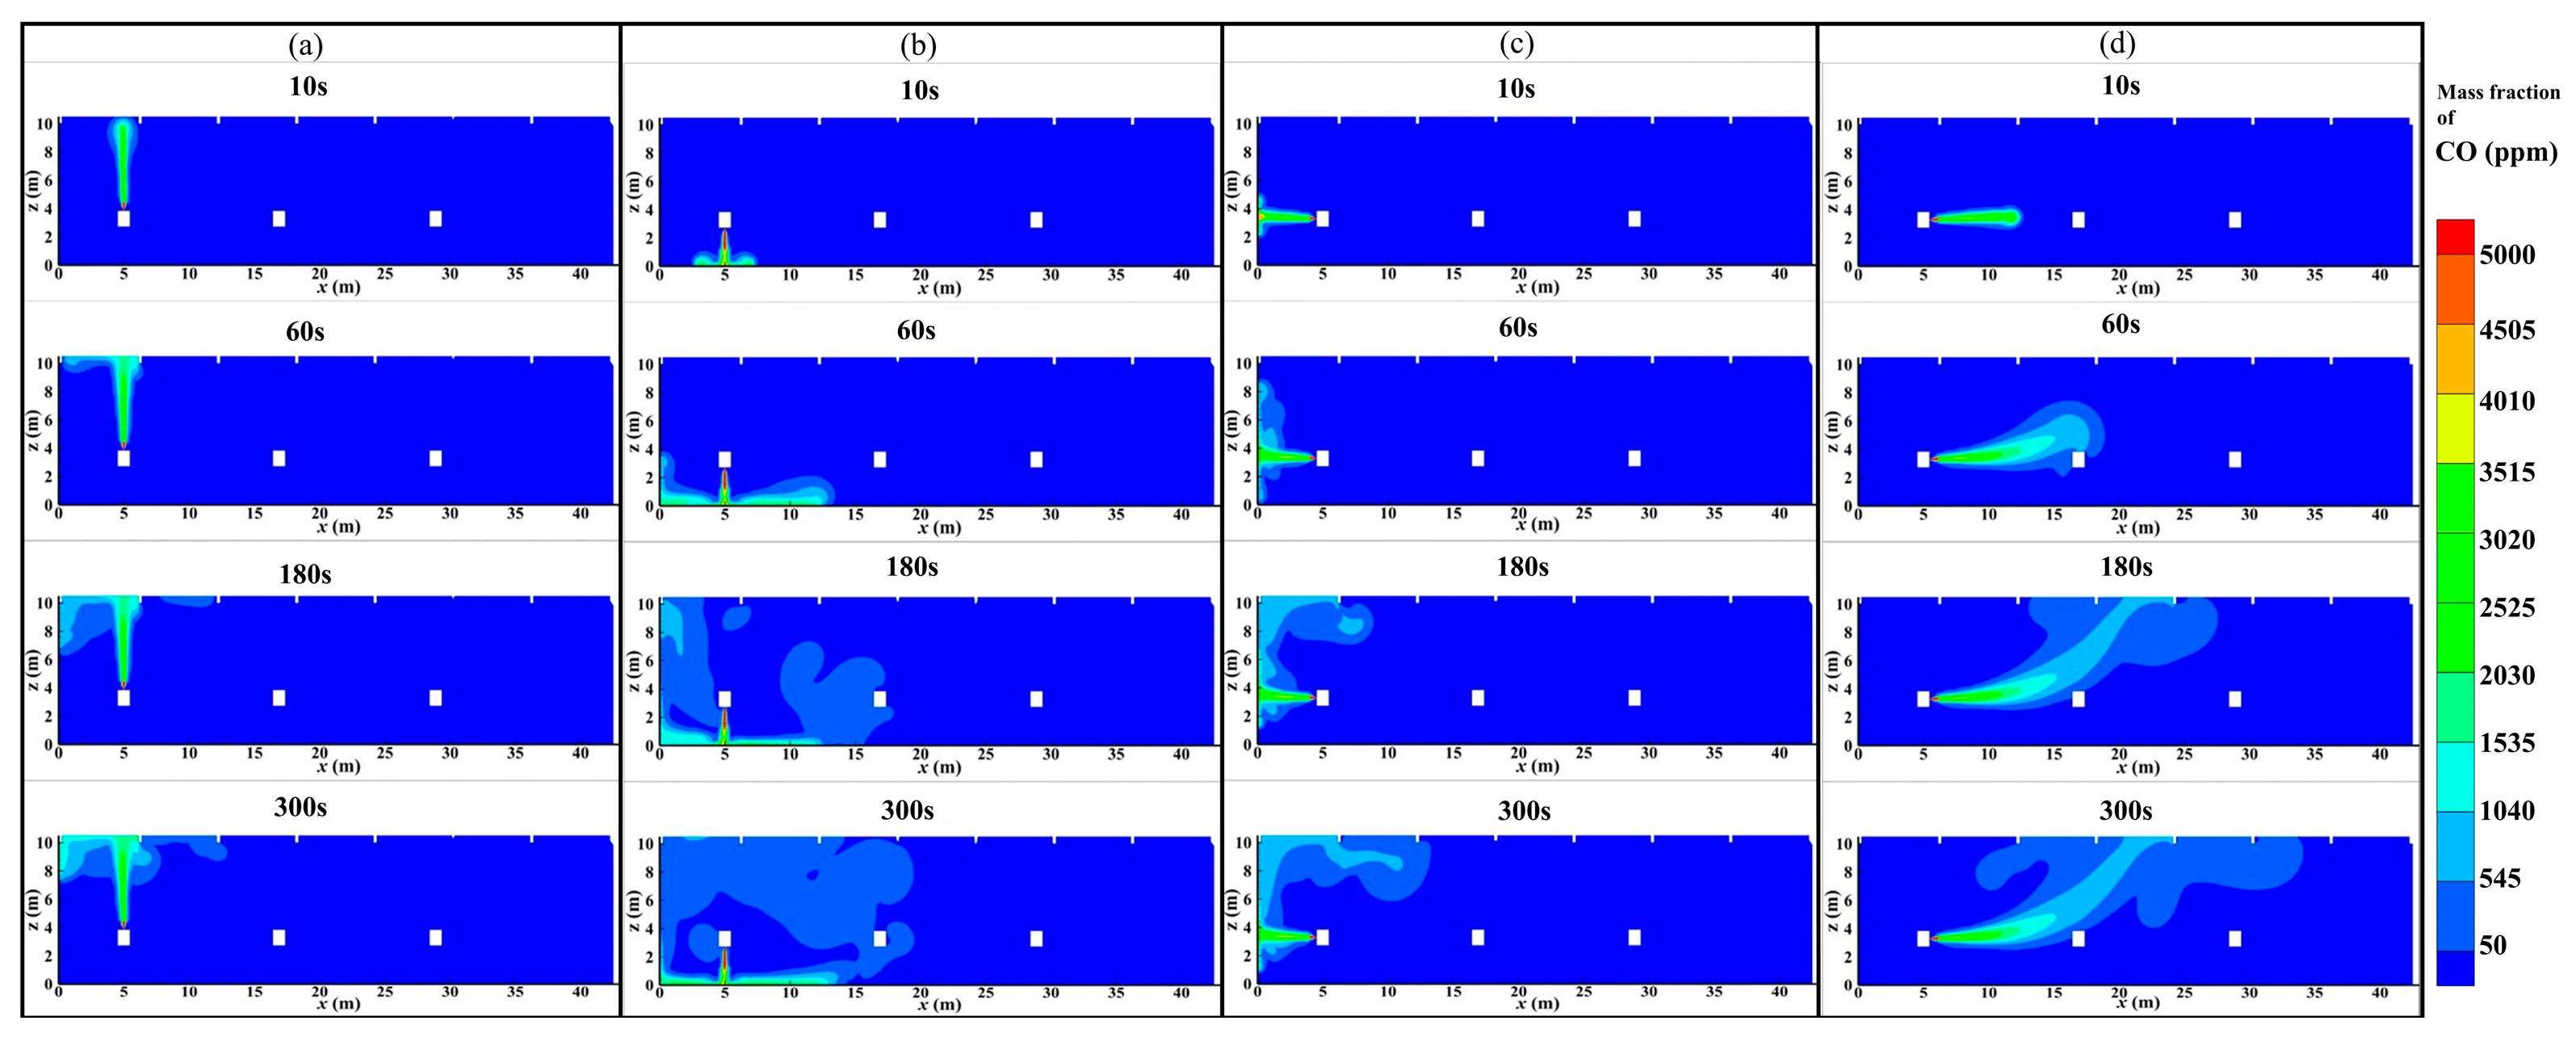
After confirming the flow field near the leakage source, the gas diffusion paths in the typical industrial space should be clarified and visualized, which were shown in Figure 8, Figure 9 and Figure 10. As can be seen in Figure 8, the CO leakage of Fan#2 was in a symmetric jet along the leakage direction at the initial stage (10 s). For the downward leakage (Figure 8b), the CO diffused to the ground and spread around the ground for about 5 m, which can be attributed to the Coanda effect [44,45]. After a short diffusion time (60 s), the horizontal diffusion distance was larger than that under the upward leakage (Figure 8a), owing to the impact on the ground. For the leftward (Figure 8c) and rightward (Figure 8d) gas leakages, the CO distribution was basically symmetrical, and its change law was similar under different stages. At the time of 300 s, the CO diffusion range under four leakage directions had reached the maximum, and the concentration of 50–545 ppm was the widest range.
Figure 8.
CO diffusion path under each leakage direction of Fan#2: (a) upward; (b) downward; (c) leftward; (d) rightward (t = 10 s, 60 s, 180 s, 300 s).
Figure 9.
CO diffusion path under each leakage direction of Fan#1: (a) upward; (b) downward; (c) leftward; (d) rightward (t = 10 s, 60 s, 180 s, 300 s).
Figure 10.
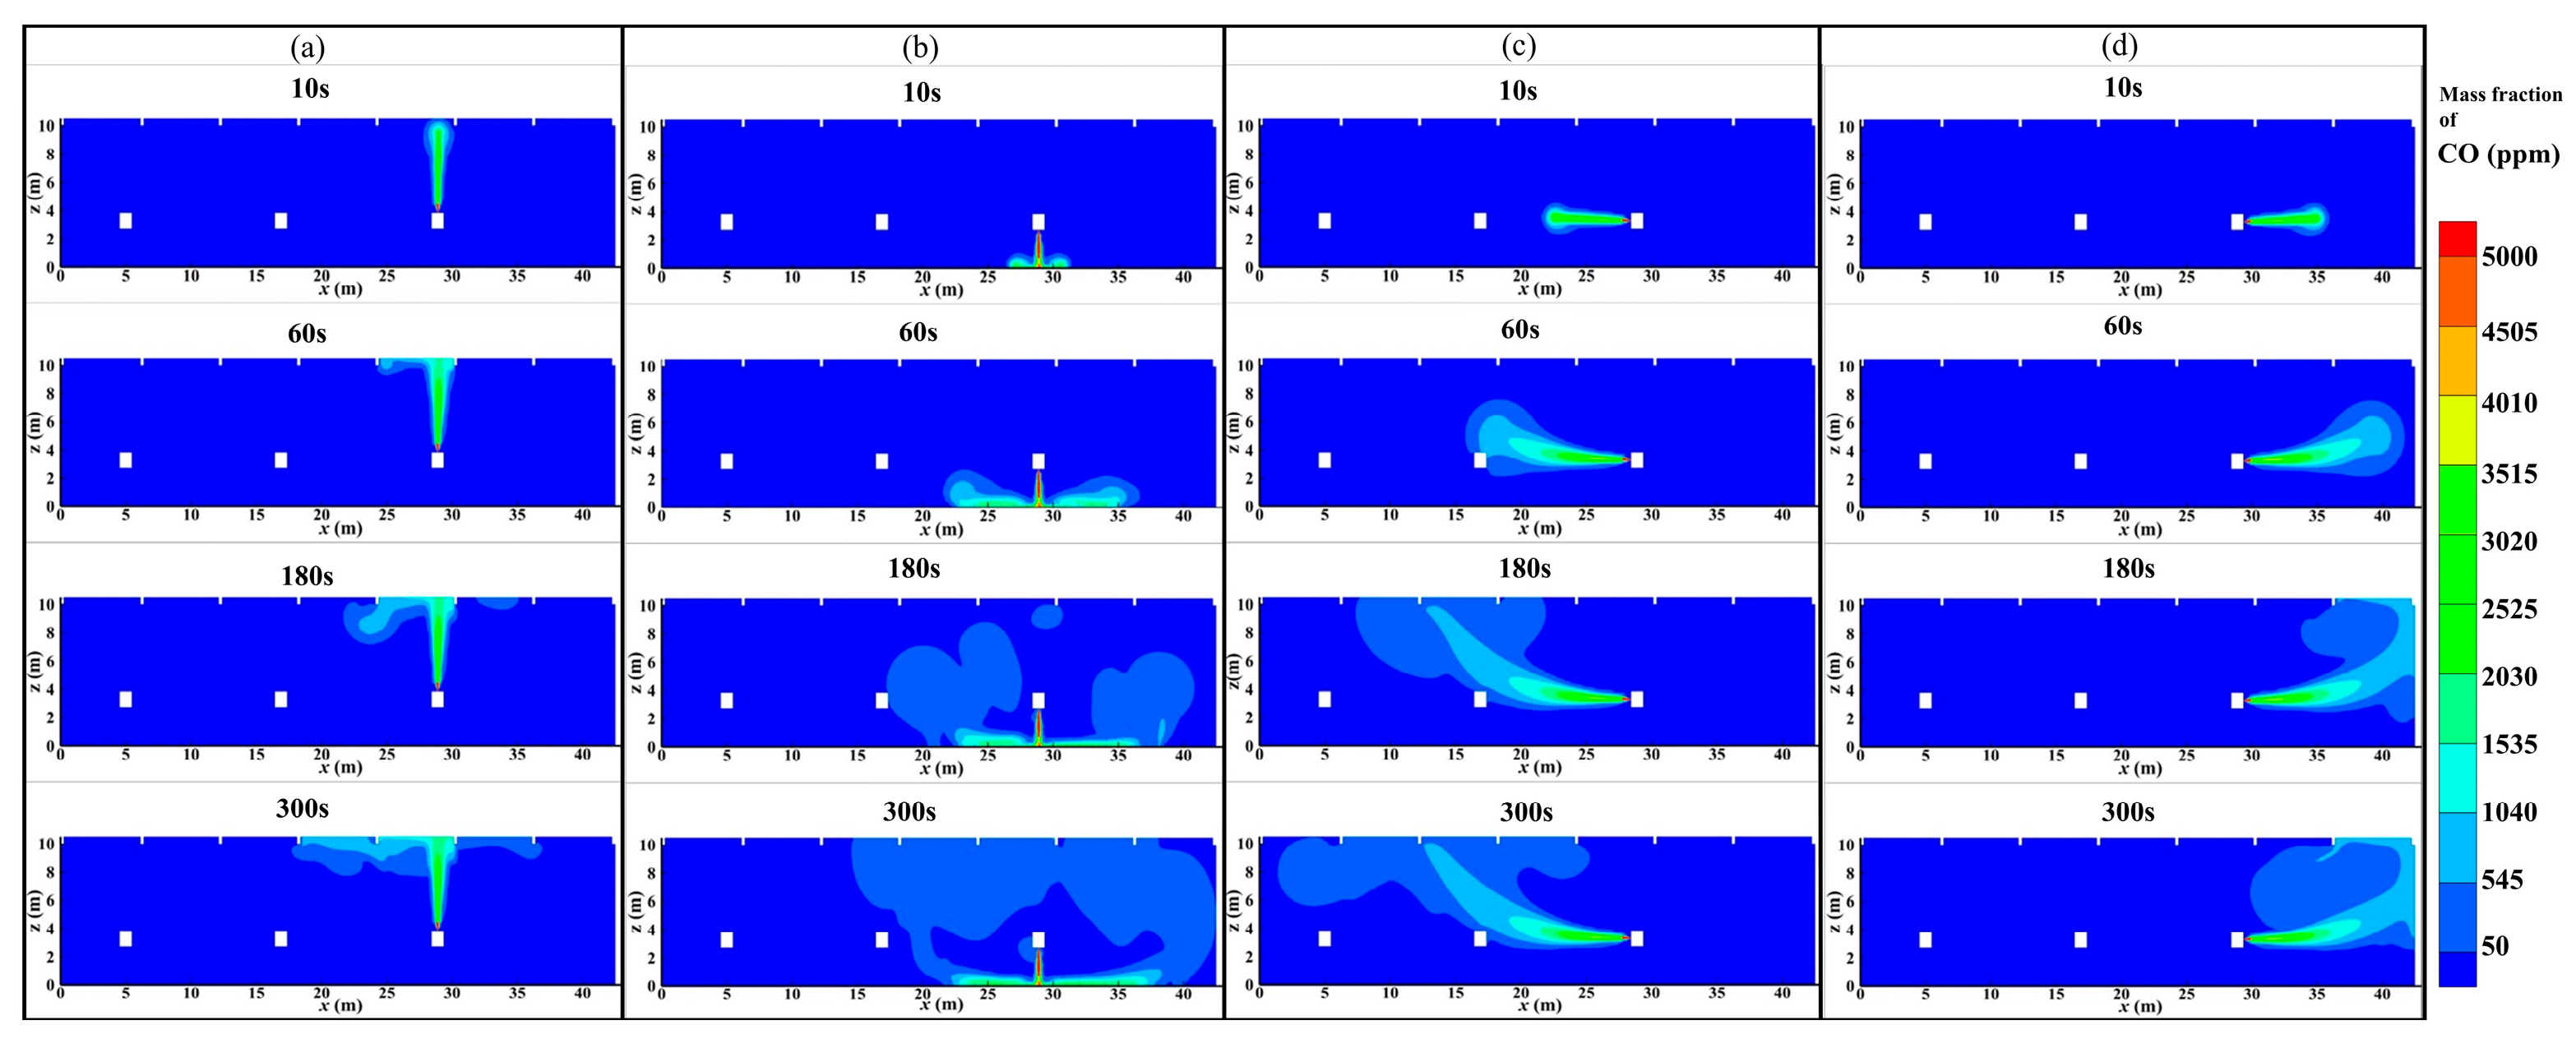
CO diffusion path under each leakage direction of Fan#3: (a) upward; (b) downward; (c) leftward; (d) rightward (t = 10 s, 60 s, 180 s, 300 s).
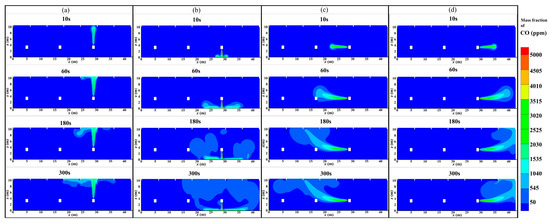
Figure 9 shows the gas diffusion process of Fan#1 under different leakage directions. The left wall limited the diffusion movement of the leftward leakage (Figure 9b) jet zone, so that the CO accumulated on the left wall spread upward to the ceiling at a large speed and then continued to spread to the right, along the ceiling for 13 m. After a short diffusion time (60 s), the left wall inhibited the diffusion boundary zones for upward (Figure 9a) and downward (Figure 9b) CO leakage, reducing the horizontal diffusion distance by around 40% compared to that of Fan#2’s leakage. Simultaneously, the CO concentration increased significantly due to the gas accumulation. As shown in Figure 9c, more significant accumulation phenomena can also be observed under the leftward leakage. For the rightward leakage (Figure 9d), the horizontal dispersion distance was longer, without the restrictive effect of the side wall. Therefore, the influence of the wall on the gas leakage of Fan#1 was more obvious, and different leakage directions can also cause differences.
In addition, considering the asymmetrical distribution of fan facilities, the gas diffusion process of Fan#3 was analyzed and is presented in Figure 10. The diffusion conditions under upward and downward leakage were similar to the cases of Fan#2. For the case of rightward leakage (Figure 10d), the horizontal diffusion range and CO concentration in the opposite direction were both smaller than those under leftward leakage of Fan#1 (Figure 9c), meaning that the influence of the right wall on gas diffusion of Fan#3 was less than that of Fan#1 by the left wall.
3.2.2. CO Concentration at Different Locations
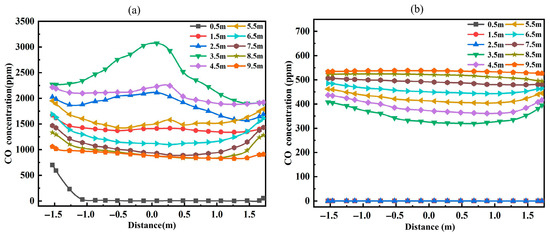
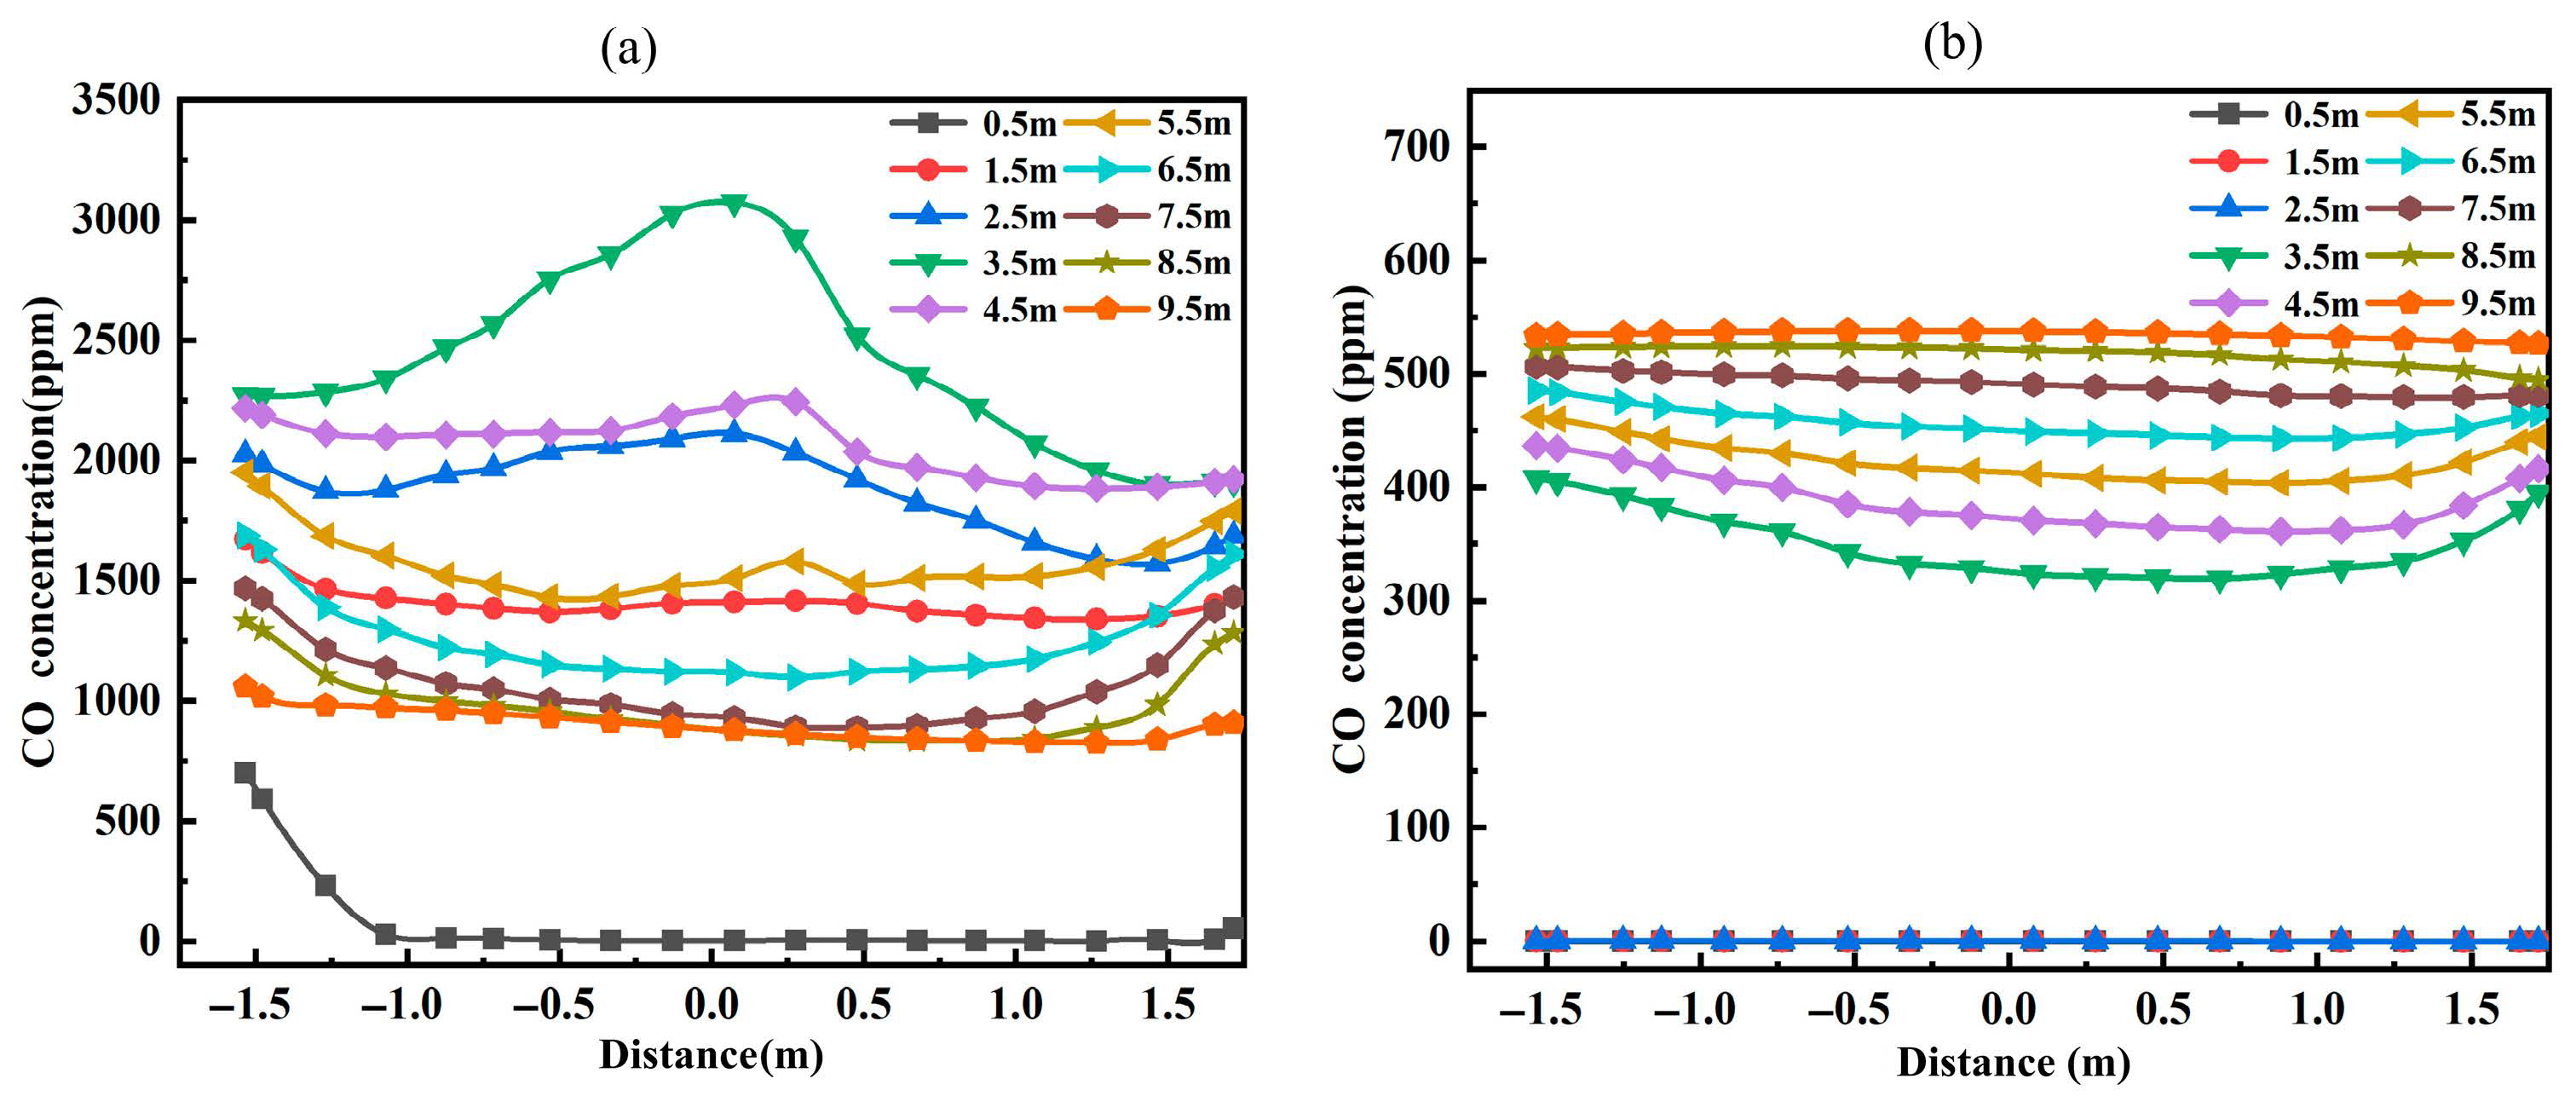
Furthermore, the CO concentration distributions at different longitudinal positions and heights at 300 s were investigated. Under the condition of leftward leakage, the section of the left wall was chosen as the study plane, and a total of 10 test lines parallel to each other were set up at the height of 0.5 m~9.5 m, with an interval of 1 m. Figure 11 shows the distribution of CO concentration on the left wall under the leftward leakage of Fan#1 and Fan#2. When Fan#1 leaked to the left, the CO concentration at a height of 3.5 m was the highest, and the values decreased with the increase in distance. When the height of the test line was greater than 5.5 m, the CO concentration at both ends of the test line was greater than the concentration in the central region. Owing to the wall restriction, the closer the location was to the leakage source, the greater the extent of CO contamination. In addition, CO was prone to accumulate at corners.
Figure 11.
Distribution of CO concentration on the left wall: (a) leftward leakage of Fan#1; (b) leftward leakage of Fan#2 (t = 300 s).
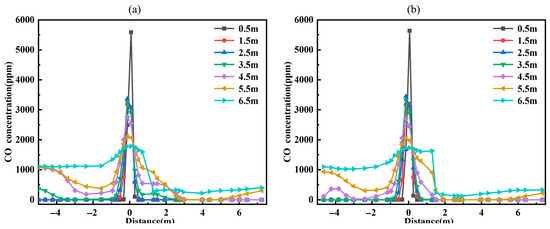
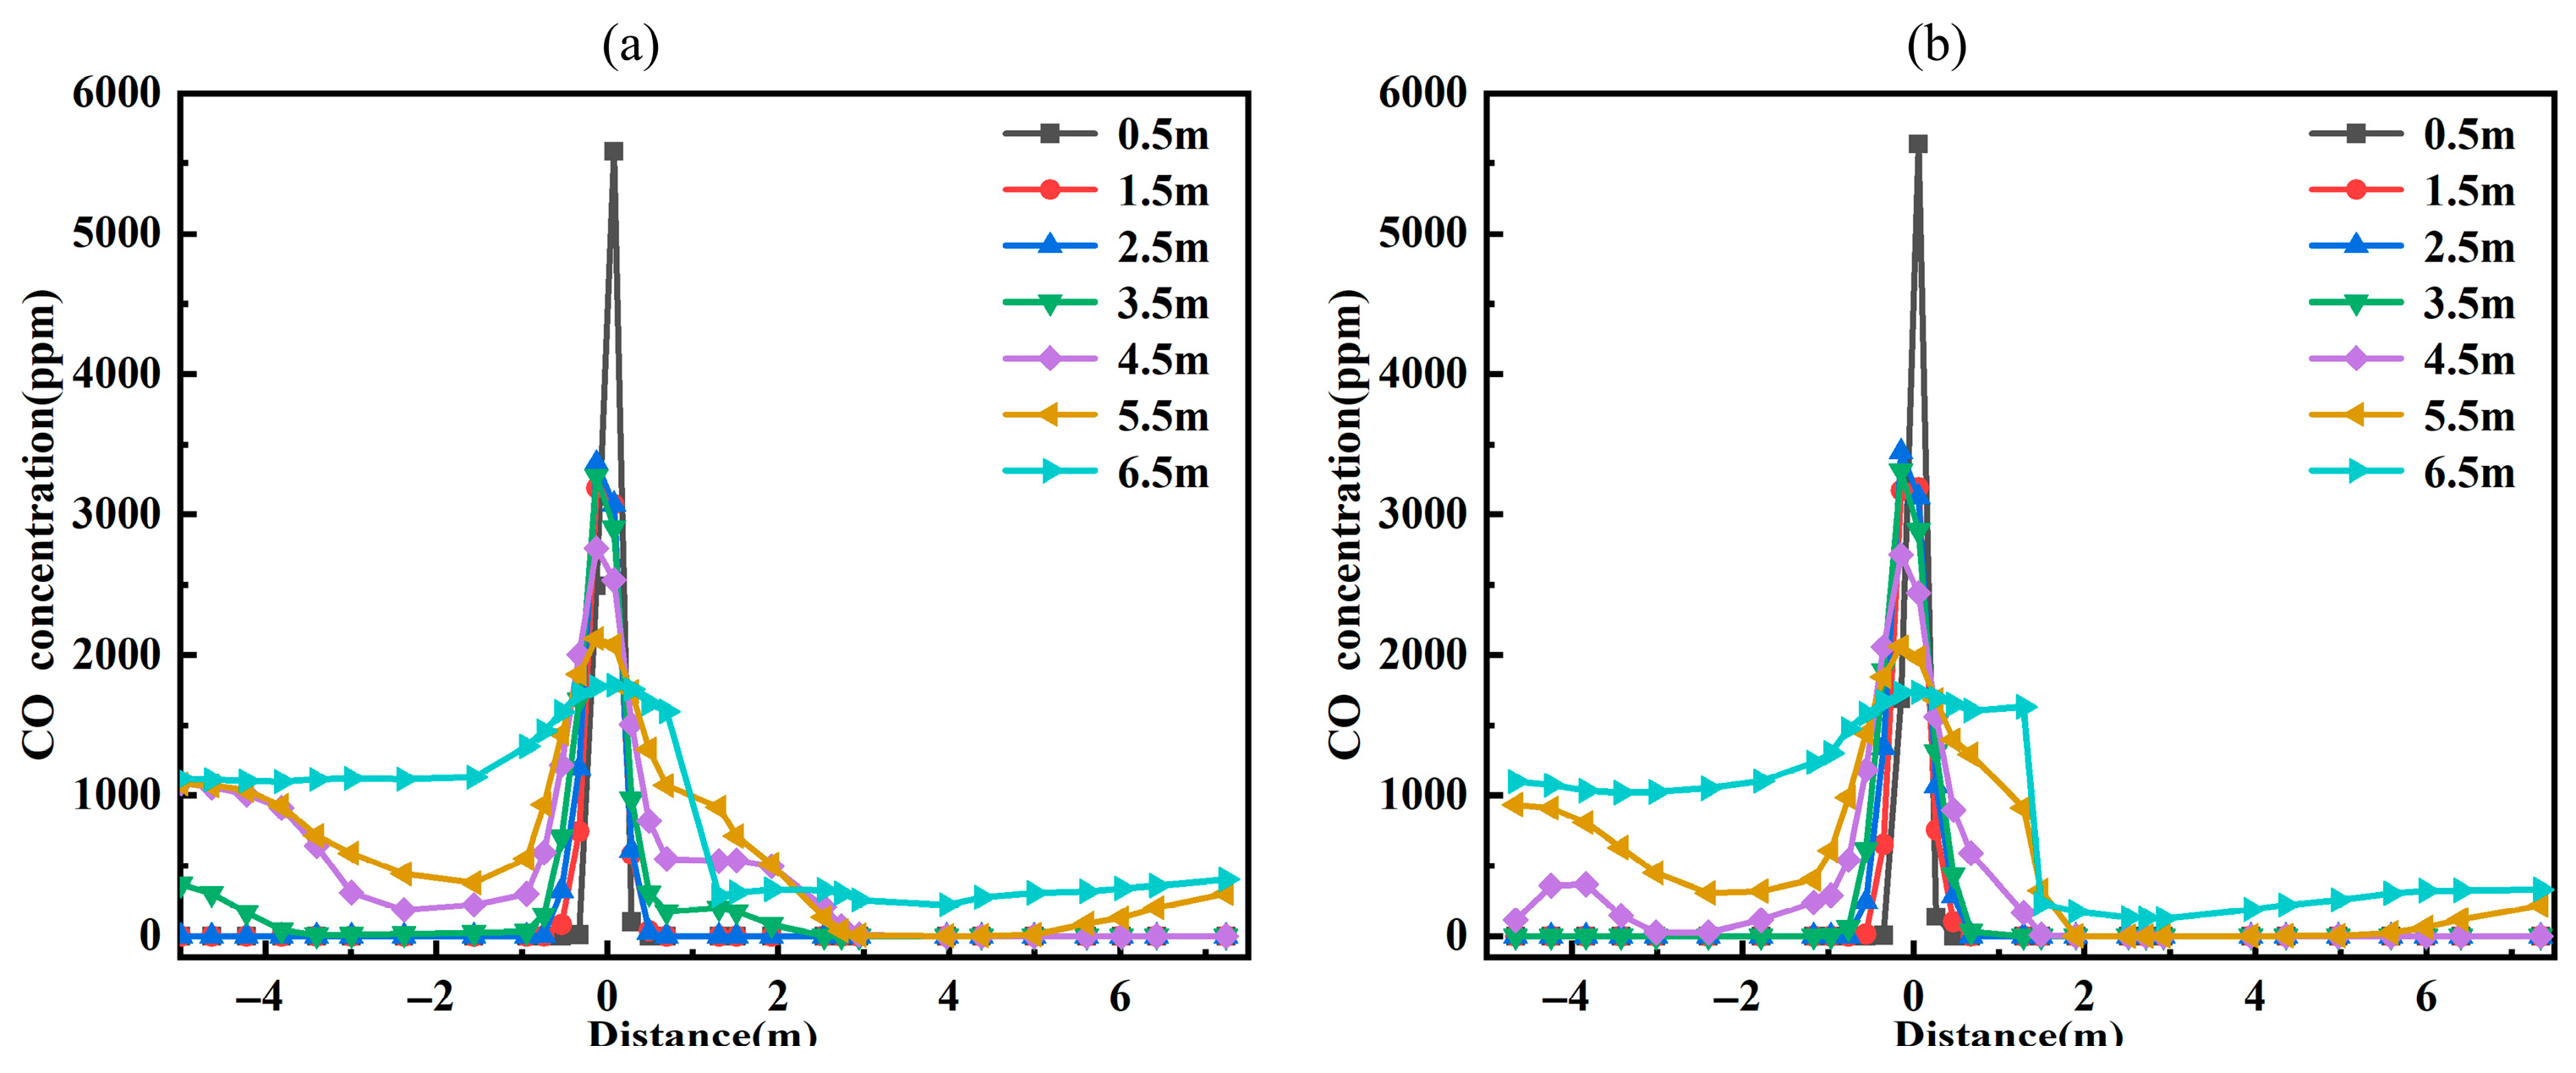
Under the condition of upward leakage, the center plane of the leakage source was chosen as the study plane, and a total of seven parallel test lines were set up at a height of 0.5~6.5 m from the leakage source, with an interval of 1 m. Figure 12 shows the distribution of CO concentrations at different heights during upward leakage from Fan#1 and Fan#2. It can be seen that the highest concentration of CO was found at a 0.5 m height above the leakage source and decreased with increasing height. As the leaked gas continued to spread, the pollution range also increased with height. The CO concentration decreased sharply with distance after the gas diffusion to the ceiling.
Figure 12.
Distribution of CO concentrations at different heights for upward leakage: (a) upward leakage of Fan#1; (b) upward leakage of Fan#2 (t = 300 s).
3.3. Hazard Area Division
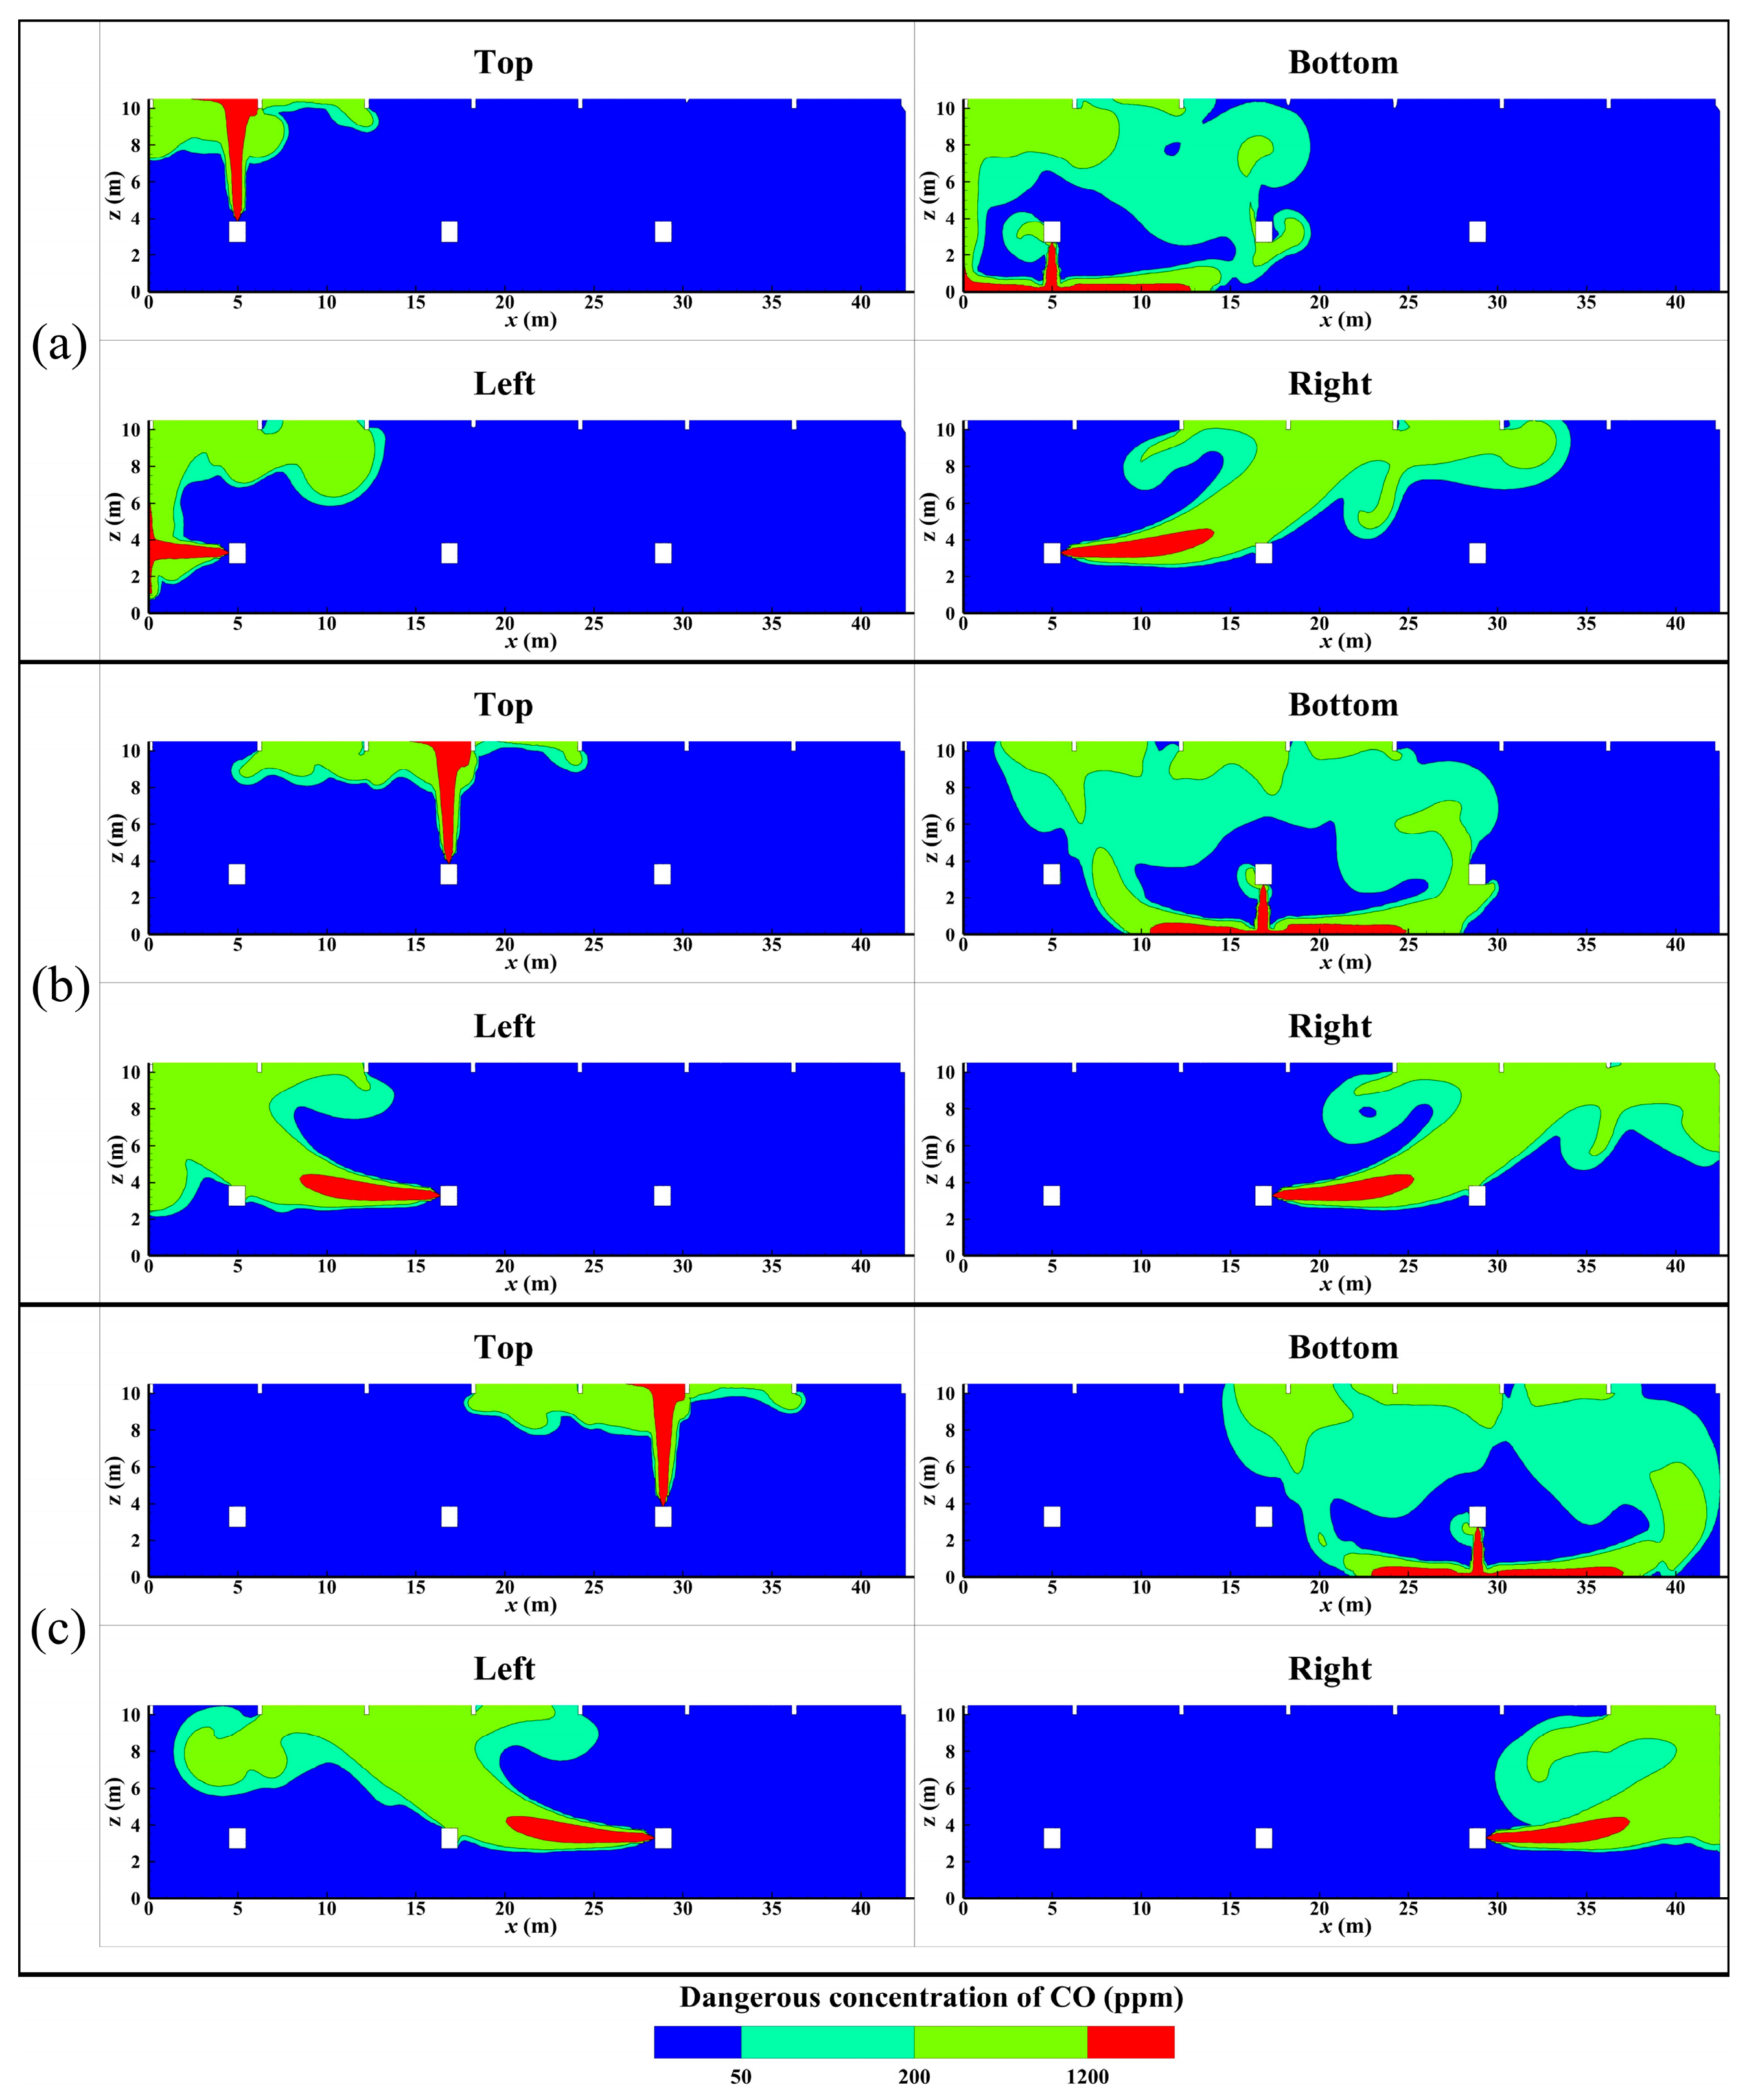
The health risks of CO can be quantified by comparison with individual exposure times or more complex methods. To ensure the safety of workers in confined spaces, many organizations have established exposure standards for CO concentrations. ‘Safety code for gas of industrial enterprises’ (GB6222-2005) [46] stipulates that the maximum allowable concentration of CO in the operating environment is 24 ppm. OSHA sets a 50 ppm limit for CO over eight hours in the workplace [47]. NIOSH recommends an 8 h permissible exposure limit of 35 ppm and a 15 min exposure value of 200 ppm, and indicates that 1200 ppm is a concentration that poses an immediate risk to life and health [24]. ACGIH set a permissible exposure limit of 25 ppm for CO over 8 h and 200 ppm over 15 min [24]. Therefore, CO distribution of gas leakage and diffusion can be divided into lethal zone, serious injury zone, and minor injury zone, according to the degree to the operators. Considering the above regulations and methods, the boundary concentrations of the lethal zone, serious injury zone, and minor injury zone were set as Cs = 1200 ppm, Cz = 200 ppm, or Cq = 50 ppm, respectively.
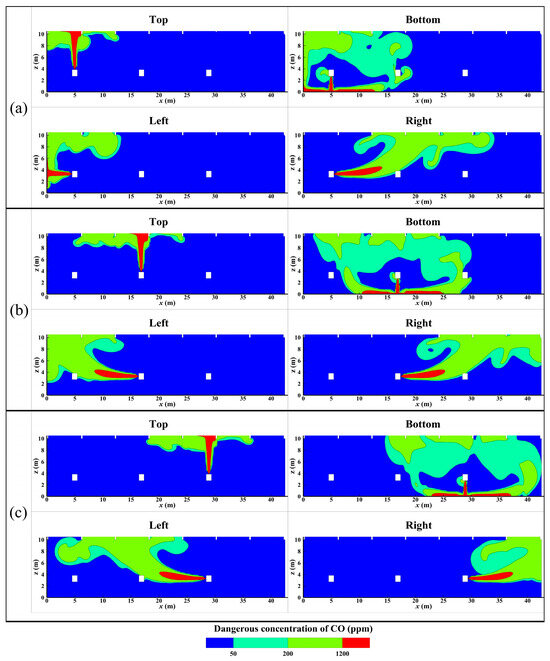
Figure 13 shows the poisoned areas for CO diffusion under different gas leakage conditions. Obviously, the closer to the structure boundary, the wider the lethal zone. The serious injury zone had the widest range, mainly distributed in the vicinity of structural boundaries, such as roofs and walls. For the downward leakage, a serious injury area of about 20–25 m wide within a height of 2–4 m was formed, and the minor injury zone accounted for about 50% of the poisoned area, mainly distributed in the height range of 4–8 m. In other words, a downward leakage is the most dangerous situation, as judged by the hazard to the operator.
Figure 13.
Hazard area division in all directions: (a) Fan#1; (b) Fan#2; (c) Fan#3 (t = 300 s).
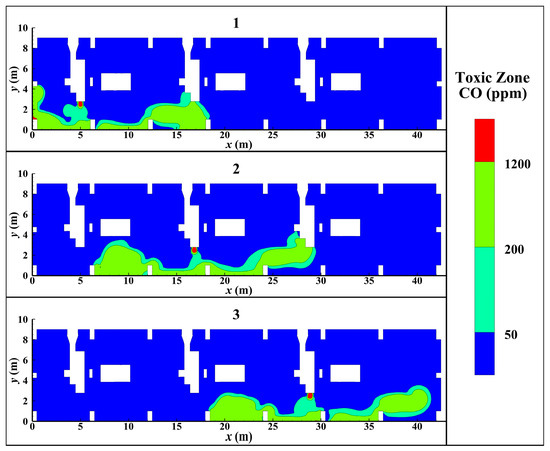
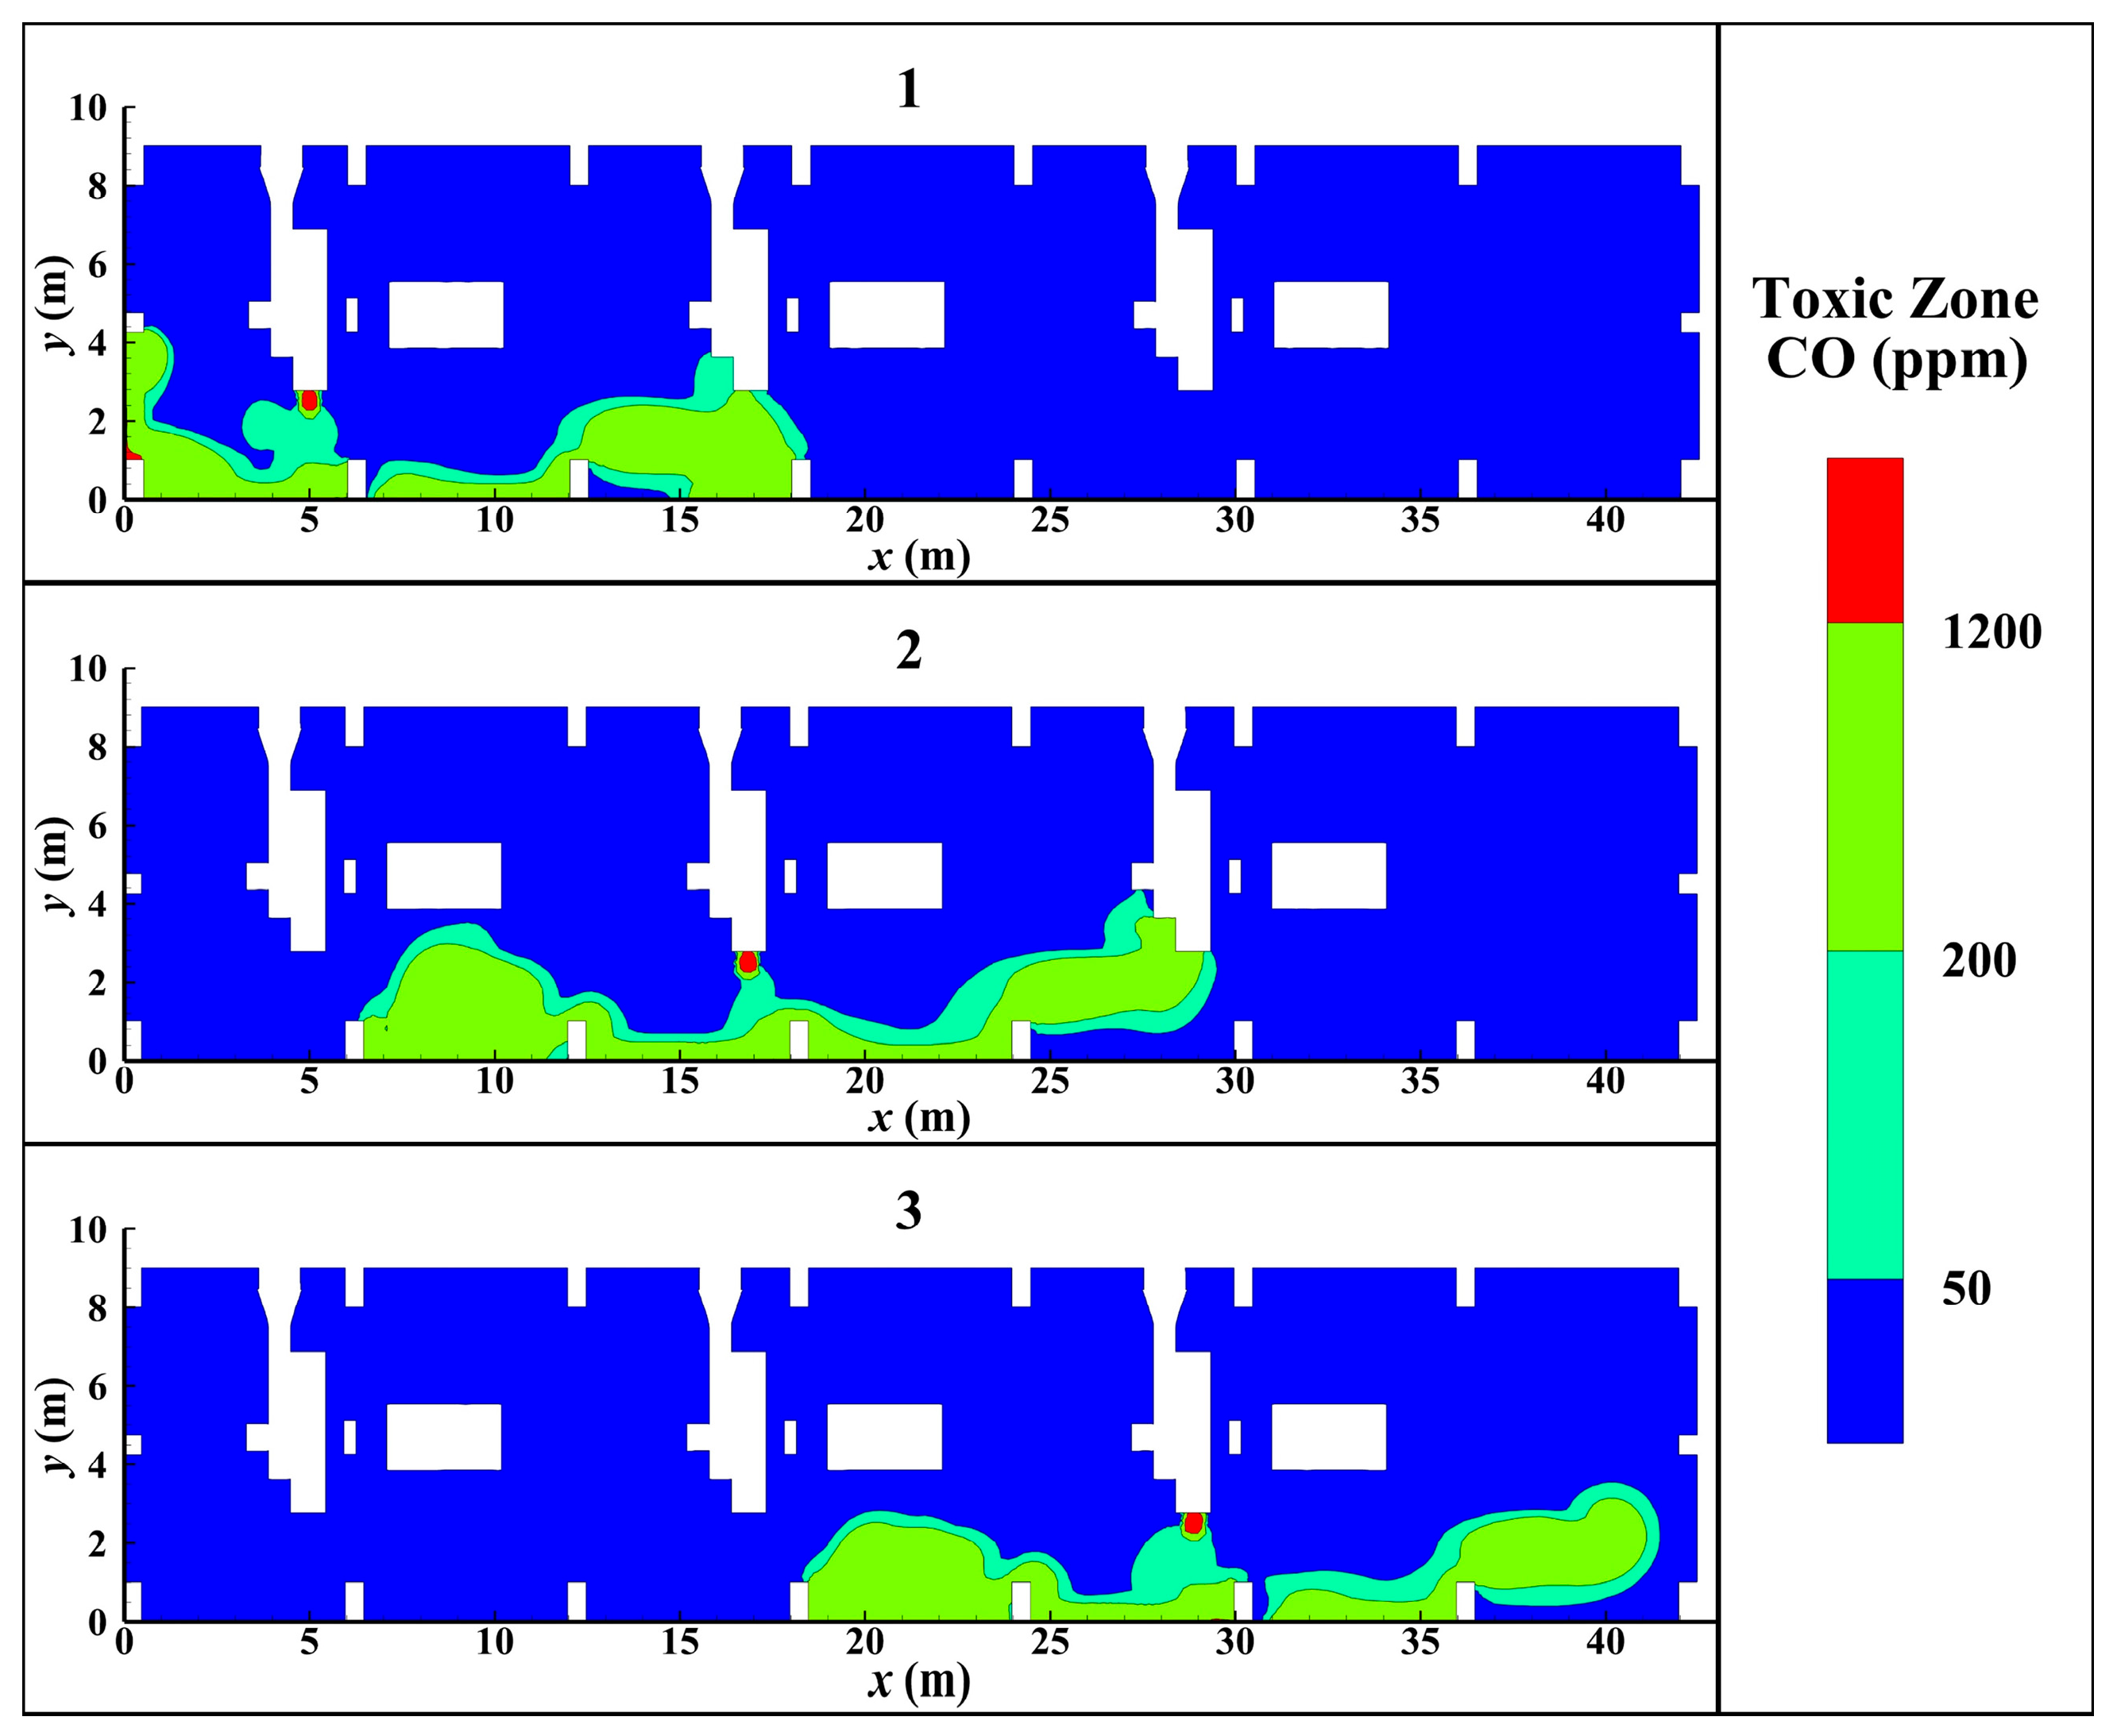
Additionally, the downward leakage of the three fans was further analyzed. Considering the critical height of 1.6 m above the ground, the horizontal distributions of CO at this height were plotted in Figure 14. It can be seen that the poisoning area was generally located on the side of the fan leakage source, and the area widths of Fan#1, Fan#2, and Fan#3 were 19 m, 23 m, and 23 m. For hazard area division, the lethal zone with a radius of 0.8 m was formed directly below the leakage source. The serious injury zone was distributed near the front wall, accounting for about 80% of the total poisoning area. The minor injury zone near the leakage source was large, and the width of the minor injury zone at the diffusion boundary was 0.5 m. These results can be used to develop evacuation routes for operators in the event of gas leakage, ensuring personnel safety and sustainable management.
Figure 14.
Horizontal CO distributions at z = 1.6 m for downward leakage: (1) Fan#1; (2) Fan#2; (3) Fan#3 (t = 300 s).
4. Conclusions
In this paper, small-hole gas pipeline leakages in the converter fan room of steel enterprises were numerically simulated and verified by measured data. Considering the effects of leakage locations and directions, the flow-field characteristic, gas diffusion path, and hazard area were analyzed, finding the dangerous scenarios of gas leakage accidents. The main conclusions were as follows:
(1) The CO distribution near the leakage hole presented a steady jet, and the obstacles altered the gas diffusion direction and range. Therefore, the closer the gas leakage source was to the side wall, the more CO accumulated near the wall, and the greater the hazard area.
(2) The diffusion velocity was affected by air resistance and leakage direction, which presented a large attenuation within the distance of 0.6 m, and the downward leakage attenuation was the fastest. In addition, the far-field velocity eventually tended to a constant value, and the final velocity of downward leakage was the highest due to the structural boundary restriction.
(3) The leakage characteristics under different scenarios were basically similar in the initial phase of the leakage (within 10 s). After that, the diffusion process changed due to the obstacles and buoyancy in the course of continuous leakage. It was found that downward leakage was the most harmful to operators by comparing different leakage directions. A lethal zone of about 14 m was formed near the ground, and a lethal zone with a radius of 0.8 m was located at a height of 1.6 m.
This work can provide guidance for coal-gas-monitoring programs and emergency management for gas leakage accidents, realizing advanced prediction and post-disposal. In other words, this study can help to strengthen the full-process management of sustainable industrial development.
Compared to the practical scenarios, the simplified geometric structure may result in a deviation between the simulated dangerous area and the actual situation, and the mechanical ventilation mode was not considered. In the future, the leakage aperture and shape can be considered to cover more leakage scenarios, with the establishment of more refined numerical models. In addition, further consideration needs to be given to ventilation factors, especially the coupling effect between outdoor environmental wind and indoor mechanical ventilation systems.
Author Contributions
Conceptualization, Z.L. and Q.W.; methodology, Z.L. and F.Z.; software, F.Z.; validation, S.Y.; investigation, H.Z.; resources, Q.W.; writing—original draft preparation, Z.L. and F.Z.; writing—review and editing, Z.L.; project administration, X.X. and X.L.; funding acquisition, Z.L. All authors have read and agreed to the published version of the manuscript.
Funding
This work was supported by the Beijing Natural Science Foundation (8254046), the Fundamental Research Funds for the Central Universities (2024XJAQ01), and the China Postdoctoral Science Foundation-CCTEG Joint Support Program (2025T047ZGMK).
Institutional Review Board Statement
Not applicable.
Informed Consent Statement
Not applicable.
Data Availability Statement
The original contributions presented in this study are included in the article. Further inquiries can be directed to the corresponding author.
Conflicts of Interest
Authors Xianhui Xu and Xiliang Liu were employed by Angang Steel Company Limited. The remaining authors declare that the research was conducted in the absence of any commercial or financial relationships that could be construed as a potential conflict of interest.
References
- Safarian, S. To what extent could biochar replace coal and coke in steel industries? Fuel 2023, 339, 127401. [Google Scholar] [CrossRef] [Scilit]
- Suo, H.; Peng, C.; Wu, Z.; Zhang, Y.; Liu, C.; Lou, L.; Liu, S.; Yu, K. Organic solid waste as sustainable fuels and reducing agents in low-carbon steelmaking technologies. Fuel 2025, 392, 134825. [Google Scholar] [CrossRef] [Scilit]
- Zhao, J.; Li, B.; Wei, X.; Li, T.; Li, S. New green and low-carbon technology for all-sensible heat recovery of converter gas. J. Clean. Prod. 2024, 438, 140699. [Google Scholar] [CrossRef] [Scilit]
- Zuo, H.; Lu, C.; Jiang, L.; Cheng, X.; Li, Z.; Li, Y.; Li, D.; Wang, H.; Li, K. Hydrogen production and CO2 capture from Linz-Donawitz converter gas via a chemical looping concept. Chem. Eng. J. 2023, 477, 146870. [Google Scholar] [CrossRef] [Scilit]
- Zhai, Y.; Li, S.; Yan, W.; Wei, X.; Zhang, L.; Wang, Y. Effects of water vapor and temperature on NOx and CO emissions during converter gas combustion. Fuel 2019, 256, 115914. [Google Scholar] [CrossRef] [Scilit]
- World Steel Association. World Steel in Figures 2024. 2024. Available online: https://worldsteel.org (accessed on 15 November 2025).
- Swalec, C.; Grigsby-Schulte, A. Pedal to the Metal 2023: It’s Time to Shift Steel Decarbonization into High Gear; Global Energy Monitor: San Francisco, CA, USA, 2023. [Google Scholar]
- Li, S.; Wei, X.; Yu, L. Numerical simulation of off-gas formation during top-blown oxygen converter steelmaking. Fuel 2011, 90, 1350–1360. [Google Scholar] [CrossRef] [Scilit]
- Hu, S.; Zhu, R.; Dong, K.; Wu, W. New Process for Resource Utilization of converter gas and simulation on the combustion of converter gas. ISIJ Int. 2018, 58, 776–783. [Google Scholar] [CrossRef] [Scilit]
- Musial, D.; Szwaja, M.; Kurtyka, M.; Szwaja, S. Usage of converter gas as a substitute fuel for a tunnel furnace in steelworks. Materials 2022, 15, 5054. [Google Scholar] [CrossRef] [Scilit]
- Kariman, K.; Gao, N.; Ma, C.; Wang, Z. A risk assessment system of toxic gas leakages in metallurgy based on fuzzy evaluation with comprehensive weighting. Appl. Sci. 2022, 12, 5948. [Google Scholar] [CrossRef] [Scilit]
- Li, Q.; Yang, Q.; Liu, W.; Dai, P.; Yang, Y. Poisoning and Asphyxiation Risk Assessment in a Steel Plant Based on Fuzzy Bayesian Network. Processes 2024, 12, 2102. [Google Scholar] [CrossRef] [Scilit]
- Shen, J.; Zhu, H.; Luo, M.; Liu, D. Numerical simulation of CO distribution discharged by flame-proof vehicle in underground tunnel of coal mine. J. Loss Prev. Process Ind. 2016, 40, 117–121. [Google Scholar] [CrossRef] [Scilit]
- Chu, C.R.; Wu, S.L. A transient transport model for gaseous pollutants in naturally-ventilated partitioned buildings. Build. Simul. 2018, 11, 305–313. [Google Scholar] [CrossRef] [Scilit]
- Czerski, G.; Spiewak, K. Assessment of the risk of poisoning by combustion products from domestic gas-fired appliance using CFD modeling. IOP Conf. Ser. Earth Environ. Sci. 2021, 642, 012010. [Google Scholar] [CrossRef] [Scilit]
- Duci, A.; Papakonstantinou, K.; Chaloulakou, A.; Markatos, N. Numerical approach of carbon monoxide concentration dispersion in an enclosed garage. Build. Environ. 2004, 39, 1043–1048. [Google Scholar] [CrossRef] [Scilit]
- Mousavi, M.S.; Ashrafi, K.; Motlagh, M.S.P.; Niksokhan, M.H.; Vosoughifar, H.R. Experimental and numerical analysis of CO concentration dispersion of vehicular exhaust emissions in isolated environment. Environ. Model. Assess. 2017, 22, 431–444. [Google Scholar] [CrossRef] [Scilit]
- Omar, M.H.; Kamal, M.M.; Abotaleb, H.A. The effectiveness of impulsive jet fans ventilation on CO concentration in closed car park. Eng. Appl. Comput. Fluid Mech. 2024, 18, 2406245. [Google Scholar] [CrossRef] [Scilit]
- Al-Waked, R.; Yassin, A.; Adwan, A.; Mostafa, D.B. Effects of cross level air interaction within multilevel underground carparks on indoor air quality. Fluids 2020, 5, 177. [Google Scholar] [CrossRef] [Scilit]
- Shi, G.; Xue, S.; Tu, Q.; Zhang, W.; Li, C. Numerical simulation study on the exhaust gas migration of fuel vehicles under an airflow field in the confined space of an underground coal mine. Fuel 2023, 349, 128674. [Google Scholar] [CrossRef] [Scilit]
- Czerski, G.; Strugała, A. The energy efficiency of hot water production by gas water heaters with a combustion chamber sealed with respect to the room. Water 2014, 6, 2394–2411. [Google Scholar] [CrossRef] [Scilit]
- Kim, K.; Song, D. Estimation of the Hazardous Chemical Leakage Scale Inside Buildings Using CFD. Buildings 2024, 14, 2094. [Google Scholar] [CrossRef] [Scilit]
- Chang, W.R.; Cheng, C.L. Carbon monoxide transport in an enclosed room with sources from a water heater in the adjacent balcony. Build. Environ. 2008, 43, 861–870. [Google Scholar] [CrossRef] [Scilit]
- Wang, L.; Emmerich, S.J.; Persily, A.K.; Lin, C.C. Carbon monoxide generation, dispersion and exposure from indoor operation of gasoline-powered electric generators under actual weather conditions. Build. Environ. 2012, 56, 283–290. [Google Scholar] [CrossRef] [Scilit]
- Zhao, P.; Zhao, Y.; Yu, Z. Diffusion research of leaked coal gas in steel plants under natural ventilation conditions. In Proceedings of the Computational Intelligence and Intelligent Systems: 5th International Symposium, ISICA 2010, Wuhan, China, 22–24 October 2010; pp. 173–179. [Google Scholar]
- Fu, L.Z.; Li, Y.F.; Li, G. Numerical simulation of gas leakage and diffusion based on FLUENT. Adv. Mater. Res. 2013, 726, 888–891. [Google Scholar] [CrossRef] [Scilit]
- Fu, H.; Yang, L.; Liang, H.; Wang, S.; Ling, K. Diagnosis of the single leakage in the fluid pipeline through experimental study and CFD simulation. J. Pet. Sci. Eng. 2020, 193, 107437. [Google Scholar] [CrossRef] [Scilit]
- Liu, H.; Liu, C.; Nie, W.; Hua, Y.; Yan, X.; Lian, J.; Wu, H.; Song, X. Numerical analysis of spatial and temporal distribution of exhaust emissions from multiple underground diesel vehicles under different idling conditions. Fuel 2024, 374, 132234. [Google Scholar] [CrossRef] [Scilit]
- Levenspiel, O. Engineering Flow and Heat Exchange; Springer: Berlin/Heidelberg, Germany, 2014. [Google Scholar]
- Yan, Y.; Dong, X.; Li, J. Experimental study of methane diffusion in soil for an underground gas pipe leak. J. Nat. Gas Sci. Eng. 2015, 27, 82–89. [Google Scholar] [CrossRef] [Scilit]
- Liu, C.R.; Wu, J.H.; Lu, K.; Zhao, Z.T.; Huang, Z. Acoustical siphon effect for reducing the thickness in membrane-type metamaterials with low-frequency broadband absorption. Appl. Acoust. 2019, 148, 1–8. [Google Scholar]
- Zhao, Q.; Li, Y.; Cao, W.; Li, Y. Risk analysis of high-pressure hydrogen leakage in confined space with tube skid container for cylinder. Int. J. Hydrogen Energy 2024, 60, 581–592. [Google Scholar] [CrossRef] [Scilit]
- Choi, S.K.; Kim, S.O. Turbulence modeling of natural convection in enclosures: A review. Mech. Sci. Technol. 2012, 26, 283–297. [Google Scholar]
- Hajji, Y.; Bouteraa, M.; ELCafsi, A.; Belghith, A.; Bournot, P.; Kallel, F. Natural ventilation of hydrogen during a leak in a residential garage. Renew. Sustain. Energy Rev. 2015, 50, 810–818. [Google Scholar] [CrossRef] [Scilit]
- Mynarz, M.; Tulach, A.; Bojko, M. CFD-based simulation of flammable gas dispersion in a complex geometry. J. Loss Prev. Process Ind. 2025, 94, 105551. [Google Scholar] [CrossRef] [Scilit]
- Ma, Q.; Guo, F. Analysis of the effects of ambient wind and vehicle opening conditions on the hydrogen leakage hazard of hydrogen fuel cell buses. Fuel 2025, 392, 134912. [Google Scholar] [CrossRef] [Scilit]
- Wu, Y.F.; Liu, D.Z.; Zhao, Y.S. Research on the Law of Leakage and Diffusion in Workplace of Iron and Steel Enterprise. China Saf. Sci. J. 2009, 19, 14–19+179. (In Chinese) [Google Scholar]
- Cheng, Y.C. Numerical Simulation Analysis of Gas Leakage in Dangerous Workplaces. China Public Secur. (Acad. Ed.) 2013, 1, 61–65. (In Chinese) [Google Scholar]
- Han, H.; Chang, X.; Duan, P.; Li, Y.; Zhu, J.; Kong, Y. Study on the leakage and diffusion behavior of hydrogen-blended natural gas in utility tunnels. J. Loss Prev. Process Ind. 2023, 85, 105151. [Google Scholar] [CrossRef] [Scilit]
- Jiao, W.; Chen, C.; Lei, P.; Zhang, Y. Experimental study on the effects of branch tunnel ventilation on the smoke movement and temperature characteristics in bifurcated tunnel fires. Tunn. Undergr. Space Technol. 2024, 144, 105529. [Google Scholar] [CrossRef] [Scilit]
- Xu, D.; Li, Y.; Li, J.; Zhong, H.; Li, J.; Huang, Y. Climate-adaptive fire smoke ventilation strategies for atrium-type metro stations: A NSGA-II multi-objective optimisation study. Energy 2024, 306, 132390. [Google Scholar] [CrossRef] [Scilit]
- Chernyavsky, B.; Wu, T.C.; Peneau, F.; Benard, P.; Oshkai, P.; Djilali, N. Numerical and experimental investigation of buoyant gas release: Application to hydrogen jets. Int. J. Hydrogen Energy 2011, 36, 2645–2655. [Google Scholar] [CrossRef] [Scilit]
- Li, Y.; Wang, Z.; Yin, Z.; Guo, P.; Fan, R. Experimental and computational studies of concentration and flow field variation of syngas released. Environ. Prog. Sustain. Energy 2024, 43, e14281. [Google Scholar] [CrossRef] [Scilit]
- Cao, X.; Liu, J.; Jiang, N.; Chen, Q. Particle image velocimetry measurement of indoor airflow field: A review of the technologies and applications. Energy Build. 2014, 69, 367–380. [Google Scholar] [CrossRef] [Scilit]
- Thawani, B.; Hazael, R.; Critchley, R. Numerical modelling of hydrogen leakages in confined spaces for domestic applications. Int. J. Hydrogen Energy 2024, 56, 797–806. [Google Scholar] [CrossRef] [Scilit]
- GB 6222-2005; Safety Code for Gas of Industrial Enterprise. State Administration of Work Safety: Beijing, China, 2005. (In Chinese)
- Henn, S.A.; Bell, J.L.; Sussell, A.L.; Konda, S. Occupational carbon monoxide fatalities in the US from unintentional non-fire related exposures, 1992–2008. Am. J. Ind. Med. 2013, 56, 1280–1289. [Google Scholar] [CrossRef] [Scilit] [PubMed]

Disclaimer/Publisher’s Note: The statements, opinions and data contained in all publications are solely those of the individual author(s) and contributor(s) and not of MDPI and/or the editor(s). MDPI and/or the editor(s) disclaim responsibility for any injury to people or property resulting from any ideas, methods, instructions or products referred to in the content. |
© 2026 by the authors. Licensee MDPI, Basel, Switzerland. This article is an open access article distributed under the terms and conditions of the Creative Commons Attribution (CC BY) license.