


Abstract
Effective water resource management in agriculture is a pivotal challenge for environmental sustainability and the economic viability of crop production. The present study, conducted at the CREA research station (Monterotondo, Italy), analyzed a precision irrigation strategy based on an automated drip irrigation system with soil moisture sensors, applied to a 15-year-old high-density poplar plantation for energy production. Five treatments were compared: a non-irrigated control (T0) and four irrigation levels based on soil moisture thresholds (T1 ≤ 20%, T2 ≤ 30%, T3 ≤ 40%, T4 ≤ 50%). The aim of this study was to assess the economic feasibility of irrigated poplar plantations, considering expected increases in biomass production and related environmental impacts. The economic evaluation used the Life Cycle Costing (LCC) method, while the environmental assessment applied Life Cycle Assessment (LCA) with the AWARE indicator to quantify the water scarcity footprint. Finally, an integrated assessment using the TOPSIS multi-criteria method was performed to identify the most sustainable treatment. Over the 15-year period, T0 (no irrigation) was the preferred option (Preferred Index Pi = 1.000), followed by T3 (Pi = 0.637) and T4 (Pi = 0.586), considering equal weighting of economic and environmental impacts. Conversely, the low irrigation treatment (T1) was the least sustainable (Pi = 0.379), followed by T2 (Pi = 0.486). While irrigation appears unviable if environmental impacts are prioritized, higher biomass value can improve the economic sustainability of treatments with greater water use (T3 and T4) when economic factors dominate.
1. Introduction
Globally, freshwater resources are increasingly recognized as critical assets due to well-documented scarcity and overexploitation. Freshwater availability is becoming progressively constrained by rising demand across productive sectors. This trend is driven by population growth and increasing living standards. Climate change further exacerbates this situation by accelerating desertification and intensifying water demand. This leads to profound social, environmental, and economic consequences. As water is vital for human health and survival, ensuring its equitable allocation among competing uses is critical. Given the continuous decline in water availability, effective mitigation strategies and sustainable practices are essential for global resource management [1,2,3,4,5,6]. Among all productive sectors, agriculture is the primary cause of water stress, accounting for up to 90% of total global freshwater consumption [7,8,9]. In recent years, irrigation demand has shown an inevitable upward trend [10]; without appropriate policies, this demand is expected to increase rapidly [11]. Consequently, the agricultural sector plays a central role in managing the global water crisis. Major agricultural nations will inevitably face increasing water pressure driven by economic development and expanding urbanization. Improving water-use efficiency is therefore crucial for regional food security and sustainable water resource management [12,13].
1.1. Current Research Status: Precision Irrigation and Decision Support Systems
The majority of water usage in the agricultural sector is directly linked to irrigation practices. Due to the strong interdependence between agriculture and water management, irrigated agriculture typically entails substantial water consumption [6,14]. Within this sector, critical challenges frequently emerge from substantial inefficiencies, primarily caused by sub-optimal distribution systems such as surface flow irrigation. To address these issues, the concept of “precision irrigation” is increasingly adopted. This approach delivers water precisely where needed, improving efficiency and reducing waste. The implementation of modern intelligent irrigation systems, also known as Decision Support Systems (DSS), is a proven method for achieving this objective. In this study, precision irrigation is implemented through an automated drip system equipped with soil-moisture sensors and managed by a DSS, enabling remote configuration and real-time monitoring. While DSS are widely used to optimize irrigation, improve water use efficiency, and support decision-making in various cropping systems, studies on their application to energy crops remain limited, as most systems are designed for food crops or specific regions [15,16].
1.2. Irrigation in Short Rotation Coppice (SRC) Systems
Irrigation is not standard practice in Short Rotation Coppice (SRC) plantations, but it can be beneficial, particularly in Mediterranean regions and areas with limited water resources, to ensure sufficient biomass yield. Studies in Italy and Spain confirm that poplar coppice forests are often irrigated to maintain productivity, with irrigation regimes significantly affecting yield and water-use efficiency [17,18,19]. Bacenetti et al. (2012) observed that precision drip irrigation in Italian SRC poplar plantations increased yields while maintaining water-use efficiency, suggesting that irrigation can be managed sustainably through careful planning [20]. Numerous studies have assessed the sustainability of irrigated SRC systems, focusing on carbon sequestration, greenhouse gas (GHG) balance, soil health and economic viability. Well-managed irrigated SRCs can serve as net carbon sinks, improve degraded soils, and reduce GHG emissions compared to fossil fuels. The economic and environmental sustainability of bioenergy cropping systems is closely linked to carbon sequestration initiatives, which are key components of comprehensive climate change mitigation strategies. These systems facilitate long-term carbon accumulation in both woody biomass and soil organic matter, providing synergistic benefits that extend beyond climate regulation to include ecological integrity, resource efficiency, and socio-economic resilience [19,21]. However, sustainability depends largely on local water availability, crop management, and economic factors. Over-irrigation or poor management can reduce both profitability and environmental benefits [18,19,20].
1.3. Research Gap: Assessment Methods and Knowledge Limitations
Evaluating water consumption in agricultural production is crucial for effectively addressing water scarcity and promoting sustainable agricultural development strategies that also prioritize freshwater conservation. The Water Footprint (WF) framework represents the most comprehensive methodological approach for quantifying the appropriation of water resources by anthropogenic activities in order to analyze and quantify water use, both directly and indirectly embodied in goods and services [5,22]. However, the “Available Water Remaining” (AWARE) indicator—which measures the water remaining per unit of surface in a watershed relative to the world average after human and ecosystem demands are met—is now the recommended approach for assessing water consumption impacts [23]. To evaluate irrigation sustainability, integrated economic and environmental assessments are essential. These evaluations are particularly significant for farmers, investors, and policymakers to determine whether investments or policy actions are required to ensure the long-term viability and profitability of irrigation practices. Moreover, these assessments help safeguard natural resources and promote resilience against climate variability. Despite the growing adoption of precision irrigation technologies, research addressing their combined economic and environmental implications in Short Rotation Coppice (SRC) systems remains scarce. Existing studies have primarily focused on yield responses or water-use efficiency. Integrated assessments that quantify both profitability and water scarcity impacts under different irrigation regimes are limited. This gap is particularly critical in Mediterranean contexts, where water resources are limited and economic viability significantly impacts management decisions.
1.4. Research Objectives and Innovation Points
This study addresses two key questions. The primary objective is to examine poplar biomass growth responses to variable irrigation water distribution. The secondary objective is to evaluate both the economic and environmental sustainability of irrigation water use in this plantation. The innovative aspect of this study lies in the ability to analyze the effects of different irrigation treatments, administered via sensor-based precision control systems monitoring soil moisture content, on standing trees biomass growth annually over a 15-year period, regardless of cutting cycles. Economic and environmental sustainability were determined by considering the average annual impact, allowing us to evaluate the effectiveness of treatments over time and to identify the break-even point alongside and the point of maximum economic and environmental sustainability.
2. Materials and Methods
2.1. Experimental Design
The study analyzed the relationship between irrigation water supplied by an automated drip irrigation system and the growth response of a SRC poplar plantation subjected to different levels of water supply throughout the growing season. The experimental design followed a completely randomization scheme, including a non-irrigated control (T0) and four irrigation treatments (T1–T4), each replicated four times. The study area, located at the CREA research station in Monterotondo (Rome, Italy), was approximately 600 m2 and consisted of four 48 m rows. Planting density was 3330 trees per ha−1, with a spacing of 3 m between rows and 1 m within rows. Each row was divided into four blocks of 12 trees each. The drip irrigation system used 16 mm diameter drip-line pipes with drippers spaced 40 cm apart. The system was managed by an “Idrosat” control unit (Idrobit srl, Rome, Italy) capable of simultaneously controlling 30 programs and 96 sectors. The control unit was connected to a Wi–Fi network and an internet portal, which allowed the seasonal irrigation activity to be programmed remotely. Program settings were configured through a 4.3″ touchscreen interface. It was complete with a GSM modem capable of sending and receiving preset SMS (Short Message Service) alarms and/or system status checks. Four solenoid valves connected to the control unit, activated irrigation in different sectors based on the soil moisture readings from four soil-moisture sensors placed 25 cm deep near the roots at the head of each treatment block. The system activated irrigation when soil moisture fell below the threshold (T1 ≤ 20%; T2 ≤ 30%; T3 ≤ 40%; T4 ≤ 50% of the soil moisture content [15]), and to cease once the preset maximum was reached. T1 had the minimum water irrigation, representing an emergency irrigation level to avoid excessive water stress. The analysis was conducted on data recorded during the first six vegetative seasons of the trial (2019–2024). The economic analysis was based on previous data from which an analysis relating to an entire life cycle established in 15 years was then extrapolated. The technical parameters used for environmental and economic analysis are reported in Table 1, which details the irrigation system’s operating time, the corresponding water volumes supplied, and the estimated average biomass yield for each treatment per hectare per year.
Table 1.
(a) Time of irrigation per treatment (h ha−1 year−1); (b) Water volumes supplied per treatment (m3 ha−1 year−1); (c) Estimation of biomass yield per year (Mg ha−1 year−1).
The estimate of the biomass produced per hectare was carried out by initially applying the following Formula (1) proposed by [15] that determines the average weight of the single tree:
where: W, tree average weight (kg tree−1); DBH, diameter at breast height (cm); H, tree height (m); S, shape coefficient (0.50 ÷ 0.52); D, density coefficient (0.80 ÷ 0.81); B, branches coefficient (1.12 ÷ 1.16).
Subsequently, to obtain the total biomass per hectare, the following Formula (2) was applied:
where: Wha indicates the biomass produced per hectare in Mg ha−1 year−1, W is the average weight of the tree in kg and P represents the planting density equal to 3330 trees ha−1. For standing trees, an average moisture content of 52.27% was used, determined according to EN ISO 18134-2:2017 [24]. Based on this water content, an average biomass energy content of 2.10 kWh kg−1 (7.56 MJ kg−1) was estimated for the standing biomass, following EN ISO 18125:2017 [25]. Poplar growth data over the six-year observation period were subjected to statistical analysis to identify statistically significant differences in growth parameters between treatments. Data were analyzed using a non-parametric Kruskal–Wallis test for independent samples using SPSS 18 statistical software. The TOPSIS (Technique for Order Preference by Similarity to Ideal Solution) multi-criteria decision analysis method [26] was applied to integrate economic (Annual Equivalent Value, AEV) and environmental (Water Scarcity Footprint, WSF) indicators. The indicators were normalized and weighted equally (50% economic and 50% environment) to ensure a neutral approach. Subsequently, the distances from the ideal and anti-ideal solutions were calculated, obtaining the Preferred index (Pi) for each treatment, which was used for the sustainability ranking. Finally, a sensitivity analysis was applied to evaluate the results using different AEV varying the biomass value of the standing poplar plants, considering two additional revenue scenarios for biomass carbon content (€10 Mg C−1 and €30 Mg C−1) [19]. Carbon content (C) in the above- and below-ground biomass was calculated using a coefficient of 0.47 and an average root-to-shoot ratio of 0.56 (0.30–0.89) [19].
2.2. Water Scarcity Footprint (WSF)
(i) Goal and scope definition. The goal of the environmental analysis was to assess and compare the WSF of four irrigation treatments for poplar SRC bioenergy cultivation. The analysis identified environmental “hot spots” that contribute significantly to WSF. The boundary of the supply chains analyzed includes all agricultural processes occurring during a 15-year cultivation cycle. A cultivated area of 1 ha and 1 Mg of fresh biomass (from standing plantations) were used as the functional unit (FU) for comparing the environmental impacts of analyzed treatments. The WSF was assessed from the cradle-to-farm-gate using an attributive approach, following the relative International Standards on LCA methodology, ISO 14040 and ISO 14044:2006 [27,28]. (ii) Life Cycle Environmental Inventory (LCI). Primary data for the life cycle inventory analysis comprised technical details regarding agricultural practices employed during the six-year period of poplar cultivation. These included all material inputs (fertilizer, herbicide, diesel, motor lubricant, unrooted poplar cuttings), water (extracted from on-site wells in Italy), and equipment. Direct emissions, to air, soil and water, generated by these practices were modeled using secondary data from Ecoinvent v.3.1.1 and Agri-footprint v.6.3. A 7 kW electric pump was selected for use in modeling the irrigation phase. Since the available database provided only a 22 kW pump dataset, the impacts related to pump production (materials, manufacturing, transportation, and end-of-life) were scaled by a factor of 7/22. These impacts were then allocated to the annual operating hours of each treatment (Table 1), assuming a 10,000 h pump lifespan. For the irrigation infrastructure, 353 kg of PVC pipes per hectare were considered, assuming a 15-year lifespan. Their impacts were similarly distributed over the average annual operating hours of each treatment. The operational electricity demand (country specific, low voltage) was modeled separately, based on the pump’s rated power, a 75% load factor, and the average annual hours of operation. (iii) Life Cycle Impact Assessment (LCIA). The water consumption impact of irrigated SRC poplar cultivated for energy purposes was calculated using the AWARE method (Available WAter Remaining, v1.2c) [23]. This is a consensus-based indicator for the WSF, recommended by UNEP/SETAC and widely applied in Life Cycle Assessment (LCA) studies of agricultural products. The WSF quantifies the relative amount of water remaining per unit area in a region after satisfying the demands of both human activities and aquatic ecosystems. It is a midpoint indicator expressed in cubic meters world equivalents (m3 world eq.), designed to assess the potential for water deprivation: the lower the remaining water per area, the higher the likelihood of scarcity affecting other users. It represents the amount of available water remaining per area in a region/watershed after the demand of human and aquatic ecosystems has been met. The analysis was implemented within the SimaPro 10.2.0.2 software (PRé Sustainability B.V., Amersfoort, The Netherlands).
2.3. Economic Analysis
The baseline costs encountered for establishing the poplar plantation were kept constant across all irrigation treatments and the non-irrigated control. The initial investment for the drip irrigation system was attributed exclusively to the irrigated treatments (T1–T4), which seem reasonable but might underestimate long-term maintenance nuances. The annual irrigation management costs greatly varied by treatment, primarily driven by the seasonal volume of water applied. In practical terms, the analysis considered two cost components: (i) annual expenses for establishing and managing the poplar grove, and (ii) setup and operational costs of the drip irrigation system. Table 2 summarizes these figures, both plantation and irrigation costs, alongside the estimated average annual cumulative value of standing biomass (€ ha−1 year−1) over a 15-year horizon, across five scenarios (T0–T4). To ensure a conservative evaluation of irrigation and production data and account for future production uncertainties, technical parameters (irrigation hours, water flow rate, and annual biomass production) from the seventh to the fifteenth year were assumed to remain constant, equal to the experimental values observed in the sixth year for each treatment. For the control plot, only plantation costs and one-off emergency irrigation in the first year were included. For the irrigated trials, calculation also factored in installation and yearly management of irrigation system. Revenue was estimated assuming a market price of €20 Mg−1 for standing poplar biomass. The values in Table 2 reflect the mean annual economic value of biomass accumulated up to that point, assuming no prior harvesting. In essence, these figures represent what a farmer might expect as compensation for selling standing trees at that stage of growth, though actual negotiations could differ depending on local market conditions and buyer preferences.
Table 2.
(a) Poplar plantation and irrigation system installation and management costs by treatment; (b) Estimated cumulate value of standing plant biomass. (€ ha−1). Annual costs also include the proportional expense for land restoration and removal of irrigation system materials and landfill disposal.
The economic analysis was developed by applying an analytical methodology that took into account fixed costs (interest and overheads) and variable costs (maintenance and repairs, energy consumption, labor). An analytical methodology based on the calculation of the Life Cycle Cost (LCC) was applied, which uses the Net Present Value (NPV) calculation technique and allows to appropriately and comprehensively evaluate the individual operations and production processes within a supply chain of products or services [16]. The NPV was calculated using the following general Formula (3):
where: NPV is expressed in € ha−1 and calculated for a period of n = 15 years; r is the discount rate; Ri and Ci are the potential revenues (biomass value of standing plants) and costs referred to the i-th year; and Io is the value of the initial investment for the purchase and installation of the irrigation system. The discounting rate r applied was considered equal to 3.56%, as established by the “Ministry of Business and Made in Italy” for the year 2023 (G.U. n. 305 of 31 December 2022). The interest rate on the advanced capital was instead equal to 5% (G.U. N. 292 of 15 December 2022, Decree of 13 December 2022—Ministry of Economy and Finance). The economic analysis was conducted without any planned felling. The biomass value was derived by monitoring the growth of standing trees, recording the increase in growth from year to year. For this reason, the investment and maintenance costs for both the poplar cultivation and the irrigation system were also calculated proportionally for each analyzed year. The NPV was determined on a year-by-year basis; revenues were estimated as the cumulative value of the standing biomass in the i-th year, while costs included initial installation, annual management, and the proportional allocation of land restoration and decommissioning costs (e.g., disposal of irrigation plastics). The cost of soil restoration (RCi-th) attributed to each year (yi-th) of the entire cycle was calculated proportionally to the baseline year using the following Formula (4):
RCi-th = 23.571 yi-th + 126.43
The coefficients for the linear regression formula were derived based on an estimated soil restoration cost of €150 ha−1 in the first year and €480 ha−1 in the 15th year.
The cost for decommissioning and disposing of the irrigation system’s plastics was kept constant across all years; this figure integrated labor costs, landfill fees, and associated transportation expenses.
The other main economic indicator was the Annual Equivalent Value (AEV), used to calculate the subsequent environmental impact indicators. The AEV was calculated for each year using the following Formula (5):
where AEV was expressed in € ha−1 year−1.
3. Results and Discussion
3.1. Experimental Data
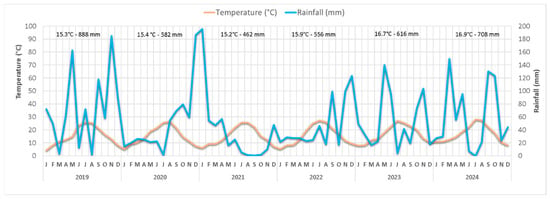
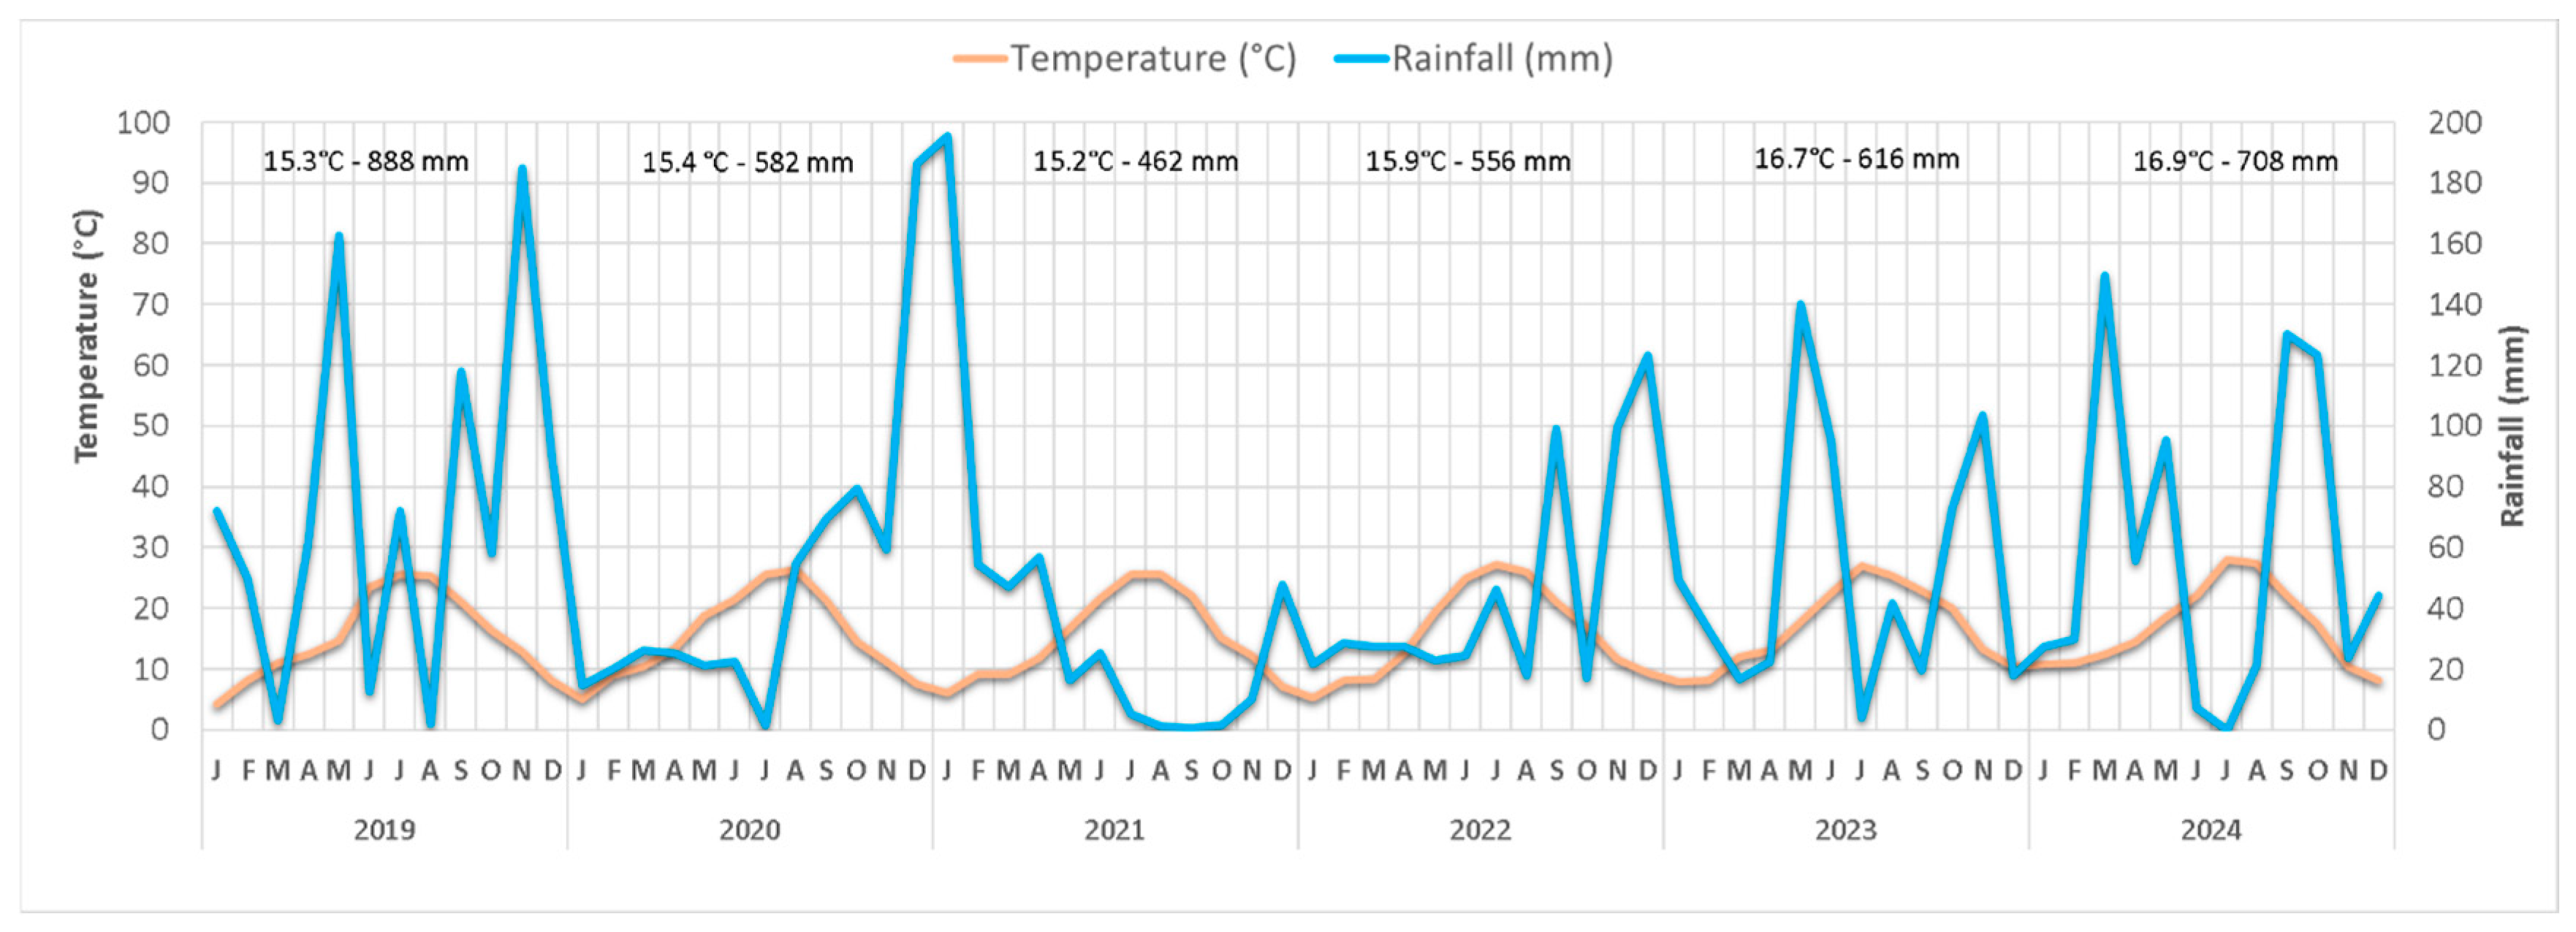
The results refer to the first six growing seasons of the poplar plantation (2019–2024). The climatogram in Figure 1 illustrates the meteorological trends of the study period, highlighting the average temperatures and annual precipitation in the six years. The data show that the driest periods were generally concentrated in July, August, and September.
Figure 1.
Walter-Lieth climatogram over the six years of experimentation (2019–2024).
In Mediterranean and temperate climates, summer drought is a primary constraint on poplar productivity [29]. The highest annual precipitation occurred in 2019 (888 mm), while the lowest was recorded in 2021 (462 mm). Regarding temperature, 2024 was the warmest year with an average of 16.9 °C, whereas 2021 was the coolest at 15.2 °C.
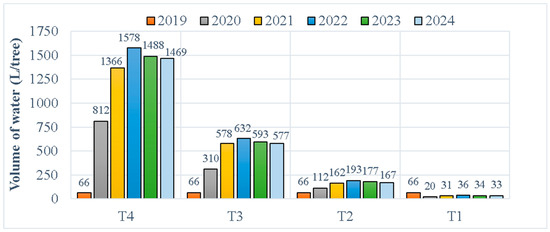
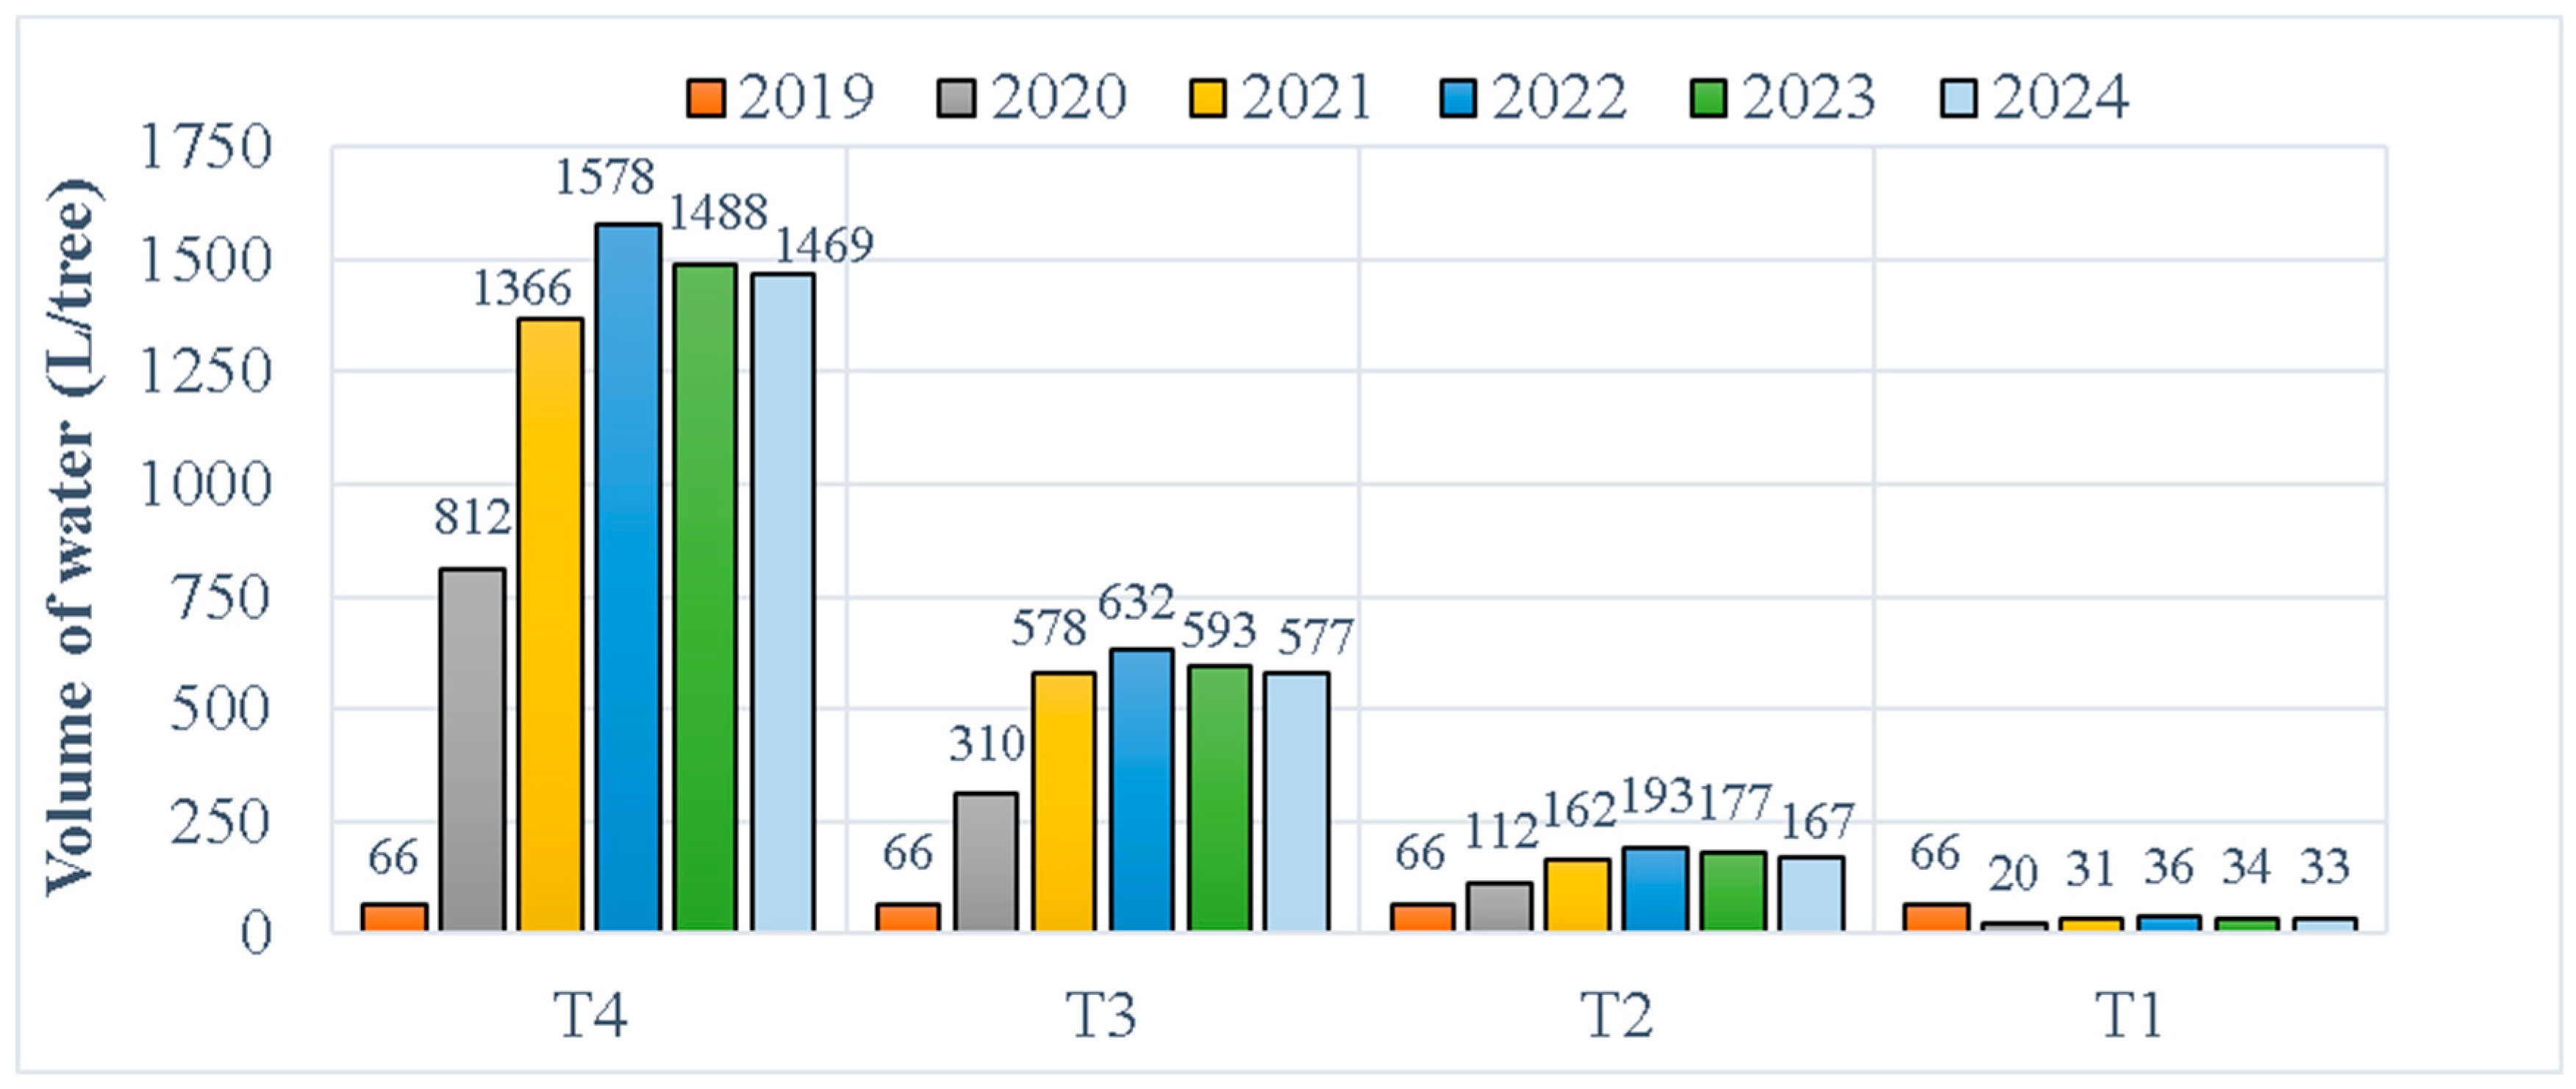
The irrigation volumes supplied during the six growing seasons are shown in Figure 2. The highest water volume, for all treatments, was supplied in 2022 with 1578 L tree−1 for T4, 632 L tree−1 for T3 and 193 L tree−1 for T2 and 36 L tree−1 for treatment T1. In the first year (2019), T1 received its highest supply of 66 L tree−1, which served as an emergency irrigation similar across all experimental treatments.
Figure 2.
Water supplied per tree per year by growing season (2019–2024) and treatment. To simplify the graph, T0 is not represented as it received only an emergency irrigation of 41 L tree−1 during the first year.
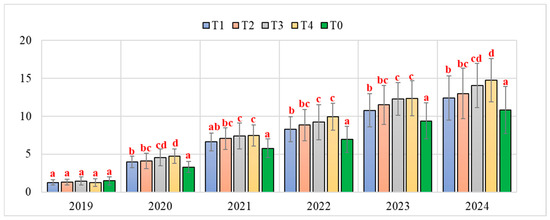
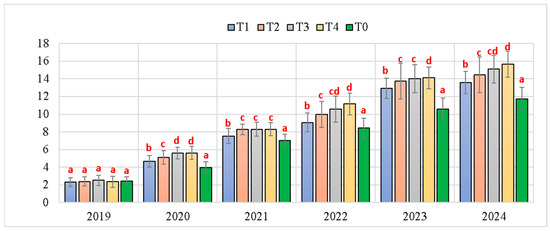
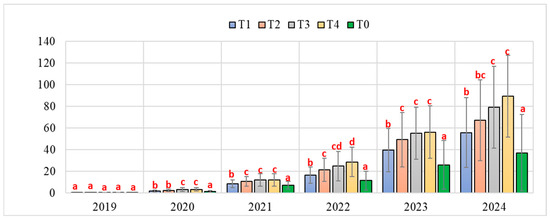
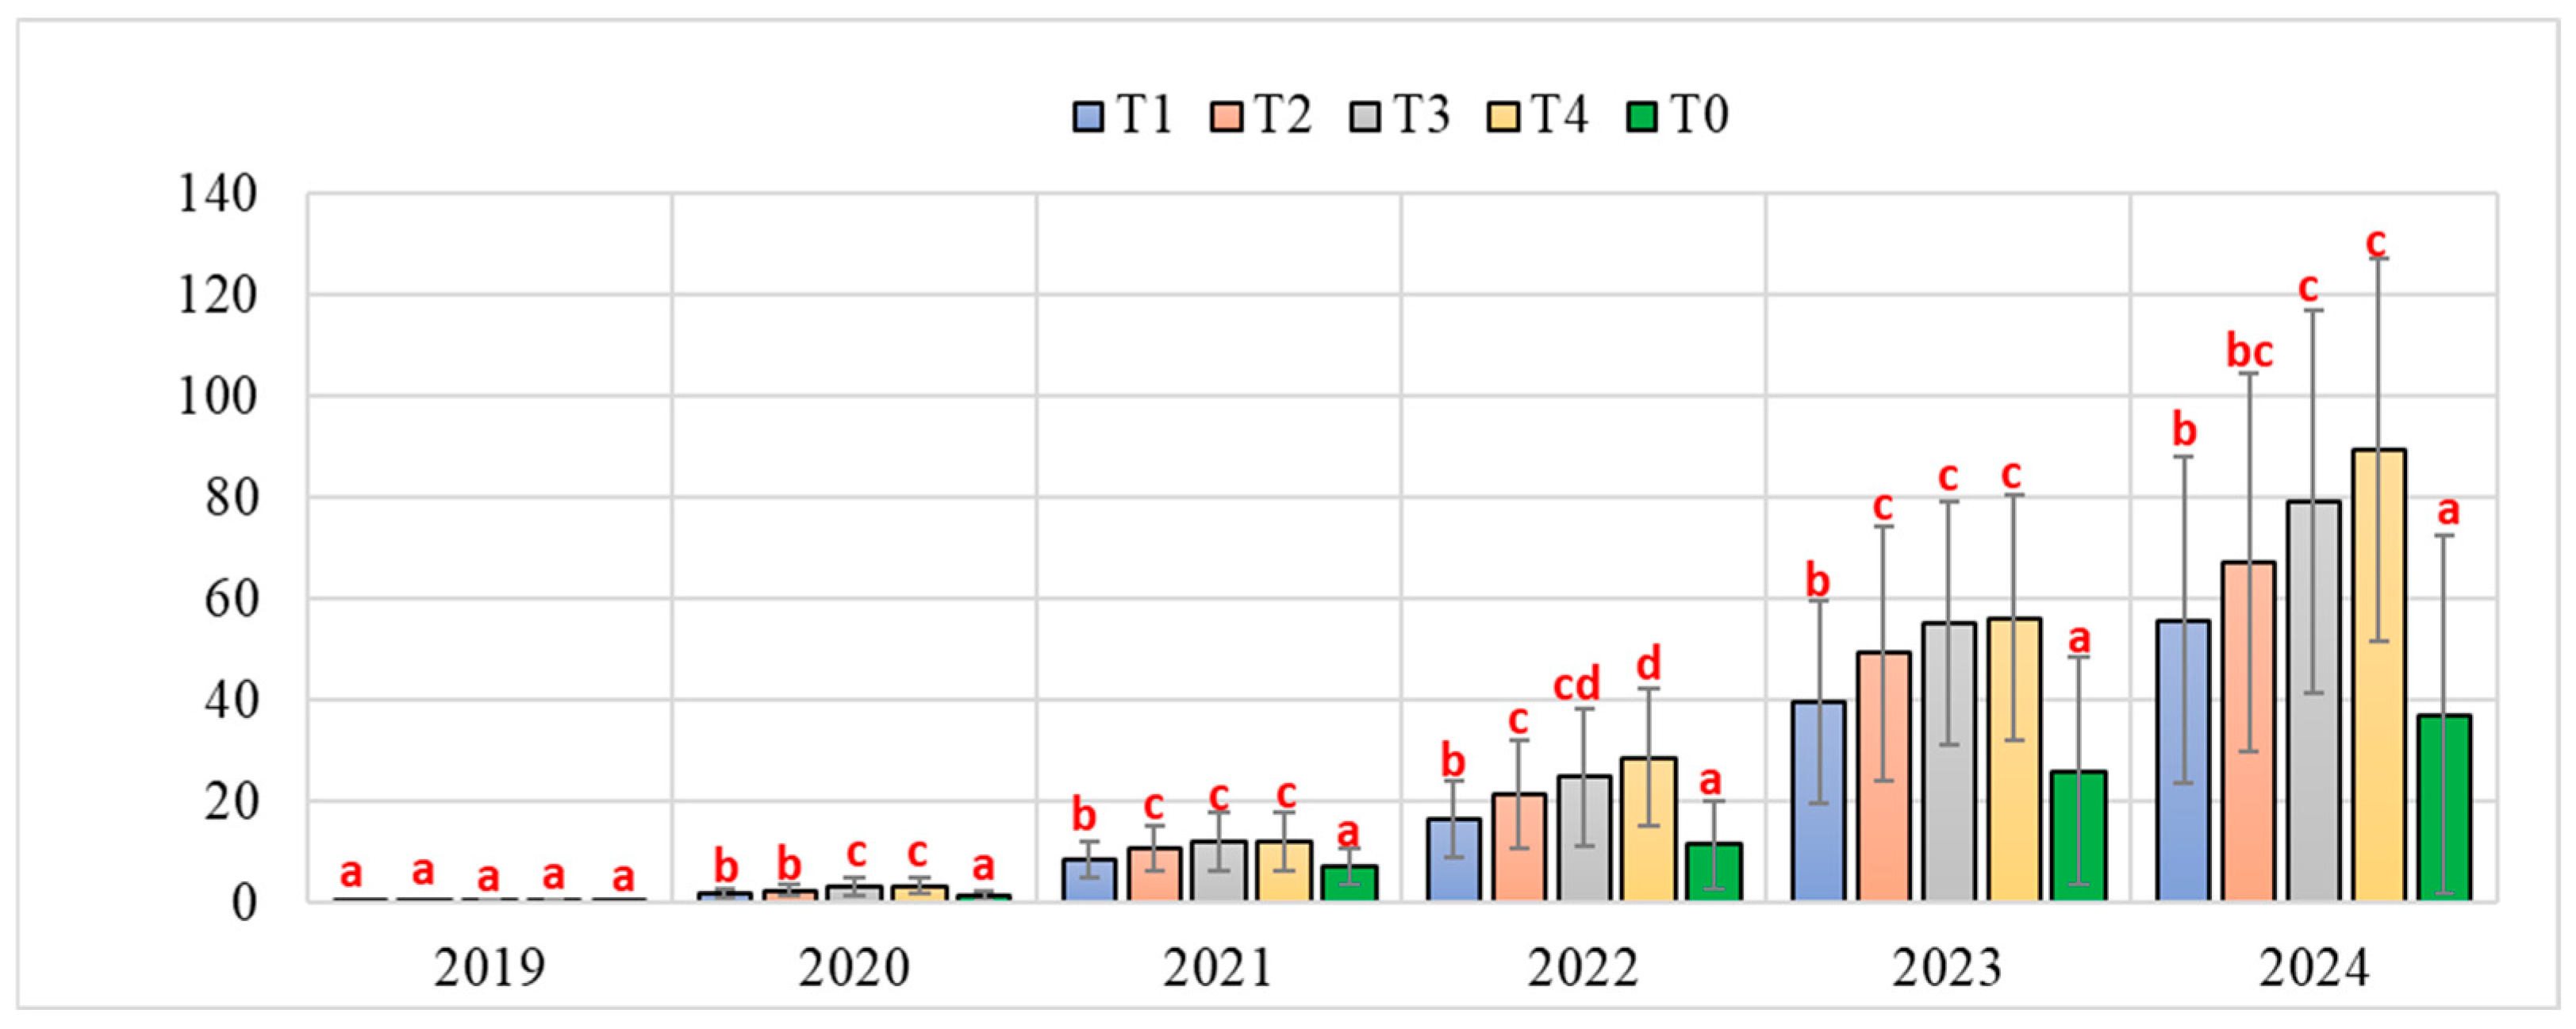
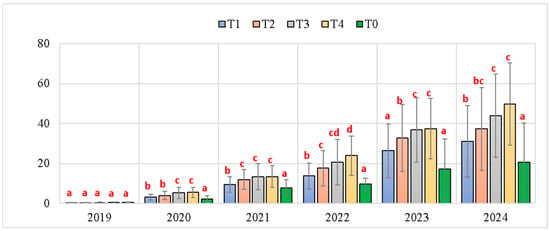
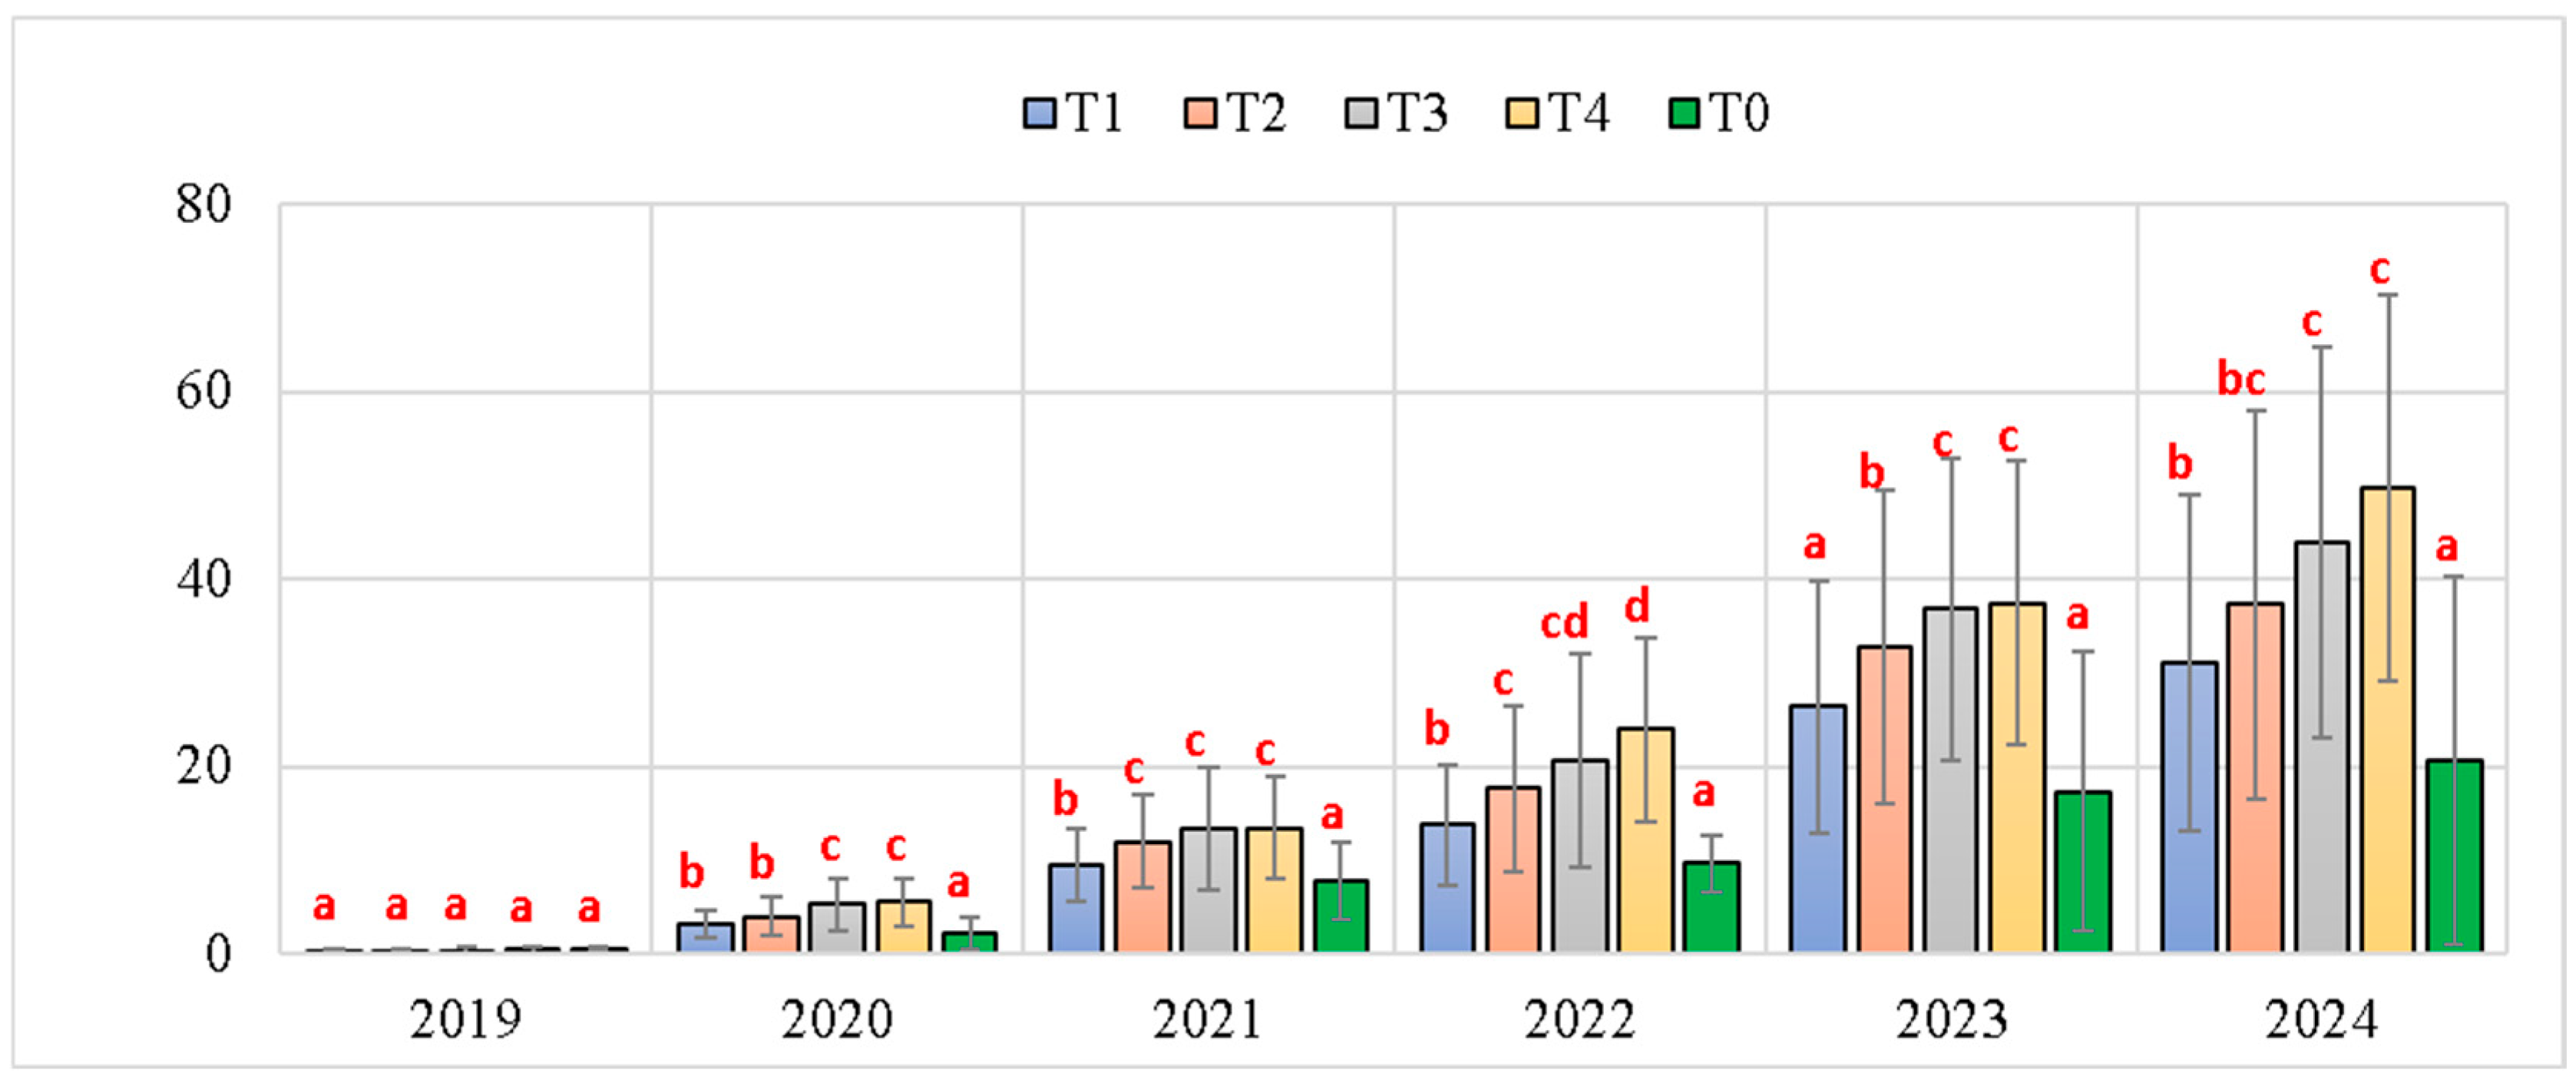
Data analysis revealed variations in diameter (Figure 3), height (Figure 4), weight (Figure 5), and biomass production (Figure 6). Except for the first year, when growth was similar, statistically significant differences were detected between the control (T0) and all other irrigation treatments in the years following planting. For all parameters, T1 differed significantly from T3 and T4, while T3 and T4 remained statistically similar to each other. T2 was almost always different from T4 but often showed similarity to T3. Mean weight per plant ranged from approximately 56 kg (T1) to 89 kg (T4) (Figure 5).
Figure 3.
Mean plant diameter (cm) by growing season and irrigation treatment. Bars represent mean values, and error bars indicate variability around the mean. Different lowercase letters indicate statistically significant differences among irrigation treatments within the same growing season based on a one-way ANOVA followed by stepwise multiple comparison tests (p < 0.05). Treatments sharing the same letter are not significantly different.
Figure 4.
Mean plant height (m) by growing season and irrigation treatment. Bars represent mean values, and error bars indicate variability around the mean. Different lowercase letters indicate statistically significant differences among irrigation treatments within the same growing season based on a one-way ANOVA followed by stepwise multiple comparison tests (p < 0.05). Treatments sharing the same letter are not significantly different.
Figure 5.
Average plant weight (kg) by growing season and irrigation treatment. Bars represent mean values, and error bars indicate variability around the mean. Different lowercase letters indicate statistically significant differences among irrigation treatments within the same growing season based on a one-way ANOVA followed by stepwise multiple comparison tests (p < 0.05). Treatments sharing the same letter are not significantly different.
Figure 6.
Estimated average fresh biomass yield (Mg ha−1 year−1) by growing season and irrigation treatment. Bars represent mean values, and error bars indicate variability around the mean. Different lowercase letters indicate statistically significant differences among irrigation treatments within the same growing season based on a one-way ANOVA followed by stepwise multiple comparison tests (p < 0.05). Treatments sharing the same letter are not significantly different.
The results show that while high water supply (T4) had positive effects on growth, these were not statistically significant compared to treatments with lower irrigation volumes (T2 and T3). This pattern is consistent with recent findings showing Populus growth and water-use efficiency in SRC systems respond non-linearly to water supply [30]. This suggests that productivity gains may diminish once the physiological baseline water demand is met, a result in line with other studies conducted for moderate irrigation strategies in Mediterranean and temperate poplar plantations [31]. Since the biomass estimate per hectare, shown in Figure 6, is derived directly from the weight data, the statistical differences between the various treatments are the same as those reported for the weights. In the sixth year, no significant differences were found between T1 and T2, and between T2, T3 and T4; however, T3 and T4 differed significantly from T1. Average values ranged from 31 Mg ha−1 year−1 (T1) to 50 Mg−1 year−1 (T4).
The results, which were extrapolated from six years of observational data to a 15-year life cycle, did not consider the impact of factors such as climate change, soil degradation and non-linear tree growth on long-term outcomes. These factors are inherently difficult to predict and represent a limitation of the study. To compensate for the uncertainty associated with these uncontrollable factors, we decided to consider a null marginal growth, for years 7 through 15. Although poplar biomass typically continues to increase annually (albeit at a declining rate), this conservative approach ensures that the environmental and economic benefits are not over-estimated.
3.2. WSF of Poplar Plantation
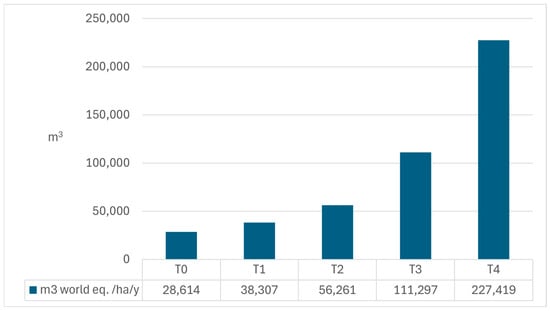
The assessment of the water scarcity footprint (WSF) using the AWARE method highlighted a wide variability in values depending on the irrigation regime applied to poplar plantations over the 15-year crop cycle. The AWARE method quantifies the potential for water deprivation for other users (humans or ecosystems) based on the residual water available per unit of surface area in a given river basin, providing characterization factors expressed in m3 world eq. [23]. The results obtained (Figure 7) show average annual WSF values per hectare ranging from 28,614 m3 world eq.ha−1 year−1 for the control T0 (irrigation limited to the first year after planting) to 227,419 m3 world eq.ha−1 year−1 for treatment T4 (irrigation at 50% of the water deficit). The intermediate treatments T1, T2 and T3 recorded values of 38,307, 56,261 and 111,297 m3 world eq.ha−1 year−1, respectively. These findings demonstrate a progressive increase in pressure on local water resources as irrigation volumes rise.
Figure 7.
WSF of 1 ha of poplar plantation produced in Lazio region (Method: AWARE V1.06).
The biomass produced on the stand for each treatment at the end of the crop cycle (Table 1) allows for an assessment of water-use efficiency in terms of WSF per unit of product. The ratio between WSF and biomass produced demonstrates that, despite having the lowest absolute WSF, the control T0 (1766 m3 world eq.Mg−1) is less efficient in terms of productivity than the moderately irrigated treatment T1 (1584 m3 world eq.Mg−1). This suggests that T1 represents an optimal compromise between environmental sustainability and biomass yield. These results indicate that low irrigation inputs can substantially improve productivity without significantly increasing the environmental footprint. Similar observations have been made by Tao (2019) and Fuertes (2023) [19,32]. In contrast, treatment T2 (1922 m3 world eq.Mg−1) starts showing a decrease in water use efficiency already compared to T0. Furthermore, treatments with high water inputs (T3 and T4) show significantly higher WSF values (3240 and 5913 m3 world eq.Mg−1, respectively) that could prove unsustainable in regional contexts characterized by high water scarcity. Other applications of the AWARE method in agricultural and forestry systems have similarly highlighted how water-intensive biomass production can compromise regional water availability, especially in semi-arid environments [23].
3.3. Economic Feasibility
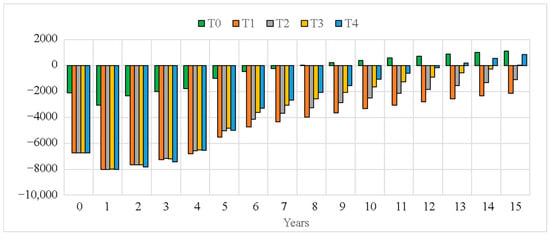
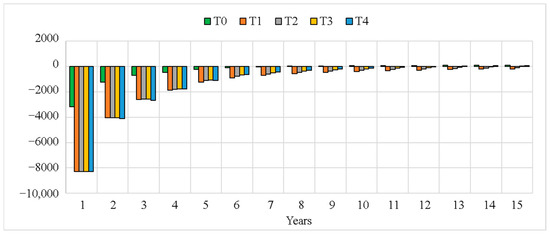
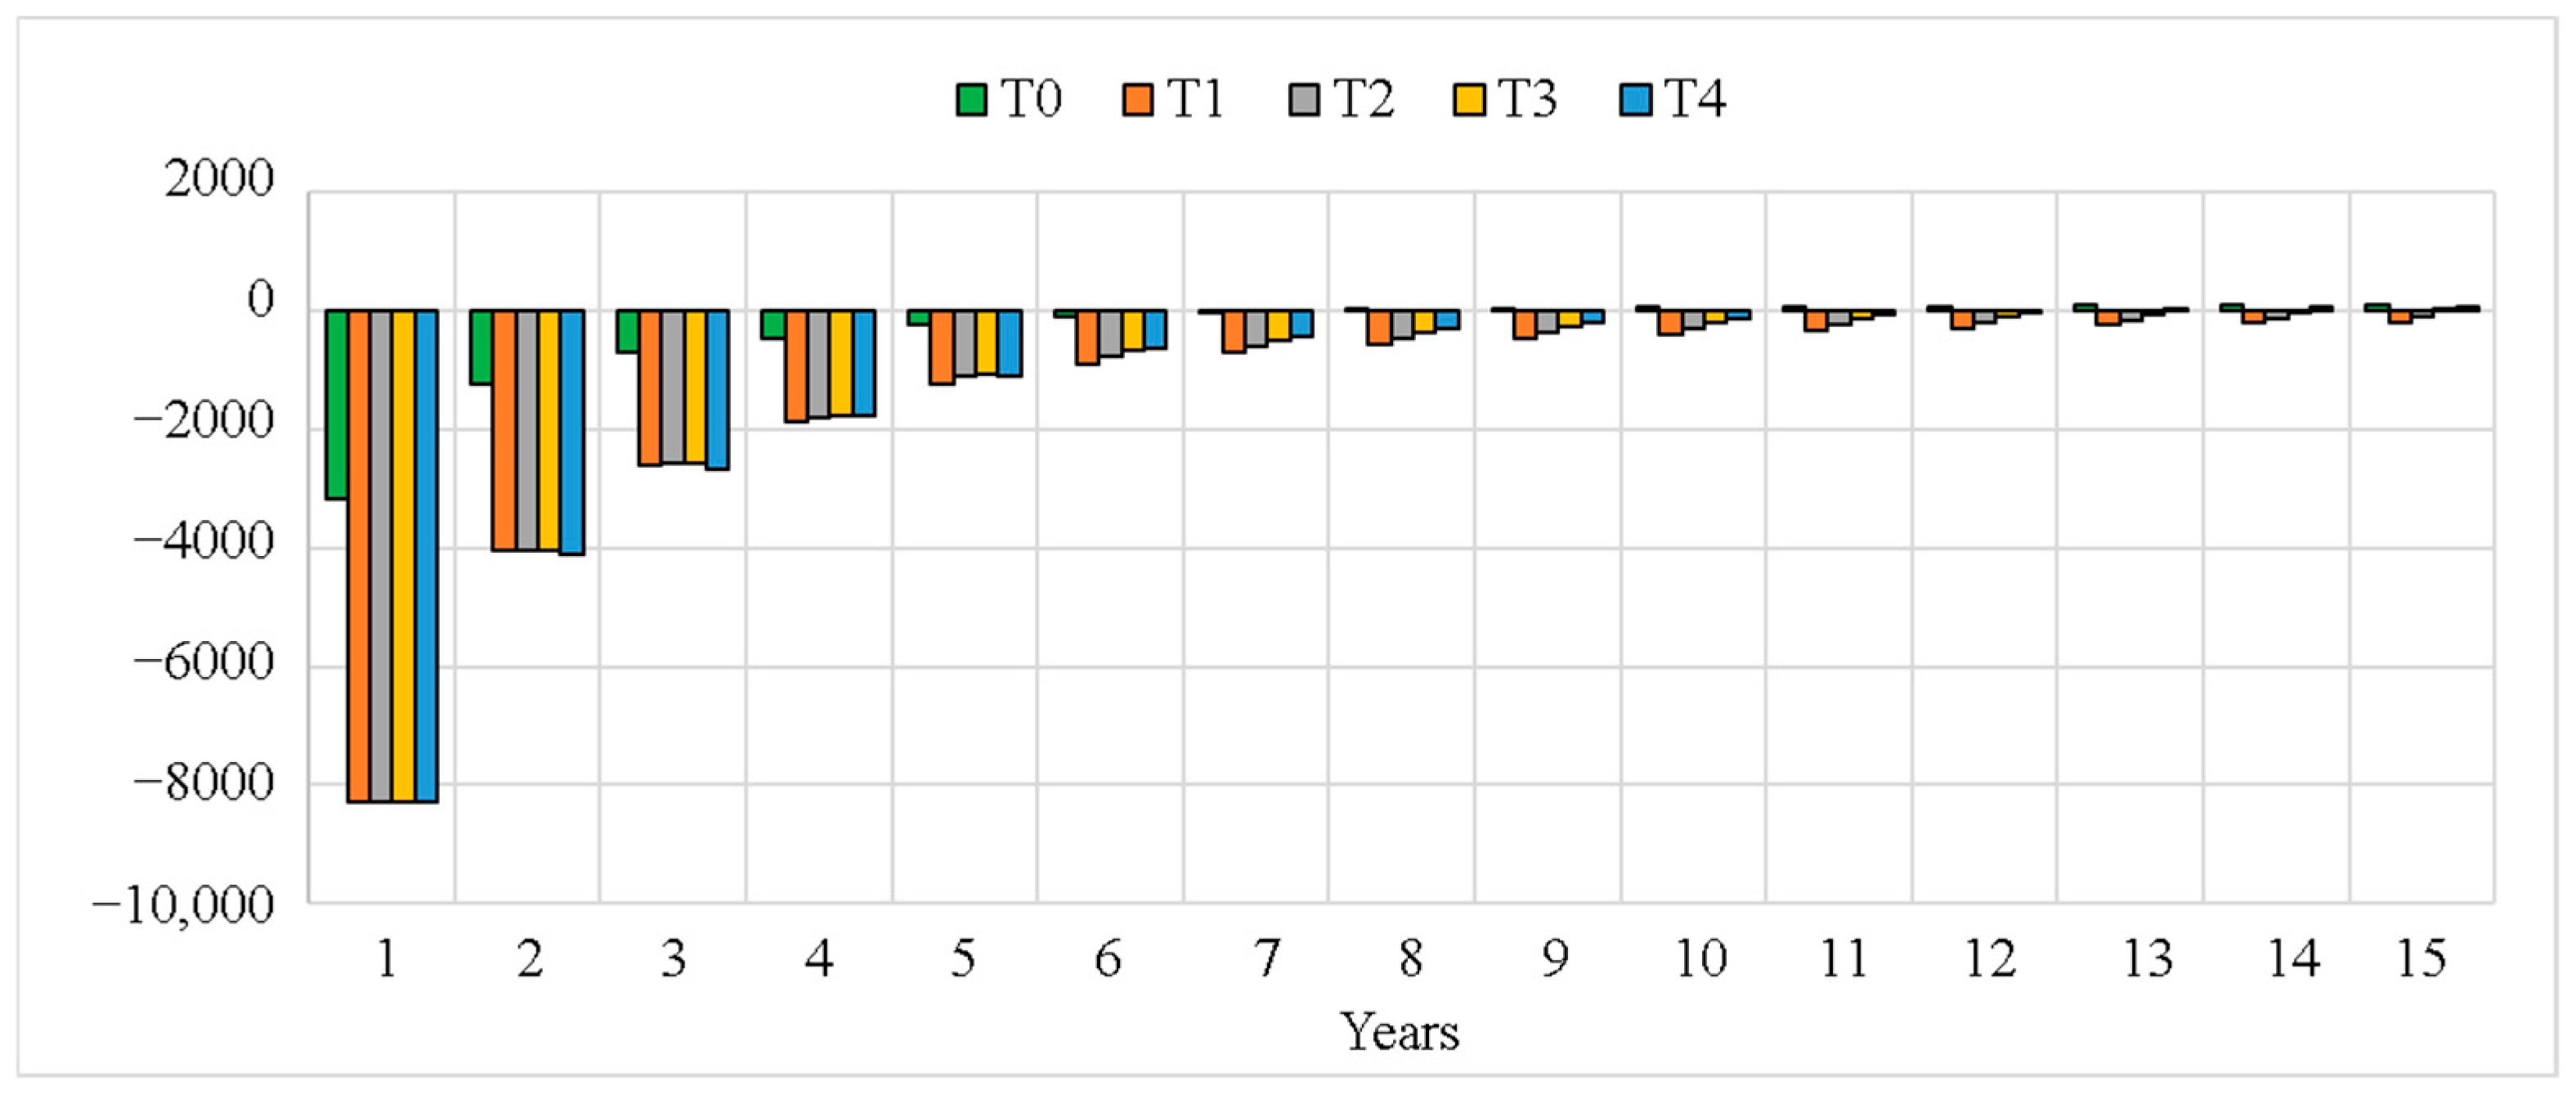
The economic analysis shows that the proposed model produces negative NPVs for all treatments in the initial years of the investment, then switches to positive values for T0, T4 and T3 at the end of the investment (Figure 8). The non-irrigated control (T0) proved to be the most economically viable, with an end-of-cycle NPV of €1135 ha−1, followed by T4 (€861 ha−1), and T3 (€21 ha−1). In contrast, T2 and T1 remained negative at the end of the cycle, reaching −€1067 ha−1 and −€2136 ha−1, respectively. The results for T1 demonstrate that the increase in biomass due to the low-level irrigation is insufficient to offset the added costs of the irrigation system and its operation. This indicates that under current biomass market conditions, the additional production achieved under T1 is insufficient to offset the higher irrigation costs. This finding is consistent with the conclusions of the study by Fuertes et al. (2021) [33], which found that irrigating poplar SRC in Mediterranean conditions can account for a substantial proportion of total costs. The net present value (NPV) increases significantly only under conditions of optimal yield or higher biomass prices [33]. Among the irrigated options, T4 performed best, demonstrating that high-water supply can still exert a positive net economic effect despite the high costs of intensive irrigation.
Figure 8.
Net Present Value (NPV) per hectare (€ ha −1) of the poplar grove irrigated with a drip system across four irrigation treatments. The values account for initial investment, management costs and biomass value over a 15-year period.
The AEV indicator (Figure 9), derived from the previous indicator, also presents the same characteristics, with the best result being T0 (€100 ha−1 year−1), followed by T4 (€76 ha−1 year−1), T3 (€2 ha−1 year−1), T2 (−€94 ha−1 year−1) and, finally, T1 (−€187 ha−1 year−1).
Figure 9.
Annual Equivalent Value (AEV, € ha −1 year −1) of the irrigated poplar grove in relation to the four irrigation treatments, over a 15-year period.
Table 3 shows the biomass and energy values for which the break-even point between production value and costs is reached in the fifteenth year. The non-irrigated control (T0) is the most economically sustainable; it reaches break-even at a production value of €13.70 Mg−1, or 31.5% less than the current value of standing plant biomass, which corresponds to €6.52 MWh−1. In contrast, T1 is the worst treatment, requiring an increase in biomass value to approximately €28 Mg−1 (€13.27 MWh−1) to break-even, which is a 39.4% increase over the current value. T4 is the second most cost-effective treatment after T0, breaking even at approximately €18 Mg−1 (€8.58 MWh−1) or 10% less than the current value.
Table 3.
Variation in market value and energy unit of standing plant biomass to reach break-even points in the fifteenth year, and related percentage variations.
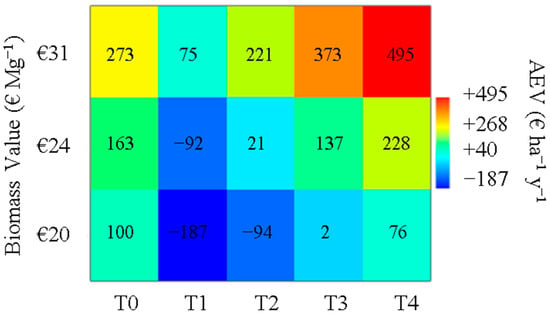
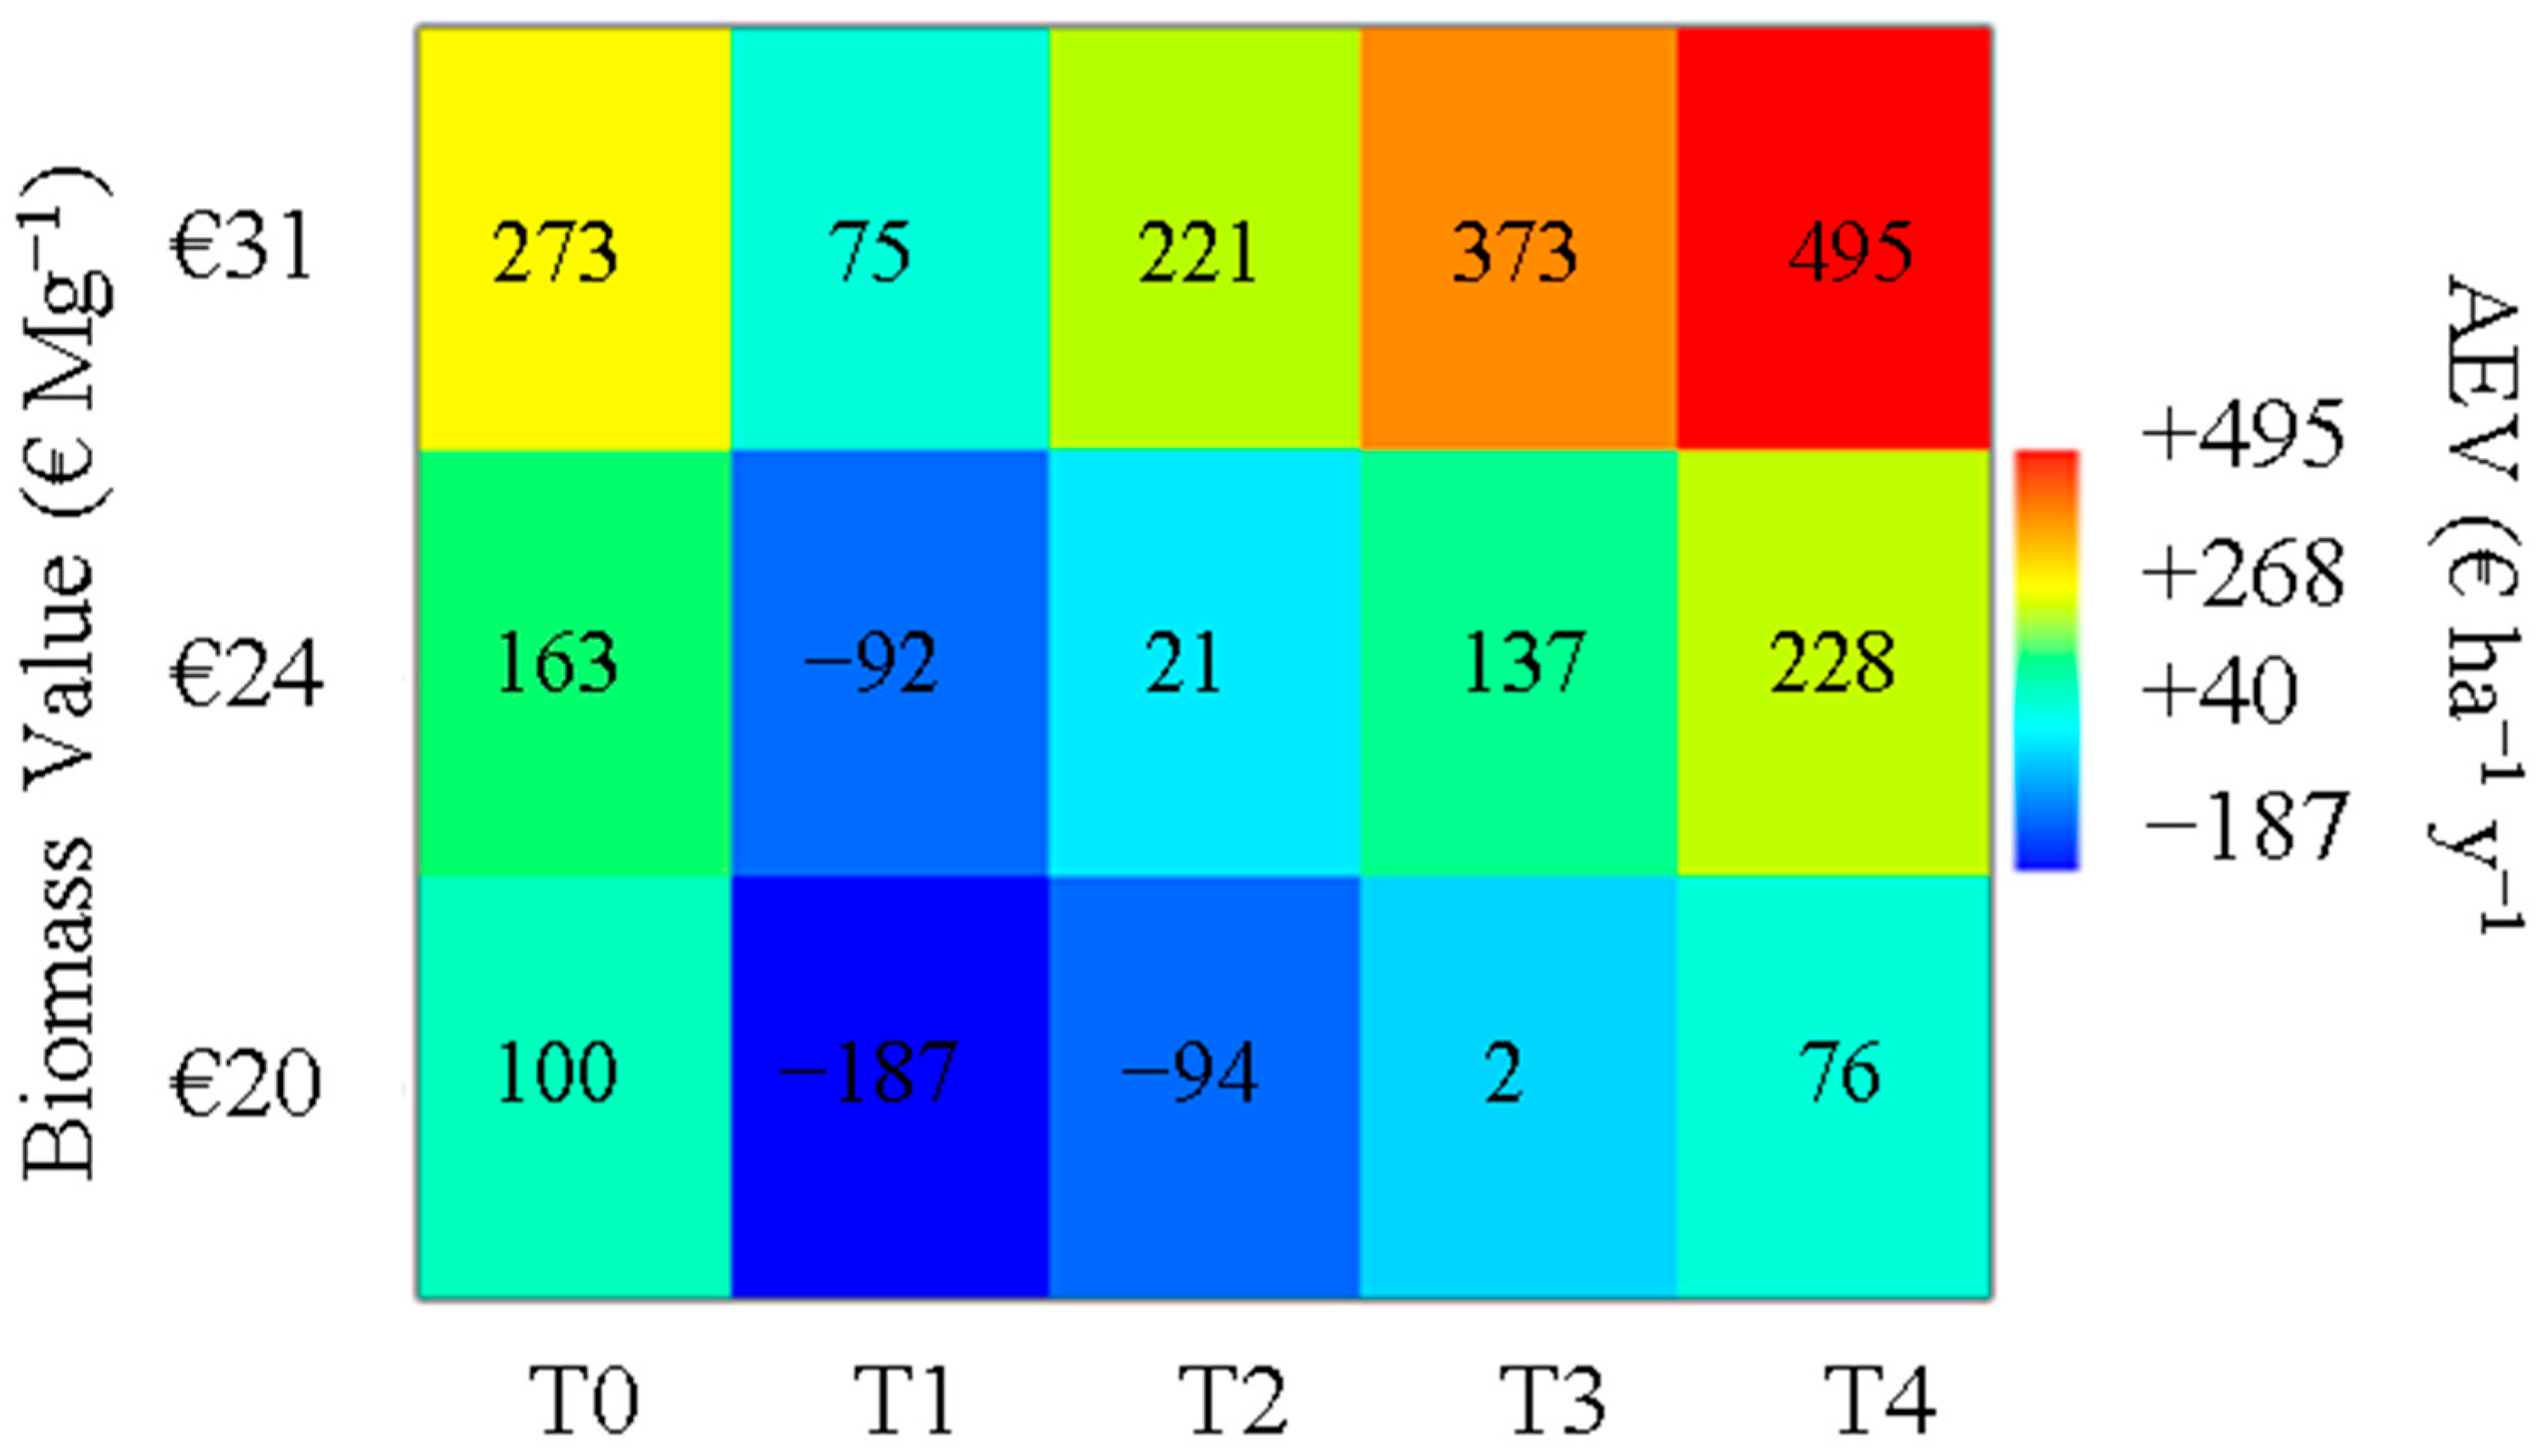
Figure 10 presents the results of the sensitivity analysis, which accounts for the increase in the value of standing plant biomass resulting from the potential use of carbon credits accumulated within the plantation. The minimum increase in biomass value was estimated at approximately €4 Mg−1, corresponding to the lowest market price of carbon credits (€10 MgC−1). Conversely, a maximum increase of €11 Mg−1 was identified, reflecting the highest market price of carbon credits (€30 MgC−1) [19].
Figure 10.
Sensitivity analysis relating to the variation of AEV (€ ha−1 year−1) as a function of biomass value increases, based on the minimum (€4 Mg−1) and maximum (€11 Mg−1) value increase, also considering potential carbon credits, compared to the baseline value of €20 Mg−1, for each treatment.
The economic indicator considered was the AEV, calculated in the fifteenth year. The figure shows that, at the maximum biomass value (€31 Mg−1), the most economically advantageous treatment is T4, followed by T3, T0, T2, and finally T1. At the minimum increase in biomass value (€24 Mg−1), T4 remains the most favorable option, but is closely followed by T0, then T3, T2, and, once again, the least advantageous overall, T1. The graph highlights that treatments subjected to higher irrigation volumes benefit more from the price increase, as the greater production is more highly valued, thereby helping to offset the elevated costs of the irrigation system. Although the values are positive, they remain negligible and, from a farm management perspective, cannot compete with the significantly superior economic performance of alternative crops to poplar—unless incentive mechanisms are introduced to bridge the current gap between the low revenues generated by biomass production and the high costs required to sustain it. According to [19], payment for ecosystem services, such as carbon credits, can shift the economic balance in favor of more productive irrigation treatments.
3.4. Multi-Criteria Analysis
It is important to evaluate economic returns while also considering environmental costs, also through multi-criteria frameworks that integrate socio-economic and ecological dimensions [34]. In this study, the multi-criteria analysis (MCA) was performed using the TOPSIS approach to integrate both economic and environmental dimensions of the system (Table 4). Two criteria were considered in this study: the Annual Economic Value (AEV) and the Water Scarcity Footprint (WSF). AEV captured the yearly net return from the poplar plantation under different irrigation regimes, while WSF expressed the relative pressure exerted on water resources, as assessed through the AWARE method. To account for market uncertainty, three hypothetical selling prices for standing trees were tested representing a baseline (€20 Mg−1) and two potential scenarios (€24, and 31 Mg−1) including additional revenues from the carbon content of the biomass (€10 MgC−1 and €30 MgC−1, respectively [19]. At the lower price assumption (€20 Mg−1), the ranking clearly favored the non-irrigated treatment (T0), which reached the highest preference value (Pi = 1.000). Without irrigation (T0), water usage was significantly reduced, and although productivity was lower, the savings from not having irrigation expenses ensured its economic performance remained relatively high. T0 showed a steady decline in preference, although it remained the most sustainable option overall. Its relative advantage diminished because higher biomass values made irrigation increasingly profitable, partially offsetting the economic penalty of water use. At the other end of the spectrum, the most intensive irrigation (T4) displayed a clear downward trend, indicating that excessive water consumption continued to erode its environmental performance. Even under favorable price conditions, the additional yield failed to compensate for the increase in the Water Scarcity Footprint, confirming that high irrigation levels are difficult to justify in sustainability terms.
Table 4.
Results of the multi-criteria analysis based on the TOPSIS method. Comparison among baseline and additional revenues scenarios from the carbon content of the biomass (balanced weight: AEV = 0.5, WSF = 0.5). The color gradient of Pi ranges from the best-performing alternative (Pi = 1, green) to the worst-performing alternative (Pi = 0, red).
The intermediate treatments demonstrated varied responses. T1 initially emerged as the least preferred option, but it exhibited a gradual improvement as prices increased, indicating that even low irrigation inputs can become economically viable when crop values rise. T2 exhibited a continuous upward trend, eventually reaching a preference level similar to T3 at the highest price scenario. T3 remained relatively stable and consistently ranked among the top-performing irrigated options, suggesting a robust balance between productivity and water efficiency. This is consistent with previous research indicating that moderate water supply levels often achieve the most effective balance between growth and resource use efficiency. Fuertes et al. (2023) observed that while water restriction reduced above- and below-ground biomass, intermediate irrigation could maintain yields while saving substantial amounts of water and energy compared to maximum irrigation levels [19]. The results indicate a gradual shift in the optimal irrigation strategy as economic incentives intensify. The incorporation of market carbon value alters the trade-off balance, favoring moderate irrigation (T2–T3) over extremes. Over irrigation (T4) continues to impose a significant environmental cost, while non-irrigation (T0), though environmentally sound, loses part of its economic appeal when biomass gains become financially viable. In practical terms, irrigating poplar plantations for energy is only feasible if the prices of biomass or carbon payments rise enough to counterbalance the additional environmental impact. Otherwise, in regions with limited water resources, systems that are either non-irrigated or only moderately irrigated are the more sustainable choice. These results suggest a delicate equilibrium between profitability and water sustainability. However, it is important to exercise caution and avoid overinterpretation of the results. The analysis assumes equal weights between AEV and WSF, a simplification that may not reflect real-world priorities. In water-scarce contexts, for instance, the environmental criterion could easily outweigh the economic one. Likewise, if there is uncertainty surrounding the carbon price or future irrigation efficiency, this could result in a change to the ranking. However, the overall pattern is quite indicative: water-saving strategies remain essential unless strong economic signals, such as verified carbon payments, are implemented.
Sensitivity of MCA
To assess the robustness of the results, a sensitivity analysis testing two different alternative weighting scenarios was carried out (Table 5). This included an economic priority scenario (AEV = 0.7, WSF = 0.3) representing contexts where economic returns dominate decision-making and an environmental priority scenario (AEV = 0.3, WSF = 0.7) representing water-scarce regions where environmental sustainability is a priority.
Table 5.
Sensitivity analysis of TOPSIS results under different criterion weighting scenarios in comparison with the balanced scenario (AEV = 0.5, WSF = 0.5).
The sensitivity analysis reveals important patterns in treatment ranking stability and demonstrates how criterion weighting substantially influences the optimal irrigation strategy. Under environmental priority weighting (AEV = 0.3, WSF = 0.7), the non-irrigated treatment (T0) maintains the highest preference across all price scenarios, demonstrating higher stability. At the baseline price (€20 Mg−1), T0 achieves the maximum preference value (Pi = 1.000), reflecting its minimal water consumption and acceptable economic performance. Even as biomass prices increase to €31 Mg−1, T0 remains the most preferred option (Pi = 0.852), although its advantage gradually diminishes as higher prices make the productivity gains from irrigation more economically attractive. Moderate irrigation treatments (T1–T2) show improved performance as prices increase, with T2 reaching Pi = 0.771 at the highest price scenario, suggesting that light irrigation can become acceptable even under environmental priority when economic incentives are strong. Notably, T3 maintains relatively stable preference values (0.596–0.614) across price scenarios, indicating it represents a middle ground that balances water use with productivity. Most significantly, intensive irrigation (T4) consistently performs poorly under environmental priority, with preference declining from Pi = 0.380 at baseline to Pi = 0.250 at the highest price. This pattern confirms that high water consumption cannot be justified from a sustainability perspective in water-limited contexts, regardless of economic incentives. The environmental penalty of T4’s water footprint consistently outweighs its productivity advantages when environmental criteria are prioritized. When economic criteria dominate (AEV = 0.7, WSF = 0.3), the treatment rankings shift substantially. T0 still leads at baseline prices (Pi = 1.000) due to the absence of irrigation costs, but its preference drops markedly as prices increase, reaching Pi = 0.579 at €31 Mg−1. This decline reflects that higher biomass values amplify the economic significance of productivity differences, making the yield losses from non-irrigation increasingly costly. Under economic priority, intensive irrigation treatments become much more competitive. T4 achieves high preference values at lower prices (Pi = 0.761 at €20 Mg−1 and Pi = 0.753 at €24 Mg−1), demonstrating that when environmental concerns receive lower weight, the productivity benefits of intensive irrigation can justify its costs. However, even under economic priority, T4’s preference declines at the highest price (Pi = 0.645), as the substantial water costs begin to erode profitability despite elevated revenues. Remarkably, T3 emerges as the most preferred irrigated treatment under economic priority at medium and high prices (Pi = 0.700 and 0.678, respectively), suggesting it achieves an optimal balance between productivity gains and resource costs when economic considerations dominate. This finding indicates that even when prioritizing economic returns, moderate rather than intensive irrigation represents the most efficient strategy at elevated biomass prices. A particularly notable finding across all weighting scenarios is the robust performance of moderate irrigation treatments (T2–T3). While T0 consistently leads under environmental priority and T4 performs better under economic priority, T2 and especially T3 maintain relatively stable and competitive preference values across both weighting extremes and all price scenarios. T3 demonstrates remarkable consistency, with preference values ranging from 0.596 to 0.678 across the six environmental-priority scenarios and 0.654 to 0.700 across the economic-priority scenarios.
4. Conclusions
The objectives of this study were to examine the production responses of a biomass poplar plantation subjected to different irrigation levels and to assess the economic and environmental sustainability of water use. Moving from the non-irrigated control (T0) to the T4 treatment (maximum water supply), significant increases in productivity were observed; however, economic and environmental evaluations revealed critical issues. Under the experimental conditions considered, T0 emerged as the most sustainable option. This outcome is primarily due to the current low market value of biomass and the high direct and indirect costs associated with irrigation infrastructure and management. Higher irrigation levels, such as T3 and T4, only become economically viable if biomass market prices rise, through, for instance, carbon credit revenues. Nevertheless, even with such additional income, profitability remains insufficient to guarantee competitive farm returns without external subsidies or major market shifts. Overall, the trend indicates that water-saving strategies remain central unless strong economic signals, such as verified carbon payments, come into play. In other words, higher biomass prices and carbon payments make moderate irrigation the most reasonable compromise between profitability and water sustainability, suggesting that external incentives like carbon credits in poplar plantations could provide farmers with an additional income source while indirectly promoting more efficient water management. The increased valuation of biomass based on carbon content should be updated using the latest market data to ensure more reliable results. These findings highlight the need for future studies that incorporate dynamic economic scenarios and long-term environmental variability to further refine irrigation sustainability assessments. Future work should focus on full-rotation SRC datasets and dynamic modeling approaches that reflect real long-term variability in climate, growth patterns, and soil conditions, thereby reducing uncertainties associated with extrapolated multi-year projections.
Author Contributions
Conceptualization, G.S., R.T., A.S., A.A.; methodology G.S. and A.S.; formal analysis G.S. and A.S.; data curation, G.S., A.A., R.T., M.P., C.C., V.C., A.S.; writing—original draft preparation, G.S., A.S., A.A.; writing—review and editing, G.S., A.S., A.A., M.P., V.C., R.T., C.C.; visualization: G.S. and A.S.; funding acquisition: R.T. and A.S. All authors have read and agreed to the published version of the manuscript.
Funding
This research was funded by Italian Ministry of Agriculture, Food and Forestry Policies (MiPAAF), grant D.D. n. 26329, 1 April 2016, project AGROENER “Energia dall’agricoltura: innovazioni sostenibili per la bioeconomia” and by the Cascading Grant of the Extended Partnership “Network 4 Energy Sustainable Transition—NEST”, under the call “Bioenergy & New Biofuels for Sustainable Future” (CUP: I53C22001450006), Spoke 3: University of Pisa.
Institutional Review Board Statement
Not applicable.
Informed Consent Statement
Not applicable.
Data Availability Statement
The data will be available upon request.
Acknowledgments
In the course of preparing the present manuscript, the authors utilized Copilot v. 2.20260101.44.0 (Microsoft) and ChatGPT v.5.0 (OpenAI) to rewrite sections of the text in order to render it more fluid and readable. This process served to enhance the grammar, structure, spelling and readability of the original text. The authors have reviewed and edited the output and accept full responsibility for the content of this publication.
Conflicts of Interest
The authors declare no conflicts of interest.
Glossary
| AEV | Annual Equivalent Value: annualized economic indicator derived from the Net Present Value (NPV) to compare yearly costs and revenues. |
| AWARE | Available Water Remaining: water scarcity indicator recommended by UNEP/SETAC for Life Cycle Assessment (LCA), expressing the potential for water deprivation. |
| DBH | Diameter at Breast Height: standard dendrometric measure of tree diameter taken at 1.3 m above ground. |
| DSS | Decision Support System: computer-based system used to optimize irrigation scheduling based on sensor data. |
| FU | Functional Unit: reference unit used in LCA to enable comparison of environmental impacts. |
| GHG | Greenhouse Gases: gases contributing to the greenhouse effect (e.g., CO2, CH4). |
| LCA | Life Cycle Assessment: methodology to assess environmental impacts associated with all stages of a product’s life cycle. |
| LCI | Life Cycle Inventory: compilation of all inputs and outputs (materials, energy, emissions) within an LCA. |
| LCIA | Life Cycle Impact Assessment: phase of LCA converting inventory flows into environmental impact indicators. |
| LCC | Life Cycle Costing: economic assessment method evaluating all costs over the life cycle of a system. |
| NPV | Net Present Value: discounted value of cumulative costs and revenues over time. |
| Pi | Preference Index: indicator derived from the TOPSIS multi-criteria method, representing the relative sustainability ranking of each treatment. |
| PVC | Polyvinyl Chloride: material used for irrigation pipes. |
| SRC | Short Rotation Coppice: intensive plantation system with short harvest cycles for biomass production. |
| TOPSIS | Technique for Order Preference by Similarity to Ideal Solution: multi-criteria decision-making method used to rank alternatives. |
| WSF | Water Scarcity Footprint: environmental indicator expressing the potential contribution to water scarcity, calculated using AWARE. |
References
- Lovarelli, D.; Bacenetti, J.; Fiala, M. Water Footprint of Crop Productions: A Review. Sci. Total Environ. 2016, 548–549, 236–251. [Google Scholar] [CrossRef] [Scilit] [PubMed]
- Lee, Y.-J. Land, Carbon and Water Footprints in Taiwan. Environ. Impact Assess. Rev. 2015, 54, 1–8. [Google Scholar] [CrossRef] [Scilit]
- Hoekstra, A.Y. Water Scarcity Challenges to Business. Nat. Clim. Chang. 2014, 4, 318–320. [Google Scholar] [CrossRef] [Scilit]
- Hoekstra, A.Y. A Critique on the Water-Scarcity Weighted Water Footprint in LCA. Ecol. Indic. 2016, 66, 564–573. [Google Scholar] [CrossRef] [Scilit]
- Hoekstra, A.Y. Water Footprint Assessment: Evolvement of a New Research Field. Water Resour. Manag. 2017, 31, 3061–3081. [Google Scholar] [CrossRef] [Scilit]
- Zhai, Y.; Zhang, T.; Ma, X.; Shen, X.; Ji, C.; Bai, Y.; Hong, J. Life Cycle Water Footprint Analysis of Crop Production in China. Agric. Water Manag. 2021, 256, 107079. [Google Scholar] [CrossRef] [Scilit]
- Finogenova, N.; Dolganova, I.; Berger, M.; Núñez, M.; Blizniukova, D.; Müller-Frank, A.; Finkbeiner, M. Water Footprint of German Agricultural Imports: Local Impacts Due to Global Trade Flows in a Fifteen-Year Perspective. Sci. Total Environ. 2019, 662, 521–529. [Google Scholar] [CrossRef] [Scilit] [PubMed]
- Ma, W.; Meng, L.; Wei, F.; Opp, C.; Yang, D. Spatiotemporal Variations of Agricultural Water Footprint and Socioeconomic Matching Evaluation from the Perspective of Ecological Function Zone. Agric. Water Manag. 2021, 249, 106803. [Google Scholar] [CrossRef] [Scilit]
- Wang, Q.; Huang, K.; Liu, H.; Yu, Y. Factors Affecting Crop Production Water Footprint: A Review and Meta-Analysis. Sustain. Prod. Consum. 2023, 36, 207–216. [Google Scholar] [CrossRef] [Scilit]
- Xu, Y.; Huang, K.; Yu, Y.; Wang, X. Changes in Water Footprint of Crop Production in Beijing from 1978 to 2012: A Logarithmic Mean Divisia Index Decomposition Analysis. J. Clean. Prod. 2015, 87, 180–187. [Google Scholar] [CrossRef] [Scilit]
- Pastor, A.V.; Palazzo, A.; Havlik, P.; Biemans, H.; Wada, Y.; Obersteiner, M.; Kabat, P.; Ludwig, F. The Global Nexus of Food–Trade–Water Sustaining Environmental Flows by 2050. Nat. Sustain. 2019, 2, 499–507. [Google Scholar] [CrossRef] [Scilit]
- Liu, J.; Yang, H.; Gosling, S.N.; Kummu, M.; Flörke, M.; Pfister, S.; Hanasaki, N.; Wada, Y.; Zhang, X.; Zheng, C.; et al. Water Scarcity Assessments in the Past, Present, and Future. Earths Future 2017, 5, 545–559. [Google Scholar] [CrossRef] [Scilit] [PubMed]
- Kahil, M.T.; Dinar, A.; Albiac, J. Modeling Water Scarcity and Droughts for Policy Adaptation to Climate Change in Arid and Semiarid Regions. J. Hydrol. 2015, 522, 95–109. [Google Scholar] [CrossRef] [Scilit]
- Yu, H.; Liu, K.; Bai, Y.; Luo, Y.; Wang, T.; Zhong, J.; Liu, S.; Bai, Z. The Agricultural Planting Structure Adjustment Based on Water Footprint and Multi-Objective Optimisation Models in China. J. Clean. Prod. 2021, 297, 126646. [Google Scholar] [CrossRef] [Scilit]
- Sperandio, G.; Pagano, M.; Acampora, A.; Civitarese, V.; Cedrola, C.; Mattei, P.; Tomasone, R. Deficit Irrigation for Efficiency and Water Saving in Poplar Plantations. Sustainability 2022, 14, 13991. [Google Scholar] [CrossRef] [Scilit]
- Sperandio, G.; Suardi, A.; Acampora, A.; Civitarese, V. Eco-Efficiency of Pellet Production from Dedicated Poplar Plantations. Energies 2024, 17, 3137. [Google Scholar] [CrossRef] [Scilit]
- Paris, P.; Di Matteo, G.; Tarchi, M.; Tosi, L.; Spaccino, L.; Lauteri, M. Precision Subsurface Drip Irrigation Increases Yield While Sustaining Water-Use Efficiency in Mediterranean Poplar Bioenergy Plantations. Ecol. Manag. 2018, 409, 749–756. [Google Scholar] [CrossRef] [Scilit]
- Alesso, S.P.; Tapias, R.; Alaejos, J.; Fernández, M. Biomass Yield and Economic, Energy and Carbon Balances of Ulmus Pumila L., Robinia pseudoacacia L. and Populus × euroamericana (Dode) Guinier Short-Rotation Coppices on Degraded Lands under Mediterranean Climate. Forests 2021, 12, 1337. [Google Scholar] [CrossRef] [Scilit]
- Fuertes, A.; Oliveira, N.; Cañellas, I.; Sixto, H.; Rodríguez-Soalleiro, R.; Hanewinkel, M.; Sperlich, D. Assessing the Potential of Poplar Short Rotation Plantations to Contribute to a Low-Carbon Bioeconomy under Water-Limited Conditions. J. Environ. Manag. 2023, 347, 119062. [Google Scholar] [CrossRef] [Scilit]
- Bacenetti, J.; González-García, S.; Mena, A.; Fiala, M. Life Cycle Assessment: An Application to Poplar for Energy Cultivated in Italy. J. Agric. Eng. 2012, 43, 11. [Google Scholar] [CrossRef]
- Grafton, R.Q.; Chu, H.L.; Nelson, H.; Bonnis, G. A Global Analysis of the Cost-Efficiency of Forest Carbon Sequestration; OECD Environment Working Papers, No. 185; OECD Publishing: Paris, France, 2021. [Google Scholar]
- Hoekstra, A.Y.; Mekonnen, M.M. The Water Footprint of Humanity. Proc. Natl. Acad. Sci. USA 2012, 109, 3232–3237. [Google Scholar] [CrossRef] [Scilit] [PubMed]
- Boulay, A.-M.; Bare, J.; Benini, L.; Berger, M.; Lathuillière, M.J.; Manzardo, A.; Margni, M.; Motoshita, M.; Núñez, M.; Pastor, A.V.; et al. The WULCA Consensus Characterization Model for Water Scarcity Footprints: Assessing Impacts of Water Consumption Based on Available Water Remaining (AWARE). Int. J. Life Cycle Assess. 2018, 23, 368–378. [Google Scholar] [CrossRef] [Scilit]
- NSAI.ISO ISO 18134-2:2017; Solid Biofuels—Determination of Moisture Content—Oven Dry Method—Part 2: Total Moisture—Simplified Method. ISO: Geneva, Switzerland, 2017.
- EN ISO 18125:2017; Solid Biofuels—Determination of Calorific Value. British Standards Institution: London, UK, 2017; p. 56.
- Papathanasiou, J.; Ploskas, N. TOPSIS. In Multiple Criteria Decision Aid: Methods, Examples and Python Implementations; Springer: Berlin/Heidelberg, Germany, 2018; pp. 1–30. [Google Scholar]
- ISO 14040; Environmental Management—Life Cycle Assessment—Principles and Framework. ISO: Geneva, Switzerland, 2006.
- ISO 14044; Environmental Management—Life Cycle Assessment—Requirements and Guidelines. ISO: Geneva, Switzerland, 2006.
- Fontenla-Razzetto, G.; Wahren, F.T.; Heilig, D.; Heil, B.; Kovacs, G.; Feger, K.-H.; Julich, S. Water Use of Hybrid Poplar (Populus deltoides Bart. ex Marsh × P. nigra L. “AF2”) Growing Across Contrasting Site and Groundwater Conditions in Western Slovakia. Bioenergy Res. 2023, 16, 379–397. [Google Scholar] [CrossRef] [Scilit]
- Saulino, L.; Allevato, E.; Rossi, S.; Minotta, G.; Fiorentino, N.; Saracino, A. Lengthening Single-Stem Rotation Improves Biomass Yield and Water Use Efficiency in Black Poplar Genotype Multi-Stem Rotation Coppice Plantations. Biomass Bioenergy 2021, 154, 106256. [Google Scholar] [CrossRef] [Scilit]
- Yousefi, M.; Banihabib, M.E.; Soltani, J.; Roozbahani, A. Multi-Objective Particle Swarm Optimization Model for Conjunctive Use of Treated Wastewater and Groundwater. Agric. Water Manag. 2018, 208, 224–231. [Google Scholar] [CrossRef] [Scilit]
- Tao, Y.; Wang, S.; Xu, D.; Guan, X.; Ji, M.; Liu, J. Theoretical Analysis and Experimental Verification of the Improved Subsurface Drainage Discharge with Ponded Water. Agric. Water Manag. 2019, 213, 546–553. [Google Scholar] [CrossRef] [Scilit]
- Fuertes, A.; Oliveira, N.; Cañellas, I.; Sixto, H.; Rodríguez-Soalleiro, R. An Economic Overview of Populus spp. in Short Rotation Coppice Systems under Mediterranean Conditions: An Assessment Tool for Decision-Making. Renew. Sustain. Energy Rev. 2021, 151, 111577. [Google Scholar] [CrossRef] [Scilit]
- Fürtner, D.; Perdomo Echenique, E.A.; Hörtenhuber, S.J.; Schwarzbauer, P.; Hesser, F. Beyond Monetary Cost-Benefit Analyses: Combining Economic, Environmental and Social Analyses of Short Rotation Coppice Poplar Production in Slovakia. Forests 2022, 13, 349. [Google Scholar] [CrossRef] [Scilit]

Disclaimer/Publisher’s Note: The statements, opinions and data contained in all publications are solely those of the individual author(s) and contributor(s) and not of MDPI and/or the editor(s). MDPI and/or the editor(s) disclaim responsibility for any injury to people or property resulting from any ideas, methods, instructions or products referred to in the content. |
© 2026 by the authors. Licensee MDPI, Basel, Switzerland. This article is an open access article distributed under the terms and conditions of the Creative Commons Attribution (CC BY) license.