


Abstract
Groundwater vulnerability assessments serve as essential tools for sustainable groundwater management, particularly in regions with intensive anthropogenic activities. However, improving the objectivity and predictive reliability of vulnerability assessment frameworks remains a critical scientific challenge in groundwater science, especially for coastal aquifer systems characterized by strong heterogeneity and complex hydrogeological processes. The traditional DRASTIC model is a widely recognized method but suffers from subjectivity in assigning parameter ratings and weights, often leading to arbitrary and potentially inaccurate vulnerability maps. This limitation also restricts its applicability in areas with complex hydrogeological conditions. To enhance the accuracy and adaptability of the traditional DRASTIC model, a hybrid PSO-BP-DRASTIC framework was developed and applied it to a coastal city in China. Specifically, the model employs a backpropagation neural network (BP-NN) to optimize indicator weights and integrates the particle swarm optimization (PSO) algorithm to refine the initial weights and thresholds of the BP-NN. By introducing a data-driven and globally optimized weighting mechanism, the proposed framework effectively overcomes the inherent subjectivity of conventional empirical weighting schemes. Using ten-fold cross-validation and observed nitrate concentration data, the traditional DRASTIC, BP-DRASTIC, and PSO-BP-DRASTIC models were systematically validated and compared. The results demonstrate that (1) the PSO-BP-DRASTIC model achieved the highest classification accuracy on the test set, the highest stability across ten-fold cross-validation, and the strongest correlation with the nitrate concentrations; (2) the importance analysis identified the aquifer thickness and depth to the groundwater table as the most influential factors affecting groundwater vulnerability in Yantai; and (3) the spatial assessments revealed that high-vulnerability zones (7.85% of the total area) are primarily located in regions with intensive agricultural activities and high aquifer permeability. The hybrid PSO-BP-DRASTIC model effectively mitigates the subjectivity of the traditional DRASTIC method and the local optimum issues inherent in BP-NNs, significantly improving the assessment accuracy, stability, and objectivity. From a scientific perspective, this study demonstrates the feasibility of integrating swarm intelligence and neural learning into groundwater vulnerability assessment, providing a transferable and high-precision methodological paradigm for data-driven hydrogeological risk evaluation. This novel hybrid model provides a reliable scientific basis for the reasonable assessment of groundwater vulnerability. Moreover, these findings highlight the importance of integrating a hybrid optimization strategy into the traditional DRASTIC model to enhance its feasibility in coastal cities and other regions with complex hydrogeological conditions.
1. Introduction
Groundwater is a vital source of fresh water worldwide, with an irreplaceable role in maintaining ecological balance, securing urban and rural water supplies, and supporting industrial and agricultural development [1,2]. However, with the continuous growth of the global population and the acceleration of economic development, groundwater resources are increasingly threatened by overexploitation and water quality degradation, posing significant challenges to their sustainable use [3,4,5]. In this context, a scientific and accurate assessment of groundwater vulnerability—defined as the susceptibility of aquifer systems to contamination from anthropogenic activities—has become a fundamental prerequisite for identifying high-risk pollution zones, formulating proactive prevention strategies, and achieving refined groundwater resource management [6,7].
Over the past several decades, groundwater vulnerability assessment methods have evolved into four main categories: overlay–index methods, process-based simulation methods, statistical approaches, and fuzzy mathematical models [8,9]. The DRASTIC model, proposed by the United States Environmental Protection Agency (USEPA) in 1987, represents a typical overlay–index method. Owing to its clear structure, ease of parameter acquisition, and strong spatial expressiveness, DRASTIC has become one of the most widely applied models worldwide [10]. This model integrates seven key hydrogeological parameters—depth to water table (D), net recharge (R), aquifer media (A), soil media (S), topography (T), impact of the vadose zone (I), and hydraulic conductivity (C)—to construct a semi-quantitative evaluation framework.
Despite its widespread use, the DRASTIC model has several inherent limitations. For example, it is mainly based on natural factors and fails to incorporate the effects of human activities. To overcome this limitation, an intuitive approach is to integrate factors that relate to human activities into the traditional framework. Wang et al. [11] applied the entropy weight method to the Songnen Plain in Northeast China as the study area, in which the aquifer thickness (A) factor was excluded, while groundwater exploitation (E) and land use (L) factors were incorporated. Long-term excessive groundwater extraction weakens the aquifer’s self-purification capacity, thereby increasing the groundwater vulnerability. Xu et al. [12] introduced a Transformer-based deep learning model to assess groundwater vulnerability by integrating spatiotemporal environmental data, including total dissolved solids, arsenic concentration, and water hardness. The contribution of each indicator to the model outputs was further analyzed using saliency maps. The results demonstrated that the proposed model achieved an accuracy of 98%, outperforming the traditional DRASTIC model. More detailed discussions on this issue can be found in previous studies [13,14].
A more intractable problem stems from its rating system and fixed weighting scheme, given that they rely heavily on expert judgment, introducing substantial subjectivity and reducing the ability to accurately reflect region-specific hydrogeological characteristics. Furthermore, as a fundamentally linear weighted model, DRASTIC cannot effectively capture the complex nonlinear relationships that often exist between influencing factors and groundwater vulnerability [15,16,17,18]. Consequently, its applicability and accuracy are considerably constrained in complex hydrogeological settings such as coastal and karst regions. Recently, researchers have increasingly integrated advanced data-driven techniques into groundwater vulnerability assessment to address these limitations, given their strong capabilities in nonlinear fitting, feature learning, and pattern recognition [19,20,21,22]. For example, Zhang et al. developed an optimization-based approach employing a backpropagation (BP) neural network to analyze the vulnerability of shallow groundwater in northern Guangdong Province [23]. Similarly, Sadikoglu et al. (2024) utilized a BP neural network to optimize DRASTIC weighting factors and predict nitrate concentrations in the Ardabil Plain aquifer, thereby improving the accuracy of groundwater vulnerability assessments [24]. However, as a local optimization algorithm, the BP neural network has exhibited several limitations, including unstable training, slow convergence, and a tendency to become trapped in local optima [25].
The particle swarm optimization (PSO) algorithm is a population-based global optimization method inspired by the social behavior of bird flocks, which benefits from its conceptual simplicity, few adjustable parameters, and rapid convergence [26]. By combining PSO with BP, the robust global search capability of PSO enables optimization of the initial weights and thresholds of the BP model, enhancing the overall performance and predictive accuracy. Although this hybrid PSO-BP approach has demonstrated strong potential, its application in groundwater vulnerability assessment—particularly in large-scale and hydrogeological complex coastal regions—remains limited.
Yantai City, located in the eastern Shandong Peninsula, is an important coastal economic hub and modern port city in China. The area exhibits diverse geomorphological features—including low mountains, hills, alluvial plains, and coastal depositional landforms—resulting in a complex hydrogeological structure. As an economically developed region with intensive agricultural activity, Yantai’s groundwater system faces significant environmental pressure from multiple pollution sources, such as agricultural non-point runoff and domestic sewage leakage, and nitrate is identified as the main pollutant in groundwater [27,28]. Therefore, conducting high-resolution groundwater vulnerability assessments in this region is of both theoretical significance and urgent practical importance for sustainable groundwater management. Given that nitrate exhibits high mobility and weak adsorption in soils and groundwater, and its sources are mainly associated with anthropogenic activities such as agricultural fertilization and domestic wastewater, it can sensitively reflect the susceptibility of groundwater to surface-derived pollution. Therefore, the spatial distribution characteristics of nitrate in groundwater were used to verify the reliability of the groundwater vulnerability assessment results.
The objectives of the study are as follows: (1) to develop an optimization-based DRASTIC method (BP-DRASTIC) and a hybrid optimization model (PSO-BP-DRASTIC); (2) to systematically compare and evaluate the DRASTIC, BP-DRASTIC, and PSO-BP-DRASTIC models using ten-fold cross-validation and nitrate concentration data; and (3) to identify the dominant factors and spatial distribution patterns influencing groundwater vulnerability in Yantai City, thereby providing scientific support for groundwater zoning, management, and protection strategies.
Our study has applicability and multiple benefits. First, the approach described herein differs from others. A hybrid optimization strategy was integrated into the traditional DRASTIC model, in which a backpropagation neural network (BP-NN) to optimize indicator weights and the particle swarm optimization (PSO) algorithm to refine the initial weights and thresholds of the BP-NN. In addition, two methods, including the ten-fold cross-validation technique and regression analysis method, were employed to validate the hybrid model (PSO-BP-DRASTIC) and compared to the traditional DRASTIC and BP-DRASTIC model. The novel hybrid model provides a reliable scientific basis for the reasonable assessment of groundwater vulnerability, and our findings highlight the importance of integrating a hybrid optimization strategy into the traditional DRASTIC model to enhance its feasibility in coastal cities and other regions with complex hydrogeological conditions.
From a scientific perspective, advancing groundwater vulnerability assessment from empirical, subjectivity-driven mapping toward data-driven and mechanism-informed evaluation remains a critical challenge, particularly in hydrogeologically complex coastal aquifer systems. By integrating hydrogeological theory with intelligent optimization algorithms, the proposed hybrid framework provides a promising pathway to reconcile model accuracy, stability, and interpretability, while enhancing regional adaptability. As demonstrated in a representative coastal setting, this approach offers a transferable methodological reference for high-precision groundwater vulnerability assessment in other complex hydrogeological regions worldwide.
2. Description of the Study Area
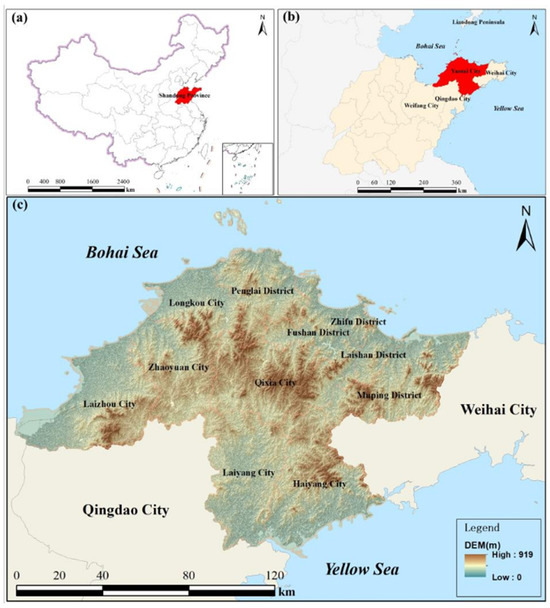
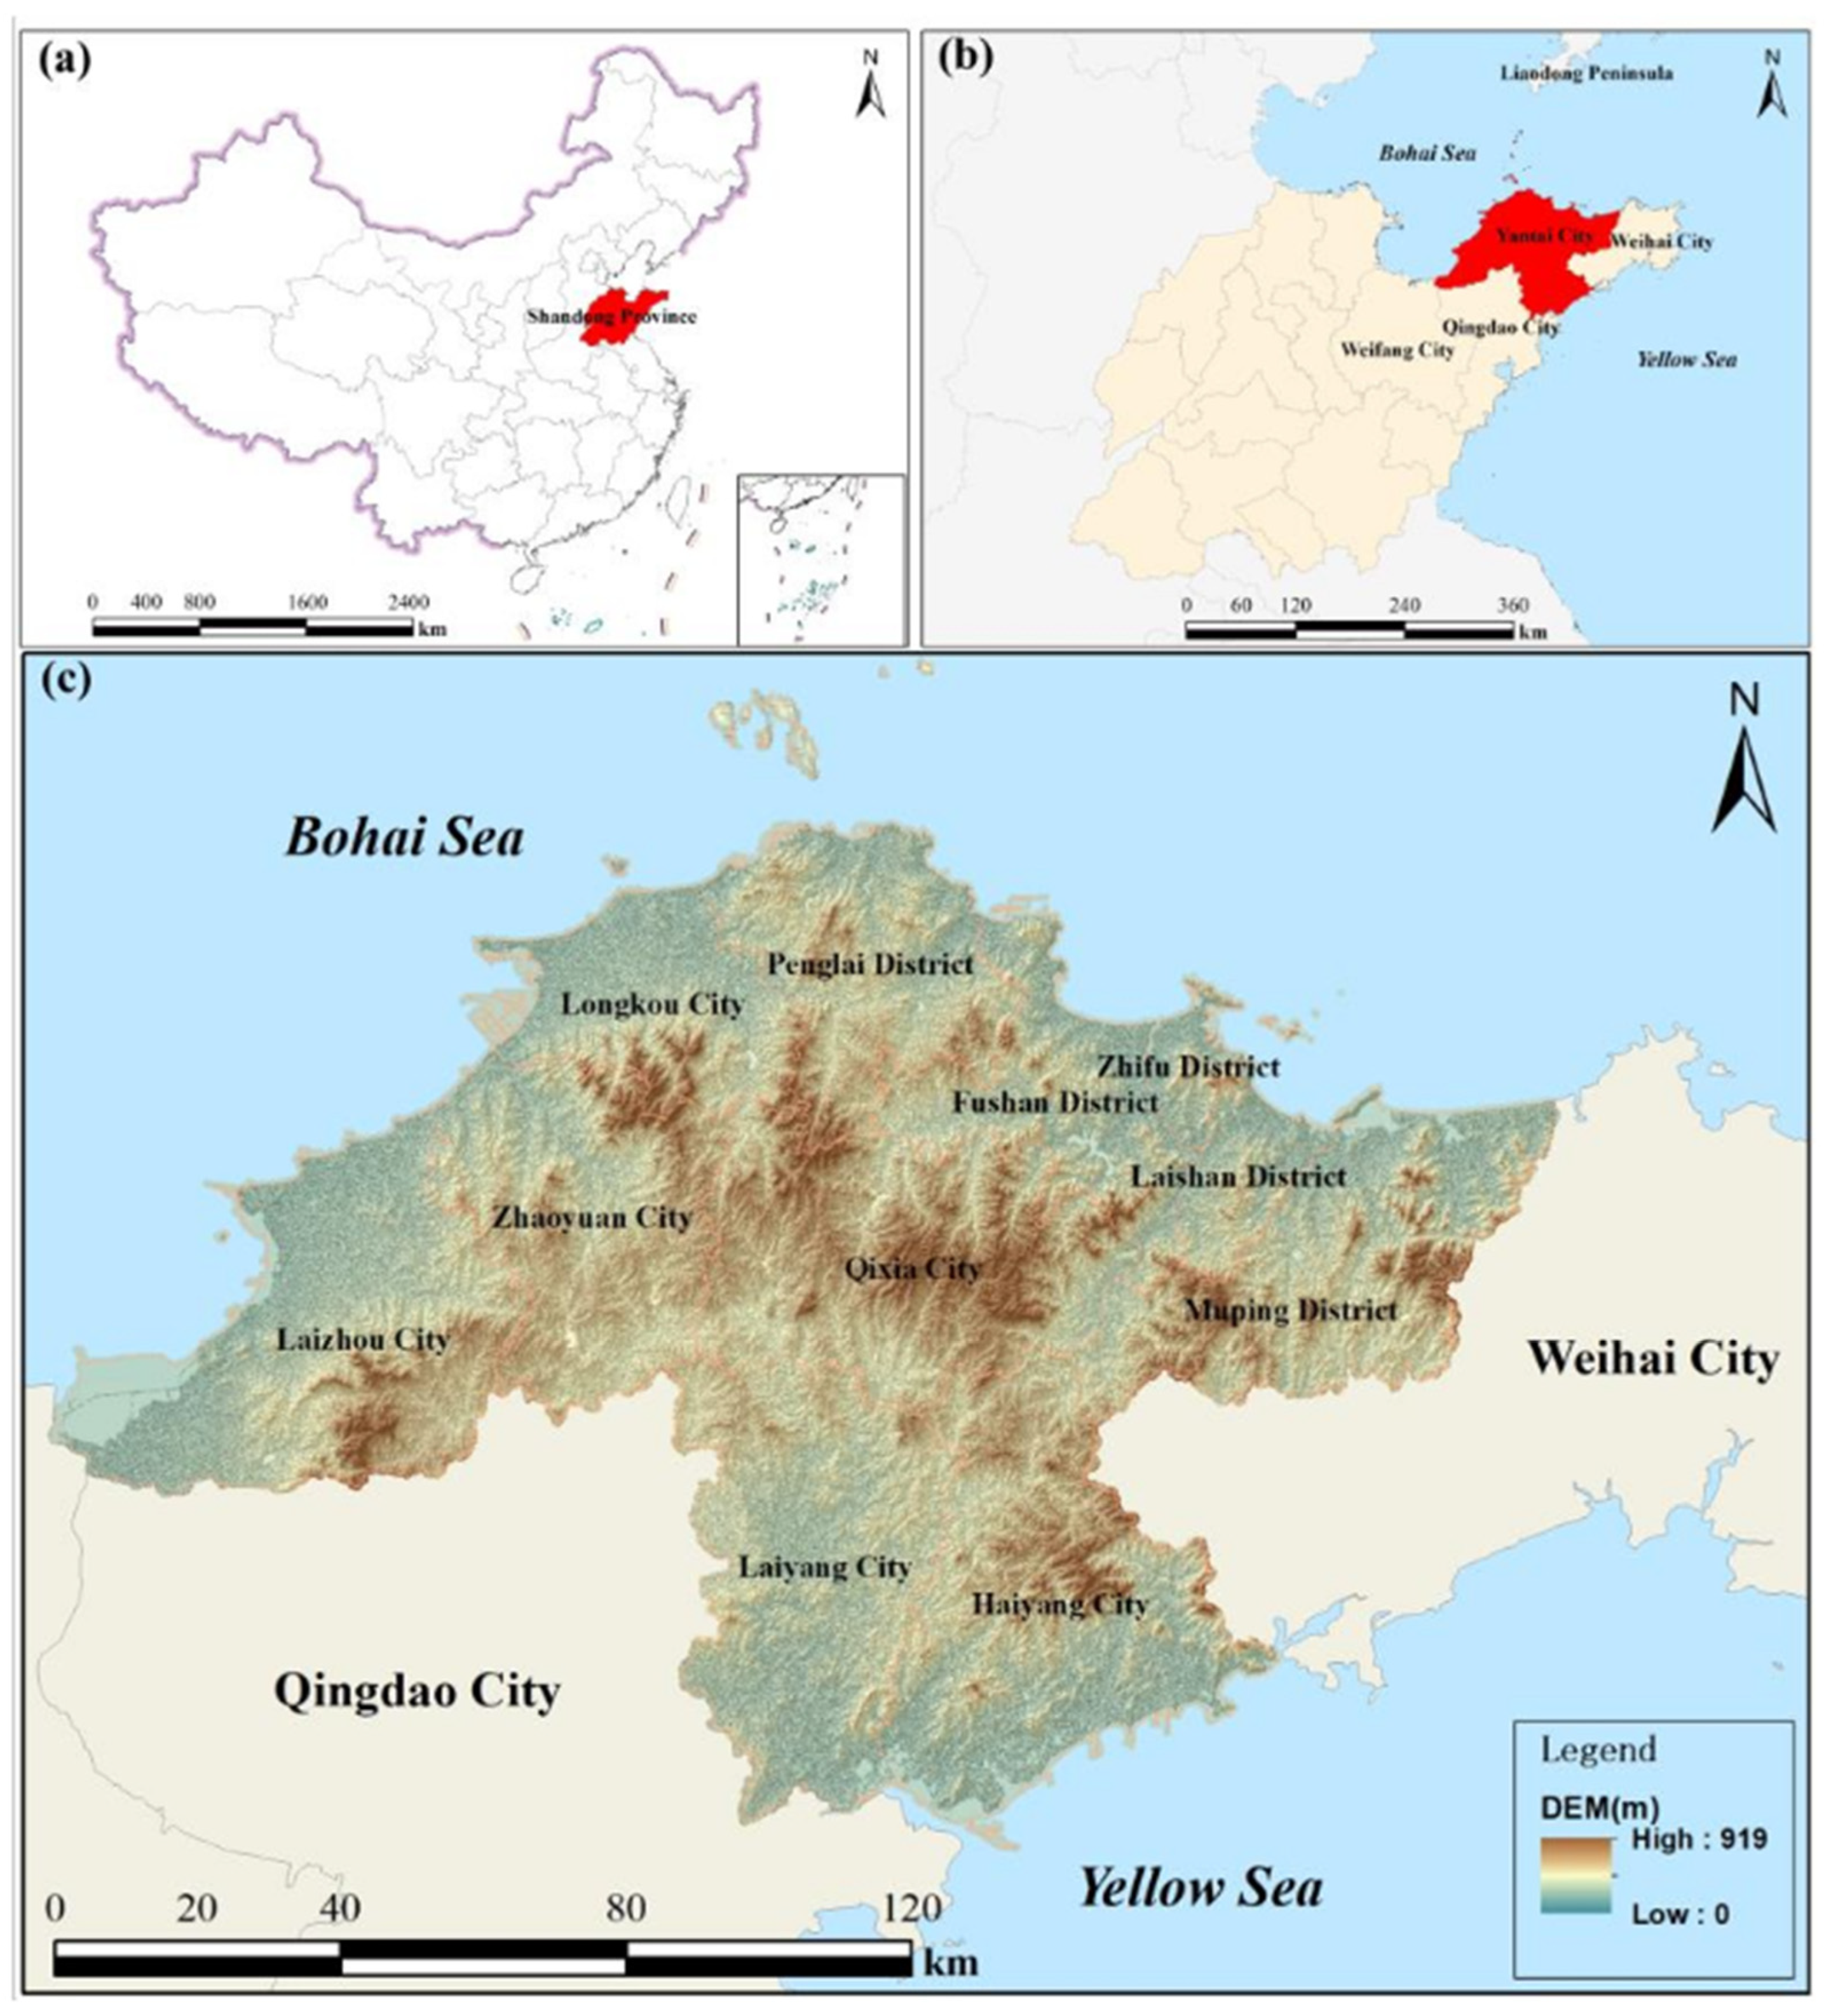
Yantai City (119°34′–121°57′ E, 36°16′–38°23′ N) is situated in the eastern region of the Shandong Peninsula, China. It borders Weihai to the east, Weifang to the west, and Qingdao to the southwest, and it is bounded by both the Bohai Sea and the Yellow Sea to the north, separated from the Liaodong Peninsula by the sea (Figure 1) [29,30]. The total land area of the city is approximately 13,930 km2, with a coastline extending over 900 km. The terrain is characterized by a high central zone and lower areas to the north and south, dominated by low mountains and hills that cover about 75% of the total area. Plains are primarily distributed along coastal zones and river valleys [31].
Figure 1.
Location of the study area in China (a), its position within Shandong Province (b), and the corresponding digital elevation model (DEM) (c).
The region experiences a typical temperate monsoon climate with distinct seasons. Based on meteorological data from 1979 to 2023, the mean annual temperature is approximately 12.5 °C, and the mean annual precipitation is 644.8 mm [28]. Precipitation is spatially uneven, with higher precipitation in the eastern areas compared to the west. The area is crisscrossed by numerous short fast-flowing rivers that discharge directly into the sea [32].
Yantai lies within the Jiaodong tectonic unit of the North China Craton. The stratigraphic framework is dominated by crystalline rocks; i.e., Precambrian metamorphic rocks and Mesozoic intrusive rocks. Limited Quaternary deposits are mainly distributed in coastal plains, river valleys, and estuaries. Its hydrogeology is characterized by fractured bedrock aquifers with low groundwater potential and localized quaternary pore aquifers along the coast and valleys. Groundwater recharge is precipitation-controlled and seasonally variable, while coastal areas are highly vulnerable to seawater intrusion. In recent years, rapid urbanization and economic development have increased the risk of groundwater pollution in the area, posing challenges for sustainable groundwater management.
3. Materials and Methods
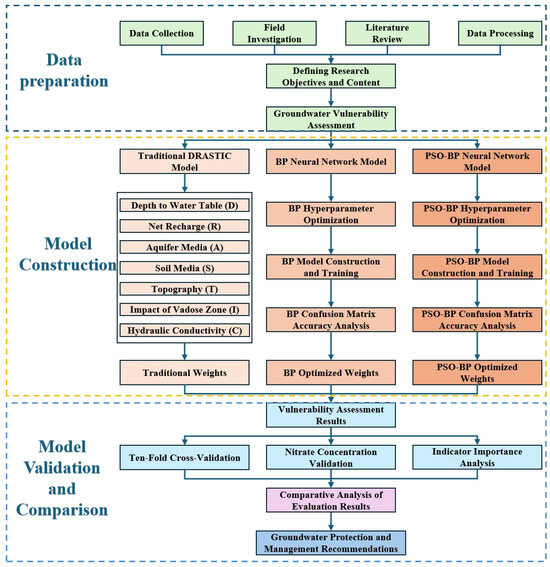
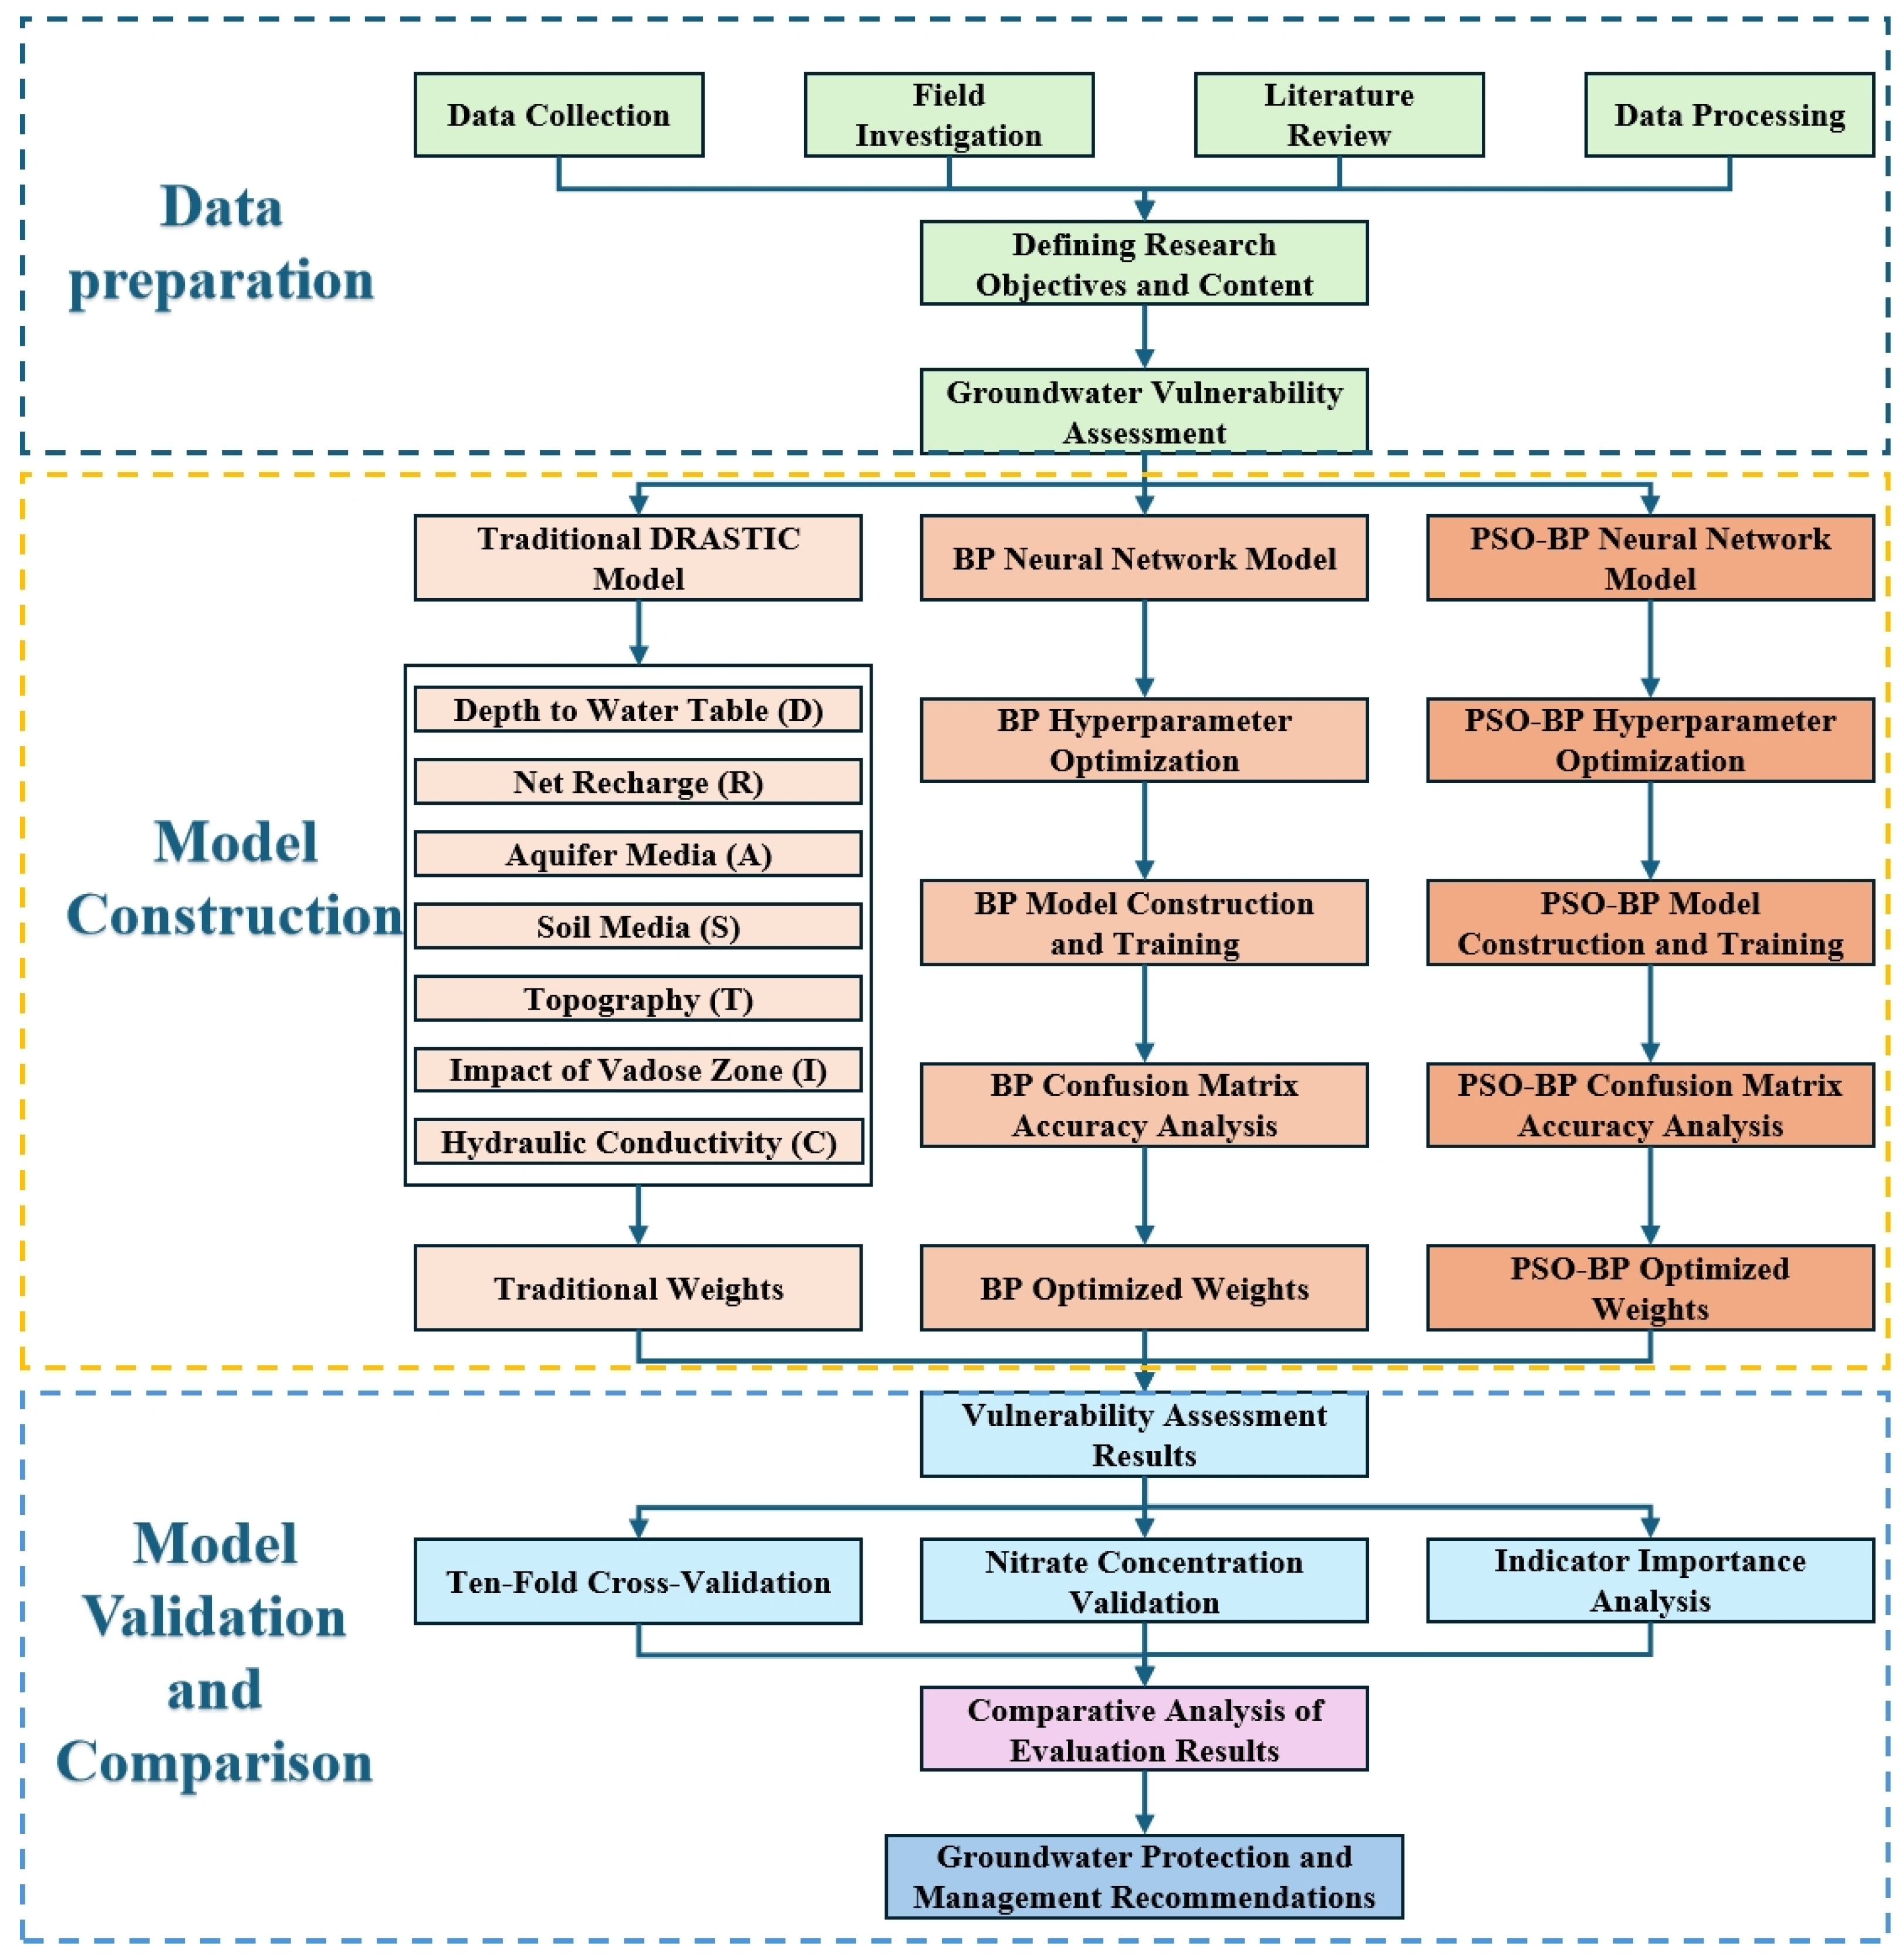
The technical framework of this study consisted of three main stages: (1) data preparation, (2) model construction, and (3) model validation and comparison (Figure 2).
Figure 2.
Technical framework of the study consisting of three main stages.
3.1. Data Sources and Preprocessing
Seven indicators required for constructing the DRASTIC model were systematically collected. All datasets underwent preprocessing, including coordinate system standardization, format unification, and quality control. The specific data sources and processing methods are summarized in Table 1.
Table 1.
Data sources and processing methods for DRASTIC model indicators.
First, all datasets were unified to the China Geodetic Coordinate System 2000 (CGCS2000). For the four parameters—depth to groundwater table, aquifer thickness, vadose zone media, and aquifer hydraulic conductivity—spatial interpolation was performed in ArcGIS 10.2, converting point-based data into raster surfaces. For the calculation of net vertical recharge, rainfall data from 2019 to 2023 were collected to compute the annual average precipitation. Infiltration coefficients were then determined based on regional stratigraphic lithology, and the agricultural irrigation return flow was statistically estimated at the county level. These components were integrated to derive the net vertical recharge. Topographic slope data were generated from ALOS satellite-derived digital elevation model (DEM) data with a spatial resolution of 12.5 m for Yantai City. The slope values were calculated using ArcGIS 10.4 and further classified through zonal analysis. Soil media data were derived from the Soil Map of Yantai City, Shandong Province. A detailed survey of soil conditions was conducted, after which the soil map was vectorized and corrected to obtain the final soil media dataset.
During the acquisition and processing of DRASTIC parameter data, strict quality control principles were implemented, as follows: (1) ensuring authoritative and reliable data sources; (2) maintaining consistency in coordinate systems, spatial resolution, and data formats; (3) checking for missing values, outliers, and errors; (4) selecting data with appropriate temporal relevance and complete spatial coverage; and (5) clearly documenting data processing steps to ensure reproducibility. These measures ensured data accuracy and consistency, thereby enhancing the reliability of the groundwater vulnerability assessment.
3.2. Model Construction
3.2.1. Traditional DRASTIC Model
The traditional DRASTIC model was first established as a baseline for comparison. Parameter ratings were determined by combining the natural breaks classification method with the standard DRASTIC rating guidelines, ensuring consistency between data distribution characteristics and regional hydrogeological patterns. Parameter weights followed the fixed scheme recommended by the USEPA: D = 5, R = 4, A = 3, S = 2, T = 1, I = 5, and C = 3. The groundwater vulnerability index (DI) was computed using Equation (1) [33]:
where R denotes the rating of each parameter, and W represents the corresponding weight. The resulting vulnerability index was classified into five categories—low, relatively low, moderate, relatively high, and high vulnerability—using the natural breaks method.
The Jenks natural breaks method is applied in groundwater vulnerability assessment to optimize data classification by minimizing within-class variance and maximizing between-class differences, thereby enabling a more accurate division of groundwater vulnerability risk levels. Specifically, the vulnerability index (VI) is calculated as a weighted combination of multiple hydrogeological parameters (e.g., depth to water table, net recharge, aquifer media, soil media, slope, impact of the vadose zone, and hydraulic conductivity) and is ultimately reclassified into five risk categories: low, relatively low, moderate, relatively high, and high [34].
3.2.2. BP Neural Network Model (BP-DRASTIC)
An artificial neural network (ANN) was employed to optimize the parameter weights of the DRASTIC model. An artificial neural network is a computational model based on the structure and functions of biological neural networks. ANNs are analogous to multiple regressions but more efficient in finding and representing relationships between predictors and predictands, with respect to the fact that they can actually learn from observing datasets. In other words, an ANN is used as a random function approximation tool that estimates the most cost-effective and ideal methods for arriving at solutions while defining computing functions or distributions. During this process, the ANN uses data samples rather than entire datasets to arrive at solutions, which saves time [35].
In this study, the feedforward multilayer perceptron (MLP) network with a backpropagation (BP) error-correction learning algorithm was adopted. The ANN has three layers that are interconnected. The first layer (i.e., input layer) consists of seven input neurons, which correspond to the seven DRASTIC parameters. These neurons send data to the second layer (i.e., hidden layer), which subsequently sends the output neurons to the third layer (i.e., output layer) [36,37]. In practice, the number of hidden layers is usually determined using a trial-and-error procedure.
The network was trained using the Levenberg–Marquardt (Trainlm) algorithm with cross-entropy as the loss function and a learning rate of 0.1. A total of 233 valid samples were empirically divided into a training set (80%), validation set (10%), and test set (10%). After training, the relative importance of each input parameter was computed using the Garson algorithm. The resulting importance values were normalized and adopted as the optimized weights in Equation (1) to calculate the BP-DRASTIC vulnerability index.
3.2.3. PSO-BP Neural Network Model (PSO-BP-DRASTIC)
To enhance the BP network’s performance, particle swarm optimization (PSO) was used to optimize its initial weights and thresholds, given the strong dependence of the BP training results on the initial parameter values. PSO is an evolutionary algorithm with its idea inspired by simulating a simplified social system of a flock of birds that fly towards their unknown destination (fitness function) in search of food resources [26]. In PSO, each potential solution to a given problem is viewed as a particle with a certain velocity flying through the space of the problem just like a flock of birds. Each particle updates its position by integrating its personal best position and current position with the corresponding information of other particles in the swarm, with additional random perturbations. After all particles have moved, the next iteration occurs. The swarm as a whole (e.g., a flock of birds collectively searching for food) should gradually approach the objective function optimum [38,39].
After optimization, the best initial weights and thresholds were assigned to the BP network, which was then retrained to obtain the optimal PSO-BP-DRASTIC model. The connection weights of the optimized network were analyzed to derive the new parameter weights under the PSO-BP framework, which were subsequently applied to generate the final groundwater vulnerability map.
3.3. Model Validation and Comparison
Two independent validation methods—ten-fold cross-validation and nitrate concentration validation—were employed to objectively evaluate the model performance.
For the ten-fold cross-validation, all 233 sample points were randomly divided into ten mutually exclusive subsets. In each iteration, nine subsets were used for training and one for testing. This process was repeated ten times to ensure that every sample was tested once. The model’s generalization ability and stability were then assessed using the average accuracy and standard deviation across all folds.
For the nitrate concentration validation, nitrate—a common non-point source pollutant—was used as an indicator of groundwater vulnerability to anthropogenic contamination. Measured nitrate concentrations from 233 sampling points were normalized and compared with the normalized vulnerability indices derived from the three models. Linear regression analysis was conducted between the nitrate concentrations and vulnerability indices, and the coefficient of determination (R2) was calculated to quantify the correlation between the model predictions and observed pollution. Higher R2 values indicate better model capability in identifying high-risk areas.
4. Results and Discussion
4.1. Comparison of Model Performance
4.1.1. Ten-Fold Cross-Validation Results
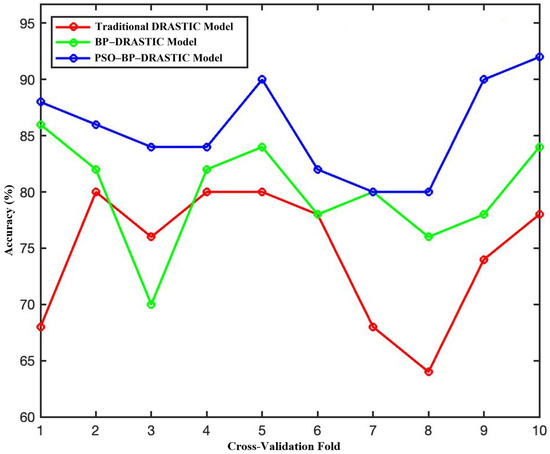
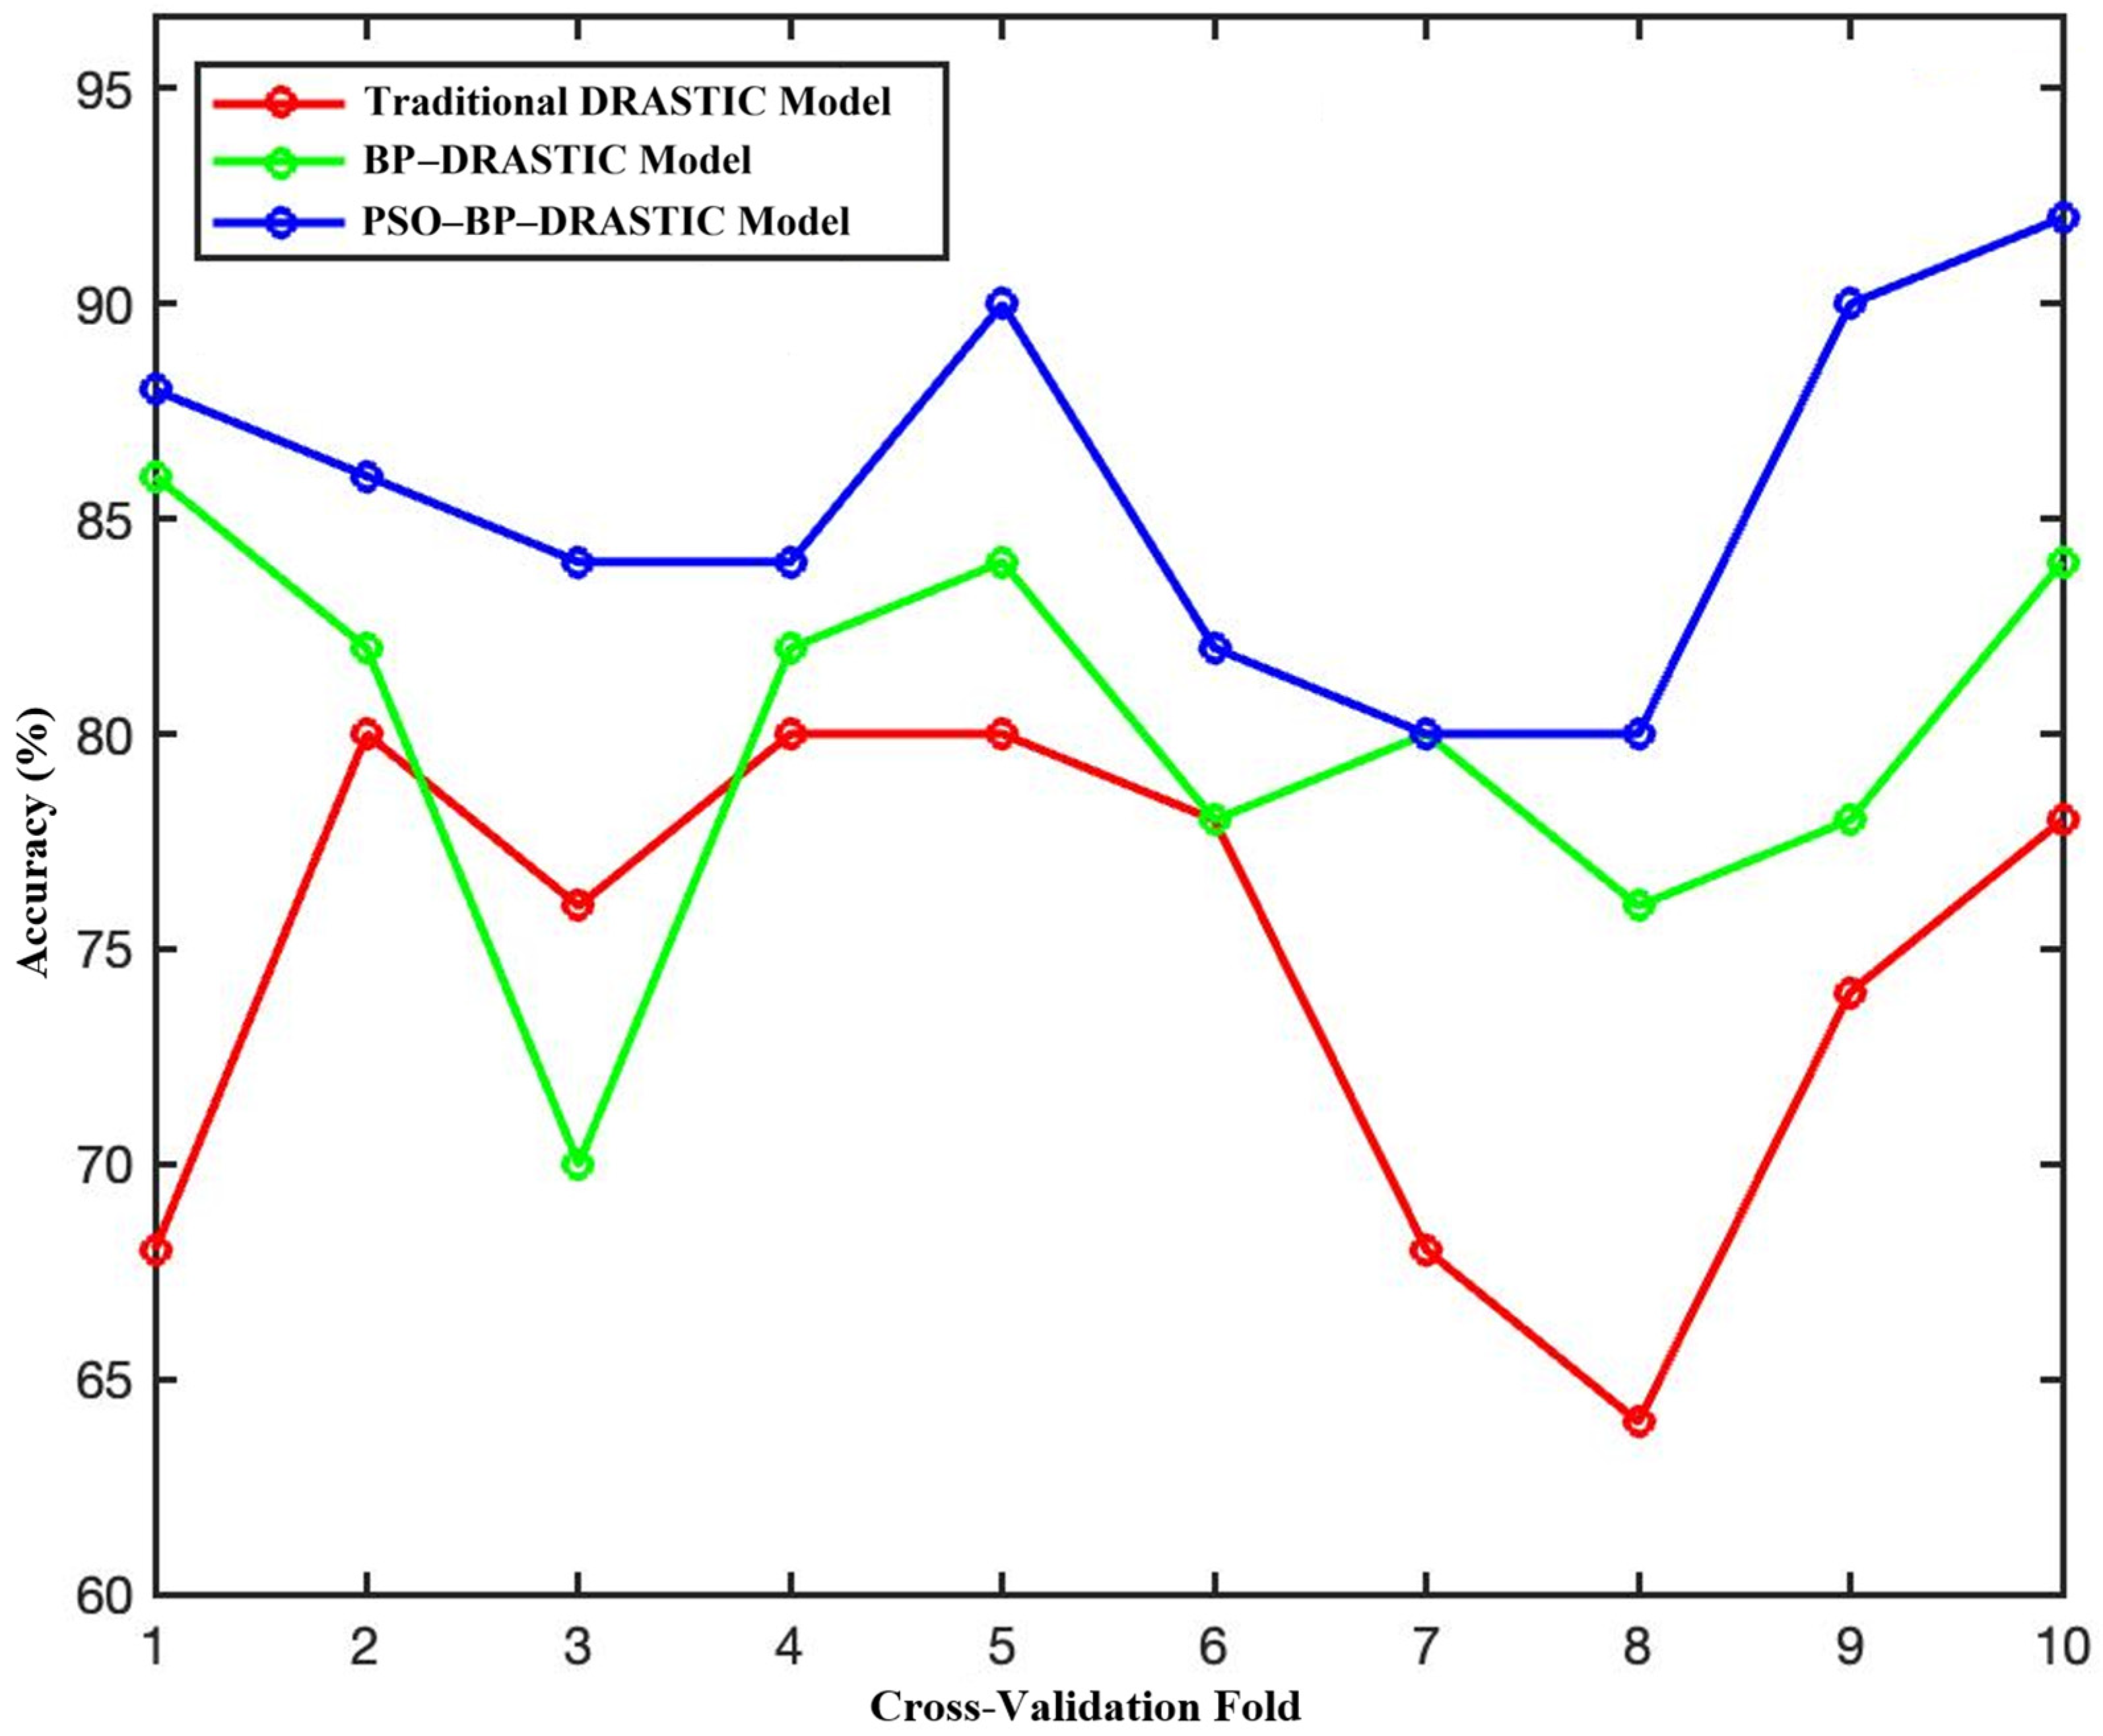
The ten-fold cross-validation results highlight clear differences in the stability and generalization ability among the three models (Figure 3).
Figure 3.
Accuracy of the three models based on the cross-validation fold.
The traditional DRASTIC model exhibited the lowest stability, with the accuracy fluctuating substantially (65–80%) and a high standard deviation. This indicates that the fixed-weight empirical approach is highly sensitive to variations in data subsets, particularly in regions with complex hydrogeological conditions, thereby reducing the reliability of its evaluation results.
The BP neural network model (BP-DRASTIC) showed a notable improvement, with a narrower accuracy range (70–85%) and higher average accuracy compared with the traditional DRASTIC model. This confirms the effectiveness of the data-driven weight optimization strategy. However, the accuracy decreased considerably in some folds (e.g., fold 3), suggesting that the BP network remains sensitive to the initial parameter settings and prone to local optima.
The PSO-BP-DRASTIC model achieved the best overall performance, attaining the highest mean accuracy and the lowest fluctuation range (80–95%), along with a markedly lower standard deviation. These results demonstrate that the global optimization capability of the PSO effectively mitigated the BP network’s randomness, enhancing the adaptability and robustness across different datasets and yielding superior generalization ability.
4.1.2. Nitrate Concentration Validation Results
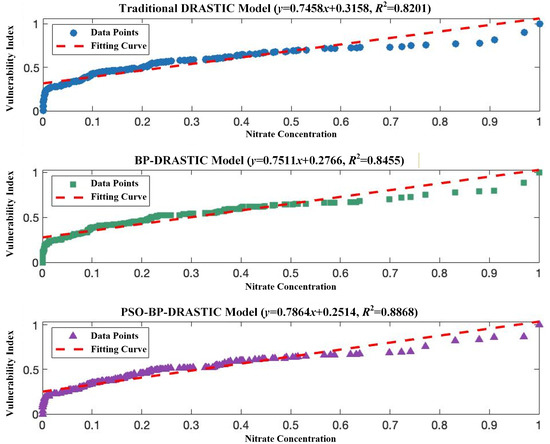
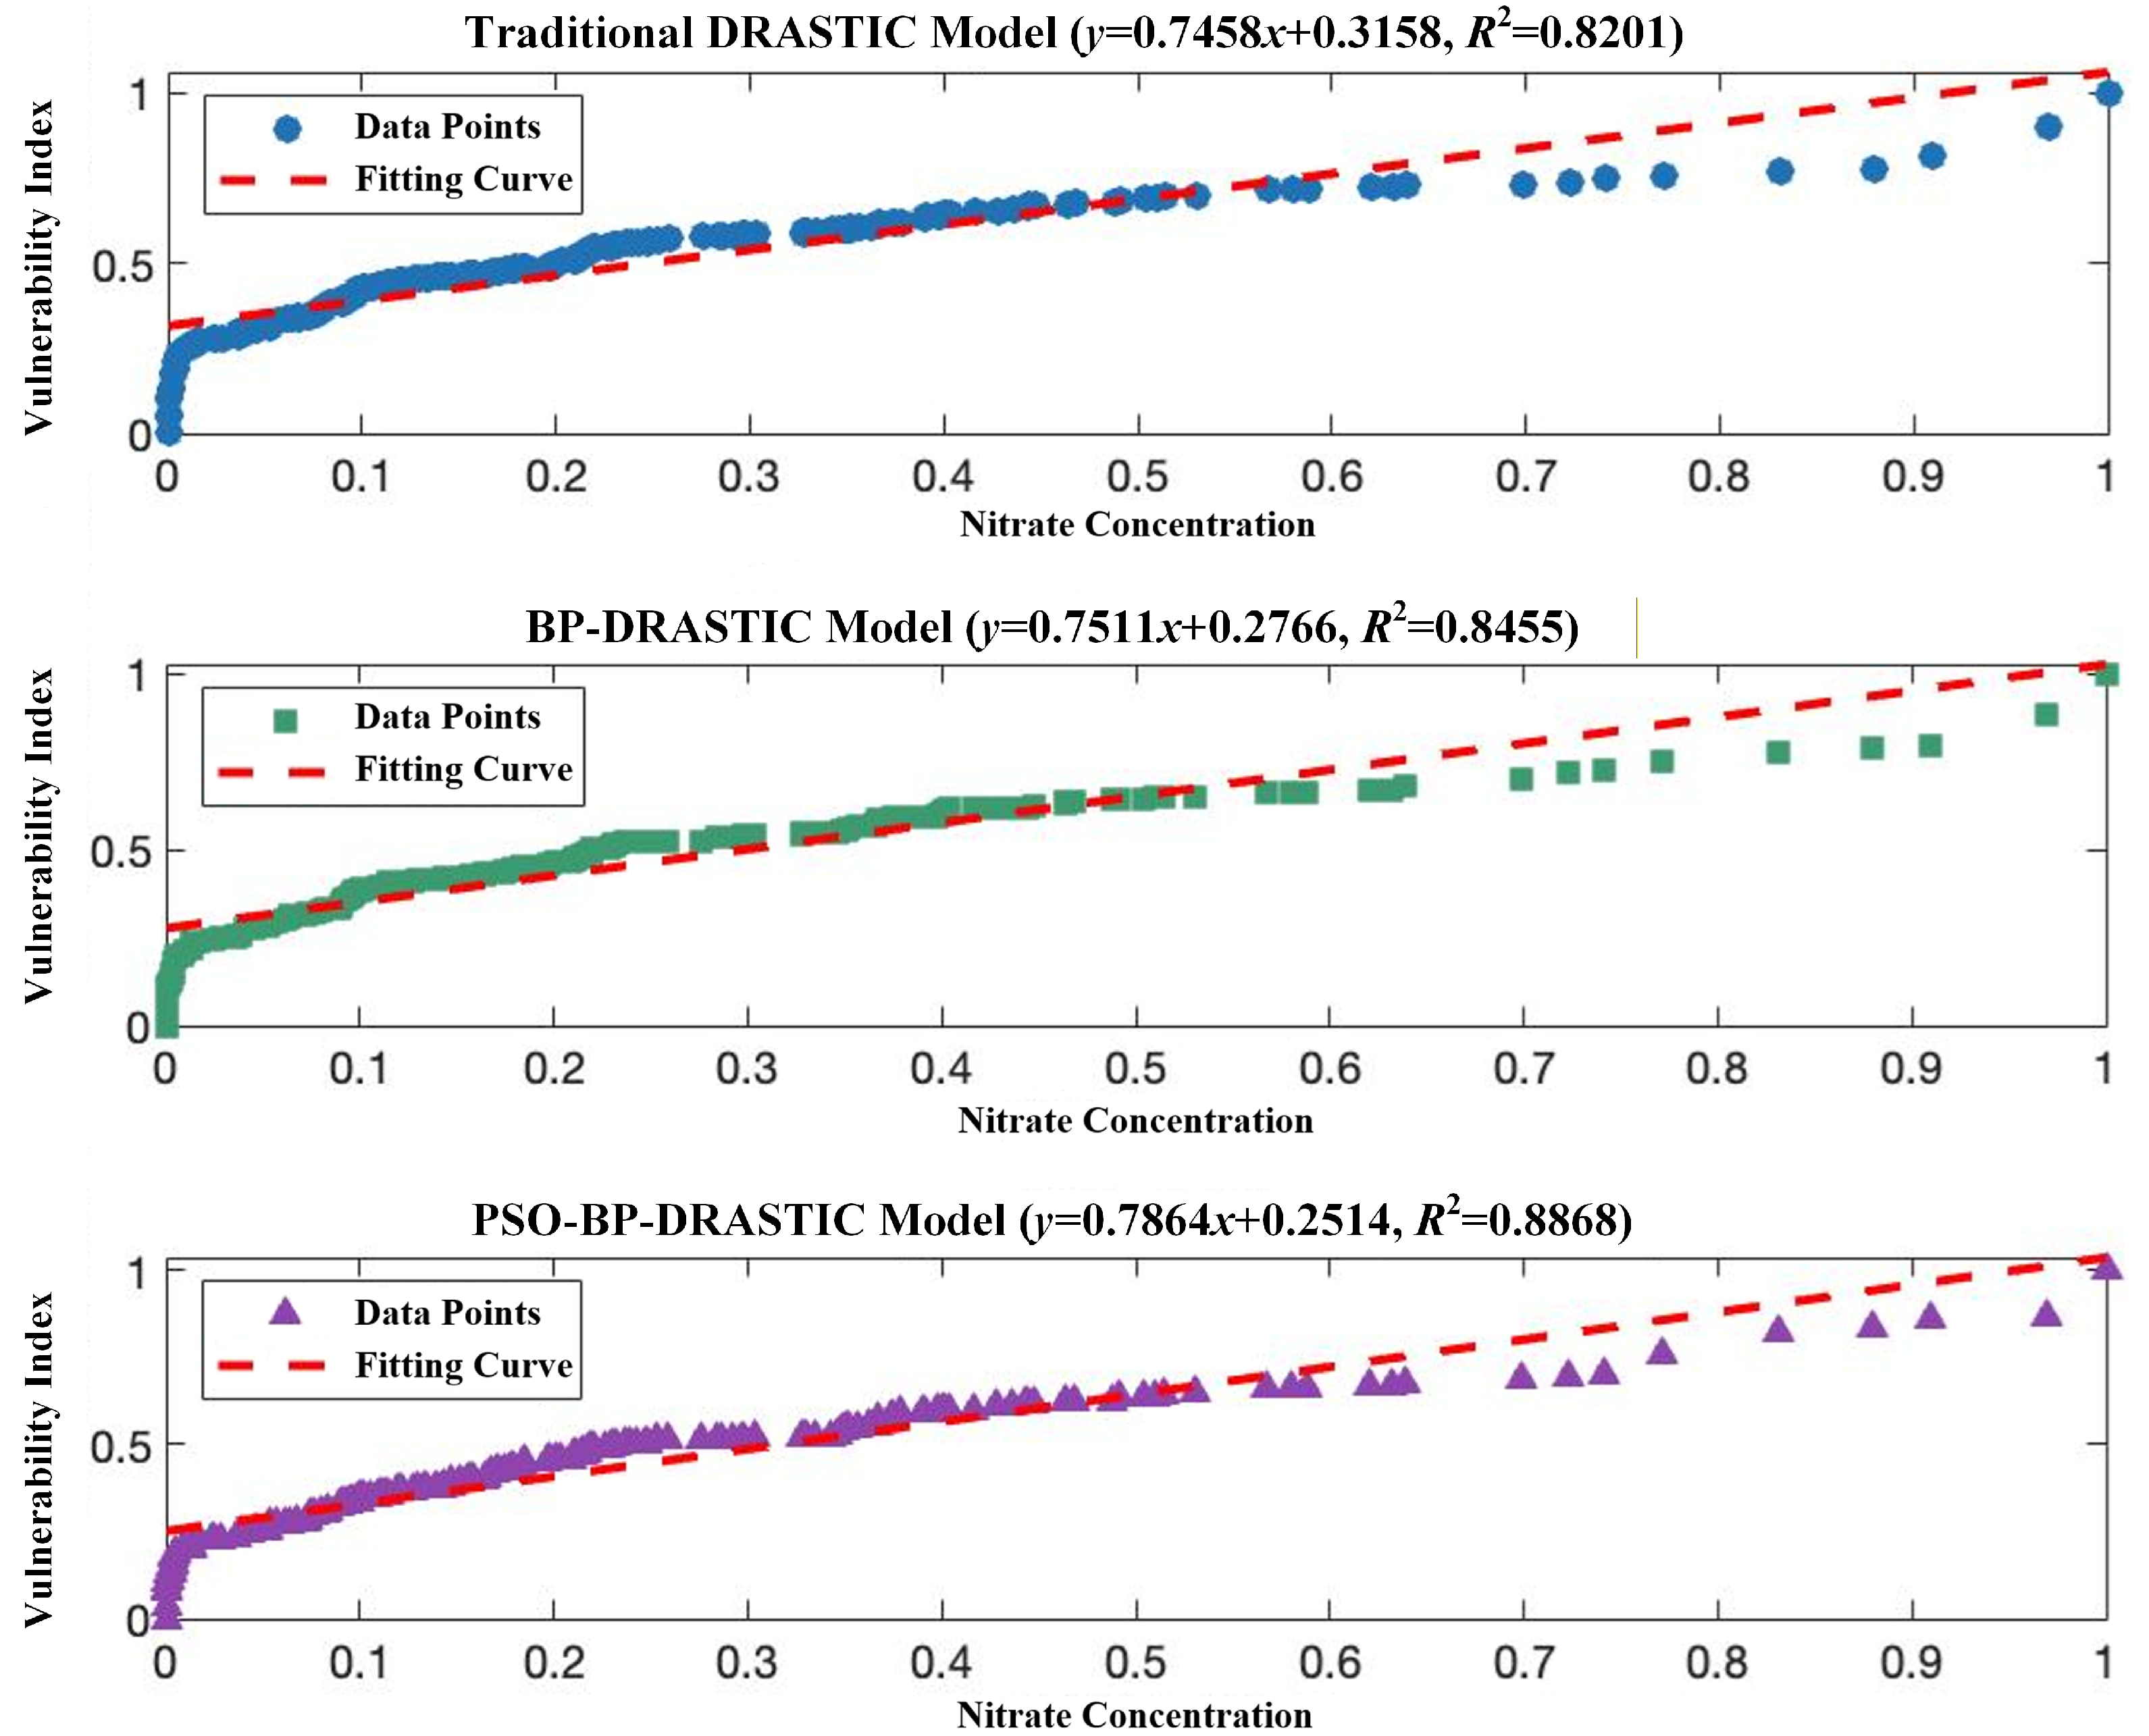
The nitrate concentration validation further confirmed the superiority of the PSO-BP-DRASTIC model given its stronger correspondence between the predicted vulnerability and the observed nitrate concentration (Figure 4). Vulnerability indices from all three models exhibited significant positive correlations in terms of the nitrate concentration, though their goodness of fit varied.
Figure 4.
Fitting relationship between groundwater vulnerability indices of the three models and the nitrate concentration.
The traditional DRASTIC model yielded a regression equation of y = 0.7458x + 0.3158 with R2 = 0.8201. While the model generally captured the vulnerability trend, the higher intercept indicates a systematic overestimation in low-pollution areas.
The BP-DRASTIC model produced the equation y = 0.7511x + 0.2766 with R2 = 0.8455. The R2 increased by approximately 3.1% compared with the traditional model, and the lower intercept suggests improved agreement between the predicted and observed values.
The PSO-BP-DRASTIC model achieved the best fit, described by y = 0.7864x + 0.2514 with R2 = 0.8868—8.1% higher than the DRASTIC model and 4.9% higher than the BP model. The higher slope indicates higher sensitivity to pollution risk, while the lower intercept reflects better performance in low-pollution regions. These results strongly demonstrate the PSO-BP model’s superior capability in accurately identifying high-risk groundwater pollution zones.
4.2. Indicator Weight Optimization and Importance Analysis
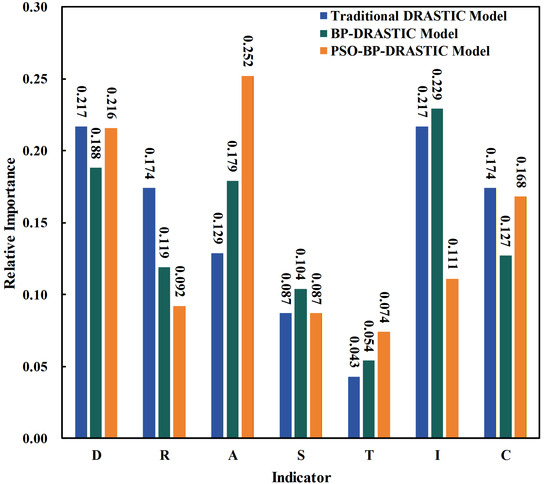
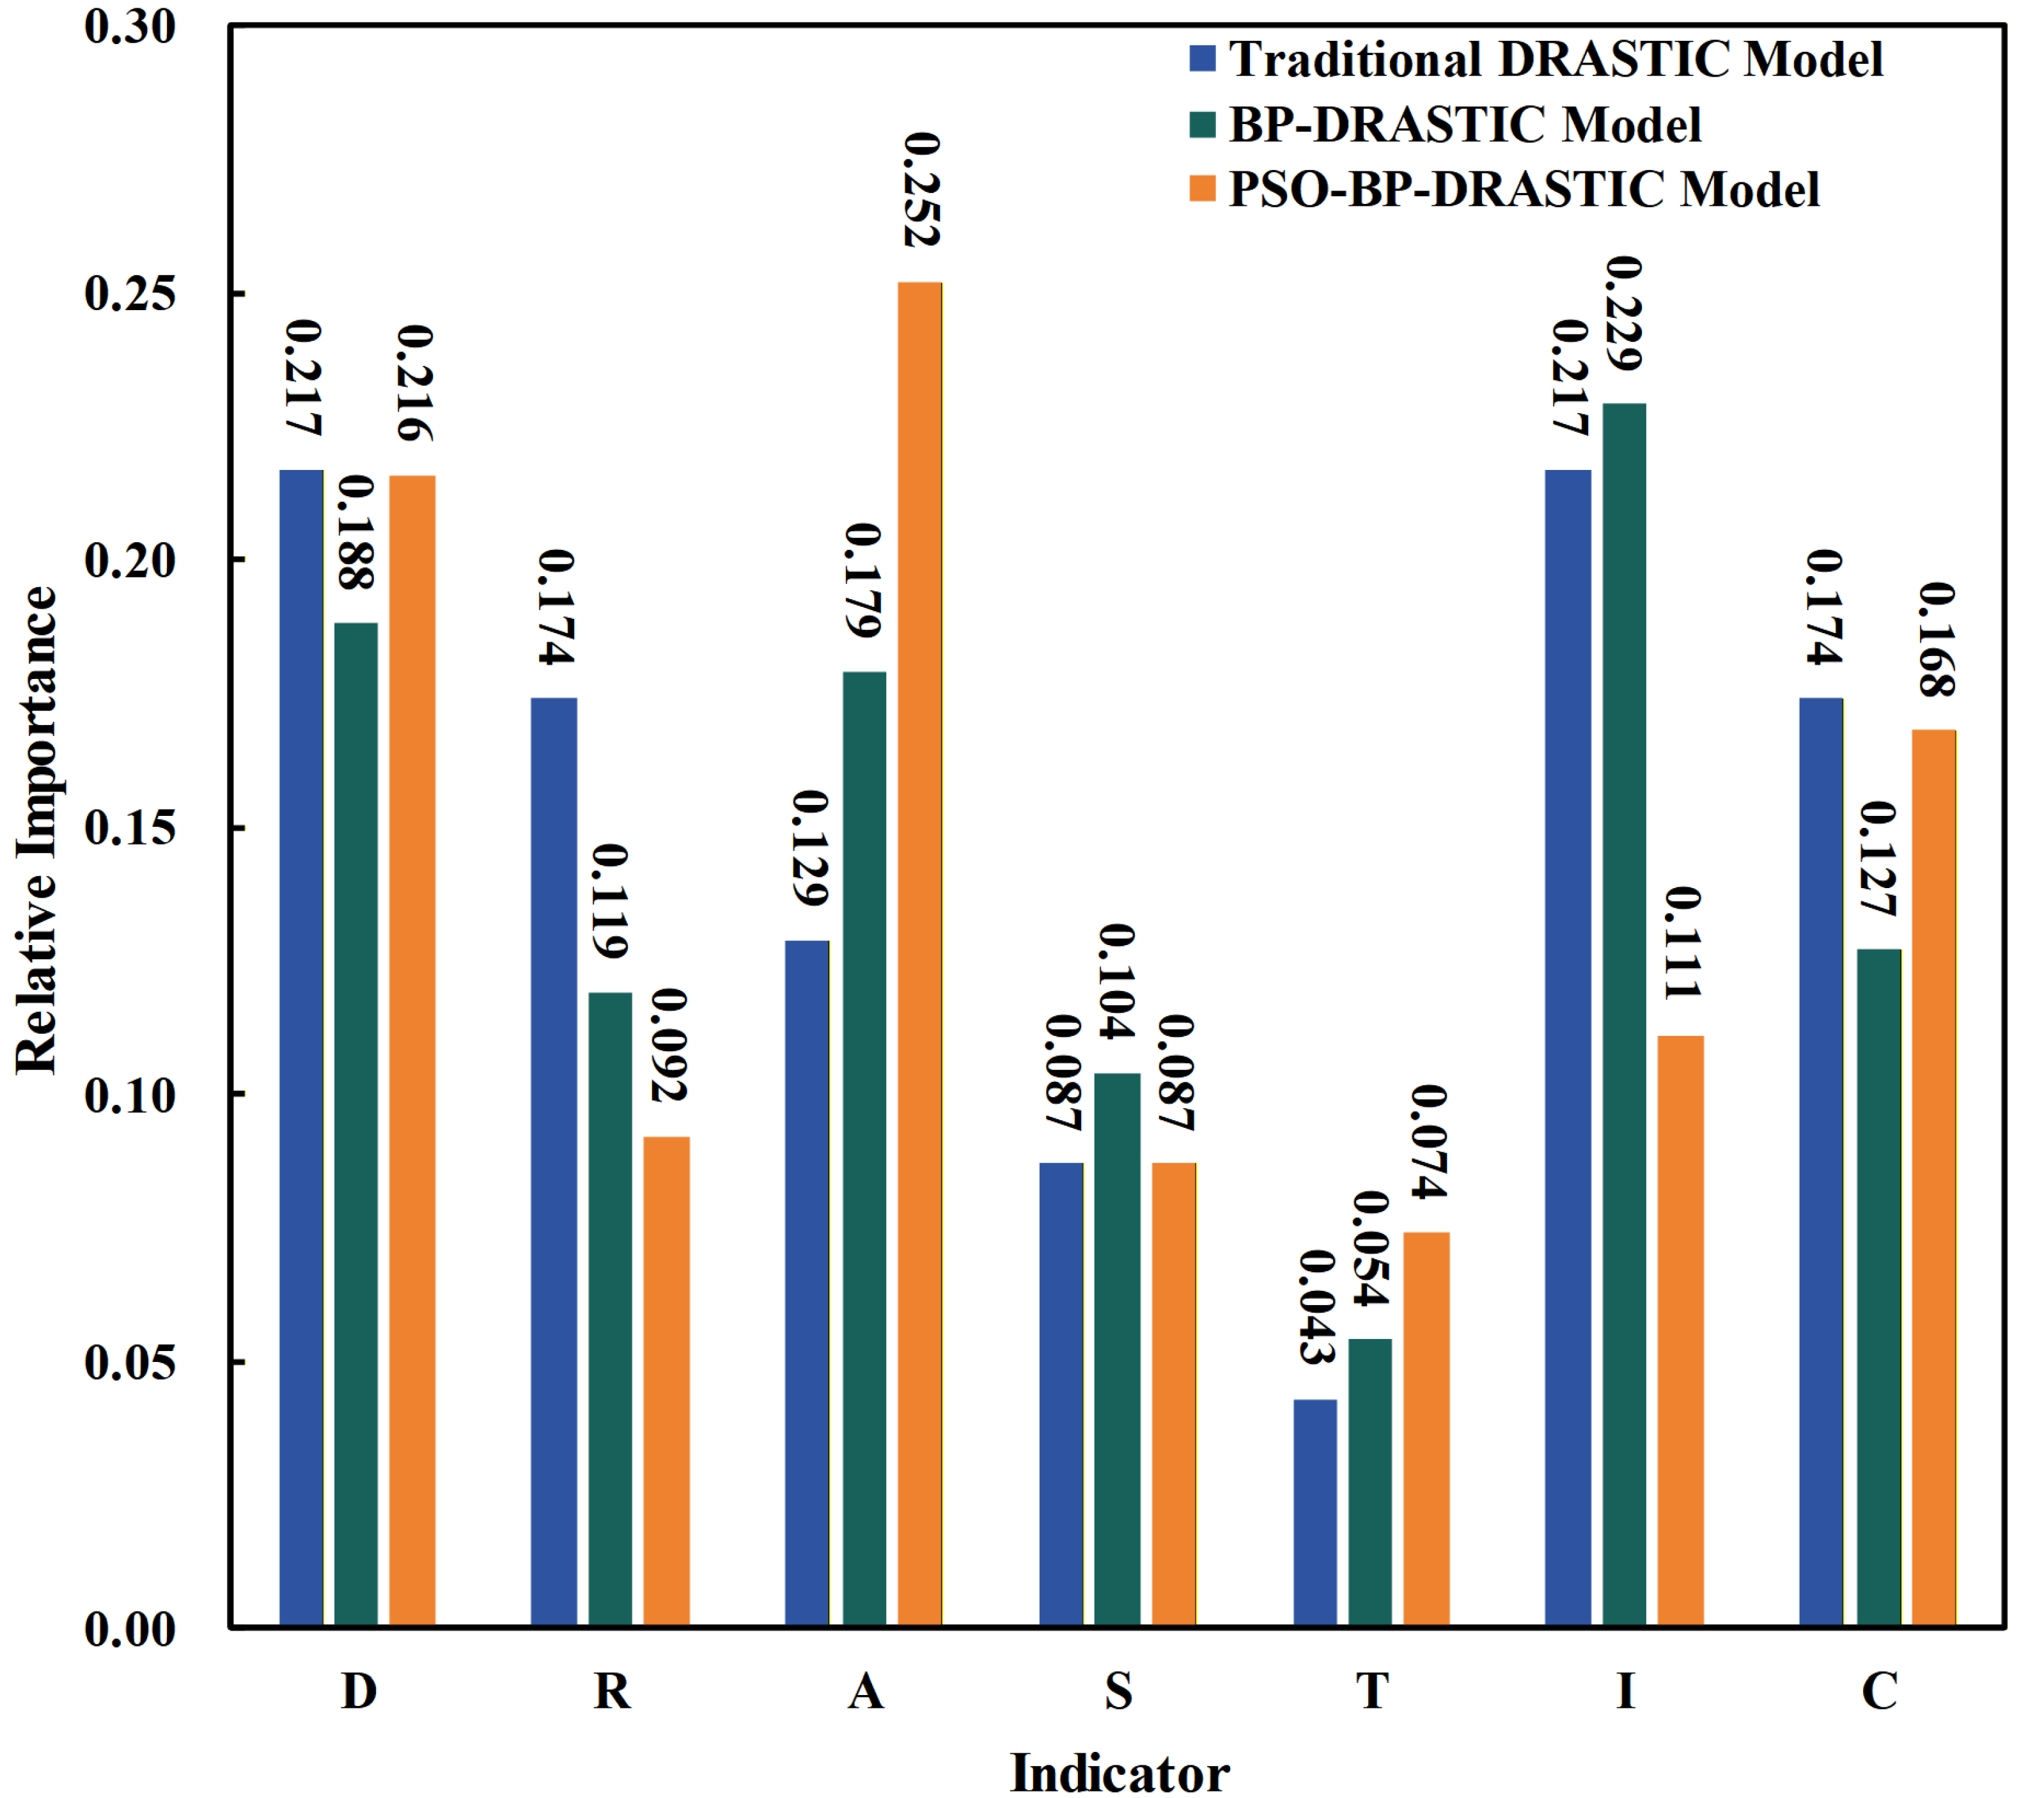
Analysis of the optimized model weights revealed the relative contribution of each parameter to groundwater vulnerability in Yantai City (Figure 5; Table 2). The results differed substantially from those obtained using the traditional fixed-weight scheme.
Figure 5.
Comparison of normalized indicator weights from the three models.
Table 2.
Optimized indicator weights for PSO-BP and BP models.
Regarding to the PSO-BP-DRASTIC and BP-DRASTIC models, aquifer media (A) was identified as the most influential parameter, in contrast to its fourth-place ranking in the traditional DRASTIC model. This finding suggests that in Yantai, aquifer storage and dilution capacity play a more critical role in determining pollutant behavior than previously assumed. Depth to groundwater (D) remained a key factor across all models, reaffirming its fundamental role in controlling pollutant migration and natural attenuation in the vadose zone.
The parameters of net recharge (R) and impact of the vadose zone (I) had notably lower weights in the PSO-BP-DRASTIC model than in the traditional DRASTIC model. This implies that under Yantai’s specific hydrogeological conditions, the influence of these factors is less significant than suggested by general empirical assumptions [33]. The topographic slope (T) consistently received the lowest weight in all models, aligning with the region’s gently sloping landscape, where infiltration and runoff processes are relatively uniform.
The PSO-BP-DRASTIC model assigned higher weights to aquifer media (A) and groundwater depth (D) and lower weights to vadose zone media (I) compared with the BP-DRASTIC model. This outcome reflects the global optimization capability of the PSO algorithm, which more accurately captured the dominant control factors in Yantai’s groundwater system. Consequently, the weight distribution derived from the PSO-BP model appears to be more scientifically robust and regionally representative.
The appropriate model parameters estimated by the PSO-BP-DRASTIC are mainly attributed to the hybrid optimization strategy. Specifically, the PSO algorithm conducts a global search within the parameter space through swarm intelligence, effectively avoiding the BP neural network’s tendency to become trapped in local minima during gradient descent. This mechanism enables the model to determine more optimal and stable initial parameters, explaining the superior stability of the PSO-BP-DRASTIC model compared with the standalone BP model in cross-validation. In addition, the traditional DRASTIC model employs fixed empirical weights, representing a “one-size-fits-all” framework based on generalized hydrogeological knowledge. In contrast, the PSO-BP-DRASTIC model optimizes indicator weights through machine learning using 233 field samples from Yantai City, achieving a localized and adaptive weighting scheme. This data-driven approach allows the evaluation model to better reflect the region’s actual hydrogeological conditions.
4.3. Spatial Distribution Characteristics of Groundwater Vulnerability
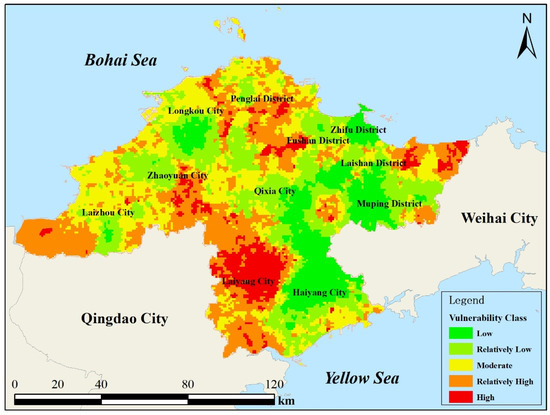
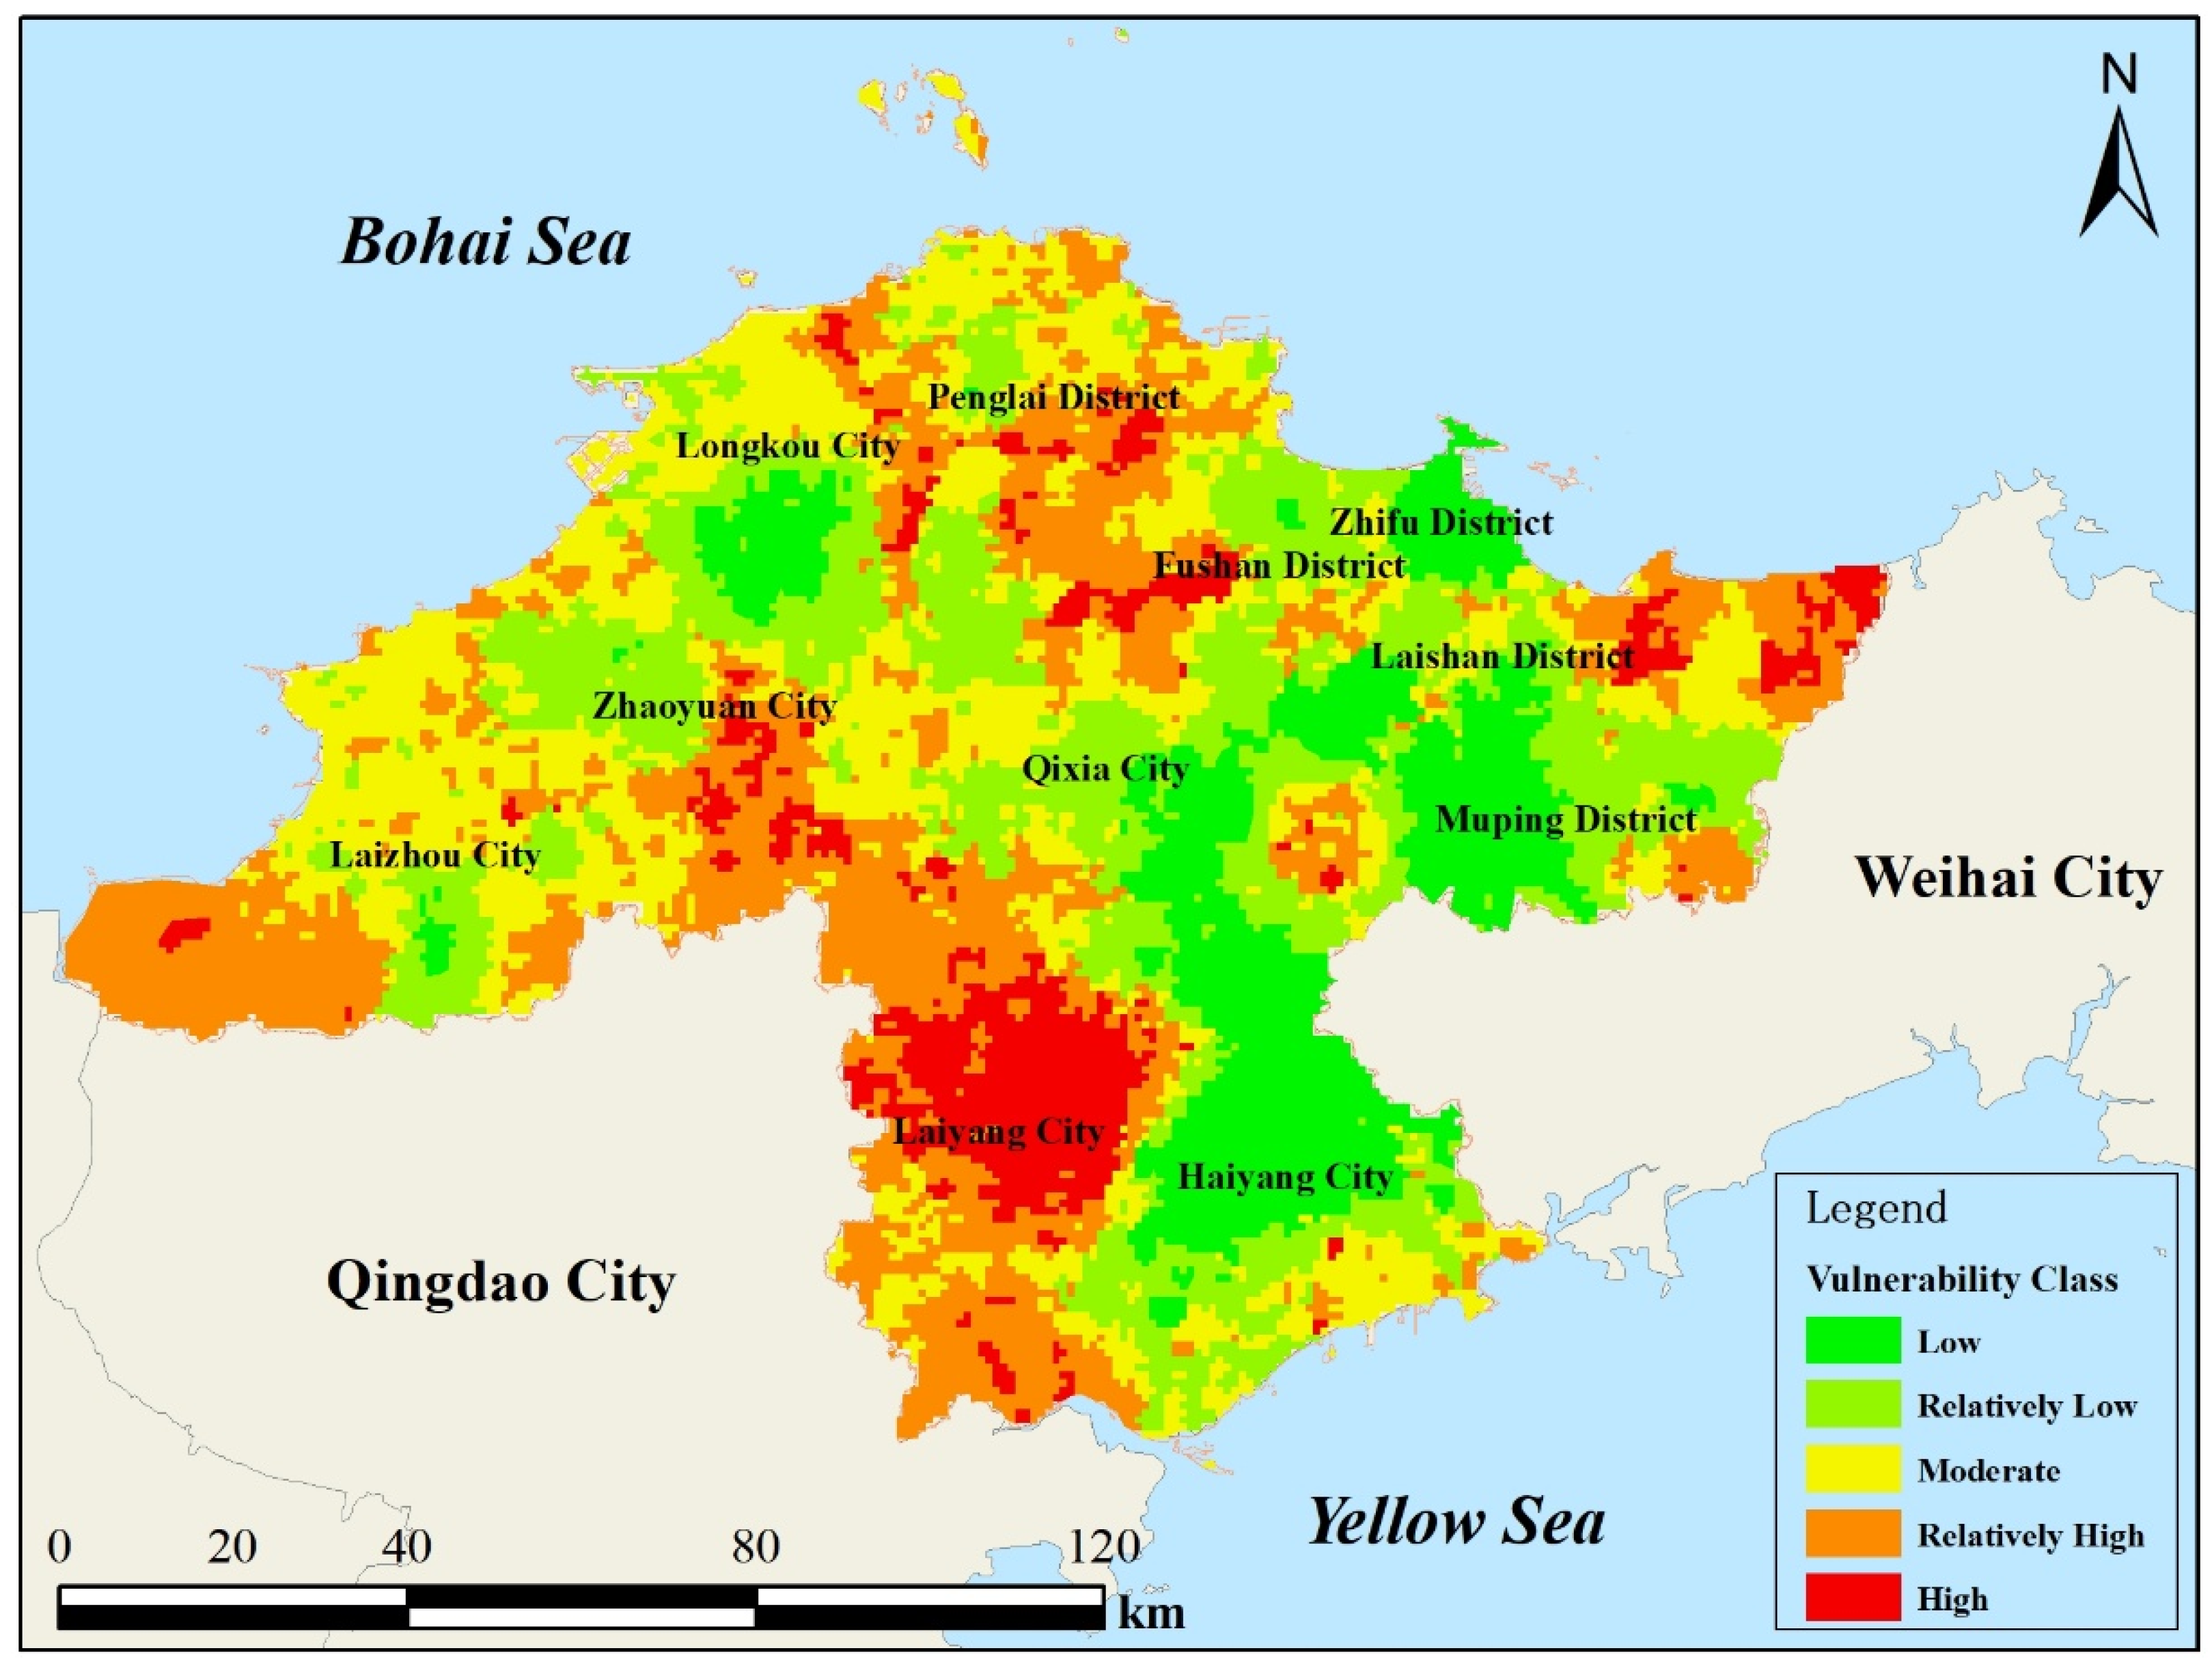
Based on the optimal performance of the PSO-BP-DRASTIC model, the spatial distribution of groundwater vulnerability in Yantai City was mapped (Figure 6), and the areal proportions of each vulnerability class are summarized in Table 3.
Figure 6.
Vulnerability partitioning of PSO-BP neural network.
Table 3.
Area statistics of groundwater vulnerability zones based on the PSO-BP model.
Spatial analysis revealed distinct spatial differentiation in groundwater vulnerability across the region.
The high and moderately high vulnerability zones (34.13%) are predominantly concentrated in the alluvial plains and coastal areas of central Laiyang, northern Haiyang, and parts of coastal Laizhou. These flat to gently sloping areas are characterized by shallow groundwater, short pollutant migration paths, and highly permeable aquifer media composed of gravel and coarse sand. This permeable, low-relief terrain coincides with intensive agricultural zones, resulting in substantial pollution pressure from fertilizer and pesticide use. Furthermore, key industrial and transportation hubs, such as areas around Laiyang Railway Station and Jinshan Port, are often located within these accessible terrains, contributing to elevated vulnerability.
Moderate vulnerability zones (26.63%) are widely distributed across transitional foothills and rolling hills in Penglai, most of Longkou, southern Zhaoyuan, and parts of Qixia. These areas represent hydrogeological and land-use transitions, with moderate soil thickness, steeper slopes than the plains that reduce infiltration potential, and mixed agricultural-urban activities. This terrain acts as a natural buffer, leading to an intermediate level of pollution risk.
Low and moderately low vulnerability zones (39.24%) are primarily associated with two distinct, less vulnerable landscapes: (1) Mountainous Bedrock Areas, such as the Zhaoyuan Luoshan National Forest Park and the Aishan–Yashan region of Qixia, where steep slopes, deep groundwater levels, and low-permeability vadose zones significantly limit contaminant transport; and (2) Highly Urbanized Cores, such as central Laishan and most of Zhifu District, where extensive impervious surfaces drastically reduce natural infiltration, and reliance on centralized water supplies minimizes direct groundwater exploitation, collectively leading to lower effective pollution loads.
4.4. Management Insights and Countermeasures Suggestions
The PSO-BP model provides high-precision spatial decision support for groundwater management and protection in Yantai City. Management strategies should be differentiated according to regional vulnerability levels. With regard to the high vulnerability areas, they should be designated as key groundwater pollution prevention areas. In agricultural regions such as Laiyang, targeted measures—mandatory soil testing, formula-based fertilization, reduced nitrogen and phosphorus input, and promotion of ecological agriculture—should be prioritized. In industrial clusters, stricter wastewater discharge standards and the construction of impermeable facilities must be enforced. Pilot groundwater remediation projects could also be initiated in these high-risk zones.
The moderate and moderately high vulnerability areas should be defined as groundwater pollution risk alert zones. The monitoring network density should be increased, with routine water quality monitoring conducted. Approval processes for new industrial or agricultural projects with potential pollution risks should be strictly regulated, while supervision of existing pollution sources should be strengthened.
In terms of the low vulnerability areas, it is suggested they should be incorporated into the ecological protection red line to preserve their natural barrier functions. In urbanized low-vulnerability areas, groundwater should be designated as a strategic emergency water source, with emphasis on preventing contamination during urban expansion and infrastructure construction.
4.5. Research Limitations and Prospects
Despite the strong performance of the proposed model, several limitations remain. First of all, this study was conducted on the basis of the traditional DRASTIC index, and human activity-related variables, such as land use patterns and groundwater abstraction intensity, were not incorporated. In this study, the analysis showed a strong correlation between areas with intensive agricultural activity and higher vulnerability indices, which aligns with findings from previous studies [40,41]. These areas often experience significant nutrient and pesticide leaching into groundwater due to heavy irrigation and fertilization. Additionally, urbanized areas with poor wastewater management systems also exhibited elevated vulnerability, reinforcing the need for land use management strategies that consider groundwater protection.
Moreover, the current results represent static vulnerability at a single time point, whereas groundwater systems are inherently dynamic. Future research should incorporate multi-period datasets by considering climate change and land use change scenarios and perform spatiotemporal simulations to capture the vulnerability evolution over time.
5. Conclusions
This study presents a novel PSO-BP–DRASTIC coupling framework to address the inherent subjectivity and limited adaptability of the traditional DRASTIC model in groundwater vulnerability assessment. By integrating the global optimization capability of particle swarm optimization with the nonlinear learning strength of backpropagation neural networks, the proposed model significantly enhances predictive performance, demonstrating high classification accuracy, strong robustness across cross-validation, and excellent agreement with observed nitrate concentrations. Application to Yantai City, a representative coastal aquifer system, reveals that aquifer media and depth to groundwater are the dominant controls on groundwater vulnerability, thereby correcting biases associated with empirical weighting schemes and offering a more objective, data-driven understanding of regional hydrogeological sensitivity. The optimized model further captures pronounced spatial heterogeneity in vulnerability patterns, with high-risk zones predominantly concentrated in agriculturally intensive areas characterized by highly permeable aquifers, providing a clear spatial basis for zoned and differentiated groundwater management.
In summary, the PSO-BP-DRASTIC model establishes a robust and transferable methodological framework for high-precision groundwater vulnerability assessment in coastal and hydrogeologically complex regions, while also laying the foundation for future integration of anthropogenic pressures and dynamic processes toward the development of, adaptive and predictive groundwater risk early-warning system.
Author Contributions
Conceptualization, Y.W. and H.Y.; methodology, H.Y.; software, H.Y.; validation, Y.W., J.W. and Z.S.; formal analysis, Z.S.; investigation, Y.W.; resources, Y.W.; data curation, Y.W.; writing—original draft preparation, Y.W. and Z.S.; writing—review and editing, J.W.; visualization, Y.W.; supervision, Z.S. and Q.S. All authors have read and agreed to the published version of the manuscript.
Funding
This work was partly supported by the National Key R&D. Program of China (Grant No. 2025YFF1309304 and 2023YFC3706700). JRW acknowledges financial support from the Science Foundation for Young Scholars by the Technical Center for Soil, Agriculture and Rural Ecology and Environment, the Ministry of Ecology and Environment of China (No. QKC2024002).
Institutional Review Board Statement
Not applicable.
Informed Consent Statement
Not applicable.
Data Availability Statement
The original contributions presented in this study are included in the article. Further inquiries can be directed to the corresponding author.
Conflicts of Interest
Author H.Y. was employed by the company Beijing District Heating Group Co., Ltd. Author Q.S. was employed by the company Aimoli (Hebei) Technology Co., Ltd. The remaining authors declare that the research was conducted in the absence of any commercial or financial relationships that could be construed as a potential conflict of interest.
References
- Deka, D.; Ravi, K.; Nair, A. Impact of urbanisation on groundwater vulnerability in shallow aquifer system of Assam: A DRASTIC approach. Urban Clim. 2025, 59, 102299. [Google Scholar] [CrossRef] [Scilit]
- Gleeson, T.; Cuthbert, M.; Ferguson, G.; Perrone, D. Global groundwater sustainability, resources, and systems in the anthropocene. Annu. Rev. Earth Planet. Sci. 2020, 48, 431–463. [Google Scholar] [CrossRef] [Scilit]
- Masoumeh, Z.; Reza, M.; Banafsheh, N. Multi-variable approach to groundwater vulnerability elucidation: A risk-based multi-objective optimization model. J. Environ. Manag. 2023, 338, 117842. [Google Scholar] [CrossRef] [Scilit]
- Han, D.; Currell, J.M.; Cao, G. Deep challenges for China’s war on water pollution. Environ. Pollut. 2016, 218, 1222–1233. [Google Scholar] [CrossRef] [Scilit]
- Song, Z.; Wang, Y.; Wang, J.; Huan, H.; Li, H. Design of pump-and-treat strategies for contaminated groundwater remediation using numerical modeling: A case study. Water 2024, 16, 3665. [Google Scholar] [CrossRef] [Scilit]
- Goyal, D.; Haritash, A.; Singh, S. A comprehensive review of groundwater vulnerability assessment using index-based, modelling and coupling methods. J. Environ. Manag. 2021, 296, 113161. [Google Scholar] [CrossRef] [Scilit]
- Krogulec, E.; Bukowski, P.; Niedbalska, K.; Sawicka, K.; Trzeciak, J.; Zabłocki, S. Changes in groundwater vulnerability due to land reclamation in mining areas: An assessment using the DRASTIC method. Water 2025, 17, 702. [Google Scholar] [CrossRef] [Scilit]
- Taghavi, N.; Niven, R.K.; Paull, D.J.; Kramer, M. Groundwater vulnerability assessment: A review including new statistical and hybrid methods. Sci. Total Environ. 2022, 822, 153486. [Google Scholar] [CrossRef] [Scilit] [PubMed]
- Tyralis, H.; Papacharalampous, G.; Langousis, A. A brief review of random forests for water scientists and practitioners and their recent history in water wesources. Water 2019, 11, 910. [Google Scholar] [CrossRef] [Scilit]
- Mondal, C.N.; Adike, S.; Singh, S.V.; Ahmed, S.; Jayakumar, K.V. Determining shallow aquifer vulnerability by the DRASTIC model and hydrochemistry in granitic terrain, southern India. J. Earth Syst. Sci. 2017, 126, 89. [Google Scholar] [CrossRef] [Scilit]
- Wang, B.; Teng, Y.; Wang, H.; Zuo, R.; Zhai, Y.; Yue, W.; Yang, J. Entropy weight method coupled with an improved DRASTIC model to evaluate the special vulnerability of groundwater in Songnen Plain, Northeastern China. Hydrol. Res. 2020, 51, 1184–1200. [Google Scholar] [CrossRef] [Scilit]
- Xu, H.; Yang, X.; Hu, Y.; Wang, D.; Liang, Z.; Mu, H.; Wang, Y.; Shi, L.; Gao, H.; Song, D.; et al. Trusted artificial intelligence for environmental assessments: An explainable high-precision model with multi-source big data. Environ. Sci. Ecotechnol. 2024, 22, 100479. [Google Scholar] [CrossRef] [Scilit] [PubMed]
- Bashir, R.; Saman, J.; Hashemy, M.S. Evaluation of aquifer vulnerability using PCA technique and various clustering methods. Geocarto Int. 2019, 36, 2117–2140. [Google Scholar] [CrossRef] [Scilit]
- Tsegay, T.; Birhanu, B.; Azagegn, T.; Hailu, B.; Ayenew, T. Assessing groundwater vulnerability to pollution in a rapidly urbanizing river basin using a modified DRASTIC land use–lineament density method. Geol. J. 2024, 59, 3278–3295. [Google Scholar] [CrossRef] [Scilit]
- Luo, D.; Ma, C.; Qiu, Y.; Zhang, Z.; Wang, L. Groundwater vulnerability assessment using AHP-DRASTIC-GALDIT comprehensive model: A case study of Binhai New Area, Tianjin, China. Environ. Monit. Assess. 2023, 195, 268. [Google Scholar] [CrossRef] [Scilit]
- Barbulescu, A. Assessing groundwater vulnerability: DRASTIC and DRASTIC-like methods: A review. Water 2020, 12, 1356. [Google Scholar] [CrossRef] [Scilit]
- Priyank, P.; Darshan, M.; Neeraj, S. A review on the application of the DRASTIC method in the assessment of groundwater vulnerability. Water Supply 2022, 22, 5190–5205. [Google Scholar] [CrossRef] [Scilit]
- Miron, A.; Morsal, S. A modified DRASTIC model for groundwater vulnerability assessment using connecting path and analytic hierarchy process methods. Environ. Sci. Pollut. Res. Int. 2023, 30, 111270–111283. [Google Scholar] [CrossRef] [Scilit]
- Escalonilla, G.; Santos, M. A machine learning approach to map the vulnerability of groundwater resources to agricultural contamination. Hydrology 2024, 11, 153. [Google Scholar] [CrossRef] [Scilit]
- Zeynab, M.; Reza, D.; Hossein, M. Groundwater vulnerability assessment in central Iran: Integration of GIS-based DRASTIC model and a machine learning approach. Groundw. Sustain. Dev. 2023, 23, 101037. [Google Scholar] [CrossRef] [Scilit]
- Bakhtiarizadeh, A.; Najafzadeh, M.; Mohamadi, S. Enhancement of groundwater resources quality prediction by machine learning models on the basis of an improved DRASTIC method. Sci. Rep. 2024, 14, 29933. [Google Scholar] [CrossRef] [Scilit] [PubMed]
- Liang, Y.; Zhang, X.; Sun, Y.; Yao, L.; Gan, L.; Wu, J.; Chen, S.; Li, J.; Wang, J. Enhanced groundwater vulnerability assessment to nitrate contamination in Chongqing, Southwest China: Integrating novel explainable machine learning algorithms with DRASTIC-LU. Hydrol. Res. 2024, 55, 663–682. [Google Scholar] [CrossRef] [Scilit]
- Zhang, T.; Wang, X.; Bi, E.; Huang, G.; Yang, R. Groundwater vulnerability evaluation and risk control in a certain area in northern Guangdong Province based on BP neural network. Environ. Eng. 2023, 41, 270–277. [Google Scholar] [CrossRef]
- Fahreddin, S.; Vahid, N.; Sana, M. Application of artificial neural network to improve DRASTIC-based groundwater vulnerability assessment. In 12th World Conference “Intelligent System for Industrial Automation” (WCIS-2022), Lecture Notes in Networks and Systems; Springer: Cham, Switzerland, 2024; Volume 718, pp. 273–281. [Google Scholar] [CrossRef] [Scilit]
- Dai, Q.; Liu, N. Alleviating the problem of local minima in Backpropagation through competitive learning. Neurocomputing 2012, 94, 152–158. [Google Scholar] [CrossRef] [Scilit]
- Zhou, L.; Sun, J.; Zhang, Y.; Chen, Y.; Lei, H. Optimization of the heat recovery performance of enhanced geothermal system based on PSO-GA-BP neural networks and analytic hierarchy process. Sci. Rep. 2025, 15, 21472. [Google Scholar] [CrossRef] [Scilit]
- Yu, G.; Wang, J.; Liu, L.; Li, Y.; Zhang, Y.; Wang, S. The analysis of groundwater nitrate pollution and health risk assessment in rural areas of Yantai, China. BMC Public Health 2020, 20, 437. [Google Scholar] [CrossRef] [Scilit]
- Meng, X.; Lu, J.; Wu, J.; Zhang, Z.; Chen, L. Quantification and evaluation of grey water footprint in Yantai. Water 2022, 14, 1893. [Google Scholar] [CrossRef] [Scilit]
- Zhou, D.; Shi, P.; Wu, X.; Ma, J.; Yu, J. Effects of urbanization expansion on landscape pattern and region ecological risk in Chinese coastal city: A case study of Yantai city. Sci. World J. 2014, 2014, 821781. [Google Scholar] [CrossRef] [Scilit]
- Yu, X.; Zhang, A.; Hou, X.; Li, M.; Xia, Y. Multi-temporal remote sensing of land cover change and urban sprawl in the coastal city of Yantai, China. Int. J. Digit. Earth 2013, 6, 137–154. [Google Scholar] [CrossRef] [Scilit]
- Yu, L.; Hou, X.; Gao, M.; Shi, P. Assessment of coastal zone sustainable development: A case study of Yantai, China. Ecol. Indic. 2010, 10, 1218–1225. [Google Scholar] [CrossRef] [Scilit]
- Gao, S.; Hu, S.; Bai, Y. Analysis of hydrogeological characteristics in Shandong Yantai District. Groundwater 2020, 42, 115–119. [Google Scholar] [CrossRef]
- Aller, L.; Bennett, T.; Lehr, J.; Petty, R.; Hackett, G. DRASTIC: A Standardized System for Evaluating Ground Water Pollution Potential Using Hydrogeologic Settings; Robert S. Kerr Environmental Research Laboratory, Office of Research and Development; US Environmental Protection Agency: Ada, OK, USA, 1987.
- Krishna, R.; Iqbal, J.; Gorai, A.; Pathak, G.; Tuluri, F.; Tchounwou, P. Groundwater vulnerability to pollution mapping of Ranchi district using GIS. Appl. Water Sci. 2015, 5, 345–358. [Google Scholar] [CrossRef] [Scilit] [PubMed]
- Wang, Y.; Lai, Y. Multi-stage neural networks: Function approximator of machine precision. J. Comput. Phys. 2024, 504, 112865. [Google Scholar] [CrossRef] [Scilit]
- Bian, H.; Chen, J.; Yang, R. A method for spatial correlations between groundwater vulnerability and pollution sources based on machine learning and cluster. Environ. Eng. 2025, 43, 112–120. [Google Scholar] [CrossRef]
- Sirat, M. Neural network assessment of groundwater contamination of US Mid-continent. Arab. J. Geosci. 2013, 6, 3149–3160. [Google Scholar] [CrossRef] [Scilit]
- Gad, G. Particle swarm optimization algorithm and its applications: A systematic review. Arch. Comput. Methods Eng. 2022, 29, 2531–2561. [Google Scholar] [CrossRef] [Scilit]
- Sengupta, S.; Basak, S.; Peters, R.A., II. Particle swarm optimization: A survey of historical and recent developments with hybridization perspectives. Mach. Learn. Knowl. Extr. 2018, 1, 157–191. [Google Scholar] [CrossRef] [Scilit]
- Foster, S. Fundamental concepts in aquifer vulnerability, pollution risk and protection strategy. In TNO Committee on Hydrological Research 1987; Proc. No. 38; van Duijvanbooden, W., van Waegeningh, H.G., Eds.; TNO: Delft, The Netherlands, 1987; pp. 69–86. [Google Scholar]
- Vrba, J.; Zaporozec, A. Guidebook on mapping groundwater vulnerability. IAH Int. Contrib. Hydrogeol. 1994, 16, 129–138. [Google Scholar]

Disclaimer/Publisher’s Note: The statements, opinions and data contained in all publications are solely those of the individual author(s) and contributor(s) and not of MDPI and/or the editor(s). MDPI and/or the editor(s) disclaim responsibility for any injury to people or property resulting from any ideas, methods, instructions or products referred to in the content. |
© 2026 by the authors. Licensee MDPI, Basel, Switzerland. This article is an open access article distributed under the terms and conditions of the Creative Commons Attribution (CC BY) license.