


Abstract
Although product returns present significant challenges for retailers, the service recovery paradox suggests they can also generate value. When return services are managed effectively, they can offset initial customer dissatisfaction and increase repurchase likelihood beyond what would occur without a return. However, prior research often treats returns as homogeneous, overlooking how different return types trigger distinct customer responses. Using transaction-level data from 27,178 orders at a major U.S. online apparel retailer between 2016 and 2019, this study investigates how customer-reported return reasons influence subsequent repurchase behavior. Return reasons are categorized by locus of responsibility—customer-, retailer-, or intermediary-attributed—and analyzed using logistic regression. The findings reveal substantial heterogeneity in post-return outcomes: customer-attributed returns are positively associated with repurchase, retailer-attributed returns are negatively associated, and intermediary-attributed returns show no significant effect. By demonstrating that return recovery effects depend on attribution, this study provides both theoretical insights and practical guidance for managing returns in a sustainable manner that enhances customer retention, improves operational efficiency, and strengthens the long-term sustainability of retail return management systems.
1. Introduction
Online shopping and the seemingly inevitable rise in product returns have grown rapidly worldwide over the past decade. Nearly 30% of online purchases are returned [1], making returns a substantial and persistent challenge for retailers. Such high return rates not only result in significant lost sales but also impose considerable costs related to reverse logistics, product inspection, and inventory management [2]. In the United States alone, the total cost of product returns was estimated at USD 101 billion in 2020 [3], with returns reducing retailer profits by an average of 3.8% [4].
Although product returns are often perceived as costly and inconvenient, prior research suggests that they also represent an important and underexplored opportunity rather than merely an operational burden: return events can foster additional customer–retailer interactions and strengthen customer relationships [5]. This idea is grounded in the Service Recovery Paradox (SRP), which suggests that post-recovery satisfaction can exceed pre-failure satisfaction when recovery performance is high [6]. In this context, a return represents a product failure and effectively managing it may leave customers more satisfied than if no return had occurred [7], thereby increasing the likelihood of repurchase. Empirical evidence supports this effect [8,9,10]. Consistent with these findings, a recent U.S.-based Narvar survey reports that 95% of online shoppers are willing to repurchase from a retailer following a positive return experience [11].
Despite growing evidence that product returns can yield positive outcomes, a critical research gap remains. Prior studies largely treat returns as a homogeneous phenomenon [8,10], implicitly assuming that effective return services uniformly translate into successful service recovery and favorable customer responses. This perspective obscures whether and under what conditions return experiences actually facilitate recovery rather than exacerbate dissatisfaction.
When customers initiate a return, they typically provide a reason that reflects their interpretation of why the product failed to meet expectations. We conceptualize this explanation as return attribution, a pivotal first step that frames the return event and shapes subsequent recovery processes. Extensive research on service failure recovery shows that blame attribution plays a central role in influencing trust [12], brand evaluations, and customer satisfaction [13,14], as consumers rely on attributional judgments to assess responsibility and fairness following a failure. When responsibility is assigned to the firm rather than the customer, perceptions of injustice intensify, undermining trust and satisfaction and, in turn, reducing repurchase intentions [15]. This dynamic can run counter to the service recovery paradox. Although attribution is central to understanding service failure and recovery [12,13,14], prior research has largely ignored its role in consumer return recovery, leaving a critical gap that limits both theoretical advancement and actionable managerial insight.
This study addresses this gap by examining how customer return attributions condition the achievement of successful recovery performance. To test the effect of attribution, we analyze 27,178 orders from a U.S.-based online apparel retailer, incorporating customer-reported return reasons such as sizing issues, preference mismatches, and quality concerns. Drawing on attribution theory, we classify these reasons based on whether responsibility is attributed to the customer, the retailer, or intermediaries. Using logistic regression analysis, we examine the relationship between return attributions and subsequent purchasing behavior. The results demonstrate that SRP is fundamentally conditional on attribution. Customer-attributed returns are positively associated with more favorable post-return responses and higher repurchase likelihood, consistent with the service recovery paradox. In contrast, retailer-attributed returns are negatively associated with repurchase outcomes, likely due to stronger negative emotions and heightened recovery expectations. Returns attributed to intermediaries, where responsibility is more ambiguous, show no significant recovery effects.
This research holds both academic and managerial significance. First, it addresses a critical gap by demonstrating that achieving the service recovery paradox in the customer return context is not automatic and cannot be ensured solely by providing superior return service. Instead, it is conditional. The positive effects of returns on repurchase behavior are contingent on how customers attribute responsibility for the return. By highlighting this conditional nature, the study extends the theoretical understanding of SRP beyond the recovery process. It also emphasizes the importance of customer perceptions and attributions in designing effective return management strategies.
Second, as an exploratory study, it addresses the limited understanding of why customers return products. This topic is often overlooked due to challenges in data accessibility and reliability. Return reason data are sensitive, multi-faceted, and often subjective, which complicates consistent analysis. We obtained data from retail partners and assessed its reliability using Inter-Rater Reliability (IRR), a measure of agreement among independent raters beyond chance [16]. To our knowledge, this is the first study to apply IRR to validate return reason data, offering a novel methodological contribution and a foundation for future research using customer-reported return reasons.
The remainder of the paper is organized as follows. We first review relevant literature and present the theoretical framework along with the research hypotheses. This is followed by a description of the research method, data analysis, and discussion of the findings. Finally, we outline the study’s contributions and limitations.
2. Literature Review
2.1. Service Recovery Paradox Based on Disconfirmation Theory
SRP suggests that customers who experience a product or service failure but receive an effective recovery may form more favorable behavioral intentions toward the provider than if no failure had occurred. Research shows that strong service recovery strategies are linked to higher customer satisfaction, increased positive word-of-mouth [17], and a greater likelihood of future purchases [15]. Originally conceptualized by [6], SRP has been widely adopted in service marketing research to examine customer responses to service failure and recovery efforts [18].
Two theoretical frameworks underpin SRP. The first is the commitment-trust theory [19]. This theory posits that trust develops when one party perceives their exchange partner as reliable and honest. Trust is reinforced through past interactions, including conflict resolution. Effective service recovery signals fairness and responsiveness, strengthening customer trust and reinforcing confidence in the firm’s integrity and commitment [20]. Because trust is central to customer retention [21], well-executed recovery efforts are positively associated with future purchasing behavior.
The second foundational framework is the disconfirmation paradigm, a widely accepted explanation for the service recovery paradox. Reference [22] develops an advanced disconfirmation model to analyze customer reactions to service recovery following a product failure. The model posits that overall customer satisfaction is shaped not only by initial disconfirmation—the gap between expectations and product performance—but also by disconfirmation during the recovery process, in which customers compare their expectations with their actual recovery experience. When recovery performance exceeds expectations, positive disconfirmation occurs and satisfaction increases. The service recovery paradox emerges when satisfaction derived from the recovery service outweighs the initial dissatisfaction caused by the product failure.
In the context of our research, commitment–trust theory has limited relevance. Product returns are frequent, and lenient return policies are common; as a result, customers often perceive efficient return management as standard practice rather than as an exceptional corrective effort capable of substantially altering trust. Accordingly, we adopt the disconfirmation paradigm to explain the service recovery paradox in the context of return failures.
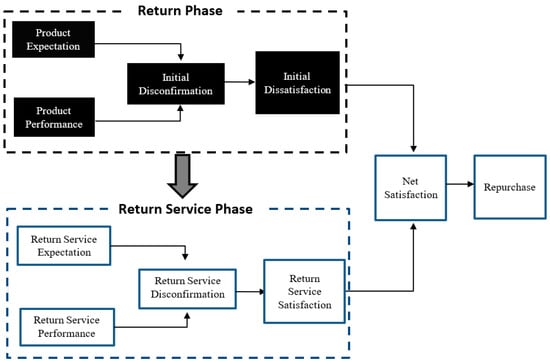
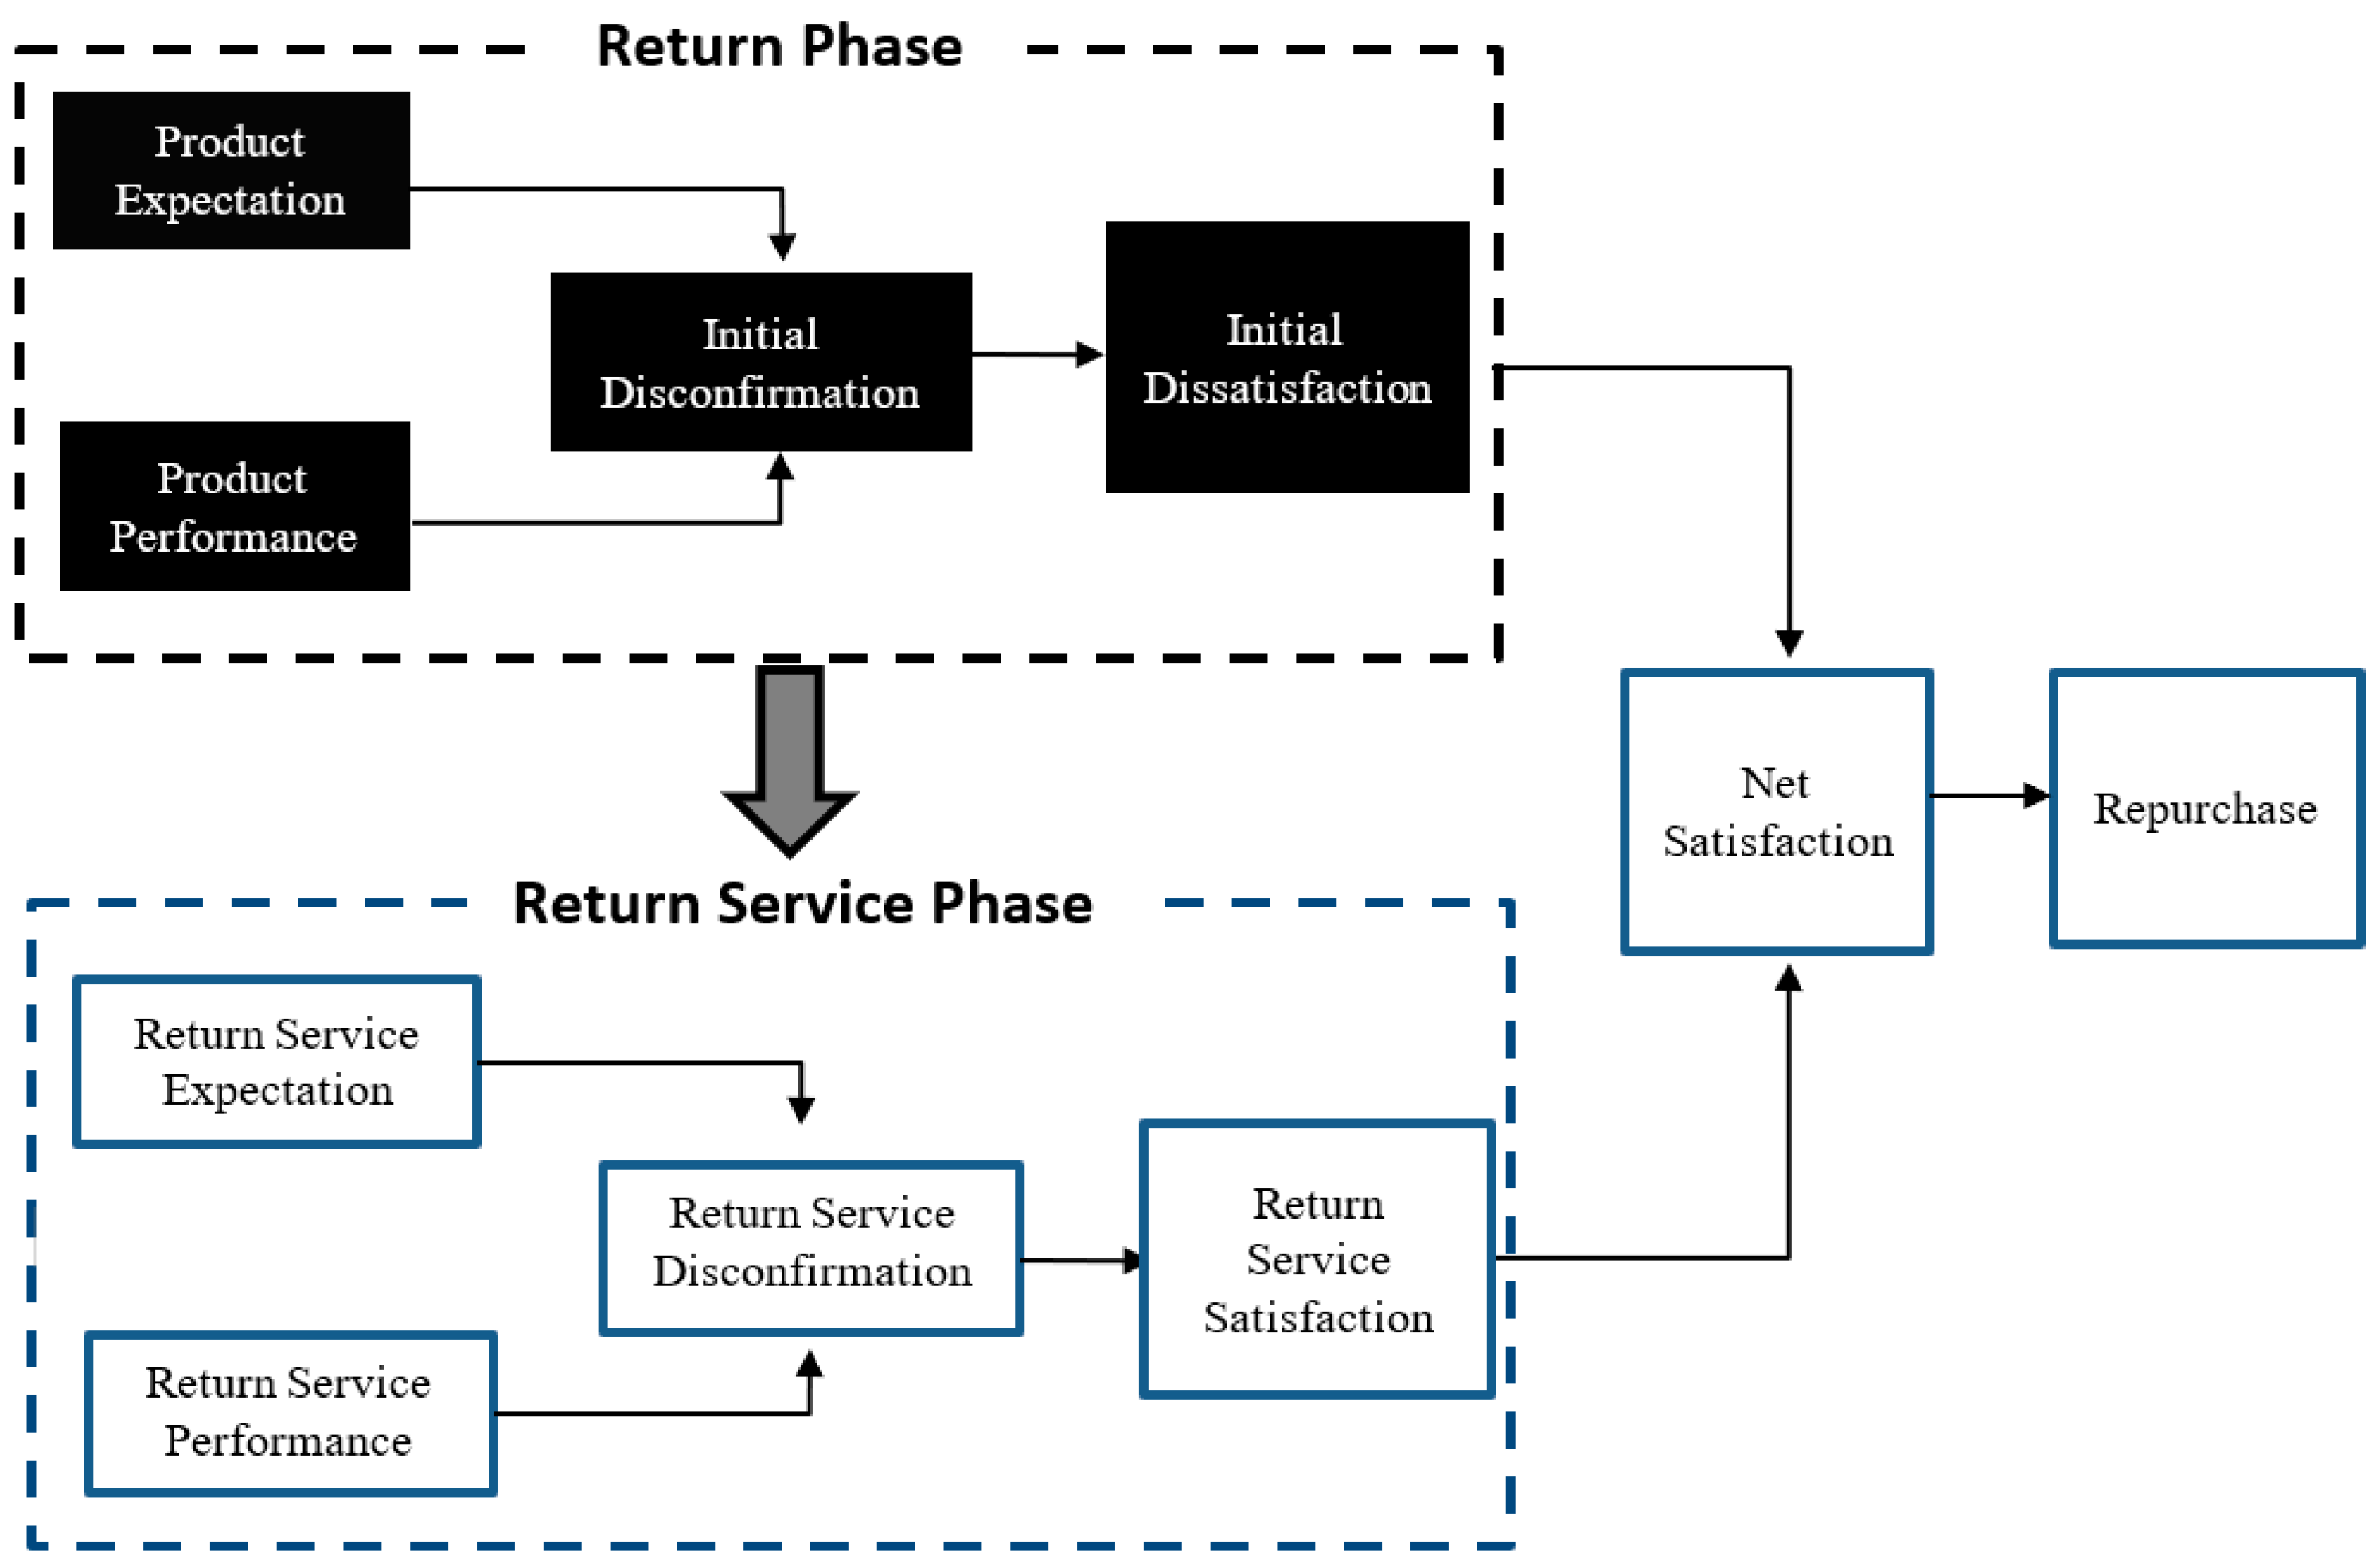
To deepen our understanding, we adapt the disconfirmation model [22] to the customer return context, illustrating how customers’ overall satisfaction is shaped not only by initial product performance but also by the effectiveness of the subsequent recovery process (Figure 1). This framework comprises two key disconfirmation pathways. The first captures customers’ initial satisfaction, determined by whether the product meets expectations. Negative disconfirmation arises when the product underperforms, often triggering a return. The second pathway concerns the recovery process. Effectively managing the return generates positive disconfirmation, enhancing overall satisfaction. Consistent with SRP principles, when satisfaction from the return service outweighs initial dissatisfaction with the product, it fosters a positive perception of the retailer. This, in turn, increases the likelihood of repeat purchases, reflecting a successful SRP.
Figure 1.
Modified Return Service Recovery Paradox Based on Disconfirmation Theory.
2.2. Customer Uncertainty, Bracketing, and Returns in Online Apparel Retail
A fundamental difference between brick-and-mortar and online retail is that customers cannot physically examine products before purchase. While digital descriptions convey some information, many attributes—such as fit, comfort, and style—can only be assessed through direct experience [23]. This pre-purchase uncertainty is particularly pronounced in the apparel industry, which accounts for roughly 25% of online retail revenues [24].
To address these uncertainties, online apparel retailers often offer generous return policies, allowing customers to try products at home before committing to a purchase. Platforms such as Amazon Prime Wardrobe, Zappos, and omnichannel retailers like Nordstrom and Macy’s enable customers to order multiple sizes or styles at no return cost. This practice, known as bracketing, effectively transforms customers’ homes into “dressing rooms,” allowing them to experiment with several items and return those that fail to meet expectations. Empirical evidence indicates that nearly 50% of online apparel customers use bracketing for at least some purchases [25]. While bracketing reduces uncertainty and can stimulate sales, it also substantially increases return volumes, creating operational challenges for retailers.
2.3. SRP in Online Apparel Returns
Returns in the online apparel industry generate substantial volume and impose significant operational costs, making the strategic management of the service recovery paradox particularly important. Within the SRP framework, a return is initially perceived as a product failure, signaling that the purchased item does not meet customer expectations. However, when retailers implement effective return services, they transform the failure into a positive experience. Such responses not only enhance customer satisfaction but also foster loyalty and increase the likelihood of future purchases [8,10,26].
References [9,26] demonstrate that returns can positively influence customer lifetime value, challenging the assumption that higher return rates necessarily reduce satisfaction or long-term value. Reference [10] shows that returns can enhance subsequent buying behavior, with moderate-return customers exhibiting the highest repurchase rates. Reference [8] provides a more granular perspective, revealing that customers who experience returns repurchase more frequently, in larger quantities, and at higher transaction values than those who never return products. Collectively, these findings indicate that, when managed strategically, product returns are not merely a cost or operational burden; they serve as a powerful mechanism for strengthening long-term customer relationships and enhancing both loyalty and revenue.
As prior research suggests, the SRP can be achieved in the context of consumer returns. A key question, then, is how firms can realize SRP in practice. As illustrated in Figure 1, two primary strategies increase the likelihood of successful service recovery: (1) minimizing the initial dissatisfaction associated with returns, and (2) enhancing satisfaction with the return service itself. Early research primarily focuses on the second strategy, emphasizing the optimization of return services to enhance customer satisfaction and encourage future purchases. For example, based on a survey of 464 customers, Reference [27] examines how firms’ return management systems influence loyalty, finding that higher service recovery quality—including efficient return handling, appropriate compensation, accessible support channels, and user-friendly website navigation—is positively associated with both return satisfaction and loyalty intentions, whereas greater customer effort in processing a return has the opposite effect. Reference [8] further shows that faster return processing increases repurchase frequency and transaction volume, and Reference [5] demonstrates that positive in-store return experiences contribute to higher future purchase rates.
Table 1 summarizes the key studies on return service recovery discussed above. Collectively, prior research demonstrates that high-quality return services can positively influence subsequent customer purchases, providing robust evidence for the occurrence of the service recovery paradox in the context of customer returns. Building on this literature, we propose a baseline hypothesis to capture the general effect of return experiences on repurchase:
Table 1.
Returns Service Recovery Literature.
Baseline Hypothesis.
A return is positively associated with the likelihood of customer future purchase.
2.4. Attribution Theory in Return Service Recovery
As noted above, effective return recovery encompasses website usability, service quality, customer effort [27], return processing speed [8], and in-store return experiences [5]. These elements are key drivers of SRP for retailers. However, their effectiveness depends on understanding the underlying causes of customer dissatisfaction. Many firms struggle to retain dissatisfied customers because they lack insight into these causes [28]. This highlights the critical importance of examining return attributions.
Attribution theory, a foundational framework within the SRP paradigm, posits that when customers experience a service failure, they engage in causal reasoning to determine its cause [29]. Individuals naturally seek explanations, especially after negative experiences [30]. The perceived cause of a product failure strongly shapes customer responses. Reference [31] identifies three key attribution dimensions that shape customer responses to service failures: locus, stability, and controllability. Locus indicates who is responsible, stability reflects the likelihood of recurrence, and controllability concerns whether the failure could have been prevented or mitigated. Of these, locus receives the most attention [32], as it captures whether customers perceive the failure as internal (their own responsibility) or external (the retailer’s responsibility), which in turn influences dissatisfaction and expectations for service recovery.
When customers attribute a product failure to their own actions, their decisions are heavily influenced by self-perception and emotions. For instance, mistakes due to inattention (e.g., “I ordered the wrong item or size”) may evoke guilt, whereas failures from misjudging product quality (e.g., “I bought a subpar product”) can trigger embarrassment or frustration. Despite these negative emotions, customer self-attributions rarely provoke anger toward the retailer, as customers see themselves as responsible. Because customer-attributed failures lead to lower dissatisfaction and modest expectations for recovery, retailers can alleviate negative feelings through efficient return processes, potentially increasing future purchases. Based on this reasoning, we propose:
Hypothesis 1 (H1).
A customer-attributed product return is positively associated with the likelihood of future customer purchases.
In contrast, returns attributed to the retailer are generally perceived as more severe than self-attributed failures [33]. This heightened perceived severity stems from two main factors. First, retailer-related failures elicit stronger negative emotions, particularly anger, directed at the firm responsible [30]. Second, customers expect the party at fault to resolve the issue. When a failure is attributed to the retailer, customers anticipate substantial recovery efforts, such as refunds, replacements, or apologies, to a far greater extent than they would for self-attributed failures [34]. The combination of intensified negative emotions and elevated recovery expectations creates significant challenges for service recovery. If firms fail to meet these expectations, dissatisfaction intensifies, potentially reducing the likelihood of future purchases. Based on this reasoning, we propose:
Hypothesis 2 (H2).
A retailer-attributed product return is negatively associated with the likelihood of future customer purchases.
While product failures can be attributed internally to the customer or externally to the retailer, some cases lack a clear cause, a phenomenon referred to as attribution ambiguity [35,36]. Ambiguity is particularly common when an intermediary, a third party facilitating the transaction, is involved [37]. For instance, in the travel industry, agencies mediate between customers and service providers such as airlines or hotels, while in online retail, logistics providers (e.g., UPS or USPS) deliver products from retailers to customers. When returns involve intermediaries, customer attribution becomes uncertain. Emotional responses toward the retailer are typically muted due to the diffusion of responsibility. Although customers may experience some dissatisfaction if the product is damaged or an incorrect intermediary is used, this dissatisfaction is weaker and less directly targeted at the retailer compared with retailer-attributed failures [38]. Expectations for corrective action are also lower, reducing the potential for strong negative post-recovery reactions. At the same time, customers rarely attribute the failure to themselves, making positive disconfirmation sufficient to trigger the service recovery paradox less likely. Consequently, intermediary-attributed returns are expected to have no significant positive or negative effect on subsequent repurchase behavior. Based on this reasoning, we propose:
Hypothesis 3 (H3).
An intermediary-attributed product return is not significantly associated with the likelihood of future customer purchases.
3. Materials and Methods
3.1. Data and Sample
We collect data from a U.S.-based online apparel retailer covering the period from January 2016 to March 2019. The company offers a limited product range, including pants, tops, sweaters, shorts, skirts, coats, and jackets, with pants accounting for over 70% of inventory. The dataset consists exclusively of online customers, the majority of whom are domestic U.S. residents.
The retailer maintains a lenient and consistent return policy throughout the study period. Returns incur no cost to customers, as return shipping is free, and refunds are processed efficiently, with approximately 75% of returned orders fully refunded within 20 days. Initial delivery requires moderate shipping fees (USD 7–8), while orders over USD 125 qualify for free shipping. This non-refundable fee may serve as an implicit restocking charge, potentially discouraging returns [39]. Given the retailer’s high average unit price (approximately USD 100) and the prevalence of bracketing, about 75% of orders exceed the USD 125 free-shipping threshold and therefore qualify for free shipping.
The dataset contains detailed information on products, order value, order size, shipping costs, returns, and promotions (discounts and coupons). The initial dataset includes 28,628 orders (54,101 items), of which approximately 25% (7506 orders; 11,841 items) involve returns or exchanges. Orders with subtotals below USD 20 are excluded due to the retailer’s higher pricing, and exchange items are removed to focus solely on returns. After aggregating data across order, item, return, and return-item datasets, the final sample consists of 27,178 orders, including both returned and non-returned orders.
3.2. Reliability Check
Before classifying return attributions and analyzing their effects, we first assess the reliability of our data. Customer-provided return reason codes form the basis for our attribution classification. For example, sizing issues are indicated by “TB” (Too Big) and “TS” (Too Small), while product dislike is captured by “DNL,” such as disliking the color or style. Product quality concerns include “NAP” (Not As Pictured), “QTY” (Quality), and “DM” (Damaged Items), reflecting discrepancies between the received item and its depiction, general quality issues, or damage. Less common reasons include “OWI” (Ordered Wrong Item) and “RWI” (Received Wrong Item). Table 2 summarizes the return reason codes, their frequencies, and explanations.
Table 2.
Summary of Return Reason Code.
However, as noted above, these customer-selected codes can be subjective or inconsistent, potentially introducing bias into the analysis. A further challenge is that existing literature offers limited guidance on studying return reasons or methods to test their reliability. Fortunately, the raw data also include customer comments—for example, “Larger than the size I bought this spring” or “Did not like the fabric”—which provide additional context for return decisions. After reviewing the literature, we decide to use these comments to evaluate the reliability of the return reason codes by conducting an inter-rater reliability check. IRR measures how consistently different raters categorize the same variable, ensuring data validity [40].
Specifically, two raters recode the return reason codes based on the customer-provided comments to determine whether the raters’ classifications are consistent with the original codes. For this analysis, we randomly select 500 returns from the sample. Two independent raters are randomly assigned to categorize each return based on the corresponding customer comment. We then compare the raters’ classifications with the original customer-provided codes. To quantify agreement, we use Cohen’s kappa, a widely used metric for nominal data that accounts for chance agreement [41]. Kappa values range from −1 (complete disagreement) to +1 (perfect agreement), with 0 indicating chance-level agreement. Following [40], a kappa of 0.40 or higher is considered acceptable. Our analysis yields kappa scores of 0.40 for rater 1 and 0.53 for rater 2, both meeting or exceeding the threshold. These results demonstrate satisfactory agreement between the raters and customers, confirming the reliability of the return reason codes for further analysis.
3.3. Variables
Dependent variable.
Our primary dependent variable, RepurchaseDummy, is a binary indicator of whether a customer makes a future purchase from the retailer. Specifically, a repurchase is defined as a second order following the first, a third order following the second, and so on.
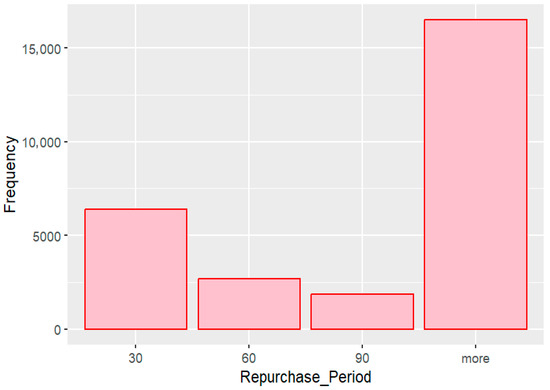
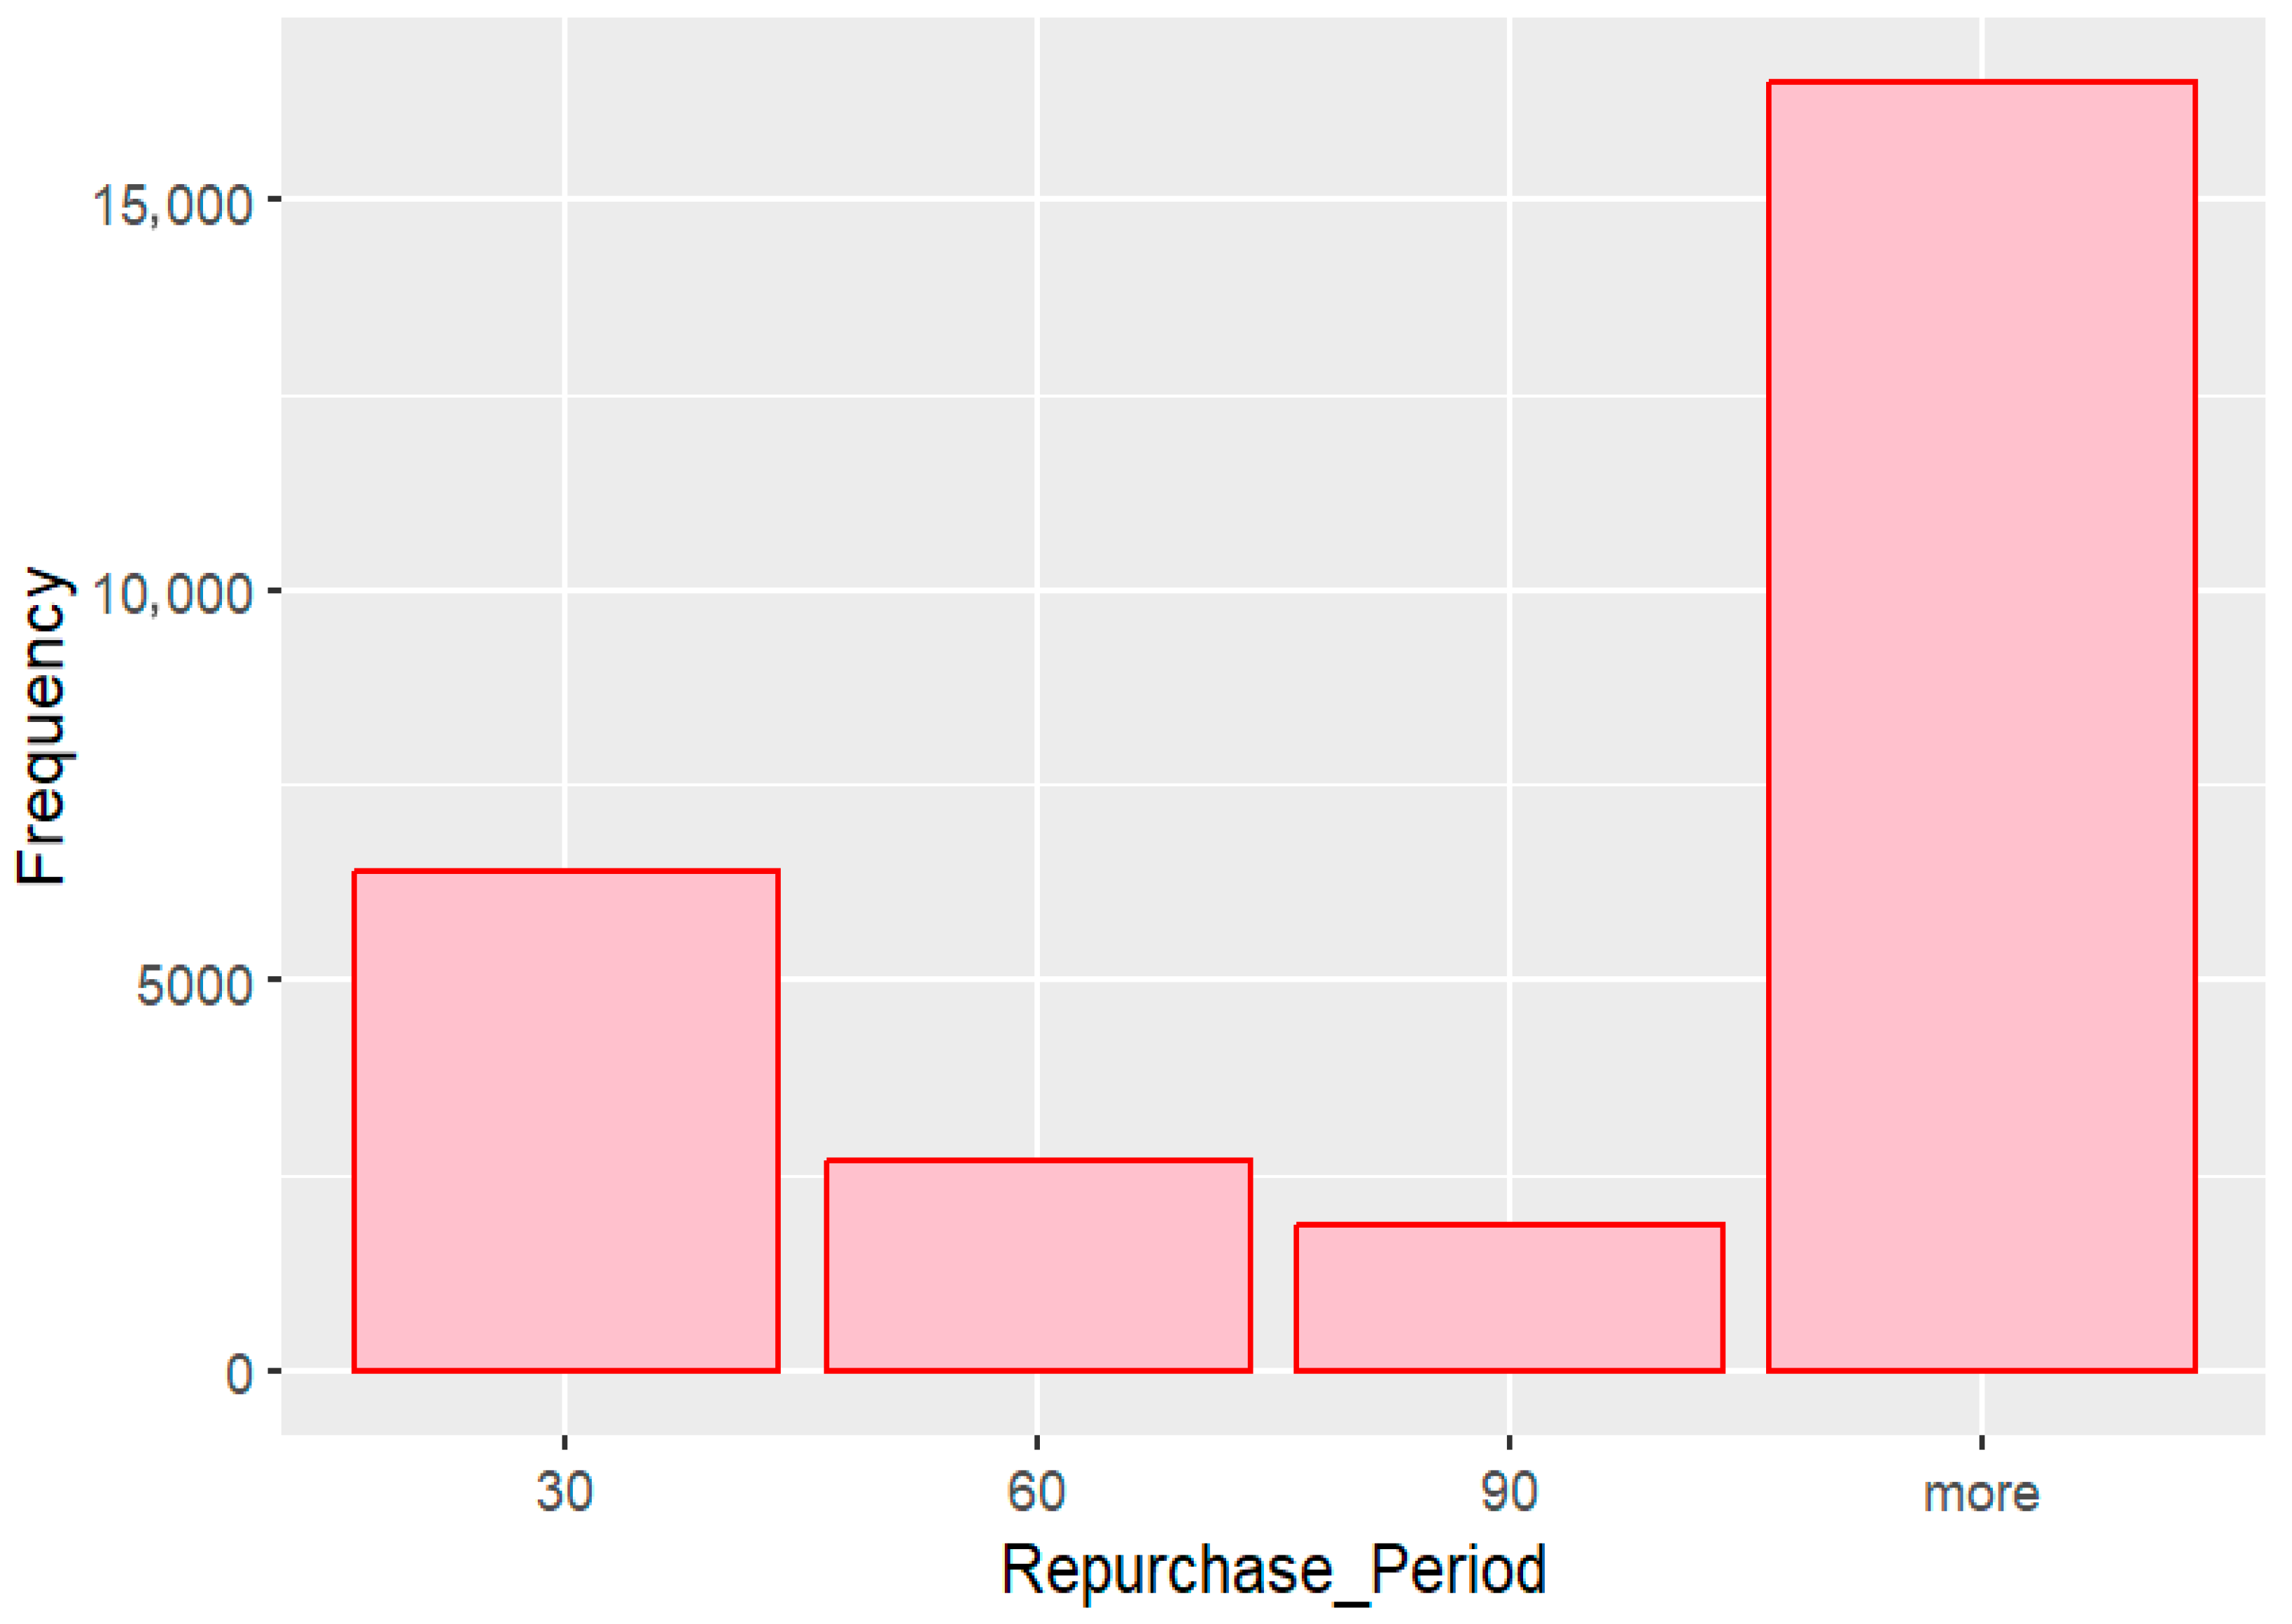
Customers may place repurchases within 30, 60, or 90 days (see Figure 2). To ensure relevance, we set a 60-day threshold, which corresponds roughly to one month after customers complete returns and receive refunds (typically around 20 days post-purchase). Repurchases within 60 days are coded as 1, and those beyond 60 days are coded as 0. We also test alternative thresholds of 50 and 70 days to check whether the direction and significance of attribution variables remain consistent, rather than relying solely on the 60-day window.
Figure 2.
Repurchase Distribution by Period (Days).
Due to data limitations, we cannot determine the exact date of the next purchase for a customer’s final recorded order. To approximate repurchase timing, we initially treat the latest order date in the dataset as the repurchase date. However, purchases beyond the dataset’s observation period are unobservable, creating a right-censoring issue. For instance, if a customer places an order 30 days before the dataset ends, it is unclear whether a repurchase would occur within the full 60-day window. Treating such orders as non-repurchases would misclassify these censored observations. To address this, we exclude all orders placed in the final 60 days of the dataset. This ensures that all included orders have a fully observed 60-day repurchase window, minimizing potential bias from incomplete data.
Independent variables.
Return Dummy. To examine the overall impact of returns on repurchase behavior (baseline hypothesis), we introduce ReturnDummy, a binary variable indicating whether a customer returns one or more products in an order. If a return occurs, the variable is coded as 1; otherwise, it is 0.
Customer-, Retailer-, and Intermediary-Attributed Returns.
To investigate the distinct effects of different return types on repurchase behavior (H1–H3), we classify returns based on attributed reasons. We construct three dummy variables: Customer-Attributed Returns, Retailer-Attributed Returns, and Intermediary-Attributed Returns. This classification follows the failure recovery framework of [42], which categorizes service failures into three types:
- Service delivery or product failures—e.g., packaging errors, out-of-stock items, product defects, website malfunctions.
- Customer-related failures—e.g., ordering errors, size mismatches.
- Employee-initiated failures—unprompted actions by company employees.
We first classify Intermediary-Attributed Returns. According to [42], packaging errors, out-of-stock items, and website malfunctions are delivery or product failures, not retailer or customer-related failures. Consistent with this framework, we classify returns involving items damaged during shipping (DM), manufacturing defects (QTY), or discrepancies between product descriptions and received items (NAP) as Intermediary-Attributed Returns, as these returns typically involve intermediaries such as delivery companies, manufacturers, or website design teams. While retailers may share some responsibility, for example, by selecting intermediaries that cause product damage, intermediaries often complicate attribution, creating attribution ambiguity [37]. Following the literature, DM, QTY, and NAP returns are coded as 1 for IntermediaryAttributedReturns and 0 otherwise.
Aligned with [42], returns resulting from customers ordering the wrong item (OWI) or experiencing size mismatches (TB or TS) are classified as Customer-Attributed Returns. While sizing issues could occasionally be attributed to retailers due to inaccurate size charts, these returns are more commonly customer-attributed because clothing fits differently across body types, and customers frequently return items that fail to meet their personal fit expectations. These returns primarily reflect customer decisions or preferences rather than product defects or retailer errors. Additionally, many consumers engage in bracketing, ordering multiple sizes of the same item with the intention of returning those that do not fit [25], which contributes to sizing-related returns. Consistent with the literature, the CustomerAttributedReturns variable is coded as 1 for these categories (TB, TS or OWI) and 0 otherwise.
Finally, we classify Retailer-Attributed Returns. While [42] associate retailer-attributed returns with employee interactions, this framework is less applicable in online retail, where such interactions are minimal. We include “Do Not Like” returns in this category. Although DNL returns may appear to reflect customer preferences, many occur because the product fails to meet expectations regarding design, color, or style—factors determined by the retailer’s assortment and presentation. Empirical evidence shows that dissatisfaction with product attributes, rather than changes in customer preferences, is among the most frequently cited reasons for returns [43], supporting their classification as primarily retailer-attributed. In addition, returns due to receiving the wrong item (RWI), such as receiving a product different from what was ordered, reflect direct retailer responsibility. Accordingly, the RetailerAttributedReturns variable is coded as 1 for RWI or DNL returns and 0 otherwise.
Another note is that we define attribution variables at the order level. Each return reason code is classified into one of three categories: Intermediary-, Customer-, or Retailer-Attributed Returns. For orders containing multiple returned items, each item is evaluated individually according to its reason code. If an order includes items spanning multiple attribution categories, the corresponding order-level dummy variables are coded as 1 for each applicable category. For example, an order with one item returned due to a manufacturing defect and another returned due to a customer misjudgment of size is coded as 1 for both Intermediary-Attributed Returns and Customer-Attributed Returns. This approach allows attribution categories to overlap within a single order, capturing multiple return motivations.
Control Variables.
To account for order characteristics, we include several key variables. We control for the total dollar value of a transaction (OrderValue) and the number of items purchased (OrderSize) to capture the impact of order size. We also control for factors that may influence future purchases, such as discounts provided to the customer (OrderDiscount) and shipping and handling fees (ShippingPrice).
Customer-related control variables are also included. We account for the number of previous orders placed by the customer (CustomerPreviousOrders), which captures the strength of the buyer-retailer relationship—a well-established determinant of repurchase behavior [44]. To address endogeneity introduced by “bracketing” practices, we also include CustomerPreviousBracketingOrders.
Finally, we include indicator variables for product categories to capture differences in repurchase behavior across items, such as pants, shirts, tops, and shorts. We also incorporate indicators for the Year of the transaction, as well as for transactions occurring during the holiday season (Month) or on weekends (Weekday), to account for seasonal and temporal effects. Standard errors are clustered at the customer level to correct for heteroskedasticity and within-customer correlation.
3.4. Descriptive Statistics
Table 3 presents summary statistics for all variables used in the analysis. Of the 27,178 orders, approximately 33% are customer repurchases. Around 26% of orders involve returns. Among these returns, 16% of orders (calculated over the total number of orders) include items returned due to customer-caused issues, 5% involve retailer-related issues, and 4% involve product quality issues attributed to intermediaries. These return categories are not mutually exclusive. If an order contains multiple returned items from different attribution categories, the order-level dummy variables are coded as 1 for each applicable category. The average transaction value is USD 265.97, with an average basket size of two items. Shipping and handling fees average USD 1.28, ranging from USD 0 to USD 30. Domestic customers may qualify for free shipping if they meet the retailer’s threshold, while international customers may incur fees up to USD 30. The average discount per order is USD 7.18, with a maximum recorded discount of USD 418.40. On average, customers have placed about two previous orders, with a maximum of 49. This indicates that some customers purchase sporadically, while others maintain a strong long-term purchase history and engage in frequent transactions. Notably, 25% of prior purchases—equivalent to an average of 0.5 orders per customer—are classified as “bracketing” orders. This suggests that customers often buy multiple units of the same product to try on before making a final selection.
Table 3.
Descriptive Statistics of Variables.
3.5. Logistic Regression Analysis
We examine the impact of returns on customer repurchases using a logistic regression model. The model expresses the probability of repurchase in terms of the log-odds of a customer making a subsequent purchase as a linear combination of return dummies and control variables. To account for unobserved heterogeneity, we include fixed effects for year, month, weekday, and product category. Standard errors are clustered at the customer level to correct for heteroskedasticity and within-customer correlation. Specifically, to assess the overall effect of returns on repurchase behavior, we formulate the following equation:
To evaluate how customer attributions for returns affect subsequent repurchases, we incorporate three types of returns, Customer-, Retailer-, and Intermediary-Attributed Returns, into the empirical model:
4. Results
4.1. Main Results
4.1.1. Effect of Customer Return on Repurchase (Baseline Hypothesis)
We first examine the overall impact of returns on customer repurchase. To test this hypothesis, we conduct a logistic regression analysis controlling for order value, order size, discount, shipping price, previous customer orders, customer bracketing history, product category, and fixed effects for year, month, and weekday. Table 4 presents the regression coefficients and their significance levels. The results indicate that, holding other variables constant, the odds of repurchase for a returned order are approximately 10% higher than for a non-returned order (EXP(0.092)). This suggests that returns are associated with an increased likelihood of customer repurchase. These findings provide additional support for the existence of SRP in the customer return domain. In other words, returns—when accompanied by effective return service—serve as additional touchpoints that enhance customer satisfaction and encourage future purchases. Thus, the baseline hypothesis is supported.
Table 4.
Results for Returns’ Effect on Repurchase.
The control variables demonstrate clear and meaningful effects. Larger order amounts are positively associated with the likelihood of repurchase, suggesting that customers who spend more tend to repurchase. In contrast, order size alone is not significantly associated with repurchase, likely due to limited variation (with an average of two items per order) or because its effect is largely captured by order value. Shipping costs are negatively associated with repurchase, reflecting customers’ sensitivity to perceived burdens or unfair charges [45]. Similarly, order discounts are not significantly associated with repurchase, suggesting that deal-seeking customers prioritize price over loyalty and are less likely to repurchase without additional incentives. The number of previous orders is positively associated with repurchase, highlighting the role of customer experience and loyalty, whereas previous bracketing orders show no significant association, indicating that such past bracketing behaviors do not reliably correspond to future purchases.
4.1.2. Effect of Customer Attributions on Repurchase (H1, H2, H3)
Building on our initial analysis, we further examine how different return types, classified by customer attributions, are associated with subsequent repurchase behavior. To test this, we conduct regression analyses assessing the relationship between customer-attributed returns, retailer-attributed returns, and intermediary-attributed returns and the likelihood of repurchase. The model controls for key factors, including order value, order size, discounts, shipping costs, prior purchase history, bracketing behavior, product category, and fixed effects for year, month, and weekday. Table 5 presents the estimated coefficients and their statistical significance.
Table 5.
Results for Effect of Customer Attributions on Repurchase.
The results indicate that customer-attributed sizing returns are positively associated with repurchase, supporting H1. In contrast, retailer-attributed returns are negatively associated with repurchase, supporting H2, while intermediary-attributed returns show no statistically significant association, supporting H3. This pattern likely reflects attribution ambiguity [37]: when an intermediary is involved, customers are less inclined to assign blame to themselves or the retailer. Such returns generate moderate dissatisfaction—insufficient to deter future purchases but not strong enough to enhance them—resulting in a neutral effect on repurchase behavior. All control variable effects are consistent with those observed in the baseline hypothesis.
As with the baseline results, the Pseudo-R2 for the logistic regression model is 0.13. While relatively low, this is expected in models of individual customer behavior, given the complexity and variability of repurchase decisions. Low R2 values are common in behavioral research because individual choices are influenced by numerous unobserved factors. Nevertheless, the model yields statistically significant results and provides meaningful insights into the associations between return attributions and repurchase behavior, highlighting the importance of considering attributional effects even when the variance explained is modest.
4.2. Robustness Checks
4.2.1. Alternative Repurchase Thresholds: 50-Day and 70-Day Windows
To validate our empirical results, we replace the baseline 60-day repurchase threshold with alternative windows of 50 and 70 days and reexamine the impact of different return attributions on customer repurchase behavior. The results (Table 6 and Table 7) using these alternative thresholds are highly consistent with the main analysis. Across both windows, customer-attributed returns remain positively and statistically significantly associated with repurchase likelihood, whereas retailer-attributed returns continue to exhibit a negative and significant effect. In contrast, intermediary-attributed returns remain statistically insignificant under both alternative specifications. Moreover, the magnitude and direction of the control variables are largely stable across models. Together, these findings indicate that our core results do not hinge on the specific choice of the 60-day repurchase threshold and are robust to reasonable variations in the post-purchase observation window.
Table 6.
Results for Effect of Customer Attributions on Repurchase Using a 50-Day Repurchase Threshold.
Table 7.
Results for Effect of Customer Attributions on Repurchase Using a 70-Day Repurchase Threshold.
4.2.2. Repurchase Amount and Repurchase Size as Alternative Outcome Variables
To further validate our empirical results, we replace the repurchase dummy with repurchase amount and repurchase size as outcome variables. We then reexamine the effects of different return types, based on customer attributions, on repurchase behavior. The analysis yields consistent results. Customer-attributed returns are positively associated with repurchase amount and size, supporting H1, whereas retailer-attributed returns are negatively associated with both outcomes, supporting H2. Intermediary-attributed returns show no significant association with either measure, supporting H3. These robustness checks, presented in Table 8 and Table 9, further confirm and reinforce our original findings for Hypotheses 1, 2, and 3.
Table 8.
Results for Effect of Customer Attributions on Repurchase Amount.
Table 9.
Results for Effect of Customer Attributions on Repurchase Size.
5. Discussion
This study examines how customer attributions for product returns are associated with subsequent repurchase behavior, extending the service recovery paradox to the return context. Consistent with our hypotheses, the results reveal substantial heterogeneity in post-return outcomes depending on where customers attribute responsibility for the return. These findings underscore that service recovery effects are conditional rather than universal and depend critically on customer perceptions of responsibility.
First, customer-attributed returns are positively associated with repurchase likelihood, aligning with prior evidence that returns can strengthen customer relationships when recovery expectations are modest. When customers attribute the return to their own actions, such as ordering the wrong size or product, the initial failure is perceived as less severe. In these cases, a smooth and efficient return process exceeds relatively low expectations, generating positive disconfirmation and reinforcing the SRP. This finding complements earlier work showing that return experiences can enhance customer lifetime value and future purchasing behavior [8,10], while clarifying that such benefits depend on attribution rather than return occurrence alone.
In contrast, retailer-attributed returns are negatively associated with repurchase behavior. When customers perceive the retailer as responsible for the failure, such as through poor product design, inaccurate descriptions, or unmet style expectations, dissatisfaction intensifies and recovery expectations rise. Even high-quality return service may be insufficient to fully offset these negative perceptions, leading to adverse post-return outcomes. This finding challenges the assumption that superior return service alone guarantees SRP and is consistent with attribution theory, which suggests that externally attributed failures erode trust and heighten perceptions of unfairness [20]. It also extends prior consumer return recovery research by showing that recovery effectiveness hinges on perceived responsibility, rather than operational excellence alone.
Finally, intermediary-attributed returns show no statistically significant association with repurchase behavior. When responsibility lies with an intermediary, such as a logistics provider, attribution ambiguity reduces the intensity of both negative emotions and recovery expectations. As a result, these returns neither meaningfully harm nor enhance subsequent purchasing. This neutral effect aligns with prior research on ambiguous locus of control, suggesting that unclear responsibility dampens behavioral responses [38].
Together, these findings advance the SRP literature by introducing a conditional, attribution-based perspective. Prior studies primarily focus on the recovery process itself, emphasizing speed, convenience, and compensation. Our results demonstrate that recovery outcomes also depend on an earlier stage of the post-purchase process: how customers interpret the cause of the return. By showing that identical recovery efforts can yield different outcomes depending on attribution, this study extends SRP theory beyond recovery execution to include customer sensemaking and responsibility assignment.
6. Conclusions
This study shows that the effect of product returns on repurchase behavior depends fundamentally on how customers assign responsibility for the return. Customer-attributed returns are positively associated with repurchase, retailer-attributed returns are negatively associated with repurchase, and intermediary-attributed returns have no significant effect.
These findings advance service recovery paradox research by demonstrating that recovery effectiveness is conditional on attribution, not merely on the quality of return service. By shifting attention from recovery execution to perceived responsibility, this study extends SRP theory and offers a more precise explanation of post-return customer behavior.
Practically, these findings provide actionable guidance for retailers seeking to optimize return management, strengthen customer retention, and allocate marketing resources more effectively. First, understanding return attributions enables retailers to tailor strategies that maximize customer satisfaction. For customer-attributed returns, a seamless and convenient return process is critical, as these customers remain highly likely to repurchase when return service is satisfactory. In contrast, retailer-attributed returns pose a greater challenge, being associated with lower repurchase likelihood even under high-quality return service. To mitigate these effects, retailers should reduce such returns through improved product design and implement proactive recovery strategies—targeted incentives and personalized communication—to alleviate post-return dissatisfaction and secure retention. Second, attribution insights guide resource allocation: customer-attributing returners, despite frequent returns, remain highly profitable and justify greater investment in retention-focused incentives, such as personalized discounts or coupons.
Despite its contributions, this study has several limitations. First, it focuses on the apparel industry, where returns are often driven by fit and style uncertainty, potentially limiting generalizability to other sectors such as electronics, home goods, or subscription services. Future research could explore cross-industry contexts. Second, the analysis relies on return reason codes rather than directly reported customer attributions or emotions. Incorporating self-reported attributions in future studies could offer deeper insight into the psychological mechanisms linking attribution, satisfaction, and repurchase. Third, the data span 2016–2019, prior to the COVID-19 pandemic. While this allows isolation of attribution and service recovery mechanisms, future research should investigate whether these relationships differ in post-pandemic retail environments, characterized by higher return tolerance and evolving customer expectations.
Author Contributions
Conceptualization, D.L. and G.S.; Methodology, D.L. and G.S.; Formal Analysis, D.L.; Writing—Original Draft Preparation, D.L.; Writing—Review and Editing, G.S.; Supervision, G.S.; Funding Acquisition, D.L. All authors have read and agreed to the published version of the manuscript.
Funding
This research was funded by the James Madison University 2025 Summer Grant.
Institutional Review Board Statement
Not applicable.
Informed Consent Statement
Not applicable.
Data Availability Statement
The raw data supporting the conclusions of this article will be made available by the authors on request.
Conflicts of Interest
The authors declare no conflicts of interest.
References
- Los Angeles Times. Available online: https://www.latimes.com/opinion/story/2021-11-23/return-culture-supply-chain-logistics (accessed on 14 February 2025).
- Cui, H.; Rajagopalan, S.; Ward, A.R. Impact of Task-Level Worker Specialization, Workload, and Product Personalization on Customer Returns. Manuf. Serv. Oper. Manag. 2021, 23, 346–366. [Google Scholar] [CrossRef] [Scilit]
- Wang, Y.; Yu, B.; Chen, J. Factors Affecting Customer Intention to Return in Online Shopping: The Roles of Expectation Disconfirmation and Post-Purchase Dissonance. Electron. Commer. Res. 2025, 25, 2729–2763. [Google Scholar] [CrossRef] [Scilit]
- MIT Sloan Management Review. Available online: https://sloanreview.mit.edu/article/can-product-returns-make-you-money/ (accessed on 14 February 2025).
- Ertekin, N. Immediate and Long-Term Benefits of In-Store Return Experience. Prod. Oper. Manag. 2018, 27, 121–142. [Google Scholar] [CrossRef] [Scilit]
- McCollough, M.A.; Bharadwaj, S.G. The Recovery Paradox: An Examination of Customer Satisfaction in Relation to Disconfirmation, Service Quality, and Attribution-Based Theories. Mark. Theory Appl. 1992, 1, 119–137. [Google Scholar]
- Hart, C.W.; Heskett, J.L.; Sasser, W.E., Jr. The Profitable Art of Service Recovery. Harv. Bus. Rev. 1990, 68, 148–156. [Google Scholar] [PubMed]
- Griffis, S.E.; Rao, S.; Goldsby, T.J.; Niranjan, T.T. The Customer Consequences of Returns in Online Retailing: An Empirical Analysis. J. Oper. Manag. 2012, 30, 282–294. [Google Scholar] [CrossRef] [Scilit]
- Venkatesan, R.; Kumar, V. A Customer Lifetime Value Framework for Customer Selection and Resource Allocation Strategy. J. Mark. 2004, 68, 106–125. [Google Scholar] [CrossRef] [Scilit]
- Petersen, J.A.; Kumar, V. Are Product Returns a Necessary Evil? Antecedents and Consequences. J. Mark. 2009, 73, 35–51. [Google Scholar] [CrossRef] [Scilit]
- Narvar. Available online: https://corp.narvar.com/blog/6-touchpoints-of-the-return-process (accessed on 14 December 2025).
- Peinkofer, S.T.; Jin, Y.H. The Impact of Order Fulfillment Information Disclosure on Consequences of Deceptive Counterfeits. Prod. Oper. Manag. 2023, 32, 237–260. [Google Scholar] [CrossRef] [Scilit]
- Gustafsson, A.; Johnson, M.D.; Roos, I. The Effects of Customer Satisfaction, Relationship Commitment Dimensions, and Triggers on Customer Retention. J. Mark. 2005, 69, 210–218. [Google Scholar] [CrossRef] [Scilit]
- Somanchi, S.; Kanuri, V.K.; Telang, R. Mitigating Churn After Online Financial Fraud: The Value of Blame Attribution. Prod. Oper. Manag. 2025, 34, 3119–3137. [Google Scholar] [CrossRef] [Scilit]
- Oflaç, B.S.; Sullivan, U.Y.; Baltacioğlu, T. An Attribution Approach to Consumer Evaluations in Logistics Customer Service Failure Situations. J. Supply Chain. Manag. 2012, 48, 51–71. [Google Scholar] [CrossRef] [Scilit]
- Nili, A.; Tate, M.; Barros, A.; Johnstone, D. An Approach for Selecting and Using a Method of Inter-Coder Reliability in Information Management Research. Int. J. Inf. Manag. 2020, 54, 102154. [Google Scholar] [CrossRef] [Scilit]
- Luong, D.B.; Wu, K.W.; Vo, T.H.G. Difficulty Is a Possibility: Turning Service Recovery into e-WOM. J. Serv. Mark. 2021, 35, 1000–1012. [Google Scholar] [CrossRef] [Scilit]
- Sahaf, T.M.; Fazili, A.I. Service Failure and Service Recovery: A Hybrid Review and Research Agenda. Int. J. Consum. Stud. 2024, 48, e12974. [Google Scholar] [CrossRef] [Scilit]
- Morgan, R.M.; Hunt, S.D. The Commitment-Trust Theory of Relationship Marketing. J. Mark. 1994, 58, 20–38. [Google Scholar] [CrossRef] [Scilit]
- Ozuem, W.; Willis, M.; Howell, K.; Ranfagni, S.; Rovai, S. Examining User-Generated Content, Service Failure Recovery and Customer—Brand Relationships: An Exploration Through Commitment-Trust Theory. Internet Res. 2024, 34, 784–809. [Google Scholar] [CrossRef] [Scilit]
- Qureshi, I.; Fang, Y.; Ramsey, E.; McCole, P.; Ibbotson, P.; Compeau, D. Understanding Online Customer Repurchasing Intention and the Mediating Role of Trust — An Empirical Investigation in Two Developed Countries. Eur. J. Inf. Syst. 2009, 18, 205–222. [Google Scholar] [CrossRef] [Scilit]
- McCollough, M.A.; Berry, L.L.; Yadav, M.S. An Empirical Investigation of Customer Satisfaction after Service Failure and Recovery. J. Serv. Res. 2000, 3, 121–137. [Google Scholar] [CrossRef] [Scilit]
- Pfaff, A.; Spann, M. Augmented Reality and Spatial Fit Uncertainty in Online Retailing. J. Retail. Consum. Serv. 2025, 87, 104442. [Google Scholar] [CrossRef] [Scilit]
- Gallino, S.; Moreno, A. The Value of Fit Information in Online Retail: Evidence from a Randomized Field Experiment. Manuf. Serv. Oper. Manag. 2018, 20, 767–787. [Google Scholar] [CrossRef] [Scilit]
- Balaram, A.; Perdikaki, O.; Galbreth, M.R. Bracketing of Purchases to Manage Size Uncertainty: Should Online Retailers Be Worried? Nav. Res. Logist. 2022, 69, 783–800. [Google Scholar] [CrossRef] [Scilit]
- Reinartz, W.J.; Kumar, V. The Impact of Customer Relationship Characteristics on Profitable Lifetime Duration. J. Mark. 2003, 67, 77–99. [Google Scholar] [CrossRef] [Scilit]
- Mollenkopf, D.A.; Rabinovich, E.; Laseter, T.M.; Boyer, K.K. Managing Internet Product Returns: A Focus on Effective Service Operations. Decis. Sci. 2007, 38, 215–250. [Google Scholar] [CrossRef] [Scilit]
- Yen, H.R.; Gwinner, K.P.; Su, W. The Impact of Customer Participation and Service Expectation on Locus Attributions Following Service Failure. Int. J. Serv. Ind. Manag. 2004, 15, 7–26. [Google Scholar] [CrossRef] [Scilit]
- Weiner, B. Attributional Thoughts About Customer Behavior. J. Consum. Res. 2000, 27, 382–387. [Google Scholar] [CrossRef] [Scilit]
- Meyer, N.; Schwede, M.; Hammerschmidt, M.; Weiger, W.H. Users Taking the Blame? How Service Failure, Recovery, and Robot Design Affect User Attributions and Retention. Electron. Mark. 2022, 32, 2491–2505. [Google Scholar] [CrossRef] [Scilit]
- Weiner, B. An Attributional Theory of Achievement Motivation and Emotion. Psychol. Rev. 1985, 92, 548–573. [Google Scholar] [CrossRef] [PubMed]
- Cranage, D.A.; Mattila, A.S. Service Recovery and Pre-Emptive Strategies for Service Failure: Both Lead to Customer Satisfaction and Loyalty, but for Different Reasons. J. Hosp. Leis. Mark. 2006, 13, 161–181. [Google Scholar] [CrossRef] [Scilit]
- Rummelhagen, K.; Benkenstein, M. Whose Fault Is It? An Empirical Study on the Impact of Responsibility Attribution for Customer Misbehavior. Eur. J. Mark. 2017, 51, 1856–1875. [Google Scholar] [CrossRef] [Scilit]
- Harris, K.E.; Mohr, L.A.; Bernhardt, K.L. Online Service Failure, Customer Attributions and Expectations. J. Serv. Mark. 2006, 20, 453–458. [Google Scholar] [CrossRef] [Scilit]
- Moser, C.E.; Wiley, S. “My Aim Is True”: An Attribution-Identity Model of Ally Sincerity. Pers. Soc. Psychol. Rev. 2025, 29, 293–313. [Google Scholar] [CrossRef] [Scilit] [PubMed]
- Kanitz, R.; Anzengruber, J. Can’t See the Forest for the Trees: Attributional Ambiguity and Attitudes Toward Change. Acad. Manag. Proc. 2019, 2019, 12398. [Google Scholar] [CrossRef] [Scilit]
- Kracht, J.; Wang, Y. Examining the Tourism Distribution Channel: Evolution and Transformation. Int. J. Contemp. Hosp. Manag. 2010, 22, 736–757. [Google Scholar] [CrossRef] [Scilit]
- Lee, B.Y.; Cranage, D.A. Service Failure of Intermediary Service: Impact of Ambiguous Locus of Control. J. Travel Tour. Mark. 2017, 34, 515–530. [Google Scholar] [CrossRef] [Scilit]
- Hess, J.D.; Chu, W.; Gerstner, E. Controlling Product Returns in Direct Marketing. Mark. Lett. 1996, 7, 307–317. [Google Scholar] [CrossRef] [Scilit]
- McHugh, M.L. Interrater Reliability: The Kappa Statistic. Biochem. Med. 2012, 22, 276–282. [Google Scholar] [CrossRef] [Scilit]
- Cohen, J. A Coefficient of Agreement for Nominal Scales. Educ. Psychol. Meas. 1960, 20, 37–46. [Google Scholar] [CrossRef] [Scilit]
- Kelley, S.W.; Hoffman, K.D.; Davis, M.A. A Typology of Retail Failures and Recoveries. J. Retail. 1993, 69, 429–452. [Google Scholar] [CrossRef] [Scilit]
- Das, L.; Kunja, S.R. Why Do Customers Return Products? A Qualitative Exploration of Online Product Return Behaviour of Young Customers. J. Retail. Consum. Serv. 2024, 78, 103770. [Google Scholar] [CrossRef] [Scilit]
- Bejou, D.; Palmer, A. Service Failure and Loyalty: An Exploratory Empirical Study of Airline Customers. J. Serv. Mark. 1998, 12, 7–22. [Google Scholar] [CrossRef] [Scilit]
- Schindler, R.M.; Morrin, M.; Bechwati, N.N. Shipping Charges and Shipping-Charge Skepticism: Implications for Direct Marketers’ Pricing Formats. J. Interact. Mark. 2005, 19, 41–53. [Google Scholar] [CrossRef] [Scilit]

Disclaimer/Publisher’s Note: The statements, opinions and data contained in all publications are solely those of the individual author(s) and contributor(s) and not of MDPI and/or the editor(s). MDPI and/or the editor(s) disclaim responsibility for any injury to people or property resulting from any ideas, methods, instructions or products referred to in the content. |
© 2026 by the authors. Licensee MDPI, Basel, Switzerland. This article is an open access article distributed under the terms and conditions of the Creative Commons Attribution (CC BY) license.