


Abstract
Ecuadorian agri-food supply chains are characterized by strong territorial heterogeneity, crop perishability, and unequal production concentration, creating significant socio-economic and logistical challenges. To address these territorial disparities, this study employs an AI-driven clustering approach to classify Ecuador’s 23 continental provinces by their agri-food production and supply chain integration profiles. Using official 2024 provincial tabulations from the National Institute of Statistics and Censuses of Ecuador, seven variables were analyzed: harvested banana area, banana production, cocoa production, rice production, corn production, potato production, and banana yield. The methodology combined descriptive statistics and Pearson correlations with unsupervised machine learning techniques, specifically hierarchical agglomerative clustering and k-means algorithms after z-score standardization. The descriptive results showed extreme dispersion across provinces, with coefficients of variation exceeding 100% for all variables and marked right skew. The final four-cluster solution (k = 4, BSS/TSS = 78.65%, average silhouette = 0.43) differentiated: (cluster 1) a potato-specialized Andean profile represented by Carchi; (cluster 2) a broad group of low-intensity provinces requiring inclusive logistical integration; (cluster 3) medium-scale banana provinces with high yields; and (cluster 4) the dominant tropical production core formed by Guayas and Los Rios. The typology explains 78.65% of the standardized variability and provides the territorial evidence base required for designing differentiated supply-chain planning, resilience strategies, and public policies tailored to each provincial typology.
1. Introduction
Agri-food supply chains (AFSCs) have evolved from simple distribution channels into strategic systems vital to ensuring global food security and the socio-economic stability of nations. In agricultural systems, intrinsic complexity arises from the convergence of multiple stakeholders operating under deep uncertainty and multidimensional risks [1]. Unlike conventional industrial supply chains, AFSCs must simultaneously manage biological variability, critical perishability constraints, and spatial dispersion, requiring supply-chain designs that balance operational efficiency with robust resilience and sustainability.
Consequently, modern supply-chain design must transition from purely operational optimization toward the principles of Agriculture 5.0, fostering systems that are human-centric, sustainable, and highly resilient. This socio-technical evolution is crucial for advancing the United Nations Sustainable Development Goals (SDGs), particularly in the areas of zero hunger (SDG 2), responsible production (SDG 12), and reducing territorial inequalities (SDG 10) [2]. These conditions are especially relevant in emerging economies like Ecuador, where productive structures and socio-economic realities vary substantially across coastal, Andean, and Amazonian territories.
Despite this reality, a critical administrative and engineering gap persists: the tendency to simplify operational reality by relying on national averages. This reductionist approach is mathematically consistent but operationally and socially weak. Ignoring regional disparities is equivalent to designing solutions that, while optimal in a computational environment, systematically fail when confronted with field realities. Therefore, before proposing large-scale optimization models or targeted policy interventions, it is imperative to quantify and classify the productive heterogeneity of the national agri-food system at the provincial level to build resilience based on productive diversity.
1.1. State of the Art: AI, Clustering, and Supply Chain Resilience
A structured literature search was conducted using the Consensus AI-assisted research platform (consensus.app), which indexes over 170 million scientific articles from Semantic Scholar and PubMed. Six thematic searches were executed using the following query families: (1) ‘agri-food supply chain clustering’; (2) ‘supply chain resilience developing countries’; (3) ‘k-means agricultural regional classification’; (4) ‘regional heterogeneity food systems’; (5) ‘supply chain network design uncertainty’; and (6) ‘post-disruption agri-food resilience’. Articles were included if they: (i) addressed clustering, regional segmentation, or network design in agri-food contexts; (ii) were published between 2011 and 2025; and (iii) were indexed in Semantic Scholar or PubMed. Of the 1900 eligible articles identified after initial screening of 27.4 million retrieved records, 19 were selected as the most directly relevant contributions based on thematic alignment with the study objectives. The search was conducted as an exploratory literature identification tool; the resulting selection (Table 1) represents key contributions rather than a comprehensive systematic review. Consensus was selected as the primary search platform because its integration with Semantic Scholar and PubMed provides the broadest available coverage of operations research, supply chain management, and food systems literature, including studies from emerging economies that are frequently underrepresented in Web of Science or Scopus. The platform’s AI-assisted relevance ranking enabled systematic identification of studies addressing territorial heterogeneity and cluster-based supply chain design in developing-country contexts—precisely the intersection where this study seeks to contribute.
Table 1.
Chronological summary of key contributions in the study of clusters and resilience in AFSCs.
1.2. Critical Analysis of Research Gaps
Despite the technical sophistication evidenced in Table 1, our analysis—assisted by the Consensus AI platform—revealed a critical gap that compromises the real-world applicability of these models in developing economies: the lack of integration between resilience to extreme systemic shocks and the use of smart logistics tools for post-crisis evaluation. Most research is limited to theoretical modeling or isolated simulations, lacking the operational maturity to evaluate the network’s actual performance after a systemic disruption.
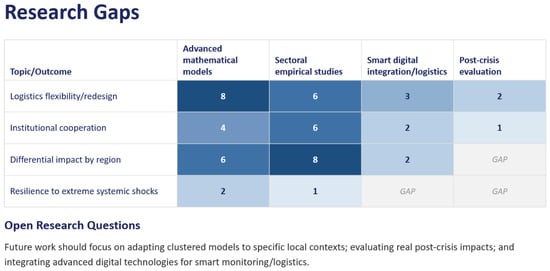
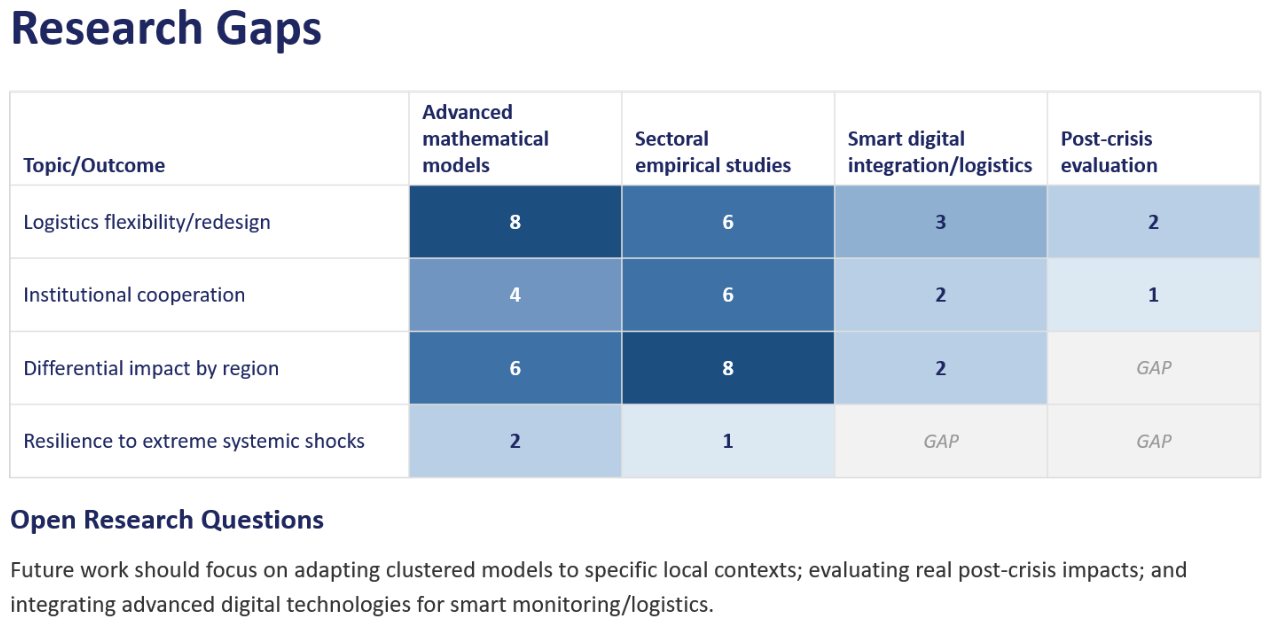
A second fundamental void relates to differential regional impacts. Current literature often provides generic frameworks, ignoring the fact that a cluster’s adaptive capacity depends critically on its local physical infrastructure and innovative human capital. Consequently, this research addresses these gaps by using local data from the ESPAC 2024 (INEC, 2024 [22]) to model regional heterogeneity in Ecuador in a post-disruption recovery scenario. By proposing clusters that weigh regional vulnerability against smart logistics integration capacity, this study transitions from abstract optimization to a network design tool that acknowledges the physical reality of the territory as a restrictive model parameter, as summarized in Figure 1.
Figure 1.
Literature review: covered areas vs. main research gaps. Source: Consensus.
The blank cells in Figure 1 indicate research areas where no studies were identified. The most critical gap is the intersection of ‘differential regional impact’ with ‘post-crisis resilience assessment’ and ‘smart logistics integration’: no prior study has combined empirical regional classification of a developing-country agri-food system with a post-disruption evaluation framework. A secondary gap exists in the application of advanced empirical clustering methods to developing-economy territorial contexts, where country-specific heterogeneity is most pronounced. These two voids jointly define the contribution of the present research.
1.3. Territorial Heterogeneity as a Prerequisite for Differentiated Resilience Planning
To understand the relevance of clustering, it is imperative to define extreme systemic shocks as large-scale, disruptive events that cascade through interconnected modern systems (production, trade, and consumption), generating food access crises and economic vulnerability. In developing AFSCs, these shocks generally fall into four main categories:
- Health Shocks and Pandemics, such as COVID-19, disrupt chains through mobility restrictions, labor shortages, and logistical closures, causing massive income losses.
- Geopolitical Conflicts and Wars: Events creating severe interruptions in the supply of grains and basic inputs, transmitting price hikes that disproportionately affect low-income nations.
- Climatic and Environmental Shocks: Extreme droughts or floods that drastically reduce yields and trigger restrictive policy responses, amplifying the crisis.
In Ecuador specifically, the 1997–1998 El Niño event reduced banana exports by approximately 30% due to severe flooding in Los Ríos and Guayas—the same provinces identified as Cluster 4 in this study. This documented episode illustrates how the spatial concentration of production in a single coastal cluster amplifies the national impact of climatic disruptions, and provides empirical motivation for differentiated resilience planning by territorial typology.
- Market and Structural Shocks: Derived from high import dependence and deficient infrastructure, where minor disruptions generate “butterfly effects” on poverty and employment.
In this context, AI-driven cluster analysis does not directly model resilience responses; rather, it provides the territorial evidence base that any such model requires as a prerequisite. By empirically classifying provinces according to their productive profiles, the typology defines which supply chain segments share comparable risk exposures and logistical capacities—the foundational information needed before disruption scenarios, network flow models, or resilience policies can be meaningfully designed. This study thus constitutes the diagnostic phase of a two-stage research agenda in which the territorial typology produced here is intended to parametrize future quantitative resilience models.
1.4. Research Objectives
The central research question guiding this study is: How can an empirically derived provincial typology of agri-food production inform differentiated supply chain planning strategies in a developing-economy context? Answering this question requires addressing four specific objectives:
Driven by the fundamental question of how regional clustering can optimize resilient agri-food network designs in developing economies, this study’s general objective is to identify homogeneous provincial profiles associated with Ecuadorian AFSCs. Specifically, the paper aims to:
Describe the distribution, dispersion, and asymmetry of key crop-production variables.
Analyze Associations Between Crop Systems
Classify the 23 continental provinces by applying unsupervised AI clustering algorithms (hierarchical and k-means) to segment the territory according to its logistical and productive profile.
Discuss the implications of the resulting typology for addressing territorial inequalities, enhancing supply-chain resilience, and informing public policy for equitable infrastructure development.
The novelty and primary contribution of this article are threefold. First, it provides an empirically grounded provincial-level typology of Ecuadorian agri-food supply chain territories using exclusively official statistical data, establishing a replicable baseline for territorial monitoring that does not rely on costly, bespoke field surveys. Second, it introduces a two-layer analytical framework that combines production-based clustering with post-clustering supply chain characterization, enabling the typology to simultaneously address productive heterogeneity and logistical capacity—a combination absent from prior developing-country agri-food clustering studies. Third, it translates a statistical classification into a directly applicable policy instrument by linking each cluster’s productive profile to its commercialization ratio, farm labor base, and road infrastructure, thereby providing decision-makers with cluster-specific, rather than nationally aggregated, evidence for infrastructure investment and resilience planning.
2. Data Source and Variables
The analysis employs a two-layer variable set that reflects both the productive base and the level of supply chain integration for each provincial territory. The first layer consists of seven production variables (X1–X7) derived from official agricultural census data, which characterize what each province grows and its technical efficiency. The second layer consists of nine supply chain variables (SC1–SC9), which characterize how much of that production effectively reaches formal markets, how much labor is mobilized in the agricultural system, and what logistical infrastructure is available to support distribution. Together, these two layers ensure that the typology developed in this study addresses supply chain management rather than agricultural production in isolation.
2.1. ESPAC 2024 Provincial Tabulations
The empirical source is the Survey of Agricultural Area and Production, called: Encuesta de Superficie y Produccion Agropecuaria Continua (ESPAC), published by the National Institute of Statistics and Censuses of Ecuador (INEC) [22]. The analysis uses the 2024 provincial tabulations and considers 23 continental provinces. Galapagos was excluded because this work’s analytical framework is the continental agricultural system. Three grounds support this exclusion: (1) the Galápagos agricultural system is oriented exclusively toward local subsistence and tourism supply, with no integration into continental supply chains; (2) ESPAC 2024 does not include Galápagos in its provincial tabulations; and (3) the islands’ unique agro-ecological conditions—volcanic soils, strict biosecurity regulations, and near-total import dependence—would constitute a singleton cluster with no interpretive value for the continental logistics planning objectives of this study.
The dataset was constructed from official tabulations disaggregated by region and province. Five crop tables were used: banana, cocoa, rice in husk, corn, and potato. For each crop, rows corresponding to solo and associated cultivation were aggregated to obtain total provincial production. Banana yield was computed as the ratio between banana production and harvested banana area. The resulting dataset has 23 observations and seven numerical variables. As seen in Table 2.
Table 2.
Variables used to characterize provincial agri-food production profiles.
2.2. Supply Chain Variables
To address the supply chain dimension of the analysis and respond to the need for logistical and commercialization indicators, nine additional variables were constructed from three official sources: ESPAC 2024 (INEC), the Transport Statistics survey ESTRA 2024 (INEC/ANT Ecuador) [23], and the Red Vial Estatal report (MTOP, 2023) [24]. These supply chain variables (SC1–SC9) are not used as clustering inputs—which would introduce multicollinearity with the production variables—but are applied after clustering to characterize each cluster’s supply chain integration and logistical capacity (Table 3). This two-layer approach allows the classification to capture both productive heterogeneity and supply chain performance simultaneously. These variables are presented here alongside the production variables because both layers share the same unit of analysis (province) and the same primary data source (ESPAC 2024); placing them together in the Data section facilitates direct comparison between what provinces produce (X1–X7) and how much of that production reaches formal supply chains (SC1–SC9). Their analytical role—post-clustering characterization—is described in the Methodology (Section 3.2, Step 6) and applied in the Results (Section 4.5).
Table 3.
Supply chain variables used for post-clustering characterization.
3. Methodology
3.1. Descriptive Analysis
The descriptive phase quantified the productive profile of each province. The following statistics were computed for every variable: arithmetic mean, median, standard deviation, coefficient of variation, minimum, maximum, skewness, and kurtosis. The coefficient of variation was considered especially important because the variables are expressed in different units and because relative dispersion reveals how unevenly agricultural production is distributed across provinces.
Boxplots were used to detect outliers and visualize the concentration of values near zero. A regional bar chart was used to compare production by region. A Pearson correlation matrix was used to identify relationships between crop systems. These descriptive tools provide the empirical basis for interpreting the subsequent clustering results.
The Consensus AI-assisted research platform (consensus.app) was used exclusively during the literature review phase of this study to conduct a quantitative bibliometric analysis of the existing scientific literature on agri-food supply chain management and clustering methodologies. Specifically, Consensus AI—which indexes over 170 million scientific articles from repositories such as Semantic Scholar and PubMed—enabled the systematic identification and mapping of research gaps in the field of territorial heterogeneity and supply chain resilience in developing economies, providing an initial evidence-based orientation for the scope and contribution of this research. This tool played no role in the collection, processing, or statistical analysis of the primary data sourced from ESPAC 2024, ESTRA 2024, and MTOP 2023; the provincial dataset and all clustering results reported in this study are based entirely on official Ecuadorian government statistical sources and validated through the AI-driven k-means and hierarchical clustering algorithms described in Section 3.2, whose outputs are grounded in established statistical methods and have been independently verified. All content generated or informed by Consensus AI has been critically reviewed, validated, and approved by the author.
3.2. Cluster Analysis
This study leverages k-means, an AI-based unsupervised learning technique, for its robustness in identifying patterns in multidimensional agricultural datasets. This cluster analysis aimed to group the 23 provinces into profiles characterized as internally homogeneous and externally heterogeneous based on the seven production indicators.
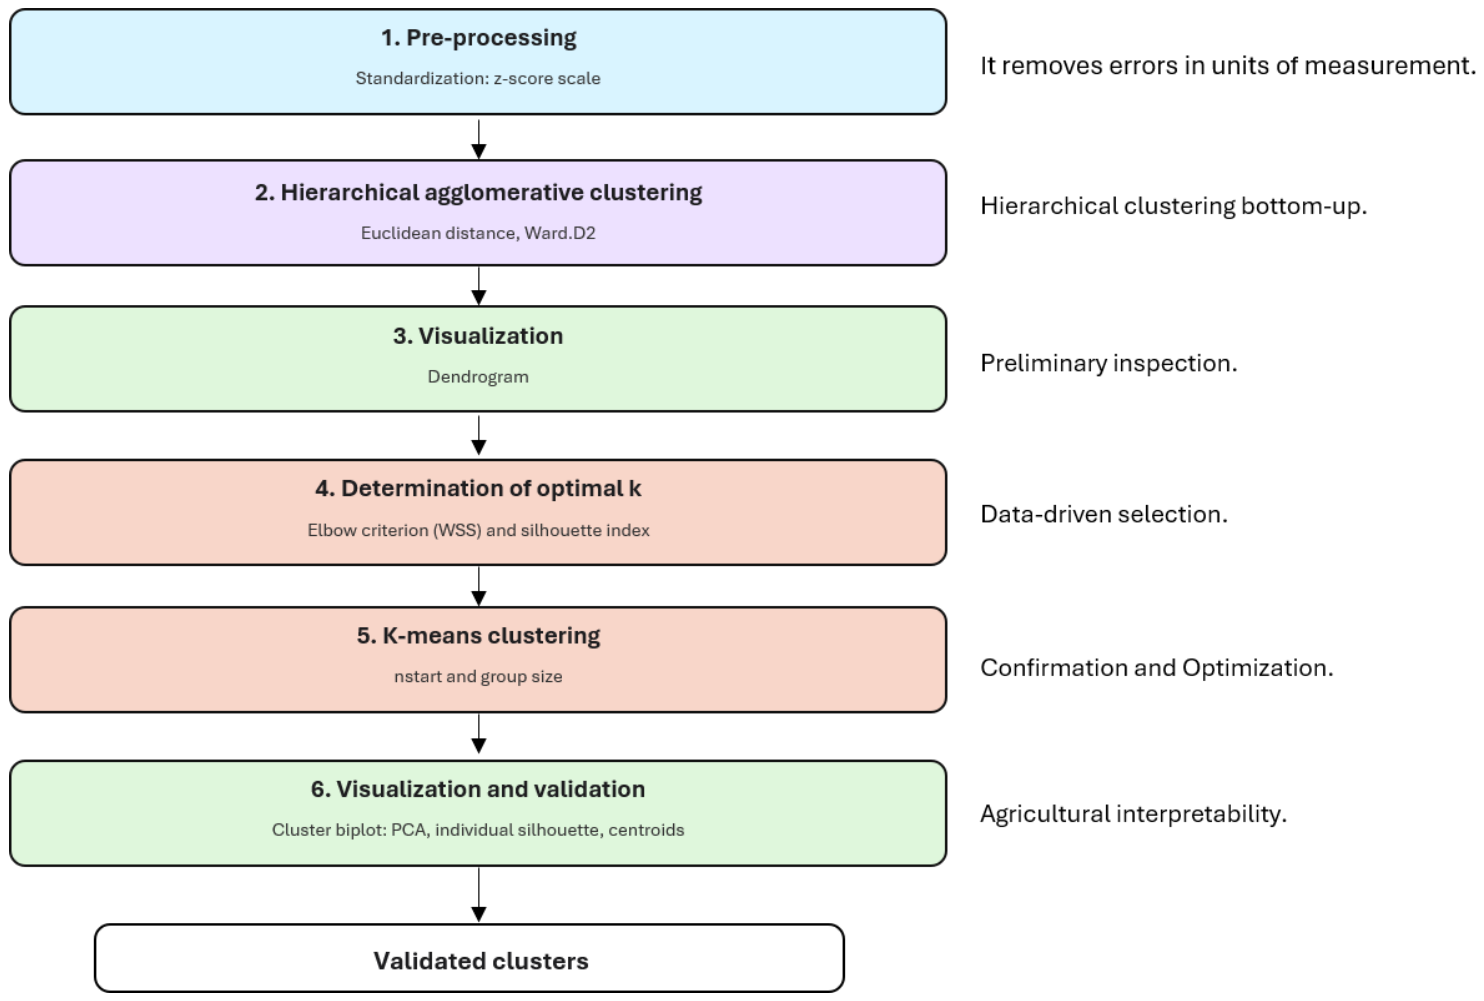
Specifically, the cluster analysis is structured into six sequential steps, all implemented in RStudio (2026.01.0) [25]. The purpose of each step, the statistical criterion applied, and the R function used to execute it are described below.
3.2.1. Step 1: Pre-Processing: Z-Score Standardization
When working with variables that mix hectares, metric tonnes, and yield ratios such as (t ) The k-means algorithm faces a concrete problem: the Euclidean distance it uses to group observations will be dominated by variables with larger numerical magnitudes, regardless of their relative importance. For example, a difference of 50,000 tonnes in banana production between two provinces would outweigh a difference of 30 t in yield by several orders of magnitude, even though the latter may be equally or more informative. To neutralize this effect, each productive variable —where denotes the observation () and the variable ()—is standardized using the z-score transformation defined as: Without standardization, the k-means Euclidean distance calculation would be dominated by the variable with the largest numerical magnitude. In this dataset, banana production values reach 3,011,202 t, while banana yield values range from 0 to 70.67 t ha−1—a scale ratio of approximately 42,000. Clustering on raw values would therefore effectively ignore yield and other lower-magnitude variables, producing groups driven solely by banana production volume rather than by each province’s multidimensional productive profile.
where is the arithmetic mean of variable computed over all observations, and is its sample standard deviation. As a result of this transformation, each standardized variable has a mean equal to zero and standard deviation equal to one, ensuring that all variables contribute equally to the computation of Euclidean distances during classification.
This transformation is implemented using the scale() function from the base R package (2026.01.0) [25], applied to the numerical data matrix before executing the clustering algorithms.
3.2.2. Step 2: Hierarchical Agglomerative Clustering
As a first classification step, hierarchical agglomerative clustering is applied using Euclidean distance as the dissimilarity measure and Ward’s minimum variance method (ward.D2) as the linkage [26]. Ward’s method merges at each step the pair of clusters whose fusion produces the smallest increase in the total within-cluster sum of squares, which makes it particularly well-suited to continuous, standardized data. The algorithm is executed using the hclust() function, which produces a complete hierarchy of nested partitions from which any number of clusters can subsequently be extracted.
It is worth noting that Step 2 produces a mathematical object stored in memory—specifically, a complete record of which observations were merged, in what order, and at what distance—rather than a visual output. The dendrogram described in Step 3 is simply the graphical representation of that object: it adds no new computation but translates the agglomeration history into a tree diagram that can be visually inspected. In other words, hclust() calculates, and fviz_dend() draws.
3.2.3. Step 3: Visualization: Dendrogram
The dendrogram produced by the fviz_dend() function from the factoextra package provides a graphical representation of the complete agglomeration history. In this diagram, the height at which two branches merge reflects the dissimilarity between the groups being joined: the larger the gap between two consecutive fusion levels, the more distinct the corresponding groups are. This visual signal guides the preliminary selection of the number of clusters before any quantitative criterion is applied and serves as an interpretive reference throughout the analysis.
3.2.4. Step 4: Determination of the Optimal Number of Clusters (k)
Two complementary criteria are applied jointly using the fviz_nbclust() function, with k ranging from 1 to 8. The elbow method examines how the Within-cluster Sum of Squares (WSS) decreases as groups are added: when this reduction ceases to be substantial and the curve ‘bends’, the corresponding k marks the point beyond which adding more clusters yields diminishing returns in compactness.
The average silhouette index complements this assessment by measuring, for each observation, how well it fits within its own cluster relative to neighbouring clusters; values close to 1 indicate well-separated, cohesive groups, while values near 0 or negative suggest ambiguity in the assignment. Using both criteria jointly leads to a more robust decision, since the elbow indicates the efficiency of the partition and the silhouette its quality and separability.
3.2.5. Step 5: K-Means Clustering
With the value of k established in the previous step, the k-means algorithm is executed using the kmeans() function, configured with 25 random initializations (nstart = 25) and a fixed seed (set.seed = 123). The multiple initializations ensure that the retained solution is the one with the lowest within-cluster variance across all attempts, reducing the risk of converging to a local optimum; the fixed seed, in turn, guarantees that the result is exactly reproducible by any researcher who executes the same code on the same dataset.
3.2.6. Step 6: Visualization and Validation
The quality of the classification is assessed through two complementary approaches. At the global quantitative level, the BSS/TSS index is computed to measure the proportion of the total dataset variability explained by the separation between the obtained clusters. The Total Sum of Squares (TSS) represents the overall variability among observations without any classification, while the Between-cluster Sum of Squares (BSS) captures the part of that variability attributable to the separation between groups. The BSS/TSS index is formally defined as:
where
= number of clusters
= number of observations in cluster
= number of variables
= value of variable for observation
= global mean of variable computed over all observations
= mean of variable within cluster
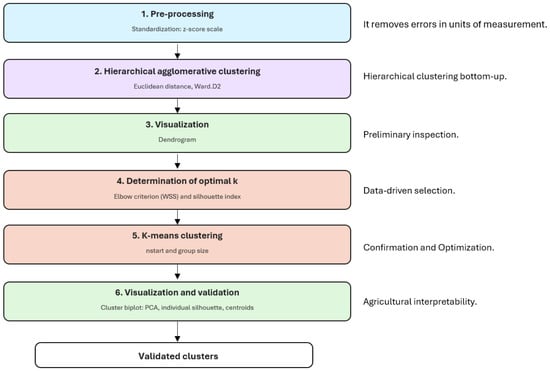
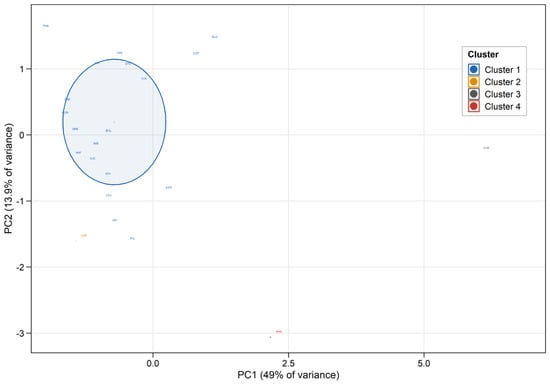
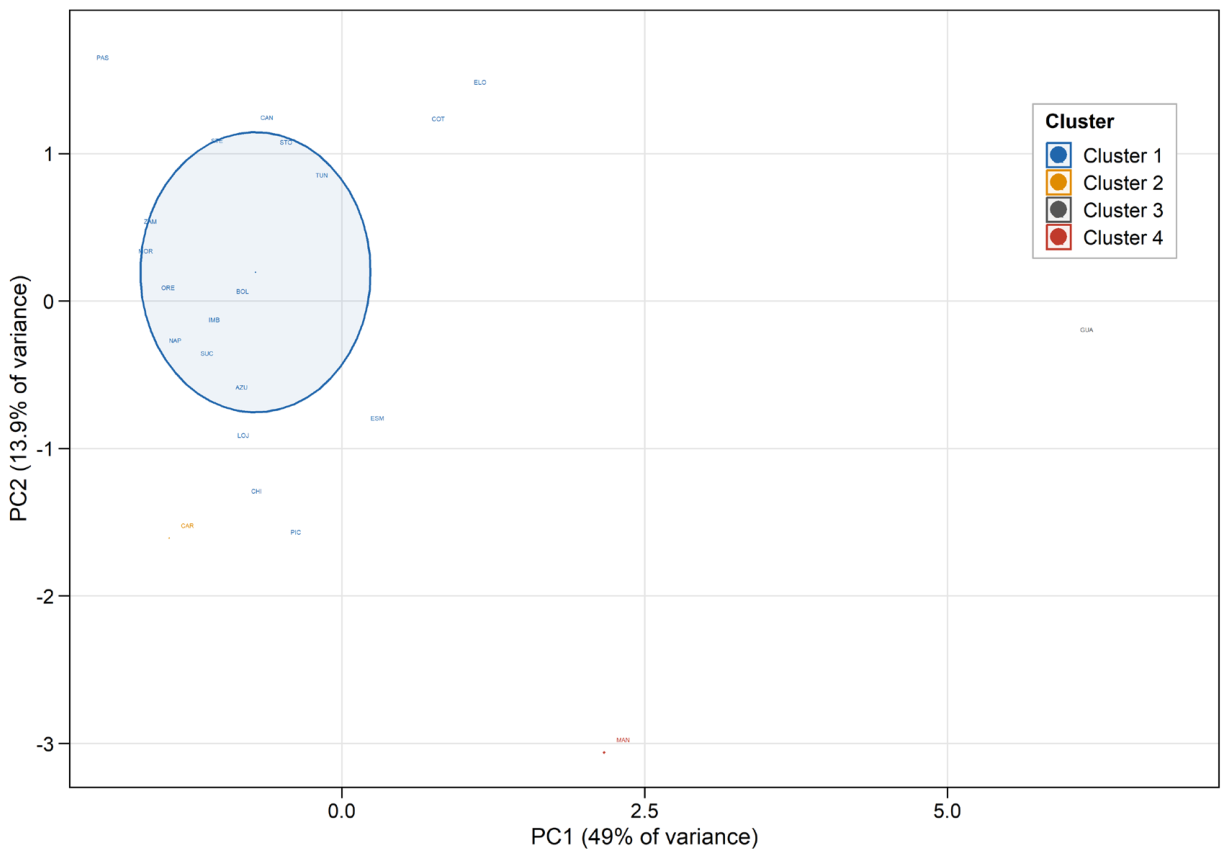
Values above 60% are generally considered indicative of a partition that captures real groupings rather than an arbitrary segmentation of the data. At the visual level, a principal component biplot is generated using fviz_cluster(), projecting the observations onto the first two principal components to enable graphical evaluation of group separation. Overlapping clusters in this reduced space may indicate that the chosen partition is not sufficiently robust. Finally, the centroids of each cluster are analyzed in the original scale of the variables, translating the statistical groupings into interpretable profiles from the perspective of the problem under study. A summary of the steps is shown in Figure 2.
Figure 2.
Methodological workflow for the cluster classification of homogeneous provinces.
3.3. Implementation in RStudio
For reproducibility, the RStudio implementation from the main document has been retained. The script loads the ESPAC provincial dataset, verifies the data structure, computes descriptive statistics, generates the original figures, standardizes the variables, applies hierarchical clustering and k-means, calculates validation indicators, and exports tables and graphics at publication resolution. See the Zenodo database in Appendix A.
4. Results
4.1. Descriptive Statistics
Table 4 summarizes the descriptive profile of the seven variables. The central result is the intensity of interprovincial dispersion. Every coefficient of variation exceeds 100%, confirming that the Ecuadorian agri-food system cannot be treated as a homogeneous national space. Rice production shows the highest coefficient of variation, reflecting strong territorial concentration, while banana yield also varies substantially across provinces.
Table 4.
Descriptive statistics of the provincial production variables.
The results reveal a productive structure in which a limited number of provinces dominate several chains. Banana, cocoa, rice, and corn are mainly associated with coastal production, whereas potato production reflects a distinct Andean profile. This contrast justifies the use of multivariate clustering rather than one-dimensional ranking.
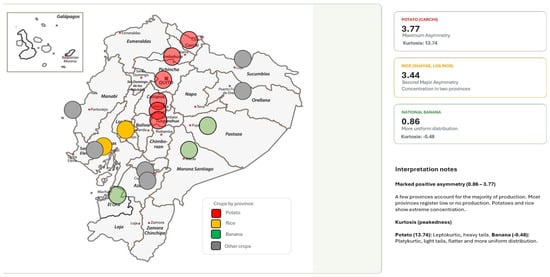
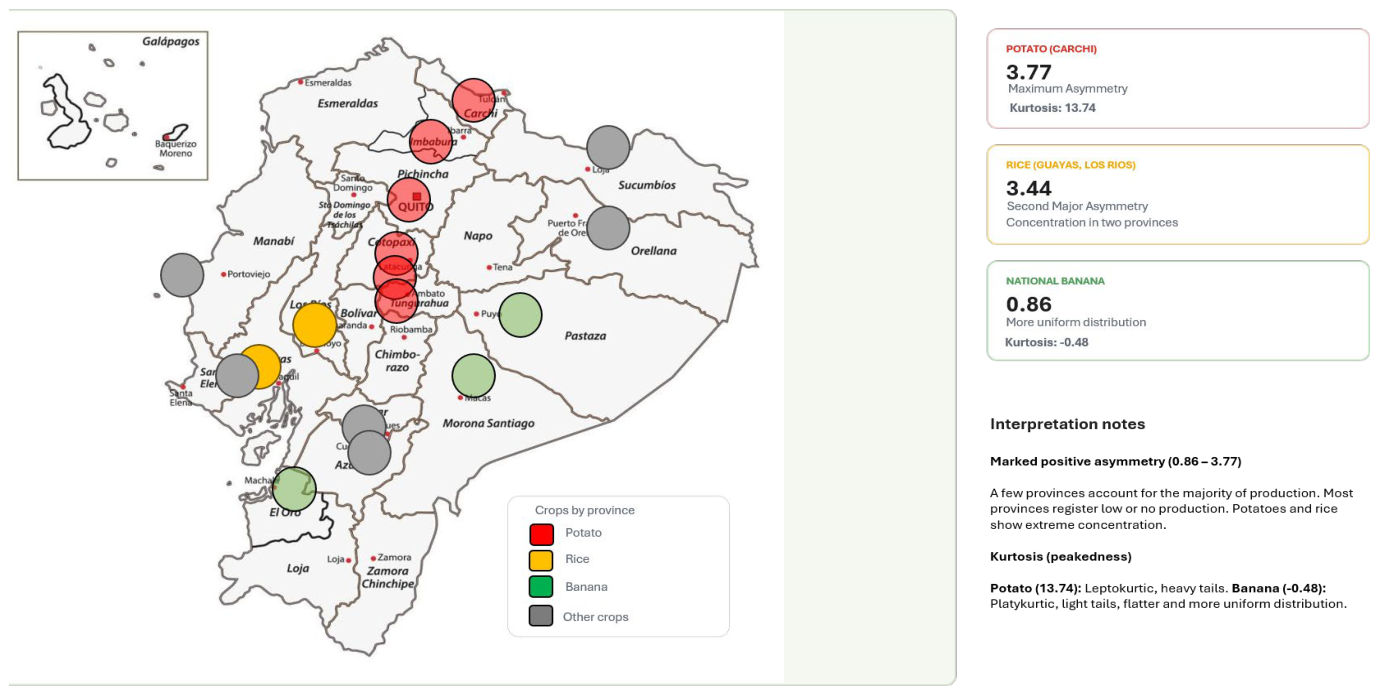
As shown in Figure 3, all distributions exhibit positive skewness. The coefficients range from 0.86 to 3.77, indicating that a few provinces account for most of the production, while most report low or zero values. Potato production is the most skewed variable, with a skewness of 3.77 and a kurtosis of 13.74. Carchi accounts for most of the national production of this crop. Rice production is the second-most skewed variable (skewness = 3.44), with Guayas and Los Ríos the only provinces with significant values. Banana yield is the most symmetrical variable (skewness = 0.86; kurtosis = −0.48), suggesting a more uniform distribution of production efficiency among provinces that grow bananas.
Figure 3.
Spatial distribution and asymmetry in Ecuadorian agricultural production.
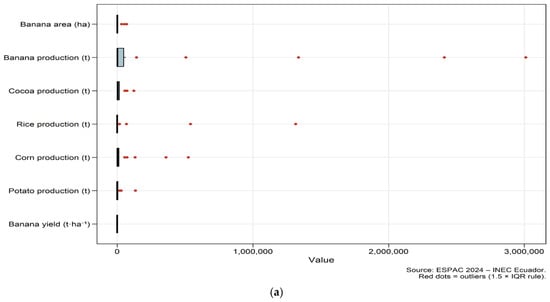
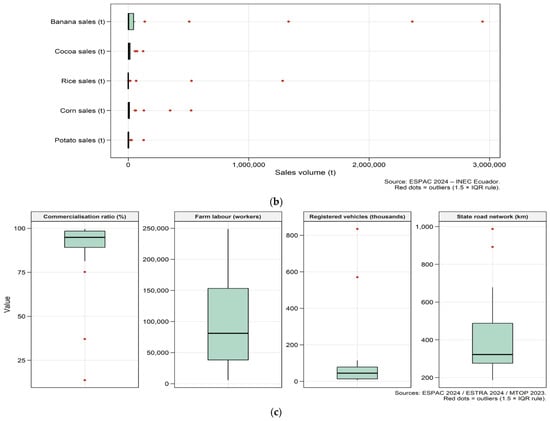
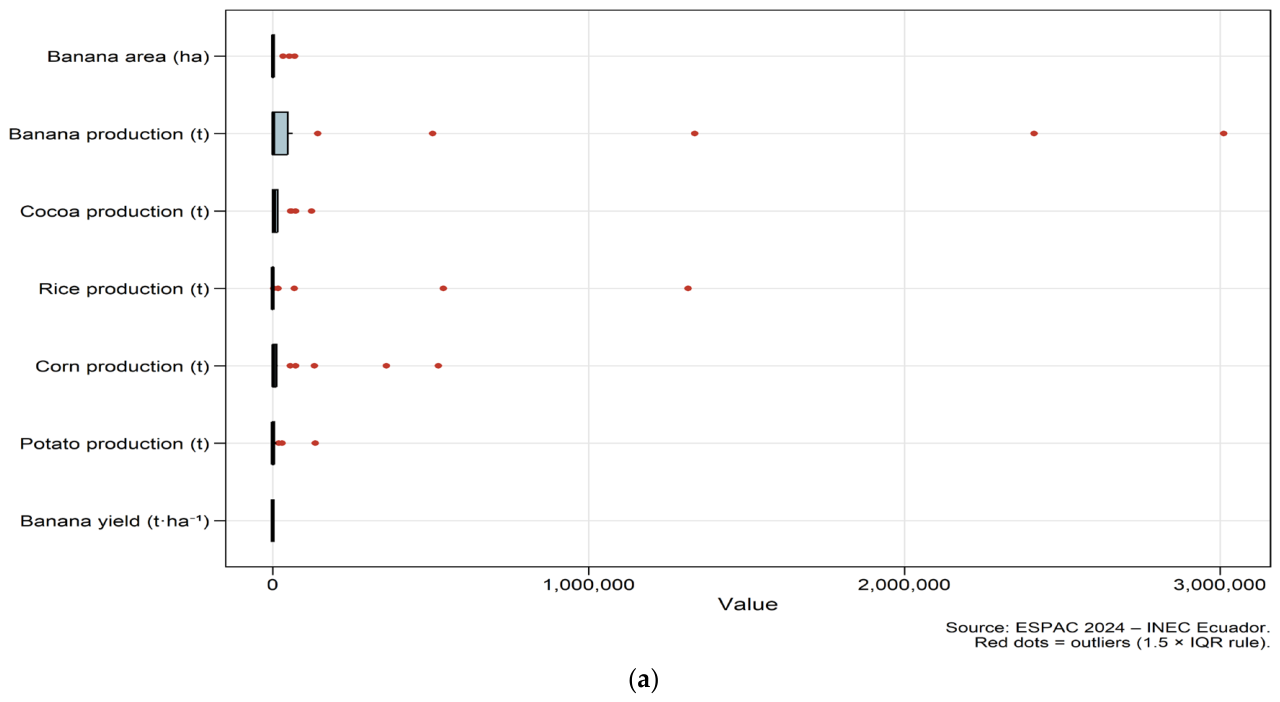
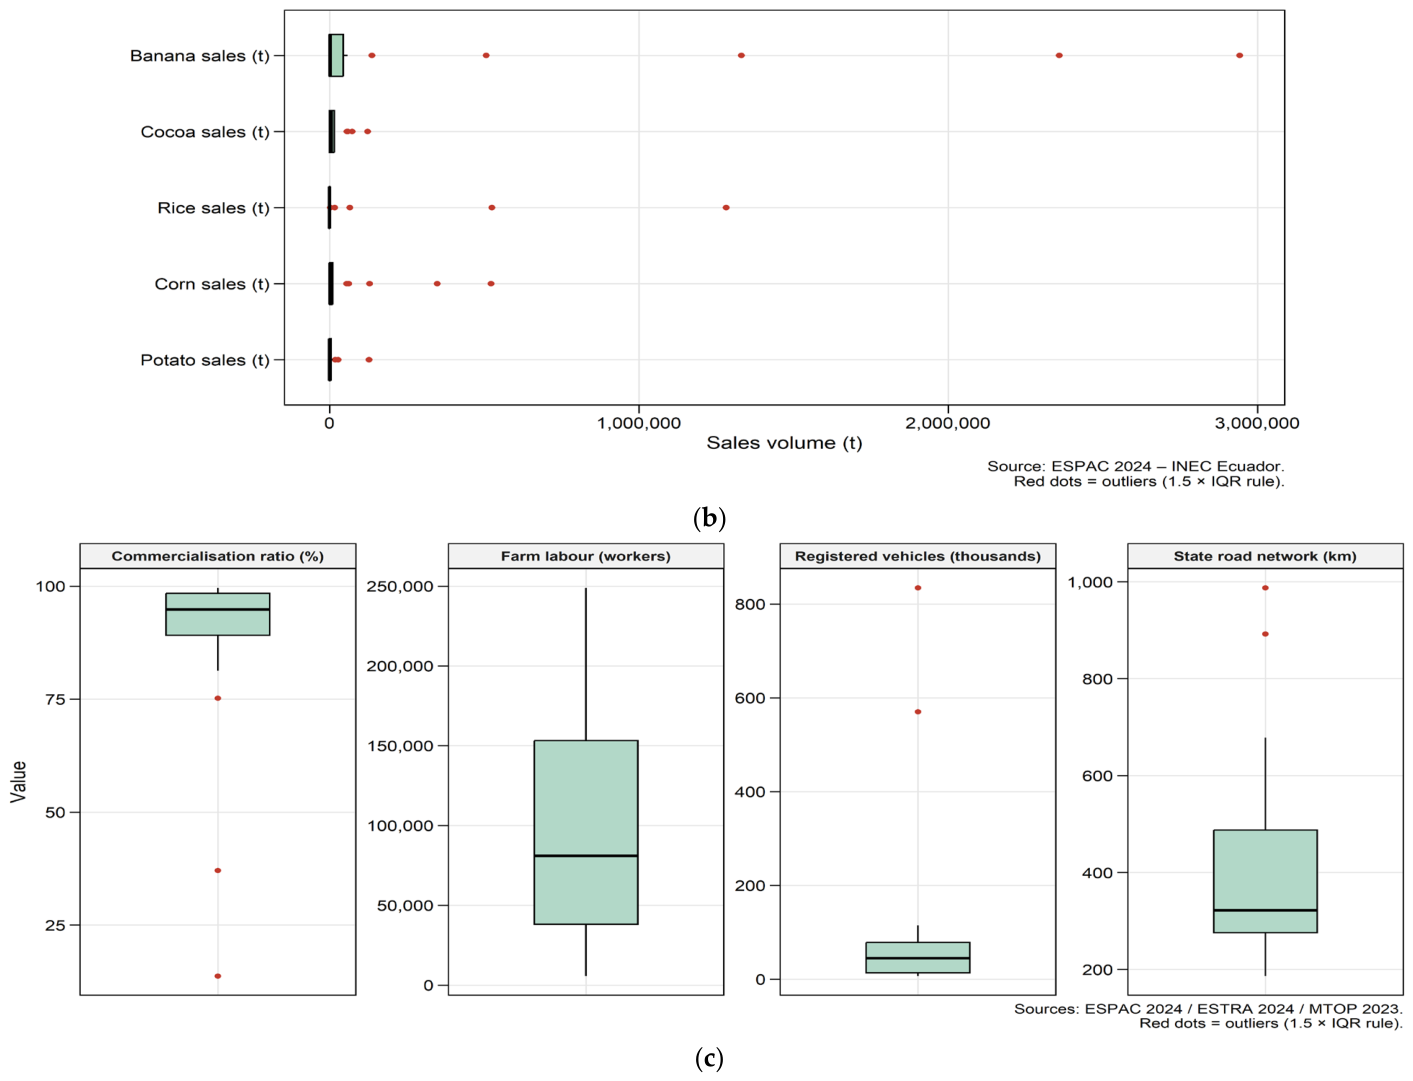
Figure 4a uses box plots to confirm these patterns for the production variables. The boxes are compact and close to zero for nearly all variables, while the outliers (red dots) extend far to the right, indicating a highly concentrated production structure in which high-production nodes function as critical points within supply chains. Figure 4b extends this analysis to the five crop sales variables (SC1–SC5), revealing the same extreme right-skewed structure: banana sales alone account for the largest inter-provincial dispersion, with Guayas and Los Ríos as dominant outliers. Figure 4c shows the four remaining supply chain indicator variables: the commercialization ratio (SC6) is relatively concentrated (most provinces are between 80 and 100%), while farm labor (SC7) and registered vehicles (SC8) exhibit extreme outliers driven by Pichincha and Guayas, respectively.
Figure 4.
(a) Distribution of productive variables by province. (b) Distribution of supply chain flow variables by province (sales volumes). Source: ESPAC 2024–INEC [22]. Red dots = outliers. (c) Distribution of supply chain indicator variables by province (commercialization ratio, farm labor, registered vehicles, state road network). Sources: ESPAC 2024 [22]/ESTRA 2024 [23]/MTOP 2023 [24].
This degree of productive concentration creates structural supply chain vulnerability. When a single province accounts for the majority of national rice or banana output, any localized disruption—whether climatic, phytosanitary, or logistical—has disproportionate national consequences. A coefficient of variation above 300% in rice production means that the ‘average province’ is a statistical fiction: designing supply chain infrastructure, storage capacity, or transport routes based on national averages in such a skewed system does not simplify reality—it misrepresents it. The descriptive evidence thus provides the empirical foundation for the differentiated cluster-based approach developed in Section 3.2.
4.2. Regional Structure and Correlations
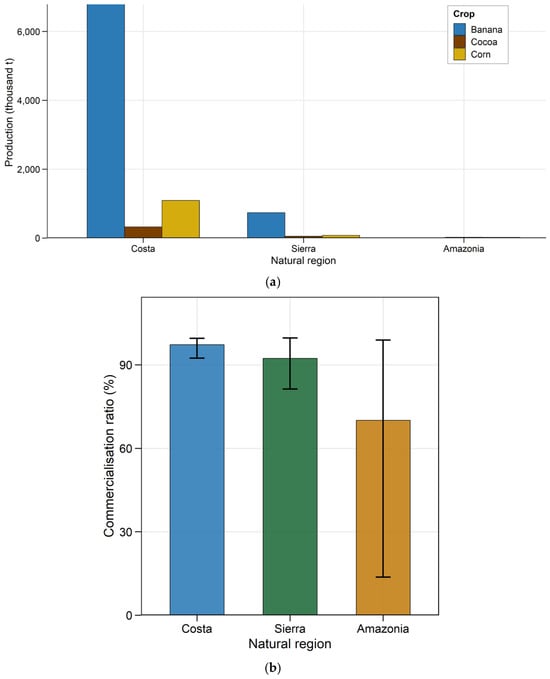
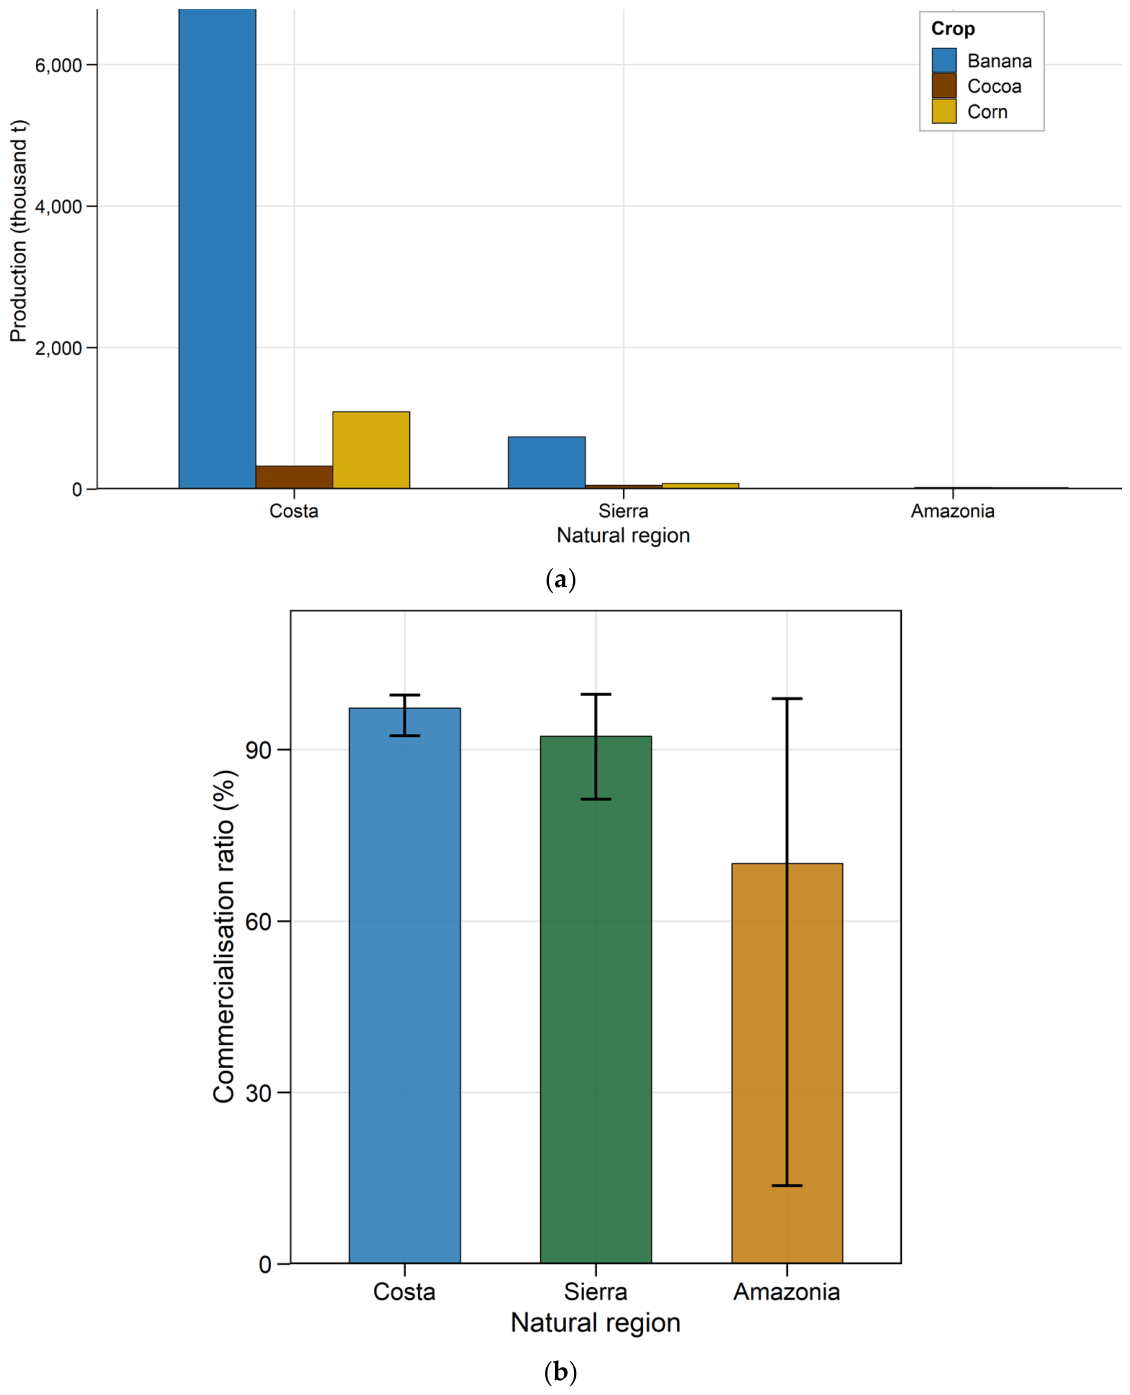
As seen in Figure 5a, the regional comparison confirms the Coast region’s dominance in banana, cocoa, and corn. The Highlands region plays a different role, particularly in potato production, while Amazonian provinces show lower production levels across the variables considered. This factor does not imply that Amazonian supply chains are irrelevant; rather, they require different analytical variables, including road access, market connectivity, and local subsistence systems. Figure 5b complements this view by showing the commercialization ratio by natural region. The Coast leads with a mean of 94.0%, followed by the Sierra at 91.2%. Critically, the Amazonia shows a much lower mean (67.1%) with a very wide range (minimum 13.7%), confirming that a significant share of Amazonian agricultural output does not reach formal supply chains—a finding with direct implications for inclusive logistics planning.
Figure 5.
(a) Production by national region. (b) Average commercialization ratio (%) by natural region. Error bars show minimum and maximum values. Source: ESPAC 2024–INEC [22].
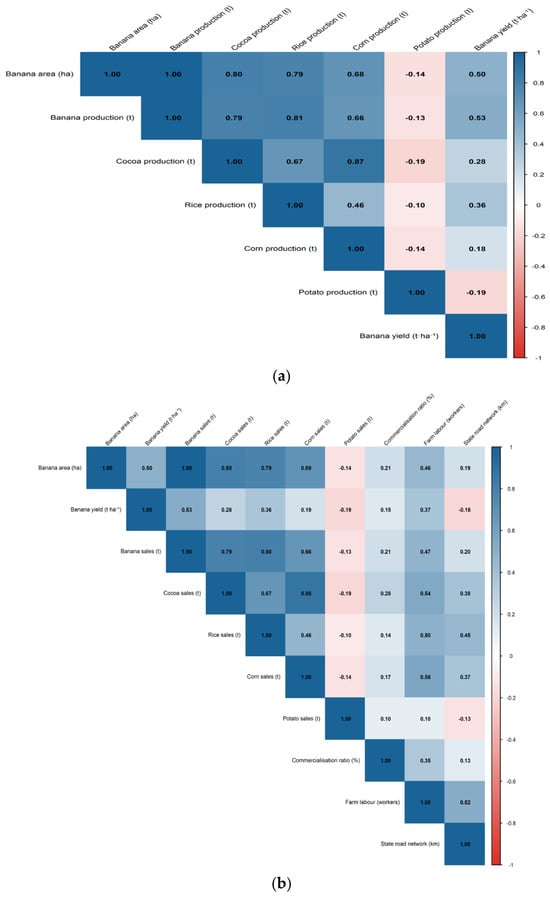
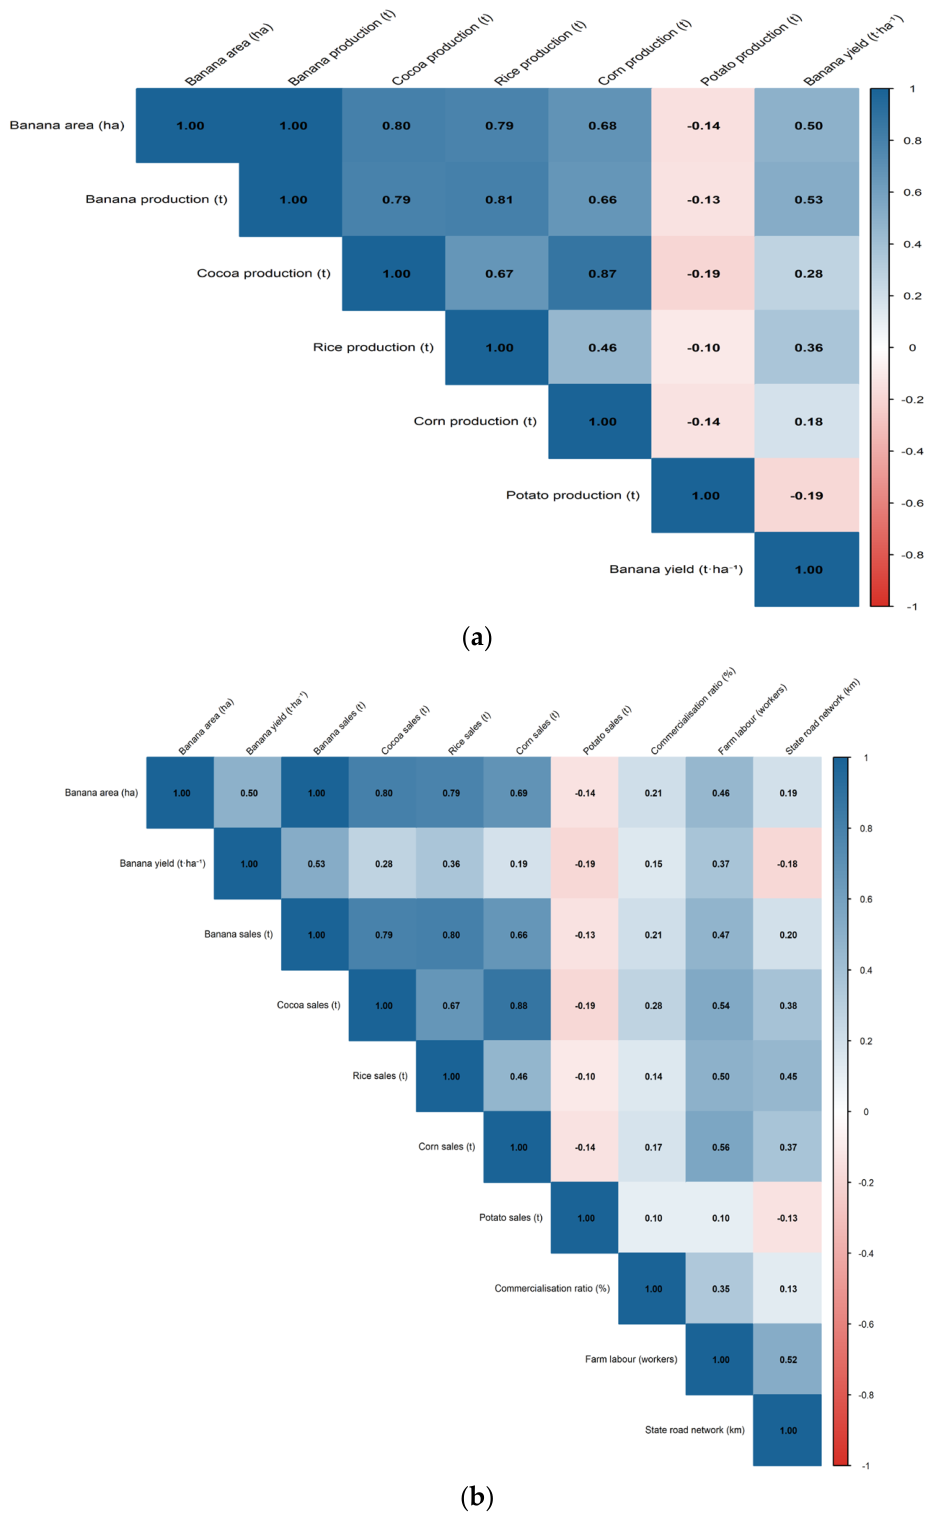
Figure 6a shows the Pearson correlation matrix, which reveals two distinct clusters of variables. The first block contains the area under cultivation and the production of bananas, cocoa, rice, and corn. There are moderate to very high positive correlations among these variables. The pair Area_Banana and Production_Banana is the most closely correlated (r = 0.997). The correlation between cocoa and corn (r = 0.872) suggests that they have similar agro-ecological conditions on the Coast. The second block consists of potato production, which shows weak negative correlations with all other variables (ranging from −0.10 to −0.19). This result is a quantitative expression of its exclusively Andean characteristic. Figure 6b presents the equivalent Pearson correlation matrix for the supply chain variables (SC1–SC9). The sales variables (SC1–SC5) form a block with moderate-to-strong positive correlations among themselves, as provinces with large tropical sales volumes tend to have higher farm labor and road network values (SC7, SC9). Notably, SC6 (commercialization ratio) is weakly correlated with all other SC variables, confirming its independent information value as a market integration indicator rather than merely a proxy for production or infrastructure scale. The negative correlations between potato production and all tropical crops reflect Ecuador’s fundamental agro-ecological duality: potato is cultivated exclusively at altitudes above 2800 m in the Andean provinces, where temperatures, soil conditions, and rainfall patterns are incompatible with banana, cocoa, rice, or corn cultivation. This geographic separation is structural rather than coincidental: high potato-producing provinces such as Carchi and Chimborazo have structurally zero tropical crop output, and vice versa. The correlation matrix, therefore, captures a geographic-ecological reality that translates directly into the distinct supply chain logics of the two productive systems identified by the clustering.
Figure 6.
(a) Pearson correlation matrix between productive variables. (b) Pearson correlation matrix between supply chain variables (SC1–SC9). Sources: ESPAC 2024 [22]/ESTRA 2024 [23]/MTOP 2023 [24].
4.3. Determination of Optimal Number of Clusters (k)
Prior to clustering, the data were standardized using the scale() function from the R base package [25]. The WSS criterion and the average silhouette index were applied together to determine the optimal number of clusters.
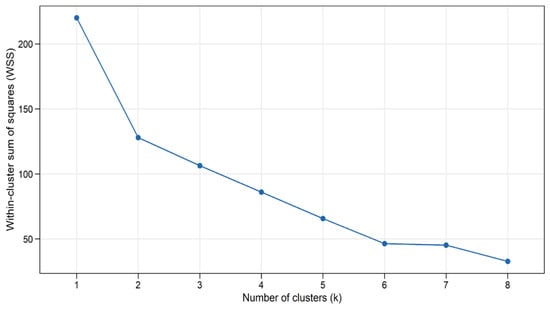
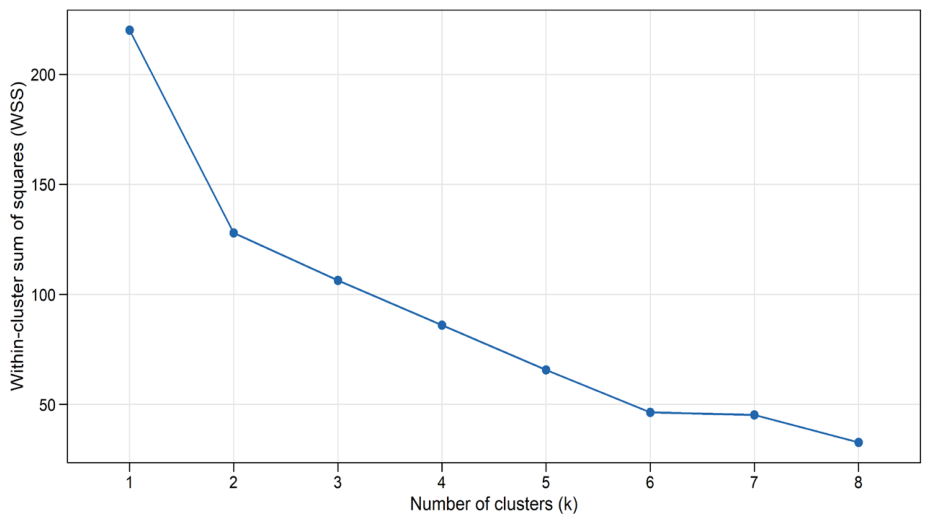
The Elbow method evaluates the internal compactness of clusters using the intra-cluster sum of squares (WSS). As the number of clusters (k) increases, the clusters become more compact, and the WSS decreases. The optimal point is where this reduction ceases to be substantial, and the curve “bends at the elbow.” Adding more clusters beyond this point barely improves internal cohesion.
As shown in Figure 7, the Elbow method indicates a sharp decrease in WSS between k = 1 and k = 3, followed by a noticeable reduction up to k = 4. Beyond k = 4, the marginal improvement becomes very limited.
Figure 7.
Elbow criterion (within-cluster sum of squares, WSS) as a function of the number of clusters k (k = 1 to 8), applied to the 23 continental provinces of Ecuador using the 7 production variables (X1–X7). The elbow is located between k = 3 and k = 4, beyond which marginal WSS reduction becomes negligible. Source: ESPAC 2024–INEC [22]. Own elaboration.
The average silhouette index measures how compact each cluster is and how well it is separated from neighboring clusters. For each province, it calculates a value between −1 and 1. Values close to 1 indicate that the province is well-assigned to its cluster and far from the others. Values close to 0 or negative suggest ambiguity in the classification. The optimal k maximizes the average of these values.
Using both criteria together yields a more robust decision regarding the number of clusters. The elbow provides information on partition efficiency, while the silhouette provides information on quality and separability.
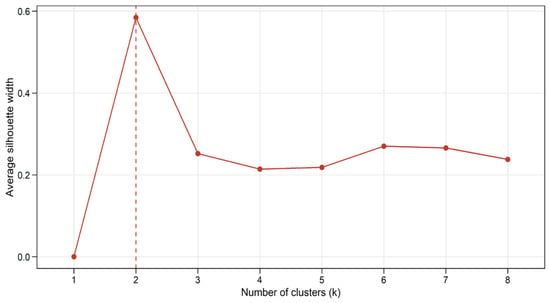
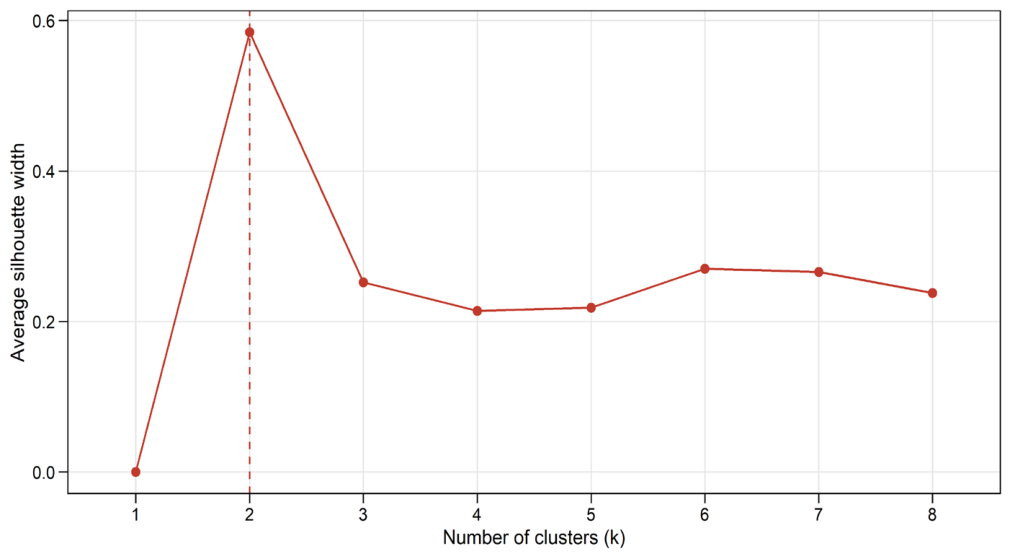
As shown in Figure 8, the silhouette index reaches its maximum at k = 2 (approximately 0.73) and then gradually decreases. However, a value of k = 2 would yield a classification that is too coarse for this study.
Figure 8.
Average silhouette width as a function of the number of clusters k (k = 1 to 8). The global maximum is at k = 2 (≈ 0.73); k = 4 is selected based on substantive interpretability criteria and WSS elbow convergence (see Section 4.3). Source: ESPAC 2024–INEC. Own elaboration.
The selection of k = 4 over k = 2—the value maximizing the average silhouette—is supported on three grounds. First, the WSS elbow indicates substantial marginal improvement through k = 4, beyond which gains diminish. Second, k = 2 would merge Carchi (the only potato-specialized Andean province) with 21 heterogeneous provinces, eliminating the precise territorial distinction that has direct policy relevance for highland agricultural planning. Third, k = 4 yields BSS/TSS = 78.65%, which exceeds the 60% threshold generally considered satisfactory for exploratory cluster analysis. While the silhouette is higher at k = 2 (≈ 0.73 vs. 0.43 at k = 4), the substantive information gain from the additional two clusters is essential for the differentiated supply chain planning purpose of this study, as evidenced by the distinct SC profiles documented in Section 4.5.
The BSS/TSS index, expressed as a percentage, indicates the proportion of total variability captured by the clustering solution. A value of 78.65%, obtained in this study with k = 4, indicates that the four clusters account for nearly 79% of the differences in production among the 23 provinces. This value is considered a satisfactory result, confirming the classification reflects actual groupings in the data rather than an arbitrary partition.
It is acknowledged that Cluster 2 represents a group defined primarily by the absence of productive specialization rather than a positive profile. This fact is a known behavior of k-means applied to highly skewed agricultural data: provinces with near-zero values across all variables tend to cluster together regardless of their internal heterogeneity. The seemingly high individual silhouette scores for Cluster 2 provinces (mean = 0.51) reflect their distance from the specialized clusters rather than their internal cohesion. This limitation is addressed in Section 4.5 through the post-clustering supply chain characterization, which reveals meaningful internal differences within Cluster 2 using commercialization ratios and logistical capacity indicators.
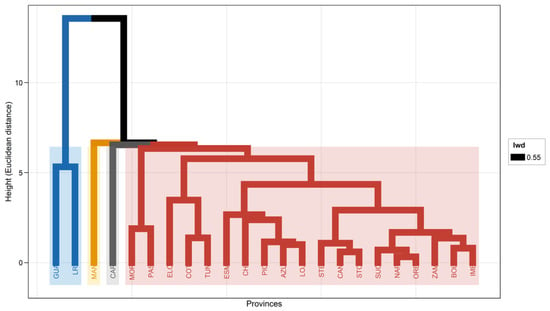
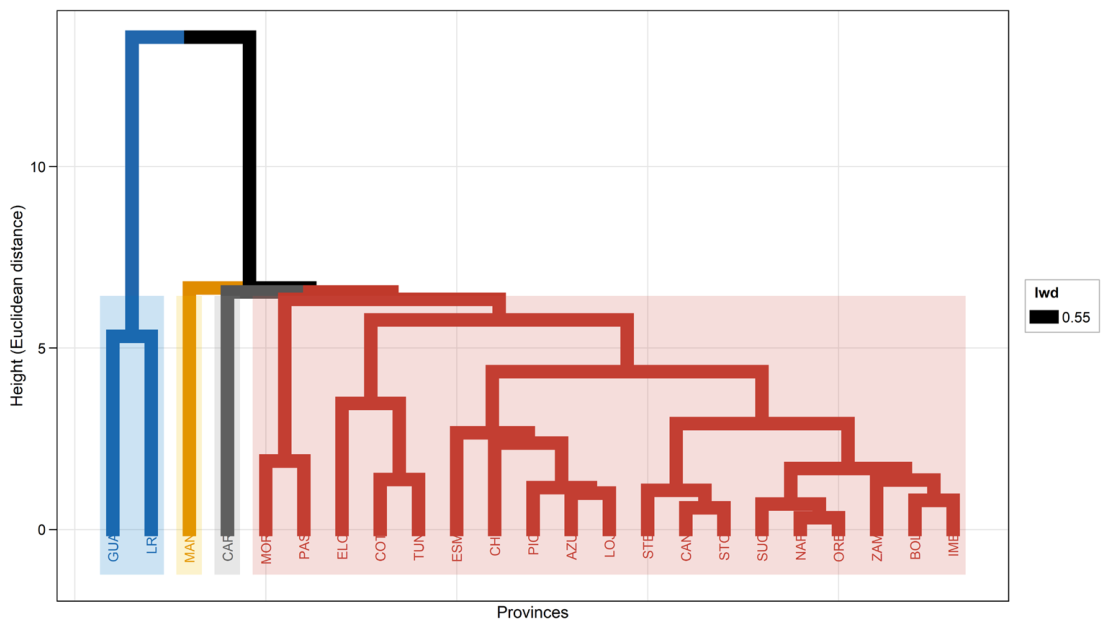
Figure 9 shows a dendrogram revealing four natural clusters with clearly distinct fusion heights. We selected k = 4 to strike a balance between statistical parsimony and substantive interpretability. This decision is supported by a BSS/TSS index of 78.65%, indicating that the four clusters account for 78.65% of the dataset’s total variance. This dendrogram was obtained using Ward’s method and the Euclidean distance metric. It visually confirms the existence of four well-defined groups. Guayas and Los Ríos (GUA, LRI) form a group distinctly separate from the rest, indicating a radically different profile. Carchi (CAR) forms an independent group. The remaining two groups comprise the other 20 provinces.
Figure 9.
Hierarchical dendrogram obtained using Ward’s minimum variance linkage method and Euclidean distance (k = 4, n = 23 continental provinces of Ecuador). Coloured rectangles delimit the four identified clusters. Source: ESPAC 2024–INEC [22]. Own elaboration.
The results of the k-means algorithm with k = 4 and 25 initializations (set.seed = 123) are shown in Table 5. Additionally, Figure 10 shows a graphical representation of the clustering.
Table 5.
Provincial assignment by cluster.
Figure 10.
Provincial classification by agricultural production profile—PCA biplot projecting the 23 continental provinces onto the first two principal components (PC1 and PC2). Ellipses represent Euclidean confidence regions per cluster. Source: ESPAC 2024–INEC [22]. Own elaboration.
Cluster 1 consists of only Carchi. Cluster 2 comprises 15 low-production provinces from three regions. Cluster 3 consists of five medium-to-high banana-producing provinces. Cluster 4, which has the highest production intensity, includes Guayas and Los Ríos.
The centroids at the original scale, shown in Table 6, characterize each profile. Specifically, Cluster 4 is dominant in tropical crops, with an average production of 2711,011 tonnes of bananas, 927,809 tonnes of rice, and 327,842 tonnes of corn. Cluster 1 (Carchi) has an opposite profile: It has 134,253 tonnes of potatoes, but zero values for bananas and rice. Cluster 3 has an average banana production of 400,366 tonnes, with a yield of 47.94 tonnes per hectare. Cluster 2, the most heterogeneous, shows low values for all crops.
Table 6.
Cluster centroids in original units.
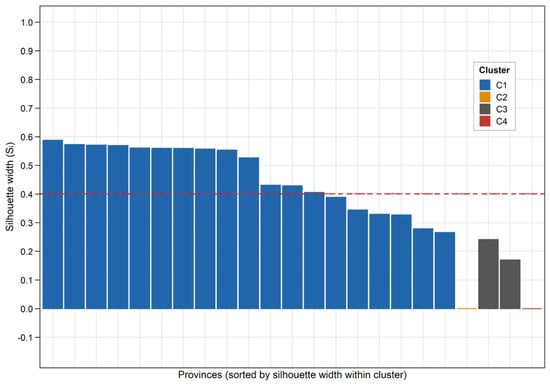
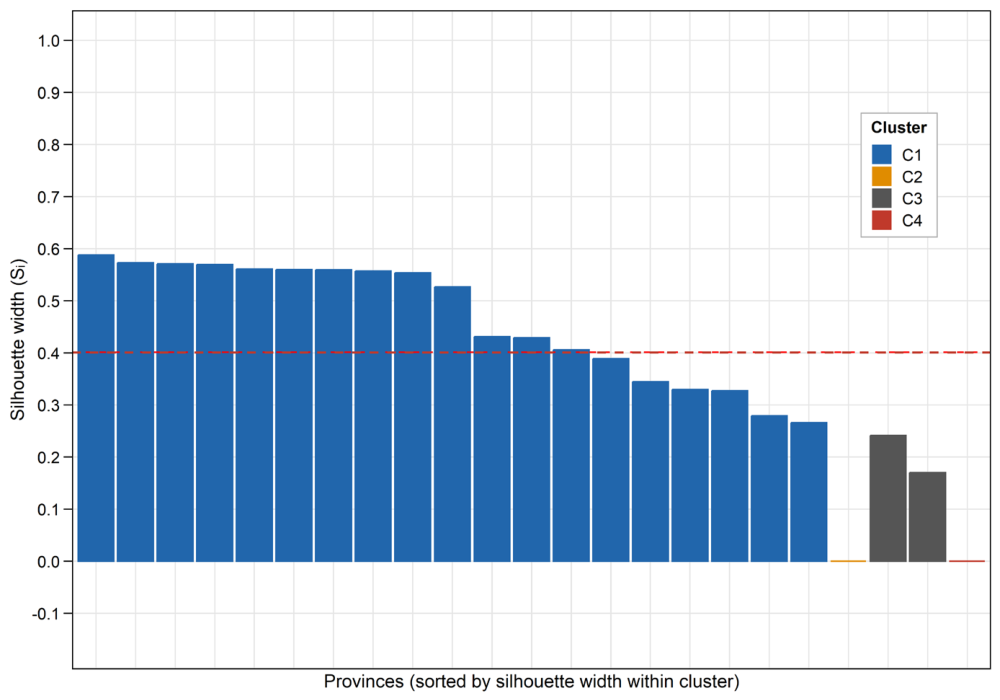
The individual silhouette plot shown in Figure 11 has an average silhouette value of 0.43. Cluster 2 is the most accurately classified, with an accuracy of 0.51. Cluster 3 exhibits the greatest ambiguity at 0.26, possibly due to the transition between upland and coastal agriculture. Cluster 4 reaches 0.33, while Cluster 1 registers 0.00 because it is a single-province cluster. This value indicates not a classification error, but rather the exceptional nature of Carchi. Following the interpretation criteria of Kaufman and Rousseeuw (1990) [27], silhouette values between 0.26 and 0.50 indicate a reasonable cluster structure, values between 0.51 and 0.70 indicate a medium structure, and values above 0.71 indicate a strong structure. The global average of 0.43 thus falls within the ‘reasonable’ range, consistent with expectations for territorial classification studies in which provinces share overlapping agro-ecological characteristics across cluster boundaries. Comparable clustering studies applied to agricultural regional typologies in developing economies report silhouette values in the 0.35–0.55 range [15,28].
Figure 11.
Individual silhouette width (Si) by province (k = 4, n = 23 continental provinces). The dashed red line represents the global average silhouette (Si = 0.43). Source: ESPAC 2024–INEC [22]. Own elaboration.
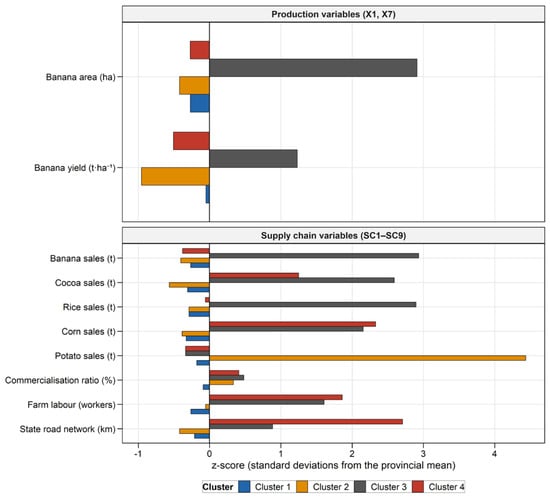
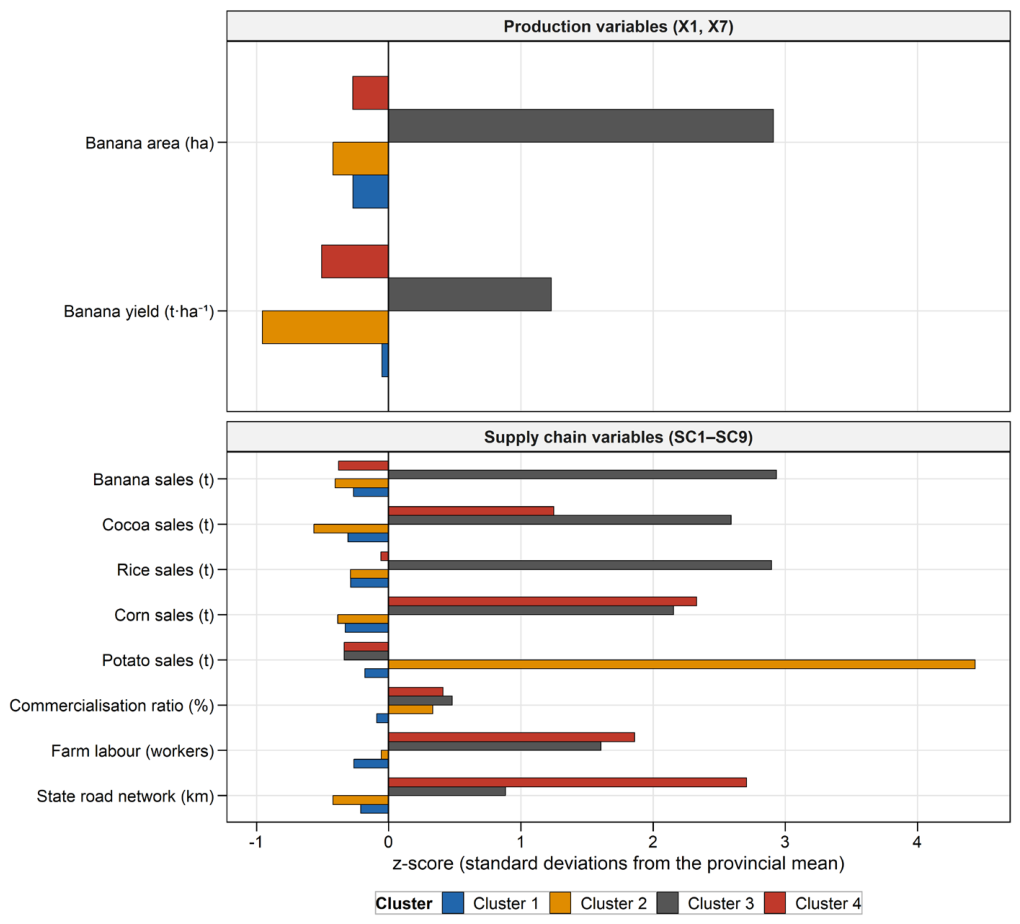
Figure 12 shows the standardized z-score profiles of each cluster across both the production variables used for clustering (upper panel) and the supply chain variables used in the post-clustering characterization (lower panel). In the production panel, Cluster 4 (Guayas and Los Ríos) dominates in banana area (z ≈ 2.9), while Cluster 1 (Carchi) shows a strongly negative banana yield z-score and near-zero values for all other production variables, reflecting its exclusively Andean profile. In the supply chain panel, Cluster 4 leads in banana, rice, and corn sales (z-values between 2 and 3). Cluster 1 registers the most extreme deviation in the entire dataset at z ≈ 4.5 in potato sales, confirming Carchi’s exceptional potato market orientation. Cluster 3 (medium-scale banana provinces) shows moderately above-average values in banana sales and a positive commercialization ratio z-score. Cluster 2 (the low-intensity group) remains near zero across all supply chain indicators, consistent with its mean commercialization ratio of 82.7% documented in Table 7.
Figure 12.
Standardized z-score profile of each cluster. Upper panel: production variables (X1, X2–X7; clustering basis). Lower panel: supply chain variables (SC1–SC9; post-clustering characterization). Source: ESPAC 2024 [22]/ESTRA 2024 [23]/MTOP 2023 [24]. Own elaboration.
Table 7.
Supply chain characterization of the four clusters (mean values per variable, original units).
4.4. Interpretation of the Four Clusters
Cluster 1 contains Carchi and represents the Andean potato-specialized profile. It should not be interpreted as a scaled-down version of the coastal system; it is a distinct chain with distinct storage requirements, seasonal risks, and price dynamics. This profile is highly relevant for modeling supply planning in the highlands. Social implications of this cluster: By mathematically isolating this Andean province from Ecuador, the algorithm reveals the need for targeted public policies that protect smallholder farming economies from being overshadowed by high-volume tropical supply chains. From a supply chain perspective, Carchi’s commercialization ratio of 94.8% indicates that nearly all potato output reaches formal markets; however, the limited state road network (314.7 km) and relatively low vehicle density constrain inter-regional distribution capacity, making this cluster’s supply chain integration efficiency-dependent rather than infrastructure-dependent.
Cluster 2 is the largest group and includes provinces with lower average values across the variables considered. These provinces should not be treated as marginal; lower individual production capacity may increase vulnerability to disruptions and dependence on supply flows from more concentrated production nodes. Therefore, identifying this cluster through machine learning highlights the socio-economic need for inclusive logistical integration to protect local food security and rural livelihoods. Its supply chain signature—a mean commercialization ratio of 82.7%, the lowest of all clusters—confirms that lower production intensity coincides with lower market integration, leaving a significant share of agricultural output outside formal distribution channels and suggesting that inclusive logistics and commercialization policies are as critical for this group as production support.
The post-clustering supply chain characterization reinforces this interpretation: Cluster 2 has the lowest average commercialization ratio among all groups (82.7%), compared with 97.8% for Cluster 3 and 97.9% for Cluster 4. This statistical result confirms that the 15 lower-intensity provinces channel a smaller fraction of their output through formal supply chains, implying higher rates of post-harvest retention, informal commercialization, or logistical losses. Their average farm labor base (79,312 workers) and state road network (433.8 km) provide sufficient capacity for local-level operations, but integration with national or export markets requires targeted infrastructure investment and inclusive commercialization policies.
Cluster 3 groups El Oro, Cañar, Cotopaxi, Tungurahua, and Santo Domingo de los Tsachilas. These provinces combine medium-scale banana production with high banana yield. Their main challenge may be less agronomic than organizational: aggregation, cooperative logistics, market access, and coordination among small and medium producers. Their near-complete commercialization ratio (97.8%) confirms that virtually all production reaches formal supply chains, shifting the policy priority from market access to aggregation efficiency. These provinces are well-integrated but fragmented, and cooperative logistics schemes would allow them to capture economies of scale currently available only to the dominant Cluster 4 provinces.
Cluster 4 contains Guayas and Los Ríos. This profile represents the dominant tropical production core. Its scale creates efficiency advantages but also systemic risk: a climatic, phytosanitary, or transport disruption affecting these provinces would not only disrupt national supply and export flows but also trigger severe food security crises and threaten the livelihoods of thousands of agricultural workers. AI-driven monitoring of this cluster is therefore a national priority. Its supply chain profile corroborates this dominance: 97.9% commercialisation ratio, 228,377 farm workers, and 595 km of state road network collectively identify Cluster 4 as the logistics hub of Ecuador’s agri-food system—and, simultaneously, as the cluster whose disruption would generate the largest cascading effects across national and export supply chains.
4.5. Supply Chain Characterization of Clusters
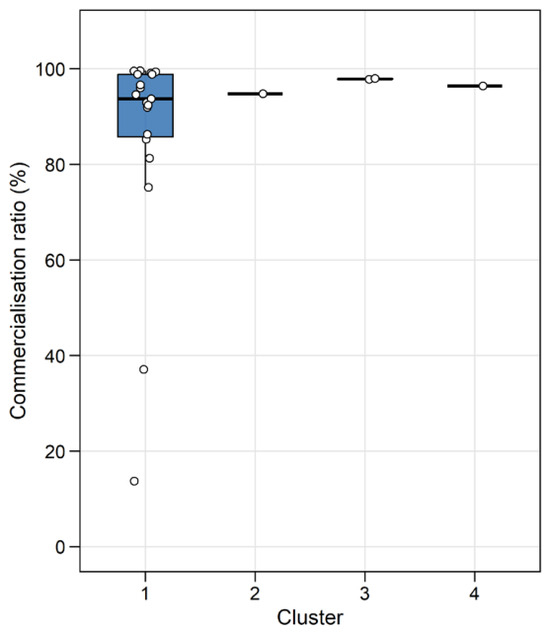
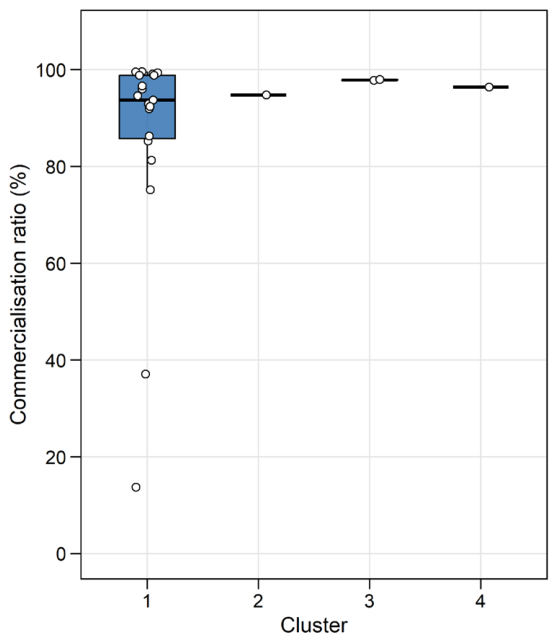
Following the cluster assignment, the nine supply chain variables (SC1–SC9) are used to characterize each cluster from logistics and commercialization perspectives. This post-clustering analysis reveals meaningful differences that complement the production-based typology and directly address the supply chain dimension of the research objectives. Table 7 presents the mean values of the three key SC indicators by cluster, and Figure 13 illustrates the distribution of the commercialization ratio (SC6) across clusters.
Figure 13.
Commercialization ratio (%) by cluster (k = 4). White dots represent individual provinces; boxes show the interquartile range. Source: ESPAC 2024–INEC [22].
The most discriminating indicator is the commercialization ratio (SC6): Cluster 2 shows the lowest supply chain integration at 82.7%, compared with 97.8% (Cluster 3) and 97.9% (Cluster 4). This 15-percentage-point gap confirms that the 15 lower-intensity provinces not only produce less but also channel a smaller fraction of their output through formal supply chains. Cluster 4 (Guayas and Los Ríos) has the largest farm labor base (228,377 workers) and the longest state road network (595 km), consistent with its role as the dominant logistics hub. Cluster 1 (Carchi) shows high commercialization (94.8%) relative to its scale, reflecting efficient integration into the potato market despite geographic isolation and a comparatively limited road network (314.7 km). Cluster 3 provinces achieve near-complete commercialization (97.8%) with moderate infrastructure, indicating that their main constraints are not production efficiency or market access per se, but rather aggregation capacity and cooperative logistics. Figure 13 visualizes the distribution of commercialization ratios by cluster, highlighting the internal heterogeneity of Cluster 1 (ranging from 13.7% to 100%) and the near-complete market integration of Clusters 3 and 4 (both above 93%).
5. Discussion
The four-cluster typology obtained in this study (BSS/TSS = 78.65%, k = 4, n = 23 provinces) is consistent with the broad finding in the clustering literature that national averages cannot represent agri-food territorial systems without losing operationally relevant information. Bosona and Gebresenbet [3] demonstrated that grouping local food supply actors by productive similarity is a prerequisite for logistics network integration; the present results extend this logic to the provincial scale of a developing economy, showing that four structurally distinct supply chain typologies coexist within a single national system. Sitnicki et al. [15], working on Ukrainian agricultural market clusters, similarly found that strategic cluster formation based on production variables yields actionable territorial segmentation; however, their focus on a single commodity (grain) differs from the multi-crop, multi-region scope adopted here. Alvarez et al. [29] established that farm-level typologies built from production data successfully differentiate management strategies in smallholder systems; the provincial typology presented here applies a structurally analogous logic at the territorial level, translating the farm-typology methodology into a supply chain planning instrument.
The dominance of Cluster 4 (Guayas and Los Ríos) in banana, rice, and corn supply chains is consistent with the structural concentration documented in resilience-oriented network studies. Gholami-Zanjani et al. [30] showed that epidemic-prone food supply chains are characterized by high node concentration and that network redesign should target redundancy in those nodes; the present findings confirm that Cluster 4 constitutes this type of high-concentration node precisely at the national scale. Hobbs and Hadachek [31] argue that supply chain resilience depends on the diversification of supply sources and the capacity to redirect flows after disruption; the 97.9% commercialisation ratio of Cluster 4 means that any reduction in its logistical throughput has an immediate and disproportionate effect on national food security, motivating the systemic monitoring and redundant transport route investments proposed in the policy framework of this study. Stone and Rahimifard [28] further establish that resilience frameworks must be tailored to the specific structural characteristics of each supply chain segment; the cluster-based approach applied here directly operationalizes this recommendation by providing segment-specific profiles.
The isolation of Cluster 1 (Carchi) as a potato-specialized singleton is consistent with the farm typology literature, which consistently identifies Andean tuber systems as structurally distinct from lowland commodity chains. Alvarez et al. [29] documented that hypothesis-based typologies capture agro-ecological boundaries that statistical methods alone may obscure; the k-means algorithm in this study independently recovered the Andean-coastal divide as the primary clustering dimension—a result that validates both the methodological approach and the ecological reality it captures. Clavijo-Buritica et al. [6], working on Colombian agri-food supply networks, found that supply chain design in mountainous developing-economy contexts requires context-specific parameters that generic optimization models do not accommodate; the Carchi profile—characterized by a distinct storage technology, seasonal risk structure, and road connectivity pattern—confirms that an Andean-specific model parameterization is necessary before any highland supply chain optimization can be meaningfully attempted.
The supply chain gap identified in Cluster 2 (commercialization ratio 82.7% versus 97.8–97.9% in Clusters 3 and 4) reflects the market integration deficit documented in the short food supply chain literature. Paciarotti and Torregiani [32] show that short chains are characterized by incomplete market integration and limited logistics capacity, which aligns with the Cluster 2 profile of low production intensity combined with lower-than-average market reach. Béné [33] argues that food system resilience in developing economies depends critically on the ability of low-intensity producers to maintain market access during disruptions; the 15-percentage-point commercialization gap documented here quantifies the vulnerability that Béné’s framework identifies as the primary resilience risk for non-specialized rural provinces. Unlike European short-chain studies, where the gap reflects a deliberate local food preference, the Ecuadorian Cluster 2 gap appears structural—driven by geographic isolation, limited road access, and the absence of aggregation infrastructure—implying that policy responses should target logistics connectivity rather than stimulating consumer demand.
The cooperative logistics opportunity identified in Cluster 3 (medium-scale banana provinces with a 97.8% commercialization ratio and a 47.94 t ha−1 yield) aligns with the cluster governance literature. Manukyan [5] documented that regional agri-food clusters in developing economies achieve competitiveness not through scale alone but through institutionalized cooperation among producers with similar profiles; Cluster 3’s homogeneous productive structure makes it the most suitable candidate for this type of cooperative arrangement in the Ecuadorian system. Barakat et al. [7], studying sustainable supply cluster dynamics in Egypt, showed that dynamic capabilities—particularly joint logistics and collective negotiation—drive collective competitiveness in medium-scale agricultural clusters; the present results suggest that applying this model to the five Cluster 3 provinces could allow them to access export channels currently dominated by Cluster 4, reducing the structural asymmetry between the two coastal banana production systems. Compared with generic supply chain optimization studies that assume homogeneous national production parameters—such as multi-objective closed-loop models applied to single-product agricultural chains [34], the cluster-based differentiation presented here demonstrates that targeting interventions at the provincial typology level, rather than at the national average, yields a more accurate representation of where efficiency gains and resilience improvements are actually attainable.
Integrating these results, a differentiated regional logistics planning framework emerges for Ecuadorian agri-food policy. Cluster 4 (Guayas and Los Ríos) requires systemic risk monitoring, redundant transport routes, and phytosanitary early-warning systems given its role as the national supply concentration point. Cluster 3 (medium-scale banana provinces) offers the strongest case for cooperative logistics programs: shared refrigerated transport, joint negotiations with exporters, and market-access partnerships that leverage their high technical efficiency. Cluster 2 (low-intensity provinces) requires investment in connectivity infrastructure and inclusive commercialization policies to close the 15-percentage-point gap in market integration relative to Clusters 3 and 4. Cluster 1 (Carchi) demands Andean-specific interventions: highland cold storage, potato price stabilization mechanisms, and smallholder credit access tailored to its distinct seasonal risk profile. This framework moves beyond the generic supply chain resilience literature by anchoring policy recommendations directly to the empirical territorial typology rather than to abstract network optimization parameters.
6. Conclusions
This study classified Ecuadorian provinces according to official ESPAC 2024 production profiles using descriptive statistics, hierarchical clustering, and k-means clustering. The results confirm that Ecuadorian agri-food production is not territorially homogeneous. All analyzed variables show coefficients of variation above 100%, and the final cluster solution differentiates four profiles with clear supply-chain meaning.
The principal contribution of this research is demonstrating how unsupervised AI algorithms can transform complex agricultural data into an operational typology. By making territorial disparities mathematically visible, this AI-driven approach provides a strategic foundation for designing equitable public policies and resilient supply chains. The typology separates a potato-specialized Andean profile, a broad, lower-intensity group, medium-scale banana provinces with high yields, and the dominant tropical production core, formed by Guayas and Los Ríos. This classification can serve as a starting point for future optimization models, resilience assessments, and differentiated public policy. Specifically, the AI-driven approach demonstrates that unsupervised machine learning can extract substantively meaningful territorial typologies from routine agricultural census data—without requiring bespoke field surveys, proprietary datasets, or computational infrastructure beyond standard statistical software—thereby lowering the barrier to evidence-based supply chain planning in data-constrained developing-economy contexts.
This analysis is primarily focused on production profiling and is limited by the absence of environmental and extended logistical indicators, such as transport-related carbon emissions, specific post-harvest food waste metrics, and road accessibility. Future research should incorporate these sustainability dimensions and evaluate whether the cluster structure remains stable when infrastructure, climate-risk, and economic variables are added. A further line of work should test whether integrating this AI-generated typology into advanced mathematical optimization models for supply chain operations—such as harvesting, consolidation, and cold-chain allocation—yields not only operational efficiency but also equitable socio-economic outcomes during emergency distribution and market uncertainty. A further limitation concerns cluster stability: with n = 23 observations and p = 7 variables, the observation-to-variable ratio is relatively low, raising the possibility of capitalizing on chance patterns specific to the 2024 survey cycle. The analysis has not been validated against prior ESPAC editions (2020–2023), and no bootstrapping or resampling procedure was applied to assess the reliability of the partition. Future research should evaluate cluster stability across multiple ESPAC editions and test alternative linkage methods and distance metrics to confirm the robustness of the four-cluster typology. The cross-sectional design (ESPAC 2024) constitutes a further limitation: a single survey year cannot capture production dynamics driven by climate cycles, market shocks, or policy changes, so the typology should be validated against multiple ESPAC editions before being applied to long-term infrastructure planning. Taken together, these limitations—production-variable scope, cross-sectional design, and absence of bootstrapping validation—define the boundary conditions within which the four-cluster typology should be interpreted: as an exploratory territorial classification grounded in official 2024 data, rather than as a stable long-term structural characterization of Ecuador’s agri-food supply system.
Future research should pursue three directions. First, expand the variable set to incorporate climate risk indices, cold-chain capacity, port access, and farm size distributions, and test whether the four-cluster structure remains stable under richer characterization. Second, applying dynamic panel clustering across the ESPAC 2020–2024 series to evaluate the temporal stability of the typology and identify provinces transitioning between cluster profiles in response to policy interventions or external shocks. Third, embedding the territorial typology as a parameterization constraint in mathematical programming models for supply chain operations—harvest scheduling, consolidation point location, and cold-chain allocation—to evaluate whether cluster-differentiated optimization yields superior resilience and equity outcomes compared with nationally uniform models.
Funding
This work was supported by the Universidad Politécnica Estatal del Carchi (UPEC) from Tulcán-Ecuador (www.upec.edu.ec) through funds allocated to the research project: DIIN-2026-09, titled ‘Supply Chain Operations Optimization Models’.
Institutional Review Board Statement
Not applicable.
Informed Consent Statement
Not applicable.
Data Availability Statement
The original data and the complete RStudio analytical script presented in the study are openly available in Zenodo at DOI 10.5281/zenodo.22004173
Acknowledgments
The author acknowledges the National Institute of Statistics and Censuses of Ecuador for providing public access to the ESPAC agricultural statistics and the Universitat Politécnica de Valencia for the academic context in which this analysis was developed. During the preparation of this work, the author utilized the AI-powered search engine Consensus strictly as an exploratory research support tool. Specifically, this technology was used to assist with the systematic literature search, identify contemporary research trends, and determine methodological gaps in the domain under study. After using this tool, the author thoroughly reviewed, analyzed, and synthesized the retrieved literature. The author takes full and sole responsibility for the final content, originality, and accuracy of this publication.
Conflicts of Interest
The author declares no conflicts of interest.
Appendix A
RStudio Script Used for Data Processing, Descriptive Analysis, and Cluster Analysis
The data supporting this study and the R code for statistical analysis are available free of charge and open to the public at the following online repository: https://zenodo.org/records/22004174 (accessed on 19 June 2026).
References
- Herrera-Granda, I.D.; del Mar Eva Alemany Díaz, M.; Peluffo-Ordóñez, D.H.; Herrera-Granda, E.P.; D’Ambrosio, G. A Systematic Review of Recent Models for Agri-Food Supply Chain Management With Emphasis on the Application of Artificial Intelligence and Sustainability. IEEE Access 2026, 14, 21213–21256. [Google Scholar] [CrossRef] [Scilit]
- United Nations. Transforming Our World: The 2030 Agenda for Sustainable Development; United Nations: New York, NY, USA, 2015. [Google Scholar]
- Bosona, T.; Gebresenbet, G. Cluster Building and Logistics Network Integration of Local Food Supply Chain. Biosyst. Eng. 2011, 108, 293–302. [Google Scholar] [CrossRef] [Scilit]
- Mogale, D.; Ghadge, A.; Kumar, S.; Tiwari, M. Modelling Supply Chain Network for Procurement of Food Grains in India. Int. J. Prod. Res. 2019, 58, 6493–6512. [Google Scholar] [CrossRef] [Scilit]
- Manukyan, I. Formation and Management of Regional Agri-Food Clusters in Developing Countries: Case of “Agrotransilvania” (Romania). Manag. Sustain. Dev. 2021, 13, 34. [Google Scholar] [CrossRef] [Scilit]
- Clavijo-Buritica, N.; Triana-Sanchez, L.; Escobar, J. A Hybrid Modeling Approach for Resilient Agri-Supply Network Design in Emerging Countries: Colombian Coffee Supply Chain. Socioecon. Plan. Sci. 2022, 85, 101431. [Google Scholar] [CrossRef] [Scilit]
- Barakat, M.; Wu, J.; Tipi, N. Empowering Clusters: How Dynamic Capabilities Drive Sustainable Supply Chain Clusters in Egypt. Sustainability 2023, 15, 16787. [Google Scholar] [CrossRef] [Scilit]
- Chang, J.; Jiang, H. Spatio-Temporal Differentiations and Influence Factors in China’s Grain Supply Chain Resilience. Sustainability 2023, 15, 8074. [Google Scholar] [CrossRef] [Scilit]
- Gholian-Jouybari, F.; Hajiaghaei-Keshteli, M.; Smith, N.; Calvo, E.; Mejía-Argueta, C.; Mosallanezhad, B. An In-Depth Metaheuristic Approach to Design a Sustainable Closed-Loop Agri-Food Supply Chain Network. Appl. Soft Comput. 2023, 150, 111017. [Google Scholar] [CrossRef] [Scilit]
- Kabir, R.; Khaled, M.; Narayanan, S.; Rashid, S. Shocks and the Determinants of Resilience: Fish and Shrimp Value Chains in Bangladesh after COVID-19. Appl. Econ. Perspect. Policy 2023, 45, 1835–1862. [Google Scholar] [CrossRef] [Scilit]
- Liu, L.; Ross, H.; Ariyawardana, A. Building Rural Resilience through Agri-Food Value Chains and Community Interactions: A Vegetable Case Study in Wuhan, China. J. Rural Stud. 2023, 101, 103047. [Google Scholar] [CrossRef] [Scilit]
- Rahbari, M.; Khamseh, A.; Mohammadi, M. Robust Optimization and Strategic Analysis for Agri-Food Supply Chain under Pandemic Crisis: Case Study from an Emerging Economy. Expert Syst. Appl. 2023, 225, 120081. [Google Scholar] [CrossRef] [Scilit]
- Aulin, V.; Holub, D.; Hrynkiv, A.; Lysenko, S. Formation of Logistic Project-Oriented Clusters in Regional Supply Chains of Agricultural Products. Cent. Ukr. Sci. Bull. Tech. Sci. 2024, 2, 214–227. [Google Scholar] [CrossRef] [Scilit]
- Coman, C.; Alexoaei, A.; Cojanu, V. The Role of Clusters in Managing Technological Challenges and Achieving Resilient Agri-Food Systems at the Global Level. Proc. Int. Conf. Bus. Excell. 2024, 18, 1495–1505. [Google Scholar] [CrossRef] [Scilit]
- Sitnicki, M.; Kurinskyi, D.; Pimenowa, O.; Wasilewski, M.; Wasilewska, N. Strategic Formation of Agricultural Market Clusters in Ukraine: Emerging as a Global Player. Sustainability 2024, 16, 9430. [Google Scholar] [CrossRef] [Scilit]
- Yao, R.; Wu, H.; Xie, Y. Mechanism and Measurement of the Effects of Industrial Agglomeration on Agricultural Economic Resilience. Agriculture 2024, 14, 337. [Google Scholar] [CrossRef] [Scilit]
- Zhu, Y.; Wang, R.; Feng, M.; Qin, L.; Shia, B.; Chen, M. Supply Chain Analysis Based on Community Detection of Multilayer Weighted Networks. Mathematics 2024, 12, 3606. [Google Scholar] [CrossRef] [Scilit]
- Ben, Y.; Zhang, Y.; Xu, J. Spatial Coupling Mechanisms of Food Security and Regional Economies: Empirical Examination of Core-Periphery Dynamics in Jiangsu Province (2001–2024). Front. Sustain. Food Syst. 2025, 9, 1614887. [Google Scholar] [CrossRef] [Scilit]
- Yuniarti, R.; Arvitrida, N. A Scoping Review and Bibliometric Analysis of Sustainable and Resilient Supply Chain Network Design. Supply Chain Anal. 2025, 12, 100162. [Google Scholar] [CrossRef] [Scilit]
- Zhang, D.; Jiang, D.; He, B. Empowering Agricultural Economic Resilience with Smart Supply Chain: Theoretical Mechanism and Action Path. Sustainability 2025, 17, 2930. [Google Scholar] [CrossRef] [Scilit]
- Zhu, Y.; Bao, Y.; Qin, L.; Sun, Q.; Shia, B.; Chen, M. Resilience Analysis Based on Multilayer Network Community Detection of Supply Chain Network. Ann. Oper. Res. 2025, 361, 1447–1471. [Google Scholar] [CrossRef] [Scilit]
- INEC. Estadísticas Agropecuarias: Encuesta de Superficie y Produccion Agropecuaria; INEC: Quito, Ecuador, 2024. [Google Scholar]
- Instituto Nacional de Estadística y Censos (INEC). Estadísticas de Transporte (ESTRA) 2024: Vehículos Motorizados Matriculados Por Provincia; INEC: Quito, Ecuador, 2024. [Google Scholar]
- Ministerio de Transporte y Obras Públicas (MTOP). Informe Técnico Semestral: Estado Actual Del Ejercicio de La Competencia de Vialidad. In Red Vial Estatal Ecuatoriana En Kilómetros; MTOP: Quito, Ecuador, 2023. [Google Scholar]
- R Core Team. R: A Language and Environment for Statistical Computing; R Foundation of Statistical Computing: Vienna, Austria, 2025. [Google Scholar]
- Ward, J.H. Hierarchical Grouping to Optimize an Objective Function. J. Am. Stat. Assoc. 1963, 58, 236–244. [Google Scholar] [CrossRef]
- Kaufman, L.; Rousseeuw, P.J. Finding Groups in Data: An Introduction to Cluster Analysis; John Wiley & Sons: New York, NY, USA, 1990. [Google Scholar]
- Stone, J.; Rahimifard, S. Resilience in agri-food supply chains: A critical analysis of the literature and synthesis of a novel framework. Supply Chain Manag. Int. J. 2018, 23, 207–238. [Google Scholar] [CrossRef] [Scilit]
- Alvarez, S.; Timler, C.J.; Michalscheck, M.; Paas, W.; Descheemaeker, K.; Tittonell, P.; Andersson, J.A.; Groot, J.C. Capturing farm diversity with hypothesis-based typologies: An innovative methodological framework for farming system typology development. PLoS ONE 2018, 13, e0194757. [Google Scholar] [CrossRef] [Scilit]
- Gholami-Zanjani, S.M.; Klibi, W.; Jabalameli, M.S.; Pishvaee, M.S. The design of resilient food supply chain networks prone to epidemic disruptions. Int. J. Prod. Econ. 2021, 233, 108001. [Google Scholar] [CrossRef] [Scilit]
- Hobbs, J.E.; Hadachek, J. The economics of food supply chain resilience. Annu. Rev. Resour. Econ. 2024, 16, 379–397. [Google Scholar] [CrossRef] [Scilit]
- Paciarotti, C.; Torregiani, F. The logistics of the short food supply chain: A literature review. Sustain. Prod. Consum. 2021, 26, 428–442. [Google Scholar] [CrossRef] [Scilit]
- Béné, C. Resilience of local food systems and links to food security—A review of some important concepts in the context of COVID-19 and other shocks. Food Secur. 2020, 12, 805–822. [Google Scholar] [CrossRef] [Scilit]
- Banasik, A.; Kanellopoulos, A.; Claassen, G.D.H.; Bloemhof-Ruwaard, J.M.; van der Vorst, J.G. Closing loops in agricultural supply chains using multi-objective optimization: A case study of an industrial mushroom supply chain. Int. J. Prod. Econ. 2017, 183, 409–420. [Google Scholar] [CrossRef] [Scilit]

Disclaimer/Publisher’s Note: The statements, opinions and data contained in all publications are solely those of the individual author(s) and contributor(s) and not of MDPI and/or the editor(s). MDPI and/or the editor(s) disclaim responsibility for any injury to people or property resulting from any ideas, methods, instructions or products referred to in the content. |
© 2026 by the author. Licensee MDPI, Basel, Switzerland. This article is an open access article distributed under the terms and conditions of the Creative Commons Attribution (CC BY) license.