


Abstract
In the process of rural revitalization, former revolutionary base areas face deep-seated contradictions between their historical contributions and their current development. This study uses 307 village-level administrative units in Huining County, Gansu Province. Based on multi-source spatial datasets from five time periods spanning 1970–2025, it constructs a rural value assessment system across five dimensions—rural industry, ecology, society, culture, and governance. It comprehensively employs methods such as the entropy weighting method, global spatial autocorrelation, hot spot analysis, and landscape pattern indices to reveal the spatiotemporal evolution characteristics of rural value. The results indicate that while overall value has continued to rise, growth patterns across different dimensions have diverged significantly; the Global Moran’s I exhibits a nonlinear trajectory of “decline—rebound—fluctuations at a low level,” corresponding to the three-stage evolution of settlements—namely, “integration—expansion—contraction”—revealing a phased disconnect between top-down spatial planning and bottom-up rural industrial development; spatial differentiation of cultural resources plays a decisive role in rural value, and the revitalization of revolutionary base areas requires a shift from sustained external investment to culture-driven industrialization. This study provides an operational framework—from value assessment to spatial planning—for differentiated rural revitalization strategies in revolutionary base areas.
1. Introduction
In the context of the critical task of advancing comprehensive rural revitalization worldwide, the sustainable development of rural regions cannot be overlooked [1]. Rural value encompasses multiple dimensions, including industry, ecology, society, culture, and governance; a systematic understanding and coordinated enhancement of these dimensions are essential prerequisites for comprehensively advancing rural revitalization [2]. An accurate understanding of rural values is a crucial prerequisite for achieving development with rural characteristics, and recognizing these values is a dynamic and evolving process [3]. Formulating differentiated regional development strategies guided by the multidimensional values of rural areas is a key pathway to achieving sustainable rural development [4]. Revolutionary base areas are home to a concentrated distribution of “red culture” resources, and their rural values exhibit distinctive characteristics including a strong historical legacy, revolutionary heritage, and regional synergy [5]. Red cultural resources represent the unique spiritual wealth and core driving force for rural revitalization in revolutionary base areas; their value lies in providing comprehensive empowerment for rural development, including political leadership, economic momentum, cultural enrichment, governance optimization, and ecological construction [6]. Exploring the interrelationships and spatiotemporal differentiation of the multifunctional roles of rural regions in revolutionary base areas underpins the optimal allocation of rural resources and advances sustainable rural development [7]. Issues such as rural regional value, spatial governance in revolutionary base areas, and the evolution of settlement patterns have gradually become central topics in rural spatial planning research. As a revolutionary holy site where the three main forces of the Red Army converged, Huining County’s rural value is embedded with multiple factors—including revolutionary cultural heritage, regional cultural accumulation, and lagging rural development—making it a typical case study for research on rural value in revolutionary base areas. It holds irreplaceable practical significance for revealing the mechanisms underlying the composition of rural value and the pathways to revitalization in such regions.
Research on rural values originated from a fundamental shift in the international academic community’s understanding of rural functions—namely, the theoretical evolution from productivism to post-productivism and, ultimately, to the concept of multifunctional rural areas [8]. Domestic scholars subsequently incorporated rural values into the theoretical framework of rural revitalization. Based on functional dimensions, they deconstructed rural resource endowments into six categories of value—production, livelihood, ecology, society, culture, and governance—providing a theoretical tool for systematically identifying multidimensional rural values [9]. Qu Ruopin et al. systematically reviewed the progress in rural value theory and methodology research [10]; Tan Lin and Long Hualou constructed a comprehensive transformation system and analytical framework for land-use patterns [2]. In terms of research methods, the entropy weighting method, the Analytic Hierarchy Process (AHP), and combined approaches of the two have been widely used for indicator weighting and value estimation [11]; spatial statistical methods such as spatial autocorrelation analysis and the Geographical Detector have been employed to reveal the spatial differentiation characteristics of value patterns and their driving factors [12]; Ecosystem service assessment tools, such as the InVEST model, have been introduced into quantitative research on rural ecological value [13]; methods such as Spearman’s rank correlation analysis and production possibility frontier curves have been used to quantitatively explore trade-offs and synergies among rural multifunctionalities [14]. Liu Yansui et al. have deepened the human geography theoretical framework for rural value research from a global perspective on rural-urban relations [15].
In the field of research on revolutionary base areas, existing studies have primarily focused on three levels: At the regional development level, Zhong Yang et al. revealed the spatial dependence characteristics and driving factors of high-quality development in these areas [16]; Fu Xiao and Huang Yingmin identified the spatial differentiation patterns of high-quality development in key counties within revolutionary base areas [7]; At the level of rural geographical systems, Cheng Jia and Fang Shiming conducted a quantitative analysis of the interactions among various rural functions and the temporal changes in spatial patterns across 31 counties in the Dabie Mountains [5]; At the level of revolutionary cultural resources, Xu Chunxiao et al. revealed that the density of business formats in revolutionary tourism destinations is characterized by a “combination of quantitative expansion and agglomeration” [17]; Ding Zhiwei et al. identified the spatial differentiation patterns and driving factors of the comprehensive development levels of revolutionary scenic areas [18].
At the level of rural settlement evolution, previous studies have used landscape pattern indices to reveal the mechanisms underlying the formation of rural settlement landscape patterns, finding that new settlements primarily result from the conversion of farmland [19]; Zhou et al. identified the paradox of a declining rural population coupled with the continued expansion of settlement areas at the township level [20]; Duan Binqiao et al. conducted a systematic assessment of settlement fragmentation at the county level in China [21]; and Wu Li et al. introduced the CRITIC weighting method and landscape pattern indices, finding that the total area of rural settlements in China has continued to expand over the past two decades [22].
A review of the above literature reveals that existing research has yielded substantial findings regarding the evolution of rural multifunctionality theory, methodologies for quantifying value, the understanding of regional systems in former revolutionary base areas, and the characteristics of settlement pattern evolution, thereby laying a solid theoretical and methodological foundation for this paper. However, at the level of explaining scientific mechanisms, existing research still faces the following areas that require further exploration:
First, at the theoretical and methodological level. There is a lack of effective integration between rural value assessment and spatial pattern analysis; changes in spatial form and value responses are rarely incorporated into a single analytical framework. This has led to an insufficient explanation of the feedback mechanism—specifically, “how spatial form influences value evolution”—and the scientific relationship between multidimensional rural values and the spatial form of settlements remains to be thoroughly explored. Second, at the level of regional specificity. Research on the evolution of rural values in former revolutionary base areas has largely focused on evaluating policy effects, while there remains room for expansion in exploring the underlying evolutionary logic under the structural tension between “strong external institutional supply and weak endogenous market development.” In particular, a more systematic scientific analysis is needed to understand how protective institutional constraints influence the asymmetric evolution of various value dimensions, as well as the coupling and trade-off mechanisms among these dimensions; Third, at the methodological and evolutionary patterns level. Analyses of settlement patterns are typically limited to a time span of 30 to 40 years and are conducted separately from value assessments, making it difficult to span an entire institutional cycle to identify the long-term, coordinated evolutionary patterns of “institutional change—spatial restructuring—value response.”
This study aims to uncover the mechanisms underlying the co-evolution of multidimensional rural values and the spatial forms of settlements, and to propose differentiated planning strategies based on these findings. Specifically, this study seeks to provide clear answers to the scientific question of how multidimensional rural values and spatial forms co-evolve in the context of long-term institutional change, and how spatial planning can be used to enhance the value of revolutionary base areas. The ultimate goal is to achieve an organic integration of the spiritual legacy of these areas with their endogenous development dynamics, thereby promoting the sustainable revitalization of rural communities in revolutionary base areas. This study uses 307 village-level survey areas in Huining County, Gansu Province, as assessment units, selects multi-source spatial data from five periods between 1970 and 2025, and establishes a spatially explicit value assessment framework across five dimensions—rural industry, ecology, society, culture, and governance. Integrating methods such as the entropy weighting method, global spatial autocorrelation (Moran‘s I), hot spot analysis (Getis-Ord Gi*), and landscape pattern indices (NP, PD, LSI, MPS). The research objective was clearly defined as “mechanism analysis and planning optimization.” Specifically: (1) At the level of mechanism analysis, how have the multidimensional values of rural areas in Huining County—a former revolutionary base area—evolved from 1970 to 2025? (2) At the level of synergy mechanisms, what kind of synergistic relationship exists between multidimensional values and the spatial forms of settlements? (3) At the level of planning optimization, how can we formulate differentiated rural revitalization planning strategies that highlight the spiritual heritage of the former revolutionary base area based on the results of value assessments?
The core contribution of this study lies in providing a systematic theoretical framework, rigorous methodological support, and practical paradigms to advance the sustainable transformation of rural areas in former revolutionary base areas, as specifically reflected in the following three aspects:
- (1)
- At the theoretical level, a closed-loop analytical framework of “institutional change—spatial characterization—value response—planning adaptation” was constructed. This framework illustrates how external institutional provisions drive the evolution of settlement spatial forms. This framework elucidates the formation mechanism of an asymmetric evolutionary pattern characterized by “rapidly rising cultural values coupled with persistently sluggish endogenous industrial momentum,” thereby deepening scientific understanding of the evolutionary patterns of rural social ecosystems.
- (2)
- At the methodological level, the study pragmatically introduced multi-source spatial proxy indicators and sensitivity analyses, effectively mitigating the objective constraints posed by the scarcity of long-time-series micro-panel data. By verifying the robustness of its conclusions under static weighting and rigorously defining the applicability boundaries of proxy indicators, it provides a methodological reference for similar long-time-series spatial econometric studies.
- (3)
- At the practical level, this study distills the synergistic experience of conservation and development into a theoretical proposition and deeply aligns the constructed five-dimensional value system with the SDGs. This proposition reveals the intrinsic logic by which revolutionary base areas empower sustainable rural revitalization through the value transformation of spiritual influence, providing solid empirical evidence and policy insights for similar regions to drive endogenous development by enhancing spiritual and cultural values and achieving multidimensional synergy and sustainable revitalization.
2. Materials and Methods
2.1. Theoretical Framework
This study examines the evolutionary characteristics and spatial differentiation patterns of multidimensional value in rural areas of Huining County, a former revolutionary base (Figure 1). A theoretical framework of “theoretical foundation—core mechanisms—planning responses—ultimate vision” was constructed, with a core focus on the synergistic evolution between comprehensive rural value and the spatial morphology of settlements. Marxist labor theory of value anchors the theoretical foundation of rural pluralistic value [9], while the theory of rural multifunctionality provides an epistemological framework for the pluralistic understanding and systematic integration of value.
Figure 1.
Research Framework Diagram.
This framework aligns with research on the characteristics of rural development in revolutionary base areas located in the Loess Hill Region. The economic, ecological, social, cultural, and governance dimensions of rural comprehensive value interact rather than exist in isolation, exhibiting a coupled relationship of mutual reinforcement and constraint. Driven by external institutional provisions, the four dimensions—ecological, cultural, social, and governance—form a coupled, mutually reinforcing network. However, given the protective regulations and insufficient endogenous market development, the industrial dimension faces a long-term structural trade-off with these four dimensions. This imbalance results in an asymmetric evolutionary pattern characterized by “rising coupling among the four dimensions and lagging industrial development.” In response to this institutional misalignment, planning has become the pivotal link in transforming rural value from spatial diagnosis to differentiated strategies [2]. This framework proposes using the Long March routes as the spatial backbone and, through differentiated strategies across five zones, leveraging the transformation of spiritual influence into the core driving force for endogenous development, thereby achieving synergistic mutual promotion between conservation and development. Consequently, value quantification, spatial characterization, and planning strategies collectively form a complete closed loop from cognition to action, ultimately pointing toward the multiple revitalization goals of “cultural heritage—ecological conservation—industrial transformation” in the revolutionary base areas. This approach drives comprehensive value enhancement and fosters multidimensional synergy and sustainable revitalization aligned with the SDGs.
2.2. Study Area
Huining County is a revolutionary holy site where the three main forces of the Red Army converged. Driven by the combined efforts of the old revolutionary base areas and the rural revitalization strategy, it was selected in 2022 for the National Rural Revitalization Model County initiative. Located in central Gansu Province, at the southern tip of Baiyin City, the county covers 6439 square kilometers and currently administers 28 townships, 284 administrative villages, and 38 communities. The county lies within the hilly and gully region of the Longxi Loess Plateau, characterized by an interlacing landscape of ridges and gullies, with an average elevation of approximately 2025 m. It has a temperate monsoon climate, with an average annual precipitation of only 340–437 mm and an annual evaporation rate exceeding 1800 mm. Drought and water scarcity are the primary natural constraints on regional development (Figure 2).
Figure 2.
Map of the Study Area’s Location and Administrative Divisions.
Dryland farmland and grassland account for the largest proportion of land use in Huining County, with built-up land scattered in patches (Figure 3). Fragmented terrain and gully development have resulted in a severe shortage of available flat construction land, which acts as a natural limitation on industrial spatial expansion in this old revolutionary base area.
Figure 3.
Map of Current Land Use in Huining County.
In October 1936, the First, Second, and Fourth Front Armies of the Chinese Workers’ and Peasants’ Red Army successfully reunited in Huining, marking the end of the Long March. More than 20 Red Army battle sites, including Dadunliang, Hongbaozhi, and Manniupo, still exist within the county. Huining County is also a historic and cultural city in Gansu Province, home to key national and provincial cultural heritage sites such as the Niomendong Ruins and the Xining City Ruins. The ancient Silk Road passed through the county, with the ruins of post stations such as Gangou, Qingjiang, and Guocheng scattered along its route. Driven by the combined momentum of rural revitalization and policies to revitalize former revolutionary base areas, integrating red cultural resources and ancient cultural resources into the development of rural industries has emerged as a pressing challenge for Huining County’s development (Figure 4).
Figure 4.
Map of the Classification and Spatial Distribution of Cultural Heritage in Huining County. (a) Distribution of Cultural Heritage Sites and Ancient Road Routes Based on Protection Levels; (b) Distribution of Cultural Heritage Sites Based on Type; (c) Map of the Route of the Huining Rendezvous During the Long March of the Chinese Workers’ and Peasants’ Red Army.
Overall, Huining County is a typical region where ecological fragility in the Loess hilly area overlaps with a wealth of revolutionary heritage resources. As a candidate for the National Rural Revitalization Model County, Huining stands out among revolutionary base areas for its historical significance and policy prominence; the challenges it faces in resource transformation and spatial development are highly representative of similar regions. Using Huining as a case study helps reveal the internal mechanisms underlying the reconstruction of rural value in former revolutionary base areas, thereby providing a reference for formulating differentiated revitalization strategies.
2.3. Data Sources
This study selected five time points—1970, 1985, 2010, 2020, and 2025—from 1970 to 2025 to construct a 55-year non-equidistant time series. During this period, Huining County underwent five distinct policy phases: in 1970, it was in a period of stable operation under the People’s Commune system; in 1985, it was in the period of full implementation of the household contract responsibility system; in 2010, it was in the period of rapid development of the Grain-for-Green Program and “red tourism”; in 2020, it marked the conclusion of the poverty alleviation campaign and the reference point for the Third National Land Survey; and in 2025, it is in the period of deepening the Rural Revitalization Strategy. Spatial data are available for each period, ensuring comparability across the five time points. This study reveals the evolution of the multidimensional value of rural areas in Huining County and the spatial patterns of human settlements. The data used are primarily divided into six categories (Table 1).
Table 1.
Data Sources and Preprocessing.
Spatial data on settlements. The 1970 settlement data were extracted through interpretation of KeyHole satellite imagery, with a resolution of approximately 2–6 m; the 1985 settlement data were extracted through interpretation of Landsat 5 TM remote sensing imagery (30 m resolution); the 2010 settlement data were extracted through interpretation of SPOT-5 remote sensing imagery (2.5 m panchromatic and 10 m multispectral resolution); The 2020 settlement data were derived from the land-use data of the Third National Land Survey, with original patch accuracies better than 1 m. To ensure spatial comparability across the five time points, fragmented land-use patches from the 2020 Third National Land Survey were consolidated using a 150-m aggregation distance; the 2025 settlement data were interpreted from Jilin-1 satellite imagery. The Third National Land Survey uses “village-level survey areas” as the basic statistical unit. Huining County comprises 307 village-level survey areas, covering 284 administrative villages, 38 communities, and independently managed units such as state-owned agricultural and forestry farms and stations. This study uses the village-level survey areas from the Third National Land Survey as the baseline evaluation units. Historical data from each period, matched to this unit system by administrative division codes and names, were integrated for analysis.
Land-use data. The 1985 and 2010 land-use data were sourced from the China Land Cover Dataset (CLCD) published by Yang Jie and Huang Xin of Wuhan University, with a spatial resolution of 30 m [23]. This dataset is based on the Google Earth Engine platform (accessed on 20 April 2026 via Ovi Interactive Map v9.8.5 X64 SVIP) and uses Landsat series remote sensing imagery as its primary data source. It was constructed using a random forest classifier combined with spatiotemporal consistency checks, achieving an overall accuracy of over 79.31%. The dataset employs a two-level classification system, with the first level divided into six major categories: cropland, forest land, grassland, water bodies, built-up land, and unutilized land. The 2025 land use data were extracted from the 2024 CLCD data (as the 2025 data have not yet been publicly released). The 2020 land use data were extracted from the Third National Land Survey.
NDVI data. NDVI data are used to measure the ecological cover index and the 1970 ecological structure index. The NDVI values for 1970 (derived from 1973 Landsat MSS imagery as a substitute), 1985, 2010, 2019, and 2025 were derived from Landsat MSS/TM/OLI imagery, respectively. Based on the preprocessing of remote sensing imagery, the Normalized Difference Vegetation Index (NDVI) was calculated for each time period using the following formula:
After calculation, the average NDVI values for each time period were summarized by using administrative village boundaries as the statistical units.
Socioeconomic data. Population data are primarily sourced from the Hui’ning County Annals, the Hui’ning County Statistical Bulletin, the China County-Level Statistical Yearbook, and population census data from various periods. Among these, the 1970 and 1985 township-level population data were estimated using linear interpolation based on the population tables in the Hui’ning County Annals and data from the Third National Population Census (1982); The 2010 population data are derived from the Sixth National Population Census; the 2020 population data are derived from the Seventh National Population Census; and the 2025 population data are derived from the 2024 China County-Level Statistical Yearbook.
Cultural Resource Data. Data on cultural heritage sites are sourced from the lists of cultural heritage sites published in various batches by the Huining County Bureau of Culture, Sports, Radio, Television, and Tourism. Data on revolutionary cultural routes are sourced from the Chronicles of Huining County, the Compendium of Revolutionary Sites in Gansu Province, and survey materials on revolutionary tourism resources provided by the Huining County Bureau of Culture, Sports, Radio, Television, and Tourism. Data on ancient roads are sourced from historical records and ancient postal and trade routes marked on topographic maps.
Road network data. Road data for 1970 and 1985 were determined based on a combination of historical imagery and the Chronicle of Transportation in Huining County. Road data for 2010, 2020, and 2025 were sourced from OpenStreetMap road network data and basic road information provided by the Huining County Transportation Bureau. For each time period, travel speeds were matched to road data according to road classification (national highways, provincial highways, county roads, and township roads) and used to calculate traffic accessibility in the OD cost matrix analysis.
Data Standardization and Spatial Correction. Given the systematic differences among the five data sets in terms of source, accuracy, mapping scale, and minimum plot area, this study adopted the following standardization process: First, unification of the spatial reference frame. All raster and vector data were reprojected to the CGCS2000/3 Degree GK Zone 35 N coordinate system using the Project tool in ArcGIS 10.8 (ESRI, Redlands, CA, USA). Land use data and NDVI data from 1985 onward, originally in the WGS84 coordinate system, were transformed to CGCS2000 using the seven-parameter Boule model; the 1970 Lock Eye imagery underwent polynomial geometric correction using more than 20 uniformly distributed ground control points in the study area, with the correction error controlled within 1 pixel. Furthermore, spatial aggregation and the elimination of scale effects. The original patch resolution of the 2020 Third National Land Survey data is better than 1 m. To ensure comparability on a spatial scale with the 1970 (Keyhole imagery resolution of approximately 2–6 m), 1985, and 2010 data (Landsat 30 m, SPOT multispectral 10 m), and eliminate the scale effects of landscape pattern indices caused by differences in resolution, Spatial aggregation was performed on the fragmented land-use patches from the 2020 Third National Land Survey using a 150-m aggregation distance—that is, merging patches of the same type with a distance of less than 150 m between them, and uniformly setting the Minimum Mapping Unit (MMU) to 150 m × 150 m, discarding isolated fragments smaller than this threshold to eliminate the systematic interference on indicators such as the total number of patches (NP) caused by minute patches that “appear out of nowhere” in high-resolution imagery. This threshold was determined based on the accepted standard for the minimum plot area in historical image interpretation from existing studies and was finalized at 150 m following sensitivity testing. In addition, unit consolidation. The Third National Land Survey uses “village-level survey areas” as its basic statistical units. This study adopts these village-level survey areas as the baseline evaluation units and, through matching administrative division codes with names, uniformly consolidates historical data from various periods into this unit system. For changes in unit boundaries in historical data resulting from administrative adjustments, spatial mosaicking and attribute association were performed based on the Historical Records of Administrative Division Changes in Huining County. Fourth, missing data interpolation. The 1970 NDVI data (actually replaced with 1973 Landsat MSS imagery) and the 1985 township-level population data (calculated via linear interpolation based on the population statistics tables in the Hui’ning County Annals and data from the Third National Population Census) have both been annotated with data sources and interpolation methods in the corresponding indicator calculations to ensure data traceability.
2.4. Research Methods
2.4.1. Developing a Multidimensional Value Assessment System for Rural Areas
Rural value assessment is a scientific method for measuring and spatially representing the multifunctional roles of rural geographical systems. It translates abstract value concepts into quantifiable and spatially representable indicators. Existing research has categorized rural value assessment into multiple dimensions, such as production, ecology, and livelihood [10], but systematic assessments specifically targeting former revolutionary base areas remain insufficient. Drawing on relevant studies on rural value assessment, this study constructed a multidimensional rural value assessment indicator system for Huining County (Table 2), covering five dimensions—industry, ecology, society, culture, and governance—with 10 indicators.
Table 2.
Multidimensional Value Assessment Indicator System.
Since the units of the various indicators differ, they were normalized to dimensionless values in the range of 0–1 using min-max normalization to eliminate unit effects. Different calculation methods were applied to the various indicators: The C1 Industrial Activity Intensity Index uses the proportion of area occupied by settlements; the same methodology was applied across all five time periods to ensure the comparability of the time series. The C2 Industrial Activity Diversity Index was calculated on a phase-by-phase basis: for 1970, the coefficient of variation in settlement size was used, while for 1985 and later, the Shannon diversity index for land cover was used. The C3 Ecological Coverage Index was represented by the mean NDVI of administrative villages for each period; the C4 Ecological Structure Index was computed in stages: for 1970, vegetation coverage (FVC) was adopted as the proxy, while for 1985 onward, the proportion of ecological land (forest, grassland, and water bodies) was used. The C5 Transportation Accessibility Index was derived from the OD cost matrix, which calculates the shortest travel time from administrative villages to the nearest township center; C6, the Population Vitality Index, was measured by the population density of administrative villages. C7, the Value of Cultural Heritage Resources, was obtained by assigning scores according to heritage protection levels (10 for national-level, 5 for provincial-level, and 1 for county-level) and aggregating the scores; C8, the Value of Cultural Routes, was estimated via proximity analysis, which computes the distance-decay scores from administrative villages to the Red Army’s Long March routes and ancient roads. Both the performance of C9 (arable land protection) and the efficiency of C10 (control of construction land) were calculated in stages: for 1970 and 1985, the rate of change in arable land area and the intensity of construction land expansion from 1970 to 1985 were used, respectively; for 2010 and subsequent years, the rate of change in arable land area and the intensity of construction land expansion from the immediately preceding period were used, respectively. All indicators underwent reverse linear range standardization.
2.4.2. Entropy Weight Method (EWM)
The entropy weighting method is an objective weighting approach widely used in multi-indicator comprehensive evaluation systems. Its basic principle is to determine weights using the information entropy of each indicator across the samples: the smaller the information entropy, the greater the dispersion of that indicator and the more information it provides; therefore, it should be assigned a higher weight in the comprehensive evaluation [22]. Previous studies have combined the entropy weighting method with spatial autocorrelation techniques to examine regional disparities and the dynamic evolution of rural development levels [24]. The calculation procedure comprises four steps: data standardization, probability matrix construction, information entropy calculation, and weight determination. The score for each dimension is calculated as the weighted sum of the standardized indicator values and their corresponding weights within that dimension; the overall composite score is obtained by summing the scores across the five dimensions. In this study, using standardized data from 1535 observations collected over five time periods across 307 village-level survey units in Huining County, we calculated the indicator weights using the entropy weighting method.
2.4.3. Spatial Analysis Methods
This study employs three types of spatial analysis methods to reveal the spatial differentiation characteristics of rural comprehensive value.
Global spatial autocorrelation (Global Moran’s I) is used to test for significant spatial clustering of comprehensive values at the county level. Moran’s I ranges from [−1, 1]; when Moran’s I > 0, it indicates that attribute values exhibit positive spatial clustering (high-high or low-low clustering); when Moran’s I < 0, it indicates a spatially dispersed pattern (high–low or low–high alternating distribution); when Moran’s I = 0, it indicates that attribute values are randomly distributed in space. The formula for its calculation is:
Here, n represents the total number of village-level units (307); xi and xj are the comprehensive value scores for units i and j, respectively; is the mean; and wij is the spatial weight matrix (constructed using the Queen’s adjacency rule).
Based on this, the Getis-Ord Gi* statistic is further employed to conduct a hot-spot and cold-spot analysis, identifying clusters of significantly high (hot spots) and low (cold spots) comprehensive value in local spaces. The formula for the Getis-Ord Gi* local statistic is:
The results are recorded in the Gi_Bin field, which characterizes cold and hot spot types at different confidence levels: high-value clusters with a confidence level of 90% or higher are classified as hot spots, low-value clusters with a confidence level of 90% or higher are classified as cold spots, and the remainder are classified as non-significant areas.
Kernel density estimation is used to characterize the spatial clustering patterns of residential areas. Calculations are performed using the ArcGIS Kernel Density Analysis tool, with a search radius based on the default bandwidth automatically determined by the system according to Silverman’s rule of thumb. Kernel density estimation overlays a smoothed surface onto each residential area polygon, estimates density contribution values around each location using a kernel function, and generates a continuous spatial density surface, which can be used to visually illustrate the degree of spatial clustering in the distribution of residential areas.
2.4.4. Landscape Pattern Indices
Landscape pattern indices characterize the spatial morphology of rural settlements. This study selected four indicators: total number of patches (NP), patch density (PD), landscape shape index (LSI), and mean patch size (MPS).
- (1)
- Total Number of Patches (NP)
The total number of patches is a basic indicator reflecting the degree of landscape fragmentation. The calculation formula is:
where N is the total number of settlement patches within a given administrative village.
- (2)
- Patch Density (PD):
Patch density characterizes the number of patches per unit area. The calculation formula is:
where A is the total landscape area, expressed in units per 100 ha;
- (3)
- Landscape Shape Index (LSI):
The Landscape Shape Index measures the complexity of patch shapes and is calculated as follows:
- (4)
- Mean Patch Size (MPS)
Mean patch size reflects the average scale of settlement patches, and is calculated as follows:
where is the sum of the areas of all settlement patches, and N is the total number of patches; the unit is m2 per patch.
The four indicators above are calculated separately for each administrative village, whereupon county-wide values are recalculated by aggregating the total area and total perimeter of all settlements in the county [22].
3. Results
3.1. Revealing the Spatial Information Content of Weights for Multidimensional Value Indicators
Using standardized data from 1535 samples collected across 307 village-level survey units in Huining County over five time periods, this study used the entropy weighting method to determine the information entropy, information utility values, and weight coefficients for each indicator (Table 3). The weight values reflect the relative importance of each indicator in the multidimensional value assessment of rural areas; that is, the higher the weight, the greater the variation among samples for that indicator and the stronger its ability to distinguish comprehensive value [25].
Table 3.
Weights of Each Indicator Determined by the Entropy Weighting Method.
According to the results, the combined weight of indicators related to cultural value (C7: Value of Cultural Heritage Resources, weight 0.3296; C8: Bonus Value of Cultural Routes, weight = 0.0412) is 0.3708, the highest. Among these, the individual weight of C7 (Value of Cultural Heritage Resources) at 0.3296 is significantly higher than that of other indicators. Among the 307 village-level evaluation units, 197 units (64.0%) scored 0 for cultural heritage resources; only Huishi Town and a few villages with concentrated red cultural and ancient cultural resources received extremely high scores owing to the presence of nationally designated key cultural heritage sites. This extremely uneven spatial distribution manifests as high spatial variability in the entropy-weighted method, which is why this indicator was assigned the highest weight. This result indicates that cultural resources in the revolutionary base areas are highly clustered—high-value areas are primarily clustered in Huishi Town, Hepan Town, and a few scattered villages; however, the great majority of administrative villages have scores approaching zero on the cultural value dimension.
Indicators related to social value (C5: transportation accessibility, weight = 0.1420; C6: population vitality index, weight = 0.1509) have a combined weight of 0.2929, ranking second highest. The high degree of spatial heterogeneity in population vitality and transportation accessibility suggests that population concentration levels and transportation locational conditions constitute the core variables shaping the spatial heterogeneity of rural comprehensive value. The combined weight of governance-related indicators (C9: Arable Land Retention Level Index, weight = 0.0264; C10: Settlement Form Control Index, weight = 0.1200) is 0.1464. The relatively high weight of C10 indicates considerable spatial variation in settlement form control efficiency across administrative villages, demonstrating a moderate ability to distinguish comprehensive value. The lower weight of C9 suggests limited variation in arable land retention levels among these villages. Indicators related to industrial value (C1: Industrial Activity Intensity Index, weight = 0.0858; C2: Industrial Activity Diversity Index, weight = 0.0217) have a combined weight of 0.1075. The industrial activity intensity index exhibits high spatial variability, reflecting significant differences in the proportion of settlement area across villages; the low weight of the industrial activity diversity index indicates that variation in the Shannon diversity index of land cover among the sample villages is relatively limited. The combined weight of ecological value-related indicators (C3 Ecological Coverage Index, weight 0.0282; C4 Ecological Structure Index, weight 0.0541) is only 0.0823, the lowest weight. This indicates that during the study period, the spatial differentiation of the two ecological indicators—ecological coverage and ecological structure—across administrative villages is relatively low, and they have not yet become major factors influencing rural value differentiation. Within the ecological value, the C3 Ecological Coverage Index (NDVI) has a weight of only 0.0282. The relatively narrow value range results in high information entropy and low information utility, making it difficult to effectively distinguish the comprehensive development levels among villages. This is associated with Huining County’s location in the Loess Hilly and Gully Region, where overall vegetation coverage is relatively low, and NDVI differences among administrative villages are not prominent.
The above weight distribution reflects the dominant mechanisms driving the spatial differentiation of rural value in Huining County. Cultural and social values are the primary dimensions shaping the spatial differentiation of comprehensive value, with cultural heritage resources being particularly prominent; transportation accessibility and population vitality also exhibit high discriminatory power. Among governance values, settlement form control plays a certain role in differentiation, whereas arable land retention has relatively weak discriminatory power. Industrial and ecological values contribute relatively little to the spatial differentiation of comprehensive value. Overall, the spatial polarization of cultural resources and the spatial differentiation of population vitality jointly shape the spatial pattern of comprehensive value, while ecological and industrial indicators exhibit relatively insufficient discriminatory power. The high spatial concentration of revolutionary cultural resources serves not only as a developmental advantage but also as the institutional root cause of spatial imbalance [17].
To test the robustness of the above weighting results, this study conducted two sensitivity analyses: period-specific entropy weighting and after excluding C7. The results of the period-specific entropy weighting showed that the weight of C7 (cultural heritage resource value) fluctuated considerably across the five periods, with a maximum deviation of 0.3296; the maximum deviation for C5 (transportation accessibility) was 0.2045; the maximum deviations for the remaining indicators were all less than 0.1, with the maximum deviations for C8 (cultural route value), C9 (arable land retention level index), and C3 (ecological coverage index) all being less than 0.05. After recalculating the results by excluding C7, the Spearman correlation coefficient for the comprehensive score rankings was 0.815; the Spearman correlation coefficient for the rankings under period-specific weights versus global weights was 0.909. Both tests indicate that, although the weight of C7 fluctuated considerably across different periods, the spatial pattern of the comprehensive value remains largely stable, and the core conclusions remain robust.
3.2. Temporal Evolutionary Characteristics of the Multidimensional Value of Rural Areas
3.2.1. Stages and Growth Trajectories of Comprehensive Value
Between 1970 and 2025, Huining County’s comprehensive rural score rose steadily from 0.074 to 0.174, an increase of 134.4% (Table 4, Figure 5), indicating a significant improvement in overall rural development over the study period. However, this growth did not proceed at a uniform pace; rather, it followed a three-stage trajectory corresponding to the phases of institutional change.
Table 4.
Multidimensional Value Scores for Huining County (1970–2025).
Figure 5.
Trends in Multidimensional Value Evolution, 1970–2025.
Phase I (1970–1985): The composite score rose from 0.074 to 0.115, with an average annual growth rate of approximately 2.9 percent—the slowest growth rate. This phase coincided with a critical period in China’s rural transition from the People’s Commune system to the Household Contract Responsibility System. In the late stage of the People’s Commune system, collectivized management and the unified purchasing and marketing system imposed rigid constraints on rural production incentives, thereby limiting rural development opportunities [15]. After the mid-1970s, some rural policies were relaxed, commune and brigade enterprises emerged, and the rural economy began to recover. In the early 1980s, the household contract responsibility system was gradually implemented. As farmers gained operational autonomy, production incentives were rapidly released, and rural value increased significantly in a relatively short period. Ecological value rose from 0.0195 to 0.0454, serving as the primary source of growth in the first stage, which is related to the ecological accumulation from basic farmland construction and sporadic afforestation activities on the Loess Plateau. Phase II (1985–2010): The score rose from 0.115 to 0.142, with an average annual growth rate of approximately 0.9%, the growth rate has slowed somewhat. The implementation of the household contract responsibility system broke the resource allocation model of the planned economy, unleashing rural productive forces, and the process of marketization drove the initial accumulation of rural value [15]; at the same time, the rollout of pilot programs for converting farmland to forests and the launch of “red tourism” planning provided a policy window for the realization of rural value in Huining County [17]. Phase III (2010–2025): The score increased from 0.142 to 0.174, with an average annual growth rate of approximately 1.4%, indicating that the growth rate has stabilized. The consolidation of achievements from the “Grain-for-Green” program, the deepening of revolutionary tourism development, and the combined advancement of policies such as poverty alleviation and rural revitalization have propelled rural development into a phase of quality and efficiency improvement, with the driving force for growth shifting from institutional reforms to the deepening of policy implementation [16,17].
The phases of the composite score correspond to the three major institutional transformations in China’s rural reform—namely, the People’s Communes, the household contract responsibility system, and the rural revitalization initiative—indicating that the growth in rural comprehensive value is essentially a response to institutional change rather than merely the accumulation of economic growth [15].
3.2.2. The Pattern of Differentiation in Five-Dimensional Value
The five dimensions display considerable divergence in their growth trajectories, with each trajectory corresponding to a unique combination of driving factors.
Cultural value rose from 0.0213 to 0.0476, representing a 123.5% increase. This growth was primarily driven by two forces: first, the ongoing designation and upgrading of cultural heritage sites at all levels, which has led to the continuous spatial accumulation of cultural heritage resources; second, the rapid development of revolutionary tourism. Existing research indicates that the density of business formats in revolutionary tourism destinations exhibits characteristics of both quantitative expansion and agglomeration during their spatiotemporal evolution [17]. Before 2010, cultural value grew steadily (0.0213 → 0.0293), while the growth rate accelerated significantly after 2010 (0.0293 → 0.0476), reflecting a transition in red cultural resources from stock accumulation to value appreciation.
Ecological value rose from 0.0195 to 0.0560, an increase of 186.7 percent, reflecting a steady upward trend. This trajectory closely aligns with the ongoing implementation of the “Conversion of Farmland to Forests and Grasslands” policy on the Loess Plateau since 1999. Previous studies have shown that vegetation coverage on the Loess Plateau has generally increased following the conversion of farmland to forests and grasslands [26]. The steady growth in ecological value indicates that investments in national ecological projects have long-term, cumulative policy effects, and that these effects manifest as comprehensive, inclusive improvements across the entire administrative village—rather than being concentrated in a few specific areas.
Social value rose from 0.0060 to 0.0255, an increase of 323.5 percent; although it started from the lowest base, it showed the fastest growth rate. This growth was primarily driven by transportation infrastructure improvements, road network expansion, and population agglomeration in central towns. Before 2010, social value remained low for an extended period (0.0060 → 0.0079), but the growth rate accelerated after 2010 (0.0079 → 0.0255). This reflects the lag effect of infrastructure development and policies aimed at equalizing public services, indicating that institutional investments often take a relatively long time to translate into tangible improvements in social value [15]. However, the absolute score for social value remains low, which is closely linked to the ongoing population outflow from Huining County, where the permanent resident population decreased from 541,300 in 2010 to 400,200 in 2025. The persistent net population outflow has weakened rural social vitality and constrained further improvements in social value [27].
The governance value rose from 0.0171 to 0.0310, an increase of 81.6 percent, reflecting steady growth. The two indicators—arable land protection and control of land for construction—showed relatively small changes during the study period, indicating that improvements in grassroots governance capacity are gradual in nature; that is, it takes a longer period of time for the results of institutional development to translate into a significant improvement in governance performance.
Industrial value rose from 0.0105 in 1970 to 0.0185 in 1985, then fell steadily to 0.0144 in 2025, showing a rise-then-fall pattern. The low industrial value in 1970 was attributed to the small proportion of residential areas and the homogeneous land use structure at that time. Non-agricultural activities lacked spatial carriers, with cropland dominating the land cover, and industrial diversity remained limited. It peaked in 1985, driven by the active rural economy and increased non-agricultural land following the implementation of the household contract responsibility system. The expansion of residential areas and the diversification of land use types jointly drove this increase. After 1985, industrial value declined mildly. The significance of this decline lies not in its sharp magnitude, but in its long-term nature. Spatial expansion failed to bring about synchronous industrial upgrading, reflecting the deep-seated constraints faced by traditional agricultural counties in their industrial structural transformation. Non-agricultural industries were underdeveloped, agricultural added value remained limited, and new growth drivers failed to provide effective support [28]. The gradual decline in industrial value reveals a deeper structural issue: industrial system evolution lags behind the pace of spatial morphological change. The increment generated by spatial expansion failed to transform into sustained momentum for industrial upgrading. Instead, without effective market mechanisms to absorb it, this increment was gradually depleted, resulting in a slow, endogenous structural recession.
The pattern of divergence across the five dimensions reveals a deep-seated contradiction: growth in the four dimensions—culture, ecology, society, and governance—is highly dependent on external institutional support (cultural heritage designation, ecological projects, infrastructure investment, and policy implementation at the local level), while the industrial dimension—the only one requiring endogenous growth momentum—remains persistently sluggish. This implies that while external institutional support can effectively enhance livability and tourism appeal, it cannot replace the self-sustaining industrial capacity required for business viability. Whereas spatial restructuring can be policy-driven, industrial upgrading must rely on market development, suggesting a time lag and a mechanistic discrepancy between the two.
3.3. Spatial Patterns of Spatial Differentiation in the Comprehensive Value of Rural Areas
3.3.1. Global Spatial Autocorrelation: Phased Evolution of Aggregation Intensity
The global Moran’s I analysis (Table 5) yields positive Moran’s I values across all years, with all p-values below 0.05. This indicates a significant positive spatial correlation in the comprehensive village values across all five periods in Huining County: high-value villages were consistently adjacent to high-value counterparts, and low-value villages to low-value ones (Figure 6).
Table 5.
Comparison of Global Spatial Autocorrelation (Moran’s I) Results for Composite Value.
Figure 6.
Line Chart Comparing Moran’s I for the Three Scenarios.
The global Moran’s I index fell from 0.268 in 1970 to 0.084 in 1985, then rose to 0.292 in 2010, before declining again to 0.184 in 2020 and 0.202 in 2025, exhibiting a nonlinear pattern of “decline—recovery—fluctuation at low levels.” This trajectory is consistent with the findings of Zhong Yang et al. regarding the significant spatial dependence of high-quality development in former revolutionary base areas [16]; however, by shifting the unit of analysis from the county level to administrative villages, this study further reveals the institutional origins of the intensity of this spatial dependence.
The high value recorded in 1970 reflects the rigid allocation of resources by administrative authorities under the People’s Commune system, in which resources were highly concentrated in county seats and administrative centers, forming a typical “center-periphery” spatial structure. The sharp decline in 1985 coincided with the implementation of the Household Contract Responsibility System, which reformed the resource allocation model under the planned economy, unleashed rural productive forces across the board, and significantly weakened the existing spatial polarization pattern. The rebound in 2010 stemmed from the “Conversion of Farmland to Forests” initiative, including the development of red tourism and urbanization, which reshaped growth poles across different regions. The slight decline after 2020 signals the diffusion of policy resources under the Rural Revitalization Initiative to peripheral townships; that is, the expansion of policy coverage has somewhat diluted the intensity of spatial agglomeration.
Nonlinear fluctuations in spatial agglomeration intensity indicate that breaking down the old pattern can be accomplished in a relatively short period of time (only 15 years, from 1970 to 1985), but establishing a new spatial order requires a longer cycle (it took 25 years, from 1985 to 2010, to achieve a significant recovery). The impact of institutional reform on spatial patterns is nonlinear: institutional reforms trigger a “de-polarization” effect, while new growth poles form only through the combined effects of policy measures and the accumulation of production factors (Figure 7).
Figure 7.
Comprehensive Value Spatial Distribution Map (Phase 5). (a) Spatial Distribution Map of Comprehensive Value, 1970; (b) Spatial Distribution Map of Comprehensive Value, 1985; (c) Spatial Distribution Map of Comprehensive Value, 2010; (d) Spatial Distribution Map of Comprehensive Value, 2020; (e) Spatial Distribution Map of Comprehensive Value, 2025.
3.3.2. Spatiotemporal Changes in the Cold-Hot Spot Pattern and the Dissipation of Polarization
The Getis-Ord Gi* analysis further identifies the specific spatial locations and evolution trends of clusters with high composite values (hotspots) and clusters with low composite values (coldspots) (Table 6, Figure 8).
Table 6.
Statistics on Hot and Cold Spots in Comprehensive Value (Comparison of Three Scenarios).
Figure 8.
Evolution of Comprehensive Value Hotspots and Coldspots (Phase 5). If there are multiple panels, they should be listed as: (a) Evolution of Composite Value Hotspots and Coldspots in 1970; (b) Evolution of Composite Value Hotspots and Coldspots in 1985; (c) Evolution of Composite Value Hotspots and Coldspots in 2010; (d) Evolution of Composite Value Hotspots and Coldspots in 2020; (e) Evolution of Composite Value Hotspots and Coldspots in 2025.
- (1)
- The spatial clustering of hotspot villages follows an objective pattern of transition from single-core polarization to a point-axis network structure along major transportation corridors. In 1970, due to the rigid constraints of the People’s Commune system, hotspot villages were scattered in isolated pockets; by 1985, the revival of commerce and trade spurred the rise in northern townships such as Guochengyi and Heban, shifting the focus of hotspot villages northward; In 2010, the combined effects of the “Conversion of Farmland to Forests” program and “Red Tourism” propelled villages along the Zuli River basin to emerge as new hotspots; by 2025, the number of hotspot villages had increased to 34, forming a networked, radiating pattern along National Highway G247 and the G22 Qinglan Expressway. The spatiotemporal convergence of infrastructure development and policy resources underlies spatial polarization in the revolutionary base areas.
- (2)
- The spatial contraction of cold-spot villages exhibits phased fluctuations, and low-value clusters show a tendency toward spatial lock-in within specific functional units. The total number of cold-spot villages decreased from 19 in 1970 to 4 in 2025, yet experienced considerable nonlinear fluctuations during this period: the number rebounded to 11 in 2010, revealing the marginalization of peripheral villages amid accelerated urbanization; After 2019, the number stabilized between 4 and 9, but remained largely anchored to water conservancy facility units and a few state-owned forest farms. This indicates that certain peripheral areas have become structurally marginalized within the county’s functional division of labor, further exacerbating spatial heterogeneity.
- (3)
- Sensitivity analyses across multiple scenarios indicate that the spatial polarization pattern exhibits high sensitivity to cultural heritage resources, yet its evolutionary trend remains robust. After excluding C7, the number of cold-spot villages surged to 30 in 2020, revealing the vulnerability of rural areas in old revolutionary base areas, where comprehensive value depends heavily on policy support for cultural heritage. Without this core variable, most villages’ endogenous development foundations would be insufficient to drive their transition out of the low-value range. The evolution trajectories under period-specific weighting schemes closely align with those under global weighting, confirming the strong path dependence of the spatial pattern on institutional supply.
- (4)
- The reverse succession of hotspots and cold spots reveals the limitations of spatial policy interventions, with value enhancement exhibiting non-equilibrium characteristics of sporadic breakthroughs and widespread lag (Figure 9). Although hotspot villages expand and cold spot villages contract simultaneously, the proportion of non-significant villages has consistently remained above 85%. This indicates that policy resources are heavily concentrated in a limited number of nodes with red resources or locational advantages, failing to generate effective spatial spillover effects for surrounding ordinary villages. This bias toward key nodes has left most villages constrained by insufficient factor mobility and a lack of resource empowerment, making it difficult for them to cross the development threshold; spatial imbalance has thus become the core bottleneck constraining the comprehensive revitalization of the old revolutionary base areas.Figure 9. Value Heat Maps by Period and Dimension (Top 30 Administrative Villages).
3.4. The Orderly Evolution of the Spatial Form of Human Settlements
This study selected four indicators, total number of patches (NP), patch density (PD), landscape shape index (LSI), and mean patch size (MPS), to reflect the evolutionary characteristics of rural settlement landscape patterns from 1970 to 2025 (Table 7, Figure 10).
Table 7.
Landscape Pattern Index for Rural Settlements (1970–2025).
Figure 10.
Evolution of the Landscape Pattern Index for Human Settlements, 1970–2025. (a) Sectional line chart (county-wide trend); (b) Box-and-whisker plot (distribution of administrative villages). Red dots represent outliers.
The concurrent changes in NP and LSI reflect the morphological evolution of settlement patterns in Huining County, which have transitioned from compact concentration to disorderly expansion, and subsequently to orderly contraction. The NP followed an inverted U-shaped trend: 6230 → 5804 → 7258 → 10,541 → 6878, corresponding to three phases: “spatial integration—disorderly expansion—restructuring and contraction.” Phase I (1970–1985): NP decreased from 6230 to 5804 (−6.8%), and LSI decreased from 101.28 to 97.40, reflecting the relatively concentrated and well-defined spatial order of settlements under the People’s Commune system. Second Phase (1985–2020): NP rose from 5804 to 10,541 (+81.6%), and LSI rose from 97.40 to 128.85. As a result of the liberation of farmers’ autonomous management rights following the implementation of the household-based contract responsibility system, the practice of building new structures without demolishing old ones has led to the spontaneous expansion and sprawl of residential areas. Phase III (2020–2025): The number of settlements (NP) decreased from 10,541 to 6878 (−34.8%), and the LSI decreased from 128.85 to 107.56, reflecting the concentrated efforts of spatial rectification policies since the implementation of the Rural Revitalization Strategy.
The decline in NP in Huining County after 2020 (−34.8%) stands in stark contrast to the national trend of a continuous increase in the number of rural settlement patches from 2000 to 2020, as reported by Wu Li et al. [22]. The decline in the number of settlement patches after 2020 contrasts with the nationwide trend of continuous growth in rural settlement patches. As a national key county for rural revitalization, Huining County has seen concentrated efforts in spatial remediation under preferential policies, resulting in a pace of spatial remediation that exceeds the national average. This study further establishes a chronological correspondence between the phased evolution of settlement spatial forms—“spatial integration—disorderly expansion—remediation and contraction”—and specific policy phases, revealing the role of institutional change in shaping rural spatial forms.
The MPS increased from 15,735 m2 in 1970 to 27,425 m2 in 1985 (+74.3%), reflecting the large-scale rural construction activities during the early stages of reform and opening-up. Subsequently, the MPS gradually declined, falling to 17,498 m2 in 2020 (the lowest among the five phases), primarily due to the higher accuracy of the data from the Third National Land Survey. Based on remote sensing imagery with a resolution better than 1 m, the Third National Land Survey identified small land patches that were not visible in previous datasets, resulting in a significant increase in the number of patches and a systematic underestimation of the average area. Although the accuracy discrepancy was partially mitigated after 150-m aggregation, the NP and MPS for 2020 still deviated systematically from the long-term trend. By 2025, the MPS rebounded to 27,228 m2, approaching the 1985 level, reflecting the ongoing consolidation of residential plot fragments and the remediation of abandoned villages.
Concurrent changes in NP and LSI indicate that rural spatial morphology in Huining County shifted from natural dispersion to human-induced disorder, and then to orderly governance. Under policy intervention, the patch structure of rural physical space has become increasingly regular, while the long-term evolutionary patterns remain robust under sensitivity analysis.”
3.5. Spatial Zoning for Rural Revitalization Based on Multidimensional Value Assessment
Grounded in multidimensional value assessment, hot-cold spot evolution, and settlement spatial pattern analysis, this study utilizes quantitative thresholds to categorize the 307 village-level units in Huining County into five revitalization types (Figure 9). The classification thresholds are derived from the data’s own quantile distribution and statistical tests: the 20th and 25th quantiles correspond to the current low-value threshold and the slow-growth threshold for comprehensive value, respectively; the 75th quantile corresponds to the threshold for ecological advantages; and 5 km represents a reasonable radius of influence for urban-rural integration at the county level.
The specific zoning results are as follows:
- (1)
- Red Culture Core Zone (25 villages). This zone comprises villages designated as “hotspot villages” for 2025, or those expected to be designated as such for at least three consecutive periods, and located more than 5 km from the county seat.
- (2)
- Urban-Rural Integration Development Zone (11 villages). This zone comprises villages designated as “hotspot villages” for 2025 and located within 5 km of the county seat. Primarily situated around the county seat, these villages serve as hubs for urban function spillover and red tourism services.
- (3)
- Ecological Conservation Zone (54 villages). Villages in this zone are characterized by a county-level ecological value no lower than the 75th percentile, a comprehensive value no lower than the 20th percentile, a trend slope of no less than 0, and a non-hotspot classification.
- (4)
- Modern Agriculture Zone (178 villages). This zone comprises the remaining agricultural villages not included in the aforementioned zones.
- (5)
- Peripheral Decline Zone (39 villages). This zone comprises villages identified as “cold spots” in 2025, or villages with a comprehensive value below the county’s 20th percentile and a trend slope below the 25th percentile across all five phases.
Spatially, the five zones form a core-periphery pattern centered on Huishi Town, extending outward along major transportation corridors and underpinned by extensive modern agricultural zones (Figure 11). Spatial overlay analysis indicates that the Red Culture Core Zone spatially coincides with the Red Army’s Long March route through Huining, jointly forming an interwoven node-corridor network.
Figure 11.
Rural Revitalization Zoning Map.
4. Discussion
This study corroborates, complements, and contrasts with existing literature across three dimensions: spatial differentiation, institutional evolution, and international experience. It not only responds to the macro-level arguments of Zhong Yang et al. [16] and Wu Li et al. [22] regarding the spatial dependence of China’s revolutionary base areas and the nationwide expansion of settlements, but also reveals, through micro-level empirical analysis of Huining, the path dependence of China’s revolutionary base areas within their specific institutional context, differing from the endogenous development pathways often observed in the West.
4.1. Industrial Costs Under Protective Restrictions and the Implicit Spatial Contributions of Established Areas
This study quantitatively analyzes the evolution of multidimensional rural values in Huin Previous studies on the evolution of rural value in revolutionary base areas have largely concentrated on evaluating policy effects [16,17]. This study advances the analysis to the underlying mechanisms. The coexistence of rising comprehensive value and sluggish endogenous industrial momentum in the Huining Revolutionary Base Area essentially stems from a mechanism mismatch between external institutional provision and the development of endogenous markets. Applying Marx’s labor theory of value, these revolutionary base areas undertook extensive historical labor during the revolutionary era and currently assume arduous obligations for ecological governance and arable land conservation. This labor generates substantial social value but resists proper market pricing, preventing its conversion into local economic returns. Coupled with this, strict regulatory red lines for arable land and cultural heritage have greatly constrained the spatial capacity for non-agricultural industries. While these areas have shouldered national responsibilities for food security and cultural heritage preservation, they have forgone opportunities for local industrialization and urbanization without adequate compensation. This finding aligns with Cheng Jia et al. [5] on rural functional trade-offs in the Dabie Mountains, while further extending the analysis to the political-economic dimension of underpriced externalities. This mechanism applies to similar revolutionary base areas characterized by ecological fragility, a wealth of “red” resources, strict regulations, and weak industrial bases. Future planning should prioritize establishing value-conversion and compensation mechanisms to address market failures and mitigate spatial inequities in these areas.
4.2. System-Driven Spatial Evolution of Settlements and Path Dependence in the Huining Revolutionary Base Areas
The spatial morphology of settlements in the Huining old revolutionary base area has transitioned from long-term dispersed expansion to orderly contraction, with a particularly notable decline in the number of patches after 2020. Although this decline was technically influenced by high-resolution data identifying minute patches, it was primarily driven by the substantive implementation of spatial consolidation policies under the Rural Revitalization Strategy, not merely a technical effect. Historically, every shift in spatial morphology has been an objective response to major institutional adjustments: from relative concentration under the early collectivization system, to spontaneous sprawl following the household contract responsibility system, and then to consolidation and contraction during the poverty alleviation and rural revitalization stages. As an old revolutionary base area and a national key assisted county, Huining’s spatial evolution relies heavily on top-down policy drivers, with the combined effect of red cultural protection and spatial governance accelerating the transformation of spatial morphology. Nationally, this finding contrasts with the macro-level conclusions of Wu Li et al. [22] regarding the continuous expansion of rural settlements, highlighting the intensity of policy intervention in old revolutionary base areas. Compared with the endogenous development path advocated by the EU LEADER program, the spatial evolution of the Huining old revolutionary base area features stronger policy intervention and path dependence, constituting an objective difference in spatial governance within a specific institutional context. This policy-driven spatial evolution features strong path dependence, indicating that in regions with strong protective institutional constraints, spatial morphology can respond rapidly to institutional intervention. However, spatial planning must fully respect this historical inertia to seek a long-term balance between institutional intervention and spontaneous spatial evolution.
4.3. Planning Response Strategies Based on Value Zoning
Multidimensional value assessments reveal that the Huining Revolutionary Base Area possesses high cultural and ecological values, yet its endogenous industrial momentum remains persistently weak. This structural characteristic implies that planning responses cannot simply replicate the industrial models of typical rural areas; instead, they must shift toward a synergistic approach that balances conservation and development. Compared to the macro-level pathway proposed by Tan Lin and Long Hualou [2], which emphasizes land-use transformation driving value enhancement, this study further examines the micro-level mechanisms of spatial organization. While traditional spatial remediation can rapidly alter physical forms through baseline controls, it struggles to address value transformation challenges arising from market failures. Spatial overlay analysis confirms that the core red culture area aligns closely with the Long March route, providing a spatially explicit planning approach: leveraging the Long March route to connect scattered, high-value nodes across villages and towns, enabling shared infrastructure and tourist markets, thereby reducing the costs of independent development for individual villages. In essence, given limited industrial space, this approach transforms cultural advantages into economic benefits through resource integration. While this planning approach, empirically grounded in Huining, offers a practical path to address structural imbalances in such revolutionary base areas, its broader application requires specific prerequisites. Resource integration and value transformation based on the Long March route can only be effective when a region faces strict constraints on both arable land and cultural heritage protection, alongside limited space for industrial development.
4.4. Data Limitations and Methodological Reflections on Long-Time-Series Spatial Econometrics
Due to limitations in the availability of long-time-series data, this study faces certain methodological constraints. First, the lack of microeconomic panel data necessitated the use of spatial proxy indicators to measure industrial and governance dimensions, which limited the precise depiction of the actual economic structure and the nature of grassroots governance. Second, although aggregation and minimum mapping unit thresholds partially mitigated the cross-resolution scale effects of multi-source remote sensing imagery, residual systematic biases persist. Finally, the static weighting assumption of the entropy method struggles to capture the dynamic evolution of policy orientations. Although sensitivity tests confirm that the bias resulting from excessively high weights for specific indicators does not overturn the core conclusions, future research should introduce dynamic weighting models and authentic panel data to further enhance the accuracy of explanations regarding long-term mechanisms.
5. Conclusions
Addressing the evolutionary patterns of multidimensional rural values, the response characteristics of spatial forms, and appropriate planning pathways under long-term institutional change, this study draws the following core conclusions based on 55 years of empirical data from Huining County:
- (1)
- It reveals the mechanisms of external dependence and endogenous lag in the evolution of rural values under protective constraints. The improvement of ecological and cultural values relies heavily on external institutional support but has not been synchronously into endogenous industrial momentum. Based on Marx’s labor theory of value, the spatial asymmetry between the burden of protective labor costs and the return of benefits is the fundamental cause of insufficient endogenous industrial momentum. The core bottleneck in revitalizing old revolutionary base areas lies in establishing a compensation mechanism that converts protection costs into economic benefits.
- (2)
- It confirms that the spatial evolution of these historic revolutionary base areas is characterized by strong institutional intervention and path dependence. Settlement pattern evolution does not follow the typical pattern of spontaneous urban sprawl; instead, it exhibits cyclical expansion and contraction corresponding to macro-level institutional adjustments. Top-down institutional intervention, rather than spontaneous reorganization by market forces, primarily shapes the ordering of physical space.
- (3)
- A spatial collaboration model for these historic regions, based on linear cultural heritage corridors, has been developed. Addressing the reality of limited industrial space, this model leverages the Long March route to connect dispersed, high-value nodes, transcends administrative boundaries between villages and towns, and achieves cross-regional integration of cultural resources through the sharing of infrastructure and tourist markets. This model provides a spatial governance paradigm for similar historic regions that does not rely on large-scale industrialization.
- (4)
- The plan outlines practical pathways for aligning with the United Nations Sustainable Development Goals (SDGs). Synergistic efforts across four dimensions—cultural heritage and rural development (SDG 11), the effectiveness of grassroots governance (SDG 16), ecological security barriers (SDG 15), and the flow of urban-rural factors and spatial justice (SDG 10)—ultimately lead to the transformation of industries toward green, high-value-added sectors (SDG 8), providing a practical reference from China’s revolutionary base areas for the multidimensional coordinated development of similar underdeveloped regions worldwide.
- (5)
- Research Outlook: Moving Toward a New Paradigm of Mechanism Unraveling and Causal Inference. Current research is constrained by the lack of long-time-series microeconomic panel data and the scale effects of multi-resolution remote sensing imagery; consequently, spatial proxy indicators have been used to measure the industrial and governance dimensions. Future research must achieve three major breakthroughs: first, a methodological breakthrough by introducing causal inference and dynamic weighting models to isolate the net effects of policy interventions and resolve endogeneity issues in long-term spatiometrics; second, a data-scale breakthrough by integrating multi-source big data—such as mobile phone signaling and micro-enterprise registration records—with village-level economic census data to reconstruct the actual socioeconomic structure, delving from macro-level physical patterns to micro-level agent behavior and spatial interaction mechanisms; third, a leap in practical validation by establishing a long-term tracking and evaluation mechanism (Post-Occupancy Evaluation) for planning implementation to verify the dynamic performance of spatial strategies over extended time periods. Through these extensions, it is expected that the trade-offs between the preservation and development of revolutionary base areas can be incorporated into the theoretical framework of the human-land relationship regional system, providing a more robust scientific basis for the sustainable transformation of underdeveloped regions worldwide.
Author Contributions
Conceptualization, X.X.; Methodology, X.X. and J.Z.; Software, J.Z.; Validation, X.X.; Formal analysis, J.Z.; Investigation, J.Z.; Resources, X.X.; Data curation, J.Z.; Writing—original draft, X.X. and J.Z.; Visualization, J.Z.; Supervision, X.X.; Project administration, X.X. All authors have read and agreed to the published version of the manuscript.
Funding
This research received no external funding.
Institutional Review Board Statement
Not applicable.
Informed Consent Statement
Not applicable.
Data Availability Statement
The data presented in this study are available on request from the corresponding author. The data are not publicly available due to geospatial data security regulations and local government data sharing policies.
Conflicts of Interest
The authors declare no conflict of interest.
References
- Liu, Y.; Li, X.; Su, S.; Guo, Y. Ecological industrialization and rural revitalization for global sustainable development. Geogr. Sustain. 2025, 6, 100307. [Google Scholar] [CrossRef] [Scilit]
- Tan, L.; Long, H.L. Mechanism of Enhancing Rural Territorial Space Value Driven by Land Use Transitions. China Land Sci. 2025, 39, 20–30. [Google Scholar]
- Yang, X.H.; Chen, D.Q.; Sun, J.L. Exploring the Path of Rural Characteristic Development in Southern Jiangsu Based on the Re-Cognition of Rural Values. Planners 2023, 39, 138–145. [Google Scholar]
- Tang, L.N.; Yang, M.W.; Liu, Y.; Zhou, P. Classification, Evolutionary Trends and Research Prospects of Rural Multifunctionality in Metropolitan Suburbs. Trop. Geogr. 2024, 44, 68–78. [Google Scholar] [CrossRef]
- Cheng, J.; Fang, S.M. Spatiotemporal Evolution and Coupling Coordination of Rural Territorial Multifunctions in the Dabie Mountains. J. Mt. Sci. 2024, 42, 496–506. [Google Scholar] [CrossRef]
- Feng, Z.J. Red Cultural Resources Empowering Rural Revitalization in Revolutionary Base Areas: Value Implications, Target Directions, and Practical Pathways. J. Northwest A&F Univ. (Soc. Sci. Ed.) 2026, 26, 73–82. [Google Scholar] [CrossRef]
- Fu, X.; Huang, Y.M. Spatial Pattern and Influencing Factors of High-Quality Development in China’s Revolutionary Base Areas from the Perspective of Principal Functions. Arid Land Geogr. 2025, 48, 517–527. [Google Scholar] [CrossRef]
- Holmes, J. Impulses towards a multifunctional transition in rural Australia: Gaps in the research agenda. J. Rural Stud. 2006, 22, 142–160. [Google Scholar] [CrossRef] [Scilit]
- Yu, S.Q.; Wu, Y.C.; An, Y.; Zhang, L. Constructing an Analytical Framework and Exploring Implementation Pathways for Rural Multidimensional Values under the Background of Rural Revitalization. Issues Agric. Econ. 2026, 3, 49–68. [Google Scholar] [CrossRef]
- Qu, R.F.; Wu, Y.C.; Chen, J.; Chen, X.; Zhang, L.; Wei, W. Progress and Prospects of Rural Value Theory and Methodology Research. Chin. J. Agric. Resour. Reg. Plan. 2022, 43, 139–149. [Google Scholar]
- Mao, J.H. Improvement of the Construction Method of Rural Revitalization Evaluation Index System and Its Empirical Study. J. Lanzhou Univ. (Soc. Sci.) 2021, 49, 47–58. [Google Scholar] [CrossRef]
- Ma, L.B.; Li, H.; Dou, H.J.; Bai, J.; Fang, F. Spatial Differentiation Characteristics and Influencing Factors of Rural Life Quality at the County Level in Gansu Province. J. Ecol. Rural Environ. 2020, 36, 1251–1259. [Google Scholar] [CrossRef]
- Lu, Y.T.; Tian, Y.S.; Qian, W.X.; Chen, J.L.; Shi, H.W. Synergistic Optimization of Ecosystem Services in Traditional Villages from the Perspective of Actor-Network Theory. Archit. Cult. 2025, 6, 73–76. [Google Scholar] [CrossRef]
- Liu, Y.; Gao, Y.B.; Pan, Y.C.; Tang, L.N.; Tu, M.G. Spatial Differentiation Characteristics and Trade-off/Synergy Relationships of Rural Multi-functions Based on Multi-source Data. Geogr. Res. 2021, 40, 2036–2050. [Google Scholar] [CrossRef]
- Liu, Y.S.; Long, H.L.; Li, Y.R. New Understanding of Global Urban-Rural Relations and Human Geography Research. Acta Geogr. Sin. 2021, 76, 2869–2884. [Google Scholar] [CrossRef]
- Zhong, Y.; Wu, Z.P.; Zhou, G.H.; Zhou, M. Spatiotemporal Evolution and Driving Factors of High-Quality Development in China’s Revolutionary Base Areas. Econ. Geogr. 2026, 46, 237–247. [Google Scholar] [CrossRef]
- Xu, C.X.; Wang, Y.Y.; Mo, Z.C. Spatiotemporal Evolution of Business Formats in Red Tourism Destinations: A Case Study of Jinggangshan City. Geogr. Res. 2025, 44, 2014–2031. [Google Scholar] [CrossRef]
- Ding, Z.W.; Bian, H.Y.; Wang, J. Differentiation and Influencing Factors of the Real-Virtual Comprehensive Development Level of Red Scenic Areas in the Dabie Mountains. Econ. Geogr. 2025, 45, 181–190. [Google Scholar] [CrossRef]
- Chen, W.X.; Duan, B.Q.; Bian, J.J.; Zeng, J. Decoding the formation mechanisms of rural settlements expansion patterns in transitional China. Land Use Policy 2025, 154, 107561. [Google Scholar] [CrossRef] [Scilit]
- Zhou, Y.J.; Zhang, J.P.; Liu, G.; Song, K.S.; Zhu, B.X.; Li, S.J.; Shao, S.D.; Li, Y.; Han, B.Q. The paradox of rural depopulation and built-up growth: Insights from two decades of settlement change in China (2000–2020). Land Use Policy 2026, 167, 108048. [Google Scholar] [CrossRef] [Scilit]
- Duan, B.Q.; Chen, W.X.; Zeng, J. Analysis of Landscape Fragmentation of Rural Settlements in China and Its Influencing Factors. J. Agric. Resour. Environ. 2025, 42, 237–248. [Google Scholar] [CrossRef]
- Wu, L.; Liang, H.; Huo, R.M.; Chen, Z. Spatiotemporal Characteristics and Driving Mechanisms of Landscape Pattern Evolution of Rural Settlements. China Land Sci. 2025, 39, 54–66. [Google Scholar]
- Yang, J.; Huang, X. The 30 m annual land cover dataset and its dynamics in China from 1990 to 2019. Earth Syst. Sci. Data 2021, 13, 3907–3925. [Google Scholar] [CrossRef] [Scilit]
- Xu, X.; Wang, Y.Y. Measurement, Regional Difference Decomposition and Dynamic Evolution of China‘s Rural Revitalization Level. J. Quant. Tech. Econ. 2022, 39, 64–83. [Google Scholar] [CrossRef]
- Ou, J.H.; Yang, J.Y.; Yao, S.J. Development Level, Regional Differences and Distributional Dynamic Evolution of China’s New Rural Collective Economy. Issues Agric. Econ. 2025, 9, 105–124. [Google Scholar] [CrossRef]
- Han, L.; Cao, X.X.; Zhu, H.L.; Chen, R.; Zhao, Y.; Liu, Z.; Zhao, Z.; Chang, Y.; Yang, M.; Gao, Y. Vegetation Cover Change and Its Driving Factors in the Loess Plateau of Northern Shaanxi Based on Feature Zoning. Acta Ecol. Sin. 2023, 43, 8564–8577. [Google Scholar] [CrossRef]
- Guo, Y.Z.; Zhou, Y.; Liu, Y.S. Spatiotemporal Evolution and Driving Mechanisms of Rural Population Outflow in China. Sci. Geogr. Sin. 2020, 40, 50–59. [Google Scholar] [CrossRef]
- Liu, Y.S.; Guo, R.Z.; Zhang, L.Q.; Guo, Y.Z.; Li, Y.R. Transformation Mechanisms and Scenario Simulation of Rural Territorial Systems. Acta Geogr. Sin. 2025, 80, 855–870. [Google Scholar] [CrossRef]
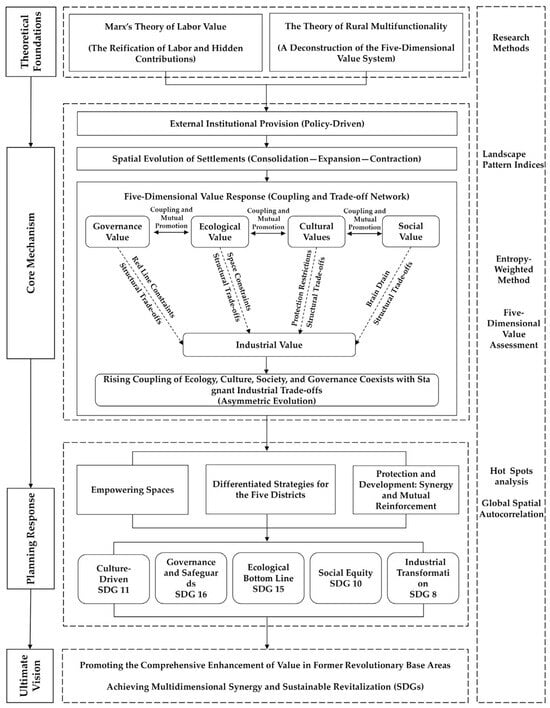
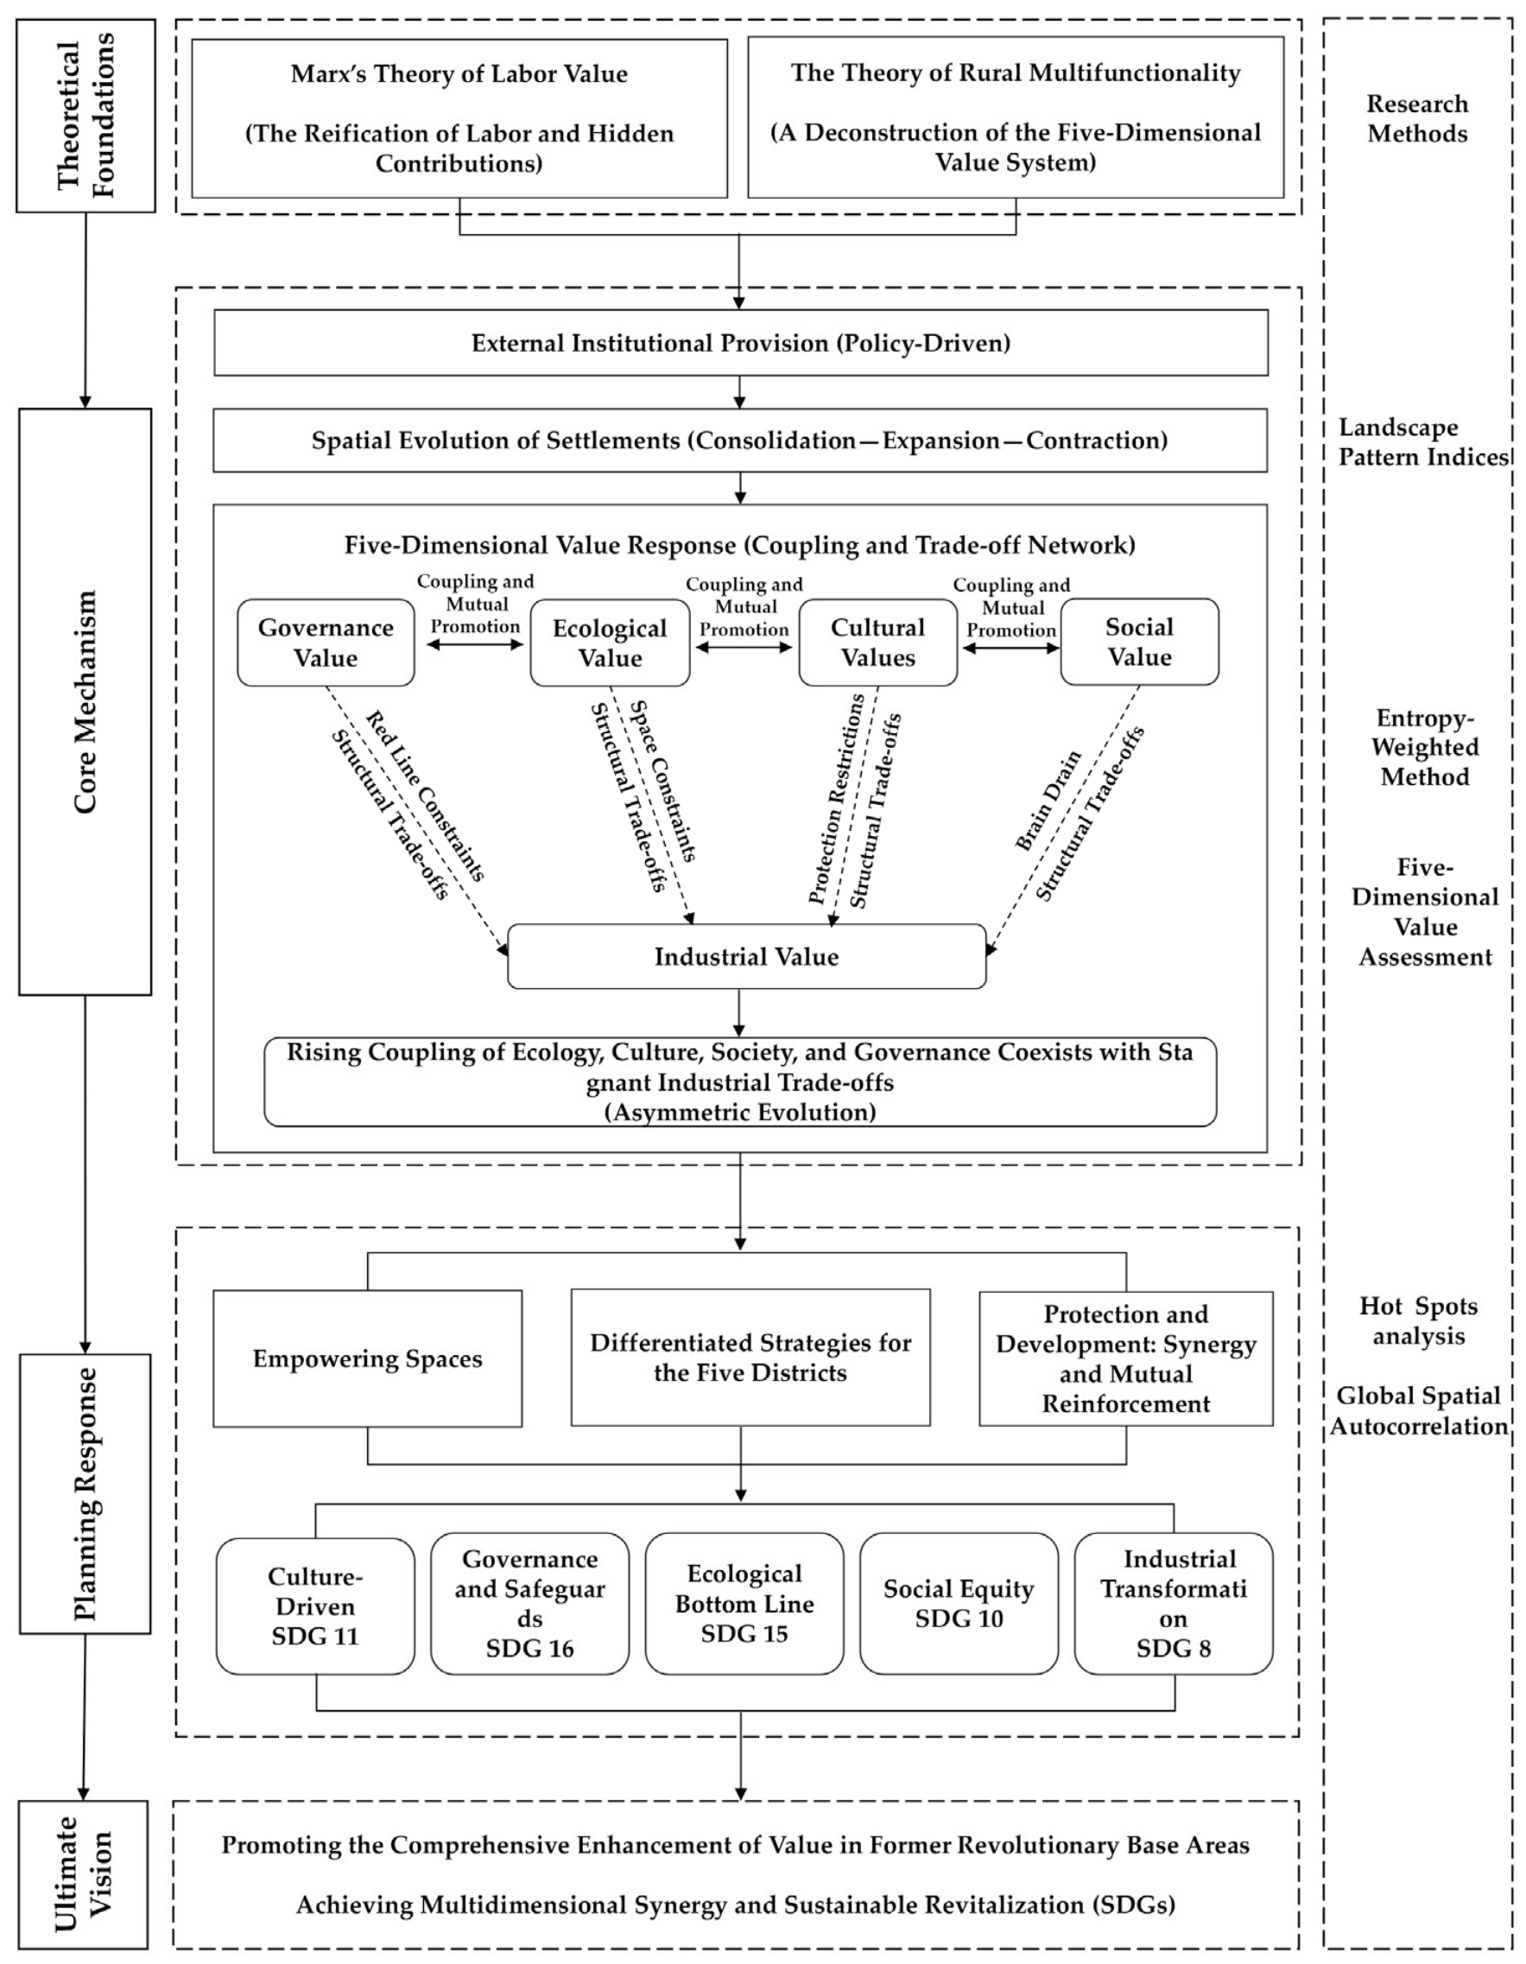
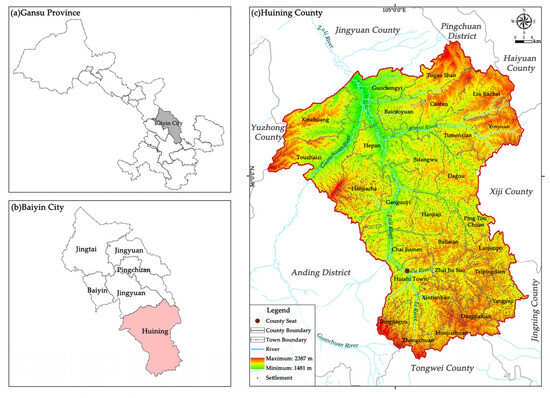
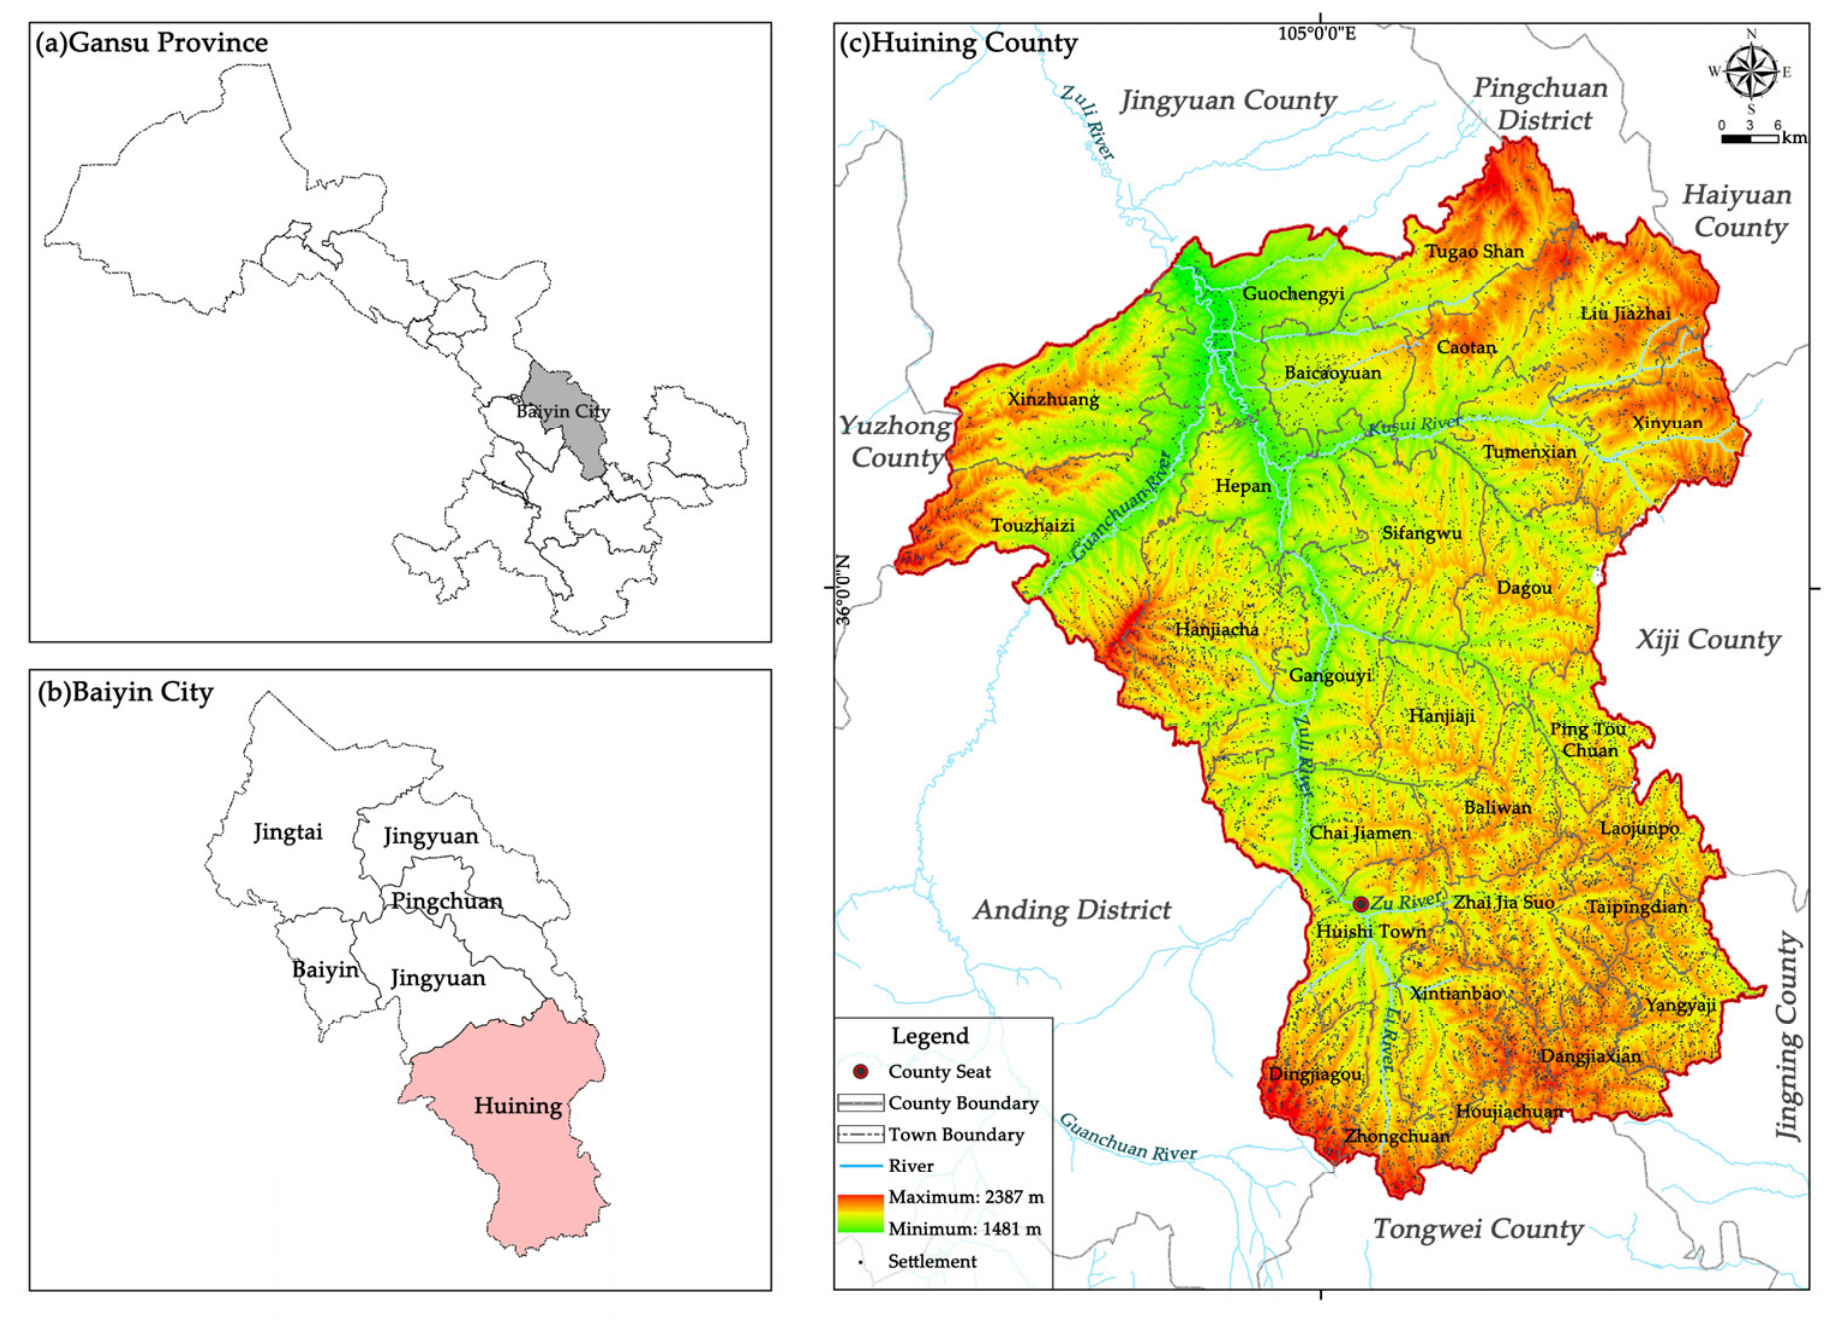
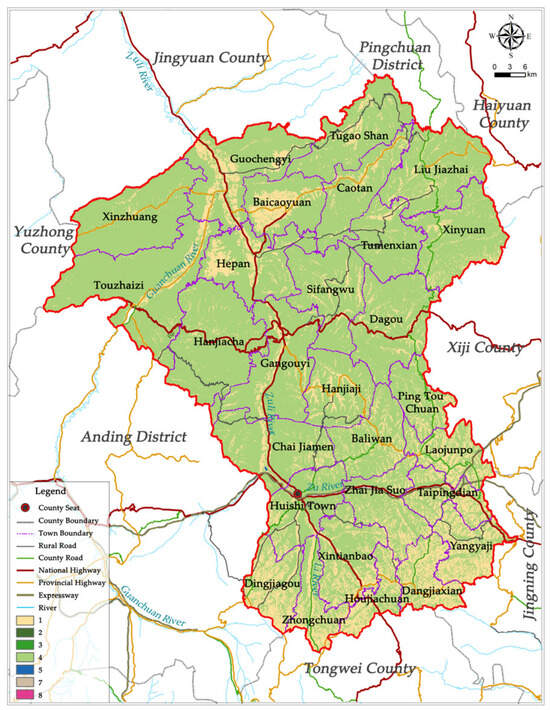
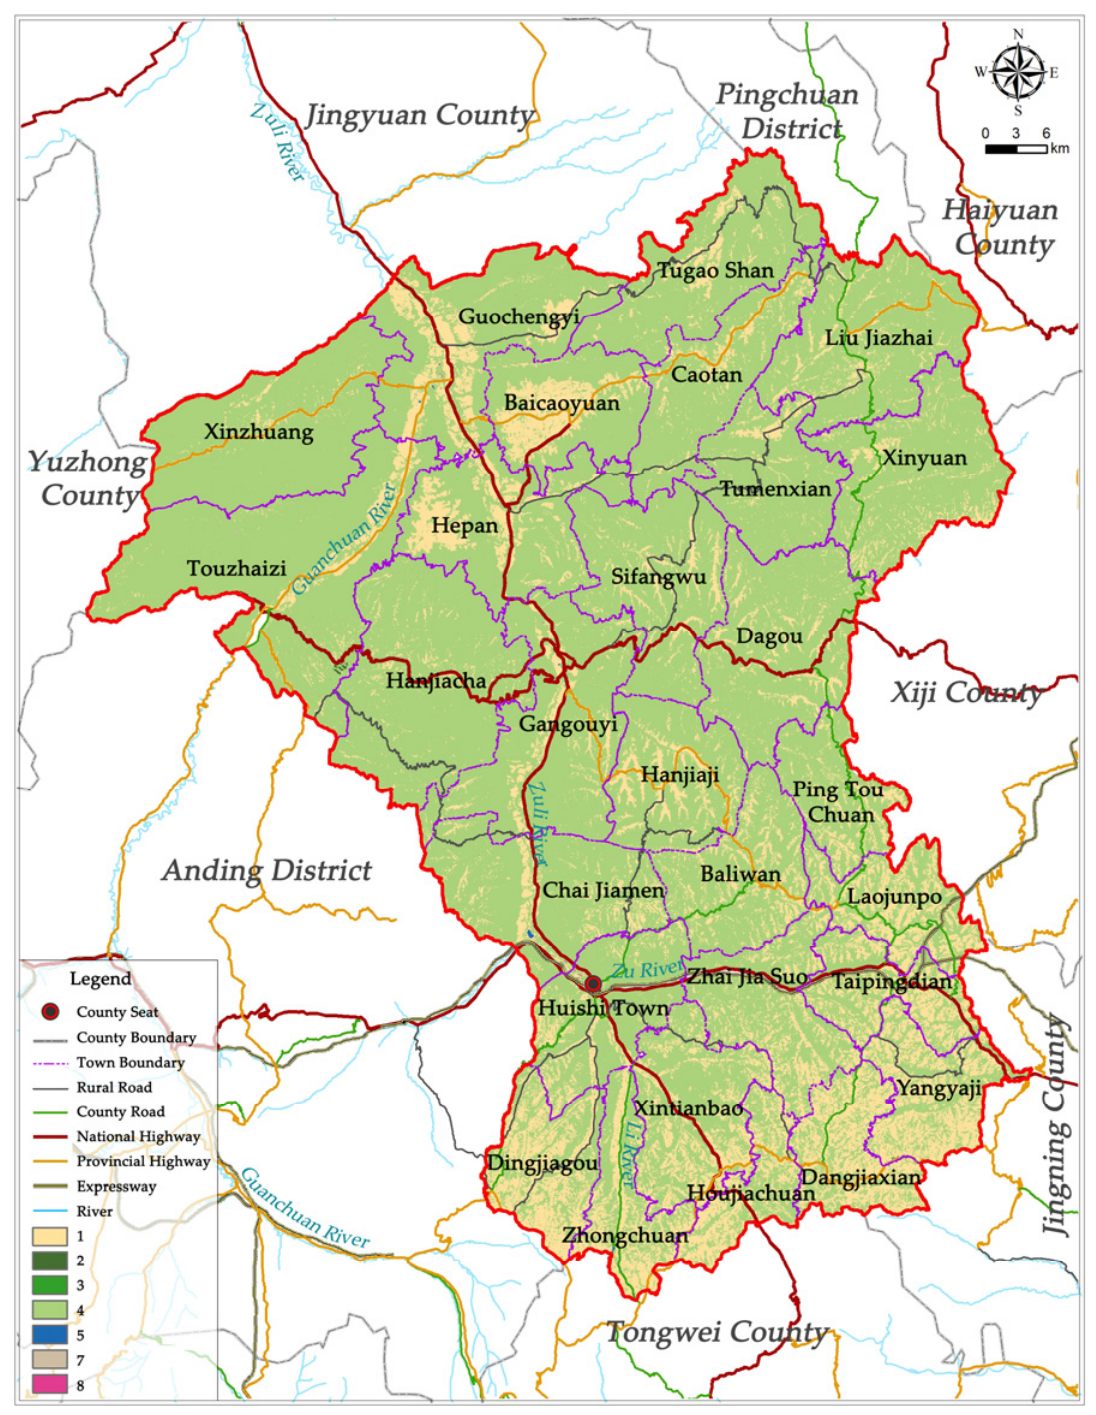
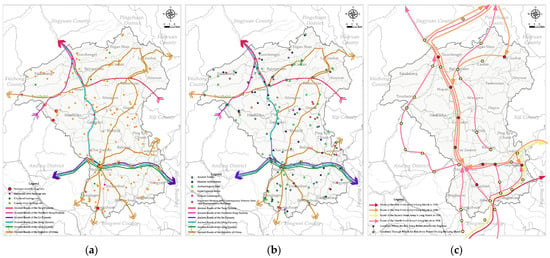
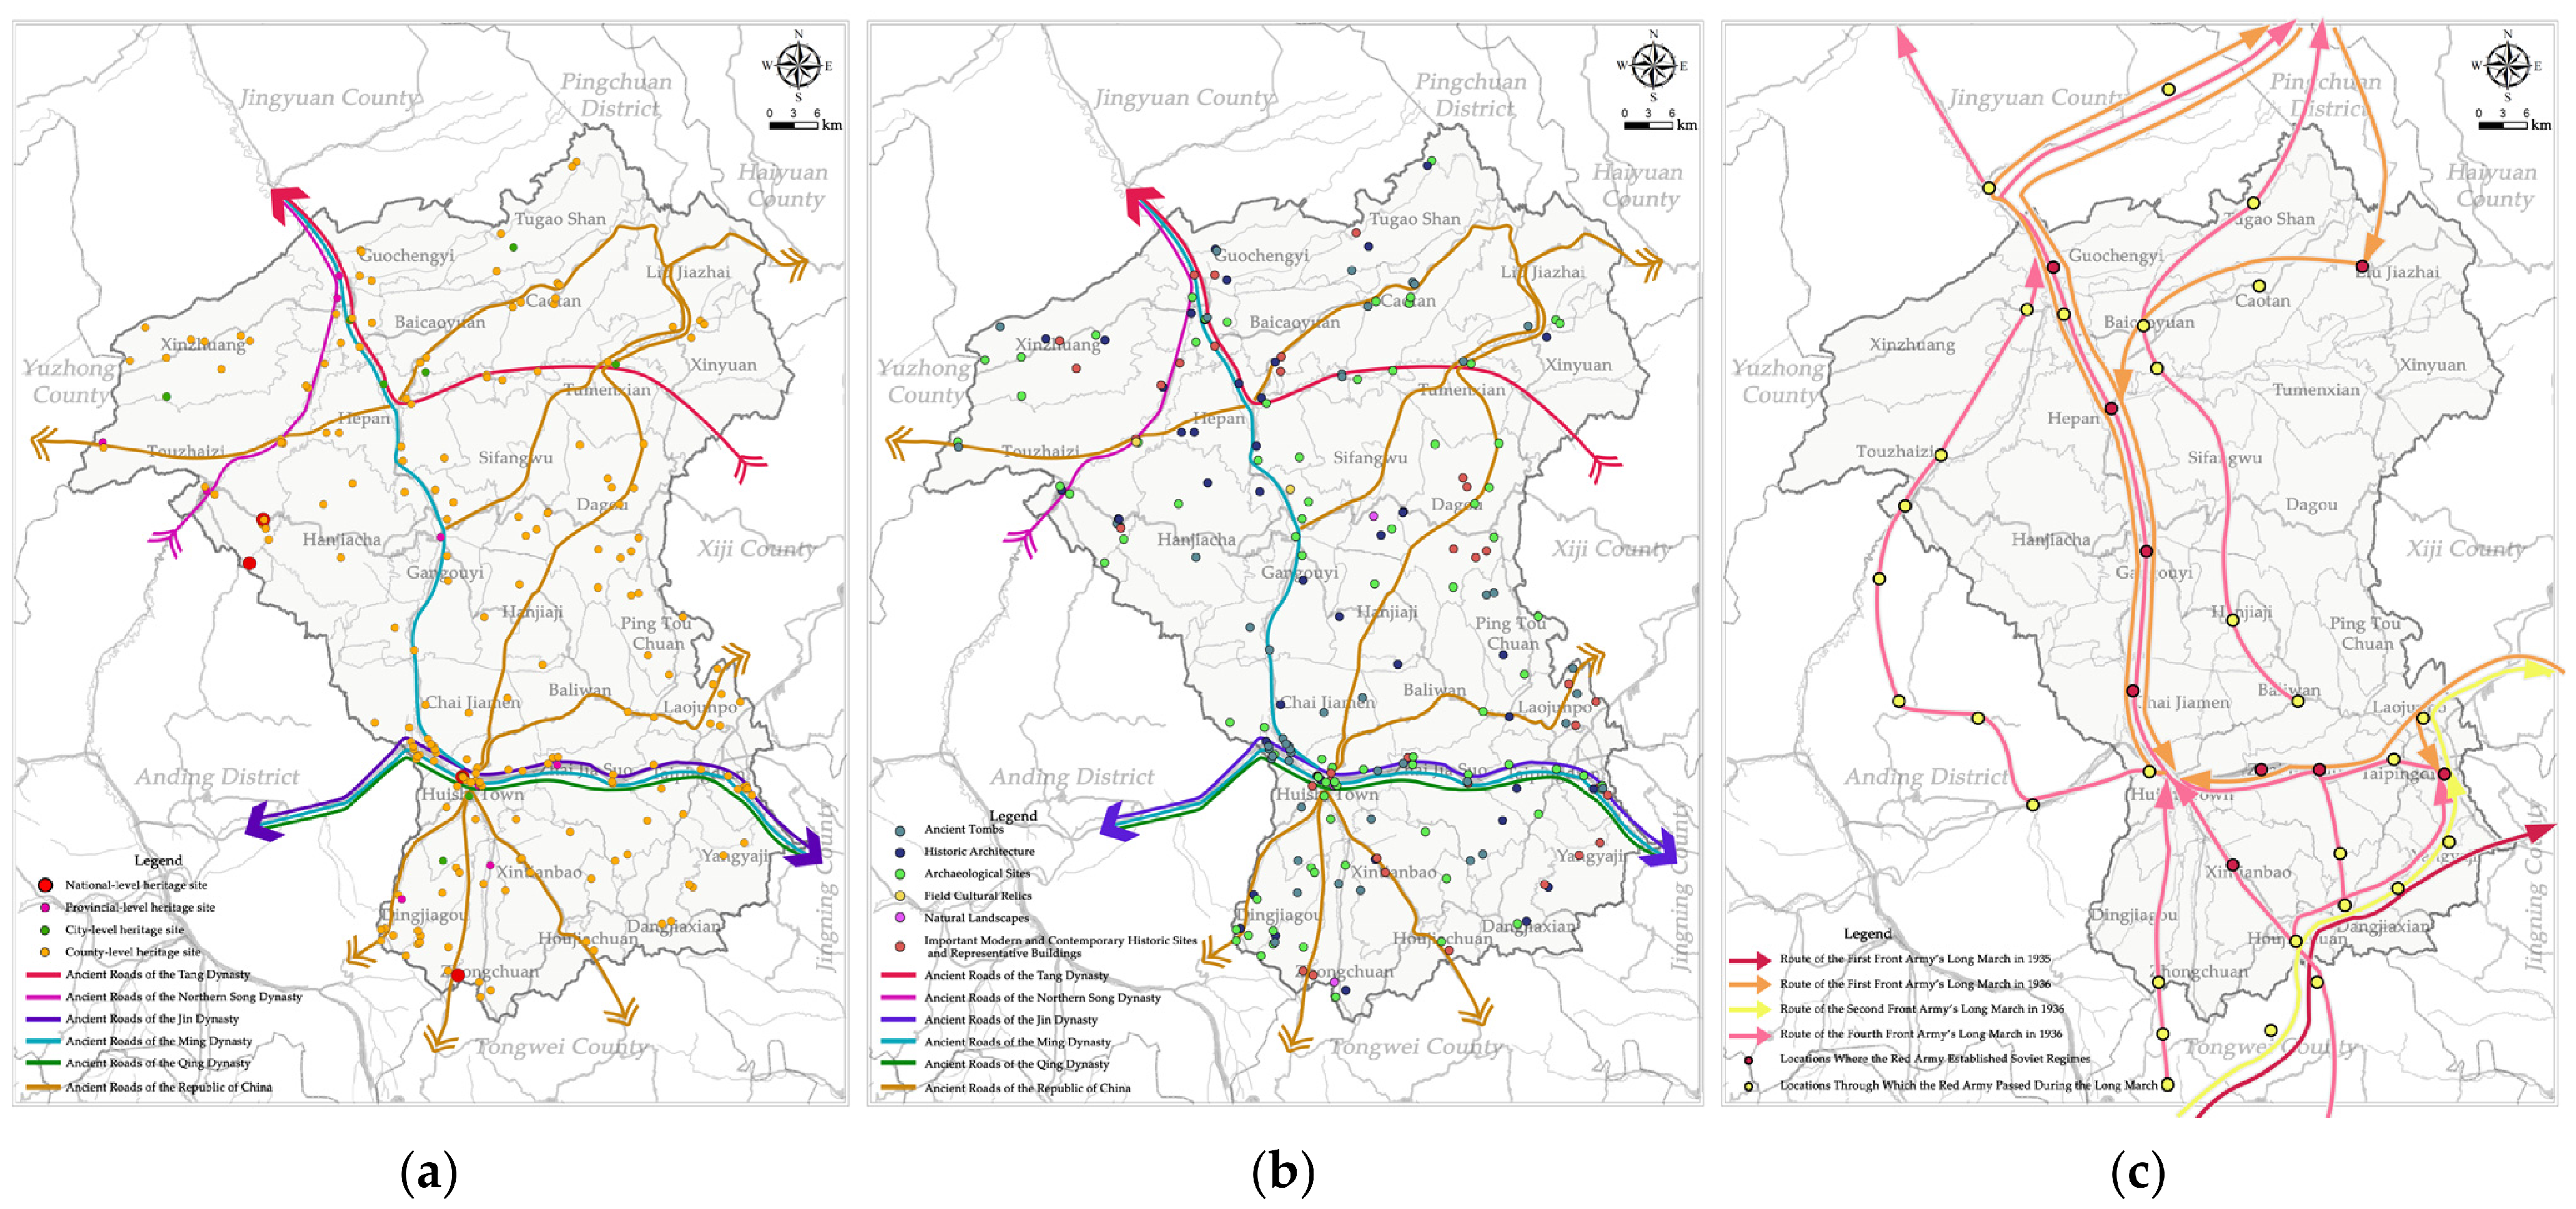
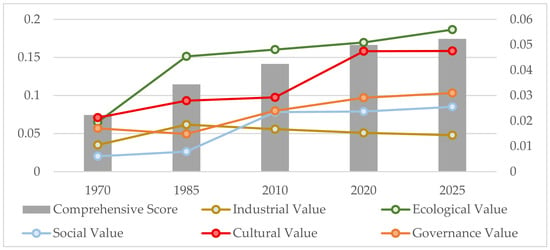
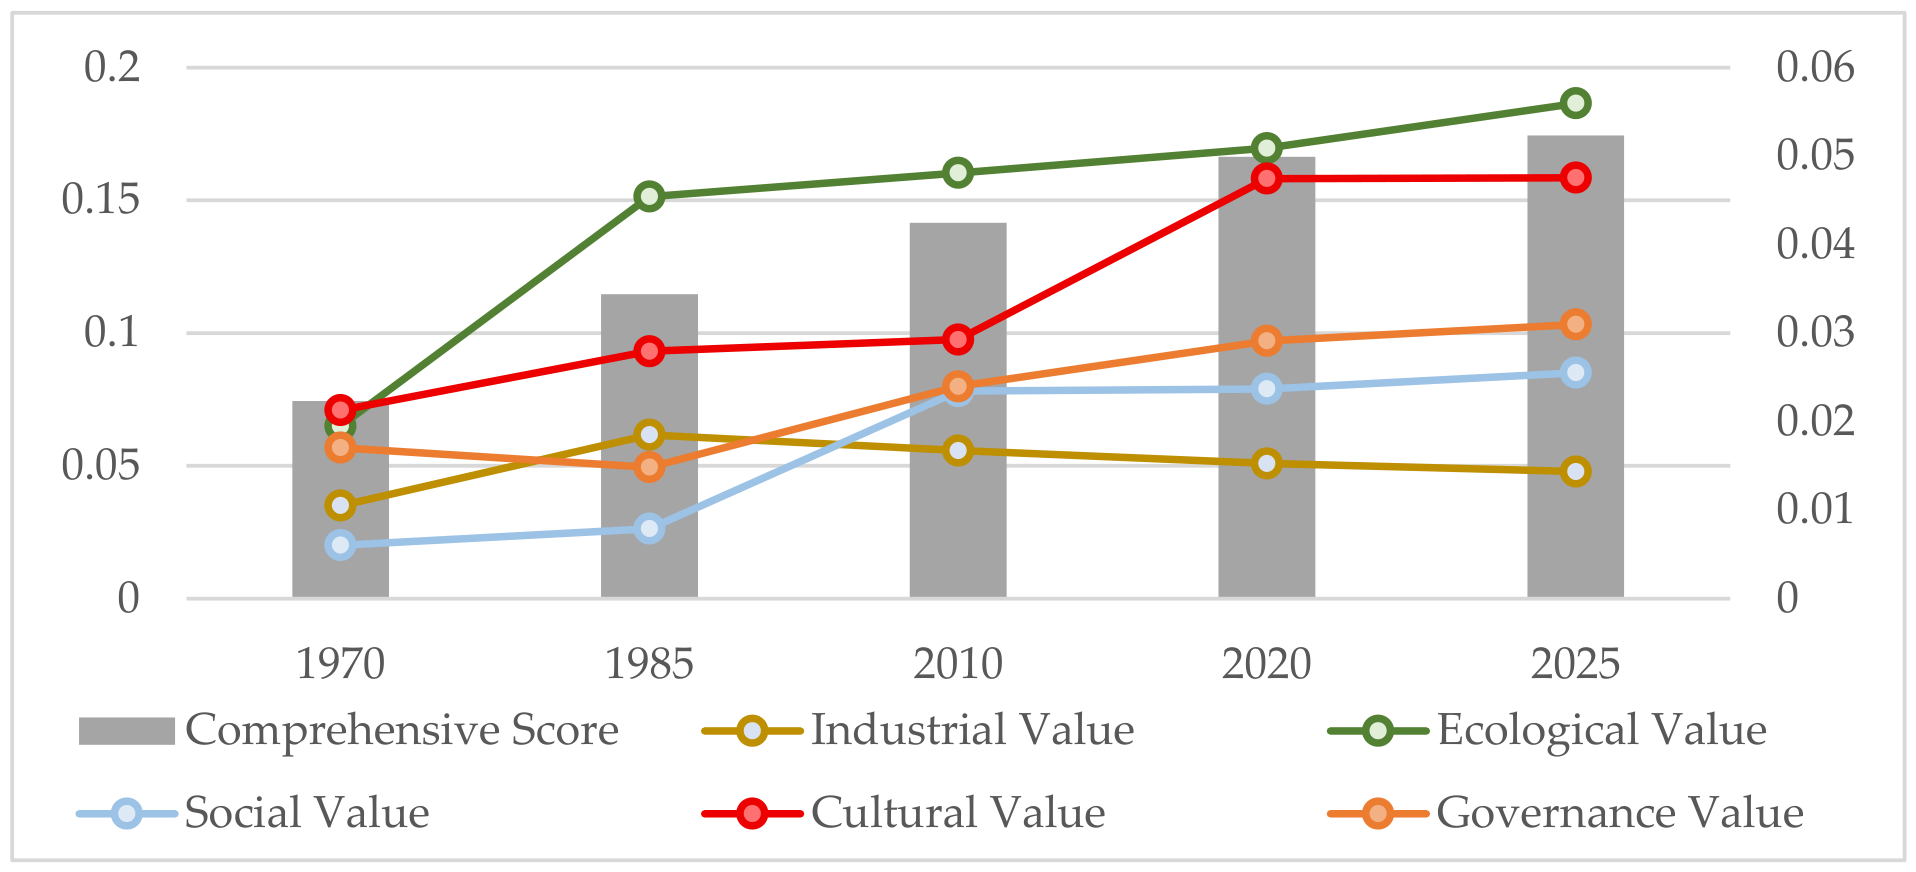
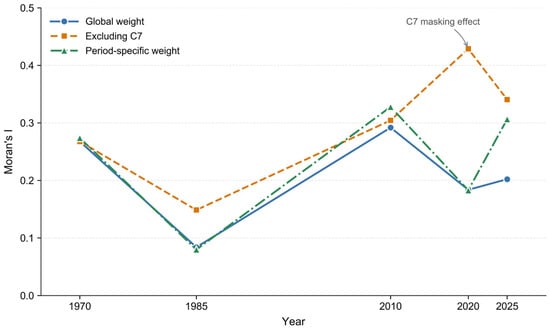
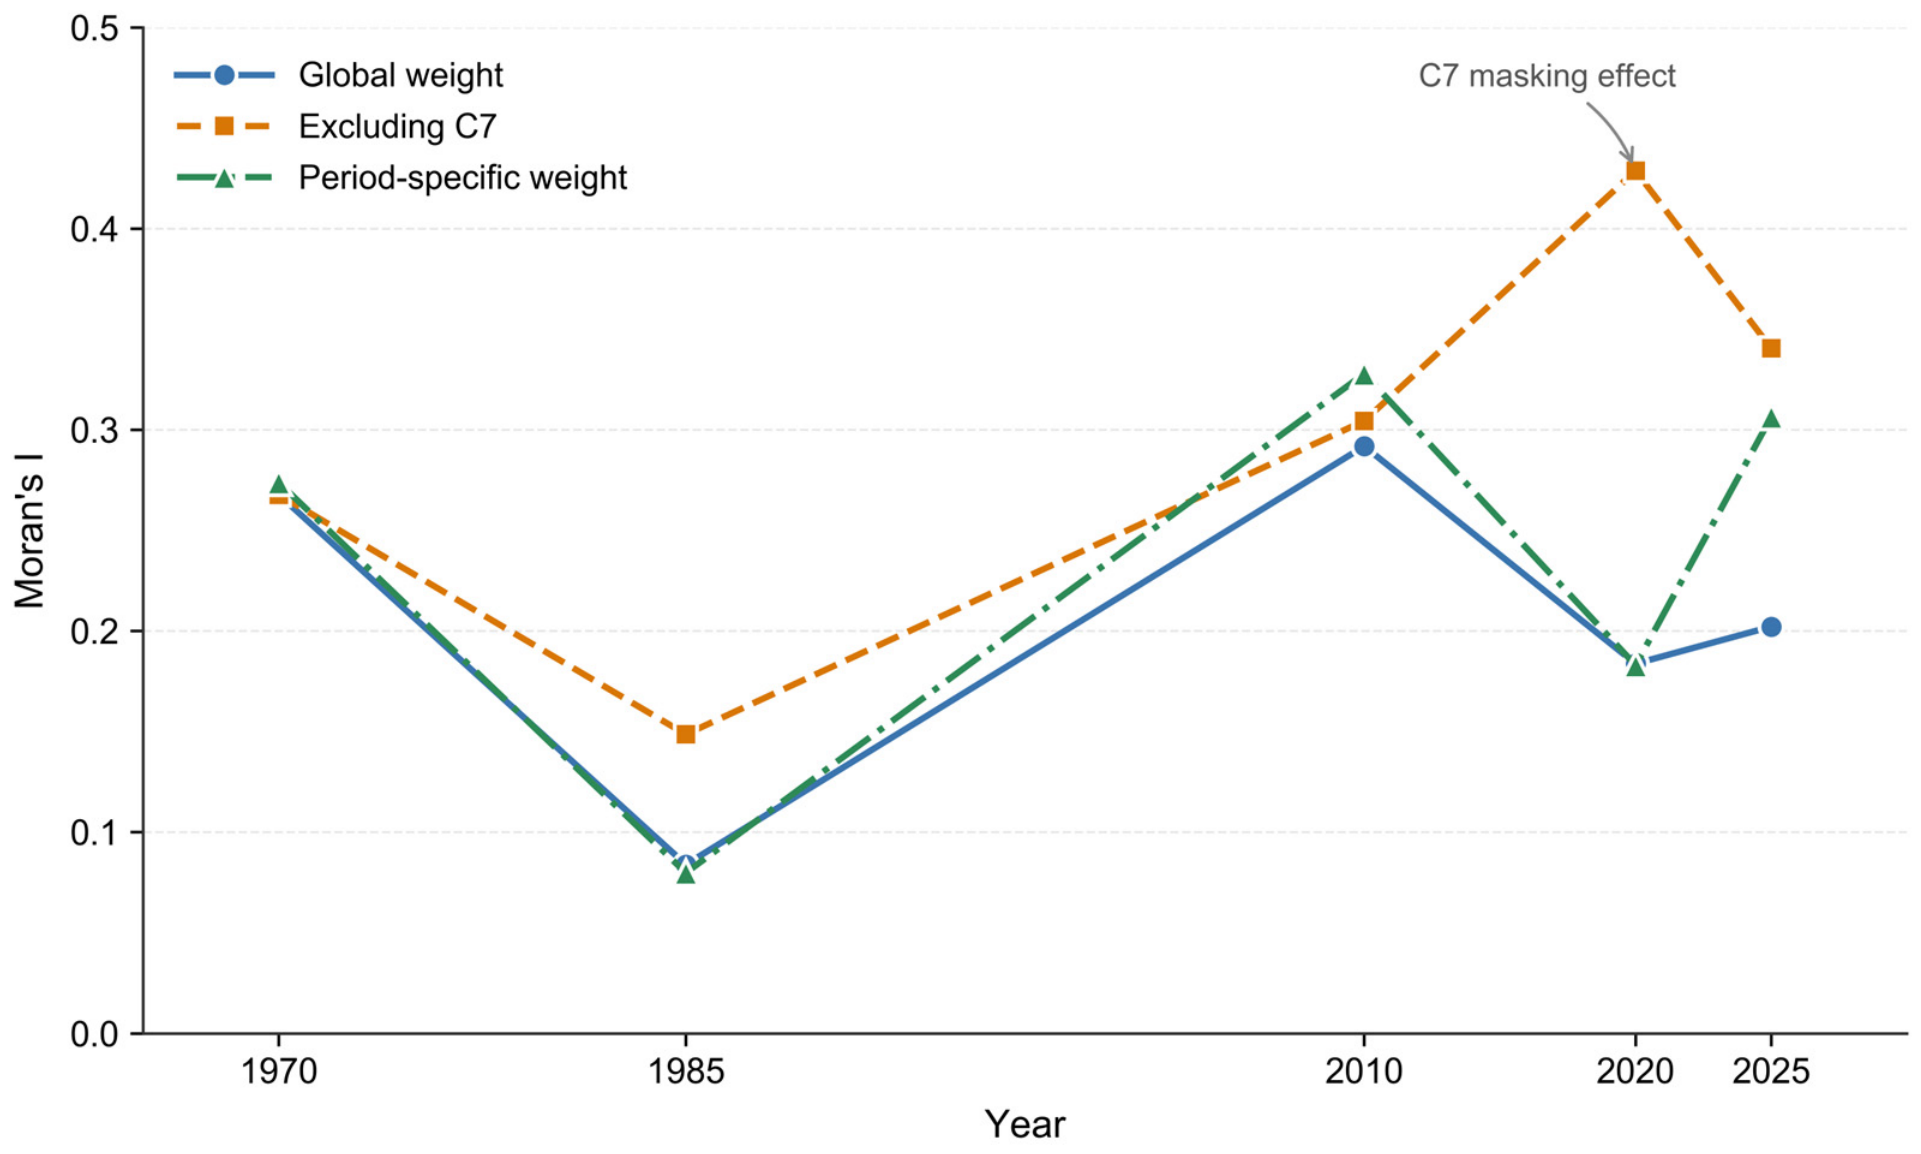
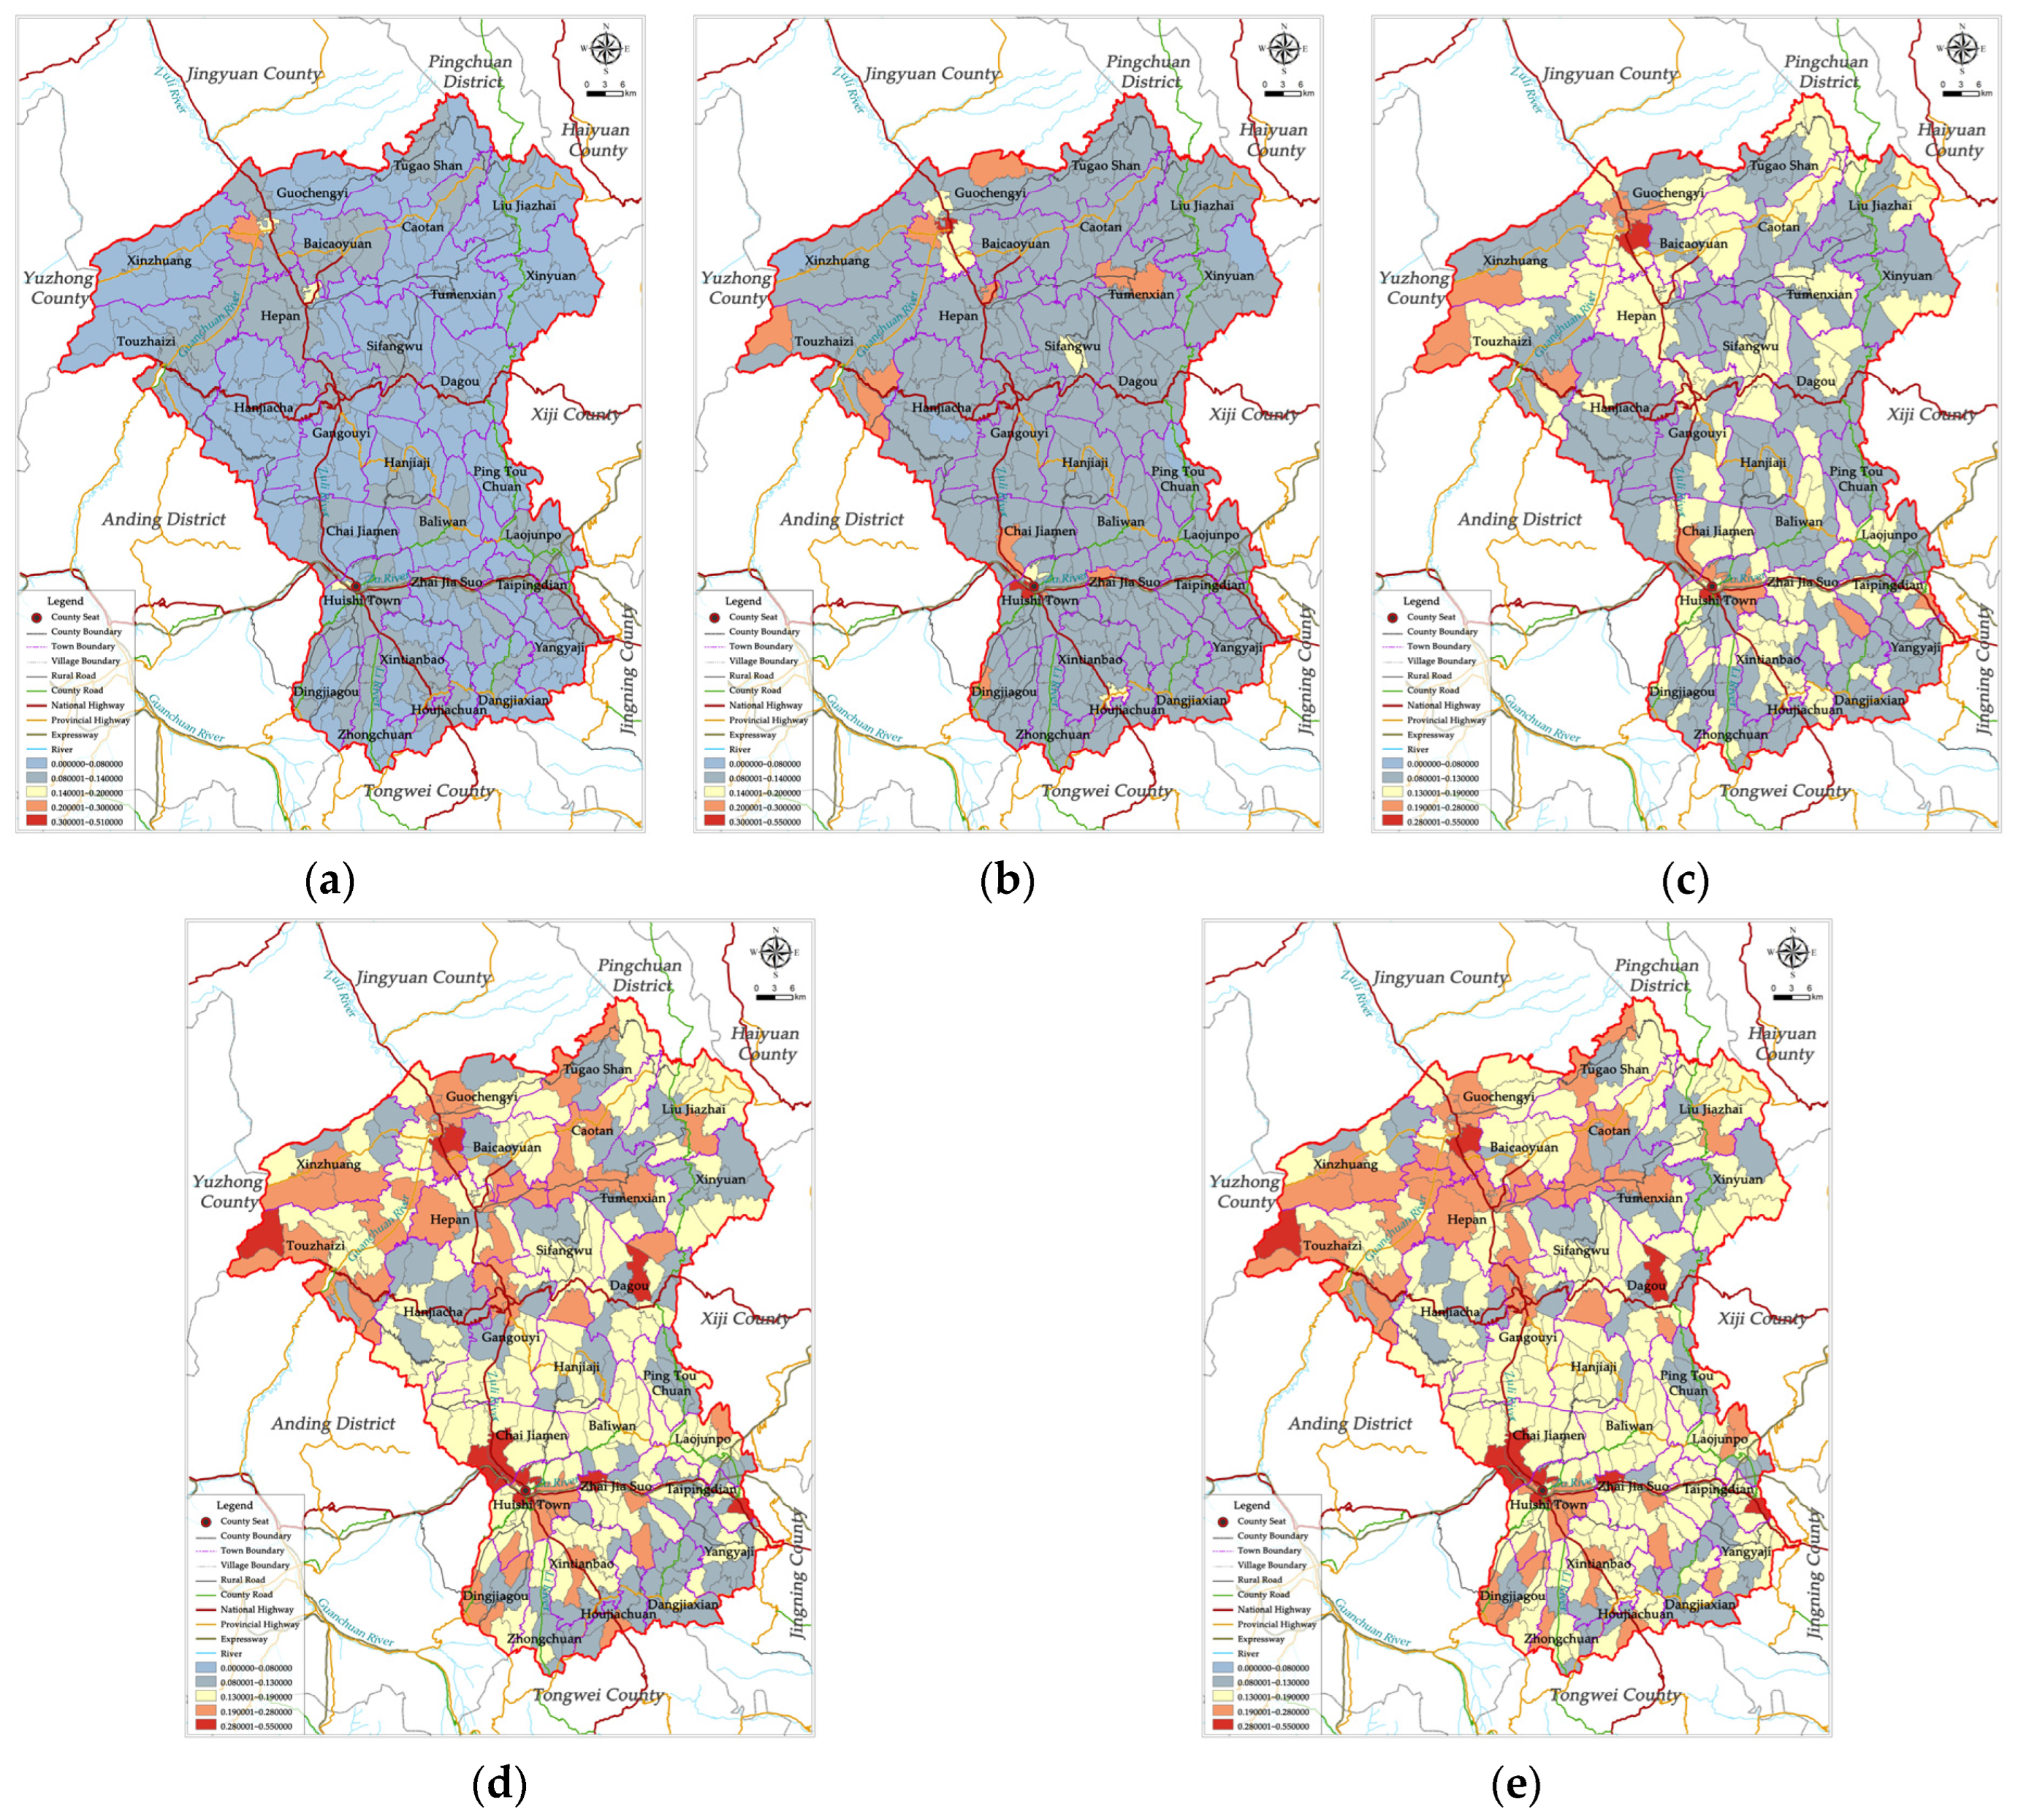
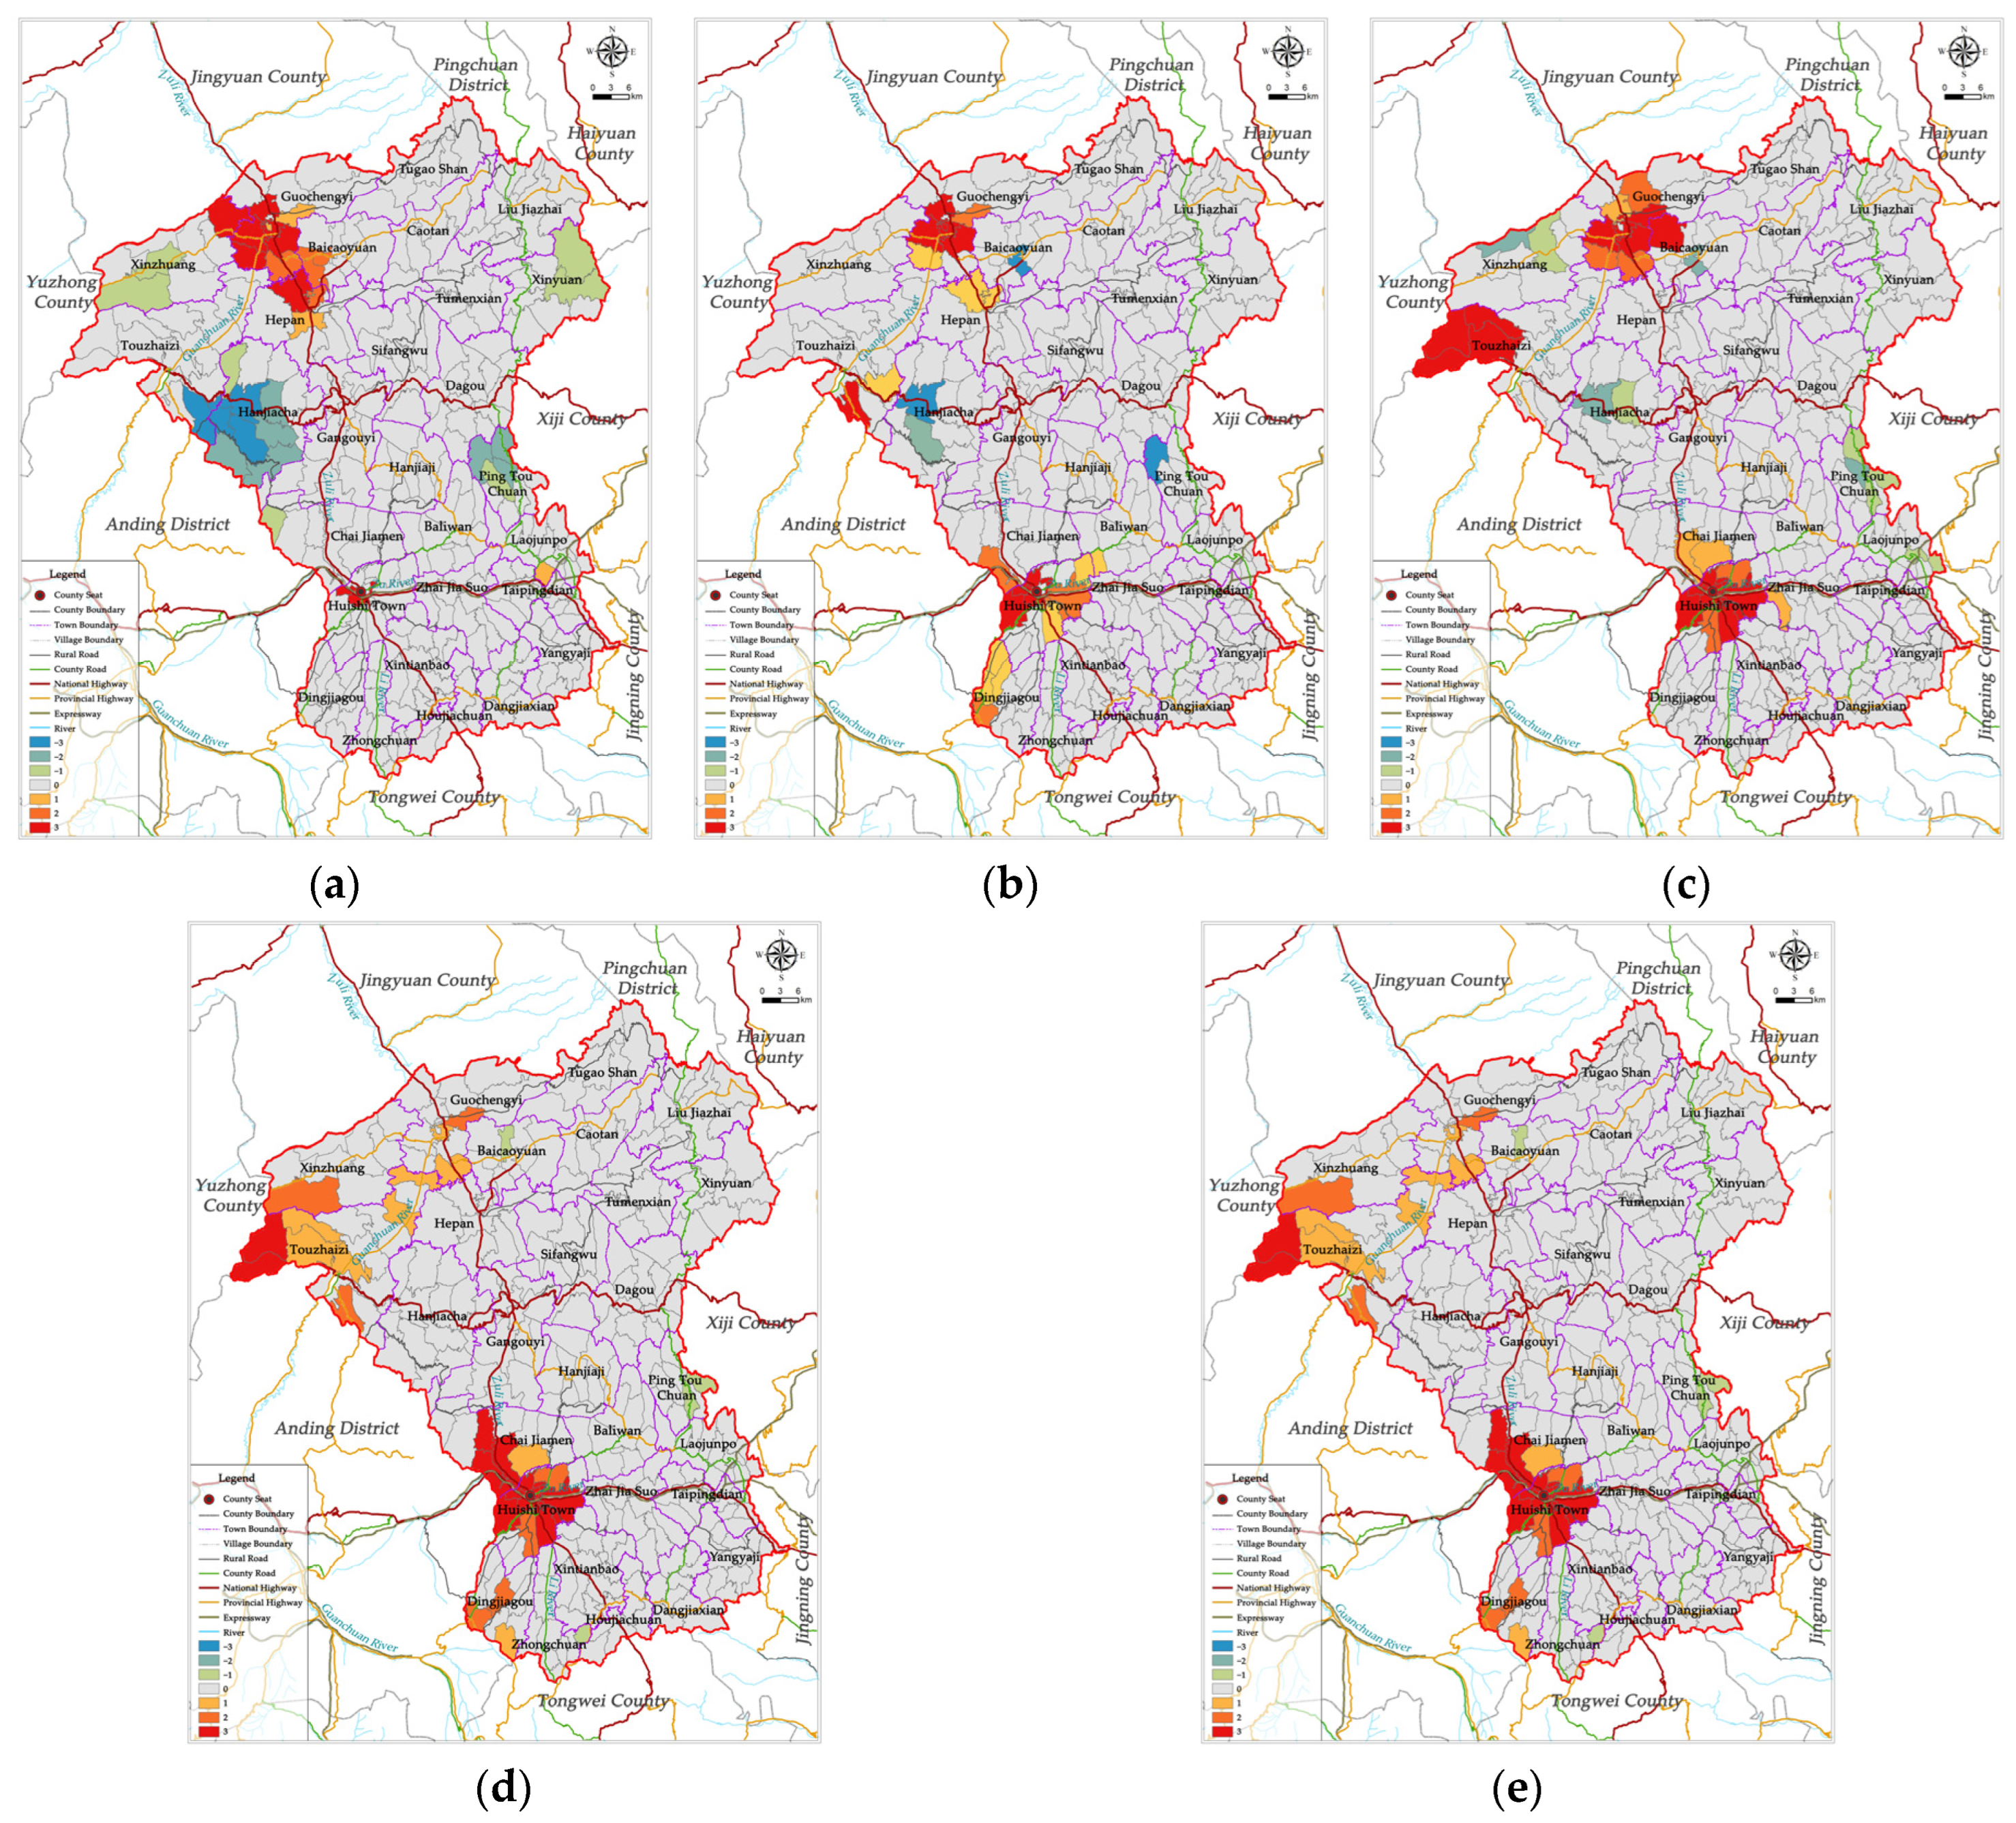
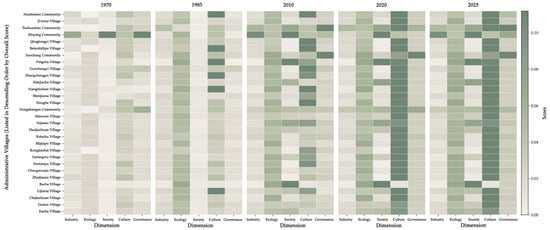
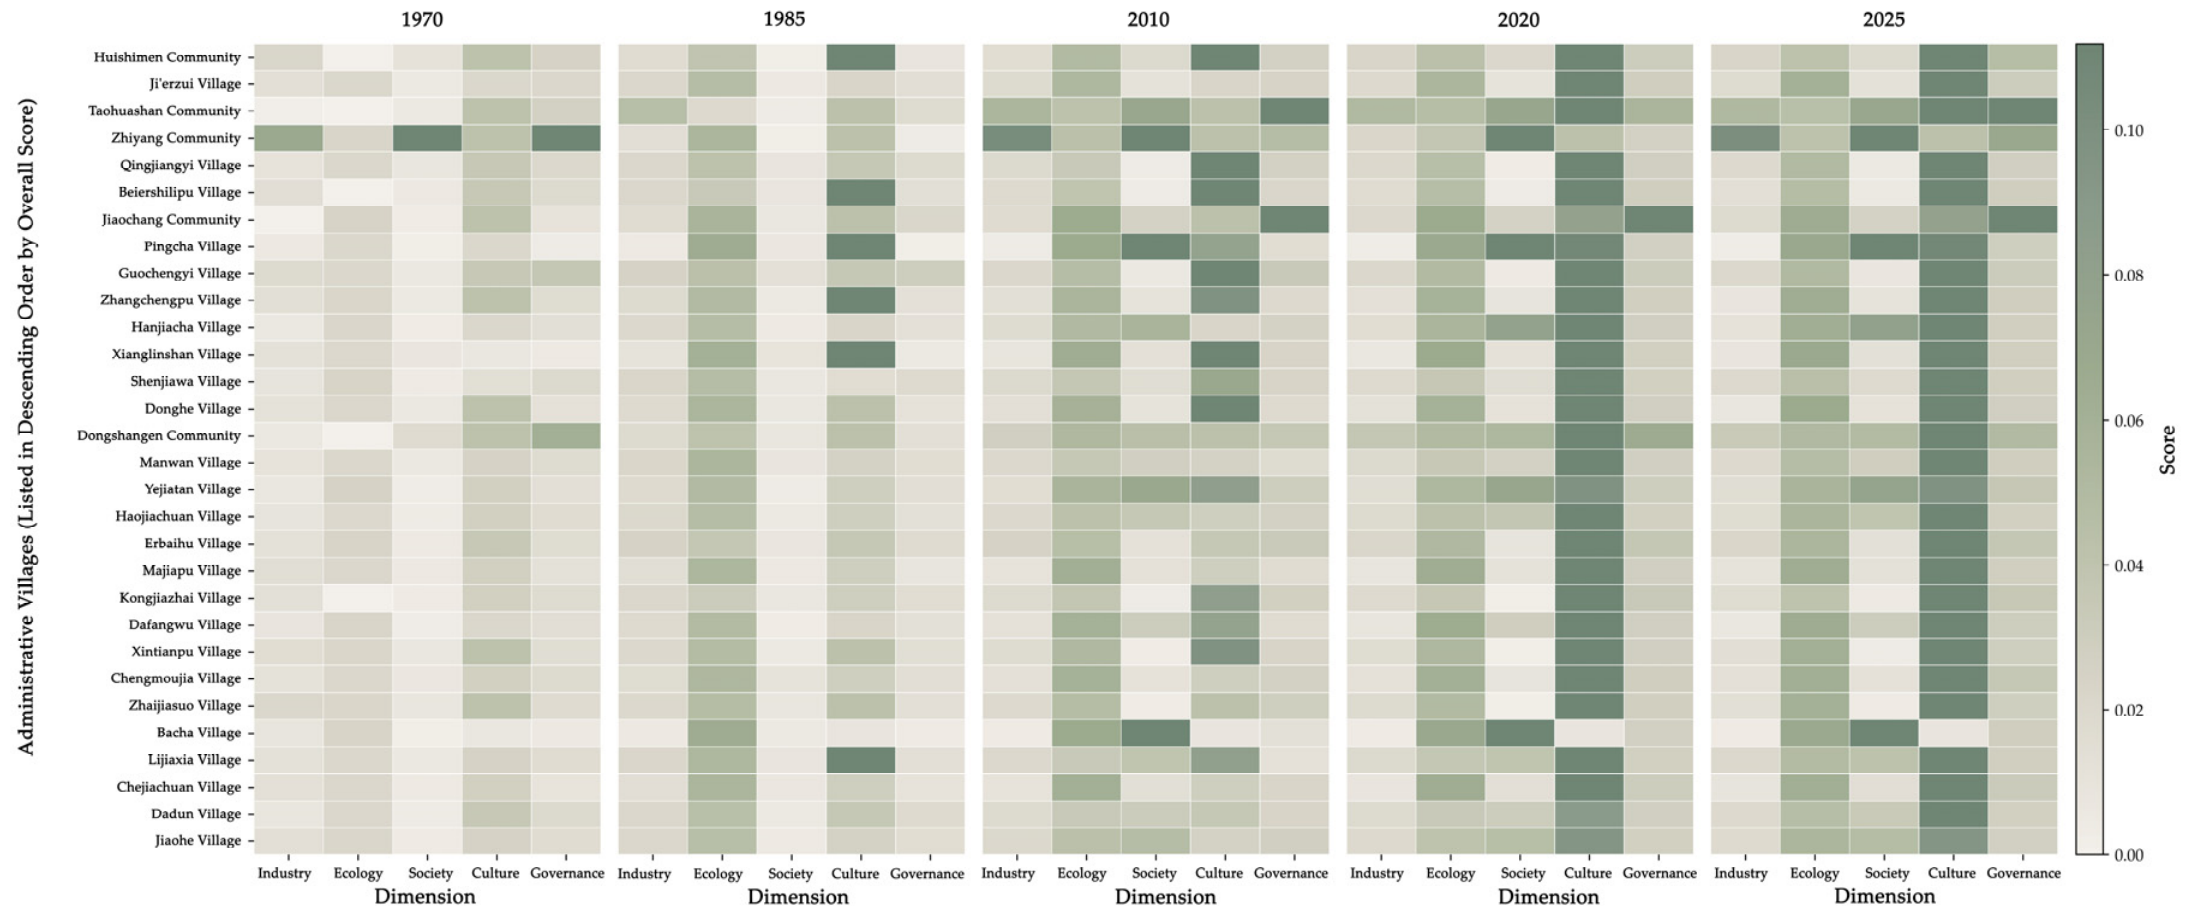
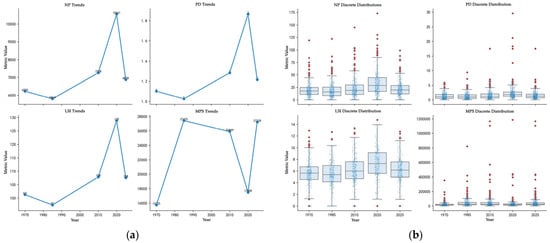
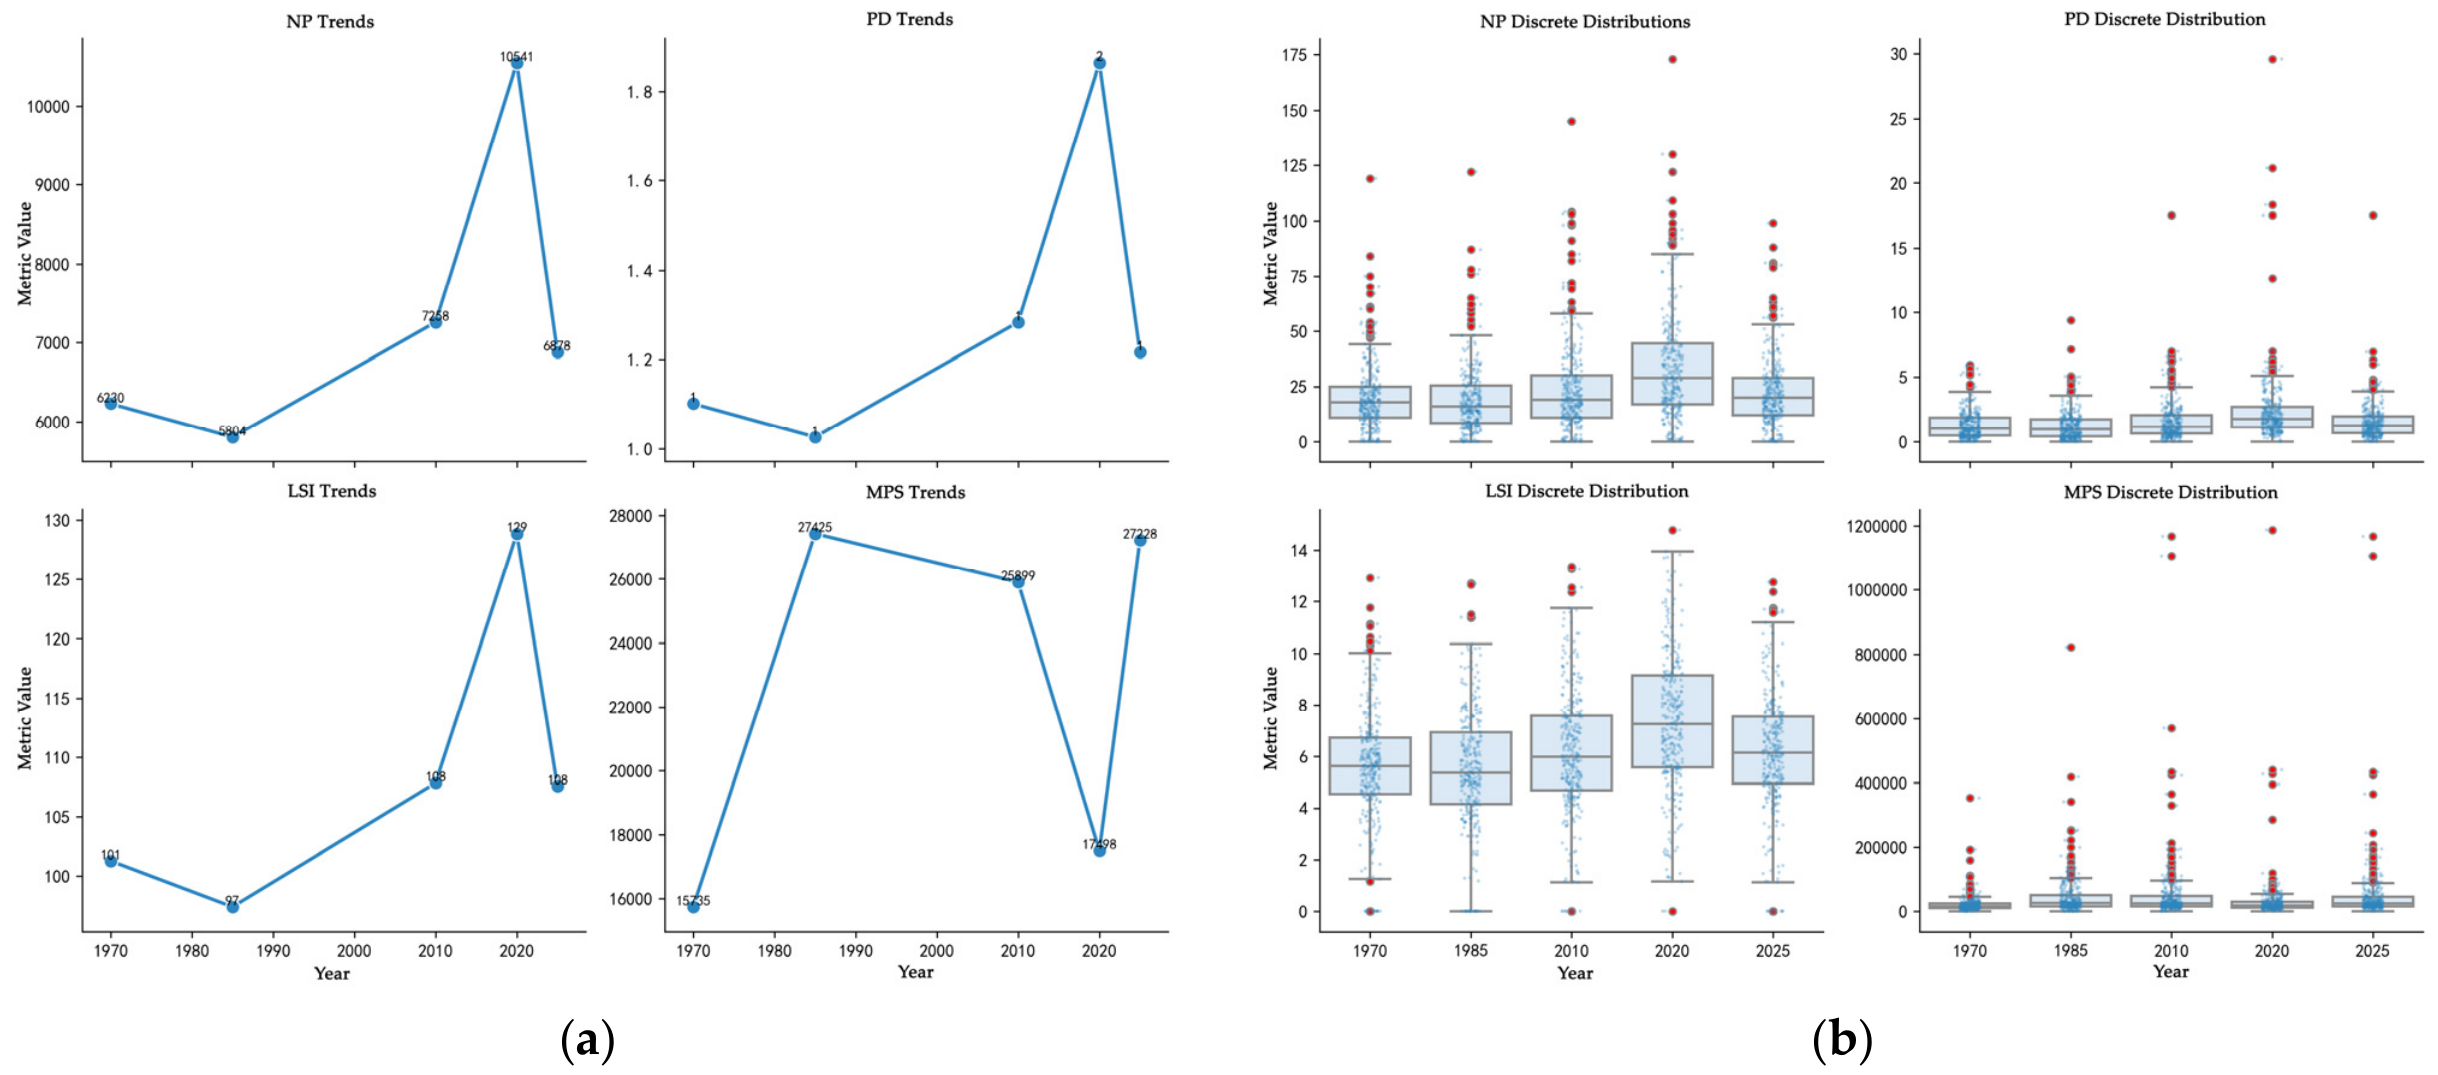
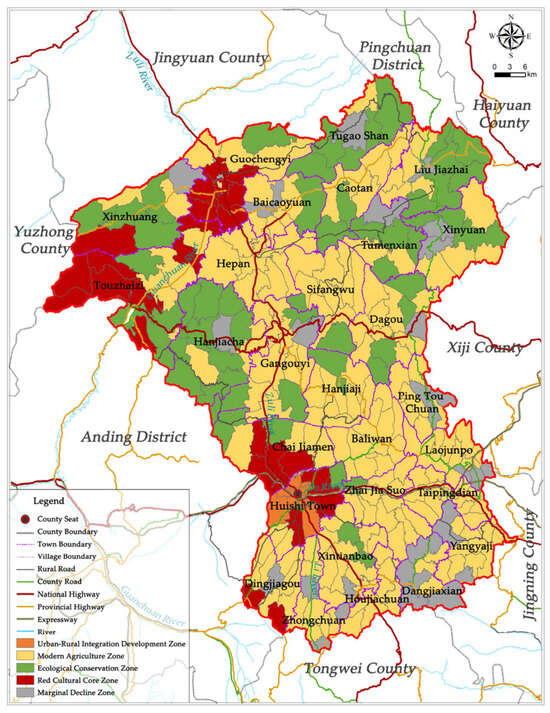
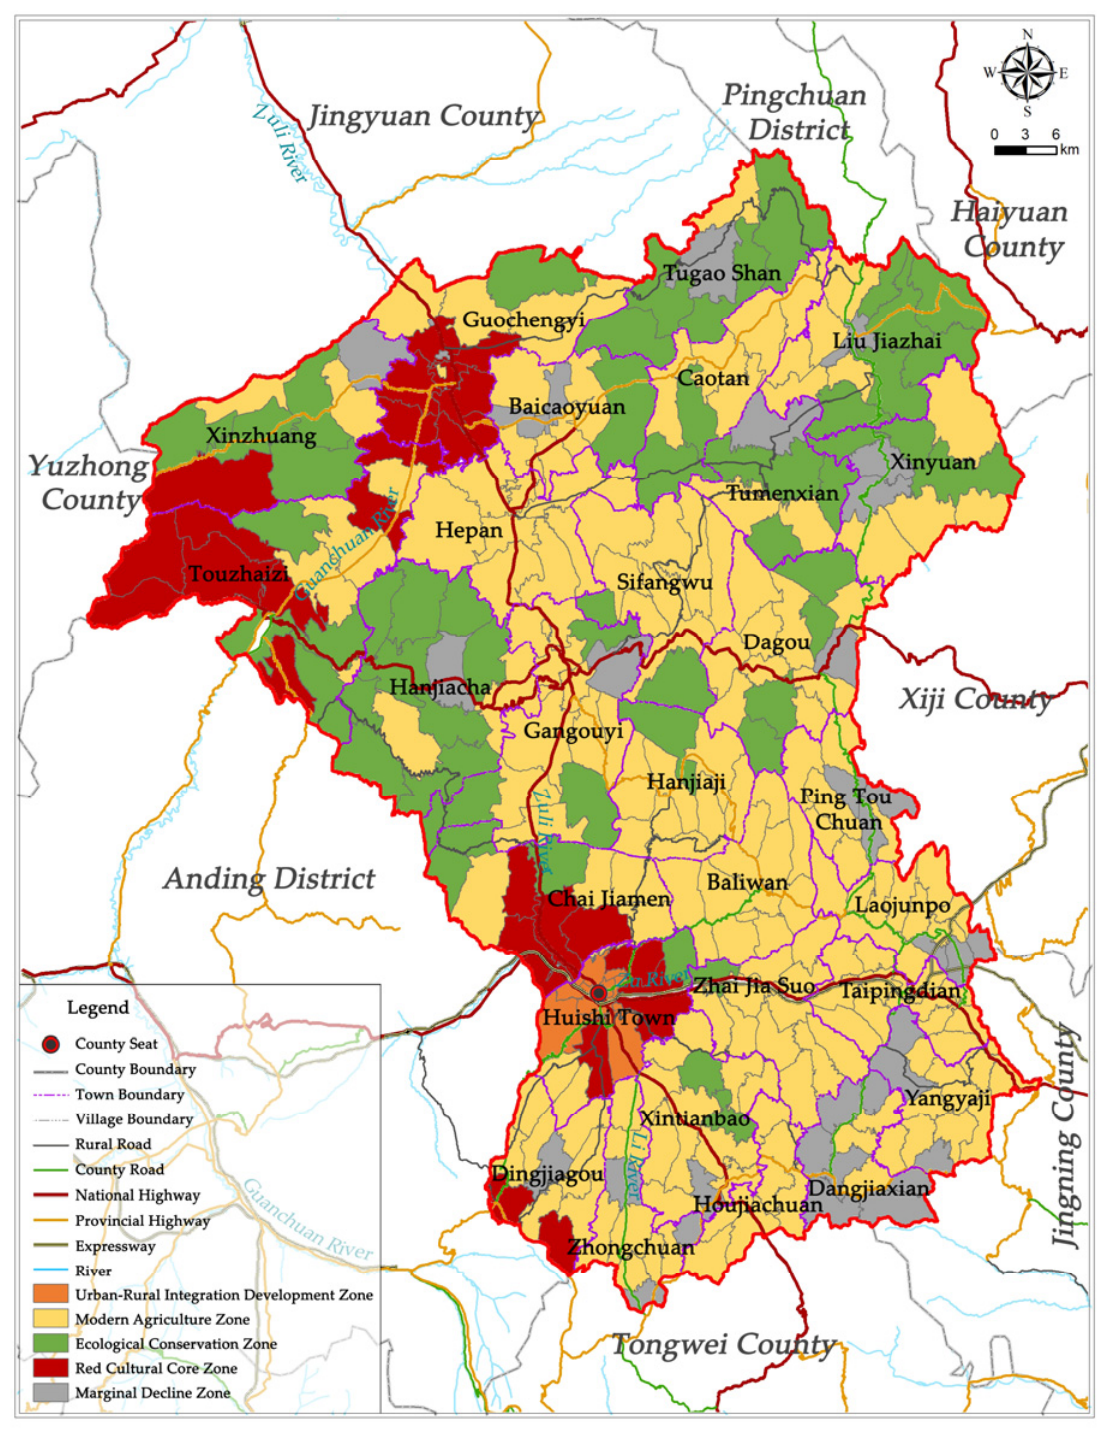

Disclaimer/Publisher’s Note: The statements, opinions and data contained in all publications are solely those of the individual author(s) and contributor(s) and not of MDPI and/or the editor(s). MDPI and/or the editor(s) disclaim responsibility for any injury to people or property resulting from any ideas, methods, instructions or products referred to in the content. |
© 2026 by the authors. Licensee MDPI, Basel, Switzerland. This article is an open access article distributed under the terms and conditions of the Creative Commons Attribution (CC BY) license.