


Abstract
Oasis–valley cities can exhibit directionally uneven public transport accessibility in the context of constrained development corridors and dispersed peripheral clusters. However, existing studies rarely explain these directional differences while jointly accounting for heterogeneous commercial facilities, full-process travel costs, and time-specific shopping scenarios. This study asks how public transport accessibility aligns with commercial opportunities in central Urumqi and how the associated factors vary across the core, inner suburbs, and peripheral clusters. We analyzed 105 subdistricts and 16 shopping centers using geographic information system (GIS) analysis, door-to-door transit travel-time isochrones, a cumulative transit service-opportunity index, and geographically weighted regression. Three findings emerged. (1) Transit supply broadly followed population concentration: population density correlated with stop density (r = 0.804) and road-network density (r = 0.780), although localized mismatches persisted. (2) Commercial opportunities formed one primary and three secondary centers; accessibility extended north–south but contracted east–west, and the main peripheral clusters generally required 45–60 min to reach. (3) Local model fit ranged from R2 = 0.26 to 0.55, with accessibility associated mainly with population in the core, population and road networks in inner suburbs, and distance to the core business district in parts of the periphery. These results provide a basis for prioritizing feeder services and cross-cluster connections in central Urumqi.
1. Introduction
Urban spatial morphology does not always follow a concentric pattern on a homogeneous plain [1]. In cities constrained by mountains, river valleys, and oasis boundaries, urban development, transport networks, and functional nodes often concentrate along a limited number of developable corridors. This process produces pronounced axial or clustered structures [2]. Research on mountainous cities has shown that topographic constraints alter the organization of public transport networks and their spatial relationship with urban development [3]. Public transport accessibility is also fundamental to residents’ ability to reach urban opportunities such as employment, commerce, and public services [4,5]. Unlike in relatively homogeneous plain cities, transport impedance in constrained cities may not increase uniformly from the center toward the periphery. Instead, it may increase gradually along major corridors but sharply across them. Studies of Chinese river-valley cities such as Lanzhou and Taiyuan have likewise observed the concentration of transport and urban functions along major corridors [6]. Daily public transport use is also associated with individual characteristics, including age, education, and employment status, as shown in a Polish survey-based logit analysis [7]. These morphological differences further affect equitable access to urban opportunities. Transport equity research stresses that public transport evaluation should consider not only whether facilities exist but also whether residents can reach essential activity opportunities within reasonable travel times [8,9]. For commercial activities, accessibility is directly related to opportunities for daily shopping, leisure, and everyday services [10]. Sustainable transport evaluation must also consider inequalities in different groups’ ability to reach urban activities [11]. It should also account for spatial gaps between public transport supply and social demand and for the risk of transport poverty [12,13].
Research on public transport accessibility has expanded from early evaluations of stop distance and facility coverage to multidimensional assessments of supply levels, cumulative opportunities, supply–demand gaps, and spatial equity. Approaches such as Public Transport Accessibility Level (PTAL) and Transit Gap jointly consider stop distance, service frequency, and potential demand to identify areas underserved by public transport [14]. More recent studies have compared objective accessibility with residents’ perceptions and identified possible discrepancies between calculated accessibility and actual travel experience [15,16]. For access to activity opportunities, cumulative-opportunity indicators are widely used because of their intuitive structure, although evaluation results are strongly affected by the spatial distribution of opportunities [17,18]. Public transport-disadvantaged groups and service gaps around stops have therefore become important concerns [19,20]. Consequently, transit-accessibility evaluation has gradually shifted from asking whether facilities provide coverage to asking how many opportunities residents can reach and whether those opportunities are distributed equitably. With the development of spatiotemporal transport data, accessibility research has also moved from static network evaluation to time-dependent and full-process travel evaluation. Studies of time-dependent service supply and planning indicators show that accessibility must reflect service variation across time periods and its implications for resource allocation [21,22]. Service disruptions, travel-time errors, and operational fluctuations change the urban opportunities that residents can reach [23,24]. Differences in the spatiotemporal activities of different groups and recurring delays may further widen gaps in access to opportunities [25,26]. Intraday variation in transit services and travel-time reliability can substantially affect residents’ access to commercial opportunities [27,28]. Shopping-activity paths and transit-network conditions likewise alter the actual availability of opportunities [29]. Measures based only on a fixed speed, a single time slice, or geometric distance therefore cannot fully represent actual shopping trips. Commercial facilities also differ substantially in their activity profiles. Differences in commercial hierarchy, location, and business format correspond to differences in catchment extent, while the spatiotemporal flexibility of shopping trips is closely related to public transport accessibility [30]. Real-time travel times and different transport modes may produce different spatial patterns of commercial opportunities [31,32]. Related studies indicate that transport accessibility affects residents’ shopping space and the spatial organization of urban economic activity. A commercial destination’s catchment cannot simply be equated with the size of its nearby resident population [33,34]. Gravity relationships in central cities and measures of commercial-opportunity accessibility under different transport modes further demonstrate clear differences among the service areas of commercial destinations [35,36]. In particular, destination-oriented commercial sites attract visitors from across districts, with demand peaking on weekends and generating pronounced return-travel demand. Accordingly, the surrounding population, point-of-interest counts, or commercial floor area alone may not represent commercial travel demand. These measures may underestimate the potential service areas of large peripheral shopping centers.
The spatial concentration of transit facilities and commercial destinations does not necessarily imply alignment in travel time or service reach. In cities extending along constrained valleys, this relationship requires attention to the distribution of local services, access to shopping destinations, and differences between urban zones. Urumqi’s elongated urban form and clustered commercial development provide a setting in which to examine these relationships.
Drawing on data from 105 subdistricts and 16 shopping centers, this study examines how transit service opportunities and door-to-door accessibility correspond to commercial geography and how their associations with population density, road-network density, and distance to the core business district vary across space.
The contribution is threefold. First, the analysis distinguishes local transit service opportunities from access to shopping destinations within a common spatial framework. Second, it examines zonal alignment in the context of an elongated oasis–valley city with dispersed commercial clusters. Third, model diagnostics and sensitivity analyses assess how the findings vary with operational assumptions and commercial weights, informing zonally differentiated transport planning.
2. Literature Review
Transport accessibility describes the ease with which individuals or groups can reach activity opportunities through the transport system. Its assessment encompasses land-use, transport, temporal, and individual components [4]. Public transport accessibility is commonly measured using cumulative-opportunity, gravity-based, or utility-based approaches. These approaches differ in their treatment of destination opportunities and travel impedance [37]. Cumulative-opportunity measures quantify the opportunities reachable within a specified time or cost threshold. Their intuitive interpretation makes them suitable for threshold-based planning assessments [38]. However, the results depend on the selected threshold, and opportunities within that threshold are generally treated as equally accessible [39]. Comparative research has also shown that measure selection can affect the estimated accessibility impacts of public transport projects [40]. Accessibility measures should therefore be selected according to the research question and interpreted within their respective analytical scope [37].
Previous studies have evaluated public transport accessibility to employment, education, healthcare, commercial facilities, and other urban opportunities [41]. Research on job accessibility shows that transport service coverage is not equivalent to the employment opportunities available to residents. Destination distribution and travel impedance also affect accessibility outcomes [42]. Studies of shopping travel have identified an association between public transport availability and the spatiotemporal flexibility of non-daily shopping trips [30]. Commercial opening hours alter the set of destinations available at a given time. Ignoring them may include opportunities that cannot be used during the assessed period [43]. Time-varying transport services may also interact with facility opening hours to produce variations in shopping accessibility [44]. Assessments of commercial accessibility should therefore specify the destination type, period of availability, and travel impedance rather than relying only on facility counts [43].
This study uses two complementary accessibility measures to distinguish local transit service provision from access to a specific commercial destination. The cumulative transit service-opportunity index quantifies the availability of transit stops and time-specific service frequencies allocated to each subdistrict through the overlap of 300 m stop buffers with its boundary [38]. It therefore represents local transit service opportunities rather than access to a particular shopping center.
A door-to-door public transport isochrone identifies the areas from which a specified commercial destination can be reached within a given total travel-time threshold. Full-process travel time includes access walking, waiting, in-vehicle travel, transfers, and egress walking [45]. Transfer locations and their associated walking and waiting times can also affect destination accessibility [46].
Commercial-opportunity scores are used separately to distinguish the relative potential attractiveness of shopping centers. The scores combine facility floor area with author-assigned relative weights based on destination orientation and service reach [42]. Together, the cumulative transit service-opportunity index and the door-to-door isochrone provide complementary rather than interchangeable evidence on transit accessibility.
Public transport accessibility varies with departure time and service frequency. An estimate based on a single departure time may not represent conditions throughout the assessment period [47]. The temporal sampling interval can also affect cumulative-opportunity estimates, particularly where services are infrequent or transfer connections vary over time [47]. Combining spatial coverage, route provision, and time-specific service levels can help identify mismatches between public transport supply and potential demand [48]. Routing based on static timetables represents scheduled services but does not fully incorporate operational delays or service irregularities [49]. Comparisons between scheduled and observed vehicle movements have identified spatially patterned differences in the resulting accessibility estimates [49]. Real-time operational data can further be used to assess the reliability of reachable opportunities across departure times [50]. Dixit et al. examined passenger travel-time reliability across multimodal public transport journeys [51]. This study compares speed and headway scenarios to quantify the sensitivity of destination coverage to operating conditions.
Urban form is associated with travel patterns and destination accessibility through land-use density, street connectivity, and the spatial distribution of activities [52]. In mountainous cities, topographic constraints restrict the arrangement of roads and developable land and are associated with spatial differences in public transport accessibility [3]. Research on Lanzhou indicates that its elongated built-up area produces a pronounced axial spatial structure along the principal valley corridor [2]. The Urumqi study area is likewise constrained by natural terrain and developable land, although its peripheral clusters and main transport corridors form a distinct spatial configuration. The literature reviewed above has examined accessibility measures, temporal variations in public transport, opening-hour constraints, and restricted urban forms. However, the correspondence between local transit provision and access to dispersed shopping destinations remains insufficiently resolved in the context of oasis–valley urban form. This study therefore combines public transport opportunities, full-process travel time, and oasis–valley urban form within a common analytical framework. Geographically weighted regression examines how associations between the selected factors and accessibility vary across space. In this context, identifying accessibility disparities associated with constrained urban form also informs assessments of spatial equity in public transport provision and the conditions supporting sustainable mobility [41,53]. Xiao et al. incorporated geographical skills mismatch into an analysis of job accessibility in Shanghai [54]. The present study extends this spatial-matching perspective to large shopping destinations, comparing residential distribution, commercial opportunities, and transit provision.
3. Materials and Methods
3.1. Study Area and Data Sources
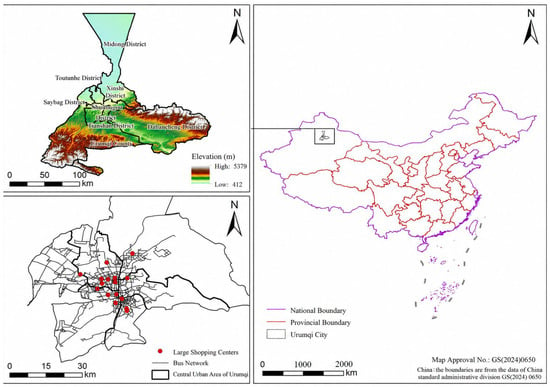
Urumqi is shaped by its oasis boundary, piedmont topography, and north–south urban development axis, and its central urban area has a pronounced spatial structure combining an urban axis and peripheral clusters. This topographically constrained urban form shares features with the “morphological constraint–transport organization–opportunity accessibility” relationship emphasized in previous studies of public transport systems in mountainous cities. At the same time, large shopping centers and destination-oriented commercial facilities are increasingly located in peripheral areas. Commercial supply near residential locations cannot fully explain the spatial range and spatiotemporal flexibility of shopping activities. Public transport service conditions further affect residents’ ability to reach commercial opportunities across districts. Improved public transport networks can also increase accessibility equity and reduce the environmental costs of transport [55,56]. The outward expansion of commercial functions and continuing adjustments to the transit network may therefore create new challenges for spatial alignment. Figure 1 shows the location, topography, and extent of the central urban study area.
Figure 1.
Location and spatial context of the study area: (a) location of Urumqi in China; (b) topography and administrative divisions of Urumqi; (c) study-area boundary, bus network, and locations of large shopping centers in central Urumqi.
The analysis uses public transport, road, population, and commercial-facility data for 2024 (Table 1). Transit stops, routes, and available operating attributes were obtained through the Amap application programming interface (API). The road network was extracted from OpenStreetMap (OSM) in October 2024. Population data were obtained from CnOpenData’s 2024 gridded urban population dataset at a spatial resolution of 250 m × 250 m. Grid-based population counts were aggregated to the 105 subdistricts to calculate the population density for spatial and regression analyses. The commercial dataset, compiled in September 2024, comprises the locations, floor areas, and business formats of 16 shopping centers. Retail formats were classified according to the Chinese recommended national standard Classification of Retail Formats (GB/T 18106–2021) [57].
Table 1.
Data sources.
3.2. Methods
3.2.1. Analytical Framework
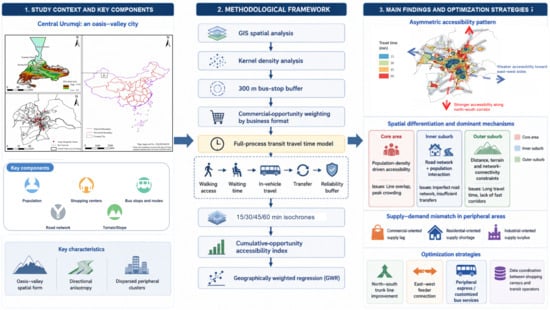
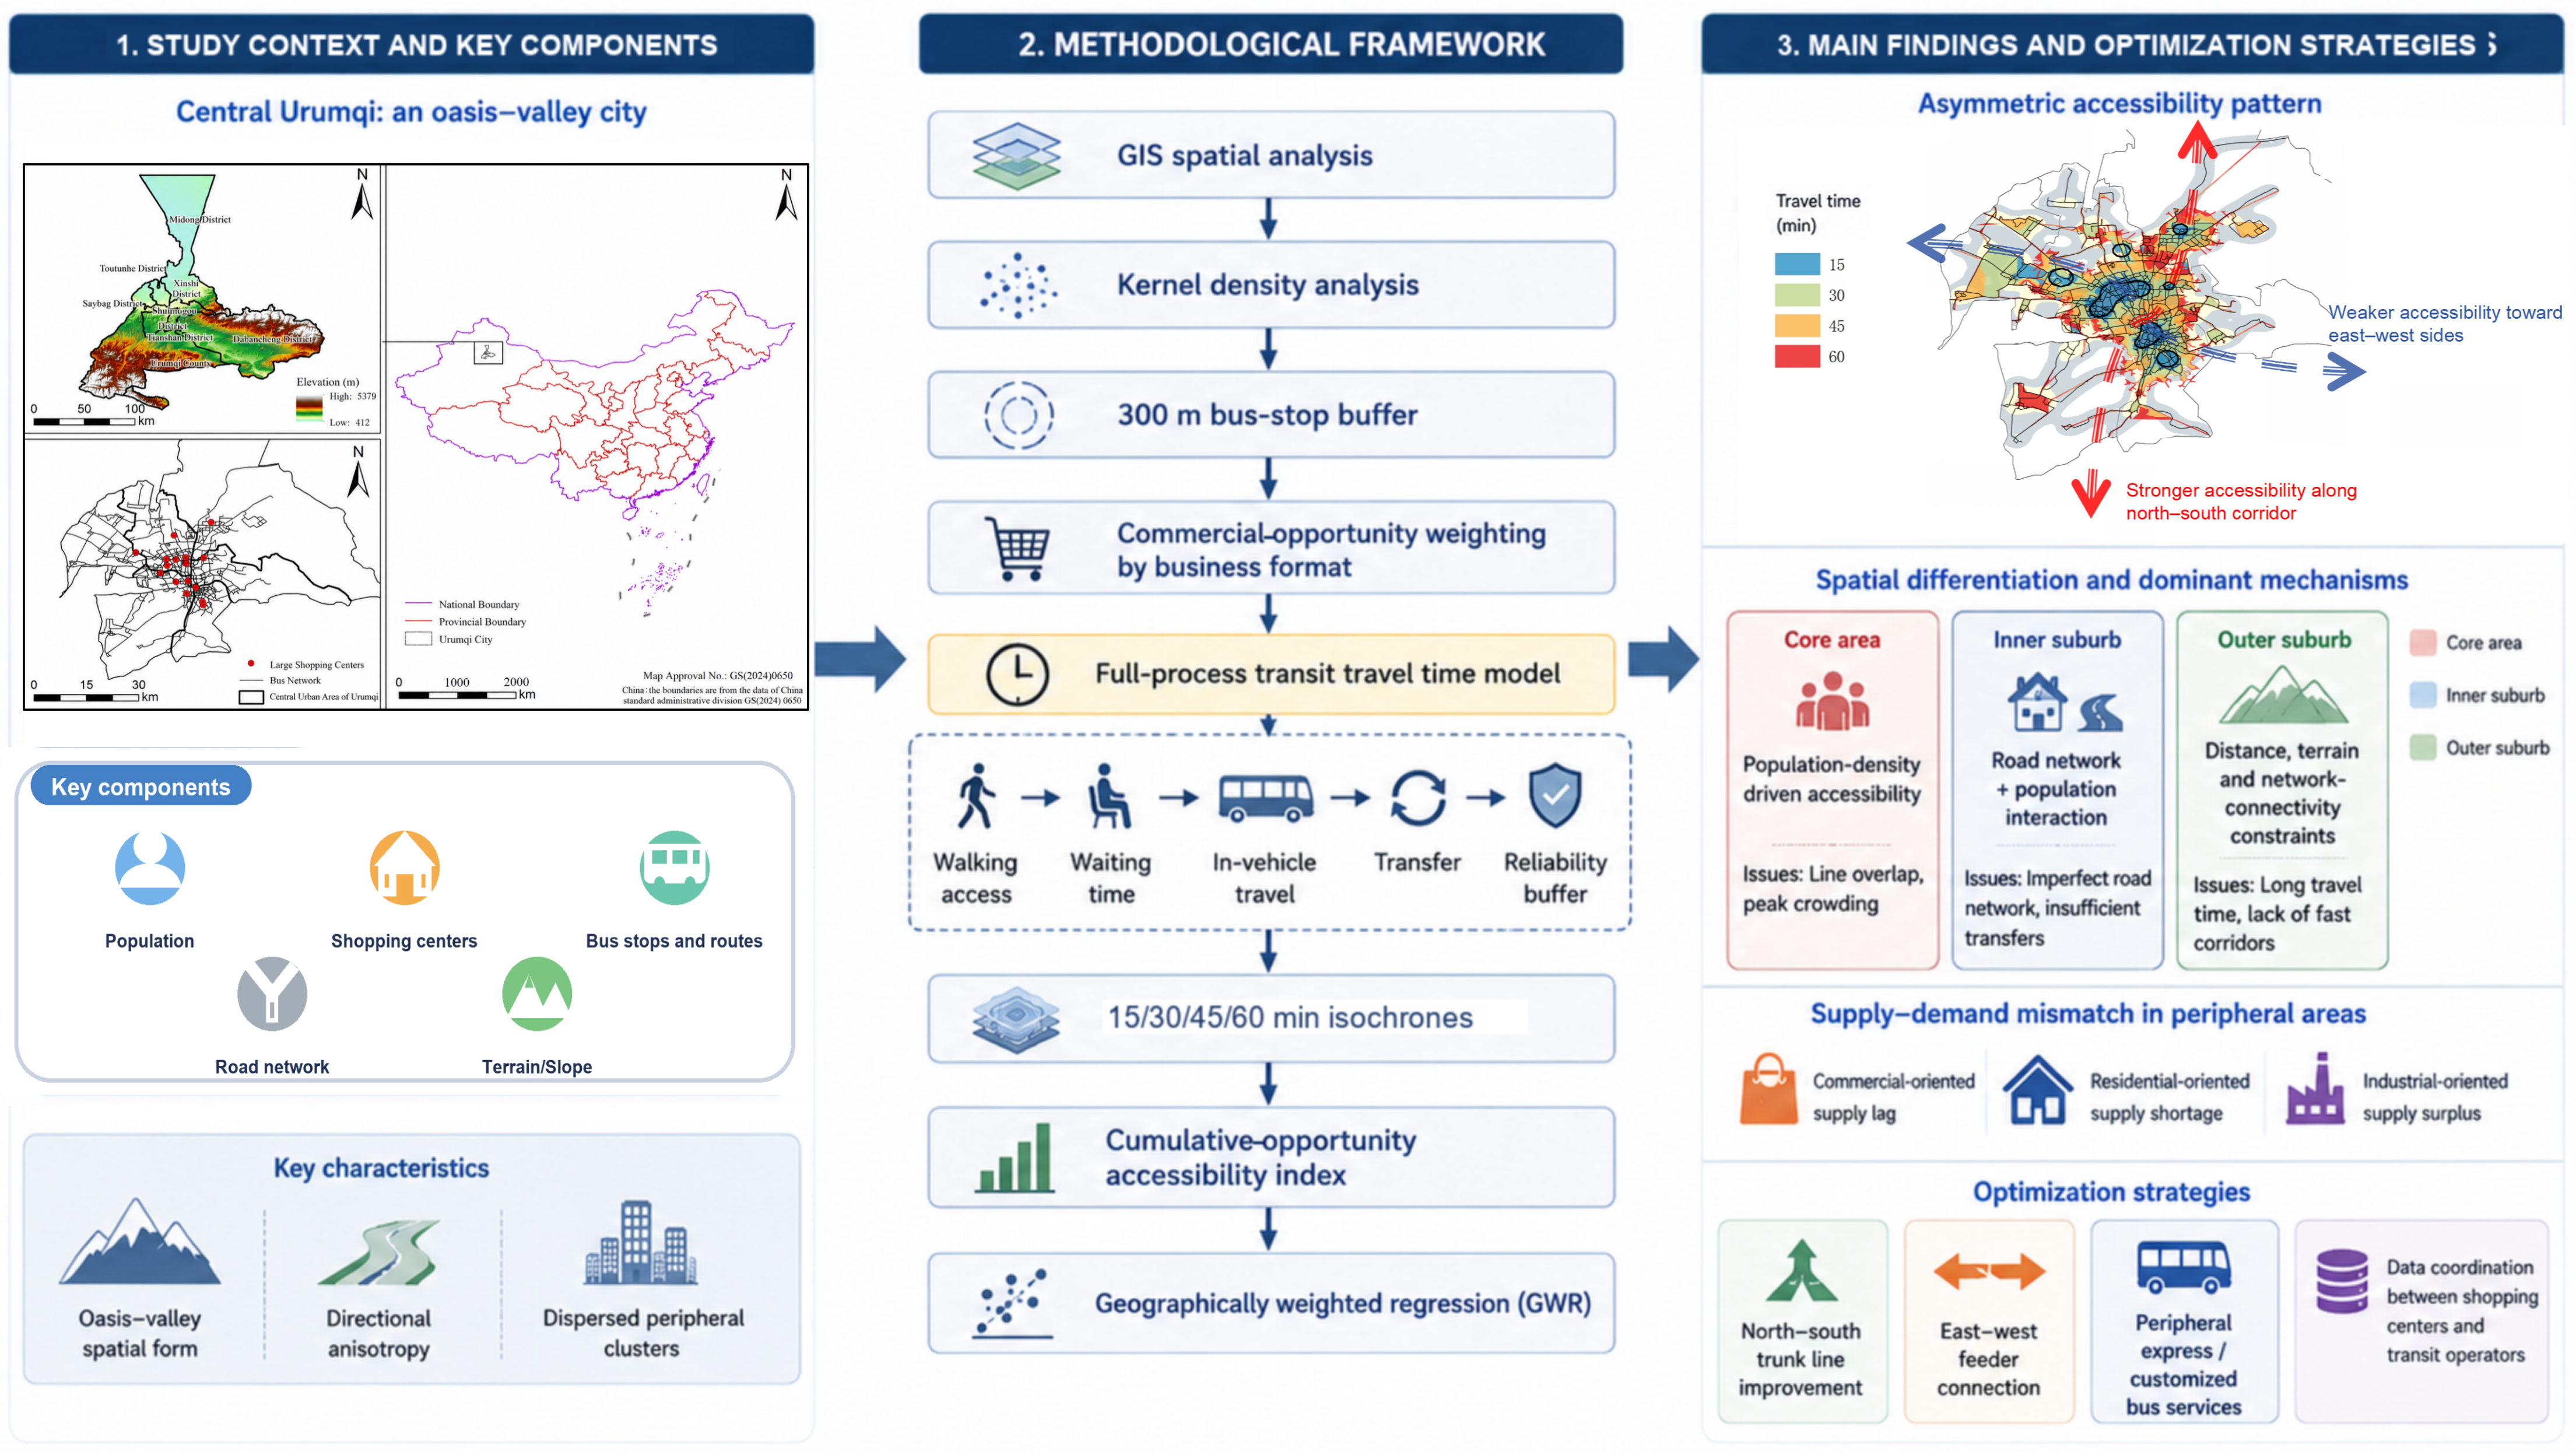
GIS-based spatial analyses were conducted using ArcGIS 10.8 (Esri, Redlands, CA, USA).To avoid substituting a single indicator for the complexity of transit journeys, the analysis follows four stages. These comprise identifying supply patterns, measuring temporal accessibility, identifying spatial mismatches between transit provision and the distributions of population and commercial opportunities, and interpreting spatial heterogeneity. First, kernel density analysis identifies concentrations of stops, routes, population, and commercial facilities. A 300 m radius buffer around each transit stop represents the area from which residents can reach services on foot. Second, full-process transit travel time is used to construct isochrones for major commercial centers. Third, cumulative transit service opportunities are compared with the spatial distributions of population and commercial facilities to identify differences in provision. Finally, geographically weighted regression (GWR) is applied to examine the spatial heterogeneity of associations between accessibility and road-network density, population density, and distance to the core business district. Figure 2 presents the overall analytical process.
Figure 2.
Analytical framework and methodological workflow of the study.
3.2.2. Kernel Density Analysis
Shopping-center floor area represents the scale of commercial opportunities, while business format distinguishes destination orientation and service reach [10,30]. Facilities were classified according to GB/T 18106–2021 [57]. The authors assigned relative weights on the basis of these characteristics, and the commercial-opportunity score was calculated as follows:
where Cj is the commercial-opportunity score of shopping center j, Mj is its commercial floor area, and ωj is the relative business-format weight. The classification standard supplies the format categories; the numerical weights were assigned by the authors for this study. Outlet centers receive greater weight for their destination orientation and wider service reach, followed by metropolitan or youth-oriented centers, regional or community facilities, and early small-format establishments (Table 2). Six alternative schemes test the sensitivity of facility rankings to these assignments. The scores describe relative commercial opportunities and do not measure observed patronage or passenger flows.
Cj = Mj × ωj
Table 2.
Baseline business-format weights for the 16 shopping centers.
Kernel density analysis is used to measure the spatial concentration and dispersion of geographic features such as transit stops and population. Each feature is treated as an observation in a spatial point distribution, and the kernel density estimator is
where K is the Gaussian kernel function, h is the bandwidth, and n is the total number of transit stops. The estimator calculates the stop density across the study area and identifies the concentration of transit stops in the core and their sparse distribution in peripheral areas.
3.2.3. Transit-Stop Buffer Analysis
A 300 m Euclidean buffer was constructed around each transit stop to calculate the spatial overlap between stop coverage and subdistrict boundaries. This distance follows the public bus-stop service-area convention in the Standard for Urban Comprehensive Transport System Planning (GB/T 51328–2018) [58]. At a walking speed of 1.2 m s−1, 300 m corresponds to approximately 4.2 min. Buffer and isochrone approaches provide complementary representations of proximity and travel-time coverage [59,60]. The stop buffer is defined as:
where Bi is the buffer around stop i, d(x, xi) is the Euclidean distance between location x and stop i, and r is the 300 m radius. Buffer intersections with subdistrict boundaries provide the area weights used in the cumulative service-opportunity index.
Bi = {x : d(x,xi) ≤ r}, r = 300 m
3.2.4. Door-to-Door Transit Accessibility
Conventional buses, bus rapid transit (BRT), and Metro Line 1 are included in both the isochrone analysis and the cumulative service-opportunity index. Commercial centers serve as destinations for the 15, 30, 45, and 60 min isochrones. Door-to-door (full-process) travel time combines walking, initial and transfer waiting, in-vehicle travel, transfer penalties, and an operating buffer. This formulation follows travel-chain approaches that consider access, waiting, and transfers together [61,62,63] and temporal accessibility research that distinguishes operating conditions from spatial coverage [64].
Under the random-arrival assumption, expected waiting time equals half the corresponding headway. Bus speed is set to 25 km h−1 in the baseline scenario and 20 or 30 km h−1 in the sensitivity scenarios. Headways are set to 6, 12, and 20 min, with 12 min as the baseline. The remaining parameters and travel-time thresholds are reported in Table 3. Total travel time is calculated as:
where Tsj(t0) is the door-to-door transit travel time from origin s to commercial destination j at departure time t0; twalk is the walking component; tiv,i is the in-vehicle time on segment i; twait is the total initial and transfer waiting time; ntr is the number of transfers; λ is the penalty per transfer; and trel is the operating buffer. Studies of schedule adherence, vehicle delays, and transfer connections show that scheduled accessibility can differ from realized accessibility. Travel-time reliability therefore requires assessment across the complete journey [49,50,51]. For this study, the operating buffer provides a uniform allowance for operational variability, set to the greater of 5% of the in-vehicle time and 2 min (Table 3). The same rule is applied across scenarios to compare coverage under different bus speeds and headways.
Table 3.
Door-to-door travel-time parameters and operational scenarios.
Cumulative coverage is calculated as the number of qualifying grid cells within the reporting area multiplied by 0.0225 km2 per cell. The reporting area is the intersection of the 500 m stop-buffer union and the study boundary; the same area is used in every scenario.
3.2.5. Cumulative Transit Service-Opportunity Index
The cumulative transit service-opportunity index measures local public transport provision by combining service frequencies at stops with the proportion of each stop buffer assigned to a subdistrict. It complements destination isochrones by describing the services available locally. For subdistrict u, the raw index, area weight, and maximum-normalized index are defined as:
where Nᵤ is the number of stops whose 300 m buffers intersect subdistrict u; Fi(t) is the service frequency at stop i during the baseline off-peak period; Bi is the stop buffer; and Uᵤ is the subdistrict boundary. The denominator of Siᵤ is the area of the entire stop buffer. Maximum normalization places Aᵤ on a 0–1 scale, with larger values indicating more cumulative transit service opportunities.
3.2.6. Geographically Weighted Regression (GWR)
Geographically weighted regression (GWR) estimates spatial variation in the relationships between transit accessibility and selected built-environment characteristics. Unlike ordinary least squares (OLS), GWR allows coefficients to vary by location. Related spatial regression approaches have been used to investigate scale-dependent associations and transit ridership [65,66,67]. The dependent variable is the maximum-normalized service-opportunity index Aᵤ, without logarithmic transformation. The three explanatory variables are road-network density (km km−2), population density (persons km−2), and distance to the core business district. Road-network density is transformed using ln(1 + x); population density and distance use ln(x). Each transformed predictor is Z-standardized.
The local regression model is specified as:
where βk(u) is the coefficient at subdistrict u, and εᵤ is the error term. Z[·] denotes Z-standardization. An adaptive bisquare kernel defines the local weights, with the bandwidth selected by minimizing the corrected Akaike information criterion (AICc). The selected bandwidth is 45 nearest neighbors. Model evaluation compares R2, adjusted R2, AICc, local condition numbers, and residual spatial autocorrelation between OLS and GWR.
3.2.7. Correlation and Spatial Autocorrelation Analysis
Pearson correlations and Spearman rank correlations are calculated for the 105 subdistricts. The lower triangle of the correlation matrix reports Pearson correlations after transformation: ln(A), ln(population density), ln(distance), and ln(1 + x) for stop and road-network densities (slope remains untransformed). The upper triangle reports Spearman correlations of the original variables. All tests are two-sided. Variance inflation factors (VIFs) are calculated for the three transformed regression predictors.
First-order Queen contiguity defines spatial neighbors as subdistrict polygons sharing an edge or vertex. The baseline spatial weights are binary and not row-standardized. The network contains 290 undirected edges, with a mean of 5.52 neighbors (range 1–15) and no isolated units. Global Moran’s I is calculated for A and for the OLS and GWR residuals, with two-sided pseudo-p values based on 999 random permutations. For n = 105, the null expectation is E(I) = −1/(n − 1) = −0.0096. Row-standardized weights provide a sensitivity check.
3.2.8. Urban Morphology and Directional Accessibility
The north–south urban corridor provides a reference axis for interpreting the direction of the commercial-center isochrones. Their longitudinal extension and transverse coverage are compared with the distribution of peripheral clusters. Slope is used as a morphological background variable and in exploratory correlation analysis. Studies of Lanzhou’s river-valley morphology and Taiyuan’s transport organization provide regional context for this comparison [2,68].
4. Results
4.1. Spatial Patterns and Accessibility to Commercial Destinations
Using the core commercial centers identified through kernel density analysis as spatial references, this section examines the alignment among population, commercial opportunities, and transit supply. It considers three dimensions: commercial-opportunity concentration, transit-supply coverage, and full-process travel time. The analysis provides a basis for the subsequent assessment of spatially varying associations.
4.1.1. Spatial Patterns of Commercial Opportunities, Population, and Transit Supply
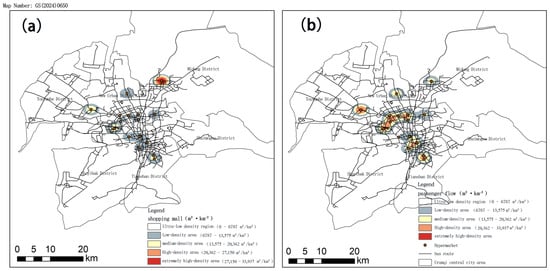
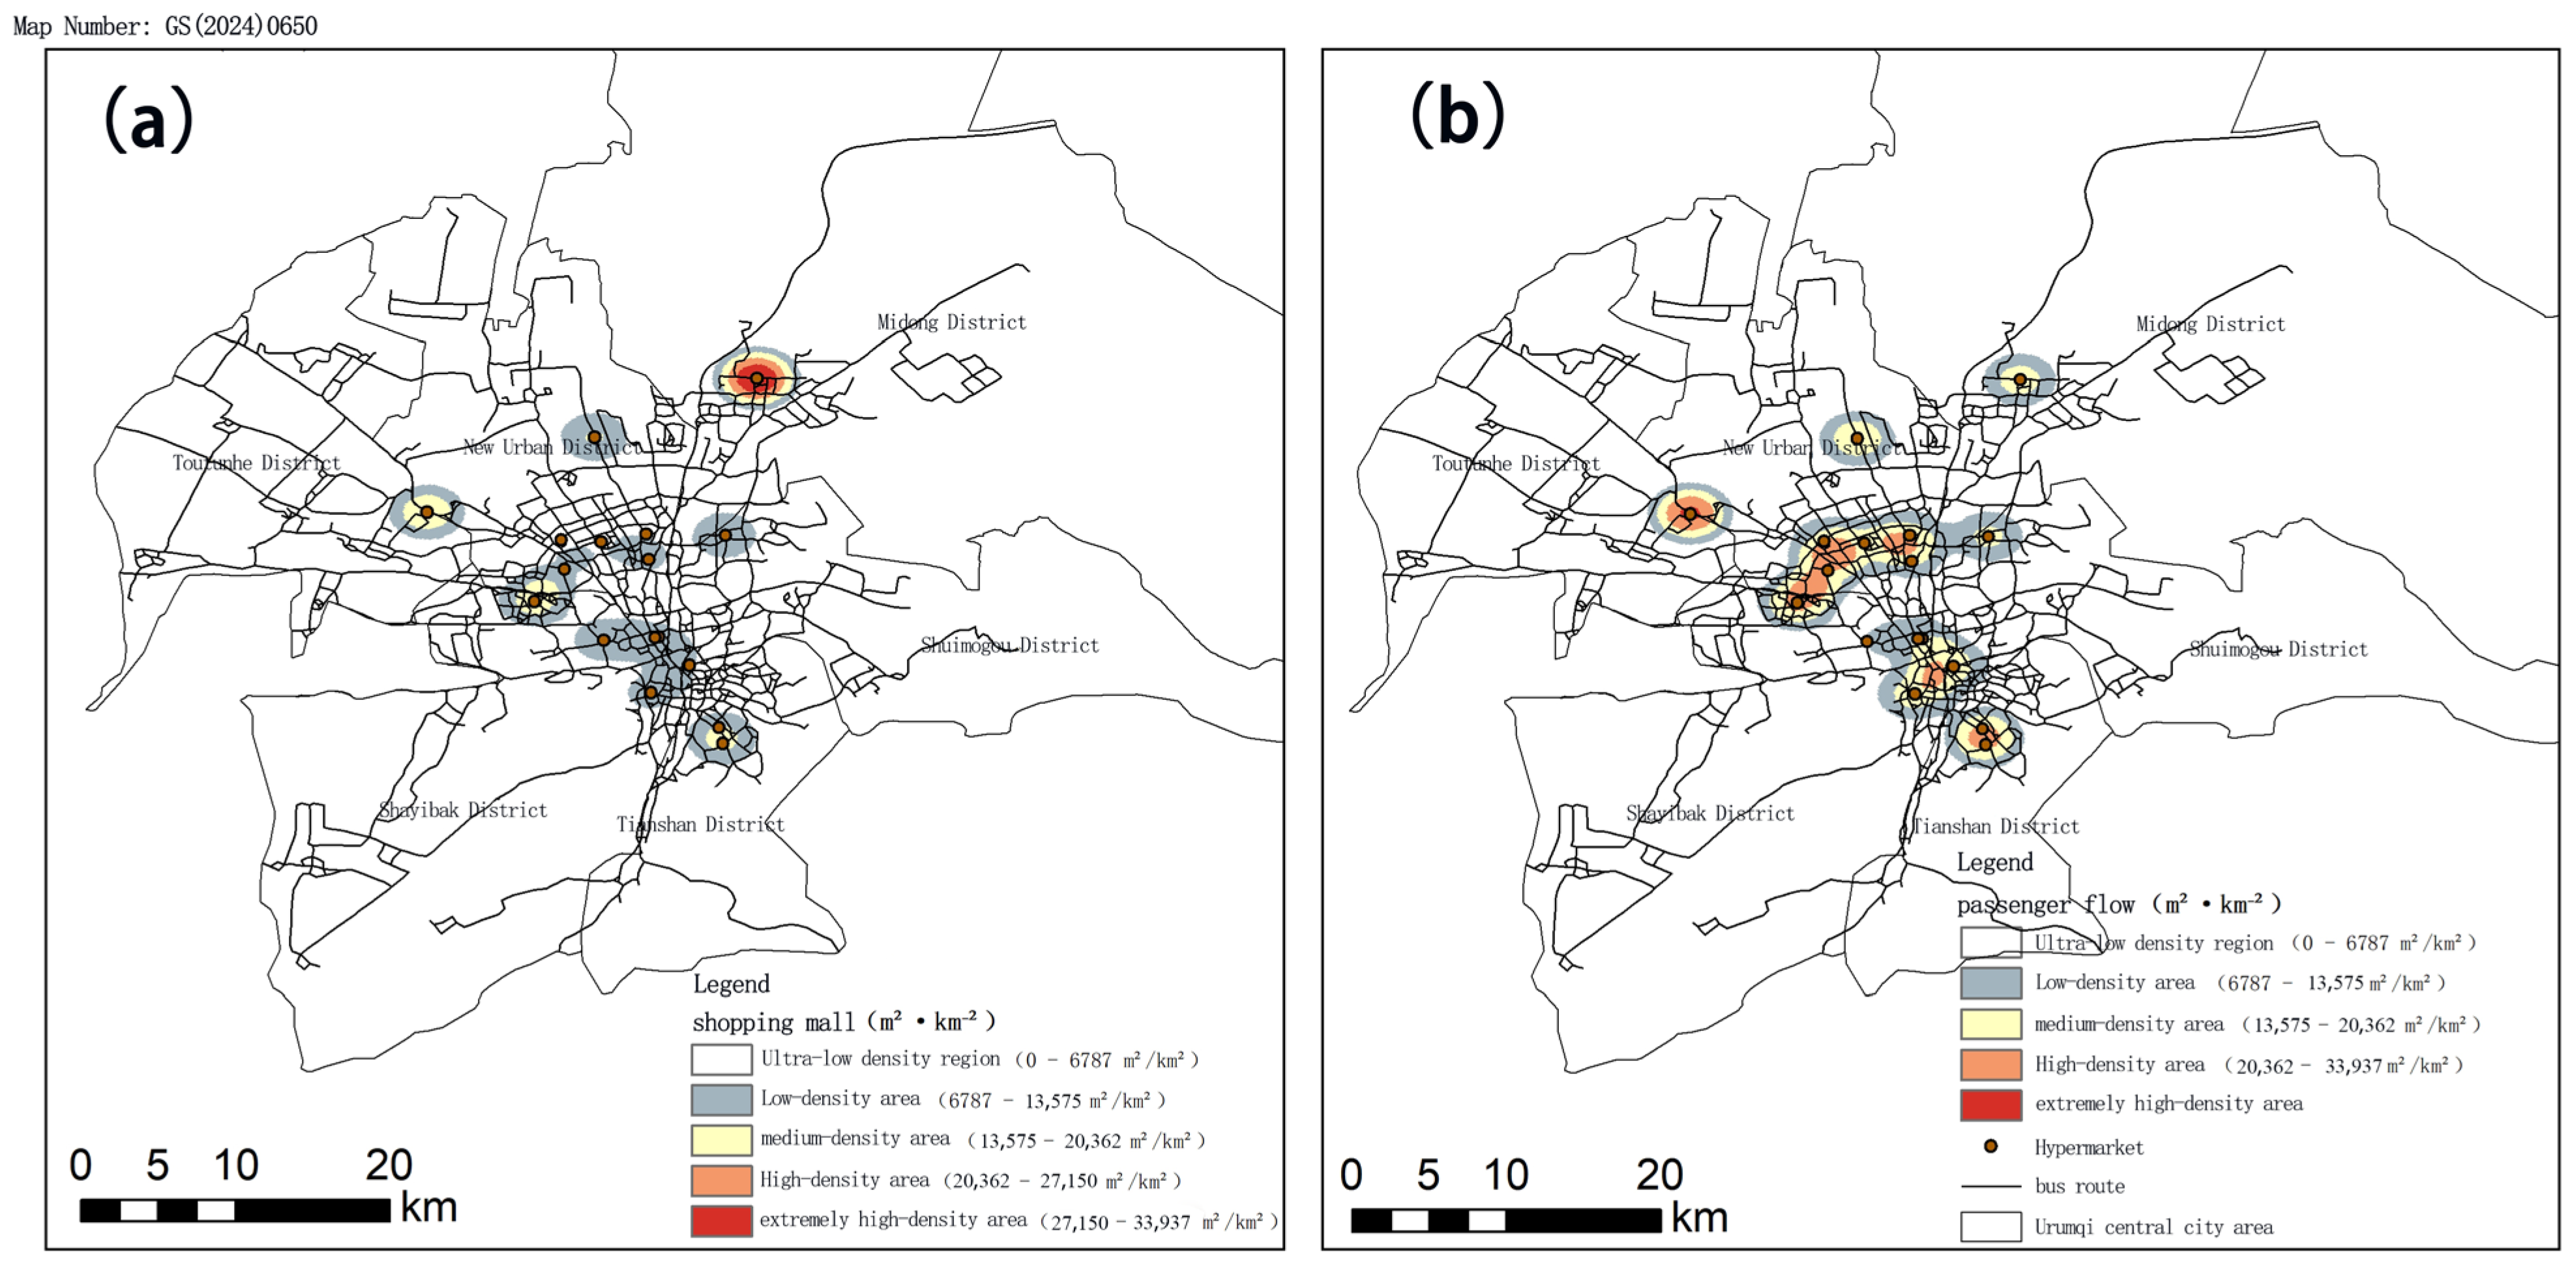
Commercial opportunities, population, and transit resources exhibit pronounced central concentration and peripheral differentiation. Figure 3a shows the spatial distribution of commercial floor-area density. Weighting commercial floor area by business format yields a commercial-opportunity density pattern comprising one primary center and three secondary centers (Figure 3b). The primary core business district lies at the boundary between Saybag District and Tianshan District. The secondary centers are located around Wuyue Plaza in Midong District, in the Sasseur Outlets–Economic Development Zone Wanda area of Toutunhe District, and along Beijing Road in Xinshi District. The business-format adjustment increased the relative weight of destination-oriented commercial facilities such as outlets. Their potential service areas therefore cannot be inferred solely from nearby population or commercial floor area.
Figure 3.
Spatial distribution of commercial opportunities in central Urumqi: (a) commercial floor-area density of large shopping centers; (b) business-format-weighted commercial-opportunity density. Colors from gray to red indicate increasing density, and orange points mark the locations of large shopping centers.
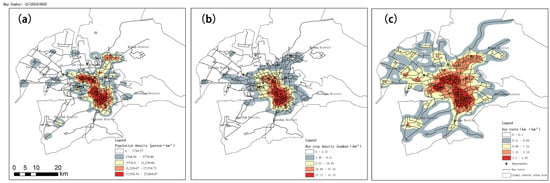
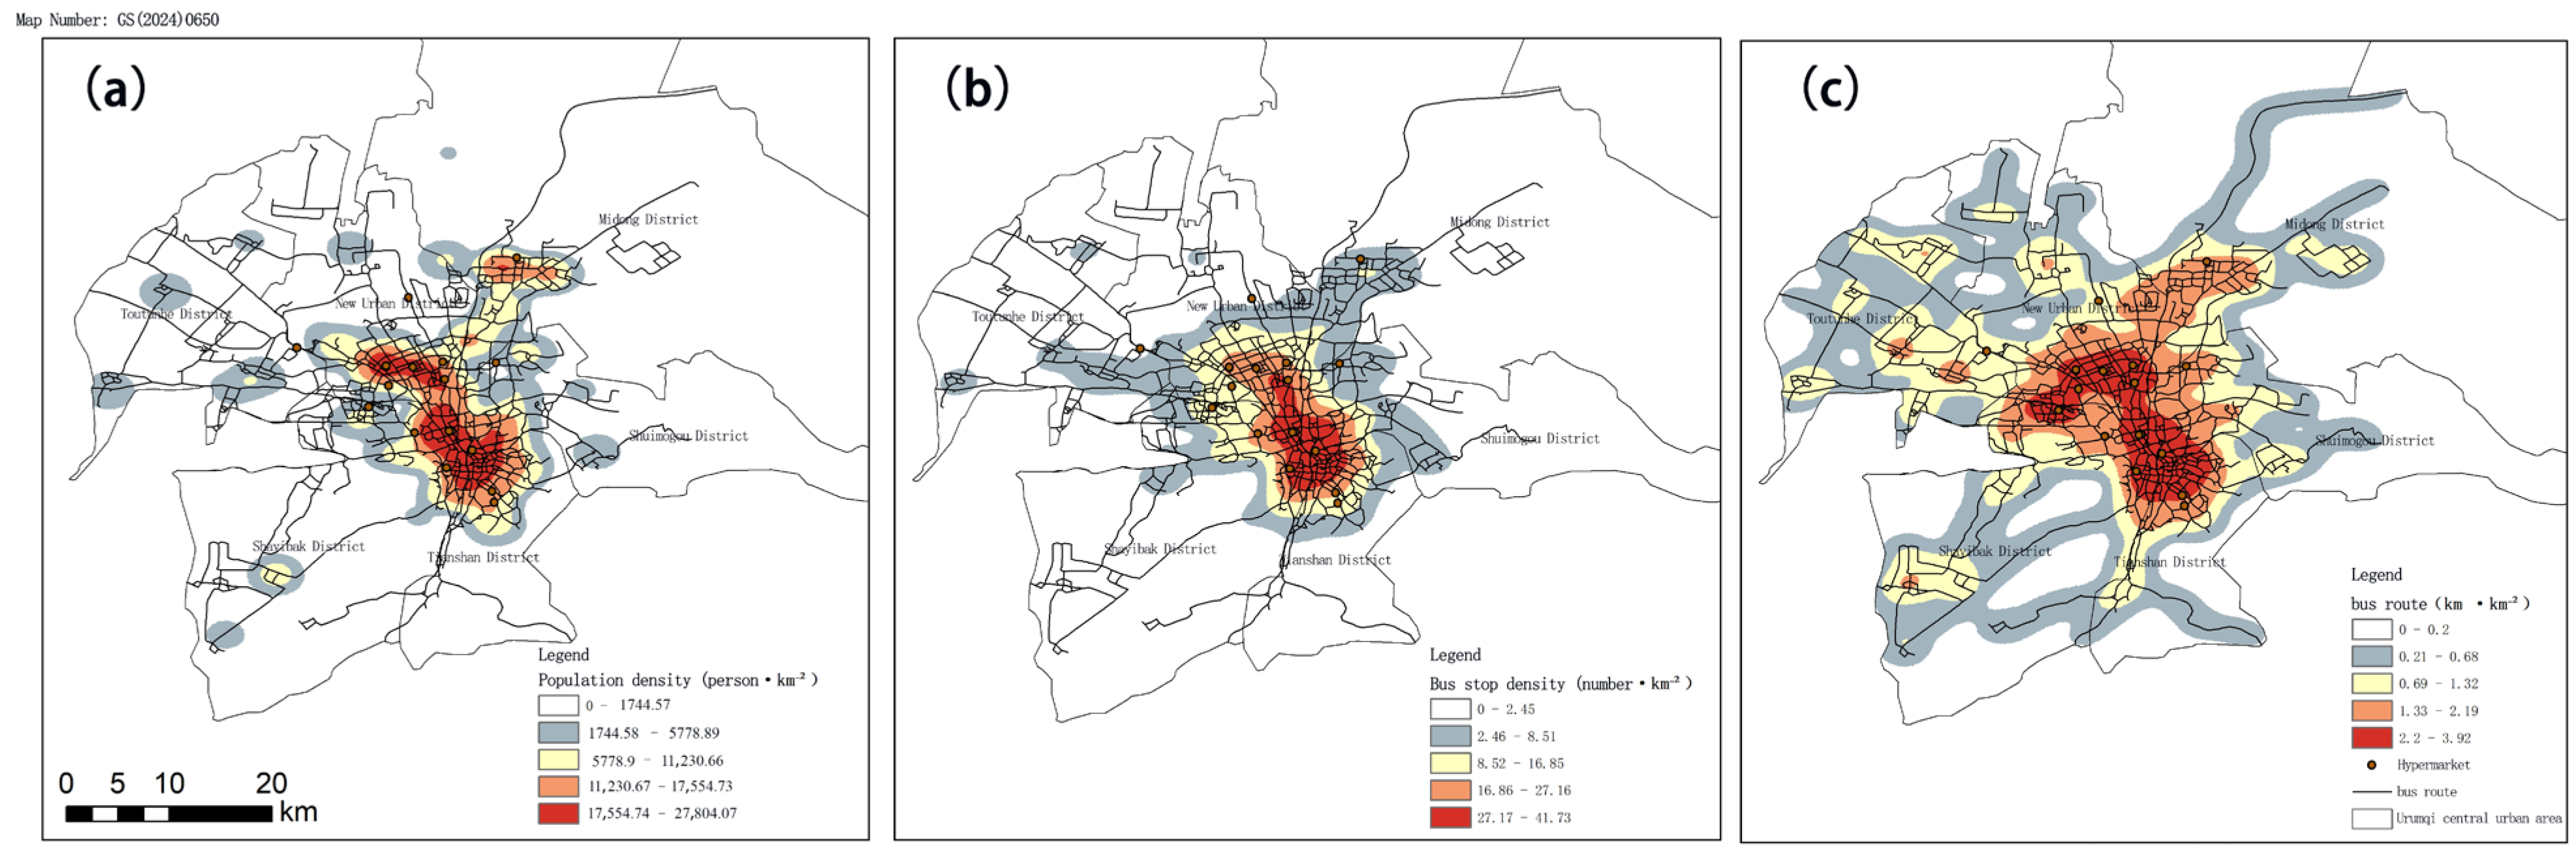
As shown in Figure 4a–c, population density, transit-stop density, and bus-route density are strongly aligned spatially. The population is concentrated in the urban core, with scattered clusters in peripheral areas. Population density is positively correlated with stop density and road-network density, with Pearson correlations of 0.804 and 0.780, respectively (Table 4). Road-network density is distinct from the bus-route density mapped in Figure 4c. Stop density in the core reaches 27–41 stops km−2, and route density reaches 2.20–3.92 km km−2. In most peripheral areas, the stop density is below 8.5 stops km−2, and the route density is below 0.68 km km−2. Transit facilities therefore broadly correspond to population concentration. Local mismatches nevertheless remain among peripheral commercial subcenters, emerging residential areas, and the existing transit network. These mismatches require further evaluation by incorporating full-process travel time.
Figure 4.
Spatial distributions of population and public transport resources in central Urumqi: (a) residential population density; (b) bus-stop density; and (c) bus-route density. Colors from gray to red indicate increasing density; orange points denote large shopping centers, and black lines denote bus routes.
Table 4.
Correlations among accessibility and spatial characteristics (n = 105).
4.1.2. Door-to-Door Accessibility and Local Spatial Mismatches
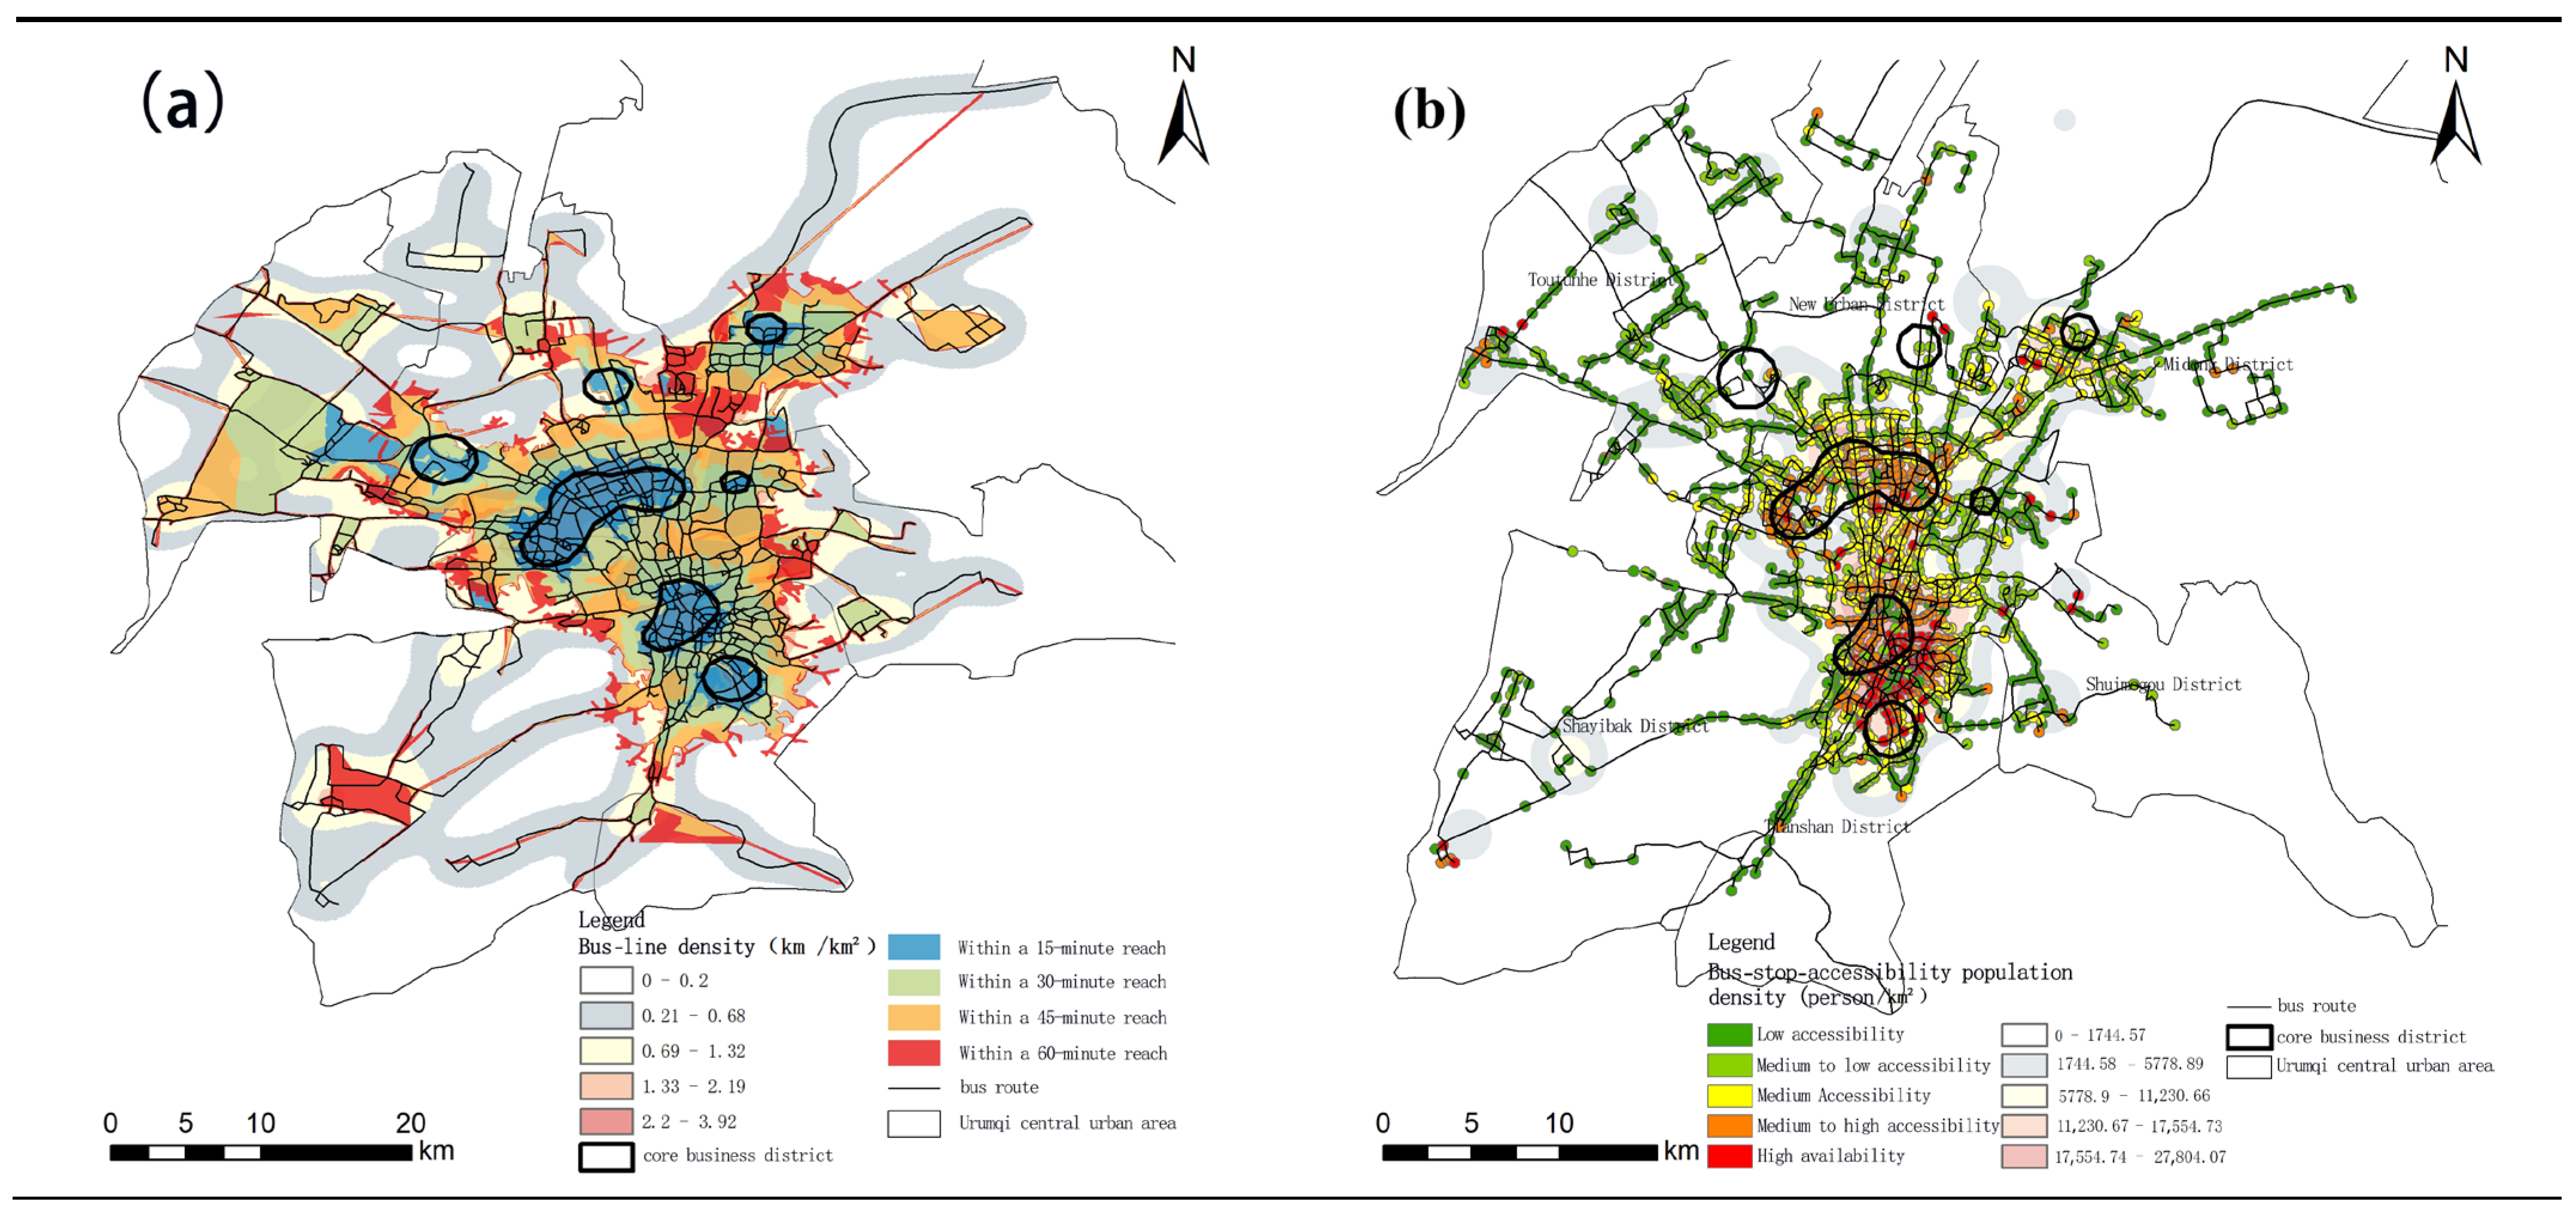
The full-process transit isochrones extend along the main north–south corridors and contract toward the eastern and western sides. They therefore do not form homogeneous concentric rings (Figure 5a). The 15 min catchment is concentrated mainly around the primary core business district. The 30 min catchment extends along major north–south corridors such as Beijing Road and Youhao Road. The main clusters in Midong District and Toutunhe District generally require 45–60 min to reach. Speed and headway sensitivity scenarios quantify changes in cumulative coverage under the four travel-time thresholds (Section 4.3.1).
Figure 5.
Spatial alignment of public transport supply, accessibility, and population: (a) bus-route density overlaid with the 15, 30, 45, and 60 min isochrones of the core commercial centers; (b) cumulative transit service opportunities overlaid with population density. In (a), the colored bands indicate full-process transit travel times; in (b), green-to-red symbols indicate increasing bus-stop accessibility, while the background shading represents population density.
As shown in Figure 5b, the overlay of population, commercial opportunities, and transit accessibility reveals three localized mismatches within the generally aligned study area. First, relatively limited transit provision in residentially dominated areas is found mainly in the Hemachuan New Area and western Midong District, where residential concentrations coincide with relatively limited transit coverage. Second, transit provision is relatively low compared with commercial opportunities around the convention and exhibition area, Economic Development Zone Wanda Plaza, and Sasseur Outlets. These locations have relatively high commercial-opportunity weights and limited cross-cluster transit connections. Third, transit provision is not fully aligned with the size of the resident population in some industrial parks in northern Toutunhe District and eastern Midong District. These areas have relatively small resident populations but some transit supply.
Comparisons by commercial type show different spatial relationships between transit supply and commercial facilities serving core, regional, and destination-oriented markets. Transit resources are relatively concentrated around core-serving facilities; cross-cluster connections are comparatively weak for regional-serving facilities; and destination-oriented facilities involve longer journeys, transfers, and cross-district travel. These results distinguish the spatial alignment of transit provision with core-serving, regional-serving, and destination-oriented commercial facilities.
4.2. Spatial Associations and Model Diagnostics
Population density is strongly and positively correlated with stop density and road-network density, with Pearson coefficients of 0.804 and 0.780, respectively (Table 4). By contrast, the correlations of A with population, stop, and road-network densities are weaker (0.189, 0.203, and 0.210). Infrastructure density and cumulative service opportunities thus capture different aspects of provision; the latter also incorporates frequency and the allocation of stop-buffer coverage.
The VIFs are 2.67 for population density, 3.01 for road-network density, and 1.95 for distance to the core business district. Global Moran’s I for A is −0.019 (p = 0.70), indicating no statistically significant global spatial autocorrelation. Row-standardizing the spatial weights leaves the significance conclusions unchanged.
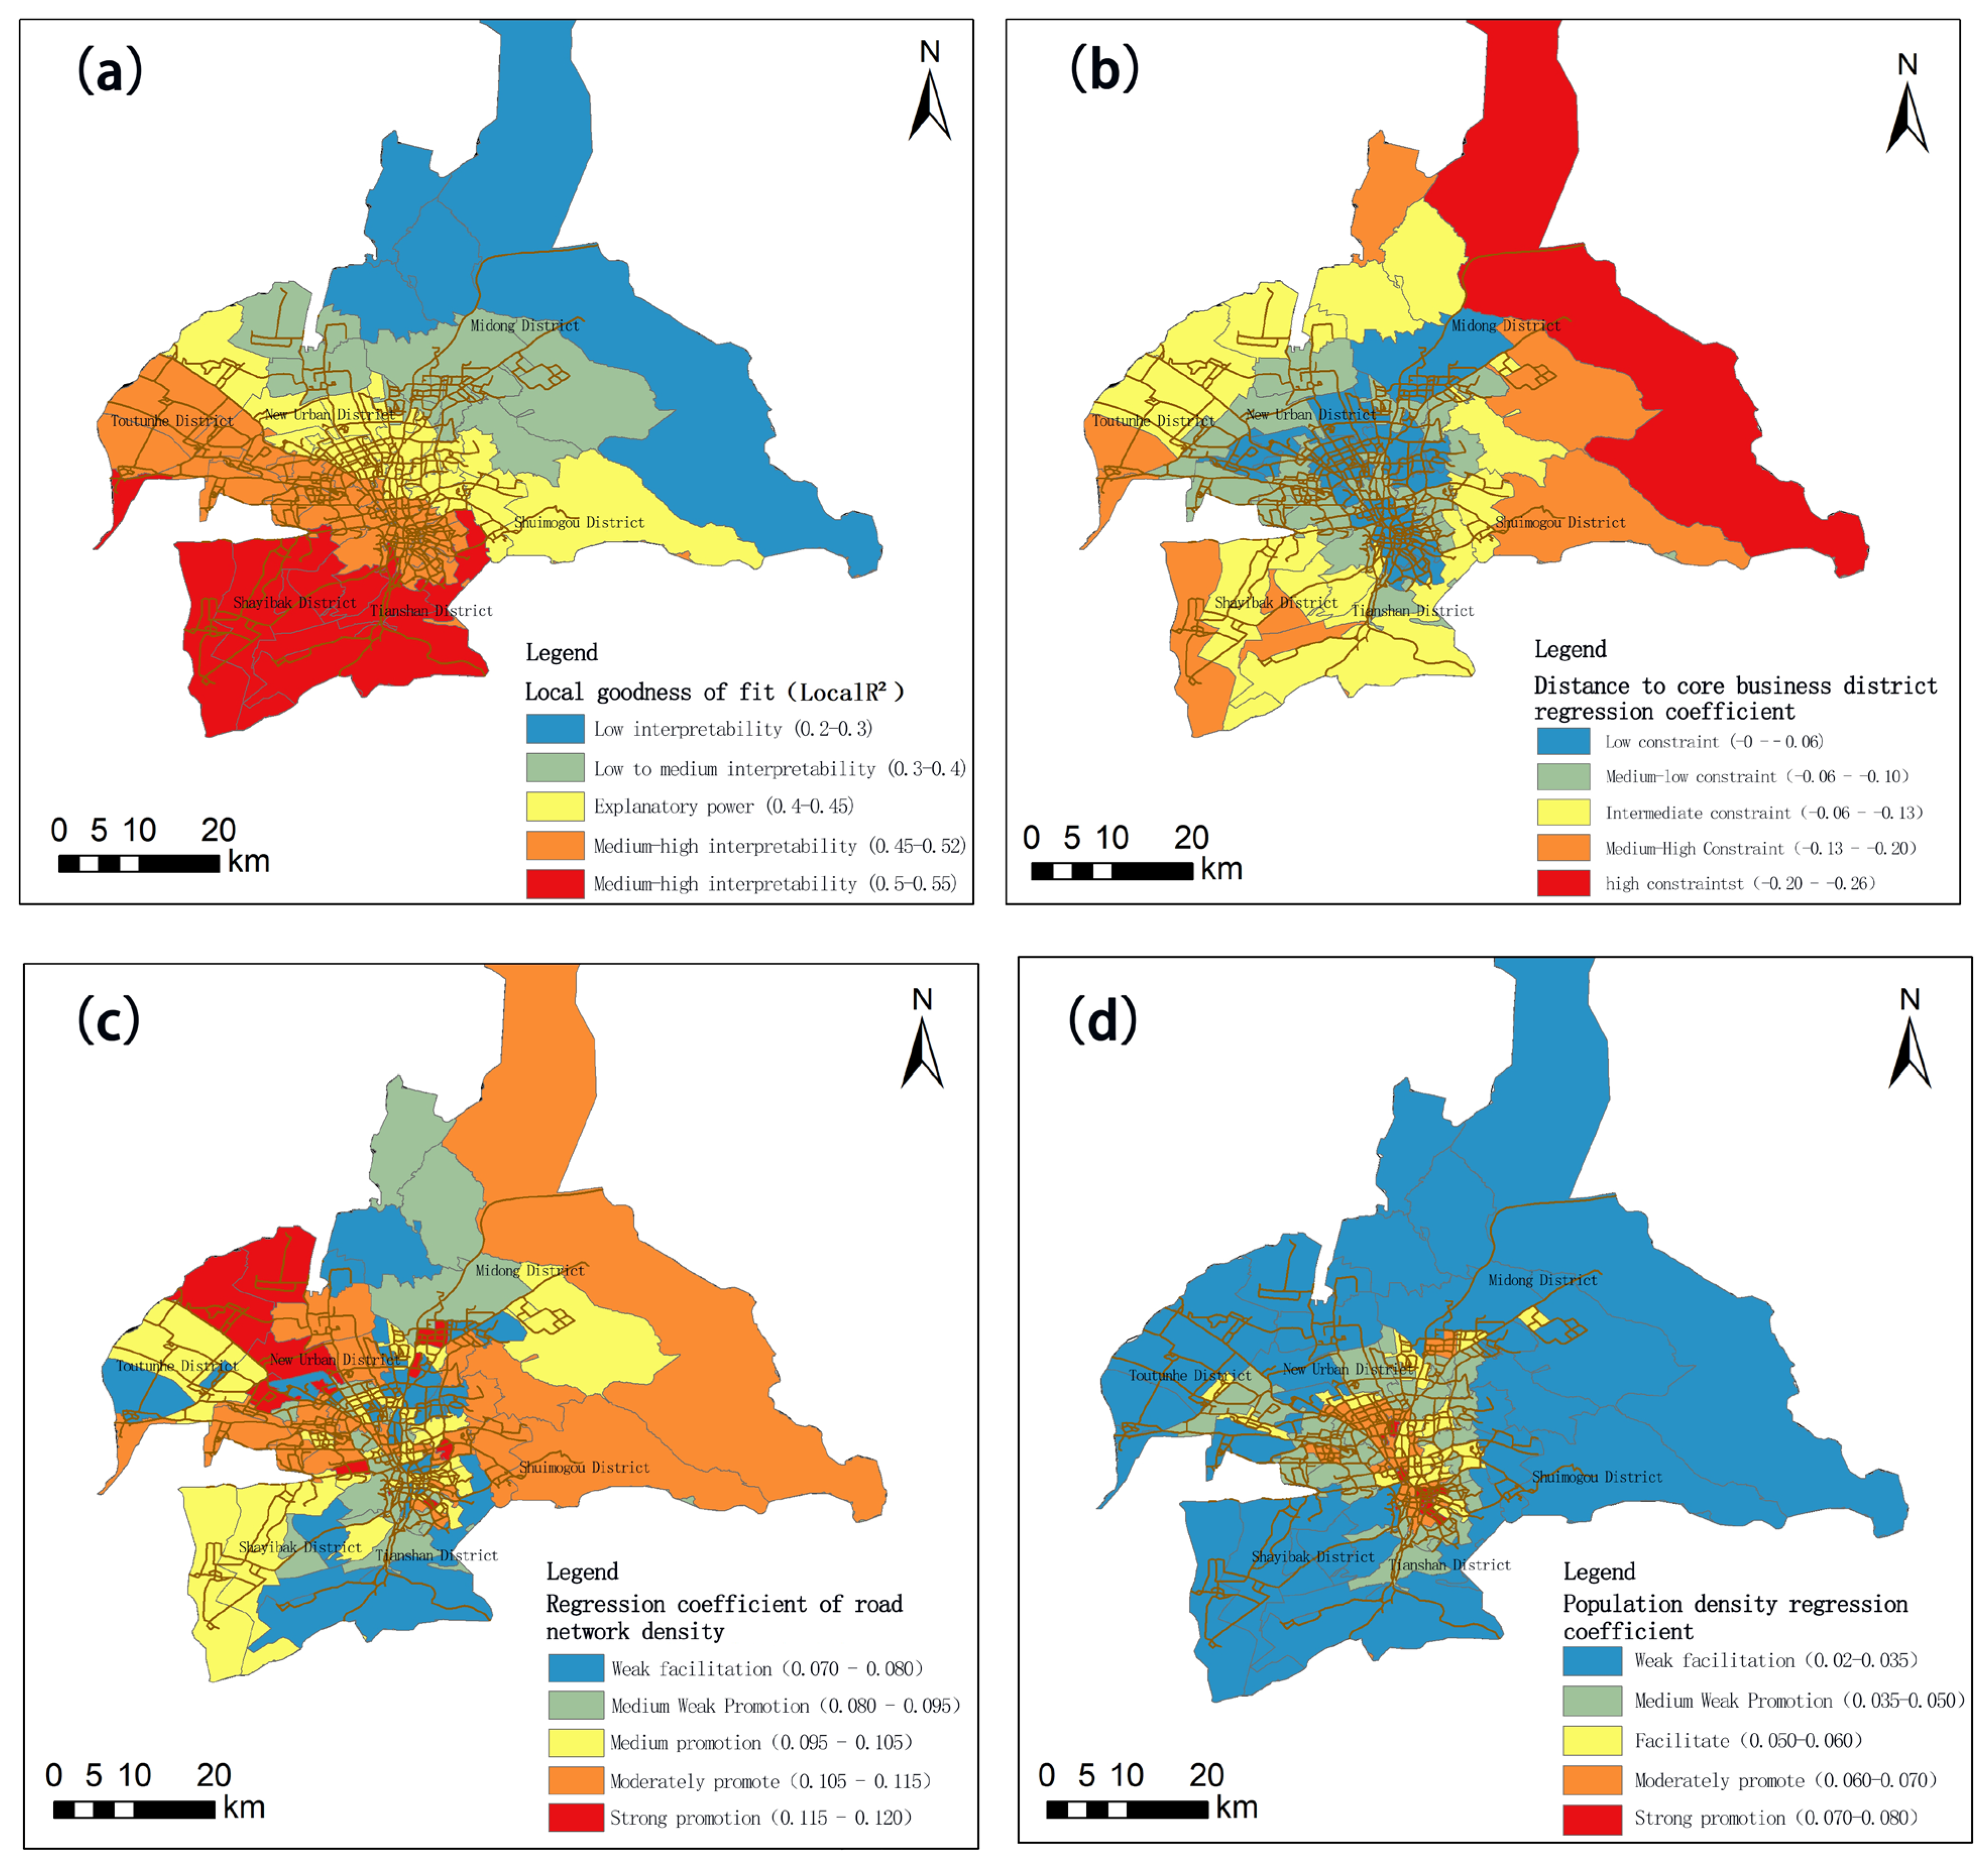
GWR provides a better fit than OLS, increasing the adjusted R2 from 0.086 to 0.278 and reducing the AICc by 7.6 (Table 5). OLS residuals exhibit positive spatial autocorrelation (Moran’s I = 0.081, p = 0.041), whereas GWR residuals do not show a statistically significant pattern (I = −0.018, p = 0.55). The local R2 ranges from 0.26 to 0.55, with a median of 0.36. The median and maximum local condition numbers are 5.1 and 10.9, respectively; all values are below 15. Local fit is relatively high in the core and lower in northern Midong District, eastern Shuimogou District, and western Toutunhe District (Figure 6a).
Table 5.
OLS and GWR model diagnostics.
Figure 6.
Spatially varying results of the geographically weighted regression model: (a) local goodness of fit (local R2); (b) regression coefficient for distance to the core business district; (c) regression coefficient for road-network density; and (d) regression coefficient for population density. Colors represent the class intervals reported in the corresponding panel legends and should not be interpreted as a common scale across panels.
The local regression coefficient for distance to the core business district ranges from −0.26 to 0 and is negative across most locations (Figure 6b). The association is stronger in eastern Shuimogou District and northern Midong District. In these areas, greater distance from the core business district generally corresponds to lower transit accessibility.
The local regression coefficients for road-network density and population density range from 0.070 to 0.120 and from 0.020 to 0.080, respectively (Figure 6c,d). Both variables are positively associated with transit accessibility, but their spatial patterns of association differ. The association with road-network density is more pronounced in areas with relatively poor road connectivity, whereas the association with population density is more evident in the Tianshan–Saybag core. Overall, transit accessibility has different spatial associations in the core, inner suburbs, and peripheral areas. In the core, it is associated mainly with population concentration. In inner suburbs, it is associated with both population density and road-network conditions. In peripheral areas, the distance coefficient is more pronounced in eastern Shuimogou District and northern Midong District.
Taken together, the spatial distribution and GWR results reveal two concurrent gradients in Urumqi’s transit accessibility. These are axial extension versus transverse contraction and higher accessibility in the core and lower accessibility toward the periphery. Population and transit resources are highly concentrated in the core. Population density and road-network conditions are both strongly associated with transit accessibility in inner suburbs. In peripheral areas, population and commercial facilities form clusters, distances to the core business district are longer, and transverse transit connections are relatively weak. These areas also have longer full-process travel times. These findings clarify how accessibility differences vary across zones and provide a basis for the subsequent planning discussion.
4.3. Sensitivity Analyses
4.3.1. Bus Speed and Headway
Cumulative coverage increases with the travel-time threshold in every operational scenario (Table 6). At a given headway, higher bus speed enlarges the covered area; at a given speed, shorter headways also increase coverage.
Table 6.
Cumulative coverage area under alternative operating scenarios (km2).
At the baseline speed of 25 km h−1 and headway of 12 min, 45 and 60 min coverage reaches 277 and 375 km2, respectively. Holding headway constant, reducing the speed to 20 km h−1 decreases these areas by approximately 22.4% and 13.1%; increasing the speed to 30 km h−1 raises them by 19.1% and 18.4%. At 25 km h−1, shortening the headway from 12 to 6 min increases coverage by 9.0% and 5.6%, whereas extending it to 20 min reduces coverage by 14.1% and 5.9%. Both operating parameters therefore affect coverage, with the magnitude varying across travel-time thresholds.
4.3.2. Commercial-Opportunity Weights
Facility rankings remain highly consistent across the six alternative weighting schemes (Table 7). Spearman correlations with the baseline range from 0.979 to 0.999, and all schemes retain the same five highest-ranked facilities. The area-only scheme yields a correlation of 0.993, indicating that the relative ranking of the principal facilities is insensitive to the tested business-format adjustments.
Table 7.
Sensitivity of shopping-center rankings to commercial-opportunity weights.
5. Discussion
5.1. Valley Urban Form and Directional Accessibility
The analysis shows that transit accessibility in Urumqi does not form a uniform concentric pattern of decay from the center toward the periphery. Instead, it extends along the main north–south corridors and contracts toward the eastern and western sides. This result is broadly consistent with evidence from previous studies of mountainous and river-valley cities, where transport infrastructure concentrates within limited spaces and along major development corridors [2,3]. Gao et al. [3] likewise showed that distinctive topography can substantially alter the relationship between public transport accessibility and urban spatial development. In cities with strong spatial constraints, a conventional center–periphery explanatory framework based on geometric distance may therefore be insufficient to represent residents’ actual transport costs for reaching urban opportunities.
Urumqi combines a continuous central development axis with dispersed peripheral clusters. Its central urban area develops continuously along the main north–south transport axis, while the peripheral areas of Midong, Toutunhe, and Shuimogou are characterized by more dispersed development clusters. The resulting transit-accessibility problem involves not only increased spatial distance but also insufficient transverse connections between the main corridor and peripheral clusters, longer transfer chains, and the service-frequency settings examined in the scenarios. Accessibility differences in oasis–valley cities should therefore be explained through both axial network organization and peripheral-cluster connectivity, rather than being reduced to conventional center–periphery distance decay.
5.2. Commercial Geography and Transit Provision
Transit stops and routes in Urumqi are generally aligned with the distribution of the resident population. However, commercial opportunities and transit services remain relatively misaligned around large peripheral commercial centers. Allocating transit resources on the basis of population distribution is generally reasonable, but this approach cannot fully account for demand associated with every type of urban activity. Previous research on shopping travel shows that commercial-destination choice is closely related to transport accessibility, spatial distance, and the spatiotemporal flexibility of residents’ activities [30,31,32]. Changes in real-time travel time may further alter the actual catchment of commercial facilities [31].
Destination-oriented commercial facilities such as outlets may attract visitors from beyond nearby residential areas, and shopping demand may extend across districts and be concentrated on weekends and during return-travel periods [33]. The conventional approach of allocating transit supply according to resident population may therefore have limitations in such areas. Transit evaluation for large peripheral commercial facilities needs to move beyond an approach based solely on residential population toward an analytical model that combines population, activity opportunities, and travel scenarios. Whereas Xiao et al. examined spatial mismatch in employment accessibility [54], this study focuses on large shopping destinations and distinguishes their commercial-opportunity distribution from local transit provision. The weighting sensitivity analysis shows that the principal facility rankings remain consistent across the tested schemes.
5.3. Operating Conditions and Zonal Planning Priorities
The full-process assessment identifies longer travel times for peripheral clusters, while the scenario analysis quantifies how the covered area varies with bus speed and headway. The travel-time calculation includes walking, waiting, transfer-related time, and an operating buffer. Comparisons of scheduled and observed vehicle movements show that discrepancies between planned and delivered accessibility vary spatially [49,50]. Research on multimodal journeys also emphasizes assessing passenger travel-time reliability across the complete journey [51]. Perceived-accessibility research further shows that residents’ judgments of how easily they can reach destinations do not necessarily coincide with calculated accessibility [16]. These findings link improvements in access to peripheral commercial destinations with coverage, operational reliability, and passenger experience. The presence of a transit route does not ensure that residents can reach urban opportunities within a short travel time. In peripheral areas that already have route coverage but low frequencies and numerous transfers, simply adding stops may not substantially improve actual travel experience. Transit-accessibility optimization in oasis–valley cities should therefore shift from conventional spatial coverage toward full-process service quality, with attention to route frequency, transfer organization, and operational reliability.
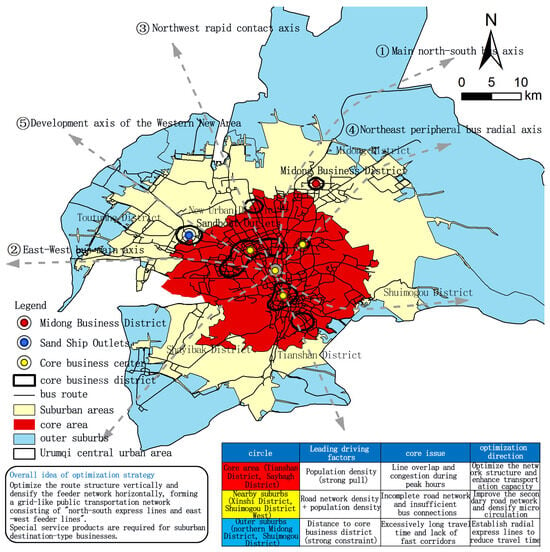
Together, the spatial patterns, full-process travel times, and local regression results indicate that transit planning in central Urumqi should avoid uniform route expansion across all areas. Service organization should instead respond to the spatial characteristics of different urban zones (Figure 7). In the core, priorities include assessing route duplication, improving corridor operating efficiency, and coordinating transfers. Inner suburbs should improve feeder coverage and cluster connections in relation to population distribution and road-network conditions. Peripheral clusters should first improve express connections to main corridors and core business districts and then explore flexible transit, customized services, or time-specific shuttles according to actual demand.
Figure 7.
Zonal planning priorities for public transport accessibility in central Urumqi.
Peripheral destination-oriented facilities such as Sasseur Outlets may serve areas beyond nearby residential neighborhoods. Demand may extend across districts and concentrate on weekends, holidays, and return-travel periods. Adding conventional fixed routes without evidence of demand would be premature. Passenger-flow surveys should inform the design of express connections between peripheral clusters and destination-oriented commercial facilities. Planners should also examine short feeder links from regional transport nodes and data coordination between commercial facilities and transit operators. Demand-responsive feeders and microtransit have the potential to improve transit accessibility in low-density, dispersed travel environments [69,70]. Specific route alignments, stops, and service capacities should be determined through passenger-flow surveys, pilot operations, and ongoing evaluation.
The findings inform Sustainable Development Goal (SDG) targets 11.2 and 9.1 by linking public transport provision with access to commercial destinations [71,72]. Consistent comparisons of 30, 45, and 60 min destination coverage could support local monitoring of accessibility improvements, complementing official SDG indicators with destination-specific evidence.
In a 2023 policy response, Urumqi’s Municipal Transport Bureau identified multimodal integration, network optimization, and cost-regulated subsidies as development priorities while acknowledging fiscal constraints on subsidy payments [73]. Accordingly, the proposed feeder and cross-cluster connections should be assessed jointly by transport authorities, finance authorities, and operators, balancing accessibility gains, operating costs, and passenger demand through staged pilots.
5.4. Limitations and Future Research
This study uses specified operating parameters and a fixed buffer rule to estimate door-to-door accessibility under alternative scenarios. The buffer parameters have not been calibrated against local vehicle arrival and departure records. The analysis therefore does not estimate observed travel-time distributions or the probability of arrival within each threshold. Vehicle location, arrival, departure, and transfer records would support an empirical assessment of operational reliability. Passenger surveys would allow for a comparison of modeled accessibility with residents’ perceived accessibility.
Local GWR R2 values range from 0.26 to 0.55, with relatively lower fit in peripheral subdistricts. Population density, road-network density, and distance to the core business district thus leave part of the local variation in accessibility unexplained. Future research could use observed service operations to check the service-opportunity index and incorporate more detailed land-use and activity-distribution information. This would support examination of the remaining variation and the influence of spatial aggregation and measurement error.
Commercial-opportunity scores combine facility floor area with business-format weights, so the identified mismatches describe the spatial relationship between transit provision and potential commercial accessibility. Without shopping-related passenger-flow and origin–destination data, these patterns do not establish the extent of unmet travel demand. Combining transit smart-card records, travel surveys, and shopping-center visitation data would help evaluate these spatial contrasts and inform route alignments, service periods, and capacity allocation.
6. Conclusions
Using central Urumqi as a case study, this paper examines the alignment between public transport accessibility and commercial opportunities. The analysis considers the combined effects of the oasis boundary, topographic constraints, and dispersed peripheral clusters. It develops a spatial morphology–operational process–travel scenario framework and combines spatial analysis using a geographic information system (GIS), door-to-door transit travel-time isochrones, a cumulative transit service-opportunity index, and geographically weighted regression. These methods examine transit-supply patterns, access to commercial opportunities, full-process travel time, and spatial heterogeneity.
The results show that transit accessibility in Urumqi does not exhibit the relatively homogeneous center–periphery decay found in a generic city. Instead, the isochrones show a directional pattern that extends along major north–south corridors and contracts east–west. At the baseline bus speed of 25 km h−1 and headway of 12 min, the 45 and 60 min catchments cover 277 and 375 km2 of the built-up area, respectively. Transit stops and routes are generally aligned with the resident population; the Pearson correlation between population and stop density is 0.804, while local mismatches remain in peripheral areas. The spatial comparison shows relatively low transit service opportunities in some residential concentrations, weaker transit accessibility around certain large peripheral commercial centers, and higher transit provision relative to resident population in parts of industrial districts. These contrasts show that population and commercial-opportunity distributions provide complementary bases for assessing transit allocation. The operational scenarios quantify changes in covered area associated with bus speed and headway, complementing the spatial comparison of route coverage and destination access. The GWR model increases the adjusted R2 from 0.086 for OLS to 0.278, with the local R2 ranging from 0.26 to 0.55; its coefficients reveal regional differences in these associations. Accessibility is associated mainly with population concentration in the core. Population density and road-network conditions are jointly associated with accessibility in inner suburbs. Distance to the core business district has a more pronounced negative association in eastern Shuimogou and northern Midong.
Public transport optimization in oasis–valley cities should therefore avoid a uniform route-expansion model and apply differentiated strategies informed by the observed accessibility patterns and spatial associations. The core should shift from increasing supply to improving network efficiency. Inner suburbs should strengthen feeder services and cluster connections. Peripheral planning should prioritize long-distance and cross-cluster connections. Passenger-flow surveys and pilot evaluations should guide the selection of express connections, flexible transit, and time-specific services for large commercial destinations. As commercial functions continue to move outward and residents’ activity spaces expand, public transport planning should move beyond a conventional population-coverage approach. A more complete evaluation should combine population, activity opportunities, and full-process travel costs.
Author Contributions
Methodology and model development, W.L. and J.S.; investigation and data collection, W.L. and J.S.; data curation, W.L. and J.S.; validation, W.L. and J.S.; formal analysis, W.L. and J.S.; writing—original draft preparation, W.L. and J.S.; writing—review and editing, F.H. and J.H.; funding acquisition, F.H.; supervision, Q.Y. and W.G. All authors have read and agreed to the published version of the manuscript.
Funding
This research was funded by the Natural Science Foundation of Xinjiang Uygur Autonomous Region, grant number 2024D01A79.
Institutional Review Board Statement
Not applicable.
Informed Consent Statement
Not applicable.
Data Availability Statement
The study uses public transport data from the Amap Open Platform API, OpenStreetMap road-network data, the 2024 gridded urban population dataset from CnOpenData, and a shopping-center dataset compiled by the authors. Publicly available source data can be obtained from the respective providers. Third-party data are subject to their original licensing and access conditions. Processed data supporting the findings are available from the corresponding author upon reasonable request, subject to those conditions.
Acknowledgments
The authors thank the Amap Open Platform, OpenStreetMap, CnOpenData, and the relevant government statistical departments for providing data support. The authors also acknowledge the School of Geography and Tourism, Xinjiang Normal University, for its support during this research.
Conflicts of Interest
Author Wumuti Gongshebieke is employed by Xinjiang Jialian Urban Construction Planning and Design Research Institute Co., Ltd. The remaining authors declare that the research was conducted in the absence of any commercial or financial relationships that could be construed as a potential conflict of interest.
References
- Anas, A.; Arnott, R.; Small, K.A. Urban spatial structure. J. Econ. Lit. 1998, 36, 1426–1464. [Google Scholar]
- Yang, M.; Qian, Y.; Li, X.; Ou, Y.; Zeng, J. River valley urban network and morphology: A study on the urban morphology evolution of Lanzhou. PLoS ONE 2024, 19, e0302686. [Google Scholar] [CrossRef] [Scilit] [PubMed]
- Gao, L.; Chong, H.Y.; Zhang, W.; Li, Z. Nonlinear effects of public transport accessibility on urban development: A case study of mountainous city. Cities 2023, 138, 104340. [Google Scholar] [CrossRef] [Scilit]
- Geurs, K.T.; van Wee, B. Accessibility evaluation of land-use and transport strategies: Review and research directions. J. Transp. Geogr. 2004, 12, 127–140. [Google Scholar] [CrossRef] [Scilit]
- Dragu, V.; Rusca, A.; Rosca, M.A. The spatial accessibility of high-capacity public transport networks—The premise of sustainable development. Sustainability 2025, 17, 343. [Google Scholar] [CrossRef] [Scilit]
- Liu, J.X.; Fu, C.F. Spatio-temporal evolution characteristics of the life circle service facilities around Taiyuan metro stations, Shanxi, China based on POI data. J. Earth Sci. Environ. 2025, 47, 485–499. (In Chinese) [Google Scholar] [CrossRef]
- Macioszek, E.; Świerk, P.; Granà, A.; Sobota, A. Application of a logit model to identify socio-demographic factors influencing the choice of public transport for daily trips–a case study based on the example of the Górnośląska-Zagłębiowska Metropolis (Poland). Transp. Probl. 2024, 19, 183–192. [Google Scholar] [CrossRef] [Scilit]
- Raza, A.; Zhong, M.; Akuh, R.; Safdar, M. Public transport equity with the concept of time-dependent accessibility using geostatistics methods, Lorenz curves, and Gini coefficients. Case Stud. Transp. Policy 2023, 11, 100956. [Google Scholar] [CrossRef] [Scilit]
- Pereira, R.H.M.; Schwanen, T.; Banister, D. Distributive justice and equity in transportation. Transp. Rev. 2017, 37, 170–191. [Google Scholar] [CrossRef] [Scilit]
- Shao, R.; Derudder, B.; Yang, Y. Metro accessibility and space-time flexibility of shopping travel: A propensity score matching analysis. Sustain. Cities Soc. 2022, 87, 104204. [Google Scholar] [CrossRef] [Scilit]
- Oviedo, D.; Guzman, L.A. Revisiting accessibility in a context of sustainable transport: Capabilities and inequalities in Bogota. Sustainability 2020, 12, 4464. [Google Scholar] [CrossRef] [Scilit]
- Currie, G. Quantifying spatial gaps in public transport supply based on social needs. J. Transp. Geogr. 2010, 18, 31–41. [Google Scholar] [CrossRef] [Scilit]
- Allen, J.; Farber, S. Sizing up transport poverty: A national scale accounting of low-income households suffering from inaccessibility in Canada, and what to do about it. Transp. Policy 2019, 74, 214–223. [Google Scholar] [CrossRef] [Scilit]
- Yadav, M.; Mepparambath, R.M.; Patil, G.R. An enhanced transit accessibility evaluation framework by integrating Public Transport Accessibility Levels (PTAL) and transit gap. J. Transp. Geogr. 2024, 121, 104013. [Google Scholar] [CrossRef] [Scilit]
- Tarko, A.C.; Matichescu, M.L.; Răducan, M.R.; Dragan, A. Public transport accessibility level and public perceptions: A framework for urban mobility analysis. Urban Sci. 2026, 10, 122. [Google Scholar] [CrossRef] [Scilit]
- Negm, H.; De Vos, J.; Pot, F.J.; El-Geneidy, A. Perceived accessibility: A literature review. J. Transp. Geogr. 2025, 125, 104212. [Google Scholar] [CrossRef] [Scilit]
- Salih, S.H.; Lee, J.B. Measuring transit accessibility: A dispersion factor to recognise the spatial distribution of accessible opportunities. J. Transp. Geogr. 2022, 98, 103238. [Google Scholar] [CrossRef] [Scilit]
- Kapatsila, B.; Palacios, M.S.; Grise, E.; El-Geneidy, A. Resolving the accessibility dilemma: Comparing cumulative and gravity-based measures of accessibility in eight Canadian cities. J. Transp. Geogr. 2023, 107, 103530. [Google Scholar] [CrossRef] [Scilit]
- Wang, H.; Loo, B.P.Y. The public transport disadvantaged in a highly transit-oriented city: An analytical framework, key challenges and opportunities. J. Transp. Geogr. 2024, 120, 103983. [Google Scholar] [CrossRef] [Scilit]
- Lee, J.B.; Salih, S.H. Passive transit accessibility: Modelling and application for transit gap analysis and station area assessment. J. Transp. Geogr. 2024, 114, 103757. [Google Scholar] [CrossRef] [Scilit]
- Fransen, K.; Neutens, T.; Farber, S.; De Maeyer, P.; Deruyter, G.; Witlox, F. Identifying public transport gaps using time-dependent accessibility levels. J. Transp. Geogr. 2015, 48, 176–187. [Google Scholar] [CrossRef] [Scilit]
- Boisjoly, G.; El-Geneidy, A.M. How to get there? A critical assessment of accessibility objectives and indicators in metropolitan transportation plans. Transp. Policy 2017, 55, 38–50. [Google Scholar] [CrossRef] [Scilit]
- Liu, L.; Porr, A.; Miller, H.J. Measuring the impacts of disruptions on public transit accessibility and reliability. J. Transp. Geogr. 2024, 114, 103769. [Google Scholar] [CrossRef] [Scilit]
- Braga, C.K.V.; Loureiro, C.F.G.; Pereira, R.H.M. Evaluating the impact of public transport travel time inaccuracy and variability on socio-spatial inequalities in accessibility. J. Transp. Geogr. 2023, 109, 103590. [Google Scholar] [CrossRef] [Scilit]
- Ryan, J.; Pereira, R.H.M.; Andersson, M. Accessibility and space-time differences in when and how different groups (choose to) travel. J. Transp. Geogr. 2023, 111, 103665. [Google Scholar] [CrossRef] [Scilit]
- Nichols, A.; Ryan, J.; Palmqvist, C.W. The importance of recurring public transport delays for accessibility and mode choice. J. Transp. Geogr. 2024, 115, 103796. [Google Scholar] [CrossRef] [Scilit]
- Zhang, G.; Wang, D.; Cai, Z.; Zeng, J. Competitiveness of public transit considering travel time reliability: A case study for commuter trips in Hangzhou, China. J. Transp. Geogr. 2024, 114, 103768. [Google Scholar] [CrossRef] [Scilit]
- Farber, S.; Morang, M.Z.; Widener, M.J. Temporal variability in transit-based accessibility to supermarkets. Appl. Geogr. 2014, 53, 149–159. [Google Scholar] [CrossRef] [Scilit]
- Widener, M.J.; Farber, S.; Neutens, T.; Horner, M. Spatiotemporal accessibility to supermarkets using public transit: An interaction potential approach in Cincinnati, Ohio. J. Transp. Geogr. 2015, 42, 72–83. [Google Scholar] [CrossRef] [Scilit]
- Shao, R.; Derudder, B.; Yang, Y.; Witlox, F. The association between transit accessibility and space-time flexibility of shopping travel: On the moderating role of ICT use. J. Transp. Geogr. 2023, 111, 103661. [Google Scholar] [CrossRef] [Scilit]
- Qin, J.; Luo, S.; Yi, D.; Jiang, H.; Zhang, J. Measuring cluster-based spatial access to shopping stores under real-time travel time. Sustainability 2022, 14, 2310. [Google Scholar] [CrossRef] [Scilit]
- Zhou, R.; Yu, Y.; Wang, Z.; Ke, L.; Zhao, J. How does shared mobility impact metro-based urban commercial travel accessibility and equity? Transp. Res. Part D Transp. Environ. 2025, 138, 104523. [Google Scholar] [CrossRef] [Scilit]
- Han, H.; Yang, C.; Song, J. The evolution of the hierarchy of shopping trip space for residents in Wuhu city and its driving mechanism. Geogr. Res. 2014, 33, 107–118. (In Chinese) [Google Scholar] [CrossRef]
- Zhu, Y.; Liu, Y.; Xu, Q.; Guo, J.; Cheng, Y. Spatial characteristics analysis of traffic accessibility and city economic activity: A case study of Beijing. J. Transp. Syst. Eng. Inf. Technol. 2020, 20, 226–233. (In Chinese) [Google Scholar] [CrossRef]
- Ding, L.; Niu, X.; Song, X. Validating gravity model in multi-centre city: A study based on individual mobile trajectory. Acta Geogr. Sin. 2020, 75, 268–285. (In Chinese) [Google Scholar] [CrossRef]
- Widener, M.J. Comparing measures of accessibility to urban supermarkets for transit and auto users. Prof. Geogr. 2017, 69, 362–371. [Google Scholar] [CrossRef] [Scilit]
- Malekzadeh, A.; Chung, E. A review of transit accessibility models: Challenges in developing transit accessibility models. Int. J. Sustain. Transp. 2020, 14, 733–748. [Google Scholar] [CrossRef] [Scilit]
- Levinson, D.; Wu, H. Towards a general theory of access. J. Transp. Land Use 2020, 13, 129–158. [Google Scholar] [CrossRef] [Scilit]
- Palacios, M.S.; El-Geneidy, A. Cumulative versus gravity-based accessibility measures: Which one to use? Findings 2022. [Google Scholar] [CrossRef] [Scilit]
- Klar, B.; Lee, J.; Long, J.A.; Diab, E. The impacts of accessibility measure choice on public transit project evaluation: A comparative study of cumulative, gravity-based, and hybrid approaches. J. Transp. Geogr. 2023, 106, 103508. [Google Scholar] [CrossRef] [Scilit]
- Chen, X. Review of the transit accessibility concept: A case study of Richmond, Virginia. Sustainability 2018, 10, 4857. [Google Scholar] [CrossRef] [Scilit]
- Tahmasbi, B.; Haghshenas, H. Public transport accessibility measure based on weighted door-to-door travel time. Comput. Environ. Urban Syst. 2019, 76, 163–177. [Google Scholar] [CrossRef] [Scilit]
- Widener, M.J.; Minaker, L.; Farber, S.; Allen, J.; Vitali, B.; Coleman, P.C.; Cook, B. How do changes in the daily food and transportation environments affect grocery store accessibility? Appl. Geogr. 2017, 83, 46–62. [Google Scholar] [CrossRef] [Scilit]
- Kaza, N. Time dependent accessibility. J. Urban Manag. 2015, 4, 24–39. [Google Scholar] [CrossRef] [Scilit]
- Li, T.; Meredith-Karam, P.; Kong, H.; Stewart, A.; Attanucci, J.P.; Zhao, J. Comparison of door-to-door transit travel time estimation using schedules, real-time vehicle arrivals, and smartcard inference methods. Transp. Res. Rec. 2021, 2675, 1003–1014. [Google Scholar] [CrossRef] [Scilit]
- Chia, J.; Lee, J. Extending public transit accessibility models to recognise transfer location. J. Transp. Geogr. 2020, 82, 102618. [Google Scholar] [CrossRef] [Scilit]
- Stępniak, M.; Pritchard, J.P.; Geurs, K.T.; Goliszek, S. The impact of temporal resolution on public transport accessibility measurement: Review and case study in Poland. J. Transp. Geogr. 2019, 75, 8–24. [Google Scholar] [CrossRef] [Scilit]
- Żochowska, R.; Kłos, M.J.; Soczówka, P.; Pilch, M. Assessment of accessibility of public transport by using temporal and spatial analysis. Sustainability 2022, 14, 16127. [Google Scholar] [CrossRef] [Scilit]
- Wessel, N.; Farber, S. On the accuracy of schedule-based GTFS for measuring accessibility. J. Transp. Land Use 2019, 12, 475–500. [Google Scholar] [CrossRef] [Scilit]
- Liu, L.; Porr, A.; Miller, H.J. Realizable accessibility: Evaluating the reliability of public transit accessibility using high-resolution real-time data. J. Geogr. Syst. 2023, 25, 429–451. [Google Scholar] [CrossRef] [Scilit] [PubMed]
- Dixit, M.; Brands, T.; van Oort, N.; Cats, O.; Hoogendoorn, S. Passenger travel time reliability for multimodal public transport journeys. Transp. Res. Rec. 2019, 2673, 149–160. [Google Scholar] [CrossRef] [Scilit]
- Ewing, R.; Cervero, R. Travel and the built environment: A meta-analysis. J. Am. Plan. Assoc. 2010, 76, 265–294. [Google Scholar] [CrossRef] [Scilit]
- Pourramazani, H.; Gielen, E.; Miralles-Garcia, J.L. Equity-oriented public transport accessibility analysis using GTFS, spatial proximity, and demographic sensitivity. Sustainability 2026, 18, 4506. [Google Scholar] [CrossRef] [Scilit]
- Xiao, W.; Wei, Y.D.; Li, H. Spatial inequality of job accessibility in Shanghai: A geographical skills mismatch perspective. Habitat Int. 2021, 115, 102401. [Google Scholar] [CrossRef] [Scilit]
- Yu, L.; Cui, M. How subway network affects transit accessibility and equity: A case study of Xi’an metropolitan area. J. Transp. Geogr. 2023, 108, 103556. [Google Scholar] [CrossRef] [Scilit]
- Wu, D.; Zhang, Y.; Xiang, Q. Could improving public transport accessibility reduce road traffic carbon dioxide emissions? A simulation-based counterfactual analysis. J. Transp. Geogr. 2024, 119, 103970. [Google Scholar] [CrossRef] [Scilit]
- GB/T 18106–2021; Classification of Retail Formats. China Standards Press: Beijing, China, 2021. (In Chinese)
- GB/T 51328–2018; Standard for Urban Comprehensive Transport System Planning. Ministry of Housing and Urban-Rural Development of the People’s Republic of China: Beijing, China, 2018. (In Chinese)
- Su, H.; Li, M.; Zhong, X.; Zhang, K.; Wang, J. Estimating public transportation accessibility in metropolitan areas: A case study and comparative analysis. Sustainability 2023, 15, 12873. [Google Scholar] [CrossRef] [Scilit]
- O’Sullivan, D.; Morrison, A.; Shearer, J. Using desktop GIS for the investigation of accessibility by public transport: An isochrone approach. Int. J. Geogr. Inf. Sci. 2000, 14, 85–104. [Google Scholar] [CrossRef] [Scilit]
- Zhang, N.; Liu, B.; Chen, Q.; Zhou, G.; Li, X. Calculation method for public transit accessibility level oriented towards the entire travel process: A case study of Chengdu. Urban Transp. China 2025, 23, 16–25. (In Chinese) [Google Scholar] [CrossRef]
- Huang, X.; Kang, C.; Xing, H.; Tang, J. The impact of space-time constrained transport disadvantage on the travel behavior of urban residents. Geogr. Res. 2024, 43, 2440–2459. (In Chinese) [Google Scholar] [CrossRef]
- Lu, X.; Pan, S.; Yan, S. Evaluation method for accessibility of public transport stations from the full chain perspective of residential travel. J. Transp. Eng. Inf. 2025, 23, 32–56. (In Chinese) [Google Scholar] [CrossRef]
- Fayyaz, S.K.; Liu, X.C.; Porter, R.J. Dynamic transit accessibility and transit gap causality analysis. J. Transp. Geogr. 2017, 59, 27–39. [Google Scholar] [CrossRef] [Scilit]
- Fotheringham, A.S.; Yang, W.; Kang, W. Multiscale geographically weighted regression (MGWR). Ann. Am. Assoc. Geogr. 2017, 107, 1247–1265. [Google Scholar] [CrossRef] [Scilit]
- Roy, P.; Srinivasan, K.K. Geographically weighted nonlinear regression for cost-effective policies to enhance bus ridership. Sustainability 2025, 17, 2485. [Google Scholar] [CrossRef] [Scilit]
- Li, M.; Kwan, M.P.; Hu, W.; Li, R.; Wang, J. Examining the effects of station-level factors on metro ridership using multiscale geographically weighted regression. J. Transp. Geogr. 2023, 113, 103720. [Google Scholar] [CrossRef] [Scilit]
- Yang, S. Optimization of Taiyuan railway-hub layout for metropolitan-area services. Urban Transp. China 2018, 16, 81–86. (In Chinese). Available online: https://www.chinautc.com/templates/H_magazine/articlecontent.aspx?contentid=92662&nodeid=4597&page=ContentPage (accessed on 20 September 2026).
- Pan, A.Q.; Shaheen, S. What makes the route more traveled? Optimizing U.S. suburban microtransit for sustainable mobility. Sustainability 2025, 17, 952. [Google Scholar] [CrossRef] [Scilit]
- Aravind, A.; Venthuruthiyil, S.P.; Mishra, S. Equity and accessibility assessment of fixed-route transit systems integrated with on-demand feeder services. J. Transp. Geogr. 2024, 121, 104028. [Google Scholar] [CrossRef] [Scilit]
- United Nations Department of Economic and Social Affairs. Goal 11: Make Cities and Human Settlements Inclusive, Safe, Resilient and Sustainable. Available online: https://sdgs.un.org/goals/goal11 (accessed on 20 September 2026).
- United Nations Department of Economic and Social Affairs. Goal 9: Build Resilient Infrastructure, Promote Inclusive and Sustainable Industrialization and Foster Innovation. Available online: https://sdgs.un.org/goals/goal9 (accessed on 20 September 2026).
- Urumqi Municipal Transport Bureau. Response to Proposal No. 2098 of the Second Session of the 17th Urumqi Municipal People’s Congress. 31 March 2023; (In Chinese). Available online: https://www.wlmq.gov.cn/wlmqs/rdya/202303/8e4c182827bb403694e880cd148e6ef2.shtml (accessed on 20 September 2026).

Disclaimer/Publisher’s Note: The statements, opinions and data contained in all publications are solely those of the individual author(s) and contributor(s) and not of MDPI and/or the editor(s). MDPI and/or the editor(s) disclaim responsibility for any injury to people or property resulting from any ideas, methods, instructions or products referred to in the content. |
© 2026 by the authors. Licensee MDPI, Basel, Switzerland. This article is an open access article distributed under the terms and conditions of the Creative Commons Attribution (CC BY) license.