


Abstract
Produced water (PW) from oil and gas extraction represents a critical sustainability challenge: billions of barrels annually generate high-salinity waste streams with hydrocarbon contaminants, creating severe environmental and economic burdens through disposal costs, ecosystem contamination, and water scarcity exacerbation. Conventional treatment options deep well injection, evaporation ponds, and reverse osmosis (RO) demand substantial energy inputs and capital investment, limiting circular-economy adoption in resource-constrained regions. Forward osmosis (FO) emerges as a more sustainable alternative, leveraging osmotic gradients to reduce energy consumption and fouling compared to pressure-driven RO, yet selecting environmentally and economically viable draw solutions remains critical. This work advances a circular economy approach by evaluating PW itself as a low-cost, on-site draw solution for FO, thereby transforming waste into a resource. Performance was compared against six synthetic salts (NaCl, KCl, MgCl2, CaCl2, NaNO3, (NH4)2SO4) using ultrapure water and microalgal suspensions as feeds. Results demonstrated that PW performed osmotically equivalent to NaCl despite multicomponent composition, validating its reusability. With microalgal feed, membrane-interface osmotic pressure reached 51.2 bar versus 8.43 bar in bulk solution, attributed to concentration polarization from biomass accumulation and extracellular polymeric substances. Importantly, effective osmotic driving force reached 7.80 bar with 48.3% flux efficiency, surpassing MgCl2, CaCl2, NaNO3, and (NH4)2SO4. This study demonstrates that PW-driven FO coupled with microalgal cultivation provides a genuinely sustainable pathway for simultaneous produced-water recovery, biomass concentration, nutrient recovery, and wastewater valorization, supporting circular economy principles and reducing both environmental impact and operational costs in oil and gas operations.
1. Introduction
In the oil and gas industry, the term produced water (PW) refers to the water co-extracted with crude oil during hydrocarbon production. PW constitutes one of the largest wastewater streams generated within the sector. On average, approximately three barrels of produced water are generated for every barrel of oil extracted. This proportion can increase considerably as oil fields mature and hydrocarbon production declines, reaching values close to 12:1 in reservoirs with a high water cut. Therefore, in mature fields, a significant part of the operation becomes focused on water handling and treatment rather than only on oil production. The global management of PW annually generates billions of barrels of hazardous effluent, contributing substantially to greenhouse gas emissions, ecosystem contamination, and freshwater scarcity critical sustainability challenges that demand innovative, resource-efficient solutions aligned with circular economy principles [1,2].
Produced water is also characterized by a highly variable and complex chemical composition. It contains dissolved and suspended compounds whose concentrations depend on the characteristics of each reservoir and on the production process. Its inorganic fraction commonly includes ions such as chloride, sodium, magnesium, calcium, barium, iron, potassium, sulfates, and carbonates. In addition, it may contain organic pollutants, including polycyclic aromatic hydrocarbons (PAHs), total petroleum hydrocarbons (TPH) and BTEX compounds, namely benzene, toluene, ethylbenzene, and xylene [3,4]. This composition is not constant, since it can vary according to reservoir geology, formation depth, extraction method, and downstream oil handling operations [5]. This intrinsic variability necessitates site-specific characterization to accurately assess environmental risks and define appropriate treatment strategies. The elevated physicochemical complexity of PW leads to its classification as a hazardous industrial effluent, not only increasing environmental risk during discharge but also complicating process design, fouling prediction, and operational stability in treatment systems, thereby introducing significant engineering and economic uncertainty in large-scale management [6].
Conventional routes for PW management, including deep well injection, reservoir reinjection, evaporation ponds, and desalination technologies such as RO, multi-effect distillation (MED), and mechanical vapor recompression (MVR), are associated with significant economic and environmental challenges. These approaches demand substantial energy inputs, particularly thermal energy for distillation and electrical energy for reverse osmosis, which increase operational carbon footprints and limit their suitability in regions with energy-constrained resources or ambitious climate mitigation targets. These methods may also involve high transportation costs, land use, and long-term regulatory liabilities. In addition, potential impacts such as groundwater contamination, disturbance of receiving ecosystems, and greenhouse gas emissions remain important concerns, particularly when large volumes of PW must be managed over extended production periods [7]. From a sustainability perspective, conventional PW management typically follows a linear “extract treat dispose” model rather than a circular approach, missing opportunities for resource recovery and valorization.
Among membrane-based technologies, RO is the most widely implemented; however, its direct application to raw PW is often limited by the physicochemical characteristics of this effluent. High salinity, organic matter, suspended solids, and scaling-forming ions can increase fouling and scaling risks, requiring extensive pre-treatment to preserve membrane performance and operational stability. Moreover, the elevated osmotic pressure of highly saline PW can reduce the effective driving force in RO systems, increasing energy demand and limiting process efficiency. As a result, pre-treatment becomes a critical step, but it also increases operational costs and process complexity without necessarily contributing to resource recovery [8]. The energy intensiveness of RO and conventional desalination methods underscores the urgent need for lower energy, more sustainable separation technologies.
FO offers a different separation mechanism, as water transport is driven by an osmotic pressure gradient rather than by externally applied hydraulic pressure. This feature can reduce energy requirements, minimize membrane compaction, and mitigate irreversible fouling, which are relevant advantages for the treatment or concentration of complex streams such as PW. Nevertheless, the selection and management of the draw solution remain major barriers to FO implementation. Synthetic draw solutes with sufficient osmotic potential are often costly, and their regeneration after dilution can add substantial energy and operating demands. Together, draw solute procurement and regeneration may represent a considerable fraction of total FO operating costs, limiting the economic feasibility of the process at larger scales [9].
The use of PW itself as a draw solution represents a transformative circular economy strategy to address this limitation, converting an industrial waste stream into a valuable process input. Because PW is already available at production sites and typically contains high concentrations of dissolved salts, it can provide the osmotic driving force required for FO without the need for additional synthetic draw solutes. At the same time, incorporating PW into the draw loop may reduce the final volume requiring downstream treatment or disposal and avoid the use of freshwater for draw solution preparation, an important consideration in water-scarce regions. This integrated approach thus advances multiple sustainability objectives simultaneously: reducing disposal costs and environmental liabilities, minimizing freshwater consumption, and demonstrating closed-loop resource management within industrial operations. This approach therefore links PW management with osmotic concentration in a single integrated process.
To date, the use of real PW as a draw solution for the FO-based concentration of microalgal biomass has received limited attention. Most available studies have relied on synthetic PW analogs, which can reproduce salinity but do not fully capture the compositional complexity of field-derived PW. In particular, real PW contains variable organic and inorganic constituents, scaling-forming species, and matrix heterogeneity that may influence membrane performance, fouling behavior, and reverse solute transport.
Evaluating real PW under realistic conditions is therefore necessary not only to establish technical feasibility but also to validate the environmental and economic sustainability claims underpinning this circular economy approach.
Among the limited investigations exploring PW in FO systems, Al Hawli et al. [10] developed a hybrid electrocoagulation-forward osmosis (EC–FO) process in which synthetic produced water was employed as the draw solution and secondary treated wastewater as the feed. In their configuration, PW first underwent electrocoagulation pre-treatment before FO was performed using a cellulose triacetate membrane under two orientations: active layer facing the draw solution (PRO mode) and active layer facing the feed solution (FO mode) at flow rates of 0.8, 1.2, and 2 L min−1. The highest average water flux (5.5 L m−2 h−1) was achieved in PRO mode at 1.2 L min−1. Ghaed et al. [11] investigated the use of real produced water as a cultivation medium for four microalgal species, Chlorella vulgaris, Dunaliella salina, Spirulina platensis, and Haematococcus pluvialis, evaluating their capacity for multi-metal removal via biosorption. Among the species examined, Dunaliella salina exhibited the highest biosorption performance, achieving up to 93% metal removal within 38 min.
It is worth noting that while the economic implications of using PW as a draw solution are qualitatively significant, particularly in terms of reduced chemical procurement costs and decreased disposal volumes, a full quantitative techno-economic analysis falls beyond the scope of the present work. Such analyses will be essential in future stages to demonstrate the scalability and long-term financial viability of this sustainable approach. To the best of the authors’ knowledge, this is the first study to report the use of real produced water as a draw solution in forward osmosis for microalgal biomass concentration, and as such, this work serves as a foundational proof-of-concept investigation.
The physicochemical complexity of PW, including its high salinity, variable ionic composition, PAHs, TPH, and other organic contaminants, makes comprehensive process modeling challenging at this stage. Therefore, a full techno-economic assessment, including cost projections, energy balances, and life cycle analysis, was considered beyond the scope of the present study. Such an evaluation should be addressed in future work once the osmotic feasibility of the system has been demonstrated and the operating conditions required for scale-up have been more clearly defined. It is important to clarify that this study does not assess FO as a remediation technology for PW. Instead, its objective is to determine whether PW, due to its intrinsic osmotic pressure, can be used as a draw solution for the concentration of microalgal biomass. Under this approach, PW is not treated as the target effluent for purification, but rather as a saline stream that can provide osmotic driving force before subsequent management or disposal.
Nevertheless, it is acknowledged that the progressive dilution of PW resulting from water permeation across the membrane during FO operation could, as a secondary outcome, reduce its salinity and contaminant load, an effect that may position FO as a viable pre-treatment stage for PW ahead of downstream desalination or disposal processes. Such an outcome would further enhance the sustainability profile of this integrated approach by partially remediating the draw solution while concentrating biomass. While this potential dual functionality is beyond the scope of the present study, it represents an important direction for future research.
Accordingly, this work focuses on assessing the feasibility of using real produced water as a low-cost draw solution in forward osmosis for microalgal biomass concentration. The work evaluates osmotic performance, water flux, reverse salt flux, and concentration polarization behavior under realistic conditions, while comparing PW against conventional synthetic draw solutes including NaCl, KCl, MgCl2, CaCl2, NaNO3, and (NH4)2SO4. By integrating hazardous industrial effluent reutilization with membrane-based biomass harvesting and demonstrating the compatibility of PW with FO technology, this investigation advances economically viable and environmentally beneficial process engineering strategies for circular-economy-based industrial wastewater management, supporting the transition toward more sustainable oil and gas operations.
2. Materials and Methods
2.1. Microalgae Cultivation
The microalgae species Chlorella vulgaris obtained from the GBLAB laboratory was cultivated for 25 days in synthetic medium BBM (Bold’s Basal Medium): 17.5 g L−1 KH2PO4; 25 g L−1 CaCl2·2H2O; 75 g L−1 MgSO4·7H2O; 250 g L−1 NaNO3; 75 g L−1 K2HPO4; 25 g L−1 NaCl; 10 g L−1 Na2EDTA·2H2O; 6.2 g L−1 NaOH; 4.98 g L−1 FeSO4·7H2O; 1 mL L−1 H2SO4; 11.5 g L−1 H3BO3; in a 3 L reactor.
Aeration was provided using automatic air compressor pumps (Resun, AC-2000, 3 W, Senzhen, China) at a flow rate of 3 L/min. Air was sterilized through 0.22 μm Verticlean Nylon filters (25 mm) to prevent contamination. Cultures were maintained under mixotrophic conditions without photoperiod. C. vulgaris was used when it reached its stationary phase after 25 days of cultivation, with biomass concentrations of 1.74 × 10⁶ cells mL−1. Cellular concentration was measured by the absorbance of the microalgae in the spectrophotometer at 680 nm. A growth curve was previously made to correlate the number of cells with the absorbance.
2.2. Draw Solutions and Osmotic Pressure
Ultrapure water was used as the baseline feed solution to evaluate the intrinsic osmotic performance of each draw solution under controlled conditions. The absence of dissolved solutes, organic matter, and suspended particles minimizes additional effects on membrane transport, allowing a direct and reproducible comparison among the draw solutions before introducing more complex feed matrices. Chlorella vulgaris was selected as the microalgal feed because it is a widely studied, versatile microalga with recognized relevance in biomass production, wastewater treatment, and biofuel-related applications. Its use as a feed solution provides a representative scenario in which FO is applied for microalgal biomass concentration and dewatering, an application of increasing interest due to the high energy demand associated with conventional harvesting methods such as centrifugation and flocculation. Together, the use of ultrapure water and microalgal suspension provides a stepwise experimental framework, moving from a simplified feed matrix to a biologically complex system. This design enables the assessment of FO performance under controlled conditions while also considering a feed composition closer to that expected in practical microalgal biomass concentration processes.
Sodium chloride (NaCl), potassium chloride (KCl), magnesium chloride (MgCl2), calcium chloride (CaCl2), sodium nitrate (NaNO3), and ammonium sulfate (NH4)2SO4 were purchased from Êxodo (Sumaré, São Paulo, Brazil), and the PW was acquired from an active oil extraction site in the Recôncavo Basin, Bahia, Brazil, and reflects the typical composition of onshore petroleum operations in the region. During production, this water is co-extracted with crude oil and treated at the processing facility before being discharged, reinjected, or reused; the sample analyzed here was collected after this in-plant treatment stage. Owing to confidentiality agreements with the operating company, further details on its specific origin and treatment cannot be disclosed.
NaCl was selected as a reference draw solute due to its widespread use in FO applications. MgCl2 and CaCl2 have been extensively studied as effective draw solutions (DS) [12,13], while KCl has demonstrated high suitability for FO processes [14]. NaNO3 and (NH4)2SO4 have also been tested as osmotic solutions in other works [15,16].
Given the multicomponent nature of PW, an exact thermodynamic determination of its osmotic pressure would require activity coefficient data for every ionic species present data that are rarely available for complex, field-derived matrices. As a practical approximation, the osmotic pressure was therefore estimated by considering only Na+ and Cl−, which dominate the dissolved ionic load of the PW sample analyzed in this study (Na+: 62.400 mg L−1; Cl−: 85.217 mg L−1) and are the principal contributors to osmotic pressure in saline produced waters. This simplification follows established approaches for high-salinity produced waters, in which NaCl equivalent calculations serve as a first-order estimate. Minor ions and organic compounds are acknowledged to contribute to the osmotic pressure as well, although to a lesser degree; resolving their individual concentrations and activity coefficients lies beyond the scope of this exploratory study and would add limited value to the present analysis. This approximation nonetheless provides a sufficiently robust basis for comparing the osmotic performance of PW against synthetic draw solutions prepared at equivalent osmotic pressures. PW characterization was carried out to estimate the osmotic pressure of the draw solution (πDS,b). Considering that Na+ and Cl− are the major ions present in the PW, πDS,b was calculated by the Van’t Hoff equation (Equation (1)):
in which R is the universal gas constant (8.314 m3 × Pas/K × mol), T is the absolute temperature, and C is the molar concentration of Na+ and Cl−.
All draw solutions were prepared with deionized water at molar concentrations (M) to result in the same osmotic pressure of PW (126.66 bar), considering the Morse equation (Equation (2)), derived from Equation (1).
where i is the Van’t Hoff factor for each solute. The concentration of each DS is presented in Table 1.
Table 1.
Van’t Hoff factor and draw solution concentration (CDS) required to generate an osmotic pressure of 126.66 bar at 25 °C.
2.3. Analytical Methods
Electrical conductivity was measured using a calibrated conductivity meter (HANNA Edge EC, Woonsocket, RI, USA). Individual calibration curves correlating conductivity with concentration were established for each salt using standard solutions of known concentration. At the end of each test, the major ions in each solution were quantified following the Standard Methods for the Examination of Water and Wastewater, as follows. Nitrate (NO3−) was determined by the ultraviolet spectrophotometric screening method (SM 4500-NO3), with the sample read in a UV–Vis spectrophotometer (Agilent Cary 60, Penang, Malasia). Phosphate (PO43−) was determined by the ascorbic acid colorimetric method (SM 4500-P E), also read in the UV–Vis spectrophotometer. Ammonia nitrogen (NH4+) was determined by the SM 4500-NH3 method. Chloride (Cl−) and sulfate (SO42−) were determined by ion chromatography, Herisau, Suiza (SM 4110-B). Sodium (Na+), magnesium (Mg2+), and potassium (K+) were determined by inductively coupled plasma optical emission spectrometry (700 Series ICP-OES, Agilent Technologies, Santa Clara, CA, USA) (SM 3120-B).
The physicochemical profile of the produced water is described in Table 2. Physicochemical analyses such as salinity, pH, temperature, conductivity, and total dissolved solids were determined using a multiparameter probe (Horiba™ Multiparameter Water Quality, Kyoto, Japan,).
Table 2.
Physical–chemical characterization of produced water.
For the extraction of the 16 priority PAHs according to the USEPA, liquid–liquid extraction was carried out in the laboratory following the methodology described in [17]. The extracting solvent used was pure dichloromethane (Merck, Darmstadt, Germany), and 10 μL of surrogate standard (p-terphenyl) (AccuStandar, New Haven, CT, USA) was added, showing a recovery of 90%. For the extraction of total petroleum hydrocarbons (TPHs) in water, liquid–liquid extraction with pure dichloromethane was carried out in the laboratory following the methodology described in Cardoso [18]. The extract was concentrated in a rotaevaporator (Ika Specials—RV 3 V, Staufen, Germany) to 200 µL in vials calcined at 400 °C for 4 h in a muffle furnace. All extracted samples were transferred for injection into a gas chromatograph combined with a flame ionization detector (Agilent Technologies GC-FID 7890B, Wilmington, NC, USA).
2.4. FO Membrane Characterization
A flat-sheet FO membrane from Fluid Technology Solutions (FTSH2OTM, Albany, OR, USA), made of asymmetric cellulose triacetate (CTA), had a structure parameter (S) of 707 μm. The FO membrane was evaluated in reverse osmosis mode to determine its water permeability using a pressurized cross-flow filtration cell. The water permeability coefficient (A) was found to be 0.7791 L/m2·h·bar and was calculated based on the flow of deionized water under applied pressures ranging from 13 to 5 bar, in increments of 2 bar [19]. The temperature was maintained at 25 °C.
2.5. Experimental Setup of FO
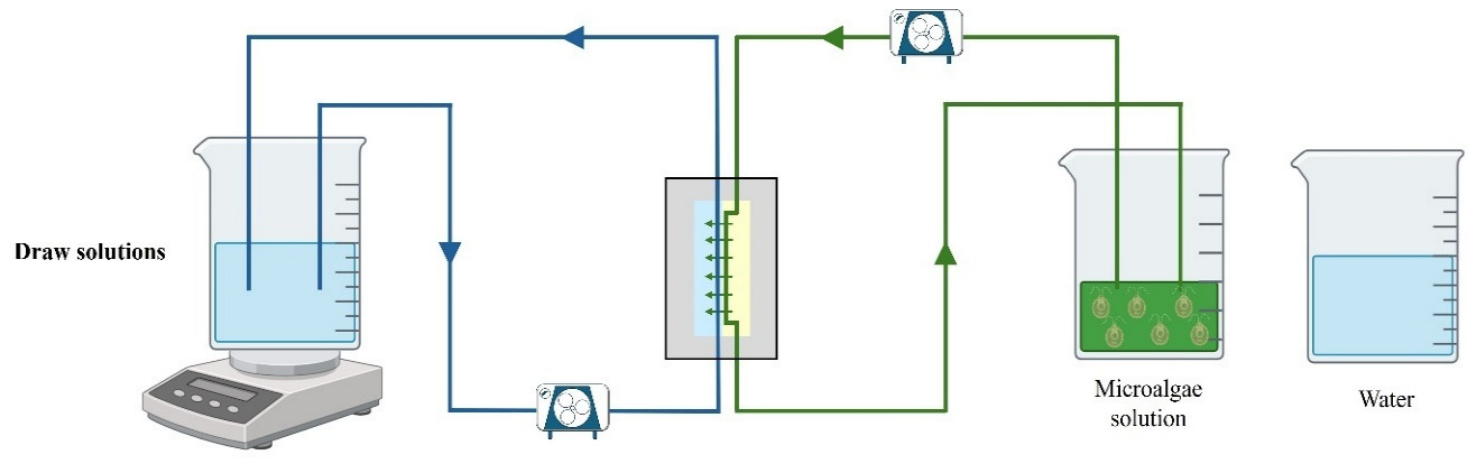
The system module was made of acrylic material, with the draw solution on one side, separated by the FO membrane, and the feed solution (microalgae) or ultrapure water on the other side, as presented in Figure 1. Experiments were conducted with the active layer facing the feed solution (AL-FS). The membrane area was 54.61 cm2. The draw solution tank was placed on an analytical balance to measure the weight change during each test. Two diaphragm pumps were used to recirculate the solutions during the test; each test was run for 3 h, with the circulation flow controlled at a velocity of 0.5935 m s−1 in the compartments. A HANNA conductivity meter was used to measure the conductivity of the feed solution.
Figure 1.
Assembly of the direct osmosis system with two different feed solutions.
2.6. Operating Conditions
Prior to each experiment, the laboratory-scale FO system was rinsed three times with tap water followed by three rinses with ultrapure water, and the same standardized cleaning protocol was applied between sequential draw-solution runs. This protocol was designed to remove residual solutes from the preceding draw solution, restore membrane baseline conditions, and minimize carryover effects that could compromise the osmotic characterization of the subsequent salt solution. A dedicated membrane piece was assigned to each feed solution: a piece of membrane was reused across the seven runs performed with ultrapure water as feed, and a separate piece of membrane was used across the seven runs performed with the microalgal suspension. Reusing a single piece of membrane within each feed condition reduced material costs and kept membrane properties consistent across the draw solutions of a given series, while assigning a separate piece of membrane to each feed and testing all draw solutions first against ultrapure water and subsequently against the microalgal suspension, progressing from simpler to more complex feed conditions, prevented biological material from the microalgal suspension from compromising the baseline osmotic characterization.
Each experiment was initiated with 1 L of the selected draw solution and 800 mL of feed solution and run for 3 h, during which the mass of the draw solution and the conductivity of the feed solution were recorded at 15 min intervals, yielding 13 measurement points per run (including the initial reading at t = 0). Seven draw solutions, six synthetic solutions and one real produced water sample were evaluated under each feed condition, giving seven runs per membrane and fourteen runs across the full experiment (182 measurement points in total). All draw solutions were formulated at the same osmotic pressure (126.66 bar) so that observed performance differences would reflect draw solution composition rather than differences in osmotic driving force. Accordingly, every experiment was carried out under identical initial conditions: osmotic pressure 126.66 bar, feed volume 800 mL, flow velocity 0.5935 m s−1, and duration 3 h.
The feed conductivity was also checked before each run to detect any anomalous baseline solute concentration. At the end of each experiment, reverse salt flux and permeate flux were determined, and aliquots of both the draw and feed solutions were collected at the start and end of every run for subsequent ionic analysis, as detailed in the Analytical Methods section. Although residual fouling and carryover effects between runs cannot be entirely ruled out, the consistency of the flux-decline trends and osmotic behavior across draw solutions indicates that inter-run interference was minimal under the cleaning protocol applied. Even so, the use of a dedicated membrane for each experimental condition is recommended in future studies that require more rigorous fouling attribution.
Detailed initial and final values of draw solution mass and feed conductivity for each run are provided in Table S1 (Supplementary Material).
2.7. Calculations of Permeate Flux, Reverse Salt Flux and Polarization
Observed FO permeate water flux (JFO,obs) was quantified by Equation (3), where mDS1 and mDS2 are the masses of DS at the time t1 and t2, Am is the membrane area.
FO reverse salt flux (Js) was determined by Equation (4), where Cf1 and Cf2 are the solute concentrations of the feed, and Vf1 and Vf2 are the volumes of the feed solution at times t1 and t2.
For concentration polarization, the calculation followed the equation described in Arcanjo et al. [19]. The observed water flux in FO (JFO,obs) can also be expressed by Equation (5):
where A is the water permeability coefficient, πDS,i and πF,i are the osmotic pressures of the DS and the feed solution, respectively, at the membrane interface.
Internal concentration polarization (ICP) can be estimated by Equation (6)
where πDS,b is the bulk solution osmotic pressure of the DS and km,FO is the support layer mass transfer coefficient, calculated by Equation (7), using the membrane structural parameter (S) and the draw solute diffusion coefficient (D)
Equation (8) is used to calculate external concentration polarization (ECP) on the feed side, considering the bulk solution osmotic pressure of the feed solution (πF,b) and the mass transfer coefficient on the feed solution side of the FO membrane (kF,FO).
Then, substituting the parameters in Equation (5), JFO,obs is expressed by Equation (9)
A reference condition was established, allowing comparison between the observed water flux and the maximum achievable flux (JFO,ref) in the absence of ECP. This reference flux was calculated as a function of the permeate-to-feed volume ratio (φ), following the model proposed by [20] (Equation (10)).
The flux performance for each draw solute and the produced water was assessed by the flux efficiency factor (FEF) (Equation (11)):
The Aspen Plus V14 program was used to calculate the specific mass of each solution. The Electrolyte Non-Random Two-Liquid (ELECNRTL) thermodynamic model was used, which is suitable for describing systems containing electrolytes in aqueous solution. As with the laboratory-scale experiment, the simulation was conducted under normal temperature and pressure conditions (CNTP), and the concentrations of the solutions were determined by laboratory analysis.
2.8. Membrane Analysis by Scanning Electron Microscopy (Sem)
After the end of the first round of tests with only ultrapure water and after the end of the last test with microalgae, the membrane was removed from the module; a piece was cut and taken for freeze-drying to remove excess water. It was then taken for Scanning Electron Microscopy (SEM); surface images of the samples were obtained using a JSM-6610LV JEOL, Tokyo, Japan; microscope operating at 15 kV. Before analysis, the samples were deposited on a steel plate and coated with a gold layer using Denton Vacuum Desk V, Moorestown, NJ, USA; equipment.
Due to the exploratory nature of this study and the limited availability of real produced water samples, each experimental condition was conducted as a single run. To minimize variability and ensure internal consistency, all experiments were performed under identical and carefully controlled operating conditions, including membrane area, flow velocity, temperature, initial draw solution osmotic pressure, and volume ratios. The continuous monitoring of water flux and conductivity at 15 min intervals throughout each 3 h experiment provided a time-resolved dataset that allows assessment of process stability and trend reproducibility across conditions. The authors acknowledge that replicate experiments would strengthen the statistical robustness of the findings, and this is identified as a priority for future work aimed at scaling up and validating the proposed approach under broader operational conditions.
3. Results
3.1. Water Flux and Concentration Polarization in Forward Osmosis
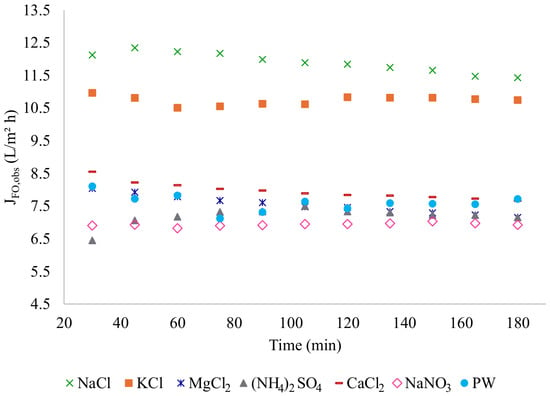
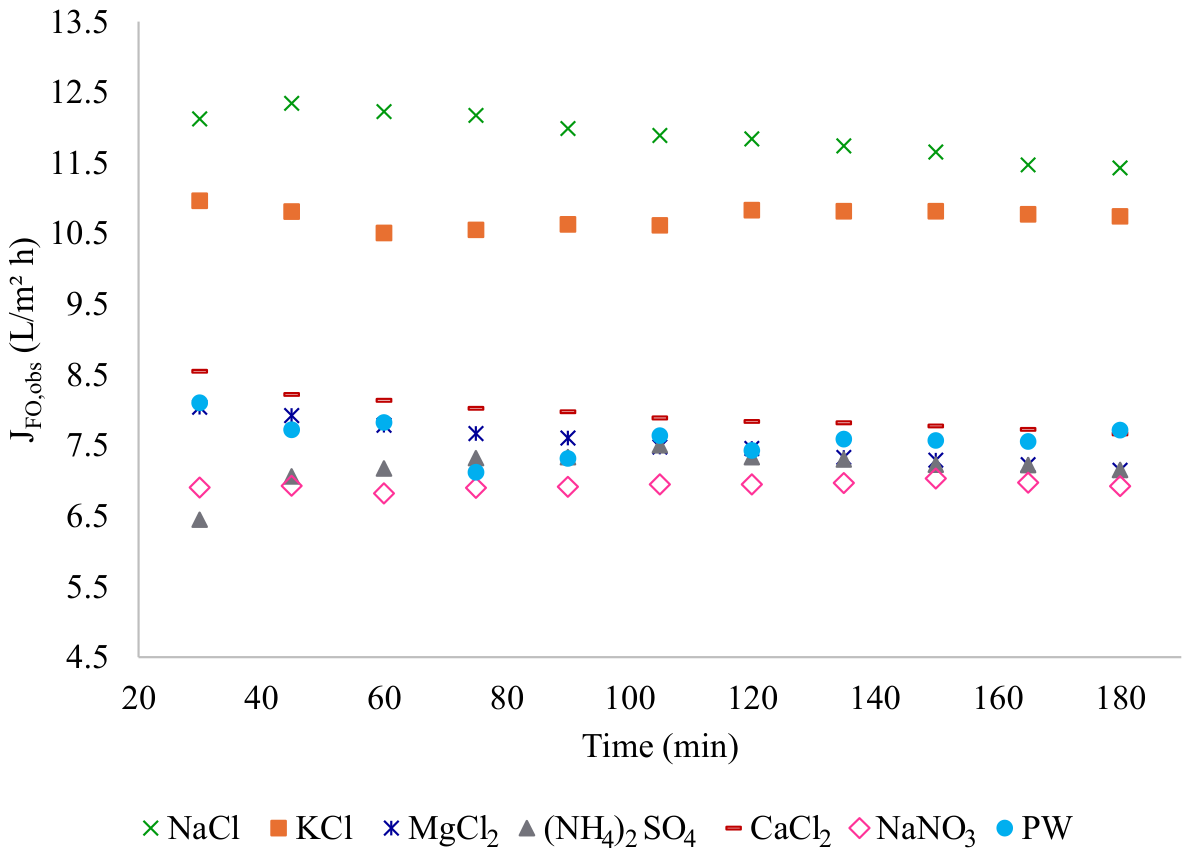
JFO,obs decreased at the start of each test, as can be seen in Figure 2, even though the πDS,b was the same for all the solutions at 126.66 bar. After stabilizing in 120 min, the NaCl and KCl solutions had the highest JFO,obs (11.63 L m−2 h−1 and 10.80 L m−2 h−1, respectively), followed by CaCl2 (7.77 L m−2 h−1), PW (7.57 L m−2 h−1), MgCl2 (7.29 L m−2 h−1), (NH4)2SO4 (7.25 L m−2 h−1) and the solution with the lowest water flow was NaNO3 (6.97 L m−2 h−1).
Figure 2.
Permeate water flux with deionized water as feed solution.
Considering the limited number of studies and, consequently, the scarce information available on the use of PW in the FO process, certain mass transport parameters were estimated based on NaCl solution, as this solute is the main component of PW. Table 3 presents the results from concentration polarization calculation for each DS when using ultrapure water as feed solution. The mass transfer coefficient on the feed side (kF,FO) showed a reasonable value, comparable to those obtained for MgCl2 and NaCl, and is a key parameter directly influencing external concentration polarization.
Table 3.
Transport parameters and osmotic pressures in FO for each DS salt evaluated.
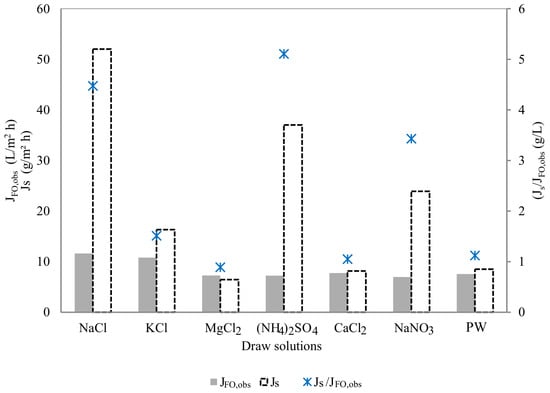
Figure 3 summarizes the water flux (JFO), the reverse salt flux (Js), and the corresponding selectivity (Js/JFO) obtained for each draw solution. Although NaCl and KCl provided the highest water fluxes, they were also associated with substantial reverse salt fluxes, indicating that a strong osmotic driving force does not by itself guarantee an efficient draw solution. A clear divergence emerged among the remaining salts, while the divalent chlorides MgCl2 and CaCl2 exhibited the lowest reverse salt fluxes and, consequently, the most favorable Js/JFO ratios, the monovalent-based solutions (NaCl, NaNO3) and, most notably, (NH4)2SO4 showed markedly higher solute back diffusion. This behavior reflects the well established dependence of reverse solute transport on ionic size and charge, whereby larger, more strongly hydrated multivalent ions are retained more effectively by the CTA membrane than smaller, weakly hydrated ones.
Figure 3.
FO water flux, reverse salt flux and specific reverse salt flux, with deionized water as feed solution.
Of particular relevance to the aim of this study, the real produced water (PW) sample displayed one of the most favorable performances of the entire set; although its water flux was moderate and comparable to that of the divalent chlorides, it exhibited a low reverse salt flux and, consequently, one of the lowest Js/JFO ratios, approaching the selectivity of MgCl2 and CaCl2 rather than that of NaCl or (NH4)2SO4. This behavior is consistent with the ionic composition of produced water, a high-salinity matrix in which multivalent species (Ca2+, Mg2+, and sulfate) contribute substantially to the osmotic pressure while being effectively retained by the CTA membrane owing to their larger hydrated radii and higher charge.
Notably, the distinctive high reverse solute flux observed for (NH4)2SO4 aligns with findings from prior investigations of ammonium based draw solutions in forward osmosis. Liu et al. [21] evaluated blended solutions combining ammonium bicarbonate with eight inorganic salts including (NH4)2SO4 as draw solutions for FO, documenting that ammonium containing salts exhibited markedly higher reverse solute fluxes compared to potassium or sodium chlorides. Similarly, Wahid et al. [22] compared multiple fertilizer-based draw solutions for FDFO (fertilizer-drawn forward osmosis) treatment of organic wastewater, finding that while (NH4)2SO4 provided adequate osmotic pressure, it demonstrated higher solute back-diffusion relative to other fertilizer options such as monoammonium phosphate (MAP). These observations underscore that the weak hydration of the NH4+ cation and its 2:1 stoichiometric pairing with the well-retained SO42− anion creating a fundamental mismatch in ion-selective transport are inherent limitations of (NH4)2SO4 as a draw solution, independent of membrane type or feed composition.
The low solute back diffusion of the PW draw solution is a desirable feature for forward osmosis, as it minimizes draw solute loss and feed contamination, supporting the feasibility of valorizing this oilfield stream as a low cost draw solution.
3.2. Forward Osmosis Performance for the Concentration of Microalgae Solution
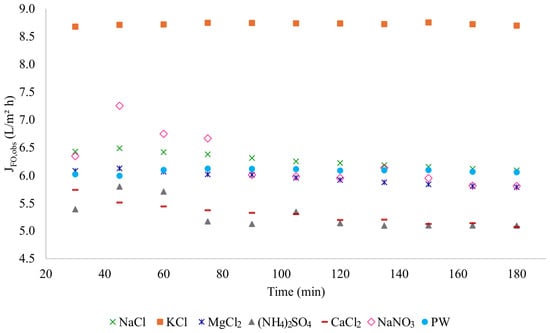
The FO permeate flux (JFO,obs) for the tests with microalgae solution as feed solution decreased at the start of each test as can be seen in Figure 4, even though the πDS,b was kept constant at 126.66 bar at the start for all solutions. After 2 h, KCl was the one with the highest JFO,obs (8.73 L m−2 h−1), followed by NaCl (6.15 L m−2 h−1), PW (6.08 L m−2 h−1), NaNO3 (5.93 L m−2 h−1), MgCl2 (5.85 L m−2 h−1), CaCl2 (5.15 L m−2 h−1) and (NH4)2SO4 (5.11 L m−2 h−1).
Figure 4.
FO water flux in the concentration of microalgae solution.
Nevertheless, for the first time PW was used as DS to promote water passage through the FO membrane, presenting permeate flux similar to NaCl.
The minor flux increase observed in some draw solutions around 45 min is attributed to the initial stabilization stage of the system rather than to a genuine performance gain. During this early period, membrane wetting and the equilibration of temperature and cross-flow conditions introduce small fluctuations in the measured flux, which are more apparent given that each assay was conducted as a single run. Beyond this stage, the water flux declined consistently for all draw solutions, in agreement with the expected behavior driven by the progressive dilution of the draw solution and the resulting concentration polarization.
The values of D and km,FO were not reported for PW due to its high compositional complexity (Table 4); values from NaCl were therefore adopted as a reference for subsequent calculations. The kF,FO coefficient showed a value comparable to other draw solutions such as NaCl, higher than in the test with ultrapure water as feed. The osmotic pressure at the membrane interface on the feed side reached 51.20 bar, compared with 8.43 bar in the bulk feed solution. On the draw-solution side, the osmotic pressure at the membrane interface (πDS,i) was 59.00 bar.
Table 4.
Transport parameters and osmotic pressures in FO for each DS salt evaluated.
The flux efficiency factor for PW as DS was 48.3%. This value was higher than those observed for MgCl2, CaCl2, NaNO3 and (NH4)2SO4, and close to that of NaCl. KCl was the only salt with a better FEF than PW, but with a higher Js/JFO,obs ratio.
The results for biomass concentration after the 180 min tests showed that the best solution for concentrating Chlorella vulgaris biomass was CaCl2, with a concentration of 202% relative to the initial microalgae concentration, followed by KCl (200%), MgCl2 and (NH4)2SO4 (190% each), NaNO3 (176%), PW (157%), and finally NaCl (109%).
3.3. Scanning Electron Microscope (Sem)
Scanning Electron Microscopy (SEM) was used to characterize the cumulative morphological changes on the membrane surface at the end of the full experimental sequence [23].
4. Discussion
4.1. Water Flux and Concentration Polarization in Forward Osmosis
A closer look at concentration polarization reveals notable differences between PW and the synthetic draw solutions. Internal concentration polarization (ICP) develops within the porous support layer, where dilution of the draw solution lowers the effective osmotic pressure at the active-layer interface. For PW, the osmotic pressure at the draw-side membrane interface (πDS,i) was 48.93 bar, a marked drop from the bulk value of 126.66 bar, and a dilution consistent with the ICP behavior of MgCl2 (49.99 bar) and CaCl2 (44.40 bar). This agreement is expected, since the transport parameters for PW were approximated with NaCl-based diffusion coefficients, given that PW is dominated by Na+ and Cl−. It should be noted, however, that the multicomponent, non-ideal character of PW may add resistance within the support layer that this approximation does not fully capture, which could underestimate ICP severity at field scale.
On the feed side, external concentration polarization (ECP) refers to the build-up of rejected solutes at the active-layer surface, which raises the local feed osmotic pressure and reduces the effective driving force. With ultrapure water as feed, the osmotic pressure at the feed–membrane interface (πF,i) reached 39.21 bar for PW as draw solution, even though the feed initially contained no solutes. This rise stems directly from reverse salt flux (Js = 7.57 g m−2 h−1): ions from the PW draw solution cross the membrane and accumulate at the feed interface, generating appreciable osmotic back-pressure. The pattern resembles that of MgCl2 and CaCl2, confirming that PW follows ECP dynamics typical of divalent-dominated systems rather than the more diffusive behavior of monovalent NaCl.
Together, ICP and ECP yielded an effective osmotic driving force (Δπeff) of 9.72 bar for PW below NaCl (14.93 bar) and KCl (13.86 bar), but comparable to MgCl2 (9.36 bar) and CaCl2 (10.76 bar) and a flux-efficiency factor of 50.5%, reflecting moderate yet competitive use of the available osmotic potential. Overall, these results show that, despite the complexity of PW and the approximations needed to estimate its transport parameters, its concentration-polarization behavior falls well within the range of conventional synthetic draw solutions, supporting its viability as a functional alternative in FO systems.
The results obtained using PW as a DS in FO highlight its strong potential as an alternative to conventional synthetic DS. Notably, a water flux of 7.57 L·m−2·h−1 was achieved, which is considered high when compared to values reported for traditional DS such as NaCl. For example, previous studies using different concentrations of NaCl as draw solution typically report water fluxes ranging from 6 to 8 L·m−2·h−1 under similar operating conditions, depending on membrane orientation and system configuration [24]. The performance of PW in this study is particularly relevant given that it is a real, complex waste stream, not a laboratory-prepared solution, thus eliminating the need for costly DS formulation.
This aspect brings significant implications for the economic feasibility of FO systems. Reference [25] emphasizes that draw solution preparation and regeneration can account for up to 30–50% of total FO process costs.
PW thus offers a twofold advantage. As an effluent generated routinely in oil and gas operations, it is readily available, and when used as a DS, it not only drives the osmotic process effectively but also becomes diluted in the course of it. That self-dilution is itself useful: by lowering the salinity and osmotic pressure of the PW, it can ease the energy demand and fouling risk of any downstream treatment, such as membrane distillation or advanced oxidation.
The reverse salt flux measured with PW reinforces this picture. It remained moderate and on par with that of established commercial salts, showing that ionic diffusion across the membrane stays manageable even for a matrix as complex as PW, evidence of a sound balance between osmotic performance and membrane selectivity. Beyond these physicochemical merits, using PW as a DS fits squarely within circular-economy thinking, pointing to a practical route for water reuse and cost reduction in biotechnological processes such as microalgae concentration.
4.2. Forward Osmosis Performance for the Concentration of Microalgae Solution
In the dehydration of microalgae, the choice of DS largely governs how energy-efficient and stable the FO process will be. NaCl is the usual reference point, but salts such as MgCl2 and CaCl2 behave quite differently, and their performance also depends on the particular microalgae species being processed. Seawater has likewise gained attention as a low-cost, practical DS; its abundance and the ease with which it can be discharged, particularly at coastal facilities, translate into lower operating costs and reduced energy use [26].
The higher kF,FO value relative to the ultrapure-water test suggests reduced mass transfer on the feed side, influenced by the presence of microalgae, which can increase viscosity and enhance diffusive resistance through the membrane. The much higher πF,i relative to the bulk feed osmotic pressure confirms the occurrence of ECP, likely intensified by the accumulation of salts, metabolites, or exudates released by the microalgal biomass, such as EPS; the difference between these pressures highlights the potential contribution of microalgae to the osmotic increase at the feed–membrane interface. Likewise, the πDS,i value of 59.00 bar reflects a substantial dilution caused by water influx from the microalgal side, higher than when the feed solution was ultrapure water.
Even so, the effective osmotic gradient (Δπeff), the genuine driving force behind water transport, fell to 7.80 bar, only about 80% of the 9.72 bar obtained with ultrapure water as feed. This drop suggests that ICP and ECP weigh more heavily when the feed is a microalgae suspension. Over time, the cells can build up into a boundary or dense layer at the membrane surface and may release ions and soluble compounds, as one would expect. Rejected solutes then concentrate at the active-layer surface (ECP) while the support layer becomes locally diluted (ICP), and the combination lowers the Δπeff available across the membrane [27]. The net result is a flux that settles into a lower steady state, with a corresponding loss of process efficiency.
This sharp rise cannot be explained by reverse salt flux from the draw solution alone, as it could when ultrapure water served as feed. Rather, it stems from a set of mechanisms tied specifically to the presence of microalgal biomass at the membrane surface. The first involves accumulation: Chlorella vulgaris cells, together with the extracellular polymeric substances (EPS) they secrete during active metabolism polysaccharides, proteins, and glycoproteins tend to gather at the active-layer surface and form a gel like fouling layer that hampers convective transport away from the membrane. By doing so, this layer lowers the effective feed-side mass transfer coefficient (kF,FO), holds solutes within the boundary layer, and intensifies ECP well beyond what a particle-free system would show.
Second, as water permeates through the membrane, microalgal cells and dissolved organic matter are progressively concentrated near the membrane surface, increasing local ionic strength and osmotic pressure. The salts present in the BBM cultivation medium, including KH2PO4, MgSO4, NaNO3, NaCl, and CaCl2, contribute to this local osmotic buildup, as their rejection by the membrane leads to concentration at the interface. Additionally, metabolic exudates such as organic acids, amino acids, and low-molecular-weight compounds released by C. vulgaris under osmotic stress conditions further elevate the local solute concentration.
Third, reverse salt flux from the PW draw solution introduces Na+ and Cl− ions into the feed, which interact with the microalgal boundary layer and further increase the interfacial osmotic pressure. The combined effect of these three mechanisms EPS driven fouling layer formation, progressive biomass and solute concentration, and reverse salt accumulation explains the large discrepancy between πf,b and πf,i observed in the microalgal experiments, and underscores the importance of accounting for biological feed complexity when modeling FO performance in real applications.
A FEF of 48.3% means that only this portion of the total osmotic potential was effectively used to drive water flux; being higher than for MgCl2, CaCl2, NaNO3 and (NH4)2SO4 indicates that PW performed more efficiently as a draw solution in the presence of microalgae than these commercial salts. The higher Js/JFO,obs ratio for KCl translates into greater salt loss, which can impact operational costs [25].
Munshi [14] used the microalga C. vulgaris in their work to evaluate the dehydration of microalgae; in addition to water and salt flows, they used three different types of DS, obtaining average water flows of 5.6, 4.8 and 4.3 L m−2 h −1, for NaCl, KCl and NH4Cl, respectively. Considering the NaCl and KCl also tested in our study, they showed higher water flow with 6.15 and 8.73 L m−2 h−1, respectively, but the DS concentration was also higher. In addition to these DS, they also evaluated another possible alternative DS, seawater, with results compatible with those of NaCl, considering its natural salinity. Nevertheless, the PW alternative tested in the present study also showed similar water flow to the NaCl solution, with values of 6.08 L m−2 h−1, the third-highest flow in the experiments.
Onyshchenko [28] cultivated the microalgae species C. vulgaris in synthetic wastewater for biomass concentration by FO, using synthetic seawater by dissolving NaCl as the DS. In relation to FO concentration, high initial water flux (in the range of 18.2 to 19.5 L m−2 h−1) and high water extraction rates (60.1 to 83.9%) were observed in all subsequent FO concentration tests.
These biomass concentration results can be related to the permeate flux values, considering that the KCl and CaCl2 solutions had the best results for JFO,obs, a fundamental parameter in the biomass concentration process using a forward osmosis membrane.
The potential transport of organic contaminants present in PW, particularly the 16 priority PAHs (671.97 μg L−1) and total petroleum hydrocarbons (TPH: 5571 mg L−1) across the FO membrane toward the microalgal feed side represents an important consideration that warrants careful discussion.
Assessing this transport rigorously and quantitatively would demand a detailed picture of the physicochemical properties of every compound in PW, molecular weight, hydrophobicity (log K_ow), aqueous solubility, and diffusion coefficients in both the aqueous and membrane phases. PAHs and TPH, however, span a structurally diverse range, from light two-ring aromatics such as naphthalene to heavier five- and six-ring species such as benzo[a]pyrene and indeno[1,2,3-cd]pyrene. Because membrane permeability varies so widely across this spectrum, any generalized description of their transmembrane transport is inherently difficult. For this reason, the reverse-flux analysis here was restricted at the outset to the dominant ionic species (Na+ and Cl−), which govern the osmotic and transport behavior of PW and can be quantified directly by conductivity.
This limitation, however, should be read against the broader circular-economy strategy being proposed. Should trace amounts of PAHs or TPH cross the membrane and reach the microalgal feed, the consequences may be less severe than they first appear: earlier work has shown that several microalgal species, C. vulgaris among them, can metabolize and remove such compounds when grown in produced water or PAH contaminated media. Yang et al. [29] evaluated microalgae strains tested against naphthalene, phenanthrene, and benzo(a)anthracene demonstrated total removal rates of 79–100%, with Desmodesmus sp. and Scenedesmus obliquus showing the greatest efficiency through biodegradation pathways. Moreover, Geetha [30] investigated indigenous microbial consortia encompassing bacteria (Pseudomonas, Bacillus), fungi (Trichoderma, Talaromyces), and algae, which achieve exceptional PAH removal, including 99.69% naphthalene removal by Pseudomonas aeruginosa KUD2 and 100% phenanthrene degradation by Phanerochaete chrysosporium, establishing viability for scaled bioremediation applications in industrial effluents.
Furthermore, biomass that has been exposed to petroleum-derived compounds can still be valorized in downstream applications such as biofuel production, where the thermochemical or biochemical conversion processes, including pyrolysis, hydrothermal liquefaction, or anaerobic digestion, are capable of degrading residual organic contaminants, thereby mitigating concerns related to biomass quality and end-use safety. This positions the proposed FO microalgae integration not only as a water recovery strategy but also as a bioremediation-coupled valorization pathway, reinforcing the circular resource flow principles underlying this work.
4.3. Scanning Electron Microscope (Sem)
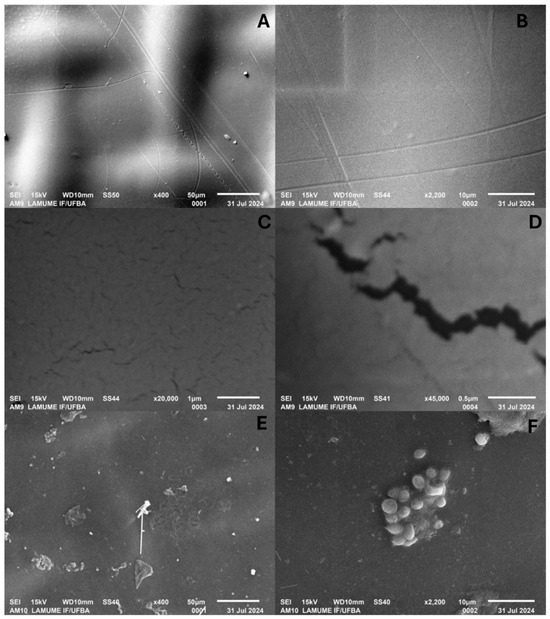
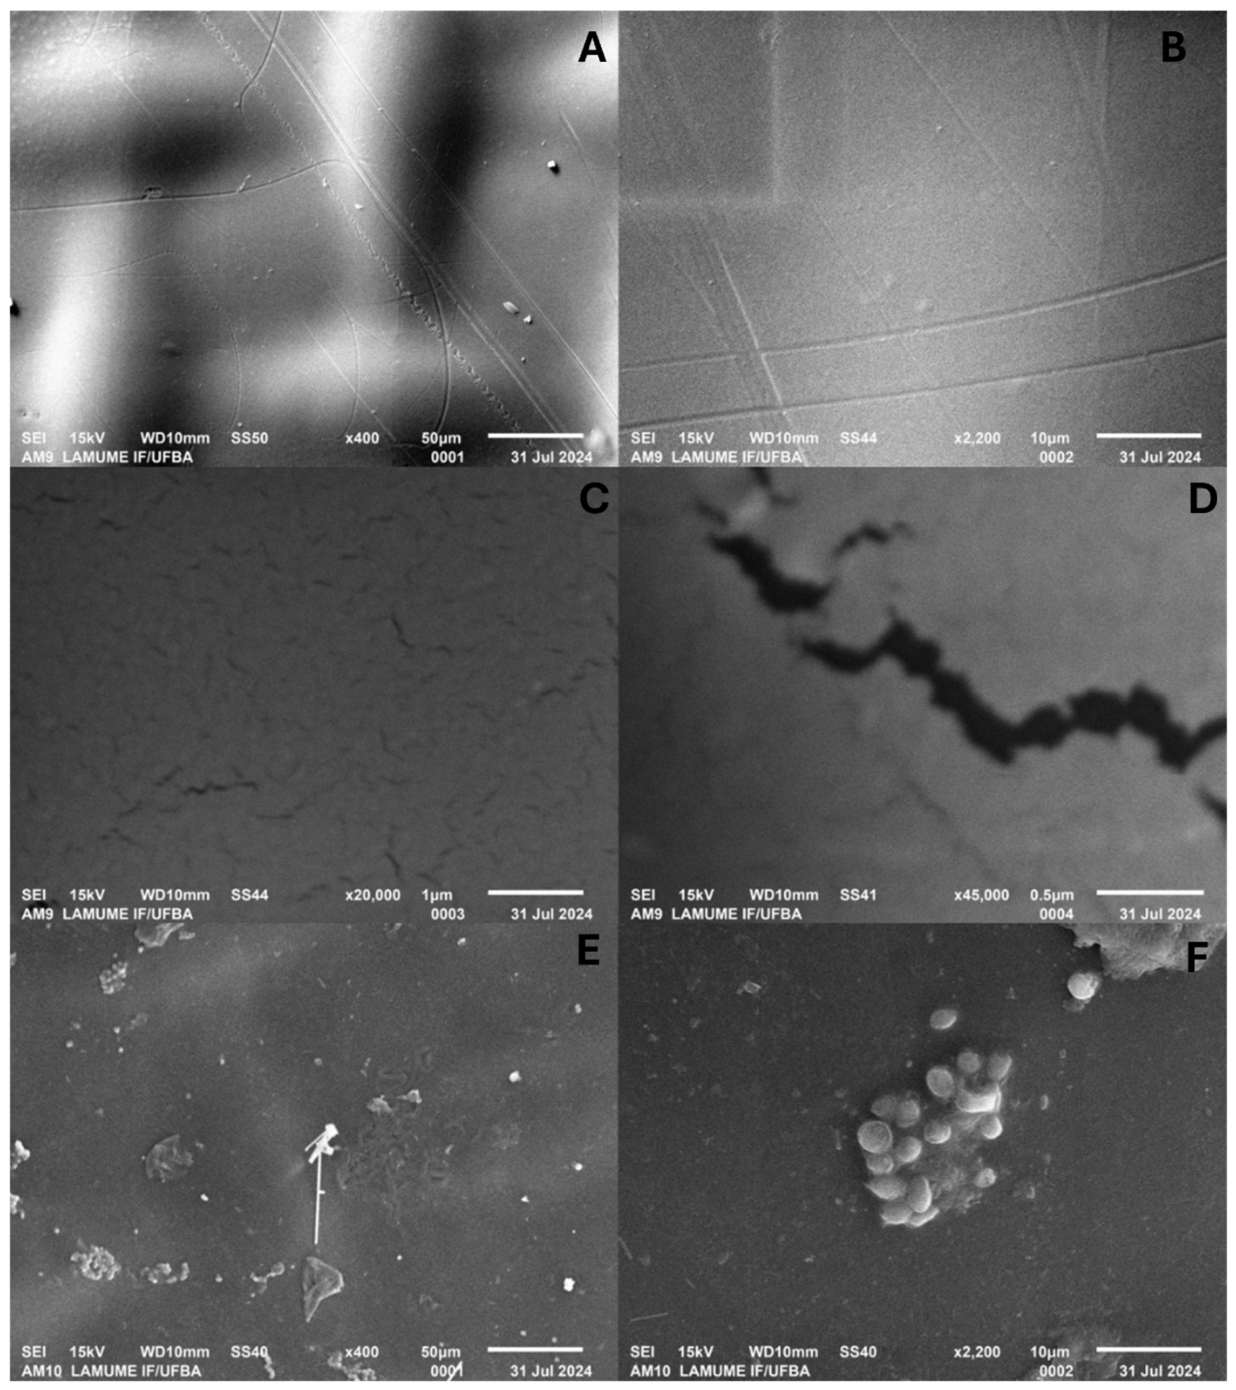
Scanning Electron Microscopy (SEM) was used to characterize the cumulative morphological changes on the membrane surface at the end of the full experimental sequence [23]. One aspect of the experimental design needs to be made explicit when interpreting these images: a single membrane was reused across all draw-solution runs performed with ultrapure water as feed, with the standard cleaning protocol applied between runs (three rinses with tap water followed by three with ultrapure water). A separate membrane segment was then dedicated to the microalgal suspension experiments. This sequential scheme was chosen to allow membrane reuse and contain costs since each FO membrane accounts for a sizeable share of the overall experimental budget. As a result, the SEM images in Figure 5 capture the membrane’s accumulated fouling history across every condition tested rather than the isolated effect of any single draw solution, PW included.
Figure 5.
Scanning electron microscope images of the FO membrane: (A–D) with ultrapure water as feed solution and (E,F) with microalgae suspension as feed solution. Isolating the fouling attributable to PW from that of the individual synthetic salts would require a dedicated membrane for each condition, a step identified as a priority for future work, as it would yield a more mechanistically resolved picture of fouling.
The SEM images still offer useful qualitative insight into how and to what extent the membrane fouled under the two broad sets of conditions tested. Figure 5A–D, for the membrane run with ultrapure water as feed, reveal pronounced surface deposits even though no biological material was present, most clearly at the higher magnifications (×20.000 and ×45.000). These deposits trace back to salt crystallization driven by reverse salt flux over the course of the successive runs; ions from the various draw solutions migrated to the feed side and then precipitated as the membrane dried during SEM preparation. Their morphology, discrete crystalline structures, points to inorganic salt precipitation rather than organic fouling, and confirms that Js-driven solute transport remains a meaningful fouling pathway even under idealized feed conditions.
Figure 5E,F, for the membrane segment exposed to the microalgal suspension, show a qualitatively different fouling layer. Here the surface is more heterogeneous, combining salt crystals from draw-solution reverse flux with biological deposits left by microalgal cells and their associated EPS. Microalgal aggregates are clearly discernible at the surface, yet the overall extent of biological fouling looks moderate, which suggests that the cleaning protocol curbed biomass build-up at least in part. This coexistence of inorganic and biological foulants is consistent with the elevated πf,i values discussed in Section 4.2, where the joint accumulation of salts, cells, and organic exudates at the feed membrane interface was identified as the main driver of the enhanced ECP. Here again, characterizing a separate membrane for each treatment would permit a more rigorous, quantitative comparison of the fouling contributed by PW versus the synthetic draw solutions, and would sharpen the mechanistic understanding of fouling in FO systems handling complex industrial matrices.
5. Conclusions
This study shows, for the first time, that real PW, a hazardous effluent generated continuously by the oil and gas industry, can serve as a functional draw solution in forward osmosis OF for concentrating microalgal biomass. In doing so, it turns an industrial liability into a process-enabling resource and lays a scientific baseline for a research direction that remains largely unexplored. Despite its complex, multicomponent matrix, PW displayed osmotic behavior on par with conventional synthetic salts such as NaCl and MgCl2, sustaining a flux-efficiency factor of roughly 48% under biologically active feed conditions, a level that exceeded several commercial draw solutes, including MgCl2, CaCl2, NaNO3, and (NH4)2SO4. These outcomes confirm the technical feasibility of the approach and support the use of field-derived PW as a credible alternative to chemically synthesized draw solutions.
The significance extends beyond osmotic performance. Reframing PW as a primary process reagent rather than a waste stream marks a shift in how the effluent might be managed. Although the central aim here was to evaluate PW as a draw solution, its progressive dilution through water permeation across the membrane emerged as a valuable secondary benefit. By lowering salinity and, with it, the likely scaling and fouling risks, this effect could establish FO as a strategic pre-treatment step ahead of downstream desalination or polishing an avenue that merits dedicated study. More broadly, the results point to the promise of harnessing the intrinsic properties of industrial effluents, rather than neutralizing or discarding them, as active components in membrane-based processes. Backed by the experimental evidence reported here, this reframing opens a research pathway at the intersection of membrane technology, industrial ecology, and resource recovery.
Realizing it will take more work. A thorough techno-economic analysis covering energy balances, chemical-cost modeling, and life-cycle assessment will be essential to move the strategy from laboratory proof of concept toward industrial deployment, where economic viability, operational scalability, and regulatory compliance become decisive. We hope these findings provide a useful reference and encourage further research into integrating hazardous industrial effluents as functional process reagents within circular economy-oriented membrane systems.
Supplementary Materials
The following supporting information can be downloaded at: https://www.mdpi.com/article/10.3390/su18199877/s1, Table S1: Initial and final state of both compartments during the FO assays (t = 15 min to t = 180 min).
Author Contributions
K.B.Ñ.: Conceptualization, Methodology, Validation, Formal analysis, Investigation, Resources, Data Curation, Writing—Original Draft, Writing—Review and Editing, Visualization. K.D.R.R.: Methodology, Investigation. C.L.G.G.: Methodology, Investigation. D.O.L.: Methodology, Investigation. C.D.R.D.M.: Methodology. R.D.C.V.C.: Methodology. I.A.S.: Methodology. C.B.S.: Methodology. L.A.: Methodology. G.S.A.: Conceptualization, Methodology, Validation, Formal analysis, Investigation, Resources, Data Curation, Writing—Review and Editing, Visualization, Supervision, Project administration, Funding Acquisition. Í.T.A.M.: Conceptualization, Methodology, Validation, Formal analysis, Investigation, Resources, Data Curation, Writing—Review and Editing, Visualization, Supervision, Project administration, Funding Acquisition. All authors have read and agreed to the published version of the manuscript.
Funding
This work was supported by the Coordenação de Aperfeiçoamento de Pessoal de Nível Superior (CAPES), Brazil [Funding code: 88887.803652/2023-00].
Institutional Review Board Statement
Not applicable.
Informed Consent Statement
Not applicable.
Data Availability Statement
The original contributions presented in this study are included in the article/Supplementary Materials. Further inquiries can be directed to the corresponding author.
Acknowledgments
The authors would like to thank the laboratories LEPETRO—Excellence in Petroleum (UFBA), Green Blue Laboratory GBLAB—Federal University of Bahia—UFBA, Laboratorio de Tratamento de água e efluentes por membranas e processos avançados LabTrEM—Federal University of Bahia, Multiuser Electron Microscopy Laboratory—LAMUME (UFBA), for all the technical support and recommendations provided. UFBA for all the technical support and recommendations provided. The authors also thank Banco do Nordeste do Brasil (BNB) for its support.
Conflicts of Interest
The authors declare no conflicts of interest.
Abbreviations
A, Water permeability coefficient; D, Diffusion coefficient; DS, Draw solution; ECP, External concentration polarization; FEF, Flux efficiency factor; FO, Forward osmosis; ICP, Internal concentration polarization; JFO, Forward osmosis water flux; Js, Reverse salt flux in forward osmosis membrane; kF,FO, Mass transfer coefficient on the feed solution side of FO membrane; km, FO, Mass transfer coefficient within the FO membrane support layer; S, Structural parameter; T, Temperature; Δπb, Bulk osmotic pressure gradient; Δπeff, Osmotic pressure difference across the active layer of the FO membrane; ζ, Concentration polarization coefficient; πDS,b, Osmotic pressure of the draw solution; πDS,i, Osmotic pressure of the draw solution at the membrane interface; πf,b, Osmotic pressure of the feed solution; πf,i, Osmotic pressure of the feed solution at the feed–membrane interface.
References
- Al-Ghouti, M.A.; Al-Kaabi, M.A.; Ashfaq, M.Y.; Da’na, D.A. Produced water characteristics, treatment and reuse: A review. J. Water Process Eng. 2019, 28, 222–239. [Google Scholar] [CrossRef] [Scilit]
- Igunnu, E.T.; Chen, G.Z. Produced water treatment technologies. Int. J. Low.-Carbon Technol. 2014, 9, 157–177. [Google Scholar] [CrossRef] [Scilit]
- Amakiri, K.T.; Canon, A.R.; Molinari, M.; Angelis-Dimakis, A. Review of oilfield produced water treatment technologies. Chemosphere 2022, 298, 134064. [Google Scholar] [CrossRef] [Scilit]
- Fakhru’l-Razi, A.; Pendashteh, A.; Abdullah, L.C.; Biak, D.R.A.; Madaeni, S.S.; Abidin, Z.Z. Review of technologies for oil and gas produced water treatment. J. Hazard. Mater. 2009, 170, 530–551. [Google Scholar] [CrossRef] [Scilit] [PubMed]
- Li, C.; Li, J.; Wang, N.; Zhao, Q.; Wang, P. Status of the treatment of produced water containing polymer in oilfields: A review. J. Environ. Chem. Eng. 2021, 9, 105303. [Google Scholar] [CrossRef] [Scilit]
- Hildenbrand, Z.L.; Santos, I.C.; Liden, T.; Carlton, D.D.; Varona-Torres, E.; Martin, M.S.; Reyes, M.L.; Mulla, S.R.; Schug, K.A. Characterizing variable biogeochemical changes during the treatment of produced oilfield waste. Sci. Total Environ. 2018, 634, 1519–1529. [Google Scholar] [CrossRef] [Scilit]
- Conrad, C.L.; Ben Yin, Y.; Hanna, T.; Atkinson, A.J.; Alvarez, P.J.J.; Tekavec, T.N.; Reynolds, M.A.; Wong, M.S. Fit-for-purpose treatment goals for produced waters in shale oil and gas fields. Water Res. 2020, 173, 115467. [Google Scholar] [CrossRef] [Scilit]
- Lugo, A.; Mejía-saucedo, C.; Senanayake, P.S.; Stoll, Z.; Sitterley, K.; Wang, H.; Kota, K.; Kuravi, S.; Fthenakis, V.; Kurup, P.; et al. A modeling framework for technical, economic, energetic, and environmental assessment of produced water pretreatment from oil and gas industry. J. Environ. Chem. Eng. 2025, 13, 117026. [Google Scholar] [CrossRef] [Scilit]
- Wang, J.; Liu, X. Forward osmosis technology for water treatment: Recent advances and future perspectives. J. Clean. Prod. 2021, 280, 124354. [Google Scholar] [CrossRef] [Scilit]
- Al Hawli, B.; Benamor, A.; Hawari, A.A. Chemical Engineering & Processing: Process Intensi fi cation A hybrid electro-coagulation/forward osmosis system for treatment of produced water. Chem. Eng. Process.-Process Intensif. 2019, 143, 107621. [Google Scholar]
- Ghaed, V.; Salimi, A.; Attar, R.; Mirvakili, A.; Salimian, J. From waste to resource: Evaluating microalgae for enhanced metal adsorption in oil and gas refinery effluents. J. Environ. Chem. Eng. 2025, 13, 115844. [Google Scholar] [CrossRef] [Scilit]
- Li, J.Y.; Ni, Z.Y.; Zhou, Z.Y.; Hu, Y.X.; Xu, X.H.; Cheng, L.H. Membrane fouling of forward osmosis in dewatering of soluble algal products: Comparison of TFC and CTA membranes. J. Membr. Sci. 2018, 552, 213–221. [Google Scholar] [CrossRef] [Scilit]
- Larronde-Larretche, M.; Jin, X. Microalgae (Scenedesmus obliquus) dewatering using forward osmosis membrane: Influence of draw solution chemistry. Algal Res. 2016, 15, 1–8. [Google Scholar] [CrossRef] [Scilit]
- Munshi, F.M.; Church, J.; McLean, R.; Maier, N.; Sadmani, A.H.M.A.; Duranceau, S.J.; Lee, W.H. Dewatering algae using an aquaporin-based polyethersulfone forward osmosis membrane. Sep. Purif. Technol. 2018, 204, 154–161. [Google Scholar] [CrossRef] [Scilit]
- Phuntsho, S.; Shon, H.K.; Hong, S.; Lee, S.; Vigneswaran, S. A novel low energy fertilizer driven forward osmosis desalination for direct fertigation: Evaluating the performance of fertilizer draw solutions. J. Membr. Sci. 2011, 375, 172–181. [Google Scholar] [CrossRef] [Scilit]
- Achilli, A.; Cath, T.Y.; Childress, A.E. Selection of inorganic-based draw solutions for forward osmosis applications. J. Membr. Sci. 2010, 364, 233–241. [Google Scholar] [CrossRef] [Scilit]
- Ñañez, K.B.; Rios Ramirez, K.D.; Cordeiro de Oliveira, O.M.; Reyes, C.Y.; Andrade Moreira, Í.T. Removal of polycyclic aromatic hydrocarbons (PAHs) from produced water using the microalgae Chlorella vulgaris cultivated in mixotrophic and heterotrophic conditions. Chemosphere 2024, 356, 141931. [Google Scholar] [CrossRef] [Scilit]
- Cardoso, C.K.M.; Moreira, Í.T.A.; Queiroz, A.F.S.; Oliveira, O.M.C.; Lobato, A.K.C. Bio-Based Sorbents for Marine Oil Spill Response: Advances in Modification, Circularity, and Waste Valorization. Resources 2025, 14, 140. [Google Scholar] [CrossRef] [Scilit]
- Arcanjo, G.S.; Costa, F.C.R.; Ricci, B.C.; Mounteer, A.H.; de Melo, E.N.M.L.; Cavalcante, B.F.; Araújo, A.V.; Faria, C.V.; Amaral, M.C.S. Draw solution solute selection for a hybrid forward osmosis-membrane distillation module: Effects on trace organic compound rejection, water flux and polarization. Chem. Eng. J. 2020, 400, 125857. [Google Scholar] [CrossRef] [Scilit]
- Lay, W.C.L.; Zhang, J.; Tang, C.; Wang, R.; Liu, Y.; Fane, A.G. Factors affecting flux performance of forward osmosis systems. J. Membr. Sci. 2012, 394–395, 151–168. [Google Scholar] [CrossRef] [Scilit]
- Liu, P.; Gao, B.; Shon, H.K.; Ma, D.; Rong, H.; Zhao, P.; Zhao, S. Water flux behavior of blended solutions of ammonium bicarbonate mixed with eight salts respectively as draw solutions in forward osmosis. Desalination 2014, 353, 39–47. [Google Scholar] [CrossRef] [Scilit]
- Wahid, R.A.; Ang, W.L.; Mohammad, A.W.; Johnson, D.J.; Hilal, N. Evaluating Fertilizer-Drawn Forward Osmosis Performance in Treating Anaerobic Palm Oil Mill Effluent. Membranes 2021, 11, 566. [Google Scholar] [CrossRef] [Scilit]
- Yuan, W.; Chen, X.; Yu, Z.; Wan, Y.; Lin, J.; Ye, W. Critical review of membrane fouling in reverse osmosis treatment: Characterizations, models, mechanisms, and controls. Sep. Purif. Technol. 2025, 363, 132119. [Google Scholar] [CrossRef] [Scilit]
- Al-Alalawy, A.F.; Abbas, T.R.; Mohammed, H.K. Comparative Study for Organic and Inorganic Draw Solutions in Forward Osmosis. Al-Khwarizmi Eng. J. 2017, 13, 94–102. [Google Scholar] [CrossRef] [Scilit]
- Arcanjo, G.S.; Dos Santos, C.R.; Costa, F.C.R.; Batista, I.F.; Amaral, M.C.S. Forward osmosis as an opportunity for acid mining effluent reuse—An assessment of concentration polarization effects on forward osmosis performance and economic aspects. Sep. Sci. Technol. 2021, 56, 2426–2438. [Google Scholar] [CrossRef] [Scilit]
- Zhang, S.; An, W.; Li, R.; Zhang, X.; Ge, H.; Liu, H. Optimization of Forward Osmotic Dewatering on Resource Utilization of Microalgae: A Review. Clean Technol. 2025, 7, 10. [Google Scholar] [CrossRef] [Scilit]
- Vrasna, D.K.; Goh, P.S.; Lau, W.J.; Ismail, A.F.; Matsuyama, H.; Gonzales, R.R. Microalgae dewatering using forward osmosis membrane: A review. Mater. Today Proc. 2022, 65, 3073–3080. [Google Scholar] [CrossRef] [Scilit]
- Onyshchenko, E.; Blandin, G.; Comas, J.; Dvoretsky, A. Influence of microalgae wastewater treatment culturing conditions on forward osmosis concentration process. Environ. Sci. Pollut. Res. 2020, 27, 1234–1245. [Google Scholar] [CrossRef] [Scilit]
- Yang, Y.; Sui, J.; Tian, Y.; Qiao, R.; He, D.; Li, M. Comparison of polycyclic aromatic hydrocarbon removal efficiency, removal pathways, and biomass pyrolysis characteristics of seven microalgal strains. J. Water Process Eng. 2025, 76, 108160. [Google Scholar] [CrossRef] [Scilit]
- Geetha, R. Exploring the potential of indigenous microorganisms for sustainable biodegradation of poly-aromatic hydrocarbons (PAH) in industrial wastewater. Sustain. Chem. One World 2026, 11, 100250. [Google Scholar] [CrossRef] [Scilit]

Disclaimer/Publisher’s Note: The statements, opinions and data contained in all publications are solely those of the individual author(s) and contributor(s) and not of MDPI and/or the editor(s). MDPI and/or the editor(s) disclaim responsibility for any injury to people or property resulting from any ideas, methods, instructions or products referred to in the content. |
© 2026 by the authors. Licensee MDPI, Basel, Switzerland. This article is an open access article distributed under the terms and conditions of the Creative Commons Attribution (CC BY) license.