


Abstract
This review synthesises the life cycle environmental performance of hydrogen production pathways for fuel cell bus applications based on a core systematic dataset of 19 peer-reviewed studies from the 2001–2020 review period, supplemented by recent literature to assess subsequent developments in the field. The reviewed literature shows that hydrogen produced using fossil-intensive electricity and coal gasification generally results in higher environmental impacts, whereas renewable-powered electrolysis provides substantially lower life cycle greenhouse gas emissions. Steam methane reforming remains an important hydrogen production pathway, and the reviewed studies indicate that carbon capture and storage can reduce its associated greenhouse gas emissions. Recent studies further indicate that the relative sustainability of hydrogen fuel cell buses is context- and scenario-dependent, with outcomes influenced by hydrogen production pathways, regional electricity systems, operational conditions, infrastructure, and economic factors. Considerable variation is observed among the reported environmental impacts, mainly because of differences in system boundaries, electricity generation mixes, geographical conditions, functional units, passenger loading assumptions, and LCA methodologies. Overall, the environmental performance of hydrogen fuel cell buses is strongly dependent on the hydrogen production pathway and the energy source used. Greater methodological standardisation and the increased use of low-carbon energy sources are therefore important for improving both the environmental performance and comparability of hydrogen-based bus systems.
1. Introduction
1.1. Background
Hydrogen fuel has gained momentum as a leading contender to displace and ultimately replace traditional hydrocarbon fuels in an effort to lower greenhouse gas (GHG) emissions. This push towards lower GHG-based energy is driven by international partnerships such as the Kyoto Protocol agreement to curtail not only global warming effects but also societal pressures, whereby investors look to companies with strong Environmental, Social and Governance (ESG) metrics. Hydrogen has considerable potential as a clean energy alternative, with approximately 2.4 times the energy density of methane, and when used in combination with fuel cell (FC) technologies, it has near-zero end-use emissions [1]. The transportation sector is a major GHG emitter accounting for 23% of global emissions [2] and requires improvement from both energy and exergy perspectives [3]. For developing nations such as China, GHG emissions from transportation are expected to grow year on year, exacerbating local air pollution [4]. Although hydrogen is considered one of the cleanest energy carriers, it is important to understand the life cycle impact of hydrogen production with respect to environmental, financial, and social impacts. In the context of hydrogen production, sustainability can be defined as meeting the energy needs to support the advancement and betterment of human civilisation, whilst not unnecessarily depleting natural resources, polluting the environment, negatively impacting financial systems, or negatively impacting society in general. A study of H2 fuel cells in ships was conducted to better understand their environmental impacts [5]. In another study [6], dual fuel (H2 and biodiesel) was used in an engine to investigate its environmental properties. This review systematically examines published life cycle environmental assessments of hydrogen production pathways and their application as alternative fuels for transit buses, with particular emphasis on well-to-wheel (WTW) environmental impacts. Nineteen peer-reviewed articles have been selected for analysis, which investigate the various hydrogen production pathways focusing on a WTW environmental impact analysis. As shown in Figure 1, these articles span over 20 years and there is an increased frequency of hydrogen production environmental impact assessment in recent years. While the earliest 2001 article from Faltenbacher et al. [7] focuses on a purely conceptual assessment, the most recent articles rely on a standardised quantitative assessment supported by previous research.
Figure 1.
Histogram of articles analysed by year of publication.
The nineteen articles represent various geographical locations as illustrated in Figure 2 and include different sensitivity cases involving access to primary energy sources, domestic industrial sector maturity level, and difference in transportation modes.
Figure 2.
Articles by location of study.
The available studies assess hydrogen production and fuel cell bus applications under different geographical conditions, system boundaries, functional units, energy mixes, and environmental impact categories, which limits a direct comparison of their reported results. The present review therefore consolidates these studies within a common comparative framework to evaluate the environmental performance of the principal hydrogen production pathways for fuel cell bus applications and to identify the methodological factors responsible for variation among the reported LCA results.
A recent systematic review [8] examined LCA studies of hydrogen fuel cell buses with particular emphasis on methodological approaches, including system boundaries, functional units, hydrogen production technologies, and impact category selection. While this provides an important methodological overview, the present review places greater emphasis on the quantitative comparison of WTW environmental performance across hydrogen production pathways. Reported results are comparatively assessed and where methodologically justified, normalised to a common functional unit basis across climate change, terrestrial acidification, human toxicity, and photochemical oxidation, while the methodological factors affecting the reliability of these comparisons are explicitly considered.
The purpose of this review is to systematically synthesise and comparatively assess the life cycle environmental performance of the principal hydrogen production pathways considered for fuel cell bus applications. Specifically, the review compares steam methane reforming, water electrolysis using different electricity sources, and coal gasification with respect to greenhouse gas emissions, terrestrial acidification, human toxicity, and photochemical oxidation. It also examines how differences in functional units, system boundaries, regional energy mixes, and LCA methodologies influence the reported environmental impacts and the comparability of results across studies.
The scientific contribution of this review lies in the systematic integration and comparative interpretation of heterogeneous life cycle studies for hydrogen production pathways used in fuel cell bus applications. The authors consolidate results reported using different functional units, system boundaries, regional energy systems, and LCA methodologies and establish a common comparative basis wherever reliable normalisation is possible. The review further provides a pathway-level comparison of greenhouse gas emissions, terrestrial acidification, human toxicity, and photochemical oxidation, while explicitly identifying the methodological factors responsible for variation among published results. In addition, the methodological quality and reliability of the reviewed studies are critically assessed to distinguish the strength and comparability of the available evidence.
1.2. Systematic Literature Review Methodology
Using Scopus, an abstract and citation database, peer-reviewed literature published between 2001 and 2020 was collated. The search was performed in the year 2021. All types of articles written in English were shortlisted for analysis. The search string used to identify appropriate literature was TITLE-ABS-KEY ((lca OR “life cycle assessment” OR “lifecycle assessment” OR “life cycle analysis” OR “lifecycle analysis” OR “life-cycle assessment” OR “life-cycle analysis”) AND hydrogen AND bus). As shown in Figure 3, each of the thirty-five articles returned by the search was systematically reviewed. All articles were peer-reviewed or published in academic databases, ensuring their quality, credibility and suitability for technical analysis.
Figure 3.
Systematic review flow diagram.
Further screening of the thirty-five articles was conducted focusing on the following criteria: relevance to the research topic, inclusion of a comprehensive LCA of either hydrogen production or hydrogen fuel cell buses, assessment of environmental impacts, and publication within the specified date range. Twenty-one articles were sought for retrieval from Charles Darwin University (CDU) Library. However, only nineteen were available. These articles provided key information pertaining to life cycle methodology, hydrogen fuel pathways, energy feedstock makeup, fuel cell technology, research location and environmental impact categories. As shown in Figure 3, where concepts pertinent to the topic were inadequately explained, additional research was conducted to supplement the nineteen articles. Nine additional information sources were collected from various scientific and government agency sources. Further information on environmental impacts was predominantly sourced from ReCiPe 2016 [9], which provides clear definitions of impact categories and their effects. Additional information on life cycle assessment was obtained from [10,11,12], providing a broader context on LCA methodology and how assessment boundary conditions affect impact results. A further understanding of hydrogen production pathways and hydrogen fuel cell technologies was obtained from [13,14,15].
2. Life Cycle Assessment Methodology in the Literature
The transition from fossil fuels to hydrogen energy and the emergence of hydrogen fuel cell technology require analysis of life cycle impacts from both direct and indirect sources. Life cycle assessment methodology provides a quantitative approach to identify impacts. LCA is a process for the assessment of impacts from a particular product or service throughout all stages of its life cycle. Standardisation of LCA principles and its framework is important when analysing different studies to enable direct comparison of results. All life cycle assessments have the following phases:
- Goal and scope definition;
- Inventory analysis;
- Impact analysis;
- Interpretation and critical analysis.
As shown in Table 1, fifteen of the nineteen articles analysed consider the environmental impacts over the full life cycle of hydrogen production and bus operation. This LCA system boundary approach is considered as a well-to-wheel approach. A comprehensive WTW LCA includes all phases of the hydrogen production life cycle including raw material extraction, manufacturing, production and operation, and end of life to provide a holistic understanding of the impacts associated with this technology.
Table 1.
Hydrogen production pathway literature analysis.
This comprehensive approach can be considered state of the art and can provide accurate impact assessment results; however, it relies on large data sources at each phase of the life cycle. Of the fifteen WTW LCA articles analysed, only a limited number consider all phases of hydrogen production while most focus on hydrogen production and the operation of hydrogen fuel cell transit buses.
An important parameter in the analysis of hydrogen production is the functional unit, forming the base unit of all measured impacts. ISO 14040 [10] defines the functional unit as ‘‘the quantified performance of a product system for use as a reference in a life cycle assessment study’’ [10]. Across the literature, significant disparities are found in the scope definition and functional units used in hydrogen production pathways research. This disparity is predominantly due to a difference in research focus. However, the period of study and LCA methodology also contribute to variability in impact assessment results.
As shown in Table 1, LCA software and databases have been extensively used in the literature to calculate environmental impacts. The use of such software and databases inventory tools may introduce bias into the impact results because of the geographical differences in factors such as natural gas composition, electrical grid makeup and regional infrastructure. As such, a Chinese study by Ren, Zhou and Ou [16] modified the data used in these databases and calibrated for their regional conditions. Furthermore, where studies have considered future modelling of environmental impacts, variability in results can be expected as database inventories are relative to date of study.
Environmental impact definitions and criteria vary across the literature. Lombardi applied the Ecoindicator’95 and Ecoindicator’99 methodologies [17], Hussain applied the ReCiPe (v1.13) methodology [18], and Cantono applied the Environmental Impact of Products (EIPRO) model [19], while the remainder of the literature applied methodologies directly from LCA software listed in Table 1 or applied unspecified methodologies. Of the literature analysed, all authors considered the impact category of greenhouse emissions while fewer included other impact categories such as acidification, human toxicity, and photochemical oxidation. The aforementioned impact categories are analysed in Section 4.
For comparison of the environmental impacts reported across the reviewed studies, the environmental impact equivalent per kilometre of bus travel was adopted as the primary functional unit wherever sufficient information was available. Results originally reported in passenger kilometres (pkm) were converted to a vehicle kilometre basis using the passenger loading or vehicle capacity reported in the respective study. Where sufficient information was not available to perform a reliable conversion, the results were retained in their original functional units and were not included in direct pathway averaging. Results reported per unit of hydrogen, such as per kg H2 or Nm3 H2, were similarly retained in their original units where conversion to bus kilometres could not be performed without introducing additional unsupported assumptions. For the aggregated pathway results presented in later sections, simple arithmetic means were calculated only from values reported in, or reliably converted to, the common functional unit adopted for their respective impact category. No weighting was applied according to study size, geographical coverage, publication year, or methodological quality. Differences in system boundaries, vehicle lifetimes, regional conditions, electricity generation mixes, and LCA methodologies were not mathematically normalised and were instead considered when interpreting the results.
3. Hydrogen Production Pathways
The main hydrogen production pathways explored in the literature are steam methane reforming, coal gasification, and water electrolysis. Within industry and the scientific community alike, hydrogen production can be classified into five main categories [1,31]:
- Green hydrogen—hydrogen produced by water electrolysis where the energy is supplied from low carbon sources, including renewable or nuclear power. GHG emissions can arise from the manufacturing of equipment.
- Grey hydrogen—hydrogen produced through steam methane reforming and the carbon produced is released into the atmosphere.
- Blue hydrogen—hydrogen produced through steam methane reforming where carbon produced is captured and stored.
- Brown hydrogen—hydrogen produced from the gasification of brown coal where the by-products of this process are released into the atmosphere.
- Hydrogen—hydrogen produced by water electrolysis where the energy used is from fossil fuel-based grid power.
The principal hydrogen production pathways and their corresponding hydrogen classifications are illustrated in Figure 4.
Figure 4.
Hydrogen production pathways [13].
Decarbonised hydrogen, including green and blue hydrogen, represents a promising pathway for reducing GHG emissions and other pollutants. Additionally, decarbonised hydrogen production is attracting ‘green’ investment and benefits from government carbon policies, which positively affect the economic sustainability of this pathway [13]. A detailed description of the hydrogen production methods is provided in the following subsections, while a concise summary of their key characteristics is presented in Table 2.
Table 2.
Summary of principal hydrogen production pathways considered in this review.
3.1. Steam Methane Reforming
Steam methane reforming (SMR) from natural gas is the predominant production method, contributing to over 75% of total hydrogen produced [20], and takes place in multiple steps. First, the natural gas feedstock, consisting primarily of methane (CH4), is transported to the processing facility where it is conditioned. Typically, sulphur is removed and the feedstock is dehydrated and compressed, before entering the production unit. Secondly, the conditioned natural gas is passed through a reformer with high-temperature steam in the presence of a catalyst. The steam molecules (H2O) react with the methane to produce synthesis gas (syngas). This syngas mainly comprises H2 and H2O but contains CO, CO2, and CH4. Thirdly, the syngas gas H2 content is increased through the water shift reactor (WSR), where CO reacts with steam to create CO2 and H2. Finally, the gas is purified to achieve a high H2 concentration using pressure swing adsorption (PSA), which consists of multiple vessels that adsorb all constituents except H2. Once one vessel is fully saturated, another is brought online while the saturated vessel is regenerated, and the tail gas is cycled back through the reformer [13,17,20]. The efficiency of the SMR process is around 74% [32,36]. The natural gas stream, unconverted CH4 and tail gas stream all may be combusted and recovered for heating of water to create steam used in the process [13].
3.2. Water Electrolysis
Hydrogen is produced through water electrolysis (WE), in which water molecules (H2O) are split into hydrogen and oxygen. Alkaline electrolysis is the most widely explored hydrogen production pathway, where electricity is the primary energy source [37,38]. At a fundamental level, alkaline electrolysis works on the principle whereby an electric current is passed through an electrolyte, potassium hydroxide (KOH), from a cathode through a porous membrane to an anode [13,17,20]. The conversion of electricity to hydrogen gas is approximately 77% efficient [20,33]. Water is reduced at the cathode to form hydrogen and oxidised at the anode to form oxygen. Alkaline electrolysers are lower in cost than technologies such as proton-exchange membrane (PEM) electrolysers, which use more specialised materials and have a relatively long operational life. The GHG emissions from WE are dependent on the electrical sources. When electricity is supplied from renewable sources such as wind, solar, and hydro, the hydrogen produced is referred to as green hydrogen and fewer emissions are generated [34]. However, the production of solar cells generates emissions [39] and requires significant capital investment [40]. When electricity is supplied from a fossil fuel source such as coal or gas, hydrogen produced has significant emissions. Water electrolysis is well suited for decentralised production of hydrogen due to its scalability and ability to be generated from all renewable and non-renewable energy sources [7].
None of the core studies included in the systematic comparative assessment evaluated nuclear powered electrolysis as a separate hydrogen production pathway. Nuclear generation is nevertheless present within some regional electricity mixes considered in the reviewed studies, but its individual contribution to the reported environmental impacts cannot be separated from the other generation sources. Nuclear generated electricity can be used for conventional water electrolysis, while advanced nuclear systems can supply both electricity and process heat for high-temperature electrolysis. Such pathways can achieve relatively low life cycle GHG emissions because nuclear power has low direct operational carbon emissions and can provide a continuous electricity supply. However, the life cycle environmental profile also includes impacts associated with uranium extraction and fuel processing, nuclear power plant and electrolyser construction, spent fuel and radioactive waste management, and associated radiological protection requirements. Consequently, nuclear powered electrolysis may offer a low carbon hydrogen pathway, but its environmental assessment should consider these nuclear fuel cycle specific impacts in addition to conventional LCA indicators [41,42].
3.3. Coal Gasification
Coal gasification is a similar process to SMR. Within a controlled vessel at high pressure and temperature, crushed coal is combined with steam and a regulated amount of oxygen to prevent complete combustion [43,44]. The oxygen reacts with the coal carbon atoms to form carbon monoxide (CO) and the released hydrogen atoms combine to form hydrogen gas molecules (H2). The product stream from this process is syngas, which mainly consists of CO and H2 but also contains other compounds, such as hydrogen sulphide (H2S), which are subsequently removed. The hydrogen concentration is further increased by passing the syngas stream through a water shift reactor where the CO reacts with steam in the presence of a catalyst to create CO2 and H2 [15,35,45]. When compared to SMR, coal gasification is more carbon rich, resulting in higher GHG emissions as part of the hydrogen production process [13,46].
3.4. Carbon Capture and Storage
Carbon capture and storage (CCS) is a transitional technology that can help mitigate anthropogenic climate change associated with the energy industry [13,47,48]. CCS comprises two stages: carbon capture and carbon storage. Carbon capture has been used extensively in industry for several decades through chemical absorption using solvents, such as aqueous amine. For this process the product stream is passed through an absorption column where the solvent bonds with process CO2 until saturated. The solvent is then regenerated by heating with superheated steam which then releases the bound CO2. This process is used for both CO2 removal from natural gas and post-combustion capture of CO2 from flue gas streams [10]. For SMR and coal gasification hydrogen production pathways, CO2 is captured through the process at the water shift reactor and pressure swing absorber. The captured carbon needs to be safely stored for a significant period. One such method is geological sequestration, whereby CO2 is stored underground as a supercritical fluid in depleted hydrocarbon reservoirs. Here, the CO2 is stored at the required pressure and temperature to maintain a supercritical state, in a similar fashion to the hydrocarbons formerly extracted from the reservoir. Consequently, it may be stored for millennia [14,49].
3.5. Hydrogen Fuel Cell Bus
Traditional diesel-fuelled transit buses create local emissions such as CO, CO2, SO2, NOx, and particulate matter (PM), which impact human health and contribute to broader environmental issues [4]. Hydrogen fuel cell buses (HFCBs) are one solution to urban air pollution because of their zero tail pipe emissions. When fuelled with hydrogen produced through low GHG emitting pathways, they can also reduce overall emissions from the transport sector. Public passenger transport also provides an important platform for the implementation of alternative propulsion technologies, with electricity, hydrogen and biofuels representing key alternatives to conventional fossil fuels [50]. In the case of hydrogen fuel cell buses, practical deployment requires integration of hydrogen storage and fuel cell power generation with the electric drivetrain, together with appropriate hydrogen supply and refuelling infrastructure [50]. Early prototype hydrogen fuel cell bus technology studies include the 2001 FC Cirtaro shown in Figure 5 which has ranges of 200–300 km, a 70-passenger capacity and a top speed of 80 km/h [7]. This bus was developed for arguably the first full-scale FC bus trial NEFLEET (New Electrical Fleet) to be carried out across 8 European cities in the early 2000s. This bus was later used in a similar study for Clean Urban Transport in Europe (CUTE) aimed at measuring the performance and environmental impacts of proton-exchange membrane fuel cell (PEMFC) bus operation with a range of hydrogen production pathways. Binder et al. [2] accumulated approximately 1,000,000 km and 70,000 h of results, finding that the operational phase of these buses performed above expectations with no critical failures in either the main drivetrain or the hydrogen fuel cell (HFC) [2]. Proton-exchange membrane fuel cells, or polymer-electrolyte membrane fuel cells, first developed by General Electric in the 1960s for the NASA Gemini space programme, have been widely adopted as the HFC technology of choice for HFC transit buses [51]. PEMFCs are widely recognised for their high efficiency and zero emissions during operation. When coupled with hydrogen as the energy carrier, they have the potential to reduce life cycle emissions [7].
Figure 5.
Typical hydrogen fuel cell transit bus [7,52].
Hydrogen fuel cell technology has been developed as an electrical power source for transit buses, either as an all-electric drivetrain or, more recently, in combination with battery technology as a hybrid drivetrain. As shown in Figure 6, HFCBs with integrated hybrid drivetrains achieve higher efficiencies because during acceleration, the battery supplements the power output from the HFC. This allows the HFC to operate closer to its optimum design point while providing power for normal operation and recharging the battery [21,22]. Additionally, regenerative braking charges the battery when the bus decelerates and has the benefit of significantly reducing PM emissions [23].
Figure 6.
Hydrogen fuel cell hybrid drivetrain [22].
In the hybrid HFC bus configuration shown in Figure 6, the hydrogen fuel cell provides the primary electrical power for vehicle operation, while the battery acts as an auxiliary energy storage system. During periods of high power demand, such as acceleration, the battery supplements the fuel cell output, allowing the fuel cell to operate closer to its optimum operating condition. The electrical energy is supplied to the traction system to drive the bus, while during deceleration, regenerative braking recovers part of the vehicle’s kinetic energy and stores it in the battery for subsequent use. This combined arrangement improves overall drivetrain efficiency and reduces the transient load imposed on the fuel cell.
Since the early demonstration programmes discussed above, hydrogen fuel cell buses have progressed from prototype-scale trials toward operational fleet deployment. Recent European demonstration and deployment programmes indicate that fuel cell buses are now being operated in regular public transport services across multiple cities and regions, demonstrating increasing technological maturity. More than 400 fuel cell electric buses were deployed through European hydrogen mobility demonstration activities between 2005 and 2023, while the JIVE and JIVE 2 programmes have supported the transition toward larger fleets and broader commercial deployment. Nevertheless, widespread commercial adoption remains at an early stage. Key challenges include the relatively high ownership cost of fuel cell buses, the availability and cost of low-carbon hydrogen, and the need for reliable and sufficiently scaled hydrogen refuelling infrastructure. Therefore, fuel cell buses can presently be considered a technically demonstrated and increasingly commercialised zero-emission transport option, although further cost reduction and infrastructure expansion are required for broader deployment [53,54].
4. Impact Analysis
The environmental impact analysis of the literature is reported based on impact category. As shown in Table 1, GHG emissions or global warming potential (GWP) are the dominant metrics across the reviewed literature while terrestrial acidification, human toxicity, and photochemical oxidation are considered to a lesser extent. These four impact categories were selected for analysis because at least two results were reported in the literature, allowing for a comparison. Evaluation of each impact category accounts for both hydrogen production life cycle phases and hydrogen fuel cell transit bus life cycle phases, where the primary functional unit used in the analysis is the impact category equivalent value per kilometre of bus travel.
The aggregated results presented in Figure 7, Figure 8, Figure 9 and Figure 10 represent arithmetic means of comparable values within each hydrogen production pathway. Only results expressed in, or reliably converted to, the common functional unit selected for the respective impact category were included in these averages. Values that could not be normalised using information reported in the original studies were excluded from the aggregation.
4.1. Climate Change
Greenhouse gas emissions are a major contributor to climate change. Huijbregts [9] defines the GHG impact category in terms of kilograms of carbon dioxide equivalent (kgCO2eq). Increased atmospheric GHG concentrations lead to increased radiative forcing and, consequently, an increase in global mean temperature [9]. Figure 7 shows the average GHG emissions of hydrogen production pathways reported in the reviewed studies [4,16,17,18,19,20,22,23,24,25,26], using kgCO2eq/km as the functional unit. The hydrogen production pathway with the lowest GHG emissions is WE, where electrical energy used is from renewable sources (WE R). The coal gasification pathway has the highest GHG emissions, with total life cycle emissions from hydrogen production and HFCB use reaching 2.8 kgCO2eq/km. Across the literature, several studies have analysed WE pathways supplied by electricity grids containing both renewable and non-renewable energy sources (WE NR + R), which results in this pathway being the third largest GHG emitter in the comparison. This interpretation of GHG emissions is at odds with the results from Binder et al. [2], where the authors find hydrogen production via electrolysis as predominantly comprised from fossil fuels such as coal and natural gas. Thus, GHG exceeds all other production pathways [2,4]. The overall impact of WE hydrogen produced from grid electricity with an unknown renewable contribution is not directly comparable because of differences in how impact data are reported across the literature.
Figure 7.
Average GHG emissions per hydrogen production pathway.
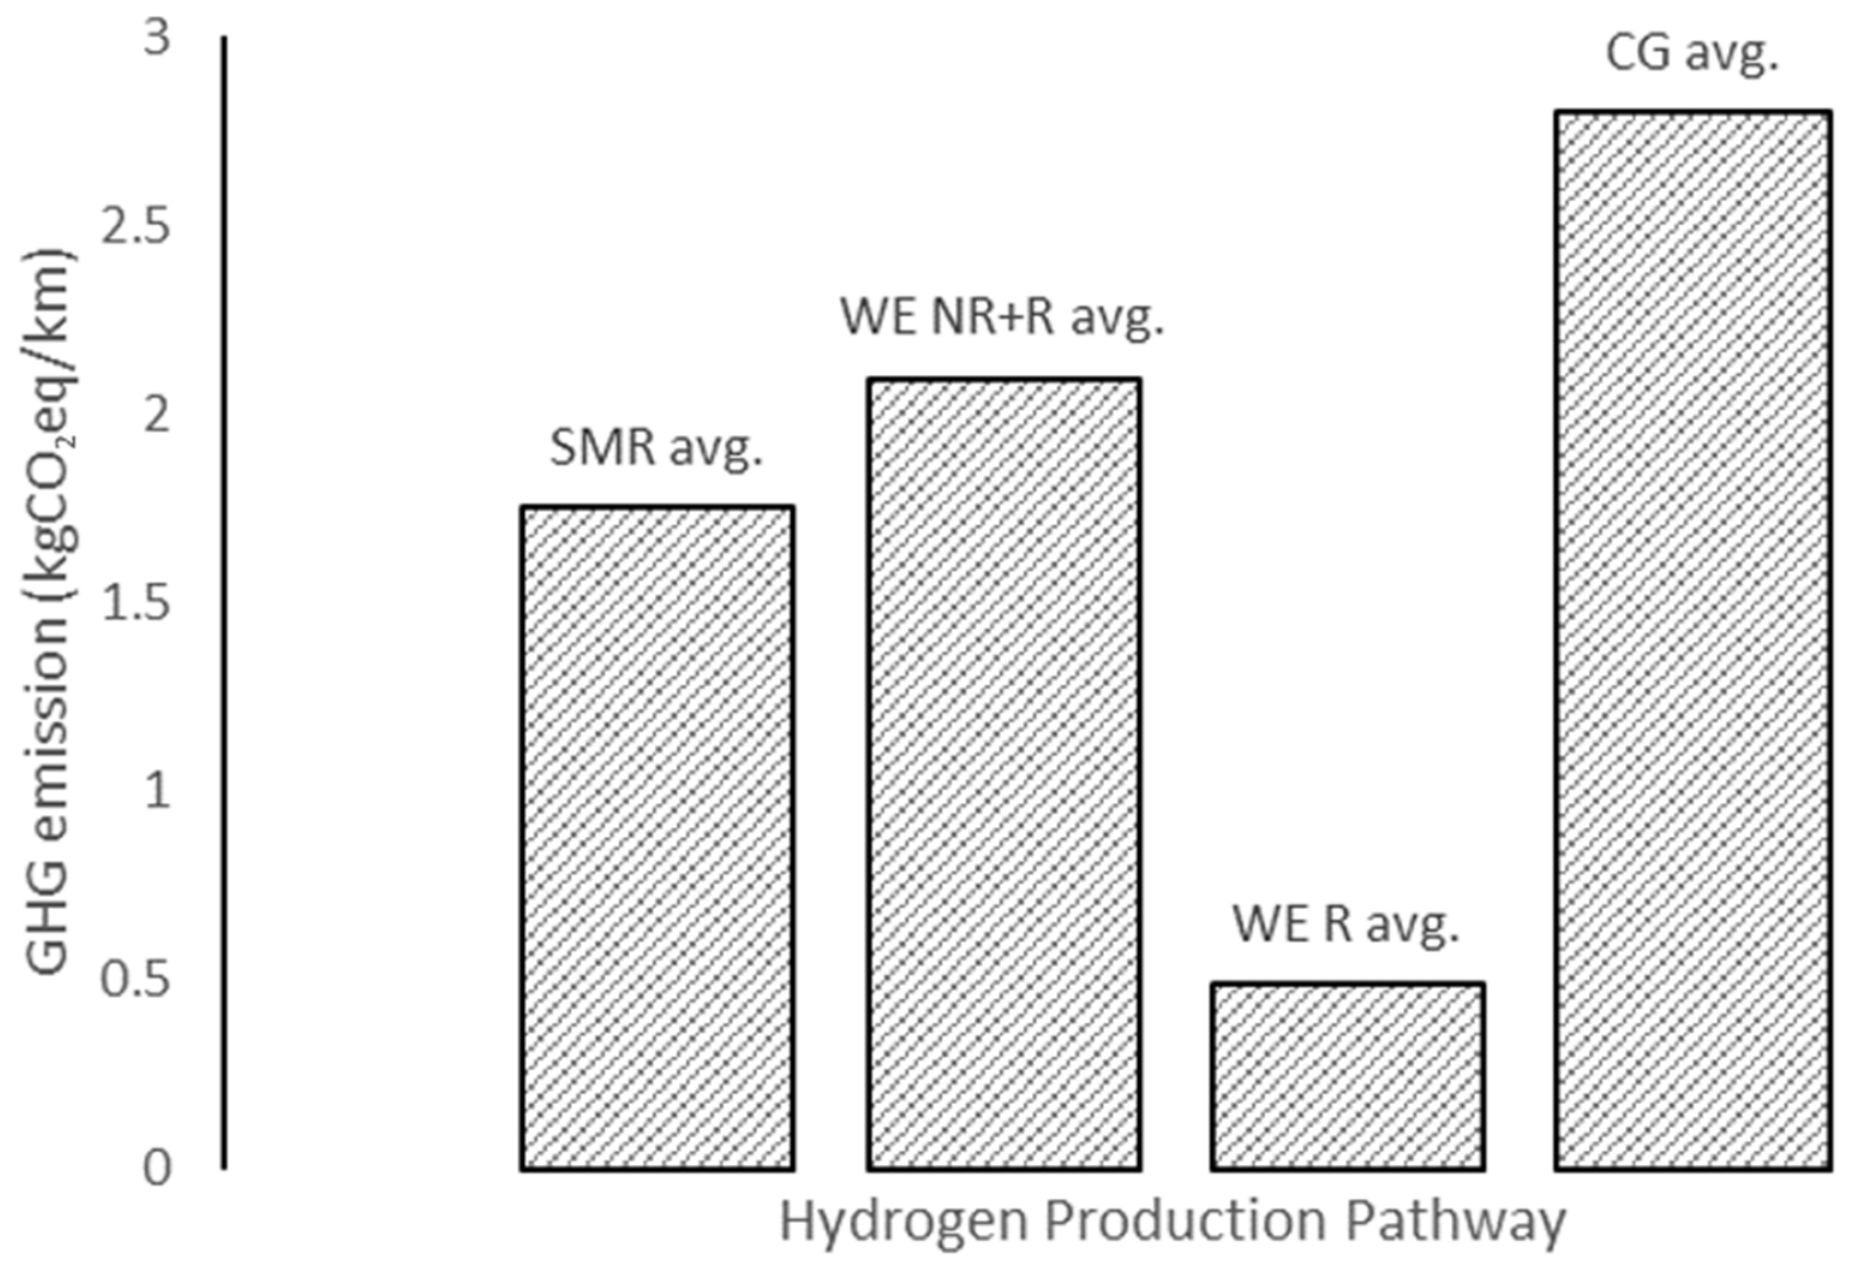
Wulf and Kaltschmitt [27] presented a 2012 study analysing the overall life cycle of CG hydrogen production from German hard rock coal. Assessing the production from a centralised facility, and accounting for by-products of the CG process such as sulphur, which is extracted from hydrogen sulphide (H2S), the authors calculated the GHG impact based on the German Energy Mix 2010. Wulf and Kaltschmitt found that up to 3.1 kgCO2eq/kg H2 @70 MPa is directly associated with the electrical energy used in the process for auxiliary equipment [27]. As found in Table 3 for CG hydrogen production alone, they calculated GHG emissions to be 23.1 kgCO2eq/kg H2 @70 MPa. In 2020, coal electrical power generation forms over 60% of China’s grid makeup and consequently remains an important energy pathway [16]. Ren, Zhou and Ou [16] modelled the life cycle energy demand and GHG emissions of CG hydrogen production and HFCB operation in China from three different processes. Of the three processes, fluid bed gasification is analysed as the conservative GHG emitter of the three. The authors note that the most important factor affecting the GHG emissions is the efficiency of the gasifier [16], where most of the GHG emissions occur [27]. As per Table 3, Ren et al. calculated a total life cycle GHG impact of 2.8 kgCO2eq/km, reaching a similar conclusion. Wulf and Kaltschmitt [27], as well as Ren, Zhou, and Ou [16], all calculate CG to be the second largest GHG emitter when compared to WE from a non-renewable coal fired-based grid. This represents an approximate 30% reduction in GHG emissions, which is attributed to the reduction in energy conversions and the credits given for CG by-products.
Table 3.
Hydrogen production pathway climate change environmental impacts.
In the case of SMR, the composition of the natural gas feedstock used for SMR can influence the resulting life cycle GHG emissions because feedstocks contain varying concentrations of methane, carbon dioxide, hydrogen sulphide, and other constituents. However, this variation is expected to be relatively limited whenever economically viable feedstocks contain high methane and comparatively low carbon dioxide concentrations.
As possibly one of the first studies of this type, Faltenbacher et al. [7] conducted an LCA on the use of HFC propulsion technology for transit buses and hydrogen production pathways across 10 European cities. Their 2001 conceptual LCA study focused on the production, operation and end of life for the NEFLEET PEMFC buses, referencing an early version of the ISO 14040 [10] standardised methodology. In terms of environmental impact analysis, this study focused on the SMR production pathway due to the existing infrastructure. The study reported CO2 emissions of 1.11 kg/km of HFCB travel and concluded that the SMR hydrogen production pathway resulted in a 21% reduction of CO2 emissions when compared to diesel equivalents for transit buses circa 2001. A reduction of this significance has yet to be found elsewhere in the literature and is concluded to be an overestimation of the improvements in GHG emissions.
Cantono, Heijungs and Kleijn [19] presented a 2008 analysis of the environmental consequences of SMR hydrogen production and HFCB operation on the 2005 European Union economic system (EU25). This study is not a LCA according to ISO 14040 [10] but an environmental IO analysis based on the EIPRO model. The authors assessed three scenarios of HFCB adoption in comparison to equivalent diesel transit buses via a well-to-wheel evaluation. Scenario one is the 10% adoption of HFCB in the replacement of existing buses using an SMR production pathway. The scenario has comparative analysis to the literature reviewed. Table 3 presents the results calculated by Cantono et al. [19] for scenario one. The calculated GHG emissions, 2.065 kgCO2eq/km of HFCB travel, aligns with the values presented in other European studies [2,7,17,20,26,27], providing credibility to the calculation methodology used by the authors where they modified the Leontief input–output analysis matrix model [19].
In 2009, Ou, Zhang and Chang [4] conducted an LCA of alternative fuel vehicles (AFVs), including HFCBs, in China and compared their energy use and GHG emissions with those of conventional diesel buses. The study conducted a well-to-wheel analysis using Tsinghua-CA3EM, which is an “integrated computerized model for China’s automatic energy supply and demand balance calculation” [4] based on Chinese national conditions. Using this model, the authors consider three types of emissions forming the GHG impact categories of CO2, CH4, and N2O. In contrast to the other reviewed literature, the authors reported that the fuel production energy conversion efficiency of NG SMR derived H2 was 66.1%, which is considerably lower when compared to traditional hydrocarbon fuel pathways. The authors report the GHG impact result of the SMR pathway to be 2 kgCO2eq/km of HFCB travel. Critically analysing their results, they found that the calculated GHG emissions and energy consumption were significantly higher than those reported in a similar 2006 Canadian study; however, the authors noted that their approach was comparatively pessimistic. They concluded that further GHG emission reductions could be realised through improvements in fuel production efficiency. Factors affecting production efficiency include NG feedstock quality, H2 conversion efficiency and production facility utilisation.
Sánchez et al. [20] presented a 2013 study primarily focused on the LCA of alternative fuel buses for the city of Madrid, Spain. The authors applied a well-to-wheel approach and accounted for the complete life cycle of HFCB, including raw materials, manufacture, operation, and end-of-life disposal. The HFCB studied involved a hybrid drivetrain fitted with PEMFC and parallel battery systems with a lifetime of 880,000 km. The LCA was conducted in accordance with ISO 14040 [10] and used the GaBi 4 model to determine the resulting GHG emissions from all energy sources and mass balance from manufacturing phases [20]. A key aspect of the study involved evaluating the effect of increasing renewable electricity generation capacity on GHG emissions over several years [20]. As found in Table 3, Sánchez et al. found that the SMR hydrogen production pathway reduced GHG emissions for every year accounted for starting from 2008. This is due to the renewable electrical generation component of the Spanish grid where the hybrid HFCB can charge batteries from a grid and, to a lesser extent, the electricity used in H2 production (pumps, compressors, etc). In a similar 2018 study, Lozanovski et al. [26] focused the LCA on fuel consumption during the operational phase of a fleet of hybrid hydrogen fuel cell transit buses. In terms of GHG emissions, parallels can be found with respect to hybrid HFCB between these two studies and are found in Table 3. Lozanovski et al. [26] calculated for the SMR production pathway the impact of hybrid HFCB operation, which was 1.58 kgCO2eq/km. Meanwhile, Sánchez et al. [20]’s calculation for the year 2030 was 2.02 kgCO2eq/km. Although there is a difference of 0.44 kgCO2eq/km, which may be explained by the broader LCA boundary used by Sánchez et al. [20], the relatively small difference in GHG impact between studies from the same region is notable.
Two separate 2019 studies by Lee et al. [23] and Chang et al. [25] measured the GHG impact of HFCBs in terms of passenger kilometres, which is a rarely used functional unit amongst the literature analysed. The passenger kilometres functional unit means transporting ‘one person one kilometre’ and accounts for transit bus passenger volume and duty cycle [25]. Chang et al. [25] studied the GHG emissions from alternative fuel buses in Tainan City where their LCA focuses on the full life cycle of HFCB including manufacturing from raw materials, bus operation, maintenance, and end-of-life disposal. Their study accounted for hydrogen fuel manufacturing including the SMR pathway. Lee et al. [23] studied the environmental impacts of HFCB use in the United States (US) and focused on a well-to-wheel LCA approach. They excluded HFCB manufacturing and hydrogen refuelling infrastructure and accounted only for HFCB fuel use. The study conducted across the US assessed the GHG over 12 years and concluded that HFCB fuelled by a centralised SMR hydrogen pathway had approximately 22–28% lower GHG emissions than diesel bus alternatives [23]. Chang et al. [25] concluded that HFCB operation in Tainan City from SMR hydrogen production pathway would potentially result in a GHG reduction of 1.2 million tonnes of CO2eq. In contrast, as per Table 3, Chang et al. [25] calculated GHG emissions to be 0.02917 kgCO2eq/pkm and Lee et al. [23] calculated them to be 0.304 kgCO2eq/pkm. This order-of-magnitude disparity may be attributed to LCA boundary conditions, regional terrain, climate and passenger duty cycle. Considering results from the remaining literature, it is suggested that the GHG emission results from Chang et al. [25] are excessively optimistic.
Two separate 2020 studies by Iannuzzi, Hilbert, and Silva Lora [24], as well as Ren, Zhou, and Ou [16], assessed the GHG impact of centralised SMR hydrogen production and decentralised SMR hydrogen production. Iannuzzi et al. [24] conducted an LCA comparing existing fossil fuel internal combustion engine (ICE) buses with PEMFC transit buses powered by different hydrogen production pathways. The study focused on the extraction, manufacture and operation phase of hydrogen production and the operation phase of HFCB in Rosario, Argentina. The study assessed the GHG impacts of two SMR hydrogen pathways: centralised and decentralised production. As seen in Table 3, the authors found that the decentralised SMR hydrogen production pathway has the lower GHG emissions of the two. Ren et al. [16] modelled the life cycle energy demand and GHG emissions of HFCB in China. Their 2020 research conducted a well-to-wheel analysis using a model developed specifically for Chinese conditions based on the Tsinghua University Life Cycle Analysis Model (TLCAM). For the SMR hydrogen production pathway, the model focused on NG extraction, NG transportation, hydrogen production, transportation and hydrogen refuelling station, and HFCB operation. Data was obtained from both empirical and literature sources. Like Iannuzzi et al. [24], the authors assessed both centralised and decentralised SMR hydrogen production. Of the various hydrogen transportation options presented, the road-based 20 MPa tube trailer is assessed as being the most feasible option and the authors find centralised SMR hydrogen production has the greatest efficiency, citing 77% when compared to decentralised production citing 65% [16]. As seen in Table 3, there is a marginal difference between the two pathways. In contrast, Iannuzzi et al. [24] found that decentralised production was the lower GHG emitter. Supporting the higher efficiency results of centralised SMR production from Ren et al. [16], Wulf and Kaltschmitt [27] also reported that centralised SMR hydrogen production is more efficient than decentralised SMR, including the transportation impacts associated.
The life cycle GHG performance of water electrolysis is strongly influenced by the electricity source and regional-grid composition. This sensitivity is evident across the reviewed studies, which assess both grid-supplied electricity and specified renewable electricity sources under different regional and temporal conditions. An early 2001 study by Faltenbacher et al. [7] had largely optimistic CO2 emission reduction estimates when using WE from renewables claiming a 40% reduction when compared to diesel internal combustion engine buses.
The 2012 study from Wulf and Kaltschmitt [27] considered both renewable and non-renewable WE hydrogen production and distribution pathways. The authors analysed hydrogen produced via WE powered by the German national grid circa 2010 and an unspecified renewable source. As per Table 3, hydrogen produced from grid power is 7.8 times more intensive in GHG emissions than the renewable alternative. Given that Wulf and Kaltschmitt [27] claim that more than 95% of all production-phase GHG emissions are produced by electrical generation, the sensitivity of GHG impact is essentially based on a grid-power generation make-up. It is now well established that in terms of hydrogen production’s GHG impact alone, WE pathways using fossil fuel-based grid power are significantly more GHG emission-intensive than renewable pathways [2,27].
One of the most important studies measuring the impact of renewable energy sources on grid-based power hydrogen production was the 2014 study conducted by Sánchez et al. [20]. Focusing on a well-to-wheel assessment of hydrogen production and the complete life cycle of HFCB operating in Madrid, Spain, the authors calculated the GHG impact of a transitioning electrical grid makeup. Accounting for three consecutive years from 2008 to 2010 and then making an assessment for the year 2030, Sánchez et al. showed a clear trend in the reduction of a fossil fuel-based grid power and an increasing reliance on renewable power generation. For the year 2030, it is expected that coal consumption will have reduced by 73% and NG by 25%, as well as an increase in wind generation by 280%, hydroelectric by 138%, solar photovoltaic (PV) by 250% and biomass by 541%. As found in Table 3, the authors calculated the GHG emission rate for WE hydrogen production from grid-based power to be 2.5 kgCO2eq/km for the year 2008 and reduced to 1.7 kgCO2eq/km for the year 2030, representing a more than 30% reduction in emissions.
While previous studies have focused on centralised WE hydrogen production pathways, Lozanovski et al. [26] and Iannuzzi et al. [24] consider decentralised production where hydrogen is produced at the point of supply [26]. They focus their 2018 study primarily on HFCB operation where the hydrogen used is produced at a point of supply via WE powered from unspecified renewables. Over the complete 720,000 km life cycle of the hybrid HFCB, Iannuzzi et al. [24] calculate a GHG impact of 0.416 kgCO2eq/km, with the major GHG contributions coming from initial manufacturing and the replacement of HFC every 240,000 km. They focus their 2020 study on a well-to-wheel analysis of WE hydrogen production and HFCB operation in Argentina. The authors consider both centralised and decentralised WE hydrogen production pathways based on grid power at a primary energy demand (PED) GHG emission of 0.40 kgCO2eq/kWh. As shown in Table 3, they calculate a GHG impact of 2.1 kgCO2eq/km for the centralised pathway and 1.94 kgCO2eq/km for the decentralised pathway. These results demonstrate that the hydrogen produced by WE at the point of supply has a lower GHG impact because there are no hydrogen transport and distribution-related impacts. Considering the source of electrical power and the LCA boundary differences of Iannuzzi et al. [24] and Lozanovski et al. [26], a large difference in the decentralised hydrogen production pathway calculated in GHG emissions per km of HFCB travel is to be expected.
Studies by Lee et al. [23] and Ren et al. [16] conduct broad regional investigations on renewable WE hydrogen production and HFCB operation. Both studies consider a well-to-wheel approach and focus on fuel usage, accounting for different passenger loadings, the duty cycle of buses, regional sensitivities and HFCB efficiency. Lee et al. assess the GHG impact of centralised hydrogen production from WE powered by wind generation in the United States. Their results, as shown in Table 3, are in terms of passenger kilometres, with the national average passenger load reported as 10 persons per bus. Conversion of the passenger kilometre-to-kilometre results in a GHG impact of 0.48 kgCO2eq/km. Ren et al. [16] assessed the GHG impact of centralised hydrogen production by WE from hydroelectric generation in China. Adapting a similar methodology to Lee et al. [23], Ren et al. used the Greenhouse gases, Regulated Emissions, and Energy use in Transportation (GREET) model [16], modelled specifically for Chinese conditions. They calculated a GHG impact of 0.6 kgCO2eq/km, as seen in Table 3. The GHG emission results from Lee et al. [23] and Ren et al. [16] both fall within the range of 0.4–0.7 kgCO2eq/km for renewable WE hydrogen production pathways, demonstrating consistency between their results. In the study [55], hydrogen fuel cell vehicles instead of buses are used and WTW emissions from biomass H2 are 1.06 kgCO2eq/km.
4.2. Terrestrial Acidification
Terrestrial Acidification is the change in soil acidity from its natural level. Huijbregts [9] defines the impact category as “atmospheric deposition of inorganic substances such as sulphates, nitrates and phosphates, causing a shift in soil acidity” [9]. A change in soil acidity from the naturally occurring optimum level harms native flora, a phenomenon called terrestrial acidification. Significant atmospheric emissions that result in acidification are sulphur dioxide (SO2), ammonia (NH3) and nitrogen oxide (NOx) [9]. The acidification potential is expressed in kg of sulphur dioxide equivalents (kgSO2eq). Figure 8 shows the average acidification potential emissions as reported [17,18,19,22], where the functional unit is kgSO2eq/km. Although acidification potential was assessed in a 2006 study from Binder et al. [2] for WE’s non-renewable pathway, their results have not been included in this impact averaging, as the results were not in the standard functional unit of kgSO2eq/km. Consequently, the production pathway of WE, where the electrical energy used is from non-renewable and renewable sources (WE NR + R), reports much lower acidification potential emissions. Evidently, from Figure 8, acidification potential emissions occur predominately during hydrogen production from fossil-based sources, particularly steam methane reforming. However, a moderate SO2 emission is incurred during the extraction of raw materials used for manufacturing renewable energy sources and HFCB [21].
Figure 8.
Average acidification potential impact per hydrogen production pathway.
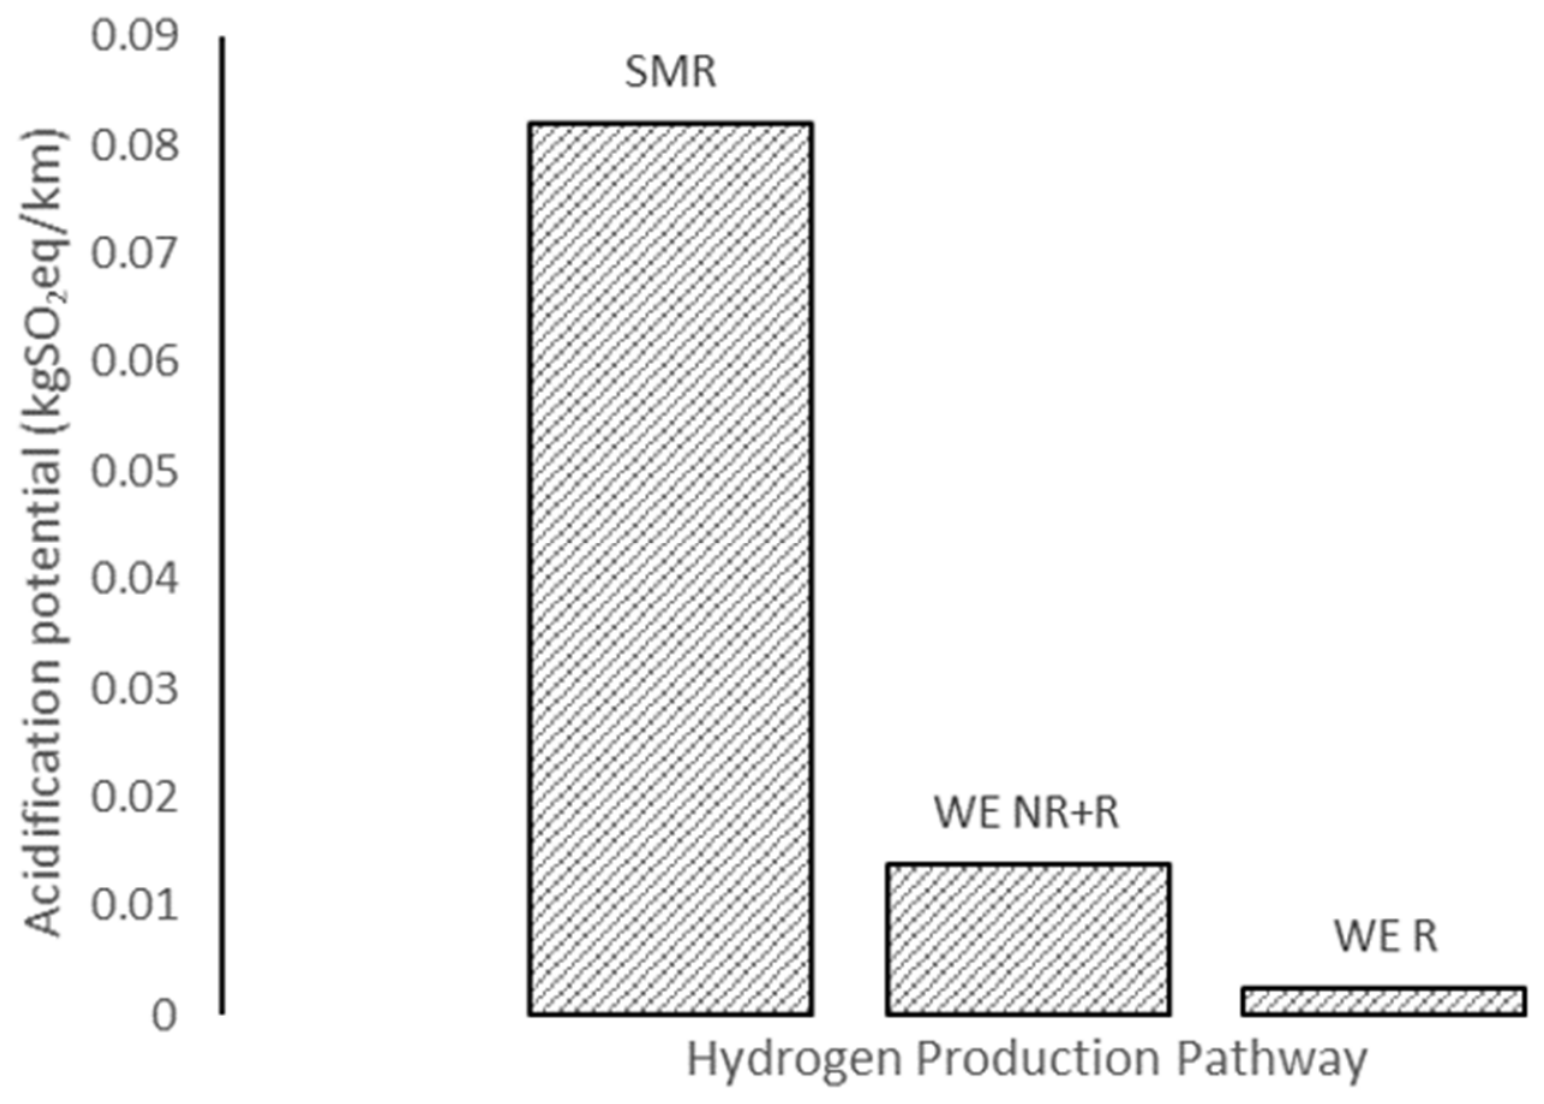
The 2006 study from Binder, Faltenbacher and Fischer [2] explores SMR production pathways and three different WE hydrogen production pathways from the German national grid circa 2001, renewable wind power generation and renewable hydro power generation. The authors found the most significant factor contributing to the environmental impacts to be the electrical supply used in the WE process. In terms of primary energy demand, WE from grid power has double that of SMR. For both renewable pathways, wind and hydro, a significant reduction of PED has been reported at 53 MJ/H2 Nm3 @440 bar and 24 MJ/H2 Nm3 @440 bar, respectively. The most significant PED contribution from both renewable pathways is from the manufacturing phase of their life cycle [2]. With respect to life cycle impacts, SMR is the second largest contributor behind grid-powered electrolysis in almost all measured emission output streams, including CO2, CO, NOx, CH4, and SO2. As seen in Table 4, for hydrogen produced from SMR, the calculated acidification potential emission is 0.0019 kgSO2/H2 Nm3 @440 bar. As seen in Table 4, hydrogen produced via WE from the 2001 German national power grid accounts for more than 85% acidification potential (SO2eq) when compared to renewable WE pathways. Binder et al. [2] concludes that since electrical grid power is largely based on fossil fuels, WE pathway is not environmentally feasible and, in most impact categories, is double that of its nearest hydrogen production pathway [2]. It is unclear if the authors considered renewable sources as part of the electrical grid, but given that the research reflects an early 2000s electricity mix, the emissions presented in Table 4 would be significantly fewer today due to technological advancements. Additionally, the study fails to consider the impacts of HFC transit buses, making direct literature comparisons inaccurate.
Table 4.
Hydrogen production pathway acidification environmental impacts.
Steam methane reforming pathway acidification impacts predominantly occur during the production phase. The 2008 analysis by Cantono, Heijungs and Kleijn [19] assessed three scenarios of HFCB adoption within the EU25 system in comparison to diesel-equivalent transit buses via a well-to-wheel evaluation. Scenario one is the 10% adoption of HFCB in the replacement of existing buses using an SMR production pathway. Table 4 presents the results calculated by the authors for scenario one. Lombardi, Carnevale and Corti [17] presented a 2011 LCA evaluating the environmental effects of hydrogen production in Florence, Italy. Their life cycle analysis included the extraction, manufacture, construction, and production phases of three hydrogen production pathways. Like Ou et al. [4], when conducting the IO inventory analysis, where empirical data was unavailable the authors sourced data from the literature. In all three production pathways, including SMR, the period of analysis was 20 years over which they assessed the impact categories of climate change and acidification potential (AP). Their analysis focused on scenario two where the produced hydrogen fuel is used in 24 mini-HFCB with hybrid-series drivetrains. Like Sánchez et al. [20] and Lozanovski et al. [26], the hybrid drivetrain included a battery. However, in the case of a series drivetrain considered by Lombardi et al. [17], the HFC would charge the battery, and in turn, the battery would power the electric motor for propulsion. The results of the SMR production pathway are found in Table 4, which have been calculated from scenario two, involving 24 HFCB operation daily fuel consumption and the reported AP emissions per kilogram of H2 produced. Significant differences are observed in acidification impacts, with the emission rate calculated by Cantono et al. [19] being more than twice that reported by Lombardi et al. [17]. This difference is largely due to the substantial difference in sample size being analysed, where Cantono et al. [19] considers 16,600 buses and Lombardi et al. [17] considers only 24 buses. Additionally, the AP being significantly lower can be attributed to the exclusion of HFCB impacts from non-operational phases.
An important environmental impact factor when analysing water electrolysis hydrogen production is the primary energy source used in the generation of electrical supply for the process. Two similar studies from Briguglio et al. [22] and Lombardi et al. [17] consider a renewable hydrogen production pathway where HFC minibuses were used with limited passenger numbers in city environments. Using a SimaPro LCA model, Briguglio et al. [22] determined the acidification impact against the functional unit of 1400 person-kilometres. Assuming a maximum passenger capacity for the minibuses, the conversion of passenger kilometres to kilometres can be made, allowing for direct comparison. In terms of acidification potential, as seen in Table 4, Lombardi et al. [17] calculated for the WE PV pathway an emission rate of 0.033 kgSO2eq/km and for the WE hydro pathway an emission rate of 0.0133 kgSO2eq/km. Basic conversion of the wind-renewable pathway by Briguglio et al. [22] for acidification potential emission results in 0.0017 kgSO2eq/km. The results from all three renewable pathways demonstrate the generation of acidification emissions through the raw material extraction and manufacturing phases. Tahir and Hussain [18] focus their 2020 study on assessing the environmental impacts of HFCB mobility and hydrogen production from WE powered by the German national electrical grid. Three scenarios of the German energy mix were considered: German grid mix for the year 2019, predicted 2050 grid install base, and 2050 grid renewable install base only. Using OpenLCA software version 1.9.0 and previous literature, Tahir and Hussain [18] modelled the complete life cycle of hydrogen production and HFCB. Unlike much of the other literature analysed, their study assessed the impacts of climate change, terrestrial acidification, human toxicity, and photochemical oxidation, in accordance with ReCiPe methodology. The calculations are based on the hydrogen consumption rate of buses at a maximum capacity of 76 passengers and electrolyser efficiencies of 60% for the year 2019 and 72.2% for the year 2050 [18]. The results seen in Table 4 are presented in passenger kilometres, which can be calculated to kilometres travelled assuming maximum passenger capacity. Tahir and Hussain [18] demonstrated that acidification emissions can be reduced through WE hydrogen production as greater renewable power generation is integrated into the grid or renewables have completely replaced fossil fuels. For the year 2019, acidification emissions are calculated to be 0.00013 kgSO2eq/pkm; for the year 2050, the mix grid scenario is calculated to be 0.000095 kgSO2eq/pkm and full renewable scenario to be 0.00009 kgSO2eq/pkm, resulting in a maximum 31% reduction.
4.3. Human Toxicity
Human toxicity refers to the harmful effects of chemical emissions on human health. Huijbregts [9] defines the impact category as the emission of a chemical with persistence, accumulated in the human food chain or through direct exposure, resulting in human intake and causing diseases damaging to human health [9]. The toxicity potential is expressed in kg of 1.4-dichlorobenzene equivalents (kg1.4DCBeq). Figure 9 demonstrates the average human toxicity potential emissions as reported [18,22] where the functional unit is kg1.4DCBeq. No impact data has been presented on SMR and CG hydrogen production pathways in the literature. Based on Figure 9, human toxicity potential is not generated entirely from combustion or use of fossil fuels where the WE R production pathway is greater than half of the WE NR + R pathway. This suggests that a significant proportion of the human toxicity impact is generated from the raw material extraction and manufacturing phases. Sources of toxicity include heavy metals, such as cadmium used in hybrid HFCB batteries and chromium used in steel manufacturing, where the waste streams of these processes make their way into the human food chain streams or are directly ingested.
Figure 9.
Average human toxicity impact per hydrogen production pathway.
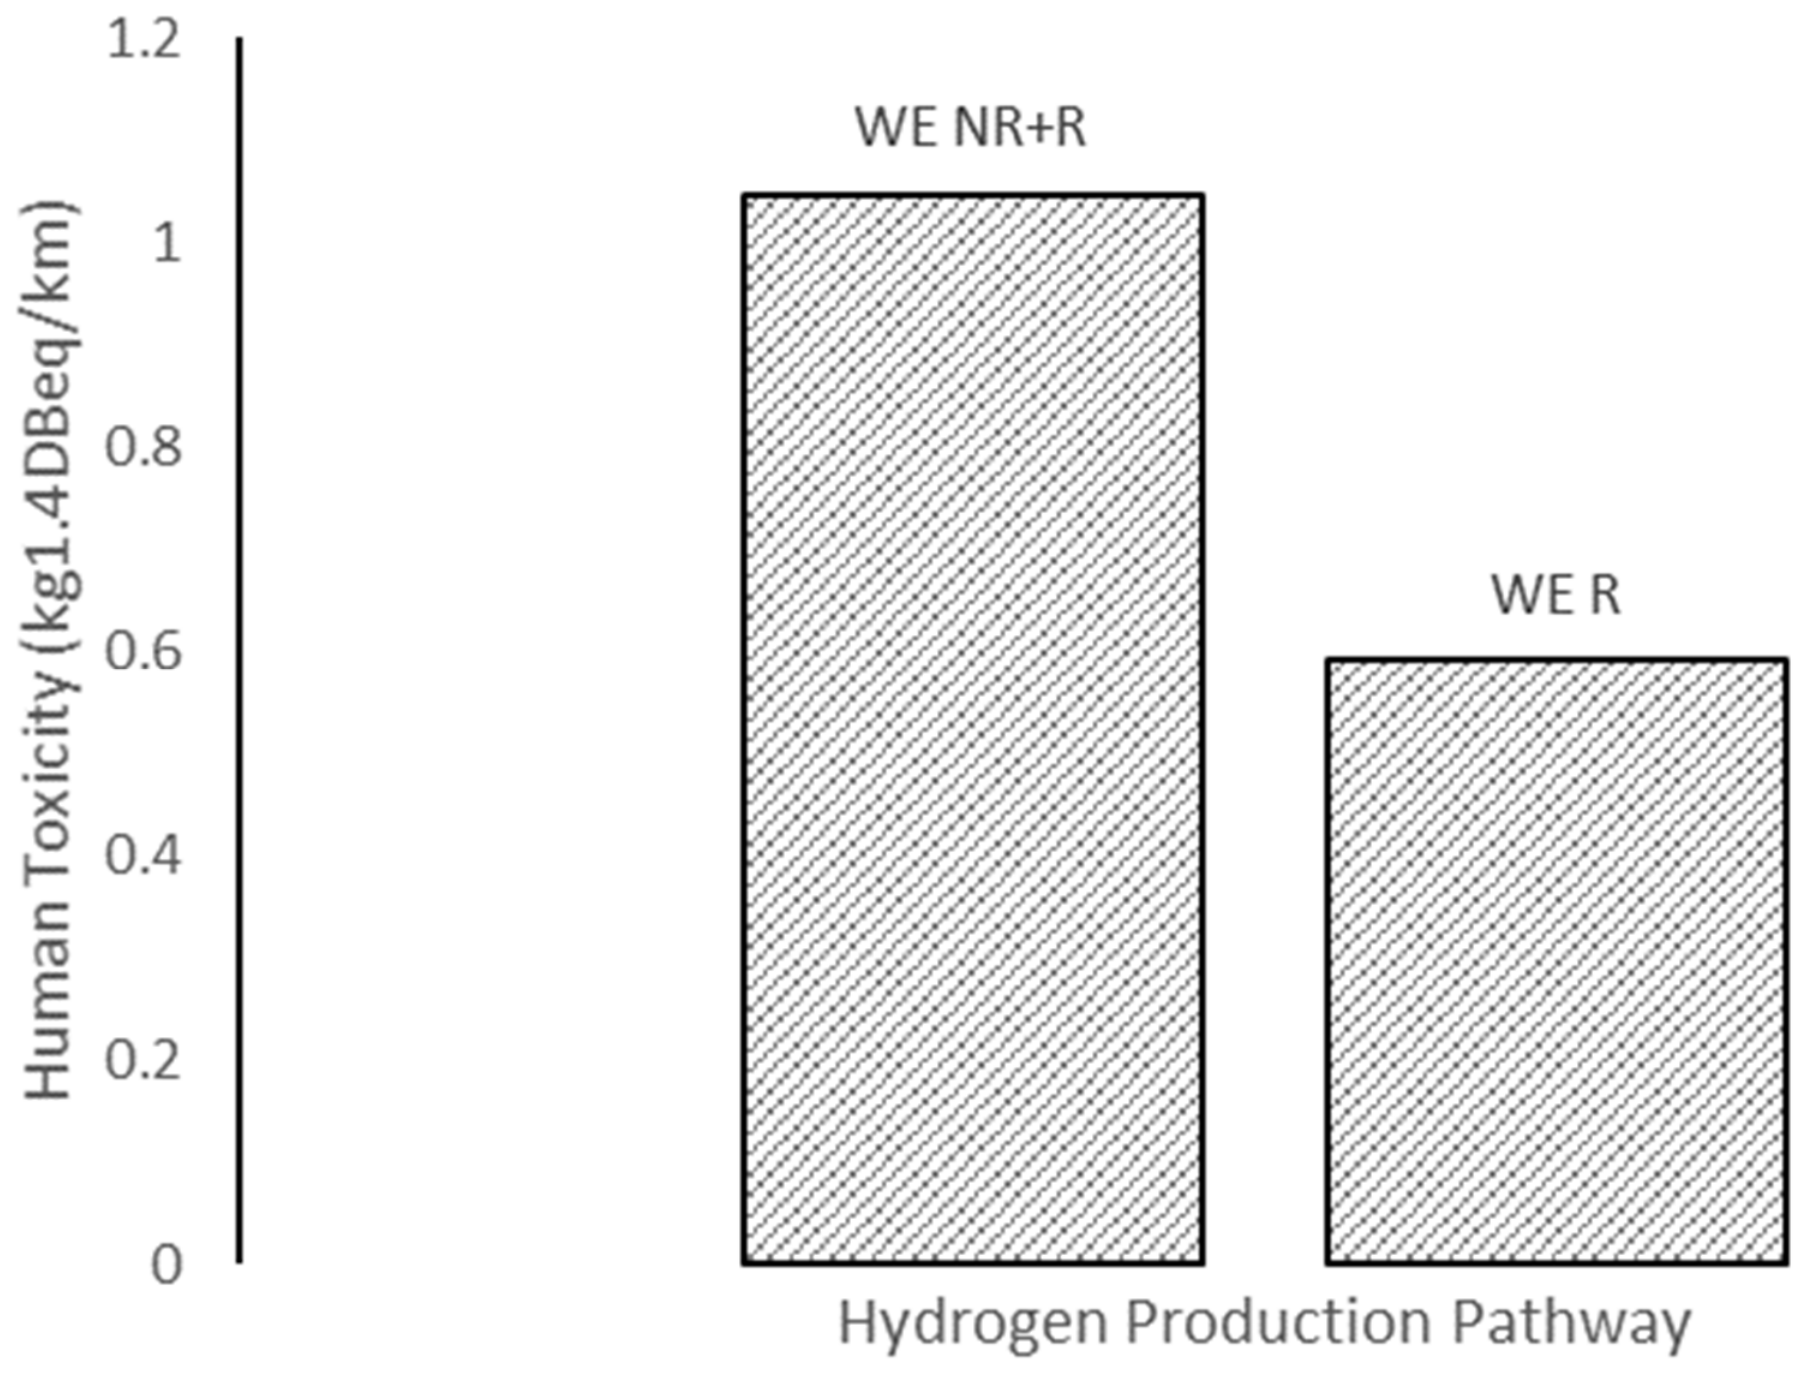
Both Briguglio et al. [22] as well as Tahir and Hussain [18] consider a non-renewable and renewable electrical generation mix for the WE production pathway. Briguglio et al. [22] conducted a 2009 LCA on WE hydrogen production from wind-based renewable power in Italy. The authors considered all life cycle phases of hydrogen production and the operational phase of hybrid HFC minibuses operating in the city of Puglia. Experimental data was collected on PEMFC performance and then used as input data into SimaPro LCA model to determine the environmental impacts. Two hydrogen scenarios were considered for minibus operation. The first operated the HFC from hydrogen produced and charged the battery using regional-grid electricity, while the other scenario operated the HFC from hydrogen produced and charged the battery using renewable wind power. As shown in Table 5, the first scenario, which uses regional-grid electricity to charge the minibus battery, demonstrates higher human toxicity impacts, consequently confirming that the primary energy source is the most significant factor contributing to environmental performance. This finding is supported by the results reported by Tahir and Hussain [18], where kg1.4DBeq emissions are twice as high for mixed energy supply when compared to the full renewable energy supply. This conclusion aligns with that of Binder et al. [2].
Table 5.
Hydrogen production pathway human toxicity environmental impacts.
4.4. Photochemical Oxidation
Photochemical oxidation, also referred to as photochemical ozone, is the formation of low-level atmospheric pollution known as ‘smog’ or ‘ground ozone’ that is harmful to human health. Smog is formed in certain atmospheric conditions, sunlight, and low humidity, where volatile organic compounds (VOCs) react with nitric oxides (NOx) [12]. The photochemical oxidation potential is expressed in kg of ethylene equivalents (kgC2H4eq) or in kg of non-methane volatile organic compounds equivalents (kgNMVOCeq).
Figure 10 shows the average photochemical oxidation emissions as reported [18,19,22], where the functional unit is kgNMVOCeq/km. NMVOC are especially present in the SMR pathway, largely from the raw gas sweetening at the well, where H2S and CO2 are removed prior to transportation. Additional emissions for NMVOC occur during the SMR process where some of the by-product gases from the hydrogen product stream are vented into the atmosphere and other NMVOCs are emitted in the combustion of fossil fuels used in the SMR process.
Figure 10.
Average photochemical oxidation impact per hydrogen production pathway.
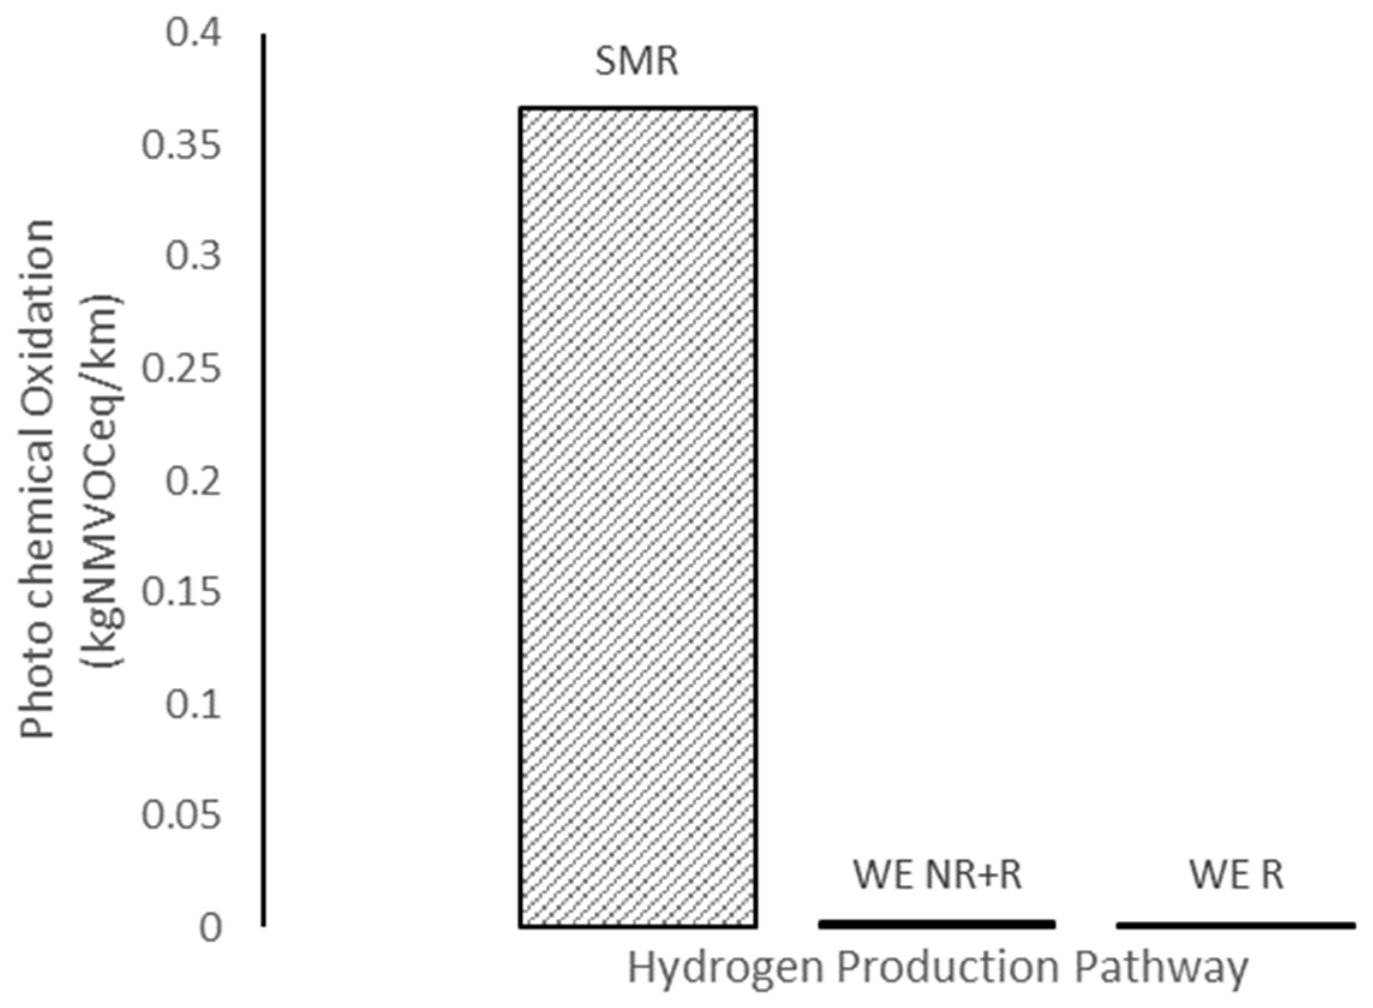
The study by Cantono, Heijungs and Kleijn [19] is the only SMR pathway study to consider the photochemical impact for both hydrogen production and HFCB operation. Basing their calculation on the EU25 economic system, they calculated photochemical oxidation in terms of ethylene equivalent per kilometre. As per Table 6, the authors calculated an emission of 0.1521 kgC2H4eq/km, which can be easily converted to 0.366 kgNMVOCeq/km using a conversion factor of 0.416 kgC2H4eq equals 1.0 kgNMVOCeq. This calculated value corresponds to a scenario in which 10% of existing European buses are replaced by HFCBs using hydrogen produced through SMR, equivalent to approximately 16,600 buses.
Table 6.
Hydrogen production pathway photochemical oxidation environmental impacts.
Both Briguglio et al. [22] as well as Tahir and Hussain [18] consider a non-renewable and renewable electrical generation mix for the WE production pathway. Both calculated the photochemical oxidation in terms of passenger kilometres and a direct comparison can be made by assuming passenger loading. Briguglio et al. [22] assessed mini-HFCBs with a maximum capacity of 21 passengers, which has resulted in an assumed photochemical oxidation emission for full life cycle of 0.00432 kgNMVOCeq/km for mixed electrical supply and 0.00324 kgNMVOCeq/km for renewable only. Tahir and Hussain [18] assessed HFC transit buses with a maximum capacity of 76 passengers. Given the limited data in the literature regarding passenger loading and duty cycle, an average passenger loading of 36 has been applied, resulting in an assumed photochemical oxidation emission for a full life cycle of 0.000195 kgNMVOCeq/km for mixed electrical supply and 0.000105 kgNMVOCeq/km for renewable only. The order-of-magnitude difference between the two studies can largely be attributed to the Tahir and Hussain [18] study accounting for a significantly higher contribution from renewable energy sources.
5. Treatment of Uncertainty
Within the literature, life cycle assessment techniques have limitations that result in uncertainty between the measured or calculated results and actual implementation outcomes. Hydrogen production from the pathways previously discussed is well established, with the largest contribution of uncertainty subsequently arising from the study of hydrogen fuel cell use in transit buses. Due to the size of transit buses and passenger or duty cycle complexities, it is identified in the research that the acknowledgment of uncertainties in HFCB operating efficiencies directly affects impact assessment results [28]. Furthermore, Ally and Pryor [21] found significant uncertainty in environmental impacts from hydrogen fuel cell manufacturing and periodic maintenance phases. For the nineteen articles analysed, the impact category of climate change due to GHG emissions has been universally assessed. However, there is uncertainty in the remaining impacts of terrestrial acidification, human toxicity and photochemical oxidation as outlined by the ReCiPe manual [9] due to the limited data reported. Uncertainty arises when direct comparisons between the reviewed studies are made. The system boundary is the dominant source of such uncertainty where each study has its own unique boundary conditions and regional biases. The system boundary directly affects the inventory data where IO from different phases of hydrogen production life cycle may be included or omitted, which directly translates into impact assessment results. These results are therefore dependent on the initial system boundary and where system boundary conditions differ in the literature, in which a direct comparison is difficult to make and is a source of uncertainty. While much of the literature analysed present impact assessment results in the functional unit of impact equivalent per kilometre, as shown in Table 1, Table 3, Table 4, Table 5 and Table 6, there are also other reported functional units. The conversion of impact equivalent per passenger kilometre requires an assumption of bus passenger loading to make direct comparison with the primary functional unit used in research of impact equivalent per kilometre, which results in an additional source of uncertainty.
Although functional unit normalisation improves comparability, it does not eliminate methodological heterogeneity among the reviewed studies. The arithmetic means presented in Figure 7, Figure 8, Figure 9 and Figure 10 combine results from studies conducted under different system boundaries, geographical conditions, electricity mixes, vehicle assumptions, data periods, and LCA methodologies. These aggregated values should therefore be interpreted as indicative pathway-level trends only. The variability among the underlying studies remains an important limitation of the comparison.
Quality and Reliability of the Reviewed Literature
In addition to the uncertainties associated with the comparison of LCA results, the methodological reporting and reliability of the reviewed studies were qualitatively assessed using the information available in the selected literature. The assessment considered system boundary completeness, study/data period, reporting of LCA methods and software/databases, allocation approach, functional unit, regional applicability, and transparency of key assumptions. These criteria were used to assess the comparability and interpretability of the studies rather than as additional exclusion criteria, as all selected studies had already satisfied the predefined scope and eligibility requirements of the review. Table 7 summarises this assessment.
Table 7.
Quality and reliability assessment.
Overall, the reviewed literature provides a useful evidence base for comparing the environmental performance of hydrogen production pathways for fuel cell buses. However, the assessment indicates that the strength of direct cross-study comparison is limited by heterogeneity in system boundaries, functional units, regional conditions, data periods and methodological reporting. Consequently, greater confidence can be placed in general trends observed consistently across multiple studies than in direct comparison of individual numerical values obtained under different methodological and regional conditions.
6. Recent Developments and Trends in HFCB
Recent literature published after the original 2001–2020 review period largely reinforces the earlier conclusion that the environmental performance of HFCBs is strongly governed by the hydrogen production pathway and the carbon intensity of the associated energy supply. However, studies from 2021–2026 increasingly extend conventional well-to-wheel assessment toward broader environmental, economic, operational and prospective analyses. Recent investigations [56,57,58,59,60,61,62,63] examine a wider range of hydrogen pathways and increasingly account for vehicle operation, infrastructure and regional energy conditions.
A consistent finding is that zero-tailpipe emissions do not necessarily correspond to low life cycle emissions. Study [62] demonstrated that HFCB performance varies substantially with the hydrogen source: renewable-powered electrolysis can provide considerable GHG reductions, whereas SMR offers smaller benefits and electrolysis supplied by fossil-intensive electricity can result in considerably higher impacts. Similarly, recent renewable hydrogen modelling by Guven [64] showed approximately 174 gCO2-eq/km for an optimised renewable pathway, compared with approximately 3732 gCO2-eq/km when grid electricity was used for hydrogen production. Waste-derived hydrogen has also received increasing attention. Lui et al. [57] reported approximately 50–69% lower GHG emissions per kilogram of hydrogen than conventional SMR. Studies [65,66] further indicate that blue hydrogen with CCS and industrial by-product hydrogen can offer transitional benefits under specific regional and methodological assumptions.
Another major recent trend is the increasingly detailed comparison of HFCBs and battery electric buses (BEBs). The literature does not identify a universally superior technology. Syré et al. [67] report lower GHG emissions for BEVs under their assessed conditions, whereas Zhao et al. [65] found favourable fuel cell bus performance for a Saudi Arabian blue hydrogen scenario. Study [68] further demonstrates that technology rankings may change over time, with BEVs favoured under present conditions but with fuel cell vehicles becoming more competitive under future decarbonised scenarios. Studies [69,70,71,72,73,74,75] similarly show that results depend on regional electricity mixes, hydrogen source, route characteristics, vehicle efficiency and system boundaries. Consequently, recent research increasingly regards the relative performance of HFCBs and BEBs as context- and scenario-dependent rather than universal.
The scope of recent LCA studies has also broadened beyond fuel production and vehicle operation. Pederzoli et al. [58], Zhao et al. [65], Syré et al. [67], Yan et al. [76], and Guven [64] increasingly consider vehicle manufacturing, batteries, fuel cell stacks, hydrogen storage, refuelling infrastructure, renewable energy systems and end-of-life processes. When operational energy becomes cleaner, a larger proportion of environmental impacts shifts toward manufacturing and infrastructure. Article [58] identifies the battery and fuel cell stack as important remaining contributors, while Syré et al. [67] emphasise production stage impacts and the potential benefits of recycling. Study [64] likewise found that manufacturing of photovoltaic, wind and hydrogen system components becomes important once direct operational emissions are minimised.
Recent studies also show increasing operational realism and methodological integration. Ahmadi et al. [59] incorporate passenger loading, temperature, actual driving conditions, fuel cell degradation and battery ageing, while reference [77] demonstrates that energy management strategies can reduce hydrogen consumption. Study [71] applies machine learning to group real bus routes and show that route length, gradient and passenger loading materially affect energy demand. Guven [64] further integrates climate projections, renewable system optimisation, LCA and life cycle cost assessment, illustrating the increasing use of integrated decision support frameworks.
Economic feasibility has consequently become a more prominent component of HFCB assessment. Studies [64,69,70,71,72,78] combine environmental assessment with life cycle cost or total cost of ownership analysis. Several current assessments still find HFCBs more expensive than BEBs, largely because of vehicle, hydrogen production, and infrastructure costs, while prospective studies indicate that falling hydrogen prices, technology learning, subsidies, and carbon pricing could substantially improve competitiveness. Mahmoudi et al. [71], for example, report considerably higher present life cycle costs for FCVs than electric buses.
Overall, the 2021–2026 literature [57,58,60,61,62,63,64,65,66,67,68,69,70,71,72,73,76,77,78,79,80,81] shows that the field has moved beyond asking simply whether HFCBs can reduce emissions. Current research increasingly focuses on the conditions under which HFCBs can provide an effective life cycle decarbonisation pathway, including hydrogen production, regional, technological, operational and economic factors. Methodological heterogeneity nevertheless remains, particularly in functional units, boundaries and regional assumptions, meaning that general trends remain more reliable than direct comparison of isolated numerical values.
7. Emerging Technologies and Future Research Directions
The systematic comparative analysis in this review focuses on the hydrogen production pathways represented within the selected core literature. However, supplementary literature considered during the review identified several additional and emerging hydrogen production technologies that may warrant greater attention in future life cycle assessments. These technologies were not included in the main quantitative comparison because they were not represented within the core studies selected for systematic analysis. However, they are discussed here only to identify potential directions for future research.
Carbon capture and storage represents an important area for further investigation because of its potential to reduce the GHG emissions associated with fossil fuel-based hydrogen production. Greater standardisation of LCA system boundaries and functional units is also required to improve comparability among future studies. Other emerging routes identified in the supplementary literature include thermochemical water splitting cycles [42,82] and high-temperature electrolysis, both of which may be coupled with nuclear heat and/or electricity, as well as other available heat and energy sources [83], biological hydrogen production [84], biomass gasification [47,85], and waste-derived hydrogen production through thermochemical processes such as gasification [33]. Waste gasification is particularly relevant because waste streams can be used as feedstocks for hydrogen production while simultaneously providing a pathway for waste treatment and resource recovery. This approach can reduce dependence on conventional fossil feedstocks and divert suitable waste streams from disposal. However, further life cycle assessment is required to evaluate the influence of waste composition, process requirements, gas cleaning, and associated emissions. These pathways offer different potential environmental and process advantages but require further investigation to establish their performance and applicability at larger scales. In particular, biomass gasification, potentially combined with carbon capture, represents an additional pathway of interest for reducing the net GHG impacts of hydrogen production. Future studies should therefore assess these emerging technologies using consistent life cycle boundaries, functional units, and environmental impact indicators to enable comparison with the established pathways evaluated in this review.
8. Conclusions
This review assessed and compared the life cycle environmental performance of the principal hydrogen production pathways considered for hydrogen fuel cell bus applications. The results show that HFCB environmental performance is governed primarily by the hydrogen production pathway and, particularly for water electrolysis, by the carbon intensity of the electricity supply. Renewable-powered WE generally provides the lowest life cycle greenhouse gas emissions, commonly within approximately 0.4–0.7 kgCO2-eq/km of HFCB travel in the core literature. In contrast, electrolysis using fossil-intensive grid electricity and coal gasification can result in substantially higher impacts. SMR generally occupies an intermediate position, although its performance varies with production efficiency, hydrogen transportation, regional conditions, and system boundaries.
The review also demonstrates that zero-tailpipe emissions should not be interpreted as zero life cycle environmental impact. Terrestrial acidification, human toxicity, and photochemical oxidation are influenced by upstream electricity generation, material extraction, manufacturing, and vehicle components. As hydrogen and electricity production become cleaner, the relative contribution of renewable energy infrastructure, batteries, fuel cell systems, hydrogen storage, and other manufacturing stages becomes increasingly important. However, evidence for these non GHG impact categories remains more limited than for climate change and should therefore be interpreted cautiously.
Recent literature from 2021–2026 reinforces the findings of the core review while showing that HFCB assessment is becoming increasingly integrated and context-dependent. Recent studies incorporate vehicle manufacturing, refuelling infrastructure, regional electricity systems, route characteristics, passenger loading, component degradation, economic performance, and future energy scenarios. Importantly, neither HFCBs nor battery electric buses emerge as universally superior. Their relative performance depends on hydrogen production, electricity carbon intensity, vehicle efficiency, operating requirements, infrastructure, and regional conditions. Consequently, transport authorities should evaluate alternative bus technologies using region and route-specific life cycle evidence rather than relying solely on zero-tailpipe emissions.
Several methodological limitations affect direct comparison among the reviewed studies. Differences in system boundaries, functional units, geographical conditions, electricity mixes, passenger loading assumptions, vehicle lifetimes, databases, and LCA methodologies contribute to variation in the reported results. Normalisation was performed only where sufficient information was available, and the arithmetic averages used for pathway comparisons should therefore be interpreted as indicative trends rather than universally applicable values.
Future research should prioritise greater harmonisation of functional units, system boundaries, inventory assumptions, and environmental indicators. Further assessment is also required for CCS-enabled hydrogen, high temperature and thermochemical water splitting, biological hydrogen production, biomass gasification, and waste-derived hydrogen. Future studies should increasingly integrate environmental assessment with infrastructure requirements, real-world operating conditions, technology degradation, economic feasibility, end-of-life treatment, and future electricity and hydrogen system decarbonisation. Overall, HFCBs can contribute to public transport decarbonisation, but their sustainability depends on the complete hydrogen production, infrastructure, and vehicle system rather than on the fuel cell vehicle alone.
Author Contributions
Conceptualisation, M.U.; methodology, M.U. and T.K.; investigation, M.U. and T.K.; data curation, M.U.; formal analysis, M.U.; visualisation, M.U.; writing—original draft preparation, M.U.; writing—review and editing, M.U., T.K., L.H.D. and A.M.M.A.R.; supervision, T.K., L.H.D. and A.M.M.A.R. All authors have read and agreed to the published version of the manuscript.
Funding
This research received no external funding.
Data Availability Statement
No new data were created or analysed in this study. Data sharing is not applicable to this article.
Acknowledgments
The authors acknowledge support from the Australian Government Research Training Programme (RTP) Scholarship. The authors gratefully acknowledge Lindsay Scholz, an undergraduate student at Charles Darwin University, for their assistance with data collection during the preparation of this article.
Conflicts of Interest
Author A. M. Mabrur Ahmad Rashedi was employed by the company Aqualis Carbon Advisory. The remaining authors declare that the research was conducted in the absence of any commercial or financial relationships that could be constructed as a potential conflict of interest.
References
- Brown, F.; Roberts, D. Green, Blue, Brown: The Colours of Hydrogen Explained. Available online: https://blog.csiro.au/green-blue-brown-hydrogen-explained/ (accessed on 4 December 2023).
- Binder, M.; Faltenbacher, M.; Fischer, M. Hydrogen as Fuel for Urban Transportation Environmental Footprint of Different Hydrogen Production Routes and the Influence on the Total Life Cycle of FC Powered Transportation Systems: An LCA Case Study within CUTE. MRS Online Proc. Libr. 2005, 895, 202. [Google Scholar] [CrossRef] [Scilit]
- Chowdhury, H.; Chowdhury, T.; Rashedi, A.; Banik, S.C.; Khanam, T.; Saidur, R.; Sait, S.M.; Rosen, M.A. Energy and exergy assessment with updated Reistad estimates: A case study in the transportation sector of Bangladesh. Energy Sci. Eng. 2021, 9, 1349–1358. [Google Scholar] [CrossRef] [Scilit]
- Ou, X.; Zhang, X.; Chang, S. Alternative fuel buses currently in use in China: Life-cycle fossil energy use, GHG emissions and policy recommendations. Energy Policy 2010, 38, 406–418. [Google Scholar] [CrossRef] [Scilit]
- Jang, H.; Jeong, B.; Zhou, P.; Ha, S.; Park, C.; Nam, D.; Rashedi, A. Parametric trend life cycle assessment for hydrogen fuel cell towards cleaner shipping. J. Clean. Prod. 2022, 372, 133777. [Google Scholar] [CrossRef] [Scilit]
- Khandal, S.; Razak, A.; Veza, I.; Afzal, A.; Alwetaishi, M.; Shaik, S.; Ağbulut, Ü.; Rashedi, A. Hydrogen and dual fuel mode performing in engine with different combustion chamber shapes: Modelling and analysis using RSM-ANN technique. Int. J. Hydrogen Energy 2024, 52, 973–1005. [Google Scholar] [CrossRef] [Scilit]
- Faltenbacher, M.; Eyerer, P.; Betz, M. An Overview of NEFLEET-The First Full Scale Field Trial of Fuel Cell Powered Busses. SAE Trans. 2001, 110, 533–536. [Google Scholar]
- Padovan, C.; Angelo, A.C.M.; D’Agosto, M.d.A.; Carneiro, P. Life Cycle Assessment of Hydrogen Fuel Cell Buses: A Systematic Review of Methodological Approaches. Future Transp. 2026, 6, 23. [Google Scholar] [CrossRef] [Scilit]
- Huijbregts, M.A.; Steinmann, Z.J.; Elshout, P.M.; Stam, G.; Verones, F.; Vieira, M.; Zijp, M.; Hollander, A.; Van Zelm, R. ReCiPe2016: A harmonised life cycle impact assessment method at midpoint and endpoint level. Int. J. Life Cycle Assess. 2017, 22, 138–147. [Google Scholar] [CrossRef] [Scilit]
- ISO 14040:2006; Environmental Management—Life Cycle Assessment—Principles and Framework. ISO: Geneva, Switzerland, 2006.
- Suh, S.; Huppes, G. Methods in the Life Cycle Inventory of a Product. In Handbook of Input-Output Economics in Industrial Ecology; Suh, S., Ed.; Springer: Dordrecht, The Netherlands, 2009; pp. 263–282. [Google Scholar]
- Acero, A.; Rodríguez, C.; Ciroth, A. LCIA Methods: Impact Assessment Methods in Life Cycle Assessment and Their Impact Categories. Available online: https://www.scirp.org/reference/referencespapers?referenceid=3815050 (accessed on 13 August 2021).
- Bartlett, J.; Krupnick, A. Decarbonized Hydrogen in the US Power and Industrial Sectors: Identifying and Incentivizing Opportunities to Lower Emissions; Resources for the Future: Washington, DC, USA, 2020; pp. 20–25. [Google Scholar]
- Bui, M.; Adjiman, C.S.; Bardow, A.; Anthony, E.J.; Boston, A.; Brown, S.; Fennell, P.S.; Fuss, S.; Galindo, A.; Hackett, L.A. Carbon capture and storage (CCS): The way forward. Energy Environ. Sci. 2018, 11, 1062–1176. [Google Scholar] [CrossRef] [Scilit]
- NETL-DOE. Process Intensification for Syngas & Hydrogen. Available online: https://www.netl.doe.gov/projects/project-information.aspx?p=FE0032178 (accessed on 15 January 2022).
- Ren, L.; Zhou, S.; Ou, X. Life-cycle energy consumption and greenhouse-gas emissions of hydrogen supply chains for fuel-cell vehicles in China. Energy 2020, 209, 118482. [Google Scholar] [CrossRef] [Scilit]
- Lombardi, L.; Carnevale, E.; Giubbilini, F.; Scalas, E.; Corti, A. Life cycle assessment of different hypotheses of hydrogen production for vehicle fuel cells fuelling. In Proceedings of the ECOS 2006—19th International Conference on Efficiency, Cost, Optimization, Simulation and Environmental Impact of Energy Systems, Aghia Pelagia, Crete, Greece, 12–14 July 2006. [Google Scholar]
- Tahir, S.; Hussain, M. Life Cycle Assessment of Hydrogen Fuelcell-Based Commercial and Heavy-Duty Vehicles. In Proceedings of the ASME Power Conference, Online, 4–5 August 2020; p. V001T008A017. [Google Scholar]
- Cantono, S.; Heijungs, R.; Kleijn, R. Environmental accounting of eco-innovations through environmental input–output analysis: The case of hydrogen and fuel cells buses. Econ. Syst. Res. 2008, 20, 303–318. [Google Scholar] [CrossRef] [Scilit]
- Sánchez, J.A.G.; Martínez, J.M.L.; Martín, J.L.; Holgado, M.N.F.; Morales, H.A. Impact of Spanish electricity mix, over the period 2008–2030, on the life cycle energy consumption and GHG emissions of electric, hybrid diesel-electric, fuel cell hybrid and diesel bus of the Madrid transportation system. Energy Convers. Manag. 2013, 74, 332–343. [Google Scholar] [CrossRef] [Scilit]
- Ally, J.; Pryor, T. Life-cycle assessment of diesel, natural gas and hydrogen fuel cell bus transportation systems. J. Power Sources 2007, 170, 401–411. [Google Scholar] [CrossRef] [Scilit]
- Briguglio, N.; Andaloro, L.; Ferraro, M.; Di Blasi, A.; Dispenza, G.; Matteucci, F.; Breedveld, L.; Antonucci, V. Renewable energy for hydrogen production and sustainable urban mobility. Int. J. Hydrogen Energy 2010, 35, 9996–10003. [Google Scholar] [CrossRef] [Scilit]
- Lee, D.-Y.; Elgowainy, A.; Vijayagopal, R. Well-to-wheel environmental implications of fuel economy targets for hydrogen fuel cell electric buses in the United States. Energy Policy 2019, 128, 565–583. [Google Scholar] [CrossRef] [Scilit]
- Iannuzzi, L.; Hilbert, J.A.; Lora, E.E.S. Life Cycle Assessment (LCA) for use on renewable sourced hydrogen fuel cell buses vs diesel engines buses in the city of Rosario, Argentina. Int. J. Hydrogen Energy 2021, 46, 29694–29705. [Google Scholar] [CrossRef] [Scilit]
- Chang, C.-C.; Liao, Y.-T.; Chang, Y.-W. Life cycle assessment of carbon footprint in public transportation-a case study of bus route no. 2 in Tainan city, taiwan. Procedia Manuf. 2019, 30, 388–395. [Google Scholar] [CrossRef] [Scilit]
- Lozanovski, A.; Whitehouse, N.; Ko, N.; Whitehouse, S. Sustainability assessment of fuel cell buses in public transport. Sustainability 2018, 10, 1480. [Google Scholar]
- Wulf, C.; Kaltschmitt, M. Life cycle assessment of hydrogen supply chain with special attention on hydrogen refuelling stations. Int. J. Hydrogen Energy 2012, 37, 16711–16721. [Google Scholar] [CrossRef] [Scilit]
- Xu, Y.; Gbologah, F.E.; Lee, D.-Y.; Liu, H.; Rodgers, M.O.; Guensler, R.L. Assessment of alternative fuel and powertrain transit bus options using real-world operations data: Life-cycle fuel and emissions modeling. Appl. Energy 2015, 154, 143–159. [Google Scholar] [CrossRef] [Scilit]
- McKenzie, E.C.; Durango-Cohen, P.L. Environmental life-cycle assessment of transit buses with alternative fuel technology. Transp. Res. Part D Transp. Environ. 2012, 17, 39–47. [Google Scholar] [CrossRef] [Scilit]
- Chang, C.-C.; Liao, Y.-T.; Chang, Y.-W. Life cycle assessment of alternative energy types–including hydrogen–for public city buses in Taiwan. Int. J. Hydrogen Energy 2019, 44, 18472–18482. [Google Scholar] [CrossRef] [Scilit]
- Hermesmann, M.; Müller, T. Green, turquoise, blue, or grey? Environmentally friendly hydrogen production in transforming energy systems. Prog. Energy Combust. Sci. 2022, 90, 100996. [Google Scholar] [CrossRef] [Scilit]
- Abraham, M. Encyclopedia of Sustainable Technologies; Elsevier: Amsterdam, The Netherlands, 2017. [Google Scholar]
- Zhao, S. Thermochemical processes for biohydrogen production. In Waste to Renewable Biohydrogen; Elsevier: Amsterdam, The Netherlands, 2021; pp. 139–177. [Google Scholar]
- Ghandehariun, S.; Kumar, A. Life cycle assessment of wind-based hydrogen production in Western Canada. Int. J. Hydrogen Energy 2016, 41, 9696–9704. [Google Scholar] [CrossRef] [Scilit]
- Liu, H.; Hu, J.; Wang, H.; Wang, C.; Li, J. Experimental studies of biomass gasification with air. J. Nat. Gas Chem. 2012, 21, 374–380. [Google Scholar] [CrossRef] [Scilit]
- Azad, A.K.; Khan, M.M.K. Bioenergy Resources and Technologies; Academic Press: Cambridge, MA, USA, 2021. [Google Scholar]
- Bhandari, R.; Trudewind, C.A.; Zapp, P. Life cycle assessment of hydrogen production via electrolysis—A review. J. Clean. Prod. 2014, 85, 151–163. [Google Scholar] [CrossRef] [Scilit]
- Koj, J.C.; Schreiber, A.; Zapp, P.; Marcuello, P. Life cycle assessment of improved high pressure alkaline electrolysis. Energy Procedia 2015, 75, 2871–2877. [Google Scholar] [CrossRef] [Scilit]
- Rashedi, A.; Khanam, T. Life cycle assessment of most widely adopted solar photovoltaic energy technologies by mid-point and end-point indicators of ReCiPe method. Environ. Sci. Pollut. Res. 2020, 27, 29075–29090. [Google Scholar] [CrossRef] [Scilit] [PubMed]
- Miskat, M.I.; Rashedi, A. Exergy efficiency and enviroeconomic analysis of solar photovoltaic power in Nepal. Energy Technol. 2021, 9, 2100093. [Google Scholar] [CrossRef] [Scilit]
- Ji, M.; Shi, M.; Wang, J. Life cycle assessment of nuclear hydrogen production processes based on high temperature gas-cooled reactor. Int. J. Hydrogen Energy 2023, 48, 22302–22318. [Google Scholar] [CrossRef] [Scilit]
- Acar, C.; Dincer, I. Comparative assessment of hydrogen production methods from renewable and non-renewable sources. Int. J. Hydrogen Energy 2014, 39, 1–12. [Google Scholar] [CrossRef] [Scilit]
- Turn, S.; Kinoshita, C.; Zhang, Z.; Ishimura, D.; Zhou, J. An experimental investigation of hydrogen production from biomass gasification. Int. J. Hydrogen Energy 1998, 23, 641–648. [Google Scholar] [CrossRef] [Scilit]
- Lv, P.; Xiong, Z.; Chang, J.; Wu, C.; Chen, Y.; Zhu, J. An experimental study on biomass air–steam gasification in a fluidized bed. Bioresour. Technol. 2004, 95, 95–101. [Google Scholar] [CrossRef] [Scilit] [PubMed]
- Chen, G.; Andries, J.; Spliethoff, H.; Fang, M.; Van de Enden, P. Biomass gasification integrated with pyrolysis in a circulating fluidised bed. Sol. Energy 2004, 76, 345–349. [Google Scholar] [CrossRef] [Scilit]
- Cetinkaya, E.; Dincer, I.; Naterer, G.F. Life cycle assessment of various hydrogen production methods. Int. J. Hydrogen Energy 2012, 37, 2071–2080. [Google Scholar] [CrossRef] [Scilit]
- Susmozas, A.; Iribarren, D.; Zapp, P.; Linssen, J.; Dufour, J. Life-cycle performance of hydrogen production via indirect biomass gasification with CO2 capture. Int. J. Hydrogen Energy 2016, 41, 19484–19491. [Google Scholar] [CrossRef] [Scilit]
- Dufour, J.; Serrano, D.; Galvez, J.; Moreno, J.; Garcia, C. Life cycle assessment of processes for hydrogen production. Environmental feasibility and reduction of greenhouse gases emissions. Int. J. Hydrogen Energy 2009, 34, 1370–1376. [Google Scholar] [CrossRef] [Scilit]
- Tsar, M.; Ghasemiziarhani, M.; Ofori, K. The effect of well orientation (vertical vs. horizontal) on CO2 sequestration in a water saturated formation-saline aquifer in Western Australia. In Proceedings of the EAGE Annual Conference & Exhibition Incorporating SPE Europec; SPE: London, UK, 2013. [Google Scholar]
- Milojević, S.; Skrucany, T.; Milošević, H.; Stanojević, D.; Pantić, M.; Stojanović, B. Alternative drive systems and environmentaly friendly public passengers transport. Appl. Eng. Lett. 2018, 3, 105–113. [Google Scholar] [CrossRef] [Scilit]
- Karlström, M. Environmental Assessment of Polymer Electrolyte Membrane Fuel Cell Systems. Consequences of an Evolutionary Perspective on Technology Development; Chalmers University of Technology: Goteborg, Sweden, 2004. [Google Scholar]
- Haraldsson, K.; Folkesson, A.; Saxe, M.; Alvfors, P. A first report on the attitude towards hydrogen fuel cell buses in Stockholm. Int. J. Hydrogen Energy 2006, 31, 317–325. [Google Scholar] [CrossRef] [Scilit]
- Bravo Diaz, L.; Boillot, L. Historical Analysis of Clean Hydrogen JU Fuel Cell Electric Vehicles, Buses and Refuelling Infrastructure Projects; Publications Office of the European Union: Luxembourg, 2024. [Google Scholar]
- CORDIS. Joint Initiative for Hydrogen Vehicles Across Europe (JIVE), Grant Agreement ID: 735582; EC: Brussels, Belgium, 2024. [Google Scholar]
- Jasper, M.; Rafati, N.; Schimmel, K.; Shahbazi, A.; Li, F.; Mba-Wright, M.; Wang, L. Carbon negative transportation fuels–A techno-economic-environmental analysis of biomass pathways for transportation. Energy Convers. Manag. X 2022, 14, 100208. [Google Scholar] [CrossRef] [Scilit]
- Aydin, M.I.; Dincer, I. An assessment study on various clean hydrogen production methods. Energy 2022, 245, 123090. [Google Scholar] [CrossRef] [Scilit]
- Lui, J.; Sloan, W.; Paul, M.C.; Flynn, D.; You, S. Life cycle assessment of waste-to-hydrogen systems for fuel cell electric buses in Glasgow, Scotland. Bioresour. Technol. 2022, 359, 127464. [Google Scholar] [CrossRef] [Scilit] [PubMed]
- Pederzoli, D.W.; Carnevali, C.; Genova, R.; Mazzucchelli, M.; Del Borghi, A.; Gallo, M.; Moreschi, L. Life cycle assessment of hydrogen-powered city buses in the High V. LO-City project: Integrating vehicle operation and refuelling infrastructure. SN Appl. Sci. 2022, 4, 57. [Google Scholar] [CrossRef] [Scilit]
- Ahmadi, P.; Raeesi, M.; Changizian, S.; Teimouri, A.; Khoshnevisan, A. Lifecycle assessment of diesel, diesel-electric and hydrogen fuel cell transit buses with fuel cell degradation and battery aging using machine learning techniques. Energy 2022, 259, 125003. [Google Scholar] [CrossRef] [Scilit]
- Padovan, C.; Fagundes, J.A.; D’Agosto, M.d.A.; Angelo, A.C.M.; Carneiro, P.J. Impact of fuel production technologies on energy consumption and GHG emissions from diesel and electric–hydrogen hybrid buses in Rio de Janeiro, Brazil. Sustainability 2023, 15, 7400. [Google Scholar]
- Lubecki, A.; Szczurowski, J.; Zarębska, K. A comparative environmental Life Cycle Assessment study of hydrogen fuel, electricity and diesel fuel for public buses. Appl. Energy 2023, 350, 121766. [Google Scholar] [CrossRef] [Scilit]
- Grazieschi, G.; Zubaryeva, A.; Sparber, W. Energy and greenhouse gases life cycle assessment of electric and hydrogen buses: A real-world case study in Bolzano Italy. Energy Rep. 2023, 9, 6295–6310. [Google Scholar] [CrossRef] [Scilit]
- Agostinho, F.; Silva, E.S.; da Silva, C.C.; Almeida, C.M.; Giannetti, B.F. Environmental performance for hydrogen locally produced and used as an energy source in urban buses. J. Clean. Prod. 2023, 396, 136435. [Google Scholar] [CrossRef] [Scilit]
- Guven, D. Transitioning Istanbul’s bus rapid transit system to green hydrogen: An environmental and economic analysis. Environ. Impact Assess. Rev. 2026, 117, 108209. [Google Scholar] [CrossRef] [Scilit]
- Zhao, C.; Kobayashi, L.Z.; Alquaity, A.B.S.; Monfort, J.-C.; Cenker, E.; Miralles, N.; Sarathy, S.M. Solutions for decarbonising urban bus transport: A life cycle case study in Saudi Arabia. Commun. Eng. 2024, 3, 95. [Google Scholar] [CrossRef] [Scilit]
- Gazda-Grzywacz, M.; Grzywacz, P.; Burmistrz, P. Environmental benefits of hydrogen-powered buses: A case study of coke oven gas. Energies 2024, 17, 5155. [Google Scholar]
- Syré, A.M.; Shyposha, P.; Freisem, L.; Pollak, A.; Göhlich, D. Comparative life cycle assessment of battery and fuel cell electric cars, trucks, and buses. World Electr. Veh. J. 2024, 15, 114. [Google Scholar] [CrossRef] [Scilit]
- Brancaleoni, P.P.; Ferretti, A.N.D.; Corti, E.; Ravaglioli, V.; Moro, D. Lifecycle CO2 analysis for urban emission reduction of hydrogen-fuelled and battery electric buses in the European Union current and future energetic scenarios. Int. J. Hydrogen Energy 2025, 123, 335–353. [Google Scholar] [CrossRef] [Scilit]
- Carbone, C.; Sanzò, N.; Dorsini, R.; Nigliaccio, G.; Di Florio, G.; Cigolotti, V.; Agostini, A. An economic and environmental assessment of different bus powertrain technologies in public transportation. Clean. Environ. Syst. 2025, 16, 100250. [Google Scholar] [CrossRef] [Scilit]
- Coppola, P.; Bocciolone, M.; Colombo, E.; De Fabiis, F.; Sanvito, F.D. Multi-criteria life-cycle assessment of bus fleet renewal: A methodology with a case study from Italy. Case Stud. Transp. Policy 2023, 13, 101044. [Google Scholar] [CrossRef] [Scilit]
- Mahmoudi, A.; Afshari, H.; Sarhadi, H.; Jabbarzadeh, A. Mitigating urban pollution: A comparative life cycle assessment of hydrogen, electric, and diesel buses for urban transportation. Int. J. Hydrogen Energy 2025, 125, 333–353. [Google Scholar] [CrossRef] [Scilit]
- Paradisi, B.P.; Pulvirenti, L.; Vinogradov, A.; Rolando, L.; Piano, A.; Millo, F.; Prussi, M. A techno-economic life cycle assessment of H2 fuelled and electrified urban buses. Appl. Energy 2025, 401, 126738. [Google Scholar] [CrossRef] [Scilit]
- Fidler, M.; Tomporowski, A.; Walichnowska, P.; Kruszelnicka, W.; Shchur, T. Comparative life cycle analysis of selected bus drive systems. Adv. Sci. Technol. Res. J. 2025, 19, 238–248. [Google Scholar] [CrossRef] [Scilit] [PubMed]
- Chang, C.-C.; Huang, P.-C. Carbon footprint of different fuels used in public transportation in Taiwan: A life cycle assessment. Environ. Dev. Sustain. 2022, 24, 5811–5825. [Google Scholar] [CrossRef] [Scilit]
- Chhugani, T.; Rahmani, R. Full emissions and energy consumption life cycle assessment of different Heavy-Duty vehicles powered by Electricity, Hydrogen, Methanol, and LNG fuels produced from various sources. Energy Convers. Manag. 2025, 326, 119439. [Google Scholar] [CrossRef] [Scilit]
- Yan, H.; Yu, Y.; Liu, Z.; Xue, B.; Zhou, C.; Huang, K.; Liu, L.; Li, X.; Yu, J. The carbon-clean electricity-lightweight material nexus of the CCS technology benefits for the hydrogen fuel cell buses. Int. J. Hydrogen Energy 2025, 99, 221–231. [Google Scholar] [CrossRef] [Scilit]
- Tari, A.H.Z.; Ahmadi, P. Dynamic simulation and comparison of overall performance and life cycle assessment of a hydrogen fuel cell bus and a battery electric bus. Int. J. Hydrogen Energy 2026, 230, 154797. [Google Scholar] [CrossRef] [Scilit]
- Wang, B.; Li, Z.; Zhou, J.; Cong, Y.; Li, Z. Technological-economic assessment and optimization of hydrogen-based transportation systems in China: A life cycle perspective. Int. J. Hydrogen Energy 2023, 48, 12155–12167. [Google Scholar] [CrossRef] [Scilit]
- Aydin, M.I.; Dincer, I. A life cycle impact analysis of various hydrogen production methods for public transportation sector. Int. J. Hydrogen Energy 2022, 47, 39666–39677. [Google Scholar] [CrossRef] [Scilit]
- Zhou, K.; Zhang, L.; Yang, Z. Carbon emission reduction assessment of hydrogen fuel cell buses: A case study of Guangdong, China. Int. J. Hydrogen Energy 2026, 222, 154299. [Google Scholar] [CrossRef] [Scilit]
- Przytuła, I.; Burchart, D. Greenhouse gas assessment of urban buses based on environmental product declarations–a review. Combust. Engines 2026, 205, 32. [Google Scholar] [CrossRef] [Scilit]
- Dincer, I.; Acar, C. Review and evaluation of hydrogen production methods for better sustainability. Int. J. Hydrogen Energy 2015, 40, 11094–11111. [Google Scholar] [CrossRef] [Scilit]
- Kannah, R.Y.; Kavitha, S.; Karthikeyan, O.P.; Kumar, G.; Dai-Viet, N.V.; Banu, J.R. Techno-economic assessment of various hydrogen production methods—A review. Bioresour. Technol. 2021, 319, 124175. [Google Scholar] [CrossRef] [Scilit] [PubMed]
- Lepage, T.; Kammoun, M.; Schmetz, Q.; Richel, A. Biomass-to-hydrogen: A review of main routes production, processes evaluation and techno-economical assessment. Biomass Bioenergy 2021, 144, 105920. [Google Scholar] [CrossRef] [Scilit]
- Antar, M.; Lyu, D.; Nazari, M.; Shah, A.; Zhou, X.; Smith, D.L. Biomass for a sustainable bioeconomy: An overview of world biomass production and utilization. Renew. Sustain. Energy Rev. 2021, 139, 110691. [Google Scholar] [CrossRef] [Scilit]
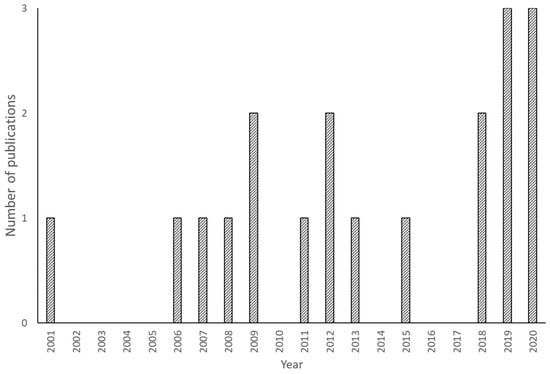
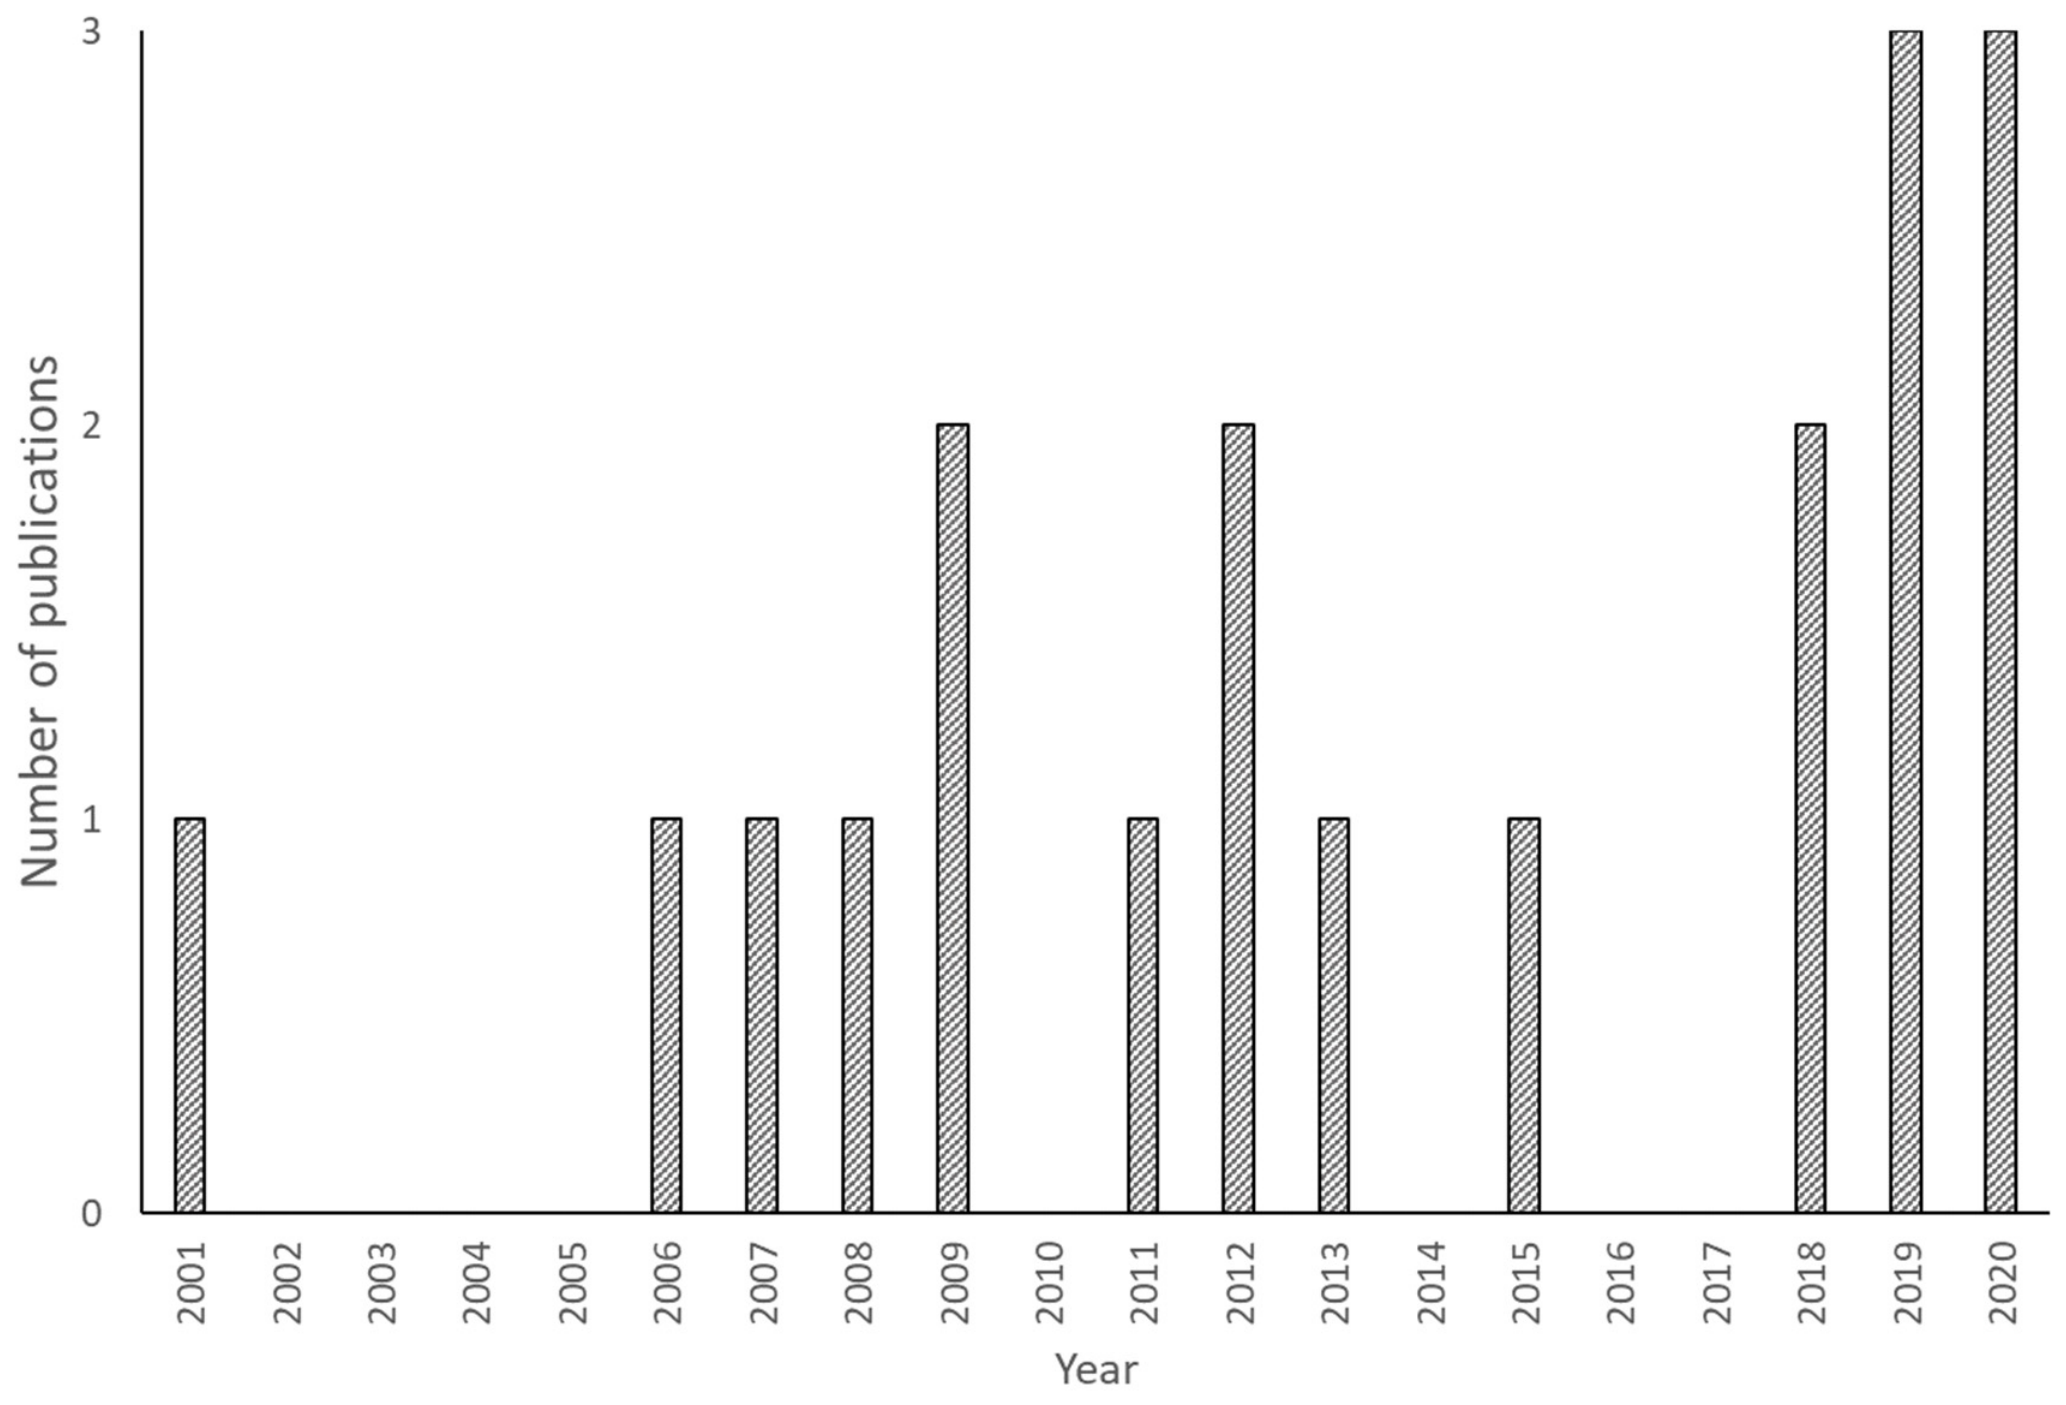
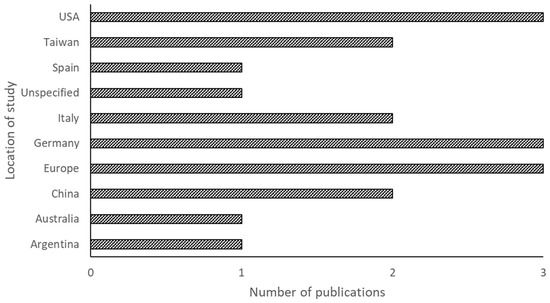
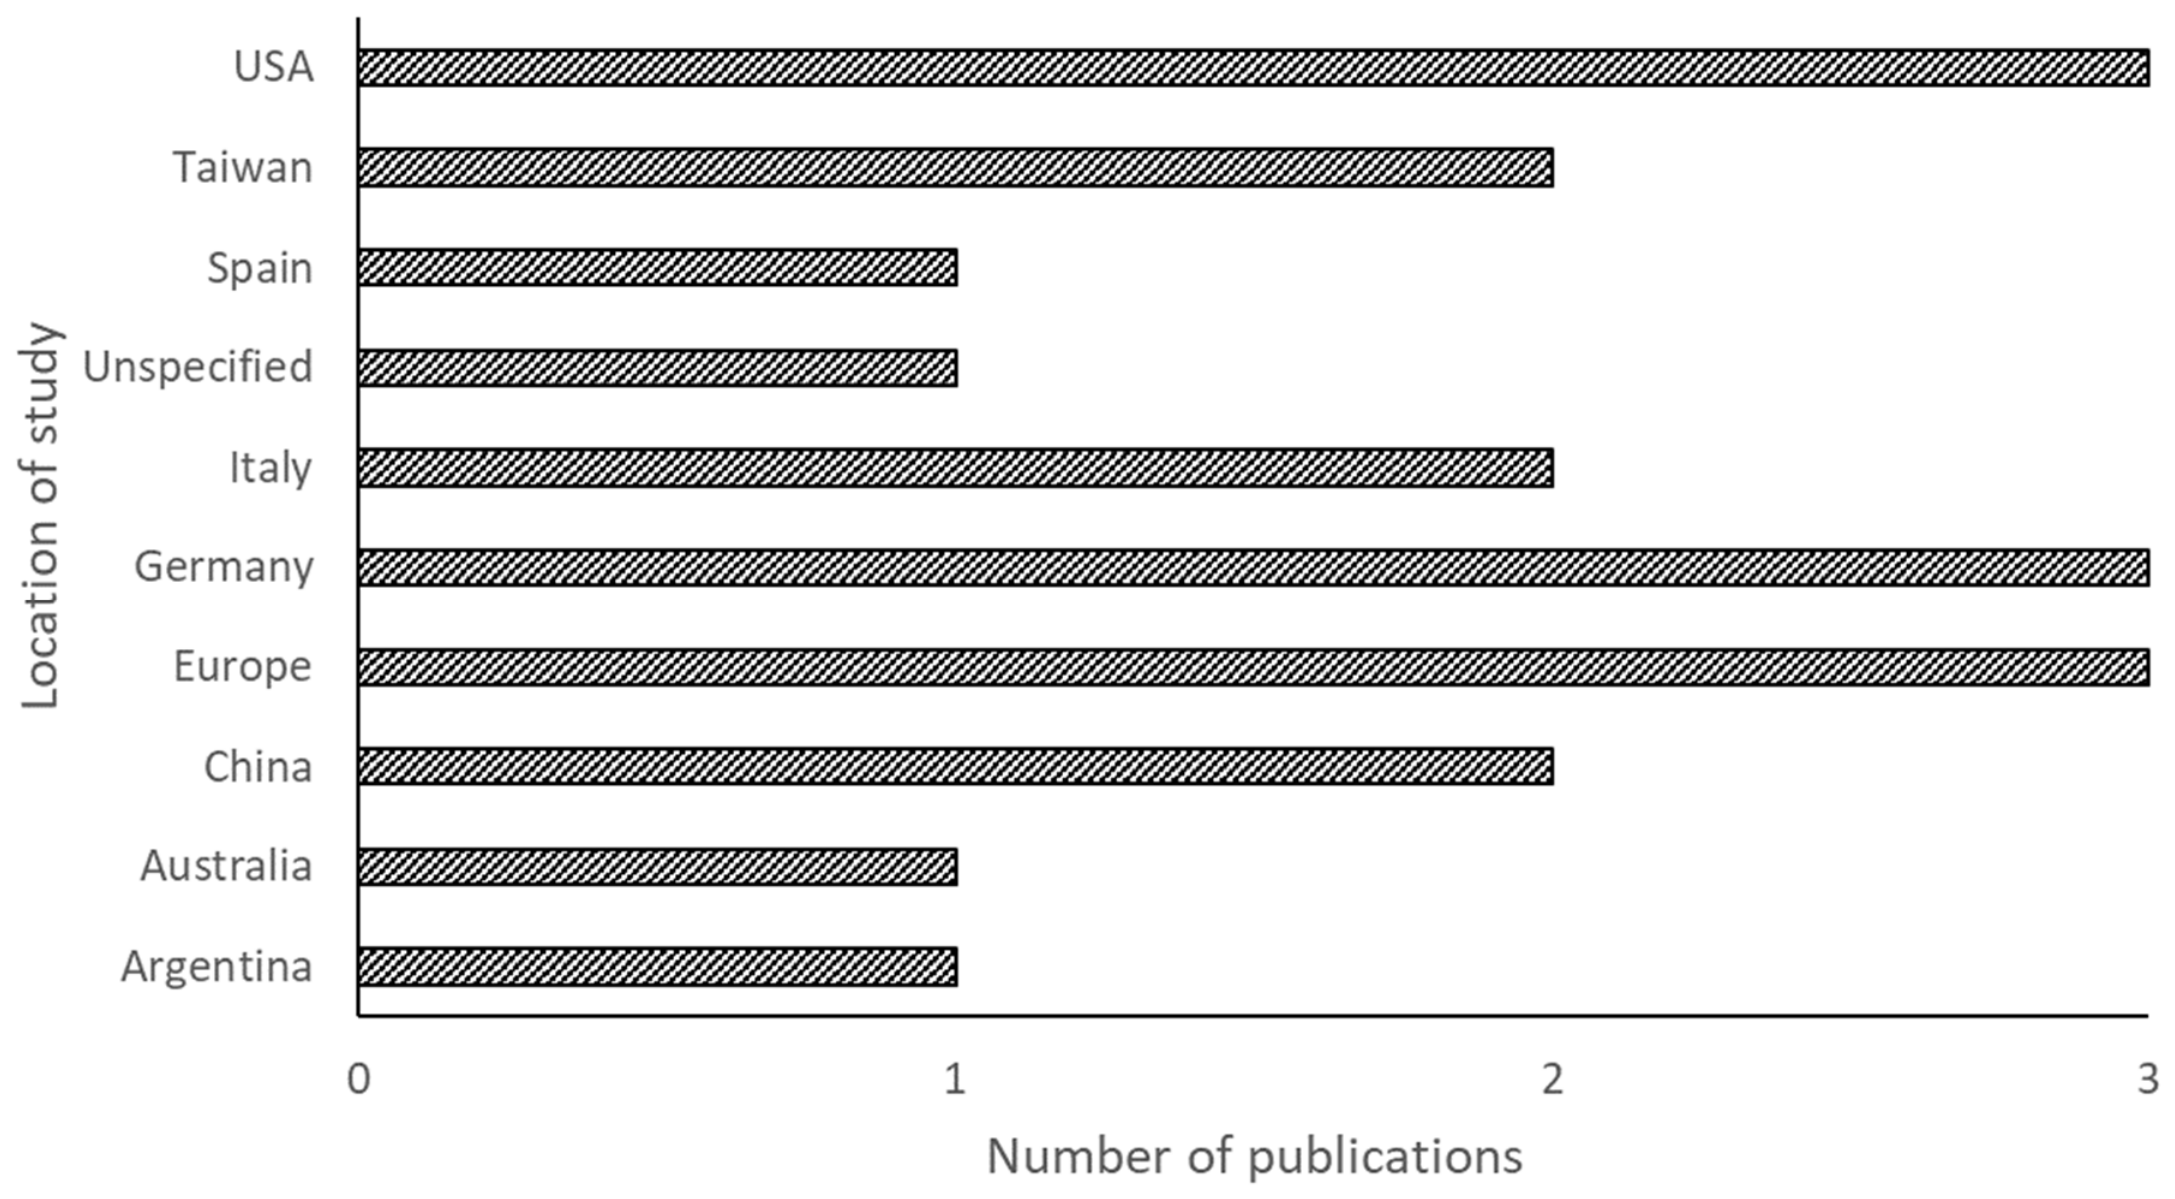
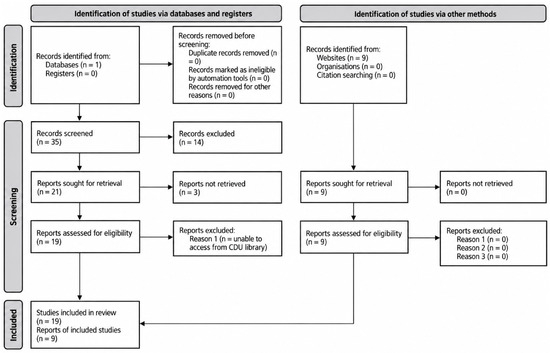
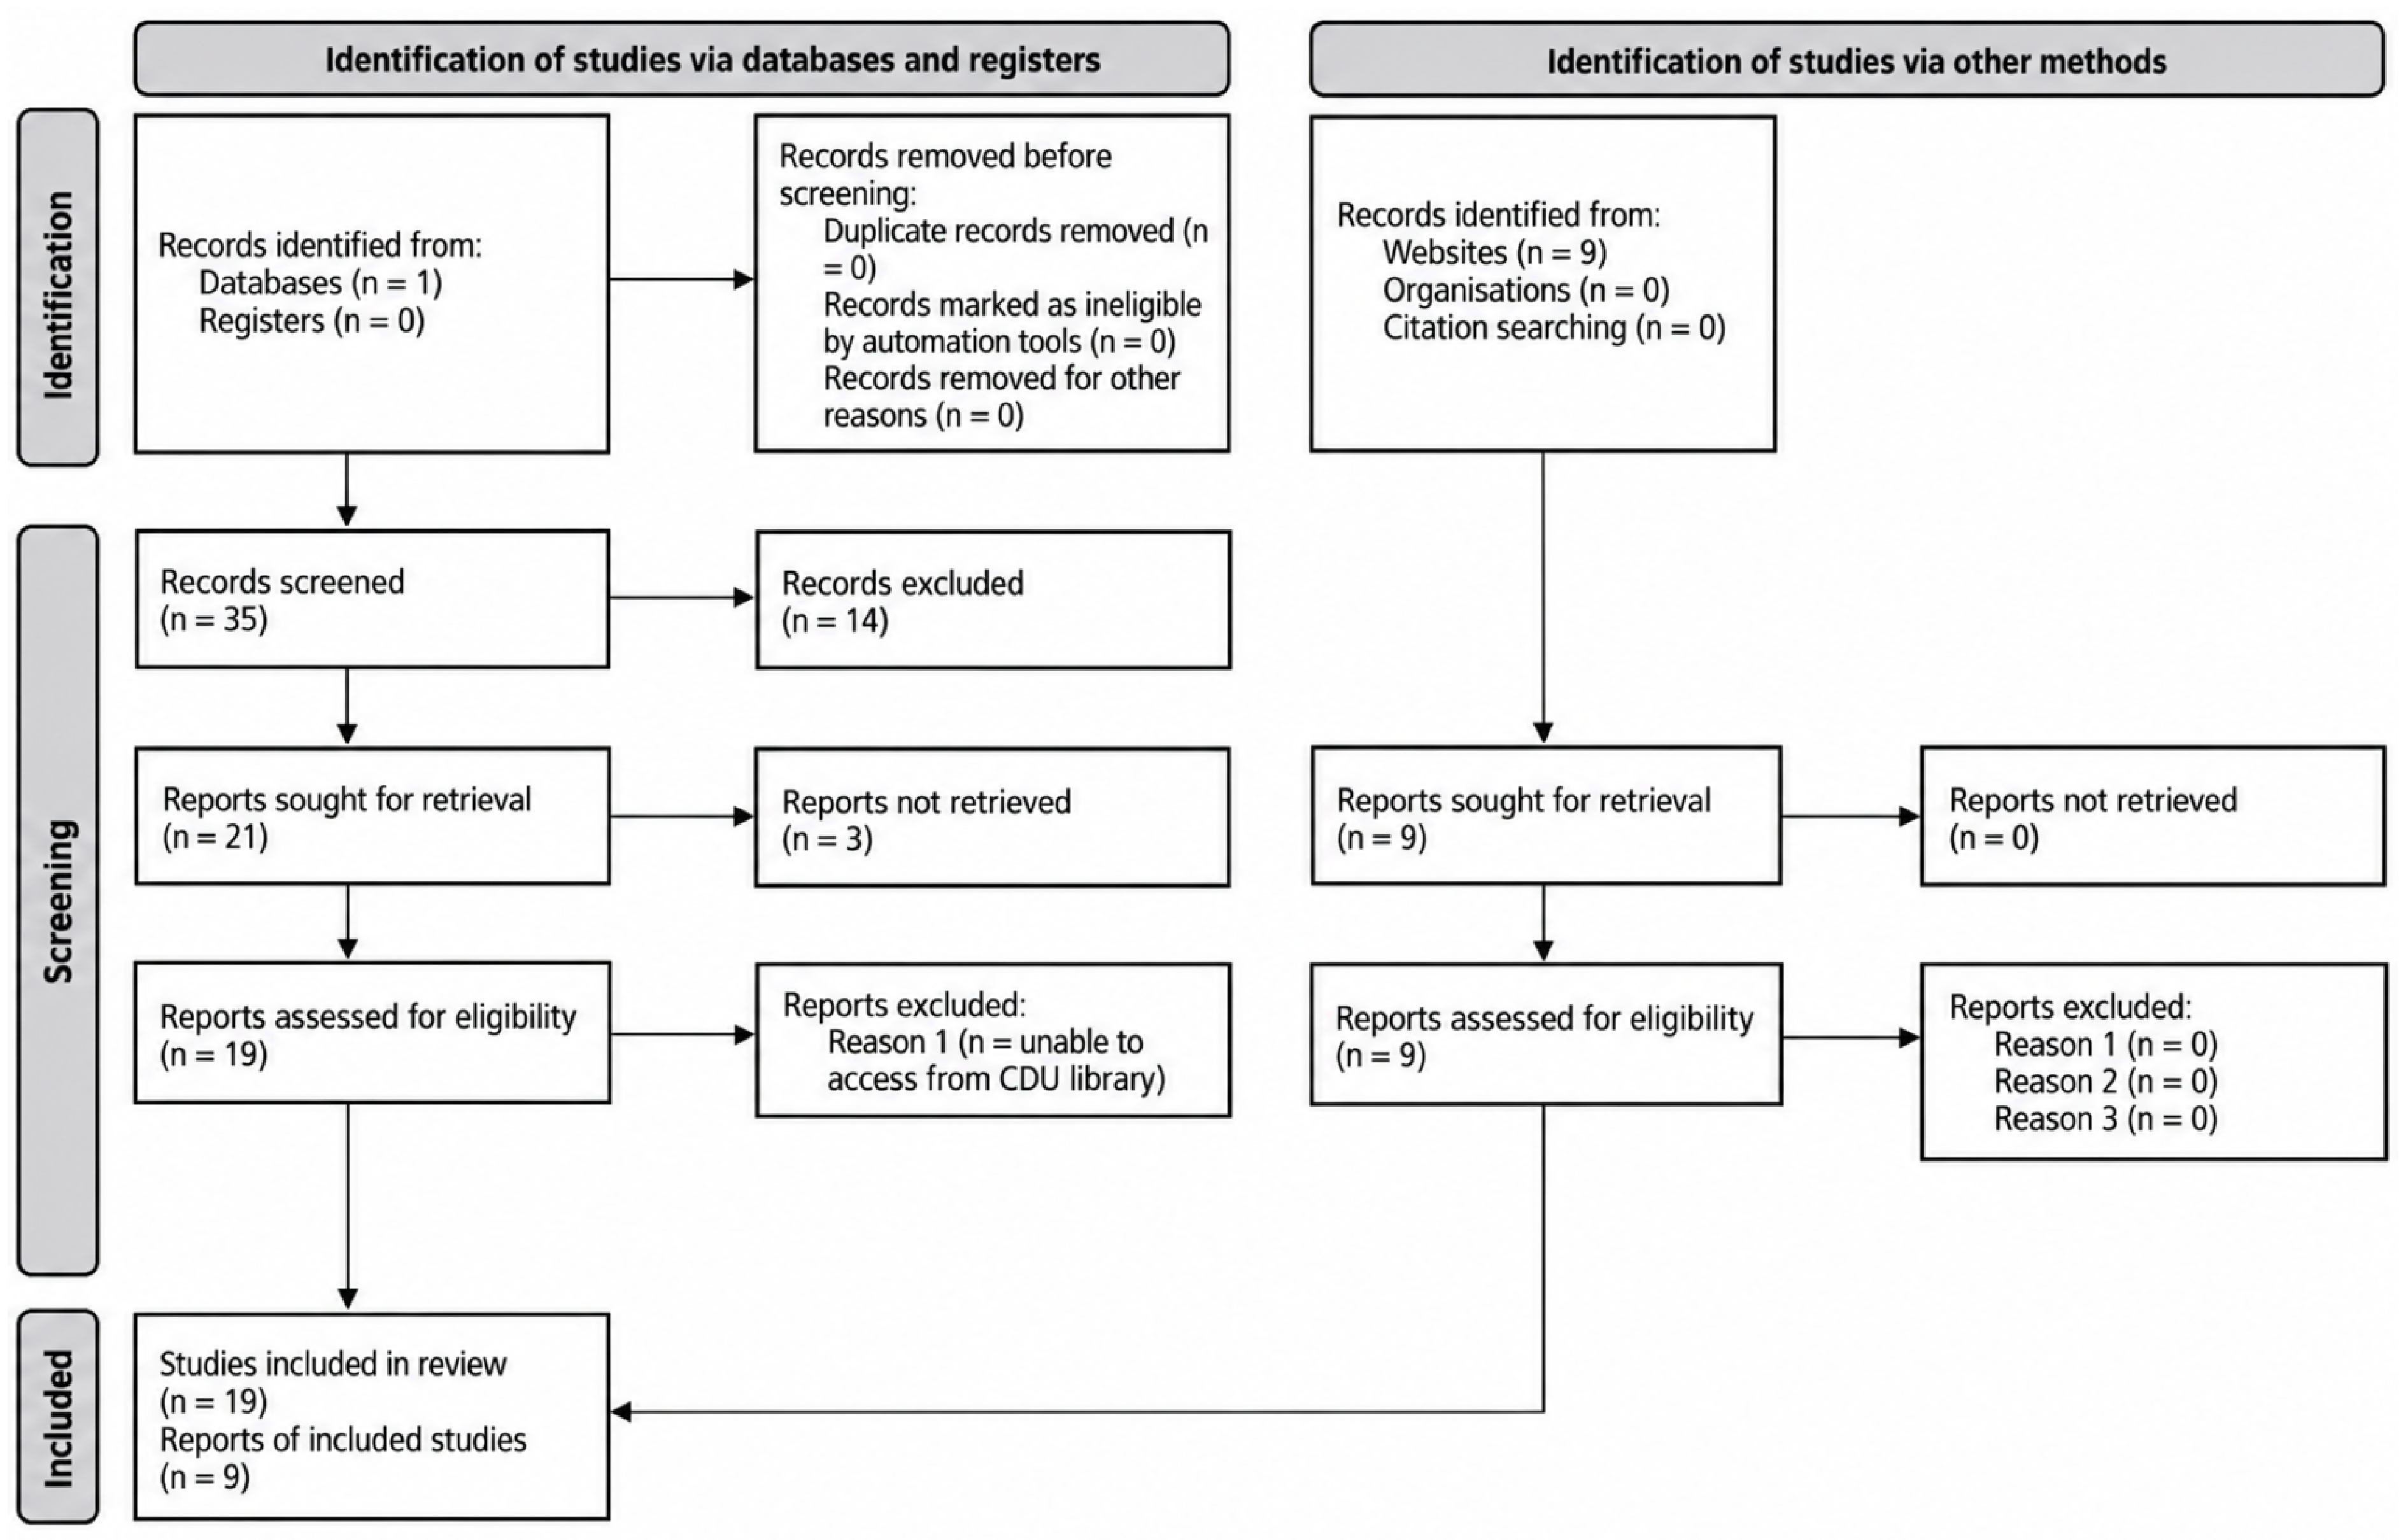
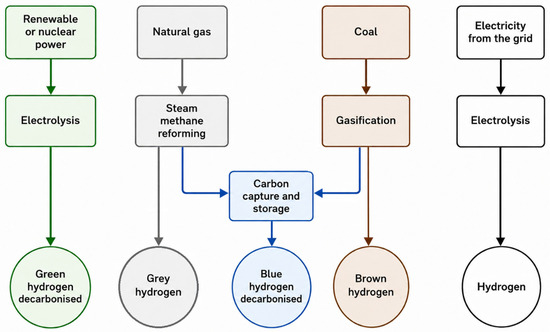
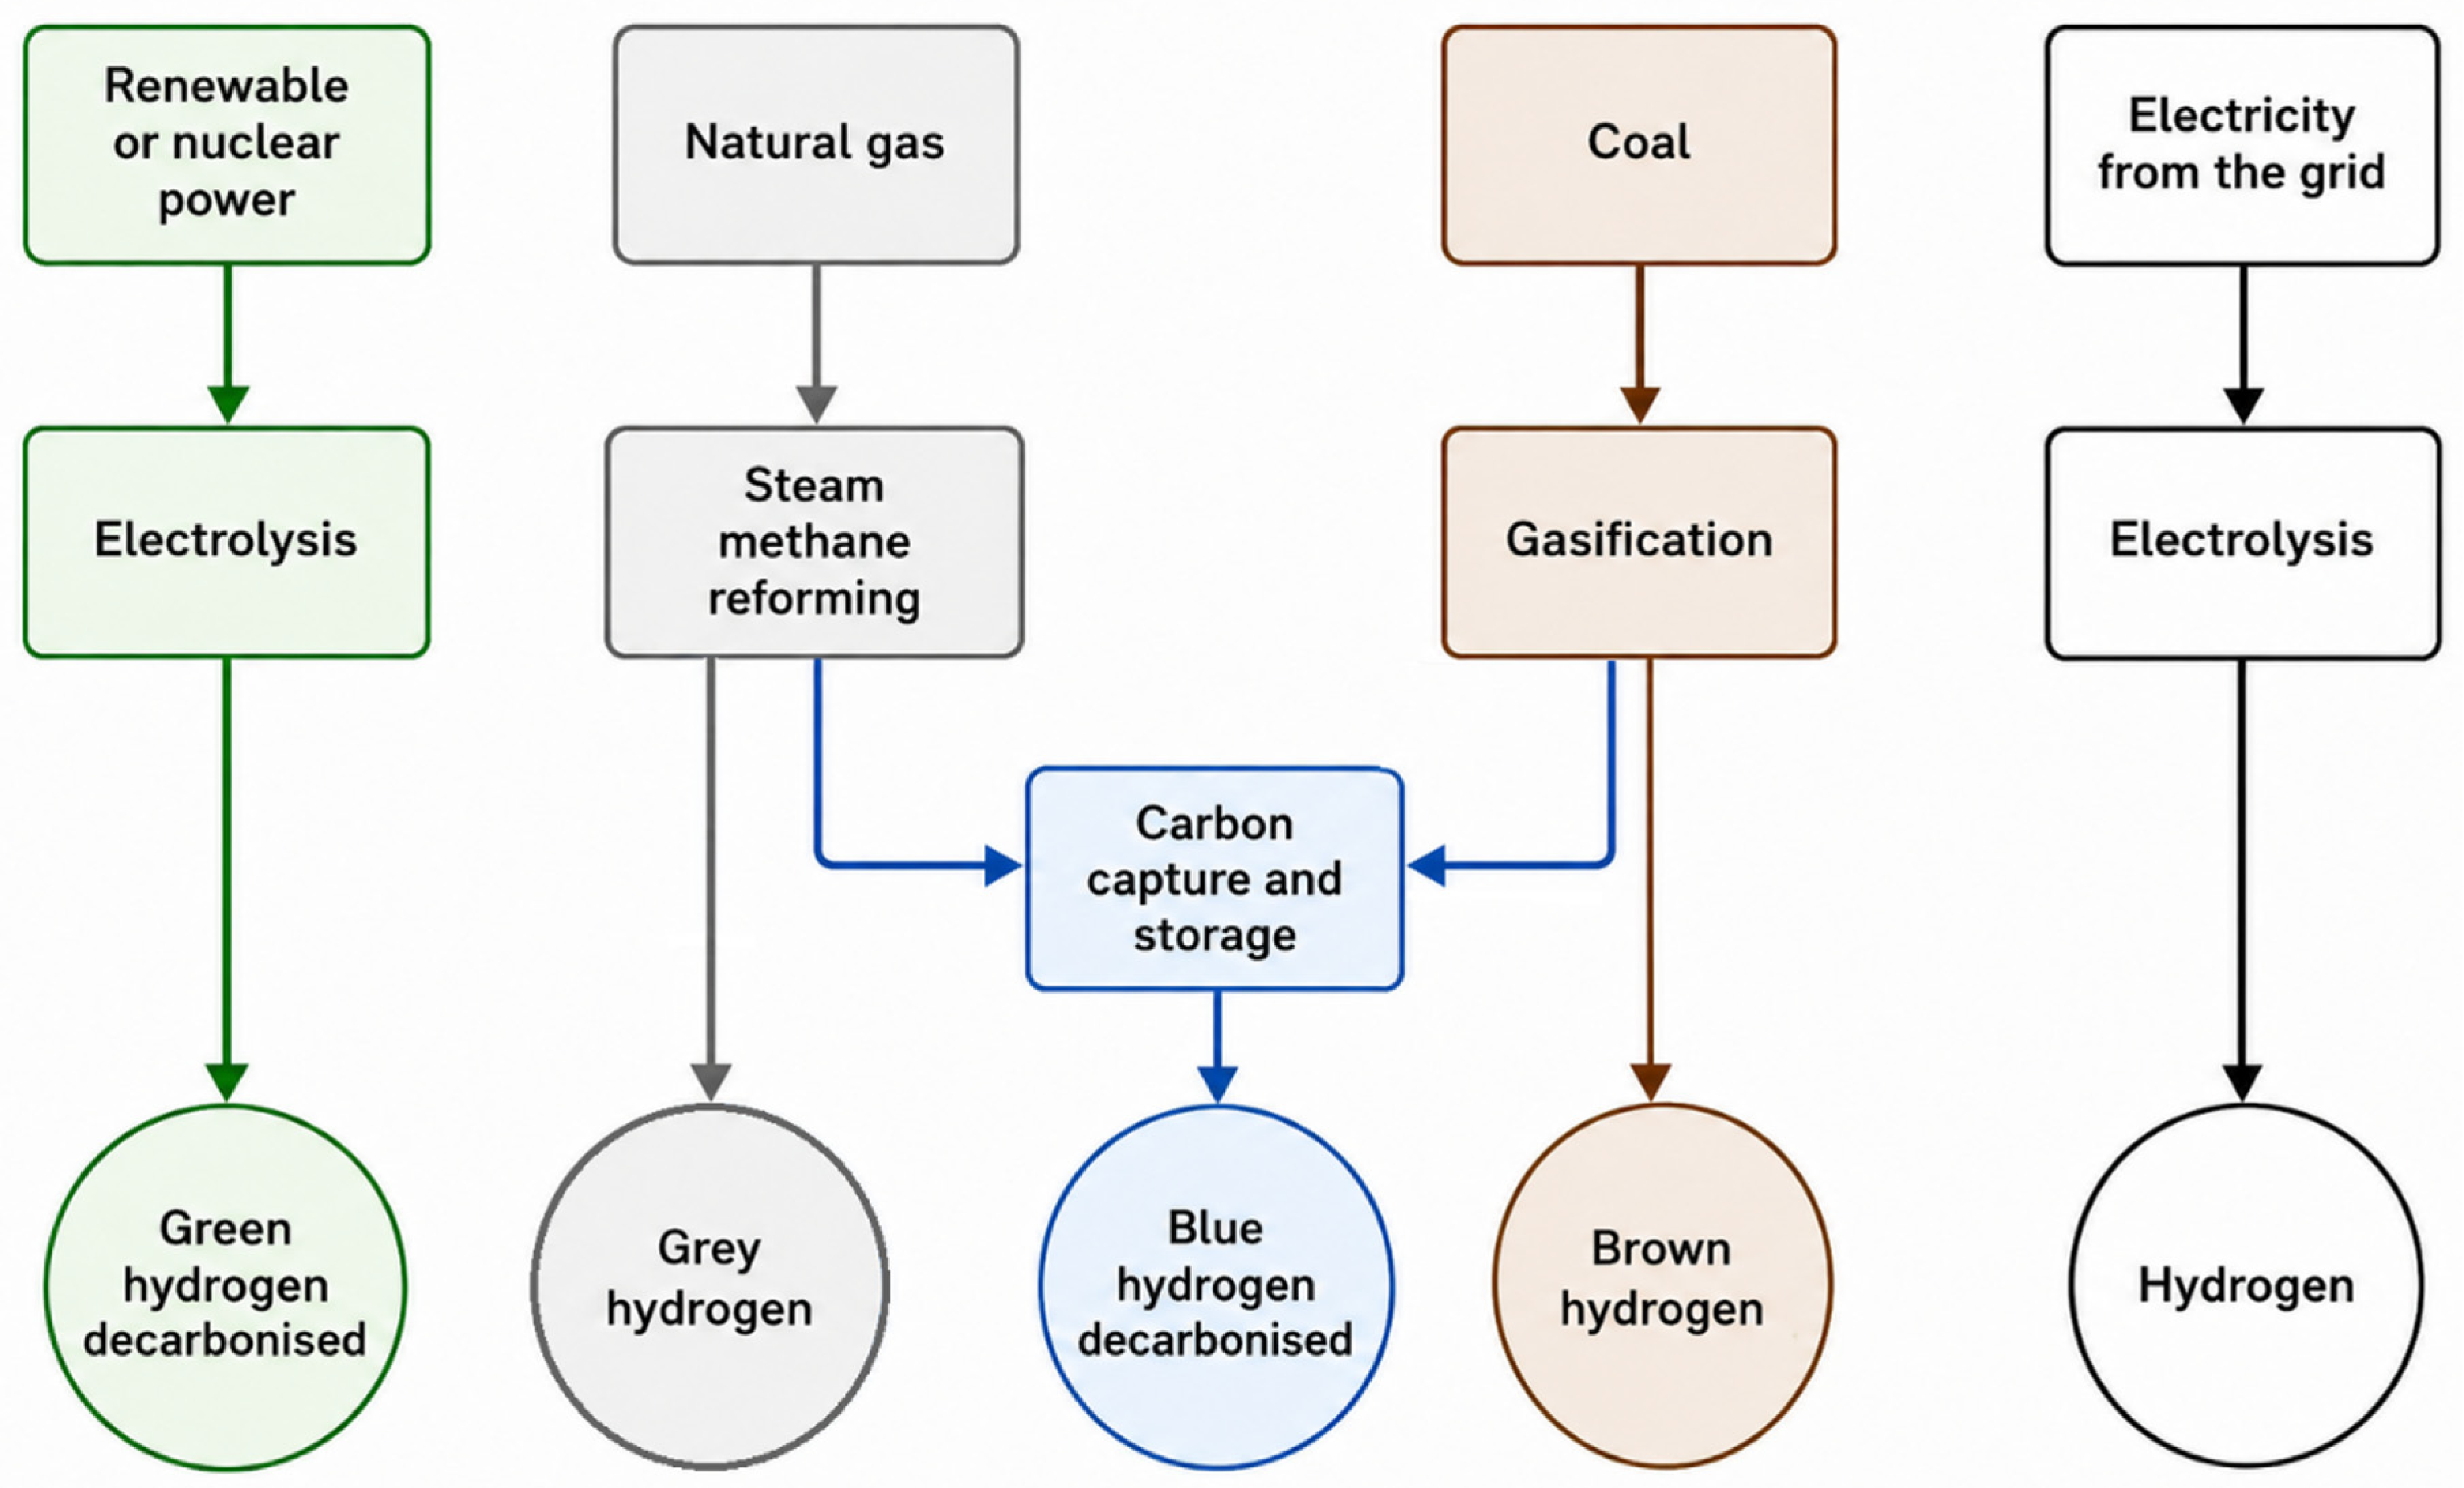
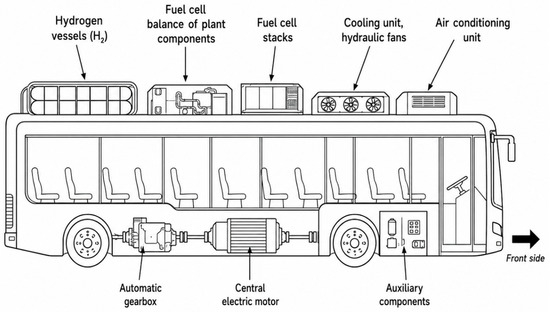
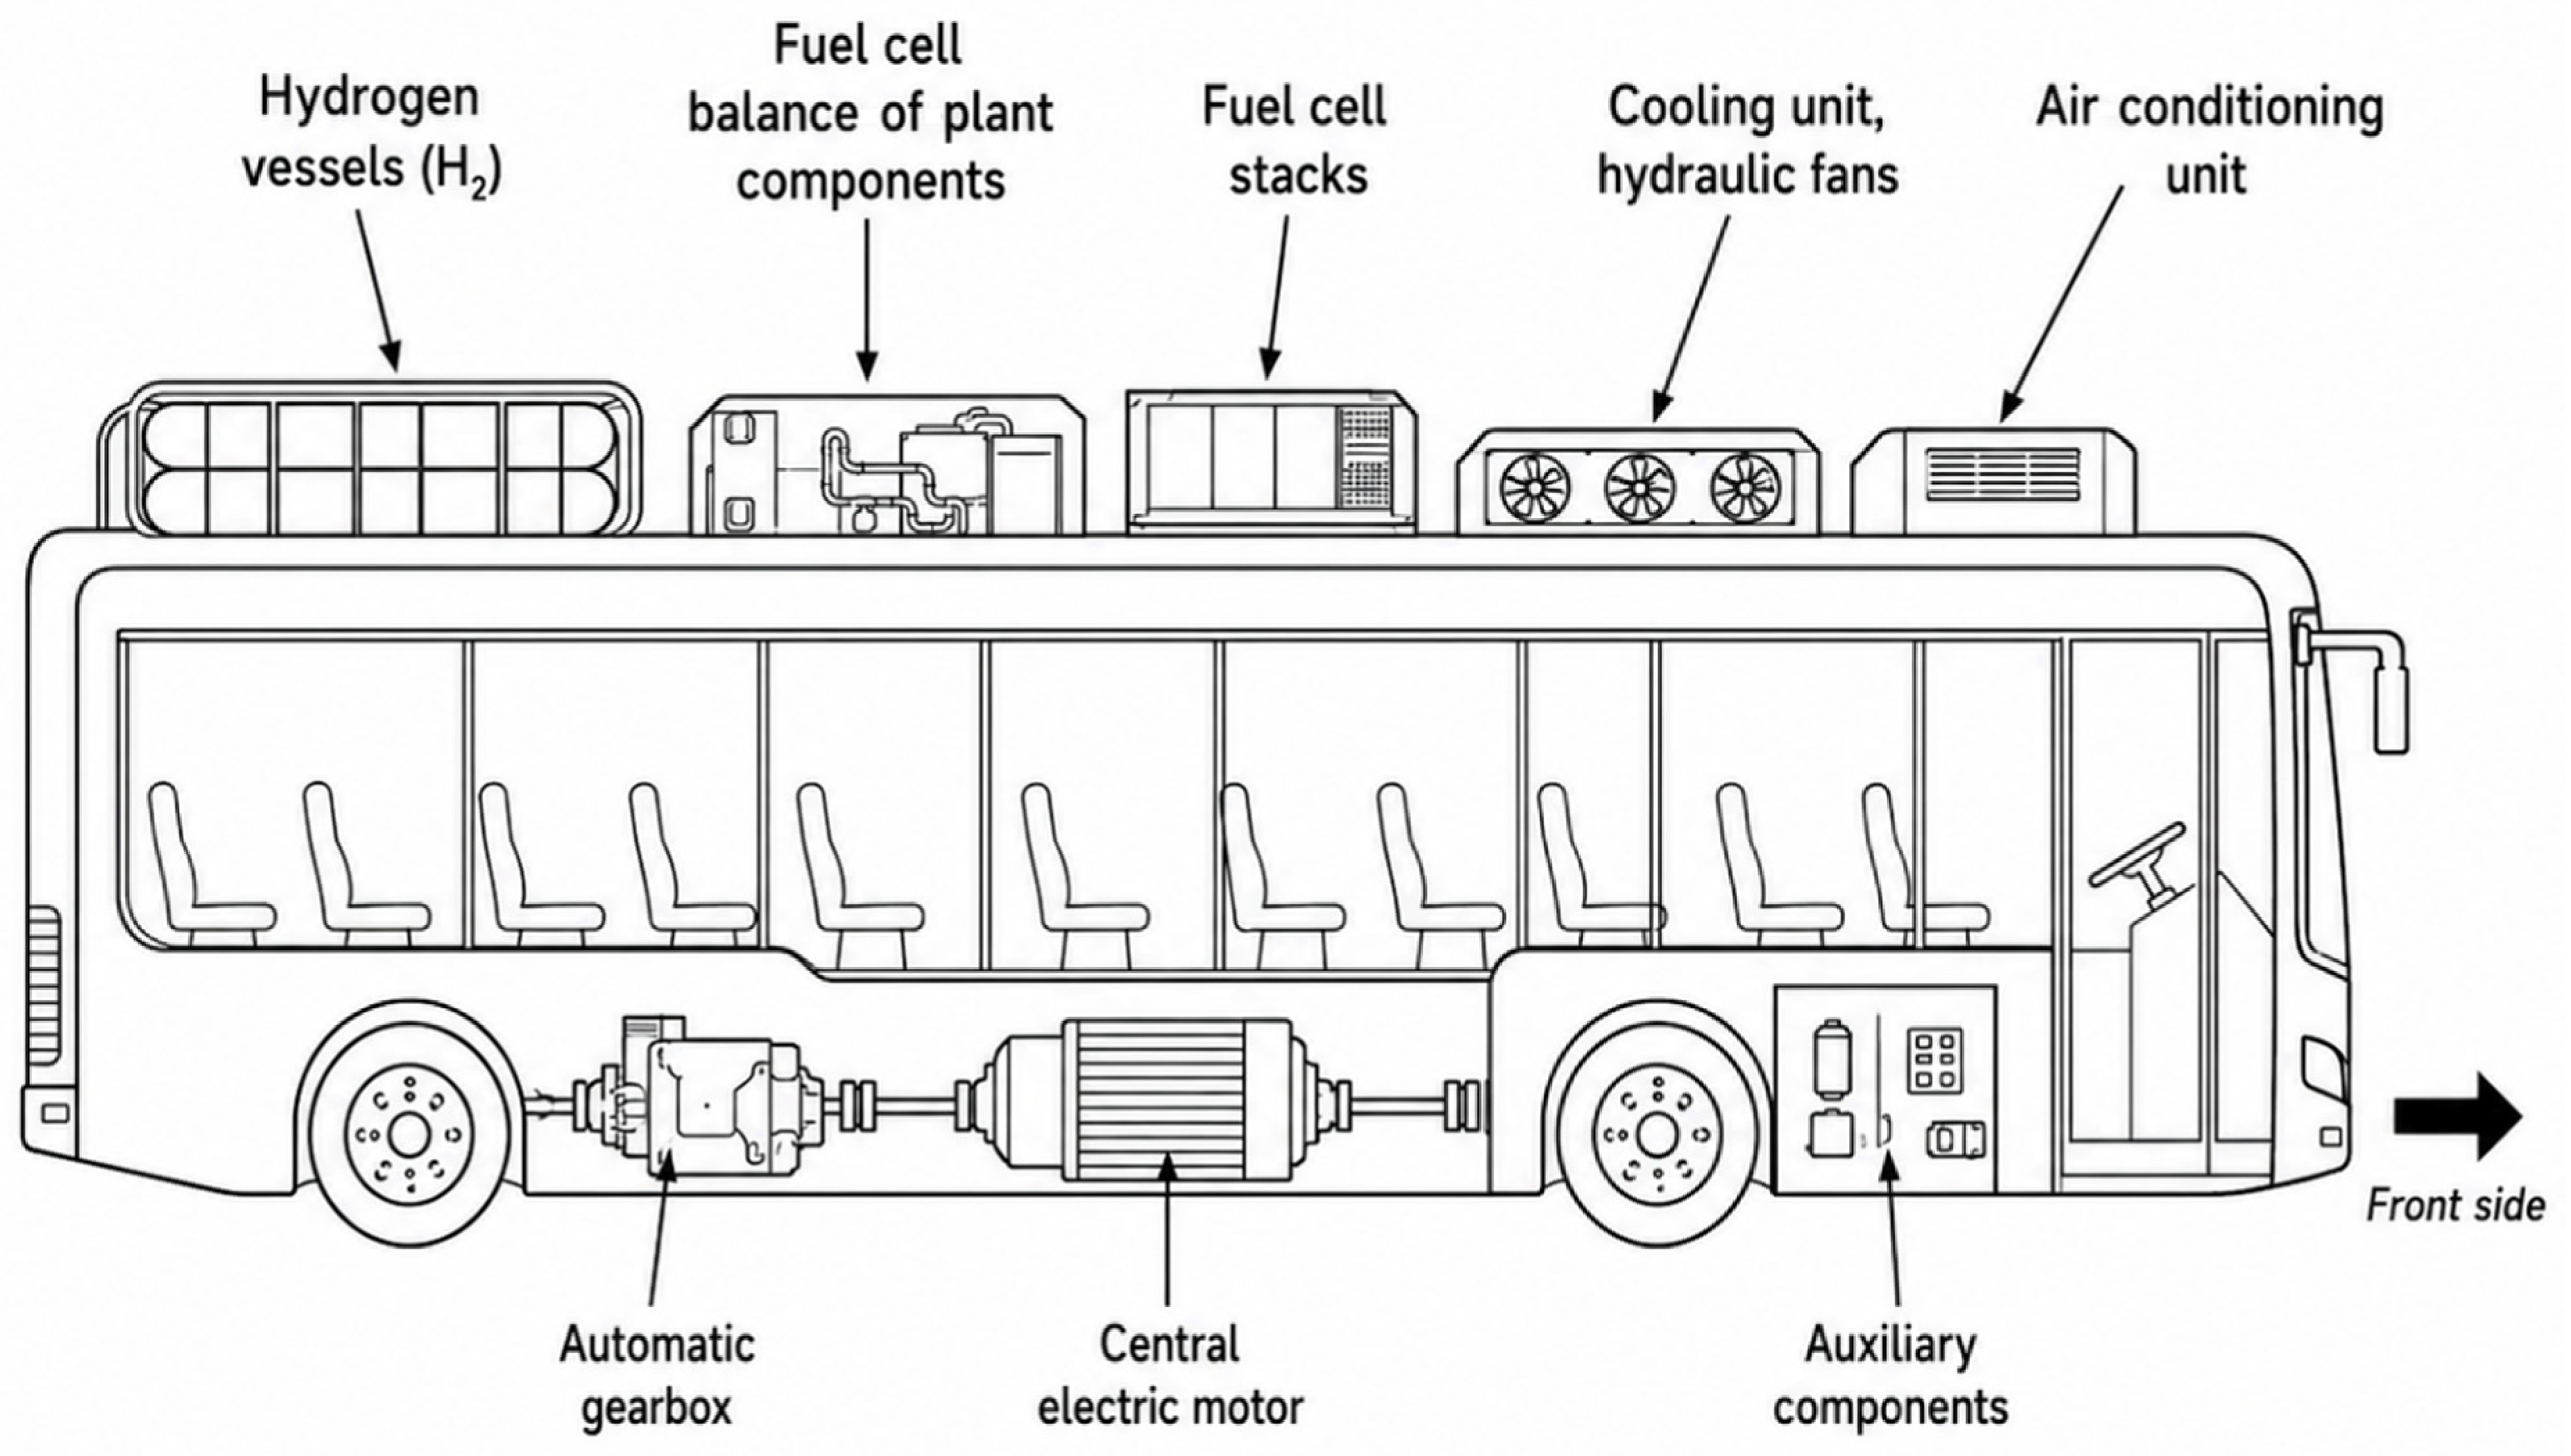
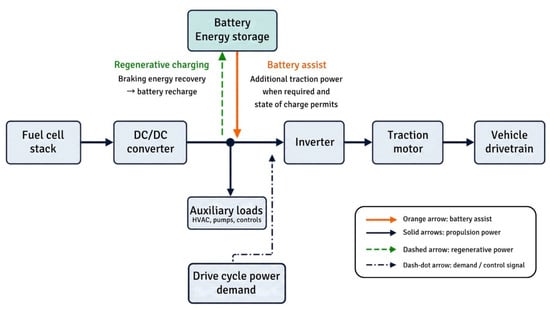
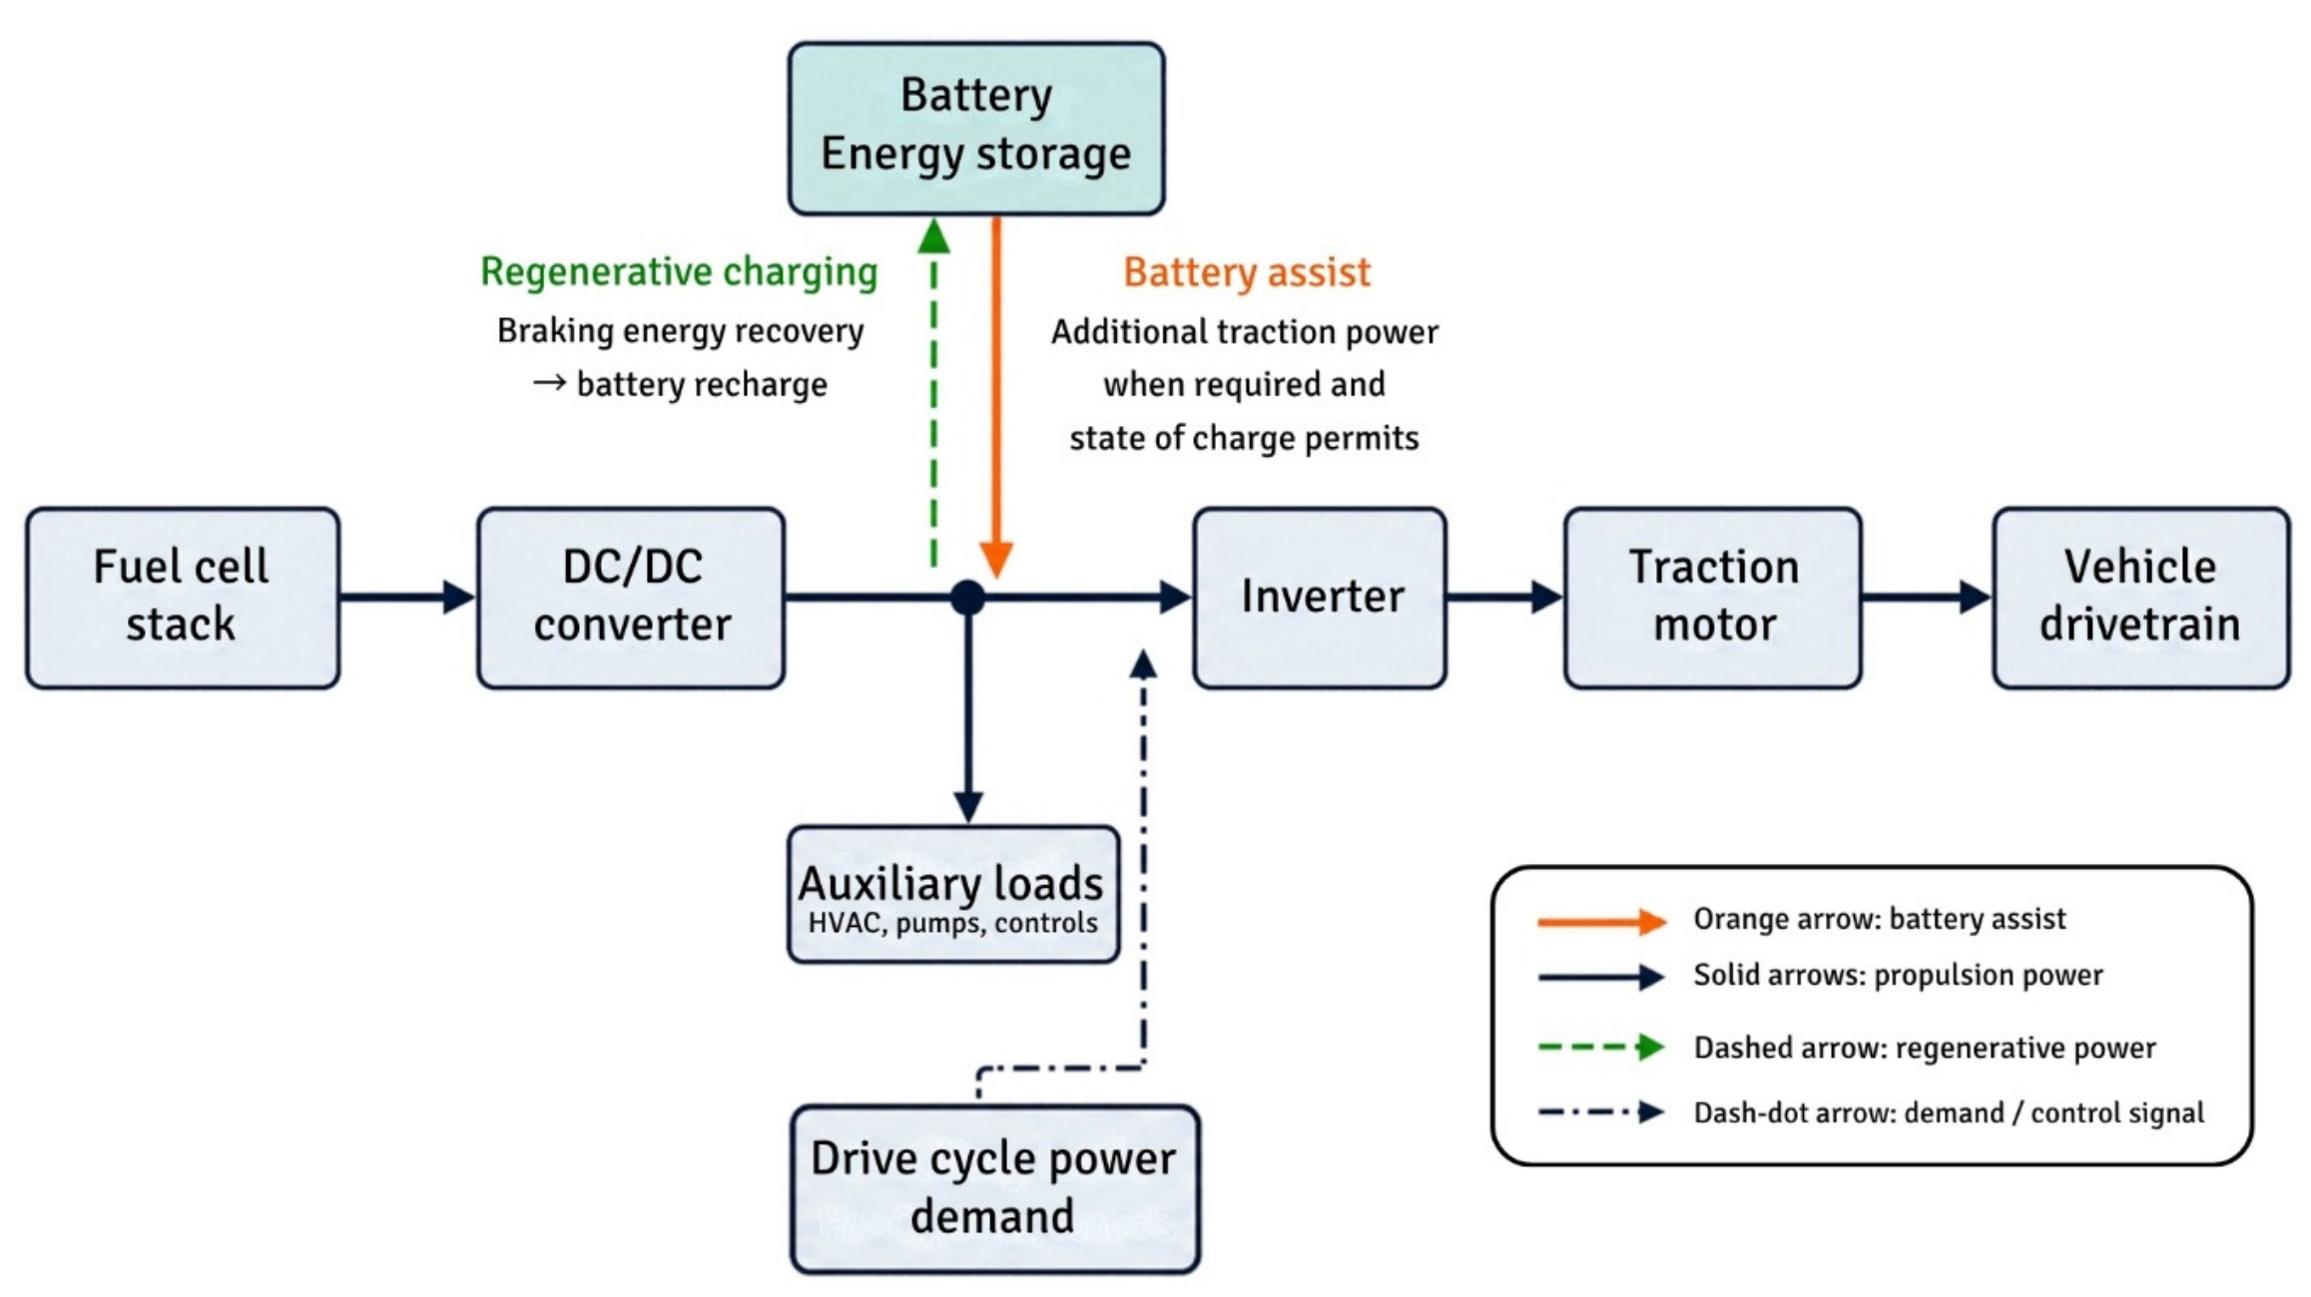

Disclaimer/Publisher’s Note: The statements, opinions and data contained in all publications are solely those of the individual author(s) and contributor(s) and not of MDPI and/or the editor(s). MDPI and/or the editor(s) disclaim responsibility for any injury to people or property resulting from any ideas, methods, instructions or products referred to in the content. |
© 2026 by the authors. Licensee MDPI, Basel, Switzerland. This article is an open access article distributed under the terms and conditions of the Creative Commons Attribution (CC BY) license.