


Abstract
Groundwater is vital for ecosystems and livelihoods in sub-Saharan Africa, particularly in Ethiopia, dubbed the “water tower of Africa.” Despite its significance, many areas face water scarcity due to data scarcity and an uneven distribution of resources. The Baro River watershed, covering over 23,000 km2 in Southwestern Ethiopia, poses a critical study area that has been largely overlooked. A hydro-geospatial modeling framework, utilizing remote sensing (RS), Geographic Information Systems (GIS), and Multi-Criteria Decision Analysis (MCDA) via the Analytical Hierarchy Process (AHP), was employed to map Groundwater Potential Zones (GWPZ) across the region. Nine environmental parameters were assessed for their impact on groundwater recharge, with rainfall as the primary influencer. The analysis involved reclassifying and weighting each factor, yielding a Consistency Ratio (CR) of 0.067, well below the acceptable threshold of <0.10, indicating reliable results. The resulting groundwater potential map classified zones into five categories: very high, high, moderate, low, and very low potential. High-potential zones are predominantly located in the Gambella lowlands, benefiting from favorable groundwater infiltration conditions in fractured volcanic and alluvial deposits. In contrast, low-potential areas correspond to steep slopes with dense drainage. The findings reveal significant groundwater development opportunities, with over 90% of the watershed exhibiting moderate to very high potential, suggesting effective water management strategies through the integration of GIS and AHP for enhanced groundwater evaluation.
1. Introduction
Groundwater is one of the most important and dynamic natural freshwater resources for sustaining ecosystems and serving as a significant buffer against the variability of surface water due to climate change [1,2,3]. Population growth, industrialization, and episodic droughts have led to higher demands for groundwater in various worldwide areas [4,5]. In sub-Saharan Africa, in countries with little surface water infrastructure, groundwater is the primary source of residential water supply consumption and irrigation demands [6,7,8]. Furthermore, the non-uniform distribution of groundwater resources is controlled by complex geomorphic, anthropogenic, and climatic interactions [9,10].
Ethiopia, often referred to as the “Water Tower of Africa,” has an abundance of surface water but is experiencing localized water scarcity [11,12]. Groundwater occurs in diverse geological settings across the country, such as high-elevation volcanic plateaus and low-lying sedimentary basins [13,14,15]. However, recent studies suggest that to be climate resilient, basin authorities such as the Upper Blue Nile basin, Omo-Gibe basin, and Awash basin are increasingly shifting from surface water to groundwater-based projects [16,17,18]. Even though the Baro River watershed is a large-scale watershed, its subsurface potential is mostly unreported and understudied despite these consequences [19].
The interplay of surface runoff and groundwater affects aquatic ecosystems and resource availability in sub-Saharan catchments, informing management strategies [20]. The Baro River watershed covers approximately 23,000 km2 in the southwest Ethiopian highlands and is of great hydrological importance. It is a large tributary of the Nile system that has a substantial annual rainfall (1200–2200 mm/yr.) and flows into the alluvial plains of the Gambella region from broken volcanic mountains [1,21]. Although the surface water is abundant, the regional groundwater potential remains poorly understood. The application of conventional hydrogeological methods such as exploratory drilling and geophysical sounding (VES) is challenging, costly, and time-consuming in large and complex terrains [22,23].
Hydro-geospatial modeling has emerged as an effective and cost-saving solution to address these challenges [24,25]. Groundwater potential zones (GWPZ) can be delineated by integrating the latest version of Geographic Information Systems (GIS) and remote sensing (RS) [2,3,8,9,17,18,19,24]. Delineating GWPZ requires consideration of several issues, including the balancing of various conditioning factors [3,10,26,27]. The Analytic Hierarchy Process (AHP) is a subcategory of Multi-Criteria Decision Analysis (MCDA) [10,26,28,29], which is the best method for this. Recent advances in hydrological modeling and GIS land-use analysis reveal that integrating thematic layers is effective for exploring subsurface potential in various landscapes [30]. However, applying these multi-criteria geospatial overlay methods in sub-Saharan Africa faces major challenges, including limited hydrogeological monitoring networks, low thematic spatial resolutions, and subjective parameter weighting in AHP pairwise comparisons [5,7,13].
Previous studies in Ethiopian catchments typically employed six or seven groundwater conditioning factors in conventional hydro-geospatial modeling [2,11,14,25]. This study advances the methodology by integrating nine important parameters that were shown to be relevant in the hydrological aspects: lithology, slope, lineament density, land use/land cover (LULC), curvature, rainfall, geology, soil, Topographic Wetness Index (TWI), and drainage density. These factors collectively determine the natural water retention capacity of the watershed, which influences groundwater infiltration, storage, and long-term aquifer sustainability [31]. Primary and secondary porosity and the rate of runoff vs. infiltration controlled by slope and TWI were represented by lineament density and lithology [15,32]. This study explores localized secondary porosity in fractured volcanic formations, emphasizing cross-layer structural analysis between lithology and lineament density, a factor often neglected by traditional models. To enhance groundwater potential zonation in data-scarce regions, it employs single-parameter sensitivity analysis, hydrological literature, and SWAT+ modeling cross-validation, with a GIS-MCDA technique designed for the Baro River watershed. The research differentiates between recharge and storage mechanisms in primary and secondary porosity, offering valuable insights for data-poor basins in sub-Saharan Africa. Its aim is to identify groundwater potential zones using a hydro-geospatial modeling approach, leveraging Geographic Information Systems (GIS) and remote sensing (RS) to synthesize environmental variables, particularly through open-source software like GRASS GIS 8.4.0.
On the terrestrial water balance, the main hydraulic input is rainfall, while the water availability in soil moisture and in deep infiltration is strongly linked with the actual evapotranspiration [33]. High near-surface evaporation loss in arid and semiarid environments [34,35], low recharge potential due to high evapotranspiration, and shallow water table conditions that do not allow for groundwater recharge and may result in overestimation of recharge if not included [33,36]. The water balance between runoff and evapotranspiration and between evapotranspiration and precipitation depends on properties of the land surface, which are coupled to the climatic forcing by atmospheric demand and precipitation. Hence, incorporating the climate outputs with land surface characteristics is required to minimize the error in water balance estimation for groundwater potential and recharge studies [37]. In the absence of comprehensive drill data, the work used a multi-step theoretical validation approach to ensure consistency of GWPZ. A statistical sensitivity analysis is given to test the stability of the model and the effect of every environmental theme layer on the final results by carefully omitting some distinct theme layers as provided by [5,27,38]. Second, to verify regional alignment and provide a solid scientific foundation for groundwater management without the need for conventional well-depth measurements, the results were finally compared with earlier research by [19], a geophysical survey in the Baro-Akobo-Sobat Basin.
The study aims to develop a high-resolution hydro-geospatial modeling framework for groundwater potential zoning for the Baro River watershed, which has been previously understudied using remote sensing-derived datasets, GRASS GIS, and the Analytical Hierarchy Process (AHP). The main contributions of this study include: (i) integrating nine groundwater conditioning factors; (ii) analyzing groundwater recharge and storage while distinguishing between alluvial and fractured volcanic aquifers; (iii) utilizing open-source GIS workflows; and (iv) validating results through sensitivity analysis, hydrological literature, and SWAT+ groundwater modeling.
2. Materials and Methods
The writers used artificial intelligence in this work solely for graphical merging of several author-generated graphs or images, not for data generation, gathering, analysis, or interpretation.
2.1. Baro River Watershed Regional Settings
2.1.1. Physiography and Hypsometry
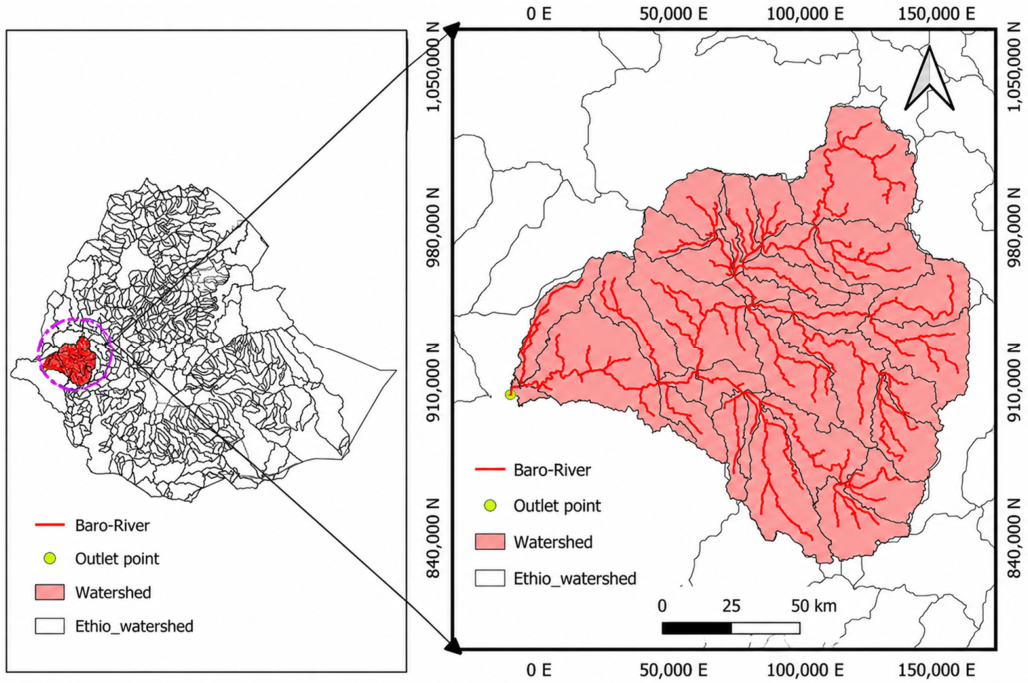
The Baro River catchment is a big tributary of the Sobat-White Nile system, and it is located in southwest Ethiopia. The area is approximately more than 23,000 km2 in the river basin (Figure 1) [19,39,40]. The regional hydraulic potential is related to the hypsometric gradient. In groundwater recharge modeling, the topographic slope (β) is determined by the slope of the digital elevation model (DEM) in both the x and y directions [19].
Figure 1.
Baro River watershed study area map.
The steep slopes of the highlands accelerate surface runoff, and the lowland areas increase surface residence time (Tr), promoting deep percolation into the saturated zones [41]. To differentiate between low-velocity and high-velocity runoff, high-resolution data is needed to identify the discontinuity features in the topography [15].
2.1.2. Hydrology and Drainage Network
The drainage system is influenced by tributaries of the Baro River watershed, including the Birbir, Geba, and Sor rivers [1,39,40,42]. After displaying a discrete dendritic system in the upper regime of the watershed, the drainage systems in the alluvial plains (lowlands of the watershed) changed to meandering forms, which are indicative of consistent resistance in the volcanic bedrock [2,4,43,44,45]. Parameters used to assess the hydrological efficiency of a watershed are: drainage density (Dd) is calculated by stream length/total area (Equation (1)) [10,26].
where L is stream length, and A is area (23,000 km2). The prioritized area (low drainage density) in the approach to modeling indicates high surface permeability and infiltration potential [2]. Contrary to this, the dissected highlands of the Baro River watershed have high drainage density values, caused by the high runoff coefficient and impermeable surface of dense drainage networks [14].
2.1.3. Comparison of Geology and Land Use/Land Cover
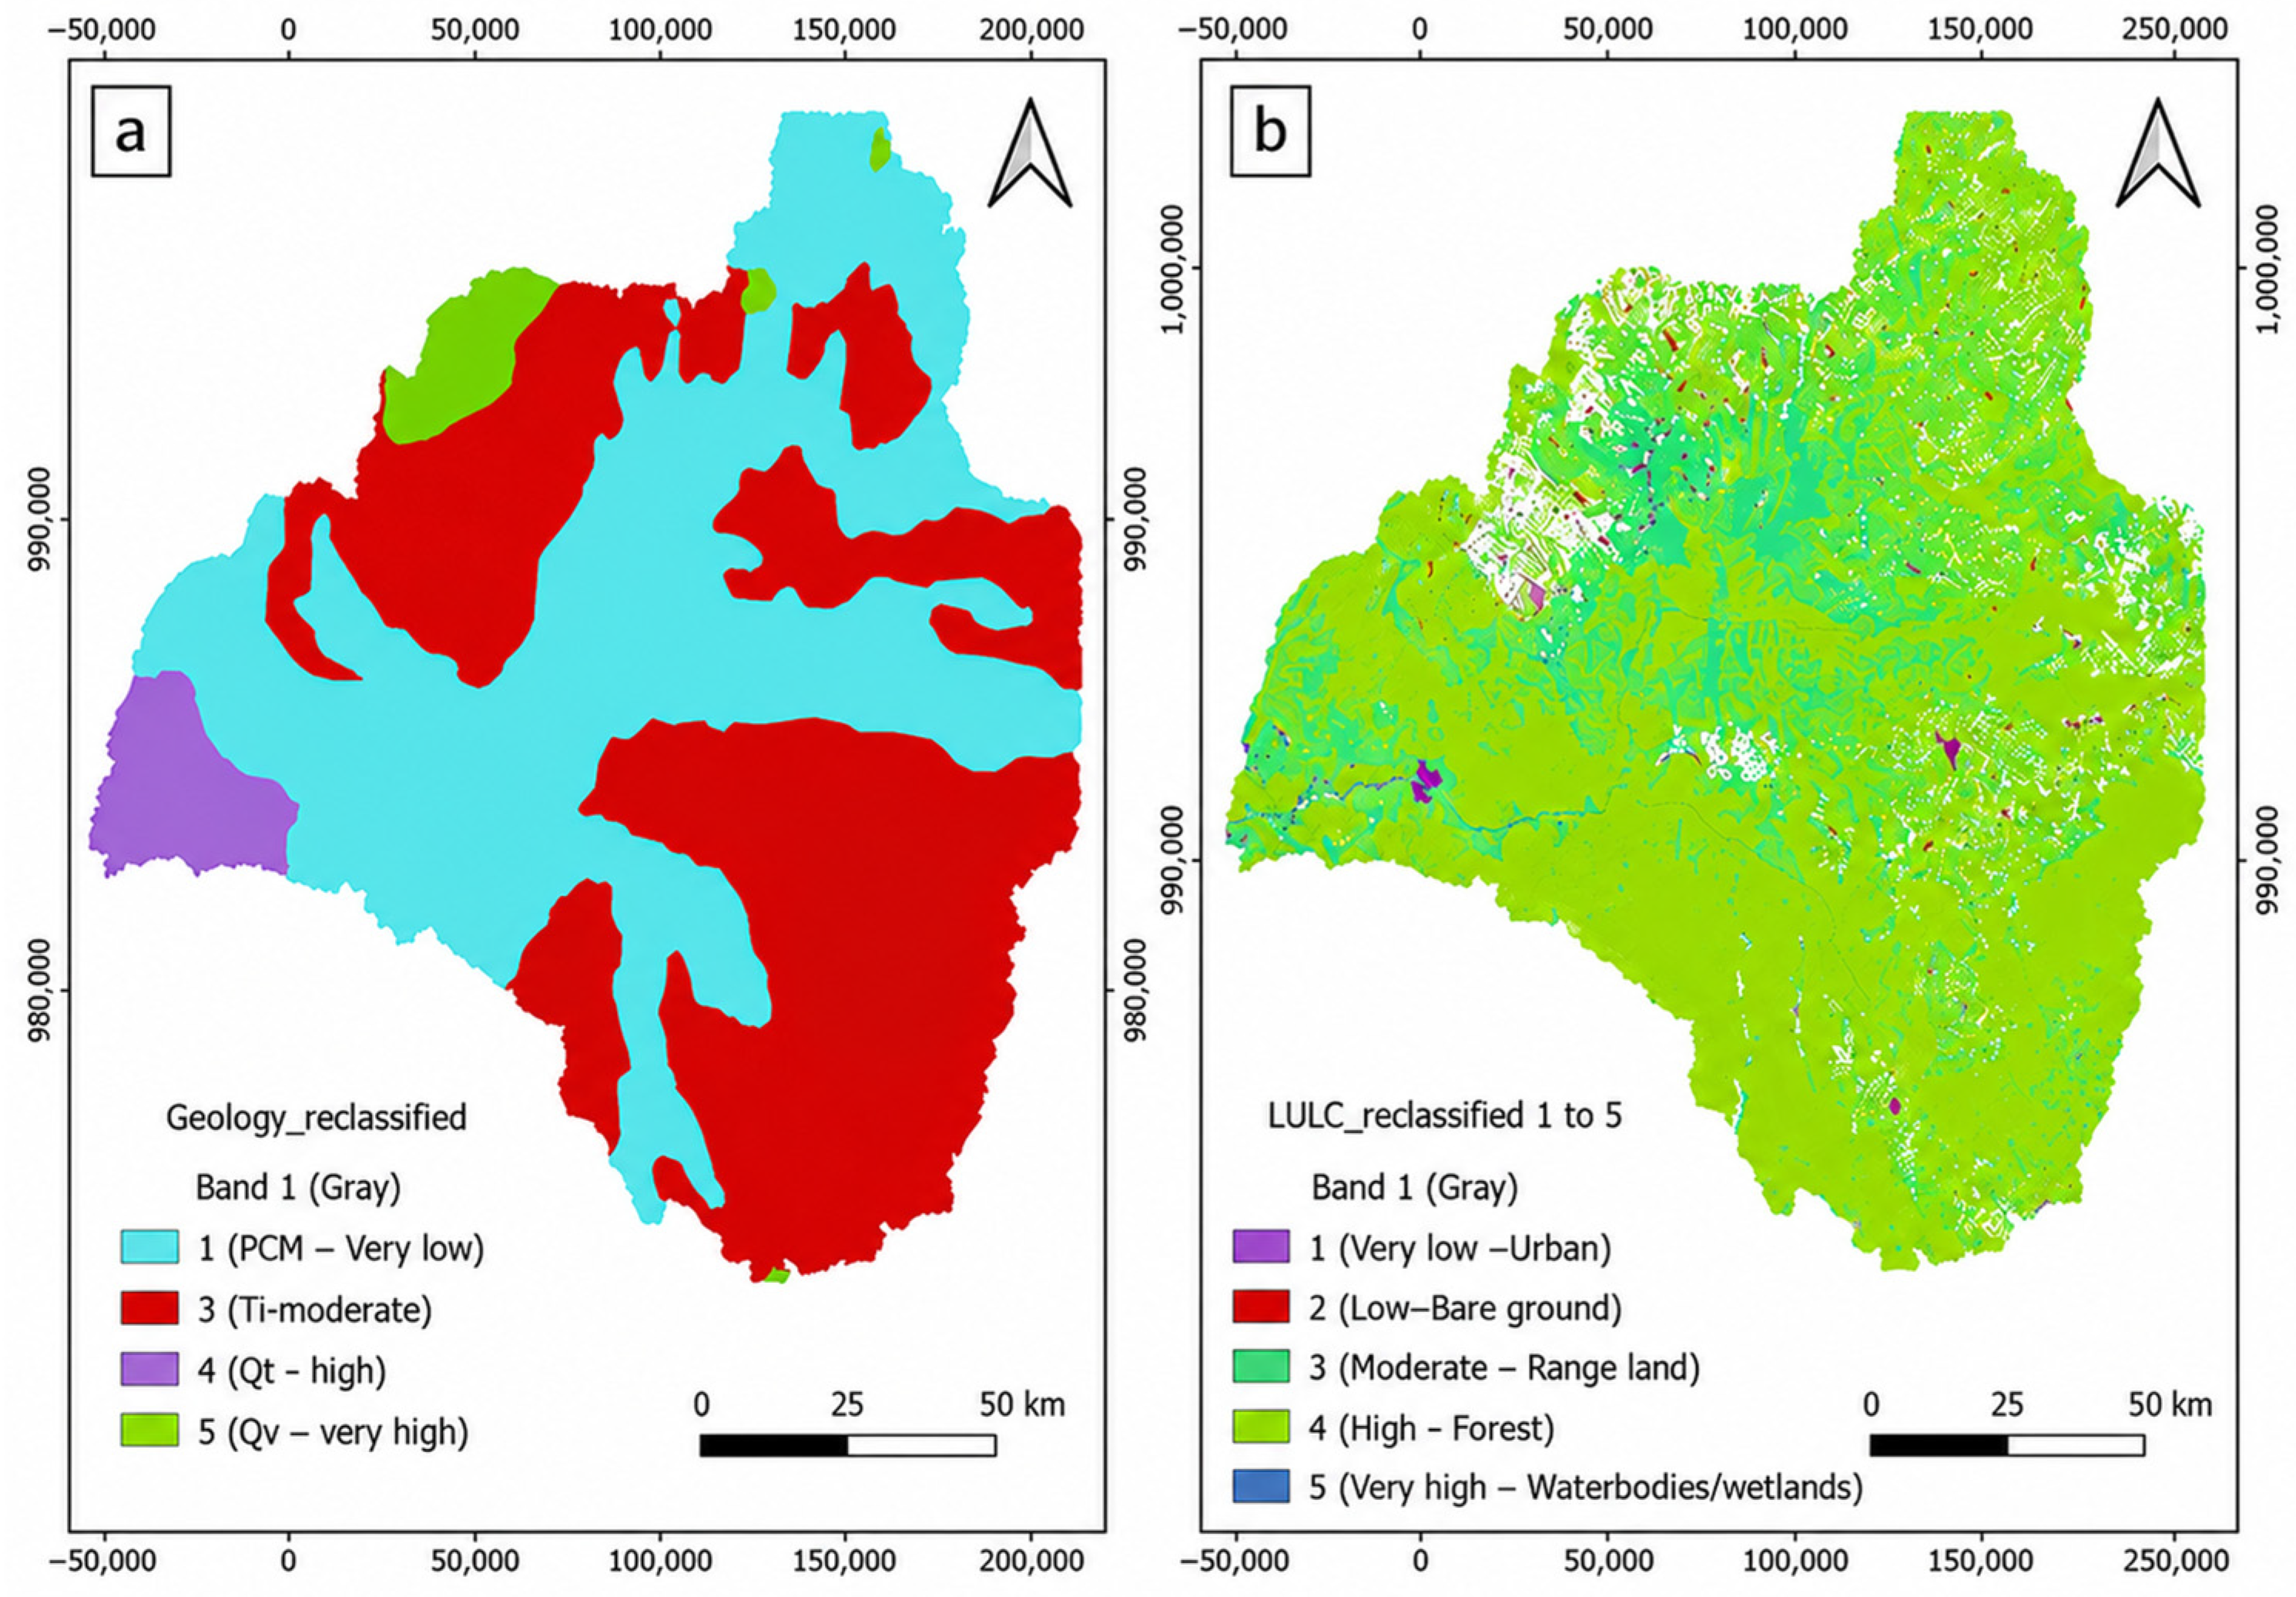
Geology: The Baro River watershed comprises three distinct hydrogeological units described in Figure 2.
Figure 2.
Comparison of (a) geology and (b) land use/land cover.
Basement rocks (Precambrian age) (Ranked 1–2): The origin of the Precambrian basement rocks with insignificant primary porosity is represented by the localized outcrops; the groundwater is constrained to the localized fracture zones and worn mantles [39,40,42].
Tertiary volcanic (Ranked 3–4): Mainly rhyolites and basalts in the highlands of the watershed, lacking substantial primary inter-granular porosity. Groundwater storage in the subsurface is controlled by secondary porosity (faults, joints, and vesicles). Accordingly, in the vertical recharge setting, these fractures at the surface appear as lineaments [4,22,24].
Quaternary alluvial deposits (Ranked 5) are unconsolidated sediments with considerable primary porosity that are present in Gambella’s lowlands with high hydraulic permeability and significant sedimentary thickness, making them high-productive aquifer zones [39,40].
Land use/land cover (LULC): Dynamically controls surface hydraulic roughness, evaporation demand, and runoff attenuation [46,47] across the Baro River watershed. In Figure 2 and Table 1, which were obtained from ESRISentinetle-2 high resolution (30 m), the watershed was divided into six land cover zones.
Table 1.
LULC classifications of the Baro River watershed.
2.2. Data Type and Collection
The reliability of hydro-geospatial modeling for the assessment of groundwater potential zones (GWPZ) in data-scarce areas such as the Baro watershed necessitates the integration of high resolutions and several sources of remote sensing products [48,49]. The study watershed’s (23,000 km2) topography, pedologic, spectral, and climatic variations were recorded using a multisensory inventory. To improve computational accuracy and consistency, all layers were projected using EPSG: 32637-WGS84/UTM ZONE 37 and harmonized at 30 m resolution.
2.2.1. Topographic Data
Topography is an important element of the hydrological cycle, and it regulates the flow between the rapid runoff and infiltration processes. The terrain data were high-resolution (30 m) data that were provided by the OpenTopography webpage. The GRASS algorithm (r.fill.dir) was used to preprocess the raw Digital Elevation Model (DEM) data in QGIS by removing false spikes and filling sinks to ensure a hydrologically reasonable surface [50].
A projected 30 m DEM was used to extract several GWPZ factors, including:
Slope gradient (β): The velocity of surface runoff is directly related to slope. Lower slopes will enable the water to remain on the surface for longer periods of time, an aspect that will promote the process of infiltration [51].
Topographic Wetness Index (TWI): After sinks were filled and the DEM’s flow directions were determined, the Topographic Wetness Index was computed to determine the local topography-based locations where water prefers to accumulate (Equation (2)).
where α is the local upslope contributing area /contour length, and β is the slope angle.
Curvature: Flow across the surface is accelerated and decelerated using the r.slope.aspect GRASS module from the DEM curvature calculation.
Lineament density (Ld): The lineament density, which represents structural weakness (fractures/faults) used for principal conduits for groundwater transport, was successfully calculated using line density from the GRASS module [52]. Computed using Equation (3) below:
where is the total length of identified lineaments (cumulative sum of length of all mapped).
2.2.2. Lithology and Land Use/Land Cover Data
To determine the Groundwater Protection Zone (GWPZ) for the study area, surface properties, including land use and land cover (LULC), were integrated with subsurface geological properties through modeling. This integration utilized vector-based geographical data alongside high-resolution land cover images. The combination of high-resolution land cover imagery and vector-based geological data enabled the modeling of both subsurface and surface properties in the research area, which were essential for defining the GWPZ.
Geology: Structural and lithological information from Ethiopia-Geoportal was utilized to assess the hydrogeological potential of the watershed. This assessment involved defining primary permeability and aquifer storage capacity, thereby characterizing the region’s water resource potential effectively [6].
LULC: The land use and land cover data from existing remote sensing-derived products-ESRI Sentinel-2 were publicly available to provide data on the land use and land cover, which affects the surface hydraulic roughness and the tendency to evapotranspiration [46]. The study used the LULC data as an input for one of the nine thematic groundwater conditioning factors for groundwater potential zoning; reclassification was made by QGIS after downloading the data from the sources.
2.2.3. Soil and Climate Data
The recharge input of the system was determined based on the distribution of rainfall across the region by CHIRPS (https://www.chc.ucsb.edu/data/chirps (accessed on 15 January 2026)) and the physical properties of the soil by FAO.
Soil: FAO had a shapefile containing soil data. Soil texture and drainage class parameters were used to calculate the surface interface’s infiltration capacity (https://www.fao.org/soils-portal (accessed on 15 January 2026)).
Rainfall is the primary source of groundwater recharge, as determined by Climate Hazards Group Infrared Precipitation with Station data (CHIRPS). The mean annual rainfall was computed using data from 12 gridded meteorological stations (Gambella, Bure, Uka, Yibdo, Dembidolo, Mettu, Shebel, Guliso, Simbo, etc.) in the delineated study area. Inverse Distance Weighting (IDW) interpolation techniques were used to compute aerial precipitation [47].
To account for the impact of evapotranspiration, the precipitation input from the macroclimatic model was combined with the characteristics of land use/land cover in data-scarce areas, using Multi-Criteria Decision Analysis (MCDA) [53,54]. High-resolution surface hydraulic properties and localized transpiration demands from the LULC layer from ESRI Sentinel-2. High-density vegetation and wetlands have high actual evapotranspiration (AET) and reduce water infiltration to deep aquifers [55]. When the weightage of the land use land cover parameter with high evapotranspiration is reduced, the model achieves a significant balance between gross precipitation input and atmospheric loss to the system [53,54]. The data type, sources and characteristics of datasets used in this study are summarized in Table 2.
Table 2.
Summarized data type and sources.
2.3. Geospatial Resources Analysis Support System (GRASS) GIS
The hydro-geospatial modeling in the Baro River watershed has been performed by the GRASS GIS 8.x (Geospatial Resources Analysis Support System) environment. It can be used with more flexibility than traditional GIS applications with GUIs, such as ArcGIS 10.7 [50], due to its open-source modular structure, high accuracy of the raster engine even for very large watershed discretization, and good ability to process topological data structures.
Groundwater potential zones need to be modeled to achieve proper hydrological characterization of the study area, which involves applying proper processing lines or techniques to convert basic topography data into important hydrological factors or predictors [5,17,24]. The workflow started with using the r.fill.dir GRASS module to remove the sinks in order to create a hydrologically consistent surface. The groundwater recharge zones were then identified (or located) to calculate the flow accumulations and drainage networks using the r.watershed module. Additionally, the r.slope.aspect module in GRASS was used to govern surface residence time (a gentle slope offers vertical percolation), where the local evapotranspiration and soil moisture retention are influenced by aspects, in order to comprehend the infiltration potential of the study area’s slope gradient (β). Using a combination of these output results, in particular the upslope contributing area (α) of r.watershed and slope gradient of r.slope.aspect, one can compute the Topographic Wetness Index (TWI) in order to map or define the spatial distributions of potential zones and groundwater vulnerability throughout the study area watershed [49,50,56].
2.4. Multiple Criteria Decision Analysis (MCDA)
This interaction among climate, geology, topography, soil, and LULC governs the complexity of groundwater occurrence in the study area and needs multiple decision-making frameworks. The Analytical Hierarchy Process (AHP) was used to weigh and incorporate several environmental factors into a single potential map.
2.4.1. Development of Factor Architecture
Based on the impact of recharge, storage, and transitions, this study identified nine environmental primary variable elements that were identified from Ethiopian highlands literature (usually utilizing 6 to 7 factors only) [1,2,9,11,14,15,40,57]. Each of these was considered as a theme rating (1–5) from very low to very high potential by the authors of QGIS (GRASS). The following features were used: rainfall (orographic effects) [22,58], lithology (geology) (defines aquifer storage capacity and hydraulic conductivity) [32,58], lineament density (structural conduits, fractures, and faults) [57,59], slope (control infiltration to runoff ratio) [7], drainage density (inverse indicator of permeability) [2], soil texture (infiltration rate and soil atmosphere interface) [15], Topographic Wetness Index (TWI—quantifies topographic controls) [38], curvature (decelerate flow and concentrate flows) were used. Although water retention capacity was not treated as a separate groundwater conditioning factor, it is implicitly represented through the integrated effects of slope, geology, land use/land cover, drainage density, and topographic characteristics used in the GIS-AHP framework [8,60].
Analytic Hierarchy Process (AHP) was chosen for the study due to its systematic approach in integrating various thematic parameters with distinct physical characteristics [28,61]. This method is commonly employed in groundwater potential mapping, facilitating the inclusion of expert insights via pairwise comparisons. The Consistency Ratio (CR) promotes objective consistency, enhancing the accuracy of factor weighting and comparisons. A CR of 0.067 confirms that subjective judgment in pairwise comparisons is minimized.
2.4.2. Analytic Hierarchy Process (AHP) and Consistency Verification
The AHP approach, developed by [28,61], was used to assign the relative weight of these nine criteria by using the Pairwise Comparison Matrix (A). Each component was compared with each other, and the comparison was made on a scale of 1 to 9, in which 1 is equal importance, and 9 is extreme importance [28]. To ascertain the impact of the nine environmental elements, four condensed steps of the AHP approach were used.
Because of the variation among individual geological formations, the technique used in the study is a cross-section between lineament density layers (used as one of the groundwater conditioning factors to represent structural discontinuities) and lithology layers as opposed to assuming each formation was homogeneous. In fractured zones, for instance, another volcanic (Tertiary) layer was given a rank of 4 due to its secondary porosity and infiltration rate characteristics, whereas in an un-fractured zone it was given a lower rank. This method suggests that it is capable of representing localized structural deformations and has a strong representation of aquifers.
Step 1: Pairwise Comparison Matrix (A): The reciprocal matrix is compared to scales developed by [28] and can be calculated using Equation (4) (Table 3) below.
Table 3.
Pairwise Comparison Matrix.
LULC had a lower weight in the analysis, although it impacts recharge via infiltration and evapotranspiration. However, its regional influence is deemed less significant compared to factors such as rainfall, geology, lineament density, and slope gradient, as supported by AHP weights from expert comparisons and prior studies.
Step 2: Normalization and weight computation (W): The matrix was normalized by dividing each cell by the total of the columns, and the relative weights (Wi) were obtained by averaging the rows of the normalized matrix (Equation (5)) (Table 4).
Table 4.
Normalized matrix, weights, and consistency analysis.
Step 3: Consistency verification (CR): To assess the judging reliability, the Consistency Ratio (CR) was computed. A valid model is shown by CR < 0.10 (Table 4) (Equation (6)).
where .
2.4.3. Statistical Sensitivity Analysis Framework (SSAF)
The study explored hydro-spatial modeling and assessed the impact of groundwater conditioning factors on a final groundwater index through single-parameter map removal sensitivity analysis. The variation index (Si) [62] for each parameter was calculated using Equation (7), focusing on the output map’s changes with the removal of specific thematic layers from the MCDA.
where Si is the variation index (%) resulting from the removal of thematic layer i, GWPZ is the groundwater potential index obtained from N = 9 parameters, and GWPZ’ is the updated groundwater potential index obtained from N = 8 parameters.
2.5. Overlay Analysis and Raster Algebra
Using raster calculators in the GRASS GIS module (r.mapcal), which enable sophisticated, pixel-based map algebra, the GWPZ was synthesized via Weighted Linear Combinations (WLC) (Equation (8)) as the final approach to modeling the hydro-geospatial characteristics of the research area. Because it is effective at preserving the statistical subtleties of the AHP weights throughout the whole study area and capable of performing floating-point operations with high accuracy, this module is preferable to basic overlay tools [28,61].
where GWPZ is the final groundwater potential index for each cell, Wi is the relative weight of factor i, and Ri is the reclassified rating of factor i.
3. Results and Discussion
The results of hydro-geospatial modeling provide a thorough spatial synthesis of the nine environmental parameters influencing groundwater potential and occurrence in the Baro River watershed research area. The detailed reclassified thematic layers and their subsequent integrations with the final Groundwater Prospect Zone (GWPZ) map will be shown in this part.
3.1. Thematic Factors Reclassifications and Analysis
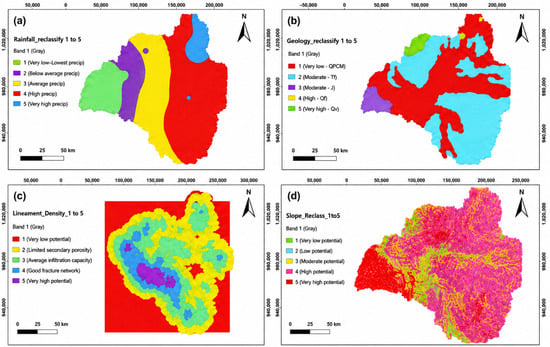
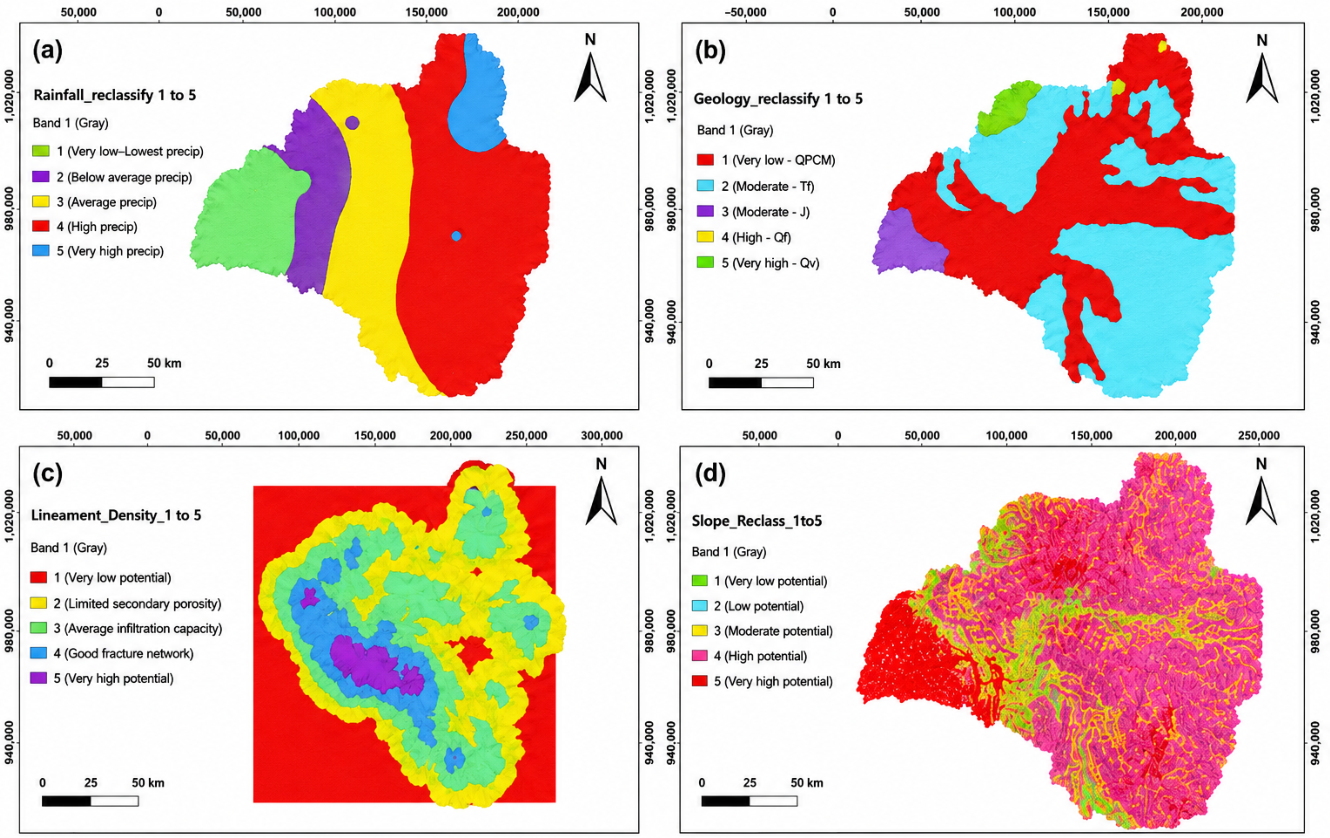
With scientific insights from various prior findings [2,3,11,25], this section presents the chosen analysis of the nine parameters with rank, area proportions, geographic zoning, and detailed descriptions (Figure 3 and Figure 4 and Table 5. These parameters are integrated by the GRASS GIS environment.
Figure 3.
Methodological framework of hydro-spatial modeling of GWPZ: Data acquisition, including DEM from OpenTopography, LULC from Sentinel-2, CHIRPS rainfall, and geology/lithology, is outlined. Preprocessing and final mapping utilized GRASS modules (e.g., r.slope.aspect, r.fill.dir). Thematic weight derivation is conducted using AHP, followed by WLC overlay. Mapping validations used single-parameter sensitivity, hydrogeological literature, and SWAT+ base flow dynamics, all represented in the flow chart.
Figure 4.
Reclassification and spatial distribution of the main factors: (a) precipitation, (b) geology/lithology, (c) lineament density, and (d) slope (surface).
Table 5.
Single-parameter map removal sensitivity analysis summary.
Rainfall: Rainfall is a key input for regional hydrology and the main source of groundwater recharge [1,2,14,21,32,45] in the Baro River watershed. The Southeast region has substantial moisture availability, as shown by the mean annual precipitation of the area with notable orographic effects from Figure 3 and Appendix A Table A1. This maximum moisture availability of zoning for deep percolations, which makes up 6.05% of the entire watershed area, was rated at 5 (extremely high). On the other hand, due to high-potential evapotranspiration and restricted infiltration, which account for 13.29% of the total area, the western lowlands of the watershed have the lowest precipitation available, represented by a rank of 1. Rainfall is designated as the primary function for recharging in the AHP model, and its weight is 0.31 (Table 3). This result showed that rainfall plays a significant role in deep percolations, which is consistent with regional water balance analysis by [21], geochemical and isotope validation by [1] and recent findings by [44] for hydrological extremes in the Baro-Akobo basins and other basins in Ethiopia, such as Upper Blue Nile (Chemoga watershed) for GWPZ delineation by [2] and drought-prone area analysis by [32].
Vertical recharge from local precipitation is limited by plains in the western part of Gambella [1]. The very high groundwater potential in this low-lying area persists despite the high-potential evapotranspiration. The variations are due to the difference in storage capacity of the quaternary alluvial deposits and the hydrologically active area of high primary porosity in the east and the fractured highland escarpments as a source of groundwater flow regions [1]. Then, the geometry of the basin and the underground geological properties are important modulating factors that protect the aquifer from localized losses by evaporation from the atmosphere [19].
Geology (Lithology): The geological architecture defines the subsurface environment’s principal permeability and aquifer storage capacity [13]. Precambrian basement rocks, Tertiary volcanic rocks, and quaternary alluvial deposits (found in river valleys, covering 2.97% of the watershed and ranked as 5 due to their highest permeability and storage capacity due to their unconsolidated nature) make up the complex lithology of the Baro River watershed, which is mapped from Figure 4b and Table A1 (Appendix A). Due to exceptional secondary porosity resulting from fracture networks, 49.82% of the lithology covered by weathered volcanic found in eastern plateaus was graded as 4. Due to their non-porous nature and function as a regional aquitard [19], the remaining 45.2% of the area was made up of enormous bedrocks that were primarily found in eastern highlands and were ranked 1. These results were compared with those of other studies conducted in the Baro River watershed and other river basins in Ethiopia, such as the hydrogeological characterization of the Baro River basins by [1] which revealed that quaternary alluvium is the most prominent unit; other researchers discovered that weathered volcanic and alluvial deposits in the Upper Omo Gibe basins by [11] were prioritized for GWP; and, in the Chemoga River, water lithology is the second significant factor in geospatial and AHP modeling by [2]. Lithology holds 0.25 model weights (Table 4).
Lineament density (Ld): In hard-rock settings, lineaments, structural flaws like faults and fractures, act as the main channels for groundwater movement. The top level, ranked by 5 (tectonic faults with 2.85% of the watershed), offered considerable secondary porosity [22], as shown by the geographical distributions of the lineament density shown in Figure 4c and the characterization of Ld in Table A1 (Appendix A). In total, 7.68% of the watershed has fracture networks that enhance permeability and high-density zones at the highland borders [24,39], which are graded as 4. Compact strata with minimal structural porosity, especially in the western plains (41.72%), were classed as low density [4]. Lineament density has a model weight of 0.16 (Table 4).
Slope: One important factor that establishes the limits between surface runoff and vertical infiltration is slope gradient. The large hypsometric gradient in the research region is seen in Table A1 (Appendix A) below. The Gambella plains, which made up 30.22% of the basins, had a 0–2% slope and a level topography. Because it maximizes the water residence period and promotes deep percolations to saturated zones, this location received a score of 5 (very high). With a rating of 4 (high) and moderate slopes (2–8%), 43.73% of the higher pediments are covered by high infiltration with minimal erosion danger. In the eastern escarpments, more than 35% of the slope, which is categorized as steep slopes and classed as 1, produces fast surface runoff that stops infiltration into subseries. Table 4 shows the weighted topographic slope of 0.11.
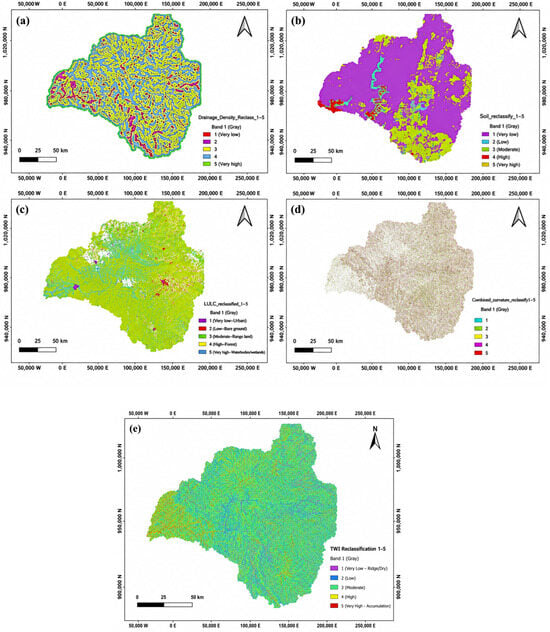
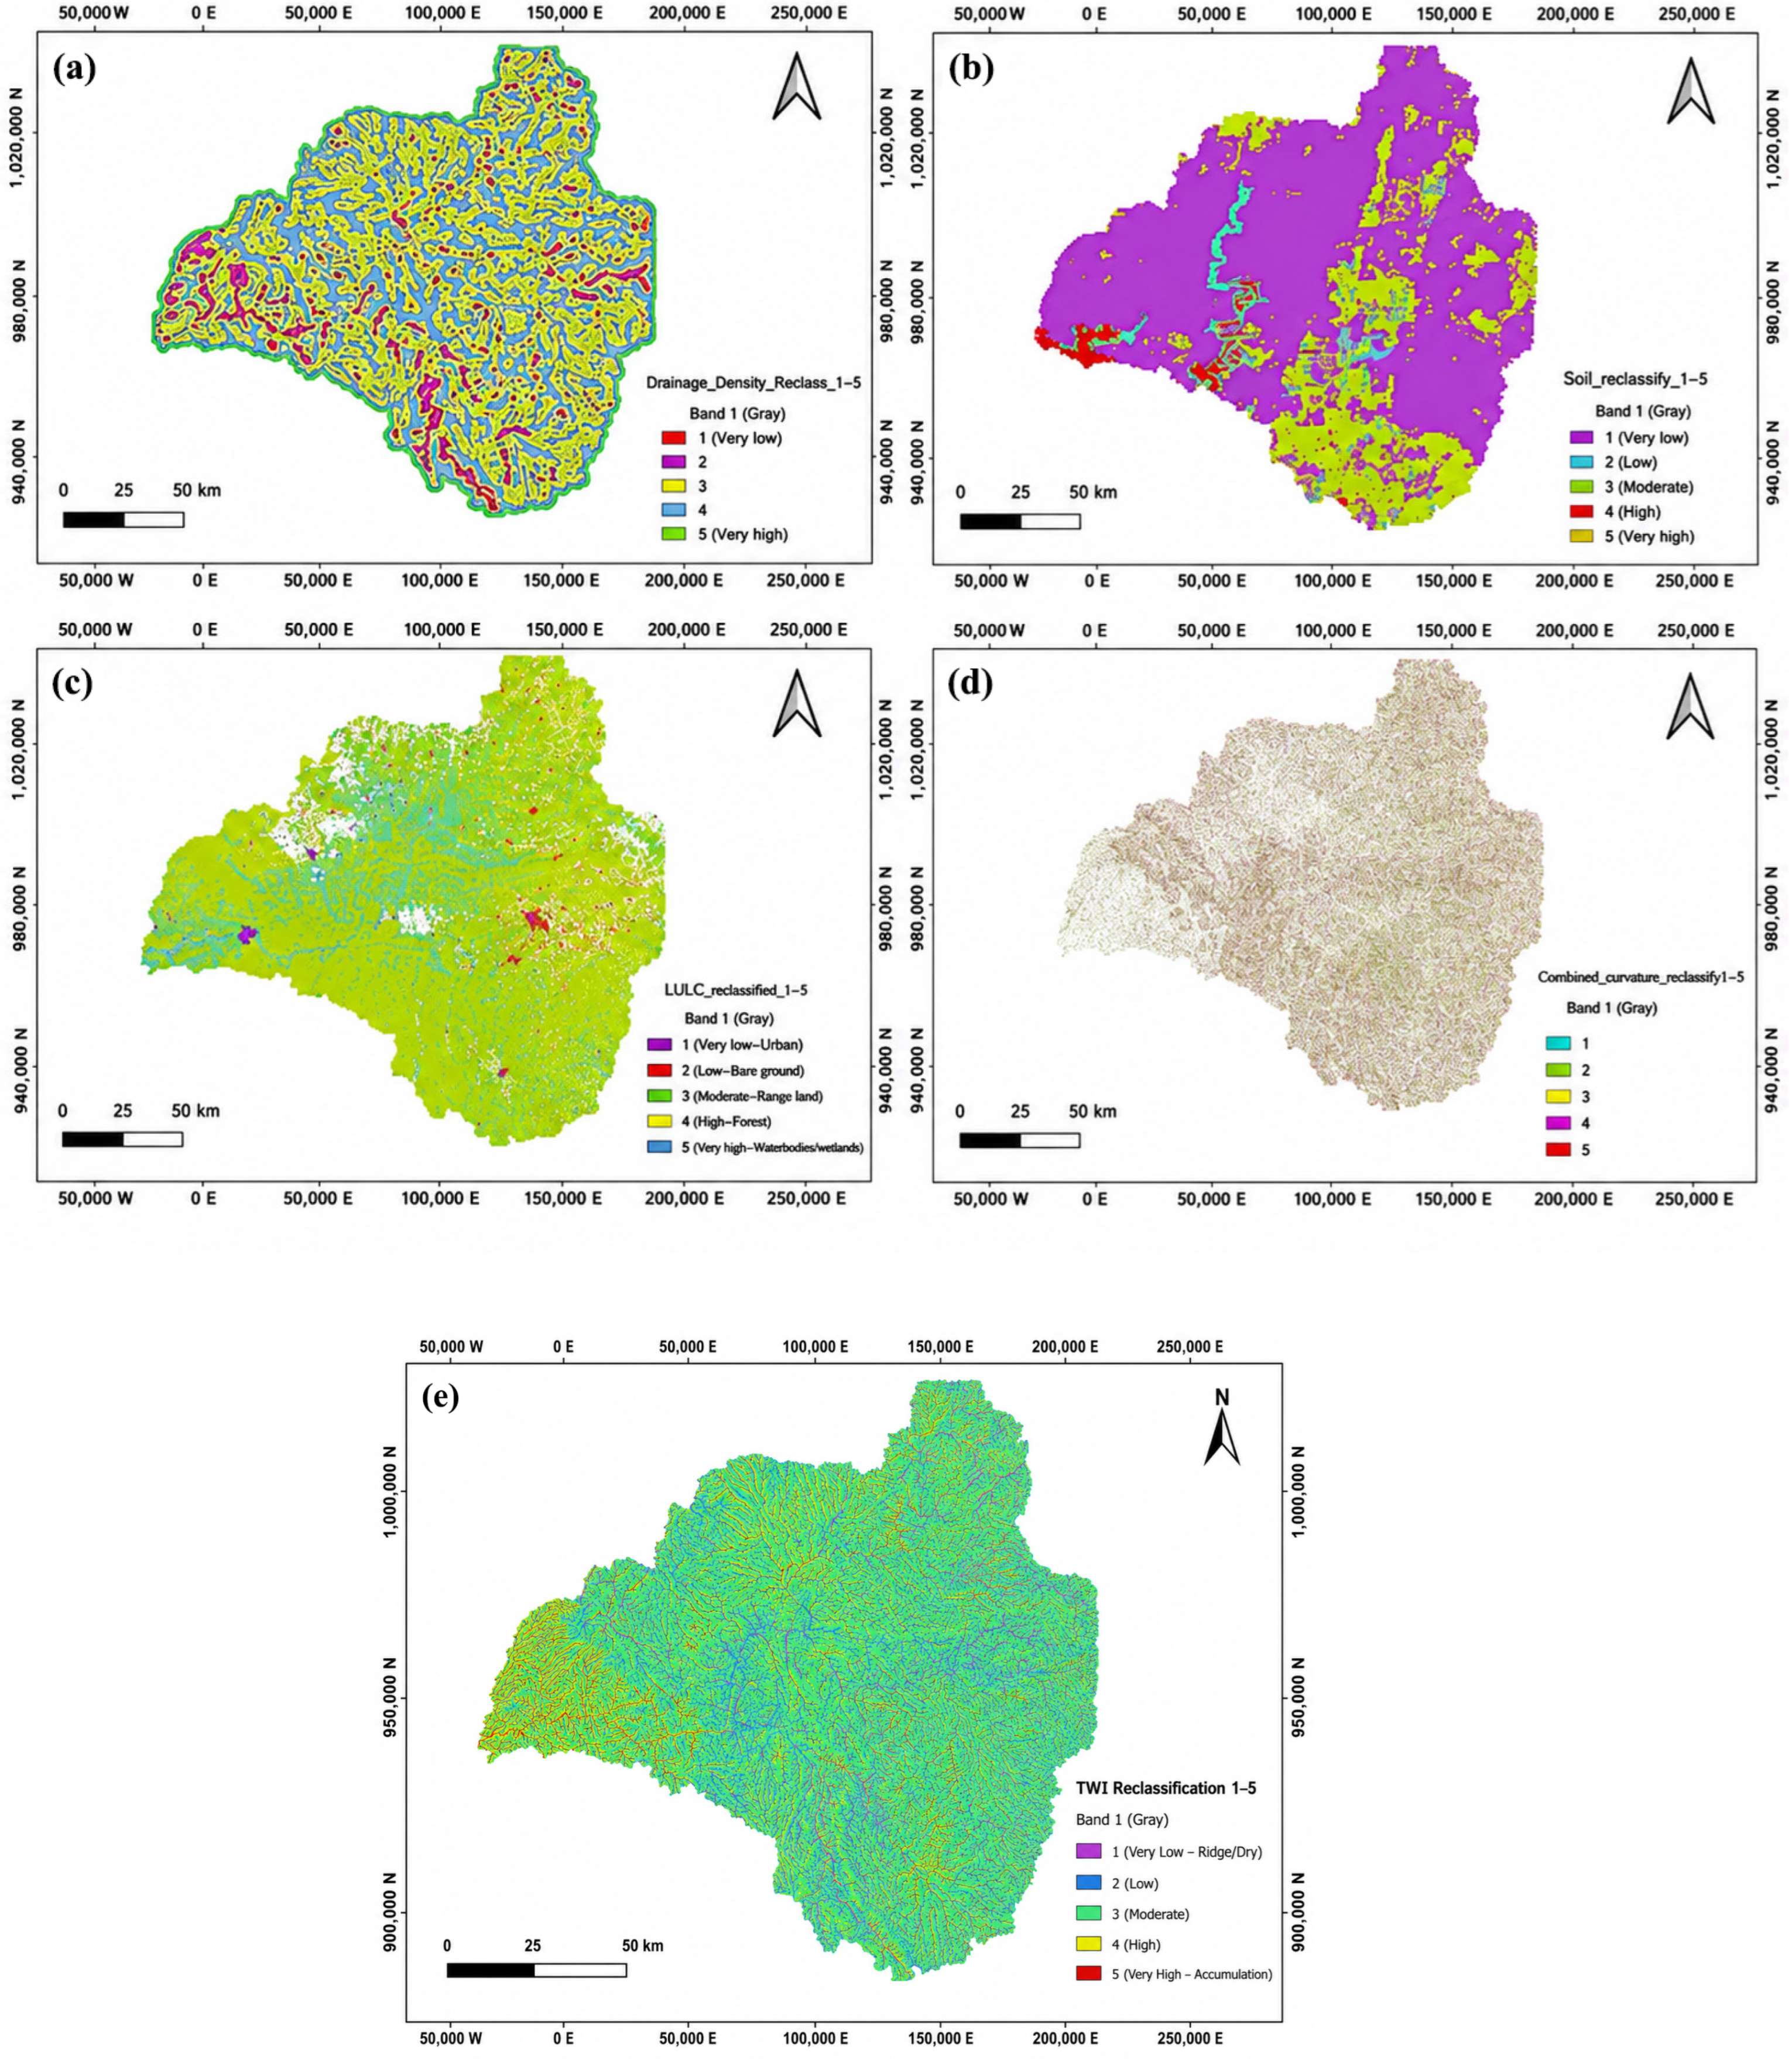
Drainage density (Dd): Drainage density is an inverse measure of permeability; a well-developed stream network efficiently removes water as runoff from a high-density area [1,22]. The research area’s dissected highlands have a very high drainage density (ranked 1), which replicates the zone of impermeable surfaces that quickly drain water away, as seen in Figure 5 and noted in Table A1 (Appendix A) below. On the other hand, 4.74% of the research area is situated in western lowlands with spatially low drainage density (ranked 5), making it more water-absorbing than sheds. In total, 51.66% of the research area’s internal watershed is covered by the most extensive areas with moderate drainage density [13,63]. The hydrological efficiency of watersheds is determined by these parameters, which have model weights of 0.08.
Figure 5.
Reclassified raster data layers showing (a) drainage density (b) soil (c) land use/land cover (LULC) (d) curvature and (e) topographic parameters (TWI).
Soil and LULC: Soil texture and land use and land cover (LULC) serve as essential surface regulators for groundwater recharge by regulating infiltration rates and hydraulic roughness throughout the research region. From below, Figure 5b and Table A1 (Appendix A) show that the lowland regions are mostly covered by 30.20% of the area of sandy and alluvial soils (ranked 5), which permit strong hydraulic conductivity, while ranked 4 (sandy loams) facilitate vertical seepage throughout 43.8% of the pediments. On the other hand, thick clays (ranked 1) at highland peaks prevent infiltration and cause excessive surface runoff. The majority of the land covered by forest and woodland (72.73% of the area, ranked 4) uses root systems to encourage deep percolation, while 1.43% of the land covered by urban areas (ranked 1) forms impermeable surfaces that completely prevent recharge. LULC patterns interact with soil qualities [22,39].
TWI and Curvature: Surface curvature and the Topographic Wetness Index (TWI) enhance the identification of water accumulation zones and flow dynamics. The TWI rank 5, covering 15% of western floodplains, indicates high saturation potential and moisture retention. Figure 5e shows valley bottoms rated 4 and concave depressions rated 5, serving as key points for surface water convergence and recharge. These features indicate significant groundwater prospects through the integration of favorable vegetative cover, soil texture, and concave topography in floodplains and lower pediments.
3.2. Groundwater Potential Zoning (GWPZ)
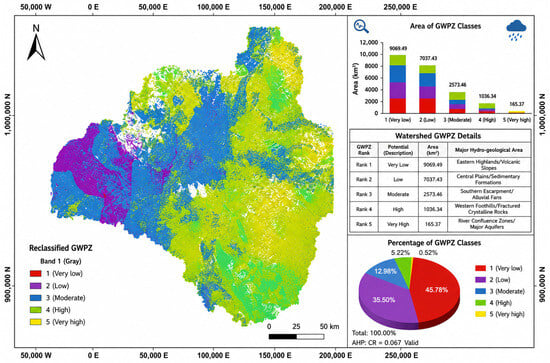
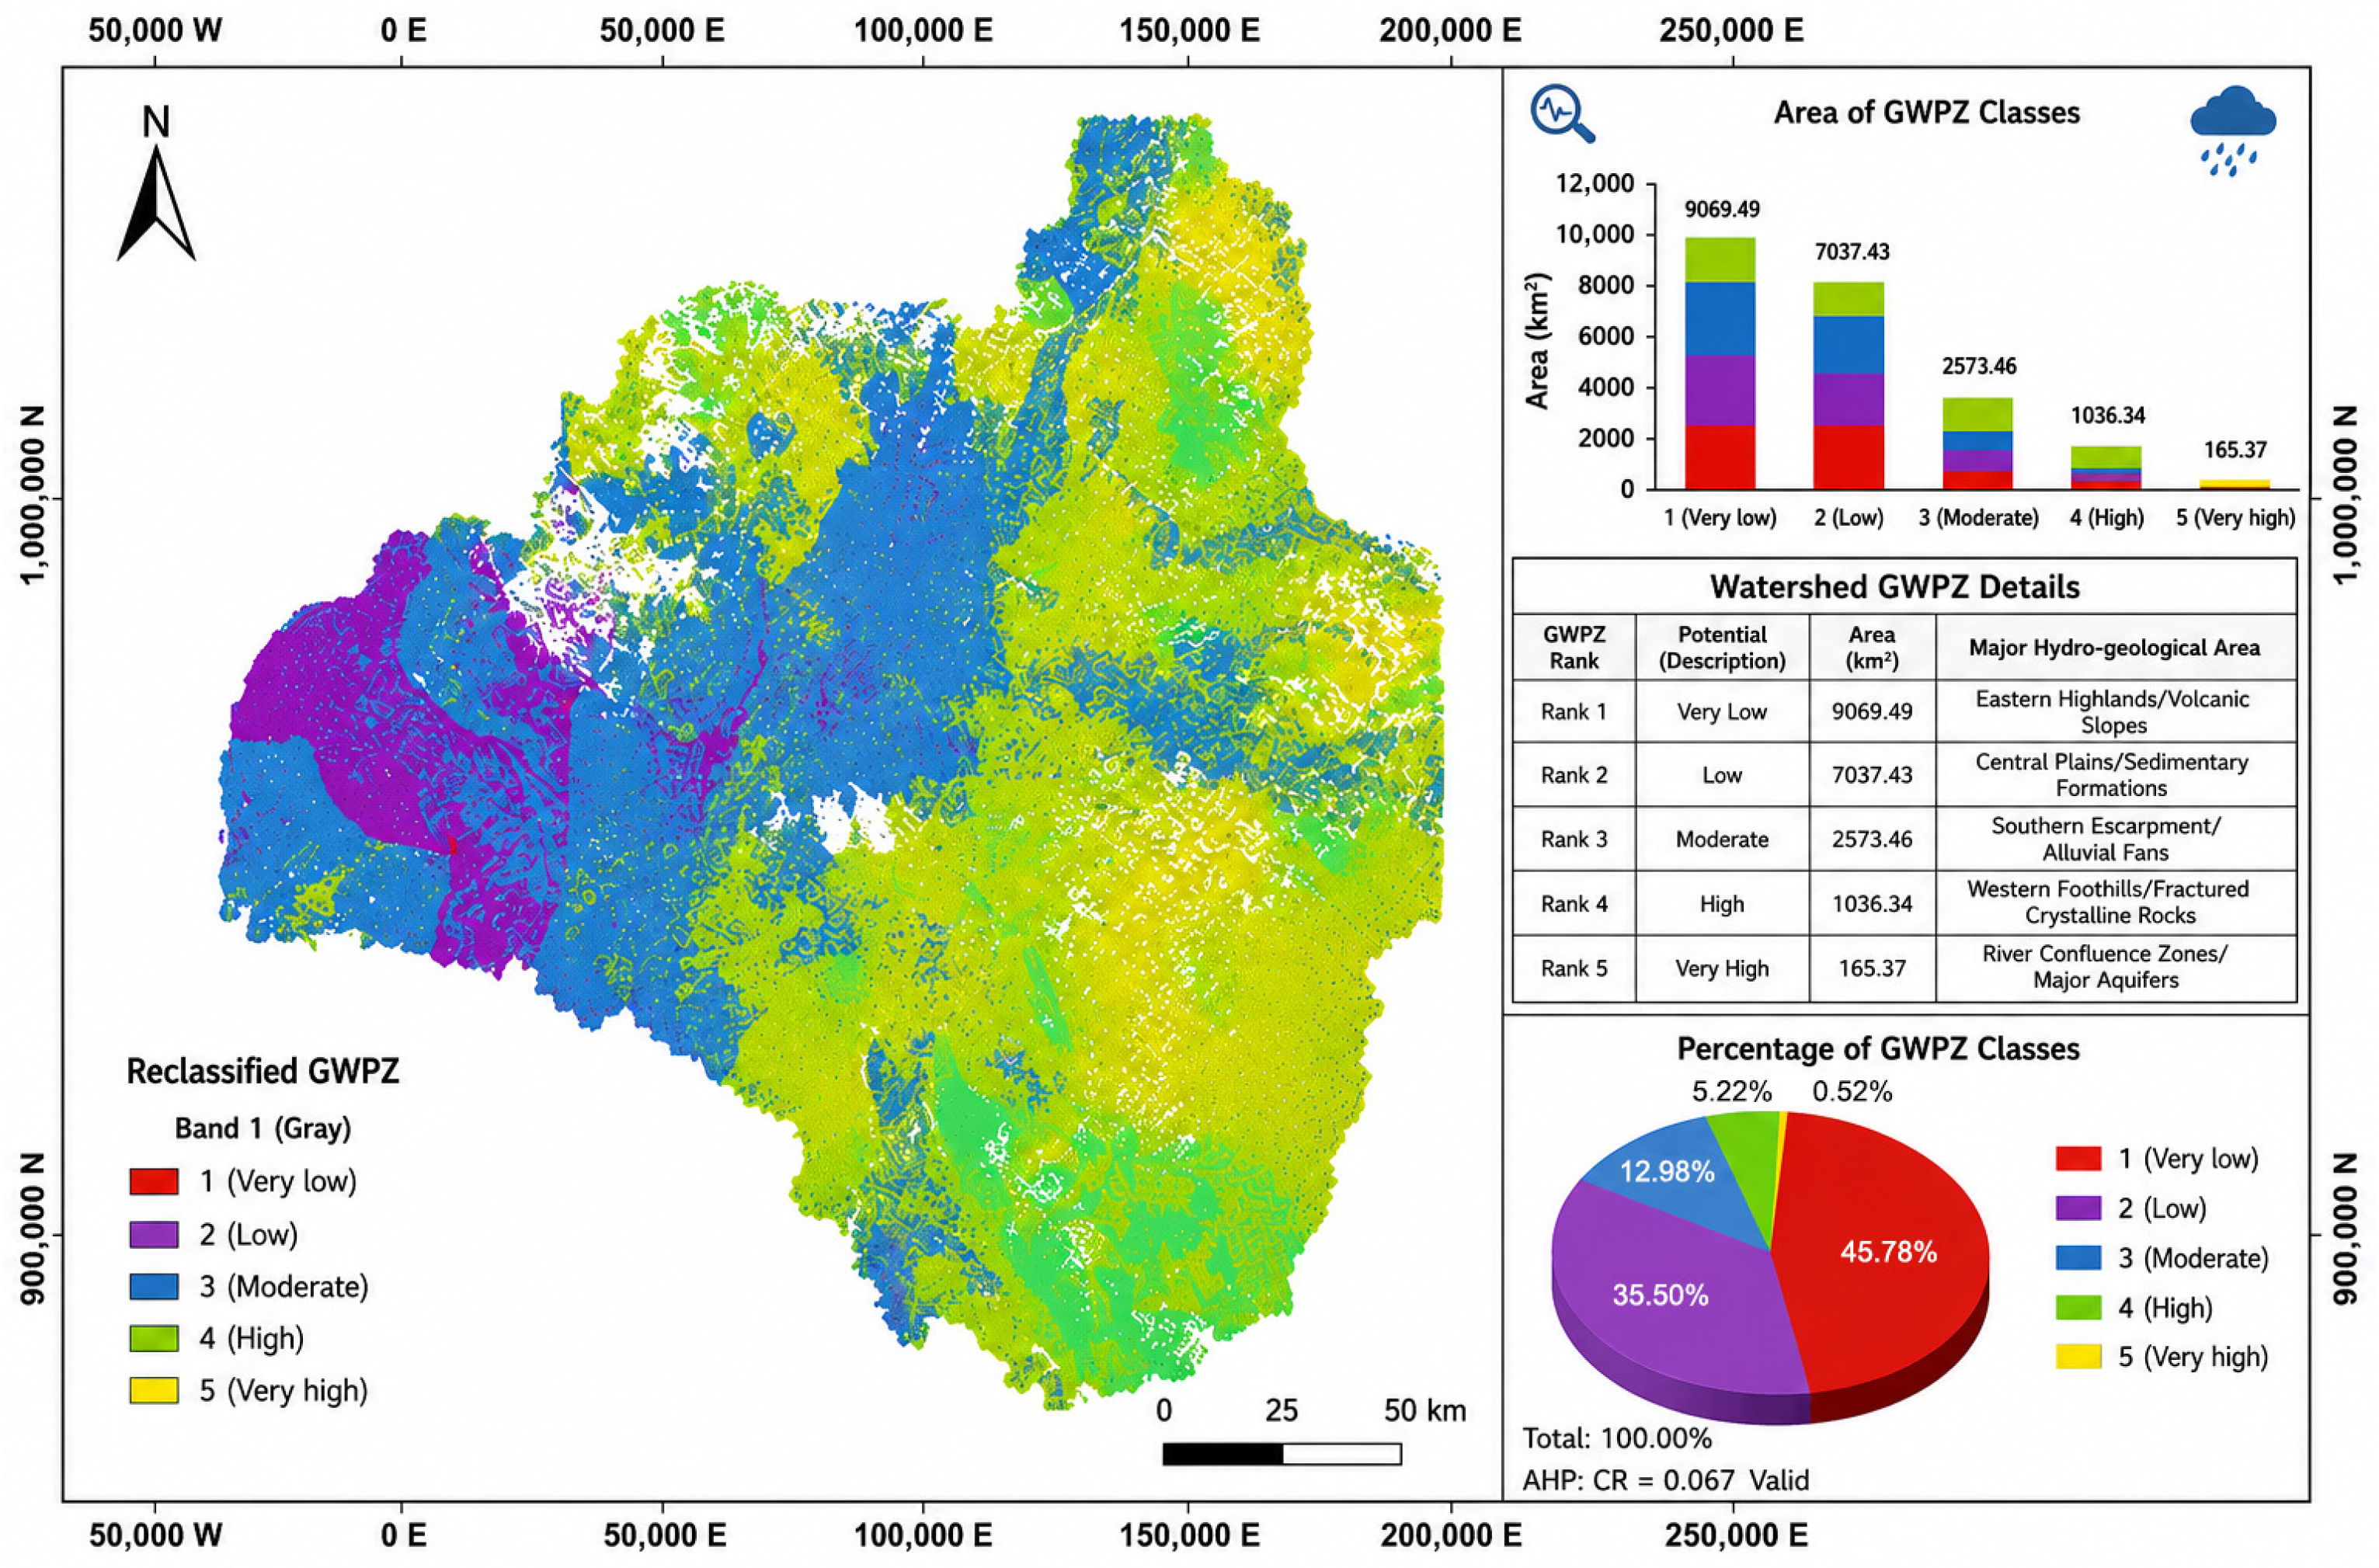
In complicated African catchments, the integration of WLC with GRASS GIS has demonstrated strong consistency with modern multi-criteria GWPZ mapping frameworks in delineating regional groundwater potential zones [64]. The final GWPZ map was produced by the Weighted Linear Combination (WLC) module using pixel-based raster algebra (r.mapcal). The r.mapcal GRASS module was employed to ensure precise performance operations [50,64]. Figure 6 below shows the groundwater potential distribution of the Baro River watershed. The classification was done by their capacity to replenish aquifers and generate sustainable yields through a combination of hydrological, climatic, lithological, and geomorphological factors.
Figure 6.
Spatial distribution of groundwater potential zones in the Baro River watershed: final groundwater potential map classified into five categories, with varying percentage shares across a 23,000 km2 area. The map indicates moderate to high storage in the lowlands and structural recharge in the eastern volcanic highlands.
Very high potential (Zone 5): These are mostly found in the northern Gambella lowlands, which have a flat slope to maximize residence time for deep percolations. They are distinguished by a large region of quaternary alluvial sediments that give high primary porosity [65].
High potential (Zone 4): Expansive regions, which are primarily found in the Eastern and Southern volcanic highlands, are areas of secondary porosity created by cracks and joints. The systems are more susceptible to seasonal rainfall variability than lowland alluvial aquifers because of the presence of broken networks in geometry, which result in minimal storage even when maximum rainfall occurs.
Moderate potential (Zone 3): The center and eastern parts of the watershed are referred to as transition areas and fall into moderate potential (Zone 3); there is a balance between highland runoff and lowland deposition. The strong lineament-driven recharge from the volcanic highlands makes this area less porous than that of the Gambella plains, which has a consistent and moderate inflow yield [22].
Low to very low potential (Zones 1 and 2): The western and northwest portions of the research area comprise large Precambrian basement rocks, with low to very low potential (Zones 1 and 2). In contrast, with the high slope and limited permeability, most of the annual rainfall in this area will lead to rapid surface runoff instead of aquifer recharge, as would occur in the permeable alluvial lowlands.
This study enhances groundwater potential mapping in the Ethiopian Rift and Nile basins by identifying dual recharge-storage dynamics at a large watershed. While prior research mainly focused on lowland alluvial storage, this analysis recognizes nine factors that control high-potential recharge zones in fractured volcanic escarpments of the eastern highlands. This robust scientific foundation supports targeted water resource management by distinguishing between precipitation-driven highland recharge and sediment-hosted lowland storage. The hydrogeological profile analysis and groundwater distribution (Figure 6) show that over 90% of the examined region has moderate to high groundwater potential. The region’s primary potential zone was made up of broken volcanic hills and alluvial sediment plains. The result will offer a solid hydro-geospatial foundation for water resource management in the basin and other data basins. This study advances large-watershed groundwater potential zone (GWPZ) mapping by incorporating additional environmental factors and leveraging cutting-edge GIS tools, including GRASS modules within QGIS 3.40.15. It newly identifies high-potential fractured volcanoes in the southeastern region, building on [66]. Previous research accurately delineated high-yield zones in smaller western alluvial plains, attributing this to their flat topography and sediment deposits [67].
Overall, the GWPZ shows moderate to extremely high stability for 90% of the watershed. Geology-derived sustainable extractability and precipitation-derived recharge potential should be separated. Actual extraction amounts are determined by the storage capacity, which is dependent on local variations in aquifer characteristics, seasonal rainfall differences, and subsoil storage capacity. The study identifies two contrasting geographical areas, namely the Eastern Volcanic Highlands and the Gambella low-lying plains, both of which have maximum rainfall, but the Eastern Volcanic Highlands has lower sustainability potential with higher slopes and rapid drainage, while the Gambella low-lying plains have high sustainability potential with unconsolidated quaternary alluvial sediments with high porosity, thickness, and high storage capacity [3,11].
From a hydrological perspective, the lowland area of the Gambella plain serves as the sink storage and terminal discharge for the Baro River watershed. Significant groundwater recharge occurs due to high precipitation from the eastern volcanic highlands, facilitating westward subsurface flow and storage within porous quaternary layers. This indicates that the high GWPZ lowlands, along with the considerable surface water volume of the Baro-Akobo-Sobat River, result from watershed-wide subsurface storage rather than merely localized precipitation. The observed spatial variation in groundwater potential indicates that features like gentle slopes, alluvial deposits, wetlands, and low drainage density enhance water storage and infiltration [68]. Conversely, impermeable formations and steep terrain lead to rapid runoff and decreased groundwater retention [3].
3.3. Validation Framework and Sensitivity Analysis
To evaluate model reliability in the Baro River watershed, a multi-trial methodology was utilized due to limited water table depth and well yield datasets. This approach involved statistical sensitivity testing, a review of regional hydrogeological literature, and hydrological simulation with SWAT+. This approach ensures resilience and application, especially when data is limited, as is the case in Ethiopia [22].
3.3.1. Single-Parameter Sensitivity Analysis
According to the single-parameter map removal test shown in Table 5, the groundwater potential index is most sensitive to variations in rainfall (2.41%) and geology/lithology (1.85%). Lineament density (1.22%) and slope (0.94%) follow, while curvature (0.15%) and TWI (0.31%) are less significant. These results indicate that climatic factors and groundwater storage capacity primarily drive the model’s spatial pattern, aligning with physical hydrological expectations.
3.3.2. Regional Hydrogeological Literature Cross-Validation
Studies conducted in the Gidabo watershed (75% moderate–high-potential) [69] and Chemoga watershed [2] are consistent with this study, which found that the Baro River watershed’s high potential zones were driven by nine elements (rainfall, geology, and slope) during AHP mapping. When applied to the Omo Gibe basin, recharge and geology were identified as key factors by the ROC test, which was performed against the transmissivity value obtained from the integrated AHP-WetSpass model [11]. This shows the effectiveness of AHP in the tectono-geomorphic highlands of Ethiopia [11,14,22,57,63,70].
3.3.3. SWAT+ Model Cross-Validation
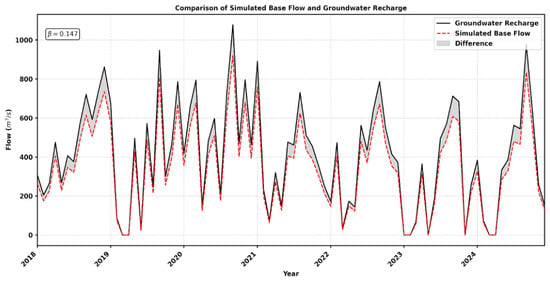
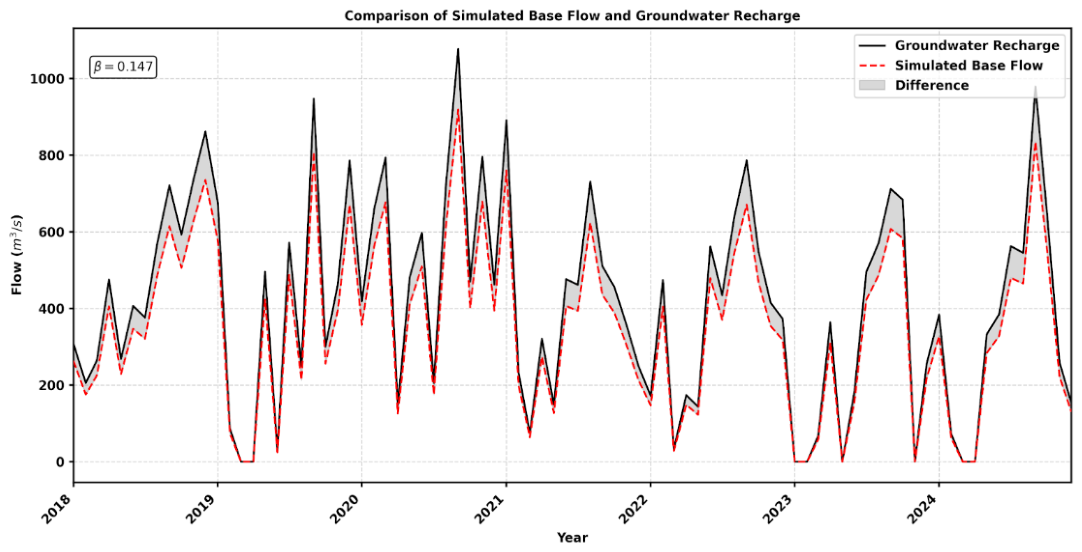
An independent approach using physically based temporal simulation outputs was added to improve the validation program for the SWAT+ model. The analysis in Figure 7 shows that the simulated groundwater recharge is correlated with the base flow and that groundwater recharge peaks determine the amount and timing of base flow. The GWPZ map integration shows that there is an active recharge process in the high-potential zones. Previous results are also confirmed by temporal trends, with high correlation between base flow responses and fluctuations in recharge, suggesting hydrologically active spatial areas [2,3,11,37,43,45]. This is an additional validation method that improves the efficiency and accuracy of the water resources model in the region.
Figure 7.
Groundwater recharge and base flow temporal dynamics.
3.4. Model Limitations and Evapotranspiration Dynamics
Infiltration and groundwater recharge are influenced by evapotranspiration within the catchment water balance [33]. Land use/land cover and TWI serve as implicit proxies for evapotranspiration and soil moisture retention [37]. The study highlights the lack of explicit weighting for potential and actual evapotranspiration in the AHP matrix. Particularly in the Gambella region’s lowlands, high temperatures lead to elevated PET rates, and neglecting AET dynamics may result in overestimated effective recharge. Future iterations of the hydro-geospatial framework should integrate daily satellite-derived AET products to enhance net effective recharge estimation.
The accuracy of AHP-based potential mapping is constrained by the spatial scale and quality of input datasets, including satellite rainfall products and geological maps [30]. In data-poor catchments like the Baro River, small subsurface heterogeneities can lead to localized spatial uncertainty, necessitating careful interpretation when transitioning to site-specific borehole drilling.
3.5. Climate Change Adaptation
Climate variability and shifting precipitation pose serious challenges to sub-Saharan Africa’s water security. In the Baro River watershed, where rain-fed agriculture and seasonal surface water are the main sources of income for the basin’s population, groundwater acts as an essential buffer against climate shocks. To guarantee long-term regional sustainable resilience, groundwater potential mapping is crucial for integrated sustainable development frameworks [71]. To mitigate drought susceptibility, sustain community water supply systems, and avoid an excessive dependence on increasingly unpredictable surface flows, the high and very high-potential zones require careful management.
4. Conclusions and Recommendations
4.1. Conclusions
To design groundwater potential possibilities in the Baro River watershed, a hydro-geospatial technique that included remote sensing, GIS, and Multi-Criteria Decision Analysis (MCDA) via Analytical Hierarchy Process (AHP) was used. Nine environmental parameters were included in this study to effectively represent the complex interplay between climatic, geomorphological, and land surface characteristics that govern groundwater occurrence and movement. Significant groundwater potential is indicated by the moderate to very high groundwater potential suitability grades found in over 90% of the examined region. Because of their level topography and loose alluvial deposits that promote infiltration and groundwater recharge, the Gambella lowlands in the northern parts of the watershed have the most potential. However, the eastern and southern parts of the watershed have substantial groundwater potential, mostly in fractured volcanic strata where groundwater storage is regulated by secondary porosity. Fractured volcanic aquifers exhibit unique storage characteristics, necessitating long-term groundwater monitoring and field investigations. The GIS and AHP integration approach worked well and was appropriate for places with little data. The calculated Consistency Ratio (CR = 0.067), which shows how consistent the weighting scheme and decision-making process are, is less than the permissible threshold value of 0.10. This article has shown that despite the absence of large amounts of field information, GIS-MCDA methods can produce scientifically complete groundwater potential maps. Altogether, this study contributes to the baseline hydrological understanding of the understudied study watershed by providing a systematic, open-source, geospatial workflow that can assist water resources planners in data-limited regions.
4.2. Recommendation
According to the findings of the research, a number of specific recommendations are established to guide sustainable water resources management across Baro River catchments. Resources development must concentrate on regions that are highly viable, such as the Southern volcanic pediments and the Gambella lowlands. The use of conservation methods of water, including contour bunds and check dams, is necessary in improving the availability of groundwater, particularly in areas of high runoff. The model validation requires field verification and geophysical surveys. Basin-scale planning should include the potential of groundwater to help minimize drought vulnerability and encourage the use of surface and groundwater in an integrated manner. Having a centralized GIS database will facilitate continuous assessment and decision-making. Further study is necessary to employ hydro-geochemical and isotopic techniques to better understand how to manage groundwater flow and sustainability, especially in fractured aquifer regions.
Author Contributions
Conceptualization, methodology, software, validation, formal analysis, investigation, resources, data curation, writing—original draft preparation (A.M.F.), writing—review and editing (M.I.), and visualization (A.M.F.), supervision (M.I.). All authors have read and agreed to the published version of the manuscript.
Funding
This research received no external funding.
Institutional Review Board Statement
Not applicable.
Informed Consent Statement
Not applicable.
Data Availability Statement
The data supporting this study are available from the researchers (corresponding author) upon reasonable request or based on the MDPI data availability statement.
Acknowledgments
During the preparation of this manuscripts/study the author(s) used ChatGPT version GPT-4o for the purpose of generating codes to merge graphs. The authors have reviewed and edited the output and take full responsibility for the content of this publication.
Conflicts of Interest
The authors declare no conflicts of interest.
Abbreviations
The following abbreviations are used in this manuscript:
| AET | Actual Evapotranspiration |
| AHP | Analytic Hierarchy Process |
| ANN | Artificial Neural Network |
| GIS | Geographic Information System |
| GRASS | Geospatial Resources Analysis Support System |
| GWPZ | Groundwater Potential Zone |
| IDW | Inverse Distance Weighting |
| MCDA | Multi-Criteria Decision Analysis |
| RS | Remote Sensing |
| SWAT+ | Soil and Water Assessment Tool Plus |
| TWI | Topographic Wetness Index |
| UTM | Universal Transverse Mercator |
| WLC | Weighted Linear Combination |
Appendix A
Table A1.
Selected thematic layers, ranks, area proportion each class with detailed descriptions.
References
- Alemayehu, T.; Kebede, S.; Liu, L.; Kebede, T. Basin hydrogeological characterization using remote sensing, hydrogeochemical and isotope methods (the case of Baro-Akobo, Eastern Nile, Ethiopia). Environ. Earth Sci. 2017, 76, 466. [Google Scholar] [CrossRef] [Scilit]
- Kassa, S.B.; Zimale, F.A.; Mulu, A.; Worku, T.A.; Wossene, M.L.; Minichil, T.; Hailu, Y.B.; Aman, T.F.; Kifelew, M.S.; Mekonnen, H.A. Groundwater Potential Assessment Using Integrated Geospatial and Analytic Hierarchy Process Techniques (AHP) in Chemoga Watershed, Upper Blue Nile Basin, Ethiopia. Air Soil Water Res. 2025, 18, 1–17. [Google Scholar] [CrossRef] [Scilit]
- Rehman, A.; Islam, F.; Tariq, A.; Islam, I.U.; Brian, J.D.; Bibi, T.; Ahmad, W.; Waseem, L.A.; Karuppannan, S.; Al-ahmadi, S. Groundwater potential zone mapping using GIS and Remote Sensing based models for sustainable groundwater management. Geocarto Int. 2024, 39, 26. [Google Scholar] [CrossRef] [Scilit]
- Jasechko, S.; Seybold, H.; Perrone, D.; Fan, Y.; Shamsudduha, M.; Taylor, R.G.; Fallatah, O.; Kirchner, J.W. Rapid groundwater decline and some cases of recovery in aquifers globally. Nature 2024, 625, 715–721. [Google Scholar] [CrossRef] [Scilit] [PubMed]
- Suryawanshi, S.L.; Kumar, P.; Mahesh, S.; Manjeet, K.; Kamal, S.; Yadav, K. Spatial and decision-making approaches for identifying groundwater potential zones: A review. Environ. Earth Sci. 2023, 82, 463. [Google Scholar] [CrossRef] [Scilit]
- Federal Democratic Republic of Ethiopia Ministry of Water and Energy. Terms of Reference for Groundwater Potential Assessment, Detail Reconnaissance Hydrogeological Study, GW Feasibility Study, Contract Administration & Supervision of Drilling of Test Wells in Gewane Adaytu Area Afar Region; Ministry of Water and Energy: Addis Ababa, Ethiopia, 2024.
- Sterckx, A.; Fraser, C.; Pietersen, K.; Diene, M.; Sterckx, A.; Fraser, C.; Pietersen, K.; Diene, M. Institutionalizing groundwater management and transboundary aquifer cooperation in sub- Saharan lake and river basin organizations. Water Int. 2024, 49, 553–562. [Google Scholar] [CrossRef] [Scilit]
- Touré, H.; Boateng, C.D.; Gidigasu, S.S.R.; Wemegah, D.D.; Mensah, V. Groundwater potential mapping of the central region using integrated geological and geophysical methods. Appl. Water Sci. 2026, 16, 29. [Google Scholar] [CrossRef] [Scilit] [PubMed]
- Bulbula, S.T.; Serur, A.B. Groundwater potential and recharge zone mapping using GIS and remote sensing techniques: The Melka Kunture Watershed in Ethiopia. Discov. Sustain. 2024, 5, 328. [Google Scholar] [CrossRef] [Scilit]
- Kpiebaya, P.; Ebo, E.; Amuah, Y.; Shaibu, A.; Baatuuwie, B.N.; Avornyo, V.K.; Wullobayi, B. Journal of Hydrology: Regional Studies Spatial assessment of groundwater potential using Quantum GIS and multi-criteria decision analysis (QGIS-AHP) in the Sawla-Tuna-Kalba district of Ghana. J. Hydrol. Reg. Stud. 2022, 43, 101197. [Google Scholar] [CrossRef] [Scilit]
- Hagos, Y.; Bedaso, Z.; Kebede, M. Delineating Groundwater Potential Zones Using Geospatial and Analytical Hierarchy Process Techniques in the Upper Omo-Gibe Basin, Ethiopia. Rev. Int. Geomat. 2024, 33, 399–425. [Google Scholar] [CrossRef] [Scilit]
- Abraha, T.; Tibebu, A.; Ephrem, G. Rapid Urbanization and the Growing Water Risk Challenges in Ethiopia: The Need for Water Sensitive Thinking. Front. Water 2022, 4, 890229. [Google Scholar] [CrossRef] [Scilit]
- Mengistu, T.D.; Chung, I.M.; Chang, S.W.; Yifru, B.A.; Kim, M.G.; Lee, J.; Ware, H.H.; Kim, I.H. Challenges and prospects of advancing groundwater research in ethiopian aquifers: A review. Sustainability 2021, 13, 11500. [Google Scholar] [CrossRef] [Scilit]
- Minuyelet, M.; Lmatu, Z.; Kasie, A.; Bogale, S. Groundwater potential zones delineation using GIS and AHP techniques in upper parts of Chemoga watershed, Ethiopia. Appl. Water Sci. 2024, 14, 85. [Google Scholar] [CrossRef] [Scilit]
- Melese, T.; Belay, T. Groundwater Potential Zone Mapping Using Analytical Hierarchy Process and GIS in Muga Watershed, Abay Basin, Ethiopia. Glob. Chall. 2022, 6, 2100068. [Google Scholar] [CrossRef] [Scilit] [PubMed]
- Mengistu, T.D.; Chang, S.W.; Kim, I.; Kim, M.; Chung, I. Determination of Potential Aquifer Recharge Zones Using Geospatial Techniques for Proxy Data of Gilgel Gibe. Water 2022, 14, 1362. [Google Scholar] [CrossRef] [Scilit]
- Khadim, F.K.; Dokou, Z.; Lazin, R.; Bagtzoglou, A.C.; Anagnostou, E. Groundwater Modeling to Assess Climate Change Impacts and Sustainability in the Tana Basin, Upper Blue Nile, Ethiopia. Sustainability 2023, 15, 6284. [Google Scholar] [CrossRef] [Scilit]
- Tafese, E. Groundwater Potential Zone Mapping Using Arc GIS and Analytical Hierarchy Process (AHP) for the case of Lower Omo-Gibe Watershed, Omo-Gibe Basin. Res. Sq. 2022, 1–24. [Google Scholar] [CrossRef] [Scilit] [PubMed]
- Pajock, J.; Gunalan, J.; Jothimani, M.; Abebe, A. Assessment of groundwater potential zones using an integration of Remote Sensing, GIS and 2D Electrical Resistivity imaging in the Echway watershed, Baro River Basin, Southwest Ethiopia. IOP Conf. Ser. Mater. Sci. Eng. 2023, 1282, 012012. [Google Scholar] [CrossRef] [Scilit]
- Arseni, M.; Rosu, A.; Calmuc, M.; Calmuc, V.A.; Iticescu, C.; Georgescu, L.P. Development of flood risk and hazard maps for the lower course of the Siret River, Romania. Sustainability 2020, 12, 6588. [Google Scholar] [CrossRef] [Scilit]
- Getachew, A.; Ayele, T.; Taddele, Y. Heliyon Modeling impacts of projected land use and climate changes on the water balance in the Baro basin, Ethiopia. Heliyon 2023, 9, e13965. [Google Scholar] [CrossRef] [Scilit] [PubMed]
- Mohammed, M.A.A.; Mohammed, S.H.; Szabó, N.P.; Szűcs, P. Geospatial modeling for groundwater potential zoning using a multi–parameter analytical hierarchy process supported by geophysical data. Discov. Appl. Sci. 2024, 6, 121. [Google Scholar] [CrossRef] [Scilit]
- Singh, A.; Kumar, R.; Kumar, R.; Pippal, P.S.; Sharma, P.; Sharma, A. ScienceDirect Delineation of groundwater potential zone using geospatial tools and analytical hierarchy process (AHP) in the state of Uttarakhand, India. Adv. Space Res. 2024, 73, 2939–2954. [Google Scholar] [CrossRef] [Scilit]
- Sreeja, I.S.; Aju, C.D.; Achu, A.L.; Reghunath, R.; Prakash, P.; Raicy, M.C. Geospatial modelling of groundwater potential zones validated with well discharge and electrical resistivity in a tropical catchment. Evol. Earth 2025, 3, 100094. [Google Scholar] [CrossRef] [Scilit]
- Bourjila, A.; Dimane, F.; El, H.; Nouayti, N.; Taher, M.; El, Y.; Saadi, O.; Bensiali, A. Groundwater for Sustainable Development Groundwater potential zones mapping by applying GIS, remote sensing and multi-criteria decision analysis in the Ghiss basin, northern Morocco. Groundw. Sustain. Dev. 2021, 15, 100693. [Google Scholar] [CrossRef] [Scilit]
- Ayadi, Y.; Gentilucci, M.; Ncibi, K.; Hadji, R. Assessment of a Groundwater Potential Zone Using Geospatial Artificial Intelligence (Geo-AI), Remote Sensing (RS), and GIS Tools in Majerda Transboundary Basin (North Africa). Water 2025, 17, 331. [Google Scholar] [CrossRef] [Scilit]
- Tahera-tun-humayra, U.; Islam, R.; Hosen, B.; Kader, Z. Groundwater potential zone mapping using analytical hierarchy process (AHP) and GIS for Narshingdi District, Bangladesh. Environ. Chall. 2025, 21, 101335. [Google Scholar] [CrossRef] [Scilit]
- Saaty, T.L.; Vargas, L.G. Models, Methods, Concepts & Applications of the Analytic Hierarchy Process; International Series in Operations Research & Management Science; Springer Science+Business Media: New York, NY, USA, 2012; Volume 175. [Google Scholar]
- Borz, I. Modeling Groundwater Resources in Data-Scarce Regions for Sustainable Management: Methodologies and Limits. Hydrology 2025, 12, 11. [Google Scholar] [CrossRef] [Scilit]
- Adesola, G.O.; Thamaga, K.H.; Gwavava, O.; Pharoe, B.K. Groundwater Potential Zones Assessment Using Geospatial Models in Semi-Arid Areas of South Africa. Land 2023, 12, 1877. [Google Scholar] [CrossRef] [Scilit]
- Díaz-Alcaide, S.; Martínez-Santos, P. Review: Advances in groundwater potential mapping. Hydrogeol. J. 2019, 27, 2307–2324. [Google Scholar] [CrossRef] [Scilit]
- Abdullahi, A.; Jothimani, M.; Getahun, E.; Gunalan, J.; Abebe, A. The Egyptian Journal of Remote Sensing and Space Sciences Assessment of potential groundwater Zones in the drought-prone Harawa catchment, Somali region, eastern Ethiopia using geospatial and AHP techniques. Egypt. J. Remote Sens. Space Sci. 2023, 26, 628–641. [Google Scholar] [CrossRef] [Scilit]
- Wang, J.; Zhuo, L.; Rico-Ramirez, M.A.; Abdelhalim, A.; Han, D. Interacting Effects of Precipitation and Potential Evapotranspiration Biases on Hydrological Modeling. Water Resour. Res. 2023, 59, e2022WR033323. [Google Scholar] [CrossRef] [Scilit]
- Turkeltaub, T.; Bel, G. Changes in mean evapotranspiration dominate groundwater recharge in semi-arid regions. Hydrol. Earth Syst. Sci. 2024, 28, 4263–4274. [Google Scholar] [CrossRef] [Scilit]
- Van Jaarsveld, B.; Wanders, N.; Otoo, N.G.; Sutanudjaja, E.H.; Verkaik, J.; Zamrsky, D.; Bierkens, M.F.P. Global hyper-resolution groundwater dataset for assessing historical and future groundwater dynamics. EarthArXiv 2026, 1–37. [Google Scholar] [CrossRef] [Scilit]
- Thakur, V.; Markonis, Y.; Kumar, R.; Thomson, J.R.; Vargas Godoy, M.R.; Hanel, M.; Rakovec, O. Unveiling the impact of potential evapotranspiration method selection on trends in hydrological cycle components across Europe. Hydrol. Earth Syst. Sci. 2025, 29, 4395–4416. [Google Scholar] [CrossRef] [Scilit]
- Mensah, J.K.; Ofosu, E.A.; Yidana, S.M.; Akpoti, K.; Kabo-bah, A.T. Integrated modeling of hydrological processes and groundwater recharge based on land use land cover, and climate changes: A systematic review. Environ. Adv. 2022, 8, 100224. [Google Scholar] [CrossRef] [Scilit]
- Song, Q.; Ma, M.; Liu, Y.; Wang, Z.; Wu, W. Identifying groundwater potential zones in a typical irrigation district using the geospatial technique and analytic hierarchy process. Geocarto Int. 2025, 40, 2453025. [Google Scholar] [CrossRef] [Scilit]
- Verner, K.; Šíma, J.; Alemayehu, L.; Buriánek, D.; Dvořák, Š.; Martínek, K.; Jelínek, J.; Vacek, F.; Tadesse, T.; Wolela, A.; et al. A Synopsis of the Regional Geology and Hydrogeology of Ethiopia; Czech Geological Survey: Prague, Czech Republic, 2025. Available online: https://cgs.gov.cz/en/projects/682x00-ethiopia (accessed on 15 January 2026).
- Water, S.S.C.; Water, S.S.C.; Integrated, N.; Resource, W.; Programme, M.; Economy, C.-R.G.; Water, S.S.C. Rapid Groundwater Resource Mapping for IWRM in Ethiopia—2024–2029; Ministry of Foreign Affairs of Denmark: Copenhagen K, Denmark, 2024.
- Jiang, W.; Yu, J.; Wang, Q.; Yue, Q. Understanding the effects of digital elevation model resolution and building treatment for urban flood modelling. J. Hydrol. Reg. Stud. 2022, 42, 101122. [Google Scholar] [CrossRef] [Scilit]
- Ebissa, T.N.; Kassaye, S.M.; Malede, D.A. Hydrological response to climate change in Baro basin, Ethiopia, using representative concentration pathway scenarios. Environ. Syst. Res. 2024, 13, 42. [Google Scholar] [CrossRef] [Scilit]
- Kassaye, S.M.; Tadesse, T.; Tegegne, G.; Tadesse, K.E. The Sensitivity of Meteorological Dynamics to the Variability in Catchment Characteristics. Water 2022, 14, 3776. [Google Scholar] [CrossRef] [Scilit]
- Kassaye, S.M.; Tadesse, T.; Tegegne, G.; Hordofa, A.T. Quantifying the climate change impacts on the magnitude and timing of hydrological extremes in the Baro River Basin, Ethiopia. Environ. Syst. Res. 2024, 13, 2. [Google Scholar] [CrossRef] [Scilit]
- Kassaye, S.M.; Tadesse, T.; Tegegne, G.; Hordofa, A.T. Relative and Combined Impacts of Climate and Land Use/Cover Change for the Streamflow Variability in the Baro River Basin (BRB). Earth 2024, 5, 149–168. [Google Scholar] [CrossRef] [Scilit]
- Google Earth Engine. Sentinel-2 Level-2A Harmonized Dataset. Available online: https://developers.google.com/earth-engine/datasets/catalog/COPERNICUS_S2_SR_HARMONIZED (accessed on 15 January 2026).
- Suharmanto, E.T.; Supriyanto, A. Assessment Of IDW And ANN on Daily Rainfall Data Imputation in Semarang Central Java. Sinkron 2025, 9, 382–394. [Google Scholar] [CrossRef] [Scilit]
- Panikkar, U.R.; Srivastav, R. Multiscale Variability of Hydrological Responses in Urbanizing Watershed. Remote. Sens. 2023, 15, 796. [Google Scholar] [CrossRef] [Scilit]
- Wang, J.; Wu, Y.; Hu, Z. Remote Sensing of Watershed: Towards a New Research Paradigm. Remote. Sens. 2023, 15, 2569. [Google Scholar] [CrossRef] [Scilit]
- GRASS Development Team. Geographic Resources Analysis Support System (GRASS GIS) Software, Version 8.4; Open Source Geospatial Foundation: Beaverton, OR, USA. Available online: https://grass.osgeo.org/ (accessed on 15 January 2026).
- Muntohar, A.S.; Liao, H. Factors Affecting Rain Infiltration on a Slope Using Green-Ampt Model. J. Phys. Sci. 2019, 30, 71–86. [Google Scholar] [CrossRef] [Scilit]
- GRASS Development Team. GRASS GIS Reference Manual; Open Source Geospatial Foundation (OSGeo): Beaverton, OR, USA. Available online: https://grass.osgeo.org/grass-stable/manuals/ (accessed on 15 January 2026).
- Tamesgen, Y.; Atlabachew, A.; Jothimani, M. Groundwater potential assessment in the Blue Nile River catchment, Ethiopia, using geospatial and multi-criteria decision-making techniques. Heliyon 2023, 9, e17616. [Google Scholar] [CrossRef] [Scilit] [PubMed]
- Shelar, R.S.; Nandgude, S.B.; Pande, C.B.; Costache, R.; El-Hiti, G.A.; Tolche, A.D.; Son, C.T.; Yadav, K.K. Unlocking the hidden potential: Groundwater zone mapping using AHP, remote sensing and GIS techniques. Geomat. Nat. Hazards Risk 2023, 14, 2264458. [Google Scholar] [CrossRef] [Scilit]
- Dhakal, S.; Subedi, R.; Kandel, S.; Shrestha, S. Remote sensing and geospatial approach: Optimizing groundwater exploration in semi-arid region, Nepal. Heliyon 2024, 10, e31281. [Google Scholar] [CrossRef] [Scilit] [PubMed]
- Ng, G.C.; Wickert, A.D.; Somers, L.D.; Saberi, L.; Cronkite-ratcliff, C. Coupled Groundwater–Surface-Water Systems. Geosci. Model Dev. 2018, 11, 4755–4777. [Google Scholar] [CrossRef] [Scilit]
- Burayu, D.G. Identification of Groundwater Potential Zones Using AHP, GIS and RS Integration: A Case Study of Didessa Sub-Basin, Western Ethiopia. Remote Sens. Land 2022, 6, 1–15. [Google Scholar] [CrossRef] [Scilit]
- Seifu, T.K.; Ayenew, T.; Woldesenbet, T.A. Identification of groundwater potential sites in the drought-prone area using geospatial techniques at Fafen-Jerer sub-basin, Ethiopia. Geol. Ecol. Landsc. 2024, 8, 410–422. [Google Scholar] [CrossRef] [Scilit]
- Mihret, B.; Wuletaw, A. The impact of geological structures on groundwater potential assessment in volcanic rocks in the Borena Sayint district, northwestern Ethiopian Plateau: A review. Hydrol. Earth Syst. Sci. 2025, 29, 2951–2959. [Google Scholar] [CrossRef] [Scilit]
- Łabojko, S.; Malinowska, A.; Stypiński, B. A Multi-Criteria Framework for Assessing Groundwater Retention Potential; CRC Press: Boca Raton, FL, USA, 2025; pp. 136–144. [Google Scholar] [CrossRef] [Scilit]
- Pant, S.; Kumar, A.; Ram, M.; Klochkov, Y. Consistency Indices in Analytic Hierarchy Process: A Review. Mathematics 2022, 10, 1206. [Google Scholar] [CrossRef] [Scilit]
- Nadjai, S.; Khammar, H.; Boulabeiz, M.; Nabed, A.N.; Benaabidate, L. Sensitivity Analysis and GIS Tools for Groundwater Vulnerability Assessment. (Application in the Middle Chellif Plain, Algeria). Earth Sci. Res. J. 2024, 28, 65–72. [Google Scholar] [CrossRef] [Scilit]
- Abrar, H.; Kura, A.L.; Dube, E.E.; Likisa, D. AHP based analysis of groundwater potential in the western escarpment of the Ethiopian rift valley. Geol. Ecol. Landsc. 2023, 7, 175–188. [Google Scholar] [CrossRef] [Scilit]
- Wijesinghe, D.C.; Mishra, P.K.; Withanage, N.C.; Abdelrahman, K.; Mishra, V.; Tripathi, S.; Fnais, M.S. Techniques for Mapping Groundwater Potential Zones: A Case Study of Thalawa Division, Sri Lanka. Water 2023, 15, 3462. [Google Scholar] [CrossRef] [Scilit]
- Kidanemariam, M.; Wegu, M. Mines of Petroleum and Natural Geological Survey of Ethiopia Groundwater Resource Assessment Directorate Integrated Hydrogeological Mapping of Itang (NC 36-15) and Tori (NB36-3) Map Sheets Acknowledgment; Geological Survey of Ethiopia: Addis Ababa, Ethiopia, 2017. [Google Scholar]
- The, M.; Basin, B.; Razack, M.; Furi, W.; Fanta, L.; Shiferaw, A. Water Resource Assessment of a Complex Volcanic System Under Semi-Arid Climate Using Numerical. Water 2020, 12, 276. [Google Scholar] [CrossRef] [Scilit]
- Yadeta, W.; Karuppannan, S.; Diriba, D.; Shube, H. Groundwater for Sustainable Development Identification of groundwater potential zones for sustainable groundwater resource management using an integrated approach in Sirkole watershed, Western Ethiopia. Groundw. Sustain. Dev. 2024, 27, 101328. [Google Scholar] [CrossRef] [Scilit]
- Mohapatra, P.; Paul, J.C.; Das, D.M.; Sahu, A.P.; Raul, S.K.; Singh, L.K.; Devi, S.R.; Singha, A.K.; Mohanty, A.K. Spatial analysis of groundwater quality and potential for irrigation using hydrogeological and water quality parameters: Insights from Bargarh Canal command area. Front. Water 2026, 7, 1674770. [Google Scholar] [CrossRef] [Scilit]
- Yesgat, A.; Berhanu, A.; Alemie, K. Groundwater potential zone delineation using integrated geospatial data and AHP technique: A case study of the Gidabo Watershed. Discov. Sustain. 2025, 6, 406. [Google Scholar] [CrossRef] [Scilit]
- Amognehegn, A.E.; Nigussie, A.B. Mapping groundwater potential zones for sustainable development using multi-criteria decision making and geospatial analysis in the Borkena River Basin Ethiopia. Discov. Sustain. 2025, 6, 1014. [Google Scholar] [CrossRef] [Scilit]
- Georgescu, L.P.; Balsalobre-Lorente, D.; Zlati, M.L.; Fortea, C.; Antohi, V.M.; Barbuta-Misu, N. Cluster Analysis of the Transition to Climate Neutrality in the European Union. Sustain. Dev. 2025, 33, 1498–1519. [Google Scholar] [CrossRef] [Scilit]



Disclaimer/Publisher’s Note: The statements, opinions and data contained in all publications are solely those of the individual author(s) and contributor(s) and not of MDPI and/or the editor(s). MDPI and/or the editor(s) disclaim responsibility for any injury to people or property resulting from any ideas, methods, instructions or products referred to in the content. |
© 2026 by the authors. Licensee MDPI, Basel, Switzerland. This article is an open access article distributed under the terms and conditions of the Creative Commons Attribution (CC BY) license.