


Abstract
This study examines whether green technology innovation is associated differently with firm productivity and ESG performance. Using panel data on Chinese A-share listed firms from 2013 to 2022, we estimate firm and year fixed-effects models and compare within-firm and pooled associations. In the primary corrected revenue-mode specification, green patent applications are negatively associated with short-run within-firm revenue productivity but positively associated with ESG ratings; the productivity result is construct- and specification-bounded. Alternative productivity measures further show that pooled and within-firm specifications capture materially different relationships. Firm age strengthens the ESG association more than the productivity association, whereas temporally ordered tests do not support environmental attention as a mediating channel, and the asset-turnover diagnostics are null. These findings qualify the conventional win–win view of green innovation and highlight the importance of distinguishing external rating responsiveness from internal operational outcomes. The productivity measure is revenue-based and does not represent physical efficiency.
1. Introduction
The transition to a sustainable economy depends critically on the ability of firms to translate environmental investments into both economic value and social legitimacy [1,2]. Among the various levers available to managers, green technology innovation (GTI)—defined as the development of patented technologies that reduce environmental burdens during production, usage, or disposal [3,4]—is widely promoted as a “win–win” instrument capable of simultaneously improving competitive positions and stakeholder evaluations [5,6]. Empirical research has separately examined the drivers and adoption of eco-innovation [7,8] and its financial consequences [9]. Yet most of this literature treats green-innovation outcomes as a homogeneous bundle, implicitly assuming that the same underlying mechanisms—for example, regulatory pressure, resource reallocation, or stakeholder signaling—drive the various dimensions of firm performance with comparable intensity.
This homogeneity assumption is increasingly difficult to reconcile with three streams of evidence. First, the 2013 and 2014 meta-analyses of environmental and financial performance document substantial effect-size heterogeneity across outcome domains [10,11]. Second, research on ESG measurement shows that ratings depend jointly on observable firm actions, disclosure, stakeholder attention, and provider methodology [12,13]. Recent evidence further links ESG practice to sustainable-business-model innovation [14] and green innovation to reduced greenwashing [15], underscoring that visible sustainability activity can have both substantive and evaluative consequences. Third, research on innovation returns emphasizes that measured productivity gains can require absorptive capacity and complementary investment [16,17,18]. Recent firm-level work likewise found that media conditions and green innovation jointly shape corporate productivity [19]. These strands motivate a direct comparison of the two associations, but they do not justify assuming that either represents a causal mechanism.
Failure to separate these associations can lead investors, managers, and policymakers to read a rating change as evidence of contemporaneous operating-efficiency improvement, or to assume that visible innovation and productivity respond on the same timetable. Existing studies have rarely compared productivity and ESG outcomes within the same empirical framework. A common design is therefore needed to test, rather than presume, whether the two associations have similar magnitudes and survive the same identification checks.
Despite the rapid expansion of research on green innovation, relatively little is known about whether its productivity and ESG rating associations survive the same identification tests. This distinction matters because productivity and ESG ratings are generated through different processes. Productivity indices are intended to capture internal productive capability, which depends on complementary assets, production routines, and absorptive capacity; the revenue-based index used here is not a direct physical-efficiency measure. ESG ratings are external evaluations that can respond to observable environmental actions and disclosure while also reflecting provider-specific methodology. Treating the two outcomes as interchangeable may therefore obscure whether an observed coefficient represents within-firm change, persistent between-firm heterogeneity, or rating responsiveness.
We address this gap using a main panel of 2933 Chinese A-share listed firms over 2013–2022 (23,047 firm-year observations). China provides an informative setting because environmental regulation, green innovation, and national carbon-policy salience have intensified together [20,21,22]. For the present revision, we obtained a Mark Data package containing provider-supplied listed-company financial statement data and construction code and independently reconstructed LP, OP, and OLS productivity indices. Because the supplied LP command used the software’s default value-added mode with revenue output, we also executed the documented revenue option. This corrected pooled revenue-mode LP series replaces both the legacy variable and the direct default-mode reconstruction in every primary productivity analysis; the default-mode, OP, and OLS variants are retained only as benchmarks or sensitivity checks, while the industry-specific variant is a partial diagnostic. No authoritative deflator was available. ESG is measured with the Sino-Securities Index Huazheng rating [23]. Firm and year fixed effects form the principal specification. Industry-by-year and province-by-year fixed effects absorb common sectoral and regional policy shocks; a corrected IV analysis is retained only in Appendix C because instrument relevance and exclusion remain inadequate for causal interpretation. A matched comparison around the 2020 carbon neutrality announcement is likewise framed as a policy-salience heterogeneity test rather than a quasi-experiment.
This study makes three contributions. First, it compares revenue productivity and ESG ratings within a common identification hierarchy and shows that the primary within-firm associations have opposite signs rather than a uniform win–win pattern. Second, it makes the pooled-to-firm-FE estimand transition itself analytically informative: direct within–between models and OP/OLS/FE sensitivity tests distinguish short-run changes within a firm from persistent differences across firms, instead of treating a pooled coefficient as within-firm evidence. Third, it formally compares standardized outcome slopes and age interactions while auditing construct and channel evidence. Correcting the LP software mode changes the productivity conclusion, the earlier same-year EnvAtt result does not survive temporal ordering, and the ATO term remains null in a strict revenue-and-asset-overlap diagnostic. These contributions qualify the conventional win–win view without claiming that green patents causally change either outcome.
The primary research question is therefore: are one-year-lagged green patent applications associated with within-firm changes in productivity and Huazheng ESG ratings with comparable magnitude? A complementary, non-directional question asks how the GTI–productivity association differs between pooled and within-firm estimands and across reconstructed productivity indices. Specifically, we (i) estimated both outcomes under firm and year fixed effects; (ii) added industry-by-year and province-by-year shocks; (iii) compared standardized slopes and age interactions formally; (iv) estimated variance components and within–between decomposition slopes; and (v) reassessed proposed channels using temporal ordering and accounting-overlap diagnostics. These objectives address a gap in studies that estimate one outcome at a time or label a pooled association as a within-firm mechanism without establishing where the identifying variation resides.
Overall, five findings emerged. First, under the primary firm- and year-fixed-effects design, one-year-lagged green patent applications are negatively associated with the corrected nominal revenue-productivity index (β = −0.0036, 95% CI [−0.0070, −0.0002]) but positively associated with Huazheng ESG ratings (β = 0.0441, 95% CI [0.0183, 0.0699]); accordingly, H1a is not supported and H1b is supported only in the primary application-based one-year-lag model. Second, the standardized ESG slope exceeds the productivity slope by 0.0508 outcome SD per one pooled-sample SD of GTI (p < 0.001). Third, the within–between decomposition and alternative productivity estimators show that pooled and within-firm specifications capture materially different relationships. Fourth, the standardized GTI-by-age interaction is larger for ESG than for productivity (difference = 0.0287, p = 0.008), supporting H3. Fifth, the temporally ordered channel tests do not support H2 or an ATO mechanism, while the industry and policy-salience results remain exploratory. Taken together, the evidence supports construct- and estimand-bounded asymmetric associations rather than causal pathways.
The remainder of this paper is organized as follows. Section 2 develops the theoretical framework and hypotheses. Section 3 describes the materials and methods. Section 4 reports the baseline, robustness, channel, moderation, heterogeneity, and policy-salience results. Section 5 discusses the findings, implications, and limitations. Section 6 provides the conclusions.
2. Theoretical Framework and Hypotheses
2.1. Green Technology Innovation as a Sustainability Lever
The economics-of-innovation tradition treats environmental innovation as a special case of directed technical change: when firms face explicit or implicit pricing of environmental externalities, R&D effort reallocates toward technologies that abate emissions, save resources, or substitute cleaner inputs [24,25]. Patent filings—particularly those classified under the World Intellectual Property Organization’s “Green Inventory”—provide a measurable, legally bounded indicator of such directed effort [26,27]. In the strategic management tradition, the natural-resource-based view (NRBV) recasts environmental capability as a source of sustainable competitive advantage when it is rare, valuable, and difficult to imitate [2,28]. Together, these traditions suggest that GTI should improve firm performance, but they leave unspecified the relative magnitudes and mediating channels through which different performance dimensions are affected.
2.2. Direct Associations: GTI with Productivity and ESG
Productivity association: resource-based logic. Environmental practices may reduce material, process, and regulatory compliance costs [29,30]. The resource-based view is the principal theory [2,28,31]: complementary assets and routines condition whether an invention becomes productive capability, absorptive capacity supports implementation [16], and complementary investment can delay measured productivity gains [18]. The competing selection explanation is that firms with durable capabilities may both patent more and remain more productive. A pooled positive coefficient can therefore reflect productive integration, capability-based selection, or both; firm fixed effects test whether a short-run within-firm association remains. Thus,
H1a.
Green technology innovation is positively associated with subsequent firm productivity.
ESG rating association: legitimacy logic. Legitimacy theory is the principal account: visible environmental action can support external acceptance [32], and we propose patent signaling as an observable implication by analogy to general signaling theory [33]. ESG ratings vary with provider scope and measurement choices [12,13], while the current Sino-Securities methodology draws on public information and company reports [23]. These features create an evaluative link that can operate even when a patent has not yet altered production efficiency. Because the outcome is a provider rating rather than independently measured environmental impact, the prediction concerns rating responsiveness:
H1b.
Green technology innovation is positively associated with subsequent ESG performance.
These theories generate distinct empirical predictions. The productivity coefficient should attenuate if stable capabilities account for the cross-firm pattern. The ESG rating coefficient may survive firm fixed effects if evaluators respond to changes in visible green activity. We therefore compared the standardized coefficients formally under a common firm- and year-fixed-effects system rather than inferring asymmetry from coefficients measured on different native scales. We also asked, without imposing a post hoc directional hypothesis, whether pooled and within-firm productivity associations differ across reconstructed LP, OP, OLS, and FE indices.
2.3. Environmental Attention and Accounting-Overlap Diagnostics
The earlier version of this study treated environmental attention and asset turnover as parallel mediators. The revised framework separates a temporally testable ESG hypothesis from a productivity-side accounting diagnostic. Environmental-disclosure attention is theoretically relevant because it is observable to stakeholders and rating providers. Asset turnover, by contrast, shares operating revenue and asset-scale components with the LP productivity measure; it cannot be treated as an independent mechanism without first addressing that mechanical overlap.
2.3.1. ESG-Side Mediator (Environmental-Disclosure Attention)
Environmental attention (EnvAtt). Cognitive accounts of corporate sustainability emphasize that attention to environmental issues can precede environmental action [34,35]. We observe disclosure intensity, not managerial cognition: EnvAtt is the environment-related word count in the annual MD&A, with the archived variable attributed to Wu and Hua [36], but without the underlying dictionary or text-processing materials. We propose that a filing in year t − 1 may be followed by richer environmental disclosure in year t, which may then be reflected in the rating observed in year t + 1. This temporal sequence is stricter than the same-year covariance decomposition used in the previous version, but the available sources do not establish it as a validated mechanism.
H2.
Environmental attention positively mediates the association between prior green technology innovation and subsequent ESG performance.
H2 was tested as a temporally ordered statistical indirect association rather than causal mediation.
2.3.2. Asset Turnover as an Accounting-Overlap Diagnostic
Asset turnover is defined neutrally as operating revenue divided by total assets. The LP production-function output is also revenue-based, and the resulting productivity index remains highly correlated with asset size. The ATO and TFP_LP therefore share accounting components. We retained the ATO only as a diagnostic: in addition to the raw index, we used an overlap-residualized outcome obtained by projecting TFP_LP on log total assets and reconstructed log operating revenue (Size + ln ATO), with year and industry effects. This is a strict accounting diagnostic, not a new production-function estimate. We did not state an ATO hypothesis, calculate a mediation proportion, or interpret the term as an independent economic mechanism.
2.3.3. Unobserved Alternatives
Earlier checks of management cost, operating cash flow, and institutional ownership remain reported in Appendix B.4 for transparency, but null results for selected variables cannot establish that the ATO is dominant. Unobserved channels such as patent quality, implementation expenditure, supply-chain redesign, energy-intensity changes, and workforce adaptation remain plausible. The revised analysis therefore treats all channel evidence as exploratory.
2.4. Moderation Hypothesis: Firm Age
We developed two competing, study-specific predictions for firm age from broader theory rather than treating either as an established empirical fact. General legitimacy theory [32] suggests that accumulated relational capital and regulatory familiarity could make a new green patent a credible extension of an established commitment in external evaluation. Conversely, legacy routines and production assets may delay the conversion of a new patent into productive capability, while accumulated environmental liabilities could also lead evaluators to discount a new filing [37]. These arguments predict a stronger age-contingent association for the ESG rating than for revenue productivity. We tested that difference directly after placing both outcomes, GTI, and firm age on a common standardized scale:
H3.
Firm age strengthens the association between green technology innovation and ESG performance more than it strengthens the corresponding association with revenue productivity.
The parallel industry-intensity contingency is developed in the next subsection as an exploratory boundary-condition analysis.
2.5. Boundary Condition: Industry Type
General technology and productivity theory treats substitution, complementary investment, and organizational environment as potential conditions on innovation returns [18,38,39,40]. Building on that logic, we propose—rather than treat as an established empirical ranking—that capital- and technology-intensive industries may have stronger capital, engineering, and skilled-labor complements for integrating green patents, whereas some labor-intensive settings may face greater financing, workforce, or process-redesign constraints.
Complementarity predicts a stronger GTI–productivity slope in capital- and technology-intensive settings. ESG providers, however, evaluate visible environmental action across sectors, so the rating association need not depend on the same production complementarities. This is an evaluative-decoupling argument: a rating can change without a contemporaneous change in the production function. We tested the cross-industry slope differences directly in pooled interaction models. The productivity equality test is null, whereas the ESG test yields exploratory evidence of different slopes across the documented classes. Because industry type is observational and was not a pre-specified hypothesis, neither result is interpreted causally.
2.6. Supplementary Policy-Salience Setting: The 2020 Carbon Neutrality Announcement
In September 2020, China announced its dual-carbon goals, committing to peak carbon emissions by 2030 and achieve carbon neutrality by 2060 [22]. The announcement increased environmental-policy salience for Chinese firms, especially in industries covered by the official 2008 environmental verification catalog [41]. Firm-level evidence from Chinese A-share listed companies shows that economic policy uncertainty has an inverted U-shaped association with green-innovation quantity and a positive association with innovation quality [42], reinforcing the need to treat policy context as a boundary condition rather than assume a uniform corporate response. Our comparison is not a treatment effect of GTI: the announcement was nationwide, heavy-pollution status is a differential-exposure marker, and parallel trends must be assessed outcome by outcome. Because most of 2020 predates the September announcement, 2020 is treated as a transition year and 2021–2022 as the full post-announcement period.
2.7. Positioning Relative to ESG-to-Productivity Studies
Recent studies often place ESG upstream of innovation, productivity, or sustainable-business-model change. Ding, Han, and Wang [43] modeled ESG as an antecedent of firm productivity through financing constraints and R&D; Zhang et al. [14] examined ESG-to-business-model innovation; and Ma et al. [15] connected green innovation with reduced greenwashing. Our design differs in analytical ordering and purpose. The GTI is the common observable antecedent, while the revenue-productivity index (TFP_LP) and HZESG are parallel outcomes. The revised contribution is not a new sequential mechanism but a comparison of whether the two outcome associations survive the same within-firm identification and temporal tests.
A related earlier article by Shen and Kim [44] used a substantially overlapping 2013–2022 Chinese A-share sample to examine green management and green technology innovation in relation to ESG performance, including contemporaneous environmental-attention mediation and R&D-intensity moderation. The present study is not a translation or republication of that article. It adds revenue productivity as a parallel outcome, reconstructs and audits multiple productivity measures, makes firm and year fixed effects the primary estimand, formally compares standardized outcome slopes and age interactions, and re-estimates the environmental-attention pathway using a temporally ordered design. Under the present firm-and-year-fixed-effects and temporal specification, the environmental-attention indirect association is not supported at the 5% level. The overlapping ESG-side sample and constructs are therefore treated explicitly as prior related work.
Figure 1 summarizes the conceptual framework and distinguishes the proposed ESG-side channel from the productivity-side accounting diagnostic.
Figure 1.
Theoretical framework for asymmetric GTI associations with revenue productivity and ESG ratings. Solid arrows denote direct association paths. Green dashed arrows denote the proposed temporal channel test (H2); amber dashed arrows denote the accounting-overlap diagnostic; and gray dashed connectors denote firm-age moderation of the GTI–outcome slopes (H3). Green solid paths denote the external-evaluation branch, and blue solid paths denote the internal-efficiency branch. Industry type and the 2020 announcement are exploratory boundary contexts.
3. Materials and Methods
3.1. Sample and Data Sources
The source panel comprises Chinese A-share listed firms over 2013–2022. We constructed the panel by merging four data sources matched on stock code (six-digit, zero-padded) and year:
Firm financials, governance, and patent counts from the China Stock Market and Accounting Research (CSMAR) database, supplemented by the Chinese Research Data Services (CNRDS) green patent module.
ESG ratings from the Sino-Securities Index (Huazheng ESG (Shanghai, China), henceforth HZESG), which provides nine-grade ratings (AAA → C) coded numerically. The current provider methodology is cited for provider identity and rating structure, not as proof that every historical year used the current-version rules [23].
Productivity-construction inputs and code from a Mark Data package containing provider-supplied listed-company financial statement data. The provider’s public page describes annual reports as its source and does not establish that this package is CSMAR-derived [45]. We reconstructed LP, OP, and OLS indices during the present revision; the reconstructed LP series is primary, and reconstructed OP and OLS indices are sensitivity outcomes [46,47,48,49,50,51]. The legacy provider series is retained only for validation comparison.
Environmental attention scores (EnvAtt) from textual analysis of management discussion and analysis (MD&A) sections in annual reports. The archived documentation attributes the environmental-keyword dictionary underlying EnvAtt to Wu and Hua [36]; the dictionary and source-level text-processing materials are unavailable for independent reconstruction.
At the data-construction stage, we excluded firms that were already designated special-treatment (ST/PT) and firms in financial or real estate industries, required complete corrected revenue productivity and green patent applications, required at least three valid years, and winsorized continuous variables at the 1st and 99th percentiles. An audit identified that an earlier internal build had also required nonmissing GreenMI even though GreenMI appears in no retained hypothesis, regression, table, or conclusion. We therefore removed that analytically unnecessary condition and rebuilt every variable, exact lag, model, table, and figure from the source. This correction prevented sample selection on an unused variable; GreenMI was not used in panel inclusion, winsorization, lag construction, or estimation. Of 24,644 source firm-years, 24,300 had complete corrected productivity and GreenApply; the three-valid-year rule yielded the final 2013–2022 panel of 23,047 observations for 2933 firms. Exact calendar-year lag matching and complete-case control requirements yielded 19,708 observations for the primary productivity model and 19,696 for HZESG, representing 2932 firms; the 12-observation difference reflects ESG missingness. A sensitivity analysis reported in Section 4.2 shows that ending the window in 2021 preserved both primary conclusions. A stricter firm-level exclusion removed every observation for any firm entering ST/PT status during the observed period; under that definition, H1a remains unsupported, but the negative productivity coefficient’s confidence interval spans zero, while the ESG coefficient remains positive. The construction-stage screen and the stricter sensitivity address different criteria: the former removes firms already designated ST/PT, whereas the latter removes the complete panel history of firms entering ST/PT during the study window. LP estimation-sample eligibility is a separate observation-level production-function criterion assessed in the robustness analysis and Appendix A.
Table 1 summarizes the sample-construction flow.
Table 1.
Sample construction for the GreenMI-free 2013–2022 main panel.
The sample and the ESG-side research design build on Chapter 4 of the first author’s doctoral dissertation [52]. The present study extends that work with the productivity outcome, a common firm-fixed-effects hierarchy, standardized cross-outcome tests, within/between variance decomposition, temporal channel diagnostics, industry comparisons, and the policy-salience analysis.
3.2. Variables
Dependent variables. The LP-based nominal revenue-productivity index (TFP_LP) is the corrected revision-stage reconstruction of the Mark Data LP inputs. Following Levinsohn and Petrin [46] and the Stata/MP 18 implementation documented by Petrin, Poi, and Levinsohn [48], the method uses intermediate input as a proxy for unobserved productivity. The provider describes its five-method listed-company dataset as following the Chinese firm-level comparison by Lu and Lian [49], while the exact variable definitions used here are those in the supplied workbook and code [45]. Output is the operating revenue divided by 10,000; capital is the net fixed assets divided by 10,000; labor is the employee count; and proxy intermediate input is the operating cost plus selling, administrative, and financial expenses, less depreciation/amortization, and cash paid to employees, divided by 10,000. The supplied code applies sample restrictions, transforms inputs as ln(x + 1), winsorizes log inputs annually at 1%/99%, and estimates one pooled eligible-firm production function. It uses no price deflator and omits levpet’s revenue option even though the dependent variable is the operating revenue. We first reproduced that default-mode benchmark and then executed the methodologically aligned pooled specification in Stata/MP 18 with levpet 1.0.1 and the documented revenue option. The revenue-mode re-estimation returned finite coefficients, and the resulting series was mapped to the rebuilt study panel. Appendix A reports estimation-sample eligibility, the command-generated prediction scope, the group-count reconciliation, and the e(sample)-restricted sensitivity. This corrected revenue-mode series is the primary productivity outcome; the provider default-mode reconstruction is retained only in Appendix Table A1. An industry-specific revenue-mode diagnostic produced usable estimates for too few industries and only 7837 matched study-panel observations, so it is reported as a partial diagnostic rather than an alternative primary measure. No deflated variant was estimated because the archive contains no authoritative industry-year deflator series or documented concordance linking such deflators to the analytical inputs. As Van Beveren [50] emphasizes, firm-level productivity estimates depend on input and output definitions, deflation, sample construction, and implementation; the primary index is therefore not interpreted as a physical TFP or validated scale-free technical-efficiency residual. Reconstructed OP and OLS provider-specification indices are reported only as sensitivity outcomes; the OP check follows Olley and Pakes [47] and its Stata implementation [51]. Some Chinese firm-level studies operationalize high-quality enterprise development using TFP [53]. In this study, however, the revenue-productivity index is treated only as a productivity-related outcome and is not equated with the broader policy concept. Appendix A documents the full decision. ESG (HZESG) is the Sino-Securities Index Huazheng rating. The archived annual series maps AAA through C to 9 through 1 and stores a firm-year mean; the source archive does not contain the quarterly transformation and missing-quarter log. It is a provider assessment, not a direct measure of environmental impact. Because the licensed extract lacked separate E, S, and G pillar scores and an alternative-provider series, we could not perform a pillar-level or provider-comparison test. In the sample, HZESG is effectively continuous on [1.25, 6.25] (mean 4.09, SD 1.05). The supplementary ordered logit rounds the annual mean to the nearest integer grade and estimates a different, pooled ordinal-link benchmark rather than the primary within-firm estimand.
Main independent variable. The GTI is measured as the natural log of one plus the number of green-invention and green-utility-model patent applications filed in year t, classified per the WIPO Green Inventory IPC codes [27]; the variable GreenApply carries this logged quantity throughout the data and tables (Table 2 and Table 3). For robustness analyses, we additionally used GreenGrant, defined analogously as the log of one plus the count of granted green patents in year t; using grants rather than applications captures the quality-filtered subset of green innovation that has passed substantive review. Because grants are recorded in the year of authorization, a firm-year’s granted count aggregates applications filed over multiple preceding years, which is why mean GreenGrant exceeds mean GreenApply in Table 2. Green-patent application counts capture codified, publicly observable green-innovation activity and commitment rather than commercialized output; in particular, they do not necessarily measure implementation, commercialization, or realized environmental impact. After acknowledging this as a measurement-scope choice, OECD guidance was used to bound patent-indicator interpretation [26] and granted patents (GreenGrant) were used as a robustness check.
Table 2.
Descriptive statistics for the 2013–2022 main panel.
Table 3.
Correlation matrix and variance inflation factors.
Channel variables. EnvAtt is the archived natural log of one plus the count of environment-related keywords in the firm’s annual MD&A. The archived documentation attributes the environmental-keyword dictionary underlying EnvAtt to Wu and Hua [36]; the dictionary and source-level text-processing materials are unavailable for independent reconstruction. It is a textual proxy for environmental-disclosure attention, not managerial cognition. Because the current archive lacks the Chinese dictionary, text-processing script, MD&A corpus, and document-length measure, the temporal EnvAtt test is explicitly exploratory and cannot assess length normalization or alternative missing-text rules. The ATO is the operating revenue divided by total assets. Because both the ATO and reconstructed LP index embed revenue and scale information, the ATO was excluded from the relevant control vector and used only in an accounting-overlap diagnostic. The strict variant residualizes TFP_LP on log assets and reconstructed log revenue before estimating the outcome equation.
Moderators and historical diagnostics. FirmAge is the natural log of one plus years since founding and is the pre-specified moderator in the revised analysis. GTI and FirmAge were mean-centered before their interaction was formed. With firm and year fixed effects, the age main effect is not a cross-sectional age comparison; the interaction is identified from whether the within-firm GTI slope changes as logged age evolves differentially across firms. INST is the share of equity held by institutional investors, and Intang is the ratio of intangible assets to total assets; their earlier moderation and contemporaneous-channel specifications are retained only in the archived benchmark tables.
Controls. The baseline control vector includes eight variables: firm size (Size, log of total assets), leverage (Lev), return on equity (ROE), Tobin’s Q, management-fee ratio (Mfee, administrative expenses over operating revenue), asset-turnover ratio (ATO; excluded from the outcome equation when the ATO is evaluated as a channel diagnostic), revenue growth (Growth, year-on-year operating revenue growth rate), and board size (Board, the natural log of the number of directors). The cash-flow ratio (Cashflow, net operating cash flow over total assets) appears only in the historical alternative-channel diagnostics reported in Appendix B.4.
Heterogeneity variables. HighTech is a binary indicator for high-technology firms following Ministry of Science and Technology certification. IndType is a source-based annual three-class industry-intensity variable (1 = labor-intensive, 2 = asset-/capital-intensive, and 3 = technology-intensive). The classification follows Yin, Sheng, and Li’s SPSS 19.0 Ward hierarchical-cluster solution [54], which uses the fixed-asset ratio (net fixed assets divided by average total assets) and the R&D-to-payroll ratio (R&D expenditure divided by employee compensation payable) and reports a mutually exclusive 67-code crosswalk under the 2012 CSRC industry system [55]. We merged the source record by stock code and year and used its contemporaneous annual industry code and class; thus, a firm is reclassified when its source-record industry code moves across class boundaries. All 23,047 study-panel firm-years matched the source record. Of these, 22,916 were covered by the published 67-code mapping: 6181 labor-intensive, 4228 asset-/capital-intensive, and 12,507 technology-intensive observations. The remaining 131 firm-years were left unclassified and excluded from the IndType analyses. Appendix B.2 and the retained industry-type classification audit record document the full mapping, source audit, exclusions, and re-estimation results.
Policy-salience variables. Treat is a binary indicator equal to one for firms classified as heavy-pollution by the 2008 Ministry of Environmental Protection list [41]. FullPost equals one in 2021–2022, the full calendar years after the September 2020 announcement. The clean contrast excludes 2020 as a transition year; the event study reports its separate transition-year coefficient. The 2008 catalogue is used here as a fixed historical heavy-pollution industry classification convention; it is not assumed to have remained legally operative throughout the 2013–2022 study window.
Notation. Throughout the text and tables, GTI (t − 1) and GTI (t − 2) denote exact one- and two-calendar-year lags of GTI, the log-transformed green-patent application count (variable GreenApply); GTI-grant denotes the granted-patent variant based on GreenGrant; and (c) marks mean-centered variables in the moderation specifications. Lags were constructed by matching firm i in year t to the same firm’s record in year t − 1 or t − 2. If that exact calendar-year record was absent, the lag was left missing rather than filled from the previous observed row.
Software environment. Productivity reconstruction was performed using Stata/MP 18 (StataCorp LLC, College Station, TX, USA) with levpet 1.0.1, opreg 2.0.0, and winsor2 1.1. Downstream fixed-effects, within–between, cross-equation, matching, wild-bootstrap, figure, and table routines were conducted using Python 3.13.5 (Python Software Foundation, Beaverton, OR, USA) with NumPy 2.3.5, pandas 2.3.3, SciPy 1.17.1, linearmodels 7.0, and scikit-learn 1.8.0, as recorded in the retained execution environment.
Generative artificial intelligence use. OpenAI Codex (OpenAI, San Francisco, CA, USA; https://openai.com/zh-Hans-CN/ accessed on 17 August 2026) was used to assist with code review, reproducibility checks, numerical and structural consistency review, reference verification, English-language editing, and document formatting. It was not used to create or alter source data. All code, numerical outputs, modeling decisions, interpretations, and final text were independently reviewed and approved by the authors.
3.3. Empirical Specification
Our primary specification is:
where Y is either the reconstructed productivity index (TFP_LP) or HZESG, α_i and μ_t are the firm and year fixed effects, respectively, and X is the control vector. Standard errors are clustered by firm. The coefficient β is therefore identified from within-firm changes after absorbing economy-wide annual shocks. The exact one-calendar-year lag reduces same-year simultaneity but does not eliminate time-varying omitted variables, so we describe β as a within-firm association rather than a causal effect.
We estimated a fixed-effects hierarchy rather than selecting one specification after observing significance. The hierarchy comprised (i) firm and year fixed effects, our primary model; (ii) firm and industry-by-year fixed effects; and (iii) firm, industry-by-year, and province-by-year fixed effects. The latter models absorb common sector-year and province-year shocks. A pooled year-and-industry-fixed-effects model, which retains both within- and cross-firm variation, is reported only as a descriptive benchmark; it is not a between estimator. For firm-FE specifications, we report the within R2 after fixed-effect absorption; for the pooled benchmark, we labeled the corresponding partial R2 separately.
We first decomposed the variance of the lagged GTI and both outcomes into exact within- and between-firm sums of squares. Because variance shares do not decompose a regression coefficient, we then estimated a within–between decomposition model with firm means and firm-mean deviations:
This is an absorbed OLS decomposition, not a random-intercept or correlated-random-effects estimator. For each outcome, firm means were calculated on that model’s complete-case estimation sample. One-year-lagged green patent applications and every time-varying control enter jointly as a firm-mean deviation and a firm mean, together with year and industry fixed effects. Standard errors are clustered by firm. The deviation coefficient βW estimates the conditional within-firm association, while the firm-mean coefficient βB estimates the conditional between-firm association. A cluster-robust Wald test was used to evaluate the equality of the two slopes. Neither coefficient is interpreted causally.
Finally, on common estimation samples, we standardized the GTI and both outcomes using their pooled-sample standard deviations, residualized the direct-association equations on firm and year fixed effects, and estimated them as a cluster-robust system. A standardized slope is therefore measured in outcome SDs per one pooled-sample SD increase in the GTI. For H3, we additionally standardized firm age, entered the standardized GTI, age, and their product in both firm-and-year-FE outcome equations, and used the firm-clustered cross-equation covariance to test the equality of the interaction coefficients. An algebraically equivalent regression using the standardized ESG-minus-productivity outcome provided a verification check. These procedures compare slopes and interactions directly rather than inferring a difference from separate significance decisions [56].
The appendix-only instrumental-variable sensitivity specifications instrument GTI (t − 1) with GTI (t − 2), the lagged leave-one-out industry-by-year mean of peer GTI, or both. They include the full control vector and year and industry fixed effects, with standard errors clustered by firm:
The persistence instrument is strongly relevant, whereas the lagged peer instrument is weak. Relevance alone would not establish validity in any case: GTI (t − 2) can affect current outcomes through persistent capabilities, while peer GTI can proxy for industry-year demand, regulation, or technology shocks. The joint specification did not reject the overidentifying restrictions, but that diagnostic cannot establish the exclusion restrictions. We therefore retained the IV estimates only as a transparent appendix audit; they do not corroborate the primary result, identify a defensible local average treatment effect, or support causal language.
The channel analysis is temporally ordered:
Both equations use the same path-specific complete-case sample, absorb firm and outcome-year fixed effects, and cluster by firm; confidence intervals for a·b use the delta method and are descriptive rather than causal. Controls are measured at t. Environmental attention (EnvAtt) is evaluated as a pre-specified but exploratory ESG channel. Asset turnover is retained as an accounting-overlap diagnostic, not a mediator hypothesis, because both the ATO and the reconstructed LP productivity series incorporate operating revenue. We therefore report the productivity index (TFP_LP) and an outcome residual obtained by projecting that index on log assets and reconstructed log operating revenue, and we avoided mediation-share calculations.
The policy-salience analysis estimates propensity scores from the eight controls measured in 2019 and applies 1:1 nearest-neighbor matching with replacement within a caliper of 0.05 standard deviations of the logit propensity score. Repeated control draws enter the matched panel through frequency weights. Covariate balance was assessed using weighted standardized mean differences (|SMD| < 0.10 [57]). The clean full-post contrast omits 2020 and estimates:
where Treat denotes heavy-pollution-industry membership and FullPost equals one in 2021–2022. Firm and year fixed effects are included. Because exposure was assigned through industry status, standard errors and confidence intervals clustered on 54 detailed industries in the full sample and 50 detailed industries in the matched sample, and p-values used a 999-draw Webb-weight wild-cluster bootstrap. Because the announcement applied nationwide and Treat is a time-invariant exposure category, the design is a differential policy-salience comparison, not a direct intervention on GTI. Event-study coefficients for 2014–2022 use 2019 as the reference year, display 2020 separately as the transition year, apply the matching frequency weights, and report detailed-industry-clustered 95% confidence intervals and joint pre-trend tests.
4. Results
4.1. Baseline Associations: GTI with Productivity and ESG
Table 4 reports the fixed-effects hierarchy using the corrected pooled revenue-mode index. In the primary firm-and-year-FE model, one-year-lagged green patent applications are negatively associated with the revenue-productivity index (β = −0.0036, SE = 0.0017, p = 0.038; 95% CI [−0.0070, −0.0002]; N = 19,708). Because H1a predicted a positive association, H1a is not supported. The point estimate remains negative but is marginal after absorbing industry-by-year shocks (β = −0.0032, p = 0.057) and both industry-by-year and province-by-year shocks (β = −0.0031, p = 0.070). The pooled year-and-industry-FE benchmark is also negative and statistically null (β = −0.0013, p = 0.657). We therefore describe the primary negative estimate as specification-bounded and associational rather than as evidence of a causal productivity loss.
Table 4.
Fixed-effects hierarchy for revenue productivity and ESG ratings.
For Huazheng ESG ratings, the primary one-year-lagged application coefficient is positive and statistically significant (β = 0.0441, SE = 0.0132, p < 0.001; 95% CI [0.0183, 0.0699]; N = 19,696). It remains positive after industry-by-year fixed effects (β = 0.0411, p = 0.001) and after adding province-by-year fixed effects (β = 0.0442, p < 0.001). The pooled year-and-industry-FE benchmark is larger (β = 0.1695, p < 0.001), consistent with the added cross-firm variation but not decomposing its coefficient by source. H1b is supported in the primary application-based one-year-lag model, but later robustness checks show that this association is not invariant to the granted-patent proxy or the two-period lag.
Panel A of Table 5 reports the exact sums-of-squares decomposition: 74.7% of GTI variance, 76.4% of corrected revenue-productivity variance, and 64.6% of ESG variance is between firms. Panel B estimates the coefficient decomposition that variance shares alone cannot provide. For the productivity index, the within–between model estimates a negative within slope of −0.0051 (SE = 0.0018, p = 0.004; 95% CI [−0.0087, −0.0016]) and a statistically null between slope of −0.0016 (SE = 0.0040, p = 0.685; 95% CI [−0.0095, 0.0062]); their difference is 0.0035 (SE = 0.0045, p = 0.432). For ESG, the within slope is 0.0375 (SE = 0.0131, p = 0.004; 95% CI [0.012, 0.063]), the between slope is 0.2088 (SE = 0.0201, p < 0.001; 95% CI [0.169, 0.248]), and the difference is 0.1713 (SE = 0.0239, p < 0.001). These terms remain conditional observational associations; the productivity result does not establish a causal within-firm loss, and the larger ESG between slope does not establish selection by stable capabilities.
Table 5.
Exact variance components and within–between decomposition estimates.
Table 6 formally compares the within-firm standardized slopes on a common sample using a cluster-robust system. The revenue-productivity slope is −0.0135 (SE = 0.0065, p = 0.038; 95% CI [−0.0262, −0.0007]), whereas the ESG slope is 0.0373 (SE = 0.0112, p < 0.001; 95% CI [0.0155, 0.0592]). Their difference is 0.0508 (cluster-robust SE = 0.0126, p < 0.001; 95% CI [0.0261, 0.0755]; N = 19,696; 2932 firms). H1a was decided from the native-scale primary model, not from this standardized comparison. On the common complete-case sample used for the standardized comparison, one pooled-sample SD of GTI is 0.909; the corresponding full-panel SD reported in Table 2 is 0.895. On the native scale, that common-sample SD corresponds to 0.040 HZESG points (95% CI [0.017, 0.063]), or about 0.037 of the common-sample HZESG SD. These are associational magnitudes, not causal effects.
Table 6.
Cluster-robust comparison of standardized GTI slopes.
Because Huazheng ratings are ordinal in origin, Table 7 reports an ordered-logit benchmark for the discretized 1–9 grade. The firm-clustered coefficient is positive (log-odds β = 0.341, SE = 0.028, p < 0.001, N = 19,696). This secondary year-and-industry-FE result provides sign robustness to an ordinal link; it does not replace the firm-FE linear model used for the primary within-firm inference.
Table 7.
Ordered-logit benchmark for the GTI–ESG association.
4.2. Primary-Estimand Robustness
Table 8 and Table 9 align the sensitivity analyses with the primary firm- and year-fixed-effects estimand. The reconstructed alternative OP (β = −0.0046, p = 0.135) and OLS (β = −0.0009, p = 0.707) indices are statistically null. Appendix Table A2 shows why substituting a pooled model changes the empirical question rather than providing an interchangeable robustness result. In the year-and-industry-FE pooled benchmarks, the OP (β = 0.0139, p = 0.022), OLS (β = 0.0110, p = 0.005), and conventional FE-index productivity (β = 0.0101, p = 0.010) are positive. In the direct within–between models, the OP conditional between slope exceeds its within slope (difference p = 0.005), whereas the OLS difference is marginal (p = 0.056) and the FE-index difference is not significant (p = 0.167). These estimator-dependent contrasts indicate that pooled positive results can be concentrated in persistent cross-firm differences; they do not establish a positive within-firm association. In contrast, the corrected revenue-mode LP coefficient remains negative for granted patents (β = −0.0062, p < 0.001), the two-period application lag (β = −0.0040, p = 0.014), and the exclusion of heavy-pollution observations (β = −0.0043, p = 0.031), but is marginal when 2020 is excluded (p = 0.051) or variables are winsorized at 5%/95% (p = 0.075). Thus, the productivity conclusion is explicitly conditional on both the estimand and the reconstructed index.
Table 8.
Firm-and-year-fixed-effects robustness checks for revenue productivity.
Table 9.
Firm-and-year-fixed-effects robustness across outcomes.
For ESG, excluding 2020 (β = 0.045, p < 0.001) and 5%/95% winsorization (β = 0.040, p = 0.001) preserved the positive within-firm coefficient. The grant-based coefficient (β = 0.021, p = 0.087) is marginal only at 10%, and the two-period-lag coefficient (β = 0.007, p = 0.618) is statistically null. H1b is therefore supported in the primary application-based one-period-lag model and several specification checks, but it is not invariant to proxy or lag horizon. The supplementary Tobin’s Q results are reported for scope rather than used to support either primary hypothesis.
Table 8 also reports the source-row eligibility audit. Restricting the primary productivity regression to observations eligible for the LP production-function e(sample) removes 355 documented full-panel predictions and leaves the negative coefficient and 5% decision unchanged (β = −0.0035, SE = 0.0017, p = 0.045; 95% CI [−0.0069, −0.0001]; N = 19,353). Table 10 treats 2013–2022 as the main window, shows the corresponding sample ending in 2021, and applies the stricter ever-ST/PT firm exclusion. Ending the window in 2021 leaves the productivity estimate negative (β = −0.0036, p = 0.043) and the ESG estimate positive (β = 0.0419, p = 0.004), so the inclusion of 2022 does not determine either primary hypothesis decision. The ever-ST/PT rule attenuates the productivity coefficient to −0.0029 (p = 0.107), while the ESG coefficient remains positive (β = 0.0412, p = 0.002). H1a remains unsupported under every sample definition, but statistical evidence for a negative productivity association is not invariant to the distress exclusion.
Table 10.
Sensitivity to ending the window in 2021 and later ST/PT entry.
Appendix C (Table A3) retains the corrected revenue-mode IV estimates solely as a diagnostic audit. The lagged peer instrument remains weak (first-stage χ2 = 0.05), while the persistent-lag instrument is strongly relevant but has an ambiguous exclusion restriction. The persistence-only and combined second-stage estimates are negative but statistically null (β = −0.0038, p = 0.331, and p = 0.335, respectively); the combined overidentification p-value is 0.146. These results do not corroborate a causal interpretation of the primary association and support no local-average-treatment-effect conclusion [58,59,60].
4.3. Temporally Ordered Channel Tests
Table 11 reports the temporally ordered firm-and-year-FE channel tests. For environmental attention, the indirect term for GTI (t − 1) → EnvAtt(t) → ESG(t + 1) is 0.0010 (delta-method 95% CI [−0.0001, 0.0020], p = 0.071; N = 16,350). The interval includes zero at the pre-specified 5% level, so H2 is not supported under temporal ordering and within-firm identification. The estimate is at most marginal evidence and is not interpreted as mediation.
Table 11.
Temporally ordered channel tests and ATO diagnostics.
For revenue productivity, the raw-ATO indirect term is 0.00010 (95% CI [−0.00011, 0.00030], p = 0.348). In the stricter diagnostic, the productivity index was first residualized on log assets and reconstructed log operating revenue; the ATO indirect term is likewise null (−0.00004, 95% CI [−0.00016, 0.00009], p = 0.557). Neither result supports an independent ATO mechanism. We make no mediated-percentage claim and do not privilege ATO over unobserved operational, governance, or supply-chain channels.
4.4. Firm-Age Moderation Results
Table 12 presents native-scale firm-and-year-FE moderation models and a formal standardized common-sample comparison. On the native scales, the GTI × FirmAge interaction was imprecisely estimated for the productivity index (β = −0.0030, SE = 0.0052; p = 0.572) and positive for ESG (β = 0.1077, SE = 0.0417; p = 0.0098). Figure 2 plots those outcome-specific marginal associations with 95% confidence intervals. On the common standardized scale, the interaction is −0.0031 for productivity (SE = 0.0055, p = 0.573) and 0.0256 for ESG (SE = 0.0099, p = 0.0098). The direct ESG-minus-productivity difference is 0.0287 (SE = 0.0108, 95% CI [0.0075, 0.0500], p = 0.008; N = 19,696; 2932 firms), and the outcome-difference regression yields the same result. H3 is therefore supported by a direct cross-outcome test, not by comparing separate significance decisions. The interaction remains observational and does not establish causal moderation.
Table 12.
Firm-age moderation and standardized cross-outcome interaction test.
Figure 2.
Firm-age moderation of GTI associations with revenue productivity and ESG ratings under firm and year fixed effects. The dark-blue fitted line shows the estimated marginal association, the light-blue shaded band shows the 95% confidence interval, and the colored points mark firm age at −1 SD (blue), the mean (gray), and +1 SD (red).
4.5. Industry Heterogeneity
Table 13 and Table 14 retain the HighTech and factor-intensity split samples as descriptive benchmarks. Under year and industry fixed effects, the corrected revenue-productivity index is statistically null for HighTech firms (β = 0.000) and non-HighTech firms (β = −0.005); their estimated difference is also null (p = 0.528). Using the documented source-based IndType classification, the factor-intensity productivity slopes are −0.001 for labor-intensive firms, approximately zero for asset-/capital-intensive firms, and 0.003 for technology-intensive firms; none is statistically significant. The corresponding ESG slopes are positive in all three separate models (0.192, 0.136, and 0.165; all p < 0.01). These separate-model patterns do not themselves establish different slopes [56].
Table 13.
HighTech versus non-HighTech descriptive benchmarks.
Table 14.
Factor-intensity descriptive benchmarks under the documented source classification.
Table 15 reports the corresponding formal pooled equality tests using firm and year fixed effects, the same source-based classification, and the sample excluding unclassified firm-years. The estimated revenue-productivity slopes are −0.001, −0.004, and −0.004 for labor-, asset-/capital-, and technology-intensive industries, respectively; the joint equality test did not reject equality (χ2 = 0.38, p = 0.826; N = 19,592; 2916 firms). The corresponding ESG slopes are 0.098, 0.073, and 0.017, and their joint equality test rejected equality at 5% (χ2 = 7.30, p = 0.026; N = 19,580; 2916 firms). This is exploratory evidence that the within-firm GTI–ESG association differs across the documented factor-intensity classes, not a pre-specified moderator hypothesis or a causal contrast. The transparent reclassification resolved the construct-provenance issue; inference remains bounded because classes are observational and 131 firm-years fall outside the published mapping.
Table 15.
Formal equality tests under the documented source-based industry classification.
4.6. Supplementary Policy-Salience Evidence Around the 2020 Carbon Neutrality Announcement
Table 16 excludes the 2020 transition year and compares the 2021–2022 full post-announcement period with 2013–2019. With firm and year fixed effects, detailed-industry clustered standard errors, and Webb-weight wild-cluster p-values, the full-sample GTI contrast is −0.050 (SE = 0.033, wild p = 0.227) and the matched-weighted contrast is −0.034 (SE = 0.042, p = 0.469). The corrected revenue-productivity contrasts are imprecise (full β = 0.001, wild p = 0.902; matched β = 0.007, p = 0.473). The full-sample ESG contrast is positive (β = 0.093, SE = 0.046, p = 0.039), while the matched-weighted estimate is statistically null (β = 0.067, SE = 0.059, p = 0.282). Matching with replacement produced 843 treated-control draws containing 843 treated firms and 587 unique controls (1430 unique firms). Each matched draw was counted once in the balance calculation; repeated controls entered the matched panel with the corresponding frequency weights. All eight weighted post-match covariates satisfy |SMD| < 0.10 (largest |SMD| = 0.052; Table 17).
Table 16.
Policy-salience comparison for the full post-announcement period.
Table 17.
Covariate balance for the policy-salience matched sample.
Figure 3 reports weighted 2014–2022 event-study estimates with detailed-industry-clustered 95% confidence intervals and displays 2020 separately as the transition year. Industry-clustered joint pre-policy tests reject the null for GTI at 5% (p = 0.041) but do not reject for corrected revenue productivity (p = 0.113) or ESG (p = 0.090; Table 18). The pre-policy GTI instability, nationwide announcement, nonrandom heavy-pollution classification, and COVID−19 overlap precluded a causal policy interpretation. We therefore treated the full-sample ESG contrast only as contextual policy-salience evidence, especially because the matched estimate is null.
Figure 3.
Weighted policy-salience event study for GTI, revenue productivity, and ESG ratings. Blue dots and solid lines denote estimated event-time coefficients; light-blue vertical intervals denote 95% confidence intervals; the red vertical dashed line marks the 2020 transition; and the gray dotted horizontal line marks zero (the reference).
Table 18.
Industry-clustered joint pre-policy tests for the weighted event study.
5. Discussion
5.1. Summary of Findings
Table 19 summarizes the hypothesis decisions under the designated primary tests. The evidence is asymmetric and inconsistent with a uniform win–win claim. H1a is rejected because the primary within-firm revenue-productivity coefficient is negative rather than positive. H1b is accepted with qualification because the one-year-lag application coefficient is positive, while the granted-patent estimate is only marginal and the two-period-lag estimate is null. For H2, the decision is “Not supported at the 5% level (rejected under the designated criterion).” The temporally ordered environmental-attention indirect-effect confidence interval includes zero. H3 is accepted because the standardized GTI-by-age interaction is significantly larger for ESG than for productivity. These decisions indicate empirical support under the specified tests; they do not establish causal effects or causal mechanisms.
Table 19.
Summary of hypothesis tests and decisions.
The productivity result contrasts with Sun et al. [19], who report a positive relationship between green technological innovation and corporate productivity among Chinese listed firms, but the two findings address different estimands and productivity constructions. In our data, the OP, OLS, and conventional FE productivity indices were positive in pooled benchmarks and null under firm fixed effects, whereas only the corrected nominal revenue-mode LP index was negative in the primary within-firm model. This internal pattern favors an estimand-and-timing explanation over a physical-efficiency-loss mechanism. It is also consistent with the productivity J-curve [18], under which complementary intangible investment, organizational adaptation, and commercialization can delay measured operating gains after an innovation is recorded. The negative coefficient is therefore interpreted as a short-run, construct-specific revenue-productivity association rather than evidence that green innovation destroys productive efficiency.
The positive GTI–ESG association is consistent with Huang, Sun, and Zhang [61], who found that green technology innovation improves ESG performance among Chinese listed companies, and with research linking visible sustainability activity to business-model renewal and reduced greenwashing [14,15]. Our result is deliberately narrower. The Huazheng coefficient remains positive after firm, industry-by-year, and province-by-year fixed effects, but it is strongest for recent patent applications and weaker for granted patents or a two-period lag. This timing pattern is consistent with signaling and legitimacy: current applications are public and timely indicators that can enter external evaluation before productive deployment is complete. Because ESG providers differ in scope, measurement, and weighting [12,13], the coefficient is interpreted as Huazheng rating responsiveness rather than verified environmental improvement.
The channel and contingency results further delimit this interpretation. The EnvAtt indirect-effect confidence interval crosses zero, so the archived MD&A word-count measure is not a sufficient transmission channel. The persistence of the direct ESG coefficient alongside the null EnvAtt path indicates that the rating process may draw on a broader information set—including patent records, company reports, regulatory information, and other public signals—than this single disclosure proxy captures [23]; the data do not identify which component is decisive. The larger age interaction for ESG than for productivity is consistent with accumulated legitimacy making a new patent signal more credible for older firms, whereas age does not accelerate operational conversion. The exploratory industry result—ESG slope differences but no productivity slope differences—is likewise consistent with sector-specific signal materiality rather than production complementarity, but it is not treated as a causal mechanism. The policy-salience estimates remain contextual because the GTI pre-trend fails and the matched ESG contrast is null.
5.2. Theoretical Contributions
First, this study separates an external evaluation outcome from an internal efficiency outcome under the same firm-and-year-FE design. This makes the comparison identified from common within-firm variation and formally tests both the standardized main-slope difference and the standardized age-interaction difference, advancing work that often studies only one outcome or compares coefficients informally [9,14,43,62].
Second, the results qualify signaling and stakeholder accounts. Observable green patent activity is associated with rating improvement within firms, but the absence of a temporally ordered environmental-attention indirect effect means that disclosure attention cannot be claimed as the verified transmission mechanism. This distinction matters in light of rating disagreement and possible greenwashing [12,13,15].
Third, this study makes estimand and construct sensitivity part of the theoretical interpretation. In the submitted design, the positive productivity conclusion came from a pooled model, while the accompanying firm-FE check was already null. Making firm FE primary therefore changed the hypothesis decision before the revenue-mode correction; the subsequent correction changed the primary point estimate from null to negative. The OP, OLS, and conventional FE productivity indices further show positive pooled but null within-firm coefficients. This layered evidence does not establish that green innovation reduces physical efficiency; it redirects the theoretical question toward persistent capability sorting, short-run adjustment costs, implementation horizons, revenue composition, prices, markups, and complementary capabilities [16,17,18,19].
5.3. Practical Implications
5.3.1. Evidence-Based Implications
Managers should not treat additional patent filings as a near-term productivity improvement. The combination of a negative corrected-LP coefficient, null OP and OLS within-firm estimates, and attenuation under stronger fixed effects and alternative preprocessing shows that the short-run finding is specific to the nominal revenue-productivity construction and implementation horizon. This pattern is consistent with adjustment and commercialization lags, not evidence of a physical-efficiency loss. A practical, non-validated screening matrix can keep three axes separate: (i) innovation quality and deployment, including grants, citations, and commercialization milestones; (ii) operational evidence, including asset-utilization trends and realized process changes; and (iii) external evaluation and impact, including provider-specific ESG ratings and verified emissions. A firm with rating improvement but little deployment evidence would be classified as evaluation-responsive rather than efficiency-validated. The matrix is a decision aid, not an index estimated by this study. Policy evaluators should likewise report innovation, environmental, and productivity outcomes separately.
5.3.2. Theory-Motivated Recommendations
The following recommendations follow from theory but were not directly estimated. Labor-intensive firms may prioritize workforce training, modular process redesign, and lower-capital deployment pathways; capital-intensive firms may pair patents with equipment renewal and integration engineering; technology-intensive firms may emphasize scale-up, commercialization, and intellectual property quality. Investors could request patent citation, grant, deployment, and emissions data alongside ratings. Policymakers could combine disclosure standards with commercialization support and skills programs. These segmented strategies are testable propositions, not effects established by the null productivity equality test or the exploratory ESG equality result.
5.4. Within-Firm Identification and the Pooled Benchmark
The 74.7% between-firm share of GTI variance shows that cross-firm information is substantial, but variance shares do not decompose coefficients. The primary revenue-mode within–between model directly estimates a negative within slope (β = −0.0051) and a statistically null conditional between slope (β = −0.0016); the two slopes are not significantly different. It likewise estimates a smaller positive within ESG slope (β = 0.0375) and a larger positive between ESG slope (β = 0.2088). For OP productivity, the direct decomposition instead produces a positive between slope that exceeds the null within slope; the analogous OLS difference is marginal. The difference across productivity indices is itself substantively informative: the original pooled result cannot be generalized to within-firm change, and the revenue-mode LP result cannot be generalized to every productivity construction. These terms remain conditional associations, not causal effects of within-firm innovation changes or stable capabilities.
This contrast does not prove that green innovation reduces productivity. The corrected LP application, grant, and two-period-lag coefficients are negative, but the OP, OLS, and conventional FE alternatives are null under firm FE, higher-dimensional fixed effects attenuate conventional significance, and the ever-ST/PT exclusion also spans zero. This manuscript therefore treated the primary firm-FE estimate as the H1a test, retained pooled estimates only to diagnose why the submitted conclusion changed, used alternative estimators and sample definitions as robustness boundaries, and interpreted every coefficient as noncausal. The contribution of this research is sharper identification of where an association resides, not preservation of the largest or most favorable coefficient.
5.5. Limitations
The corrected revision-stage LP outcome is independently reconstructable from the identified Mark Data inputs, but it is not validated as physical TFP. We corrected the supplied command’s mode mismatch by using levpet’s revenue option, yet the implementation still uses nominal operating revenue without a price deflator and estimates one pooled production function rather than industry-specific technologies. The resulting index can retain price, markup, scale, and accounting effects. This distinction matters because revenue productivity can diverge from physical productivity when producer prices and demand conditions vary [63]. In addition, the functional-dependence identification concern highlighted by Ackerberg, Caves, and Frazer [64] applies to this LP implementation; extending the audit to an ACF estimator is left for future research. The industry-specific revenue-mode diagnostic covers only 7837 of 23,047 study-panel rows and is unsuitable as a primary replacement; a deflated variant could not be estimated because no authoritative deflator series or documented deflator-to-input concordance was available. Reconstructed OP and OLS indices are sensitivity outcomes, not independent construct validation. The corrected pooled revenue-mode index is nearly unrelated to the legacy analytical variable (r = −0.060), demonstrating that the prior stability narrative cannot be retained. Downstream standard errors condition on the estimated productivity index and do not propagate uncertainty from the production-function estimation stage. Appendix Table A1 reports the full decision.
Huazheng ratings are a single provider’s composite measure. The licensed archive contains the overall score but not a complete, consistently defined E/S/G pillar panel, and no second-provider rating is available. We therefore cannot distinguish environmental-pillar improvement from rater responsiveness or rating disagreement. Patent applications similarly measure codified innovation activity, not implementation, commercial success, or realized emissions reduction.
The 2013–2022 sample covers listed Chinese firms, so results may not generalize to private firms or other institutional settings. Firm fixed effects do not remove time-varying confounding, the channel tests are observational, the Appendix C sensitivity contains one plainly weak peer instrument and an exclusion-ambiguous persistence instrument, and the nationwide policy-salience design lacks an untreated policy group. The GTI event-study pre-policy test rejects, and the ever-ST/PT exclusion attenuates the primary negative coefficient. Future work needs validated deflators, sufficiently covered industry technologies, longer post-innovation horizons, verified commercialization and emissions measures, green managerial and organizational innovation measures, multi-provider ESG data, and genuinely exogenous innovation shocks.
6. Conclusions
Using 23,047 firm-year observations from 2933 Chinese A-share firms during 2013–2022, this study finds a negative primary within-firm association between one-year-lagged green patent applications and a corrected LP-based nominal revenue-productivity index, alongside a positive association with subsequent Huazheng ESG ratings. H1a is not supported because it predicted a positive productivity association. H1b is supported in the primary application-based one-year-lag model but is not invariant to the granted-patent proxy or the two-period lag. A direct standardized test shows that firm age strengthens the ESG association more than the productivity association, supporting H3. The pooled-to-firm-FE contrast is analytically meaningful rather than a robustness failure: alternative OP, OLS, and conventional FE productivity indices are positive in pooled benchmarks but null within firms, with a statistically significant OP between–within difference and a marginal OLS difference. Robustness is therefore not uniform across estimands or productivity constructions. Channel and policy analyses remain exploratory or contextual; the industry equality test suggests exploratory ESG heterogeneity but no productivity heterogeneity. The primary productivity index uses the correct revenue mode but remains nominal, pooled, and undeflated; it is not a physical TFP.
Green technology innovation should therefore not be presented as an automatic dual-performance lever, nor should the negative revenue-productivity coefficient be presented as a causal efficiency loss. Visible green innovation may be reflected positively in external ratings while short-run revenue productivity moves in the opposite direction under the primary specification. Managers, investors, and policymakers should evaluate innovation inputs, ESG assessments, commercialization, operational efficiency, prices, and environmental outcomes as distinct objects. The central contribution of this study is a disciplined, construct-bounded asymmetric-association result and a transparent account of what the available panel can—and cannot—identify.
Author Contributions
Conceptualization, D.S. and Y.K.; methodology, D.S.; software, D.S.; validation, D.S. and Y.K.; formal analysis, D.S.; data curation, D.S.; writing—original draft preparation, D.S.; writing—review and editing, Y.K.; supervision, Y.K. All authors have read and agreed to the published version of the manuscript.
Funding
This research received no external funding.
Institutional Review Board Statement
Not applicable.
Informed Consent Statement
Not applicable.
Data Availability Statement
The CSMAR, CNRDS, Sino-Securities Index Huazheng ESG, and Mark Data financial inputs are proprietary and cannot be redistributed by the authors except as permitted by the applicable licenses. The Mark Data public description identifies listed-company annual reports as the source for its five-method data product and states that raw data, results, and do-files are included [45]; it is cited here as a data-source record, not as a methodological authority. The authors retain the portable reconstruction code, execution logs, numerical comparisons, the non-proprietary industry-type crosswalk, source-file hashes, merge and re-estimation code and logs, and model-recheck outputs. Non-proprietary materials are available from the corresponding author upon reasonable request, subject to the applicable provider licenses. Proprietary input workbooks, provider code, derived firm-year productivity data, and other provider-restricted materials cannot be redistributed without permission. The source-level EnvAtt construction materials remain unavailable, as detailed in Appendix B.1.
Acknowledgments
This article is based in part on Chapter 4 of the first author’s doctoral dissertation at Korea University [52]. A related earlier ESG-focused analysis by the same authors, using a substantially overlapping 2013–2022 Chinese A-share sample, was published as Shen and Kim [44]. The present article substantially extends and reassesses that work through a parallel productivity outcome, firm-and-year fixed-effects identification, reconstructed productivity measures, direct cross-outcome tests, and temporally ordered channel analyses.
Conflicts of Interest
The authors declare no conflicts of interest.
Appendix A. Sample Selection and Productivity Reproducibility
The retained merged 2013–2022 panel contains 24,644 firm-year observations. After the construction-stage ST/PT and financial/real estate exclusions and the requirement of complete corrected revenue productivity and GreenApply, 24,300 observations remain. Applying the requirement of at least three valid firm-years yielded the final panel of 23,047 observations for 2933 firms. Continuous variables were then winsorized at 1%/99% on this final panel. Exact calendar-year lag matching and complete-case control requirements yielded 19,708 observations for the productivity model and 19,696 observations for the ESG model, representing 2932 firms. GreenMI was not used as an inclusion, winsorization, lag-construction, or estimation requirement because it appeared in no retained hypothesis or model.
LP revenue-productivity reproducibility. We identified the organizational source of the legacy productivity variables as a Mark Data provider package, but we did not recover the exact historical release that created the legacy analytical values. The preserved materials define output as operating revenue/10,000, capital as net fixed assets/10,000, labor as employee count, the LP proxy input as (operating costs + selling expenses + administrative expenses + financial expenses − depreciation/amortization − cash paid to employees)/10,000, and investment as cash paid to acquire fixed, intangible, and other long-term assets/10,000. Financial firms and IPO-year/pre-IPO observations are excluded; missing depreciation is set to zero; output and labor values at or below zero and investment below zero are set missing; continuous inputs are transformed as ln(x + 1); complete log-input observations are retained; and the log inputs are winsorized annually at the 1st and 99th percentiles. No price deflator was applied.
We first reproduced the supplied pooled command in Stata/MP 18 with levpet 1.0.1 (levpet lnY…, free(lnL) proxy(lnM) capital(lnK)), whose implementation is documented by Petrin, Poi, and Levinsohn [48]. That direct P0 reconstruction remains almost rank-identical to the legacy variable but uses levpet’s default value-added mode despite operating revenue being the dependent variable. We therefore executed the corrected P1 command levpet lnY…, free(lnL) proxy(lnM) capital(lnK) revenue reps(50). It returned code 0, used 58,454 observations from 5690 eligible firms, and produced finite coefficients (labor = 0.121761, capital = 0.021601, intermediate input = 0.862937). The package printed 5691 groups after restoring the full 61,081-row provider panel; the one-group difference reflects one additional firm with a single ineligible observation, not a missing or invalid identifier. The Stata predict command generated values for all 61,081 complete-input rows, including 2627 outside e(sample) because of ST, *ST, or suspended-listing status. The construction-stage screen removed firms already designated ST/PT, whereas LP e(sample) eligibility was determined observation by observation for the production-function estimation; firms entering ST or *ST status later could therefore remain in the study panel while those firm-years fell outside e(sample). Of the 19,708 primary-regression rows, 355 were documented full-panel predictions outside e(sample), all corresponding to retained ST or *ST firm-years. Restricting the primary regression to e(sample)-eligible source rows leaves the negative sign and 5% decision unchanged (β = −0.0035, SE = 0.0017, p = 0.045; 95% CI [−0.0069, −0.0001]; N = 19,353; 2930 firms). The corrected values matched all 23,047 rows of the rebuilt study panel and were winsorized once at 1%/99% on that panel. The same exact-calendar-year lag and complete-case rules then yielded 19,708 observations and 2932 firms in the primary regression.
Correcting the software mode changed the scientific conclusion. The corrected P1 series is nearly unrelated to the legacy analytical variable (Pearson r = −0.0602). On the final GreenMI-free analytical panel, the primary firm-and-year-FE coefficient is β = −0.002198 (SE = 0.002610, p = 0.400) for the legacy variable, β = −0.002190 (SE = 0.002586, p = 0.397) for the direct default-mode P0 reconstruction, and β = −0.003596 (SE = 0.001733, p = 0.038) for the corrected revenue-mode P1 reconstruction. These final regenerated values match Table A1 and the main P1 estimate in Table 4. P1 replaces both earlier series in every headline productivity analysis, table, figure, discussion, and conclusion. Reconstructed OP and OLS variants follow the provider formulas and remain sensitivity indices only; the OP implementation is documented by Yasar, Raciborski, and Poi [51].
We also attempted P2 industry-specific revenue-mode estimation using a pre-declared minimum of 250 observations, 30 firms, and eight years per two-digit industry. Thirty-six of 85 cells met the threshold, but only 19 yielded all three production coefficients, seven of those reached a coefficient boundary, 13 returned only partial coefficients, and four failed. P2 covered 7837 of 23,047 study-panel rows and 6755 observations from 1055 firms in the downstream primary model, so it is an incomplete exploratory audit rather than an alternative primary measure. P3 deflated revenue productivity was not executed because no authoritative provider- or author-supplied industry-year deflator series or documented deflator-to-input concordance was available; no deflator was downloaded, fabricated, or silently imputed. Table A1 records this decision. The retained revision-stage reproducibility record contains aggregate commands, counts, hashes, comparisons, and model results; access to provider inputs, provider code, and derived firm-year values remains subject to written license permission.
Table A1.
LP construct-validity decision and corrected-sensitivity comparison.
Pooled-versus-within productivity audit. Appendix Table A2 holds the sample, focal lag, controls, winsorization, and clustering rule constant while comparing pooled year-and-industry-FE and firm-and-year-FE estimates for the corrected revenue-mode LP index and directly reconstructed OP, OLS, and conventional FE indices. It also reports direct within–between slopes rather than treating the pooled coefficient as a between estimator. The OP and OLS have positive pooled slopes, null within-firm slopes, and statistically larger between than within slopes; the conventional FE index has the same pooled-positive/within-null pattern but a nonsignificant slope difference. The corrected revenue-mode LP pattern is different. This audit explains the estimand transition and bounds generalization across productivity constructions; it was not used to select a favorable measure or to restore H1a.
Table A2.
Pooled-versus-within estimand audit across reconstructed productivity indices.
Appendix B. Variable Construction Details
This appendix documents the environmental-attention channel, the ATO accounting diagnostic, and the industry classifier used in the revised analysis.
Appendix B.1. Environmental Attention (EnvAtt)
The archived documentation defines EnvAtt as the natural log of one plus the count of environment-related keywords in the firm’s annual MD&A and states that the measure uses a 64-term Chinese-language dictionary reported by Wu and Hua [36]. The archived analytical panel contains the resulting firm-year variable, but the current archive does not include the dictionary itself, the text-processing script, the underlying MD&A corpus, a document-length measure, or a missing-text handling log. The precise term composition, tokenization, length normalization, and missing-text treatment therefore cannot be independently verified or reconstructed from the available files. Exact reconstruction requires those author-provided source materials; no unverified imputation rule or missing-text rate is reported.
Appendix B.2. Industry-Type Classification (IndType)
We replaced the archived IndType assignments with a documented source-based annual classification. The 2000–2024 source dataset contains 84,336 firm-year rows, annual two-digit CSRC codes, and mutually exclusive labor-, asset-/capital-, and technology-intensive indicators. The Excel range Sheet1!A1:AG84337 contains one header row and 84,336 data rows; its Stata/MP 18 counterpart contains the same 33 variables. The firm-year keys, industry codes, and three intensity indicators agree record by record across the two formats, with no duplicate keys, cell-level discrepancies in the audited fields, or multiple-class assignments. The indicator values reproduced all 67 code assignments in Table 5 of Yin, Sheng, and Li [54], who used SPSS 19.0 Ward hierarchical clustering with the fixed-asset ratio and the R&D-to-payroll ratio under the 2012 CSRC industry system [55].
We merged the source classification to the 23,047-row study panel by stock code and year; all records matched. The annual source-record code and its accompanying published class indicator were used together rather than recombining values from two sources, preserving the source’s contemporaneous classification rule. Of 23,047 firm-years, 22,916 were classified as the following: 6181 labor-intensive, 4228 asset-/capital-intensive, and 12,507 technology-intensive. The 131 unclassified firm-years—B10 (5), C42 (30), E47 (15), O80 (4), and Q83 (77)—fall outside the published 67-code mapping and were excluded from all IndType models rather than assigned by inference.
The complete published crosswalk is as follows. Labor-intensive (40 codes): A01, A02, A03, A05, B06, B08, B09, C13, C14, C15, C17, C18, C19, C20, C21, C23, C24, C32, C34, D46, E48, E49, E50, F51, F52, G53, G54, G58, G59, I63, I64, K70, L72, M73, M75, N78, P82, R85, R87, and S90. Asset-/capital-intensive (14 codes): A04, B07, B11, C22, C25, C26, C28, C30, C31, D44, D45, G55, G56, and R86. Technology-intensive (13 codes): C27, C29, C33, C35, C36, C37, C38, C39, C40, C41, I65, M74, and N77.
Among 21,019 classified observations for which the archived assignment is also available, the archived and source-based assignments agree for 78.84%. Sixteen of 49 overlapping codes change class: B07, C23, C24, C29, C32, C33, C34, D44, D45, I63, I64, L72, M73, M75, N77, and N78. We therefore did not retain the archived assignments as the operative measure. Table 14 and Table 15 were re-estimated from the source-based classification, and the supplementary record reports the complete crosswalk, unclassified codes, source hashes, merge audit, scripts, log, and model results. The revised classification resolves the provenance limitation. The formal productivity equality test remains null, while the exploratory ESG equality test rejects equal slopes; neither result establishes causal industry moderation.
Appendix B.3. ATO (Asset Turnover)
ATO = Operating revenue/Total assets, computed from firm financial statement data. When the ATO was evaluated as a channel diagnostic, it was removed from the outcome equation’s control vector to avoid double-counting. Because the reconstructed LP index is revenue-based, ATO and TFP_LP share accounting components. Table 11 first used the productivity index (TFP_LP) and then applied a stricter outcome-side diagnostic: log operating revenue was reconstructed as Size + ln(ATO) for positive ATO, and TFP_LP was projected on reconstructed log revenue and log total assets with year and industry effects. The resulting productivity-index residual was used as the t + 1 outcome in the second ATO path. This residual is not a new production-function estimate, and the indirect term is not interpreted as causal mediation.
Appendix B.4. Historical Contemporaneous Channel Diagnostics
The previous manuscript tested three additional candidate productivity mediators using contemporaneous OLS with year and industry dummies and 200 firm-cluster bootstrap replications. These 200 draws apply only to the historical Mfee/Cashflow/INST screening. They are not the 1000-draw firm-cluster bootstrap used for the v7 core EnvAtt/ATO paths, as verified from the preserved configuration and revision record. The two counts therefore describe different analyses rather than alternative provenance for the same interval. These historical calculations used the legacy provider productivity variable and were not rerun as part of the reconstructed-outcome analysis. They are retained only as an explicitly labeled audit trail, are excluded from all revised inferences, and do not enter any table, figure, hypothesis decision, or conclusion. Their contemporaneous timing does not match the revised lagged design, and null results for three observed variables cannot establish that another variable is the dominant mechanism.
Management cost (Mfee) fails the a path (a = 0.0001, p = 0.84; indirect = −0.00027; bootstrap 95% CI [−0.0025, 0.0025]). Operating cash flow fails both paths (a = 0.0004, p = 0.60; b = −0.0430, p = 0.42; indirect = −0.00002; bootstrap 95% CI [−0.0002, 0.0000]). Institutional ownership has sign-inconsistent a and b paths (a = −0.0075, p = 0.04; b = −0.0549, p = 0.002) and only marginal indirect evidence (a·b = 0.00041; Sobel p = 0.09).
None of the three candidates shows the predicted positive two-path pattern. This does not validate the ATO: the temporally ordered ATO terms in Table 11 are statistically null, and unobserved operational, technological, governance, and supply-chain channels remain possible.
Appendix C. First-Stage and Validity Diagnostics for IV-2SLS
The corrected IV sensitivity aligns the endogenous regressor with the baseline model: GTI (t − 1) is instrumented by GTI (t − 2), the lagged leave-one-out industry-year peer mean, or both. Every model includes the full control vector and year and industry fixed effects and clusters inference by firm. The IV-A first stage is:
Table A3.
Sensitivity and validity diagnostics.
IV-A uses GTI (t − 2) and has a cluster-robust first-stage Wald χ2 of 6361.06 (p < 0.001). IV-B uses the lagged peer mean and has a first-stage Wald χ2 of only 0.05, demonstrating that this instrument is not relevant once year and industry fixed effects are included. IV-C combines both instruments and has a first-stage Wald χ2 of 6408.99 (p < 0.001), driven by GTI persistence. The joint model’s overidentification test does not reject (p = 0.146), but this is not evidence that the exclusion restrictions hold. Although the Durbin–Wu–Hausman test rejects regressor exogeneity in IV-C (p = 0.024), that diagnostic requires a valid instrument set and therefore does not validate a design containing a weak peer instrument and an exclusion-ambiguous persistence instrument. We retain the IV estimates only as appendix diagnostics.
These diagnostics reinforce the conservative interpretation in Section 4.2. GTI (t − 2) is a proxy for persistent firm innovation capacity and can affect later outcomes through channels other than GTI (t − 1). The lagged peer mean can transmit industry-level regulation, demand, and technology shocks and is empirically weak in the corrected specification. Neither instrument supplies a defensible causal design, irrespective of the joint test’s non-rejection; no post hoc LATE subgroup analysis was used to rescue them.
References
- Porter, M.E.; van der Linde, C. Toward a New Conception of the Environment-Competitiveness Relationship. J. Econ. Perspect. 1995, 9, 97–118. [Google Scholar] [CrossRef] [Scilit]
- Hart, S.L. A Natural-Resource-Based View of the Firm. Acad. Manag. Rev. 1995, 20, 986–1014. [Google Scholar] [CrossRef] [Scilit]
- OECD. Sustainable Manufacturing and Eco-Innovation: Framework, Measurement and Industry and Policy Practices—Synthesis Report; OECD: Paris, France, 2009; Available online: https://one.oecd.org/document/DSTI/IND%282009%295/en/pdf (accessed on 16 August 2026).
- Rennings, K. Redefining Innovation—Eco-Innovation Research and the Contribution from Ecological Economics. Ecol. Econ. 2000, 32, 319–332. [Google Scholar] [CrossRef] [Scilit]
- Ambec, S.; Cohen, M.A.; Elgie, S.; Lanoie, P. The Porter Hypothesis at 20: Can Environmental Regulation Enhance Innovation and Competitiveness? Rev. Environ. Econ. Policy 2013, 7, 2–22. [Google Scholar] [CrossRef] [Scilit]
- Hart, S.L.; Dowell, G. Invited Editorial: A Natural-Resource-Based View of the Firm: Fifteen Years After. J. Manag. 2011, 37, 1464–1479. [Google Scholar] [CrossRef] [Scilit]
- Horbach, J. Determinants of Environmental Innovation—New Evidence from German Panel Data Sources. Res. Policy 2008, 37, 163–173. [Google Scholar] [CrossRef] [Scilit]
- Cai, W.; Zhou, X. On the Drivers of Eco-Innovation: Empirical Evidence from China. J. Clean. Prod. 2014, 79, 239–248. [Google Scholar] [CrossRef] [Scilit]
- Xie, X.; Huo, J.; Zou, H. Green Process Innovation, Green Product Innovation, and Corporate Financial Performance: A Content Analysis Method. J. Bus. Res. 2019, 101, 697–706. [Google Scholar] [CrossRef] [Scilit]
- Albertini, E. Does Environmental Management Improve Financial Performance? A Meta-Analytical Review. Organ. Environ. 2013, 26, 431–457. [Google Scholar] [CrossRef] [Scilit]
- Endrikat, J.; Guenther, E.; Hoppe, H. Making Sense of Conflicting Empirical Findings: A Meta-Analytic Review of the Relationship Between Corporate Environmental and Financial Performance. Eur. Manag. J. 2014, 32, 735–751. [Google Scholar] [CrossRef] [Scilit]
- Berg, F.; Koelbel, J.F.; Rigobon, R. Aggregate Confusion: The Divergence of ESG Ratings. Rev. Financ. 2022, 26, 1315–1344. [Google Scholar] [CrossRef] [Scilit]
- Christensen, D.M.; Serafeim, G.; Sikochi, A. Why Is Corporate Virtue in the Eye of the Beholder? The Case of ESG Ratings. Account. Rev. 2022, 97, 147–175. [Google Scholar] [CrossRef] [Scilit]
- Zhang, C.; Tang, J.; Zhang, S.; He, B. From Responsibility to Renewal: How Does ESG Practice Promote Sustainable Business Model Innovation? Sustainability 2025, 17, 7965. [Google Scholar] [CrossRef] [Scilit]
- Ma, Y.; Feng, G.-F.; Yin, Z.; Chang, C.-P. ESG Disclosures, Green Innovation, and Greenwashing: All for Sustainable Development? Sustain. Dev. 2025, 33, 1797–1815. [Google Scholar] [CrossRef] [Scilit]
- Cohen, W.M.; Levinthal, D.A. Absorptive Capacity: A New Perspective on Learning and Innovation. Adm. Sci. Q. 1990, 35, 128–152. [Google Scholar] [CrossRef] [Scilit]
- Hall, B.H.; Mairesse, J.; Mohnen, P. Measuring the Returns to R&D. In Handbook of the Economics of Innovation; Hall, B.H., Rosenberg, N., Eds.; Elsevier: Amsterdam, The Netherlands, 2010; Volume 2, pp. 1033–1082. [Google Scholar] [CrossRef] [Scilit]
- Brynjolfsson, E.; Rock, D.; Syverson, C. The Productivity J-Curve: How Intangibles Complement General Purpose Technologies. Am. Econ. J. Macroecon. 2021, 13, 333–372. [Google Scholar] [CrossRef] [Scilit]
- Sun, J.; Hou, S.; Deng, Y.; Li, H. New Media Environment, Green Technological Innovation and Corporate Productivity: Evidence from Listed Companies in China. Energy Econ. 2024, 131, 107395. [Google Scholar] [CrossRef] [Scilit]
- Hu, J.; Pan, X.; Huang, Q. Quantity or Quality? The Impacts of Environmental Regulation on Firms’ Innovation—Quasi-Natural Experiment Based on China’s Carbon Emissions Trading Pilot. Technol. Forecast. Soc. Change 2020, 158, 120122. [Google Scholar] [CrossRef] [Scilit]
- Zhang, Y.-J.; Peng, Y.-L.; Ma, C.-Q.; Shen, B. Can Environmental Innovation Facilitate Carbon Emissions Reduction? Evidence from China. Energy Policy 2017, 100, 18–28. [Google Scholar] [CrossRef] [Scilit]
- Xi, J. Statement by H.E. Xi Jinping, President of the People’s Republic of China, at the General Debate of the 75th Session of the United Nations General Assembly. 22 September 2020. Available online: https://www.mfa.gov.cn/eng/xw/zyjh/202405/t20240530_11341451.html (accessed on 16 August 2026).
- Sino-Securities Index Information Service (Shanghai) Co., Ltd. Sino-Securities Index ESG Ratings Methodology, Version 2.1. May 2024. Available online: https://www.chindices.com/files/Sino-Securities%2BIndex%2BESG%2BRatings%2BMethodology%2BV2.1.pdf (accessed on 2 August 2026).
- Aghion, P.; Dechezleprêtre, A.; Hémous, D.; Martin, R.; Van Reenen, J. Carbon Taxes, Path Dependency, and Directed Technical Change: Evidence from the Auto Industry. J. Political Econ. 2016, 124, 1–51. [Google Scholar] [CrossRef] [Scilit]
- Calel, R.; Dechezleprêtre, A. Environmental Policy and Directed Technological Change: Evidence from the European Carbon Market. Rev. Econ. Stat. 2016, 98, 173–191. [Google Scholar] [CrossRef] [Scilit]
- Haščič, I.; Migotto, M. Measuring Environmental Innovation Using Patent Data; OECD Environment Working Papers, No. 89; OECD Publishing: Paris, France, 2015. [Google Scholar] [CrossRef]
- World Intellectual Property Organization. IPC Green Inventory. Available online: https://www.wipo.int/classifications/ipc/green-inventory/home (accessed on 2 August 2026).
- Russo, M.V.; Fouts, P.A. A Resource-Based Perspective on Corporate Environmental Performance and Profitability. Acad. Manag. J. 1997, 40, 534–559. [Google Scholar] [CrossRef] [Scilit]
- Lanoie, P.; Laurent-Lucchetti, J.; Johnstone, N.; Ambec, S. Environmental Policy, Innovation and Performance: New Insights on the Porter Hypothesis. J. Econ. Manag. Strategy 2011, 20, 803–842. [Google Scholar] [CrossRef] [Scilit]
- Henri, J.-F.; Journeault, M. Eco-Control: The Influence of Management Control Systems on Environmental and Economic Performance. Account. Organ. Soc. 2010, 35, 63–80. [Google Scholar] [CrossRef] [Scilit]
- Barney, J. Firm Resources and Sustained Competitive Advantage. J. Manag. 1991, 17, 99–120. [Google Scholar] [CrossRef] [Scilit]
- Suchman, M.C. Managing Legitimacy: Strategic and Institutional Approaches. Acad. Manag. Rev. 1995, 20, 571–610. [Google Scholar] [CrossRef] [Scilit]
- Spence, M. Job Market Signaling. Q. J. Econ. 1973, 87, 355–374. [Google Scholar] [CrossRef] [Scilit]
- Ocasio, W. Towards an Attention-Based View of the Firm. Strateg. Manag. J. 1997, 18, 187–206. [Google Scholar] [CrossRef] [Scilit]
- Bansal, P. Evolving Sustainably: A Longitudinal Study of Corporate Sustainable Development. Strateg. Manag. J. 2005, 26, 197–218. [Google Scholar] [CrossRef] [Scilit]
- Wu, J.; Hua, X. Top Management Team Attention and Corporate Green Innovation Strategy: Evidence from Chinese Manufacturing Listed Firms. Sci. Sci. Manag. S T 2021, 42, 122–142. (In Chinese) [Google Scholar]
- Walker, K.; Wan, F. The Harm of Symbolic Actions and Green-Washing: Corporate Actions and Communications on Environmental Performance and Their Financial Implications. J. Bus. Ethics 2012, 109, 227–242. [Google Scholar] [CrossRef] [Scilit]
- Acemoglu, D.; Restrepo, P. The Race between Man and Machine: Implications of Technology for Growth, Factor Shares, and Employment. Am. Econ. Rev. 2018, 108, 1488–1542. [Google Scholar] [CrossRef] [Scilit]
- Anderson, P.; Tushman, M.L. Organizational Environments and Industry Exit: The Effects of Uncertainty, Munificence and Complexity. Ind. Corp. Change 2001, 10, 675–711. [Google Scholar] [CrossRef] [Scilit]
- Syverson, C. What Determines Productivity? J. Econ. Lit. 2011, 49, 326–365. [Google Scholar] [CrossRef] [Scilit]
- Ministry of Environmental Protection, General Office. Notice on Issuing the Industry Classification Management Catalogue for Environmental-Protection Verification of Listed Companies; Huanbanhan [2008] No. 373; Ministry of Environmental Protection, General Office: Beijing, China, 2008. Available online: https://www.mee.gov.cn/gkml/hbb/bgth/200910/t20091022_174891.htm (accessed on 2 August 2026). (In Chinese)
- Zhang, L.; Luo, Z.; Yu, X.; Yang, Q.; Wang, J. Economic Policy Uncertainty and Corporate Green Innovation. Int. Rev. Financ. Anal. 2025, 97, 103797. [Google Scholar] [CrossRef] [Scilit]
- Ding, H.; Han, W.; Wang, Z. Environmental, Social and Corporate Governance (ESG) and Total Factor Productivity: The Mediating Role of Financing Constraints and R&D Investment. Sustainability 2024, 16, 9500. [Google Scholar] [CrossRef] [Scilit]
- Shen, D.J.; Kim, Y.J. Can Green Innovation Promote ESG Performance? Evidence from China. Int. Bus. Rev. (국제경영리뷰) 2024, 28, 75–96, Korean Academy of International Business Management; ISSN 1598-4869. Available online: https://www.kci.go.kr/kciportal/ci/sereArticleSearch/ciSereArtiView.kci?sereArticleSearchBean.artiId=ART003158797 (accessed on 17 August 2026).
- Mark Data. Listed Companies. Total Factor Productivity (1999–2023): Data and Estimates Using Five Methods. Available online: https://www.macrodatas.cn/article/1147472909 (accessed on 2 August 2026). (In Chinese)
- Levinsohn, J.; Petrin, A. Estimating Production Functions Using Inputs to Control for Unobservables. Rev. Econ. Stud. 2003, 70, 317–341. [Google Scholar] [CrossRef] [Scilit]
- Olley, G.S.; Pakes, A. The Dynamics of Productivity in the Telecommunications Equipment Industry. Econometrica 1996, 64, 1263–1297. [Google Scholar] [CrossRef] [Scilit]
- Petrin, A.; Poi, B.P.; Levinsohn, J. Production Function Estimation in Stata Using Inputs to Control for Unobservables. Stata J. 2004, 4, 113–123. [Google Scholar] [CrossRef] [Scilit]
- Lu, X.; Lian, Y. Estimation of Total Factor Productivity of Industrial Enterprises in China: 1999–2007. China Econ. Q. 2012, 11, 541–558. (In Chinese) [Google Scholar]
- Van Beveren, I. Total Factor Productivity Estimation: A Practical Review. J. Econ. Surv. 2012, 26, 98–128. [Google Scholar] [CrossRef] [Scilit]
- Yasar, M.; Raciborski, R.; Poi, B.P. Production Function Estimation in Stata Using the Olley and Pakes Method. Stata J. 2008, 8, 221–231. [Google Scholar] [CrossRef] [Scilit]
- Shen, D. Two Empirical Essays on Green Innovation: The Role of Executives’ IT Background and the Impact on ESG Performance. Ph.D. Thesis, Graduate School of Management of Technology, Korea University, Seoul, Republic of Korea, August 2025. Korea University dCollection Institutional Repository. Available online: http://www.dcollection.net/handler/korea/000000305842 (accessed on 17 August 2026).
- Liu, B.; Qiu, Z.; Ren, B. Artificial Intelligence and High-Quality Development of Enterprises: Empirical Evidence from National Pilot Zones for New-Generation Artificial Intelligence Innovation and Development. China Soft Sci. 2025, 6, 166–176. (In Chinese) [Google Scholar] [CrossRef] [Scilit]
- Yin, M.; Sheng, L.; Li, W. Executive Incentive, Innovation Input and Corporate Performance: An Empirical Study Based on Endogeneity and Industry Categories. Nankai Bus. Rev. 2018, 21, 109–117. (In Chinese) [Google Scholar]
- China Securities Regulatory Commission. Guidelines for the Industry Classification of Listed Companies (2012 Revision); CSRC Announcement [2013] No. 31; CSRC: Beijing, China, 2012. Available online: https://www.csrc.gov.cn/csrc/c101864/c1024632/content.shtml (accessed on 2 August 2026). (In Chinese)
- Gelman, A.; Stern, H. The Difference Between “Significant” and “Not Significant” Is Not Itself Statistically Significant. Am. Stat. 2006, 60, 328–331. [Google Scholar] [CrossRef] [Scilit]
- Austin, P.C. Balance Diagnostics for Comparing the Distribution of Baseline Covariates Between Treatment Groups in Propensity-Score Matched Samples. Stat. Med. 2009, 28, 3083–3107. [Google Scholar] [CrossRef] [Scilit] [PubMed]
- Imbens, G.W.; Angrist, J.D. Identification and Estimation of Local Average Treatment Effects. Econometrica 1994, 62, 467–475. [Google Scholar] [CrossRef] [Scilit]
- Heckman, J.J.; Urzúa, S. Comparing IV with Structural Models: What Simple IV Can and Cannot Identify. J. Econom. 2010, 156, 27–37. [Google Scholar] [CrossRef] [Scilit]
- Mogstad, M.; Torgovitsky, A. Identification and Extrapolation of Causal Effects with Instrumental Variables. Annu. Rev. Econ. 2018, 10, 577–613. [Google Scholar] [CrossRef] [Scilit]
- Huang, J.; Sun, Y.; Zhang, S. Green Technology Innovation and Corporate ESG—Evidence Based on Listed Companies in China. Sustainability 2025, 17, 1410. [Google Scholar] [CrossRef] [Scilit]
- Tang, M.; Walsh, G.; Lerner, D.; Fitza, M.A.; Li, Q. Green Innovation, Managerial Concern and Firm Performance: An Empirical Study. Bus. Strategy Environ. 2018, 27, 39–51. [Google Scholar] [CrossRef] [Scilit]
- Foster, L.; Haltiwanger, J.; Syverson, C. Reallocation, Firm Turnover, and Efficiency: Selection on Productivity or Profitability? Am. Econ. Rev. 2008, 98, 394–425. [Google Scholar] [CrossRef] [Scilit]
- Ackerberg, D.A.; Caves, K.; Frazer, G. Identification Properties of Recent Production Function Estimators. Econometrica 2015, 83, 2411–2451. [Google Scholar] [CrossRef] [Scilit]
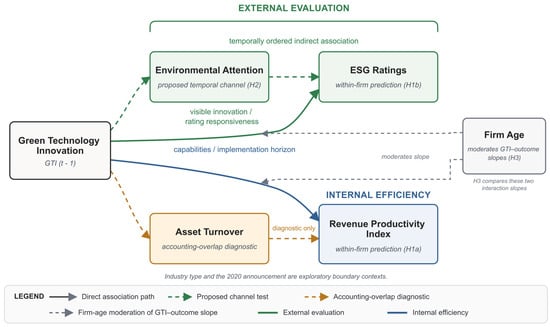
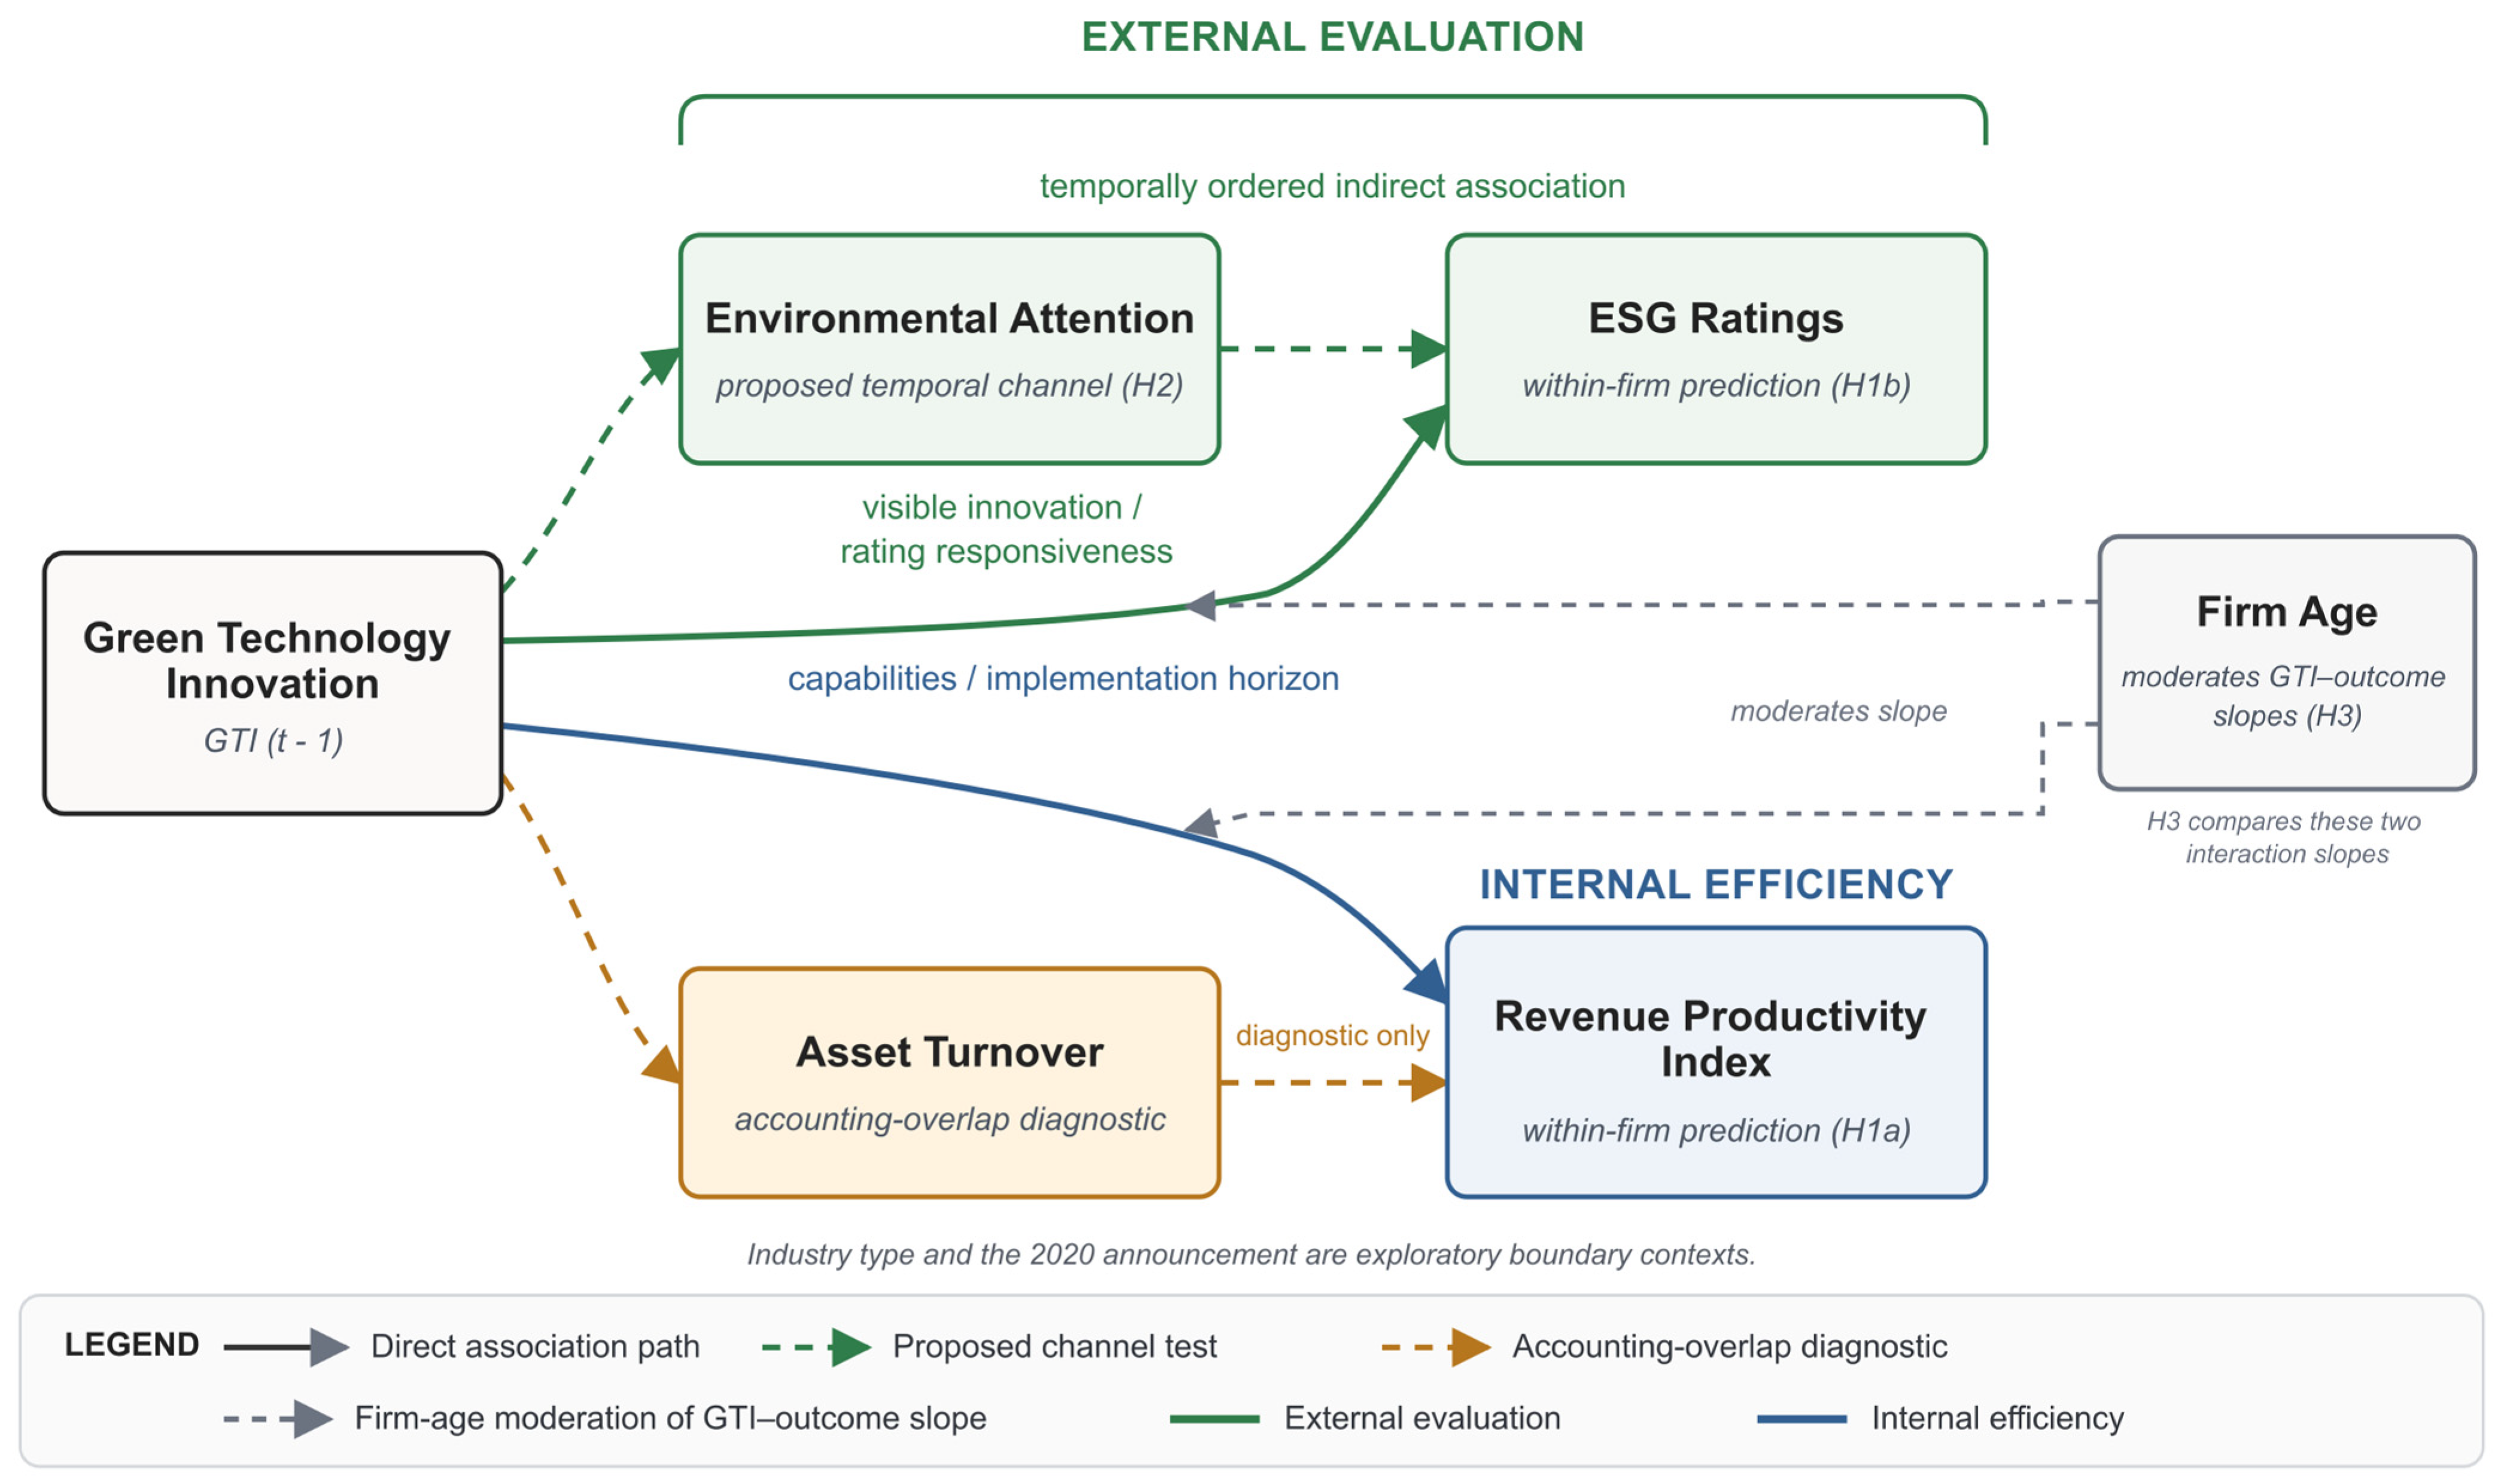
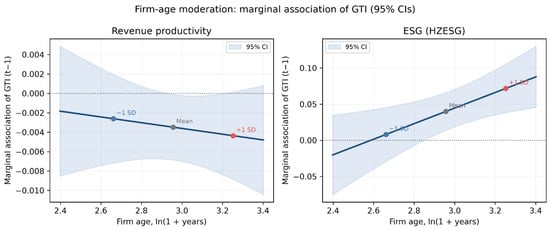
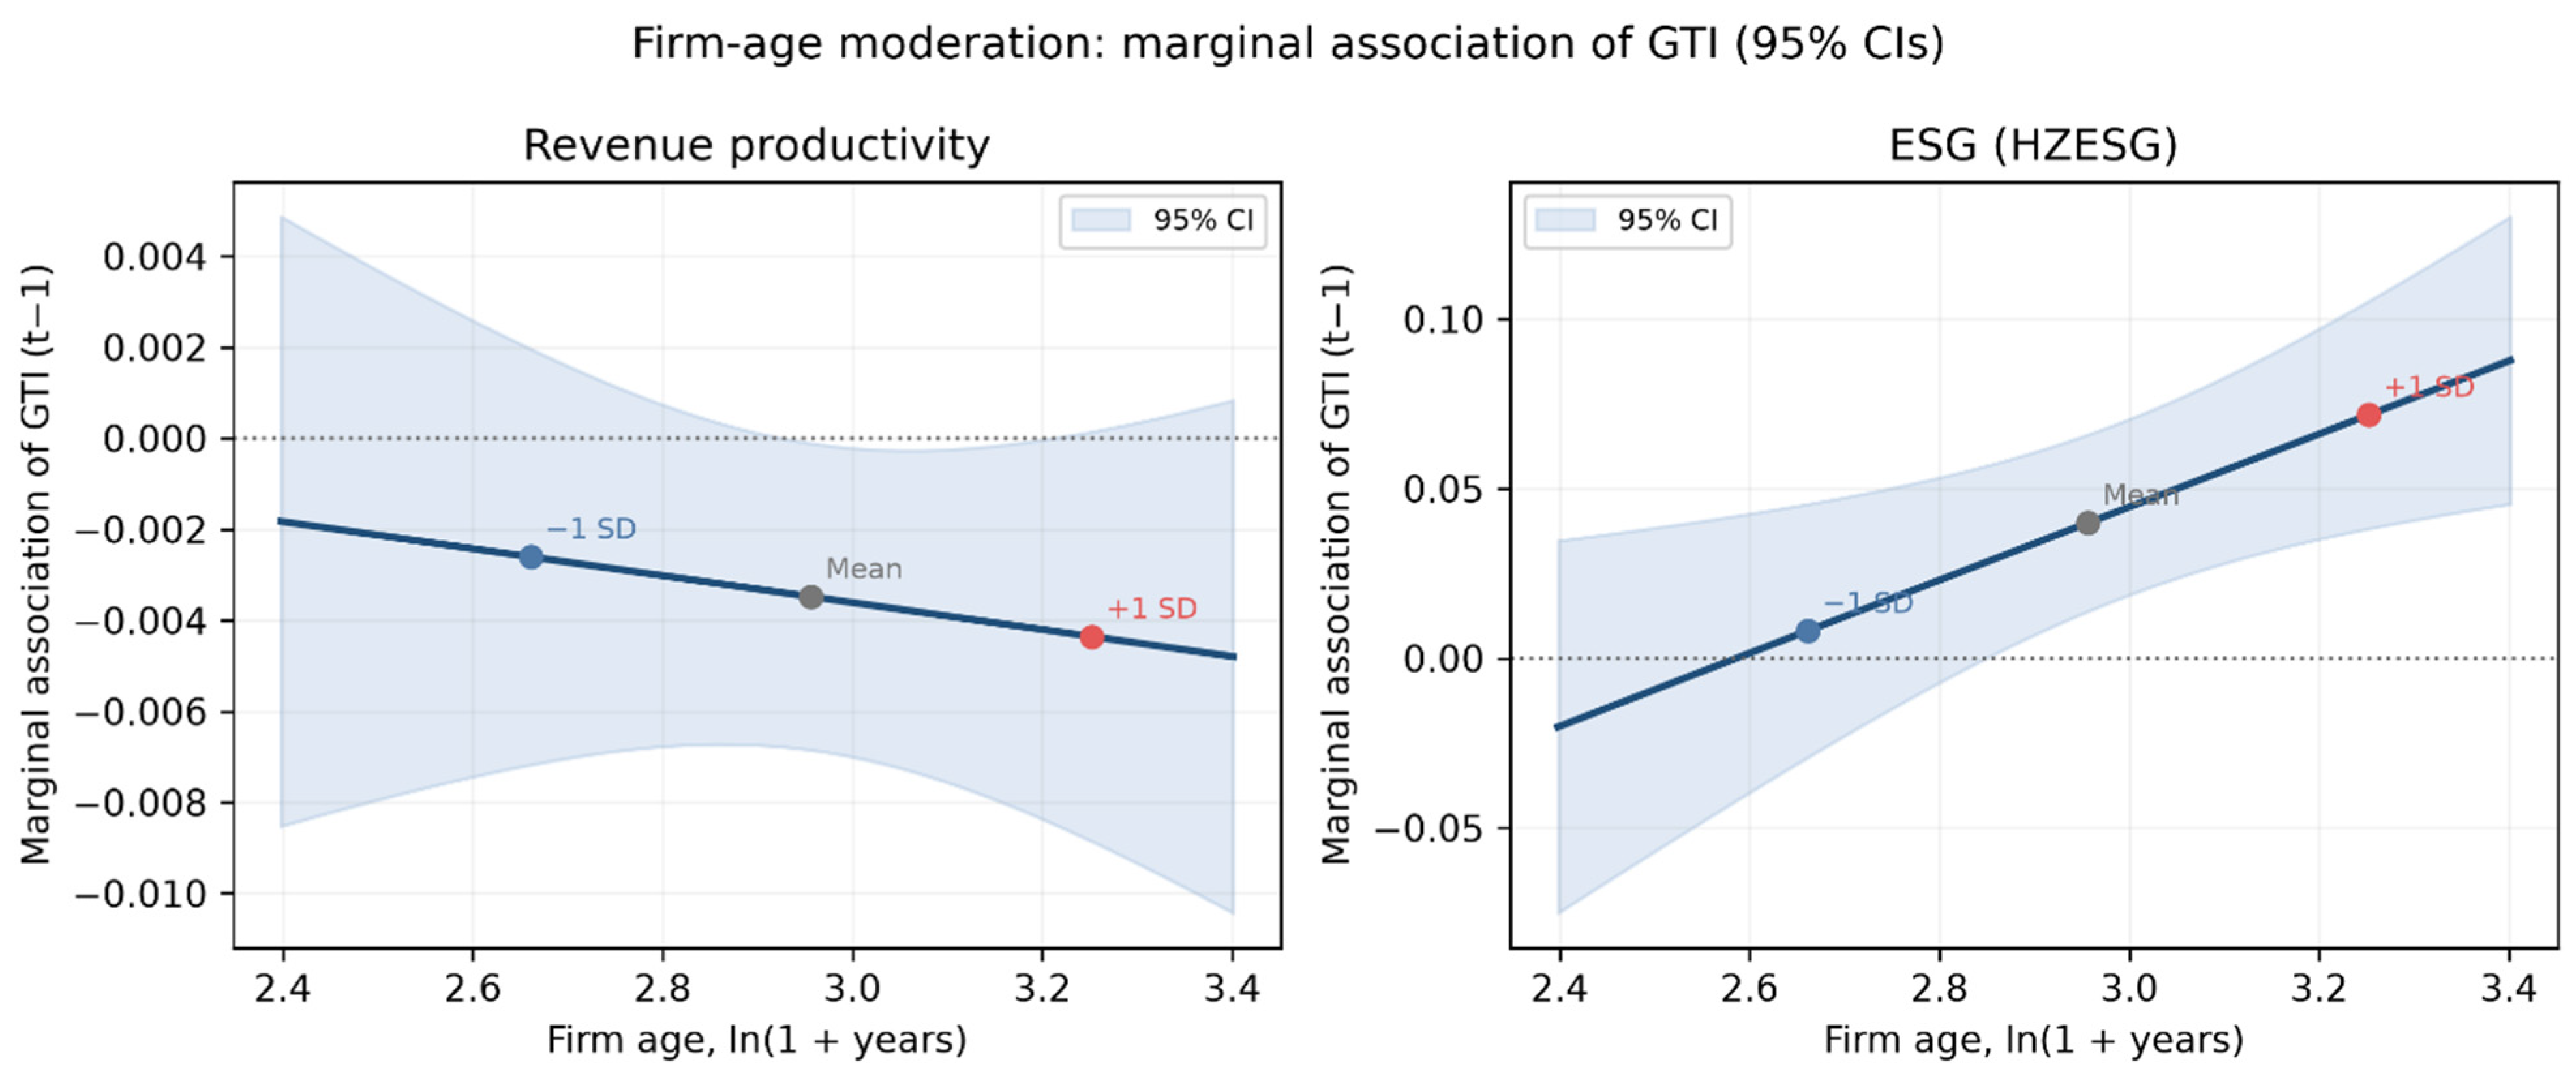
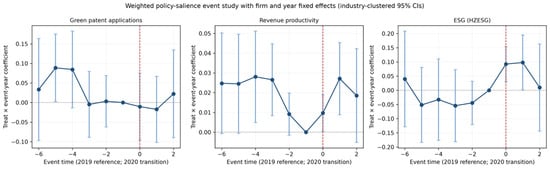
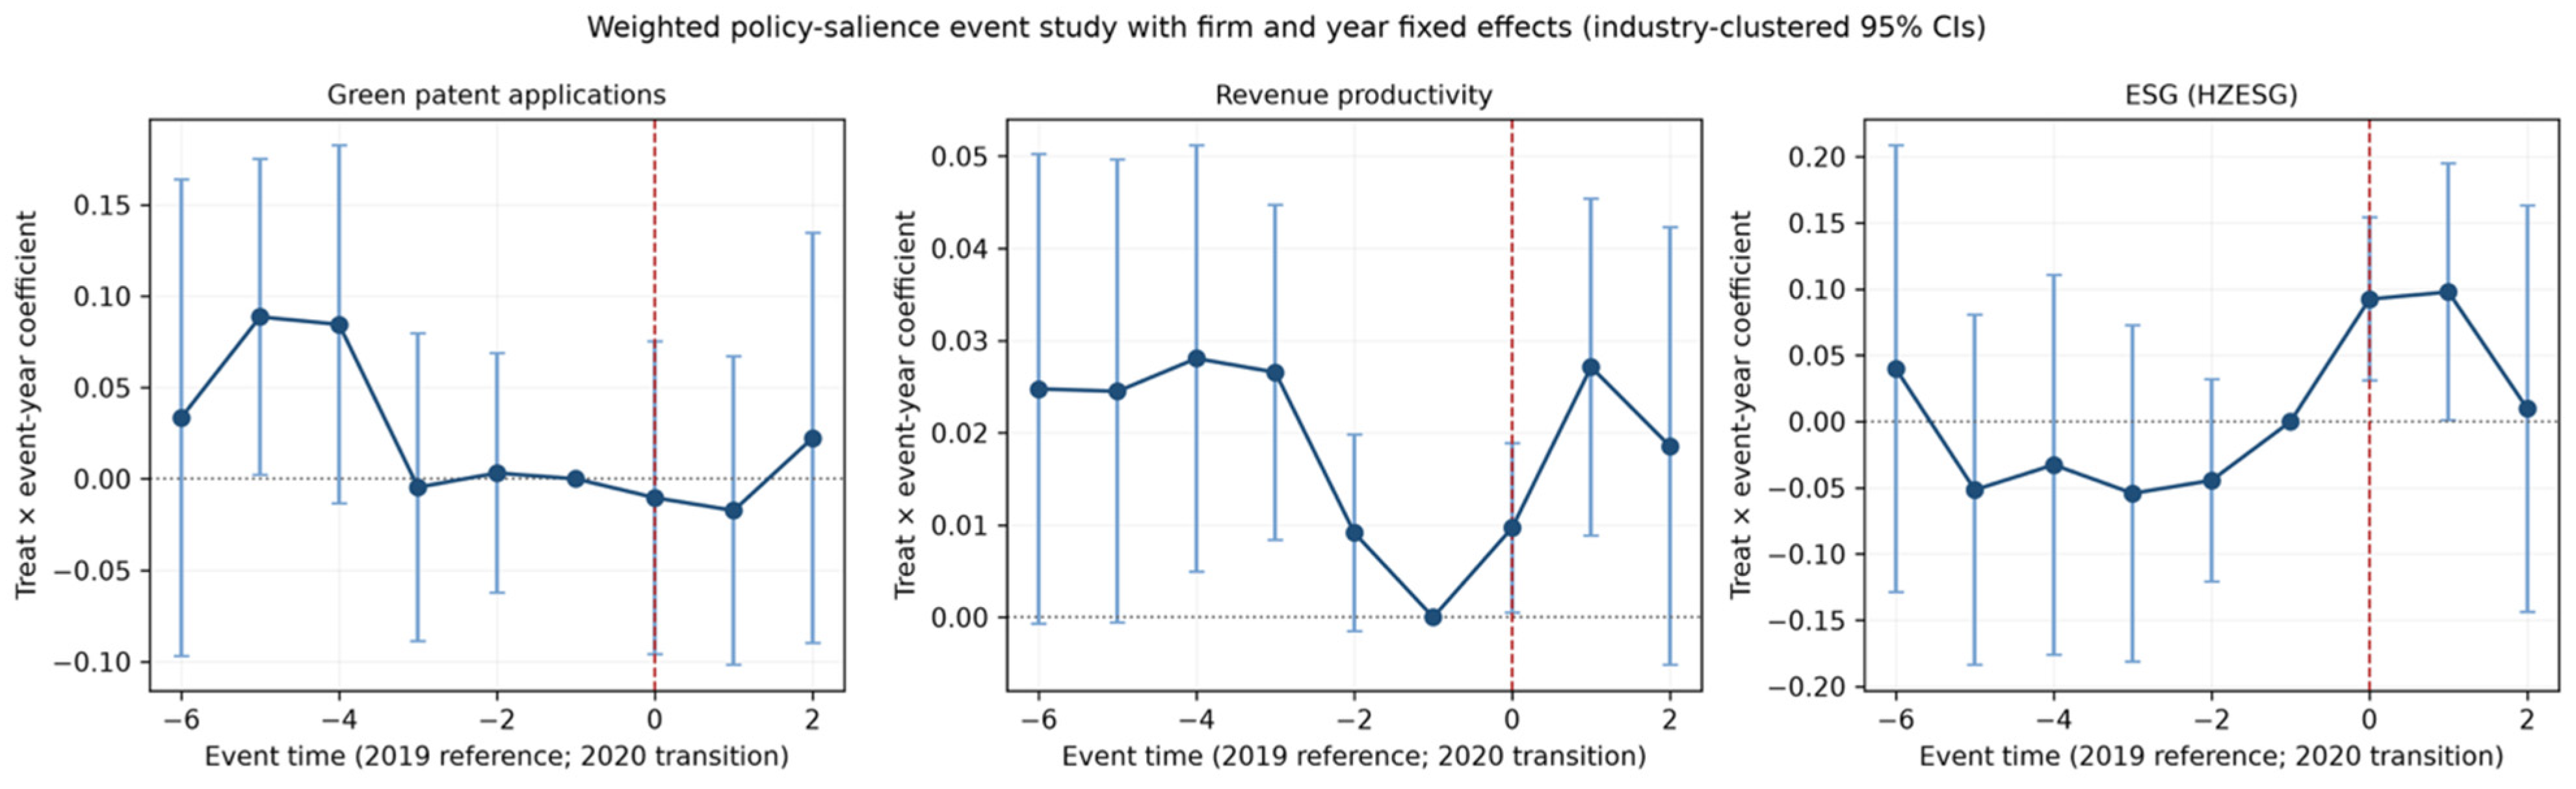

Disclaimer/Publisher’s Note: The statements, opinions and data contained in all publications are solely those of the individual author(s) and contributor(s) and not of MDPI and/or the editor(s). MDPI and/or the editor(s) disclaim responsibility for any injury to people or property resulting from any ideas, methods, instructions or products referred to in the content. |
© 2026 by the authors. Licensee MDPI, Basel, Switzerland. This article is an open access article distributed under the terms and conditions of the Creative Commons Attribution (CC BY) license.