


Abstract
This study constructs a network data envelopment analysis model to assess the eco-efficiency of the governance–production nexus, revealing traditional “black box” measurements’ internal processes. It uses data from the Yangtze River Delta (YRD) for 2011–2023 to decompose eco-efficiency into government governance and production efficiencies, identifying the influencing factors and their mediating pathways using a random panel Tobit model. We found that: (1) Traditional “black box” measurements using a limited number of indicators tend to underestimate eco-efficiency. (2) Considering the governance–production nexus, the YRD’s eco-efficiency exhibits an evolutionary pattern of “initial decline–subsequent recovery–renewed decline.” Regional differences converged during the COVID-19 pandemic, whereas they exhibited “polarization” characteristics during non-pandemic periods. (3) The average levels of government governance and production efficiencies are similar, indicating a relatively balanced contribution to eco-efficiency. (4) Unlike science and technology (S&T) expenditure, education expenditure, industrial structure upgrading, and economic density have significant positive effects on eco-efficiency. Mechanism identification reveals that education expenditure, industrial upgrading, and S&T expenditure affect eco-efficiency through the production process, whereas economic density operates through the government governance process. This study clarifies eco-efficiency levels and improvement pathways by revealing internal processes and distinguishing between the government governance and production stages.
1. Introduction
Improving resource productivity while reducing pollution and carbon emissions is central to sustainable development. Eco-efficiency translates the broad sustainability objective into a performance question: how much socioeconomic value can be created from a given level of resource use and environmental pressure? The concept was formulated by Schaltegger and Sturm [1]. It is therefore not simply an environmental indicator; it evaluates the joint performance of economic value creation and environmental pressure [2]. For urban regions, this joint performance depends on both market production and public action. Firms combine labor, capital, energy, and other resources to produce goods and services, whereas governments provide infrastructure, education, healthcare, technological support, and environmental regulation, shaping the conditions for production.
The Yangtze River Delta (YRD) provides a particularly important setting for examining this relationship. Comprising Shanghai and cities in Jiangsu, Zhejiang, and Anhui, the YRD is one of China’s most economically integrated and highly urbanized regions. Its dense production networks and large flows of capital, labor, and technology have supported rapid economic growth, while increasing pressure on energy use and the environment. Between 1990 and 2023, the YRD’s shares of China’s total energy consumption and carbon dioxide (CO2) emissions rose from 14.21% to 18.01% and from 16.25% to 18.33%, respectively [3]. Moreover, substantial differences remain among the region’s core metropolitan cities, manufacturing centers, and less-developed peripheral cities. An aggregate measure focused only on industrial production cannot distinguish production inefficiency from governance-related constraints, such as weak public-service provision. Conversely, assessing government performance separately from production may overlook how public inputs influence economic and environmental outcomes through intermediate services. A system-based evaluation of the governance–production nexus is therefore required.
International research demonstrates both the usefulness of eco-efficiency benchmarking and the importance of context. At the sectoral level, Kuosmanen and Kortelainen [4] adapted data envelopment analysis (DEA) to combine multiple environmental pressures in road transport in eastern Finland, whereas Picazo-Tadeo et al. [5] used slack information to identify eco-efficiency improvement potential among Spanish farms. Urban applications broadened the assessment beyond production: Alfonso Piña and Pardo Martínez [6] evaluated the environmental, social, and economic efficiency of Colombian cities; Lo Storto [7] compared the ecological efficiency of 116 Italian provincial capitals; and Kourtit et al. [8] compared the economic and environmental–climatological performance of 40 global cities, identifying substantial cross-city differences. These city studies enriched the outcome dimensions considered but generally benchmarked each city as an aggregate decision-making unit. Research at the national and regional levels has paid greater attention to temporal and territorial heterogeneity. Camarero et al. [9] identified distinct eco-efficiency convergence clubs among OECD countries, whereas Bianchi et al. [10] found an overall improvement but no uniform convergence across 282 European regions. Using DEA window analysis for 27 European countries, Matsumoto et al. [11] further documented time-varying environmental performance and the adverse effects of the 2007–2008 financial crisis. Overall, international studies have examined multiple environmental pressures, urban sustainability dimensions, regional heterogeneity, and temporal change, but have rarely combined these aspects with an internal decomposition of governance and production at the municipal level. Single-stage aggregate measures provide limited guidance on where an efficiency loss arises within the urban system.
DEA is well suited to eco-efficiency assessment because it accommodates multiple inputs, desirable outputs, and undesirable outputs without imposing a specific production function. The SBM–DEA model is especially useful when inputs, desirable outputs, and pollutants do not change proportionally. Nevertheless, most conventional applications treat a city or region as a “black box,” assuming that all inputs generate all outputs in a single step. This representation cannot determine whether an efficiency loss arises primarily in the governance stage or the production stage. Network DEA addresses this limitation by explicitly representing intermediate products and estimating both overall and stage efficiencies. The network SBM model developed by Tone and Tsutsui [12] provides the methodological foundation for evaluating linked processes while retaining information on process-specific shortfalls.
Among the studies explicitly modelling a governance–production system, Xiao et al. [13] evaluated 84 Chinese resource-based cities during 2007–2015 using a two-stage network SBM–DEA model in which public finance and urban land supported infrastructure, technology, education, and healthcare, which subsequently supported industrial production. They adopted baseline weights of one-third for governance and two-thirds for production and examined alternative stage weights. Their results showed increasing average eco-efficiency and a positive association between governance and production efficiency, but the analysis did not use a moving-window DEA design or conduct a second-stage econometric analysis of external factors associated with the two stage-specific efficiency scores. Although their sample included several resource-based cities located in the YRD, it did not examine the YRD as an integrated regional system. Feng et al. [14] developed a two-stage dynamic network DEA framework based on a directional distance function for the construction industry in 30 Chinese provincial-level regions during 2011–2020 and used a spatial Durbin model to examine influencing factors. Their study demonstrated the relevance of intertemporal links and spatially differentiated drivers, but its unit of analysis was a single industry at the provincial level rather than the economy-wide performance of cities within an integrated urban agglomeration. These studies establish the value of the governance–production framework but indicate that its application to a complete, highly integrated city cluster, temporal benchmarking at the municipal level, and the stage-specific associations of external factors remain insufficiently understood.
Against this background, this study aims to assess the eco-efficiency of the governance–production nexus in the YRD and examine how selected socioeconomic and policy factors are associated with overall, governance-stage, and production-stage efficiency. Four specific objectives guide the analysis. First, we construct a network SBM–DEA model for all 41 YRD cities over 2011–2023, treating infrastructure, education, and healthcare as intermediate outputs of the governance stage and inputs to the production stage, in which GDP and CO2 emissions are the desirable and undesirable outputs, respectively. Second, we use a three-year DEA window to obtain temporally comparable city-level efficiency scores and examine their evolution and regional disparities using kernel-density analysis and Dagum–Gini decomposition. Third, we estimate one-year-lagged associations of economic density, the education-expenditure share, industrial upgrading, and the logarithm of per capita science and technology (S&T) expenditure with the three efficiency measures and compare the weighted governance- and production-stage coefficient contributions to overall eco-efficiency. Fourth, we test whether the principal results are sensitive to the prespecified stage weights, the DEA window width, the econometric estimator, or the inclusion of Shanghai. The baseline one-third/two-thirds weights follow Xiao et al. [13] to retain comparability with the established framework; because these are exogenous importance weights rather than statistically identified parameters, they are compared with equal stage weights. The three-year window is likewise compared with a four-year window, and two-way fixed-effects estimates and a sample excluding Shanghai provide additional checks.
This study extends the established governance–production network DEA literature in three respects. First, it shifts the empirical focus from nationally dispersed resource-based cities or a single industrial sector to the complete municipal system of the YRD, where closely connected cities operate under a common regional-integration strategy but retain heterogeneous development structures and administrative responsibilities. Second, it integrates process decomposition with moving-window measurement and distributional analysis, allowing internal efficiency shortfalls to be examined alongside their temporal and spatial evolution. Third, it compares the conditional association of the same external factors across overall, governance, and production efficiencies and evaluates their stability under alternative DEA and econometric specifications. The novelty lies not in the network structure per se, but in the city-cluster scale, temporal benchmarking, and analytical integration of the governance–production framework.
The remainder of this paper is organized as follows. Section 2 introduces the network SBM–DEA model, the disparity measures, the econometric specification, and the data. Section 3 presents the eco-efficiency estimates, their spatiotemporal distribution, the external-factor analysis, and robustness checks. Section 4 concludes and discusses the corresponding policy implications and research limitations.
2. Methods and Data Description
2.1. Methods
2.1.1. Network DEA Model
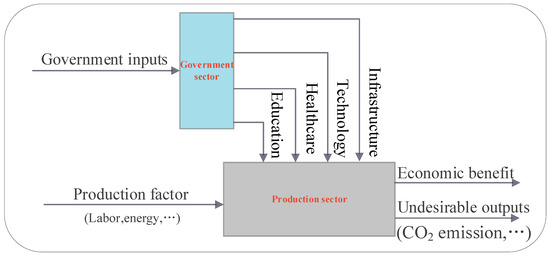
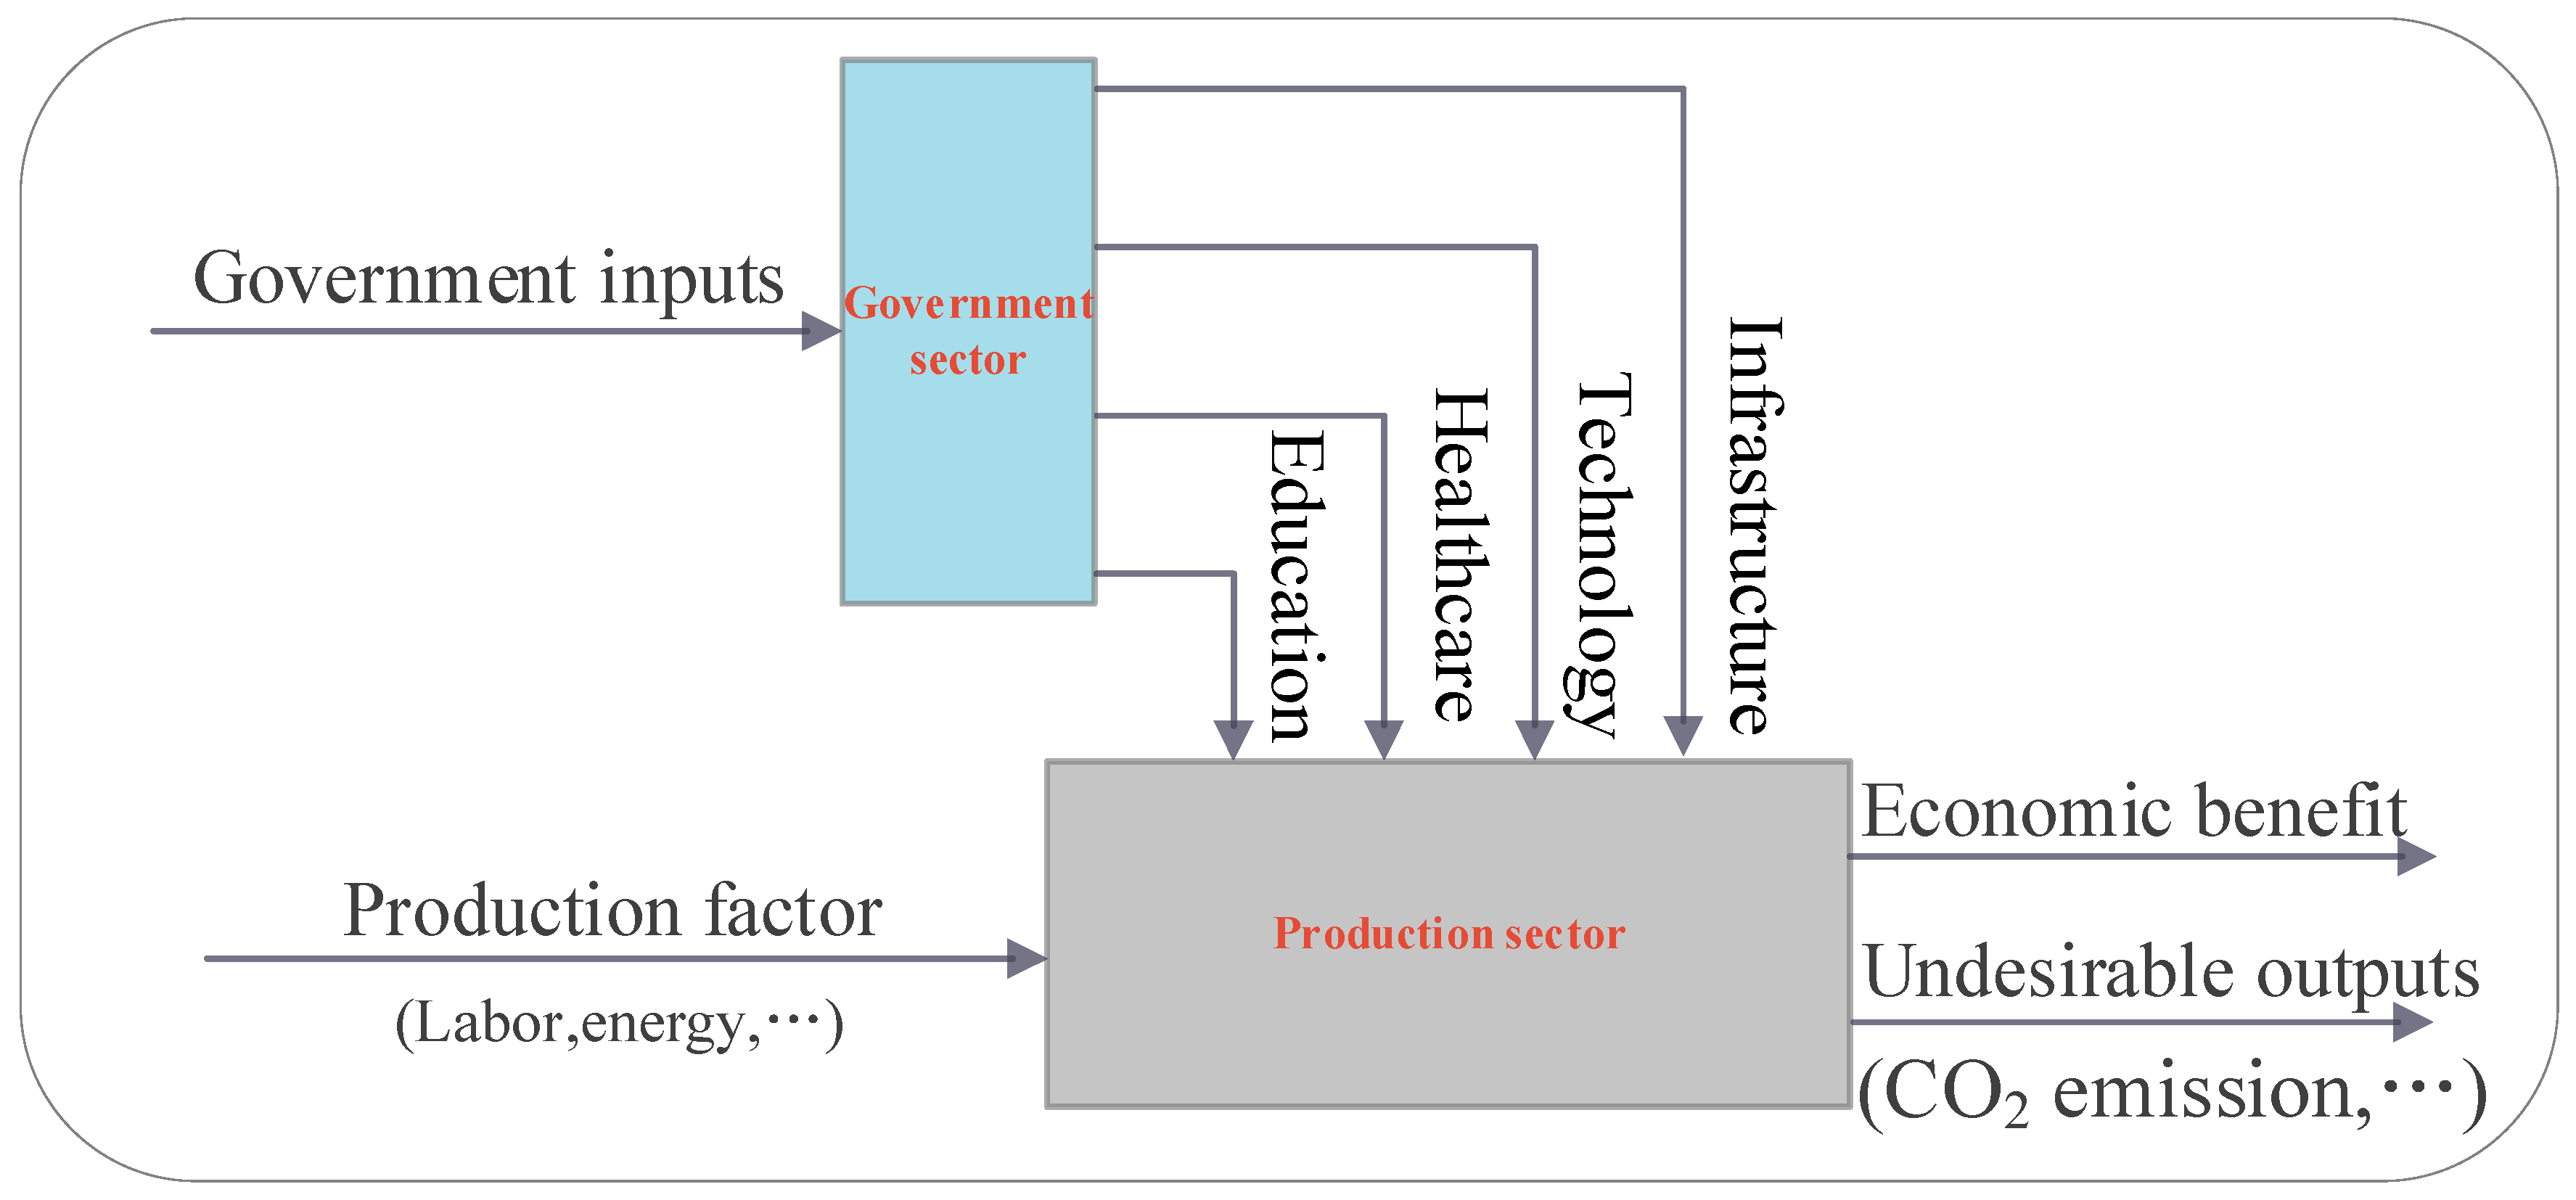
Given China’s socialist economic system, the government plays an important role in high-quality economic development, and improvements in eco-efficiency result from interactions between the government and the market. Thus, the main actors in economic activity are the government and enterprises [15]. As shown in Figure 1, the government inputs resources such as land and funds to optimize the production environment across four dimensions: education, healthcare, technology, and infrastructure. This approach creates a favorable business environment for firms [13]. In the production process, enterprises use production factors such as labor and energy to generate economic benefits while simultaneously emitting pollutants and other undesirable outputs.
Figure 1.
Framework of economic operation considering the governance–production nexus.
This study employs a network SBM–DEA model to evaluate city-level eco-efficiency and governance and production efficiencies [12]. For the government, the objective is to obtain the maximum outputs (e.g., education, healthcare) with the minimum inputs . These outputs are directly supplied to the market for use by the production sector and can thus be regarded as intermediate products that are “the more, the better” from the government’s perspective. Accordingly, the intermediate variables are linked using an “as outputs” constraint [16]. For the industrial sector, inputs generate desirable outputs and undesirable outputs . The network DEA model used to calculate the eco-efficiency of the governance–production nexus can be defined as follows:
Here, N denotes the number of cities, and the variables k and h represent the government and industrial sectors, respectively. The variables M, E, and F indicate the numbers of inputs, desirable outputs, and undesirable outputs, respectively. s denotes the slack variables for each indicator. The weights and correspond to the government and industrial sectors, and are set to 1/3 and 2/3, respectively, according to their relative importance [13]. The constraints and indicate that the government and industrial sectors, respectively, operate under variable returns to scale (VRS). The eco-efficiency obtained from Equation (1) is an overall efficiency measure, which can be further decomposed into governance and production efficiencies using Equations (2) and (3). Both governance and production efficiencies range from 0 to 1. If the efficiency value equals 1, the city is evaluated as efficient; otherwise, it is evaluated as inefficient [17].
2.1.2. Dagum–Gini Coefficient Decomposition Method
The Dagum–Gini coefficient not only allows the decomposition of disparities within and between regions, but also considers the distribution of subsamples, making it well suited to this study [18]. The Dagum–Gini coefficient is defined in Equation (4), where denotes the mean eco-efficiency of the YRD, () represents the eco-efficiency of city in region , is the total number of cities, is the number of regions, and denotes the total number of cities in region ().
According to the Dagum–Gini coefficient decomposition method, the overall Gini coefficient can be decomposed into the contributions of within-region disparities , between-region disparities , and transvariation intensity , with . The term captures the Gini coefficient arising from the cross-overlap of samples between different regions [19]; if there is no overlap among regions, this value equals 0 [20]. is obtained from Equations (5)–(8), from Equations (9)–(13), and from Equations (7), (8) and (10)–(14). denotes the Gini coefficient within region ; expresses the Gini coefficient between regions j and h; represents the degree to which relative eco-efficiency contributes to disparities between regions j and h; denotes the gross eco-efficiency advantage of region j over region h; and indicates the first-order moment of transvariation.
2.1.3. Spatial Tobit Method
Eco-efficiency takes values in the range [0, 1], and the dependent variable is thus censored within a specific interval. Accordingly, this study employs a Tobit model for regression analysis. Considering that eco-efficiency may exhibit spatial dependence, it uses a spatial Tobit model to examine its driving factors [21]. The model is specified as follows:
In Equation (15), σ is the spatial autoregressive coefficient, capturing the spatial spillover effect of eco-efficiency; β denotes the coefficients of the driving factors; and represents the vector of driving factors for region i in period t. is the spatial regression coefficient that measures the spatial spillover effects from neighboring regions. expresses the individual (region-specific) effect, denotes the time fixed effect, and is the random disturbance term.
Spatial dependence across regions may be complex; therefore, the spatial Tobit model can be classified into the following three types. When , the model is referred to as a Spatial Durbin Model (SDM); when , it is a Spatial Error Model (SEM); and when , it is a Spatial Autocorrelation Model (SAM) [22].
2.2. Data Description
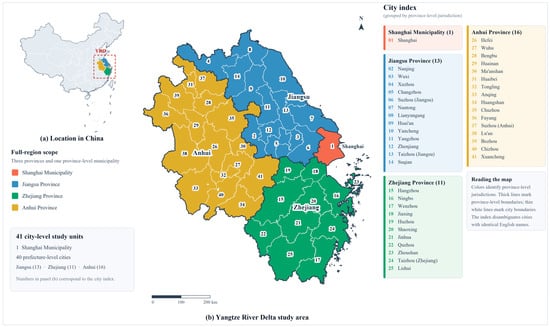
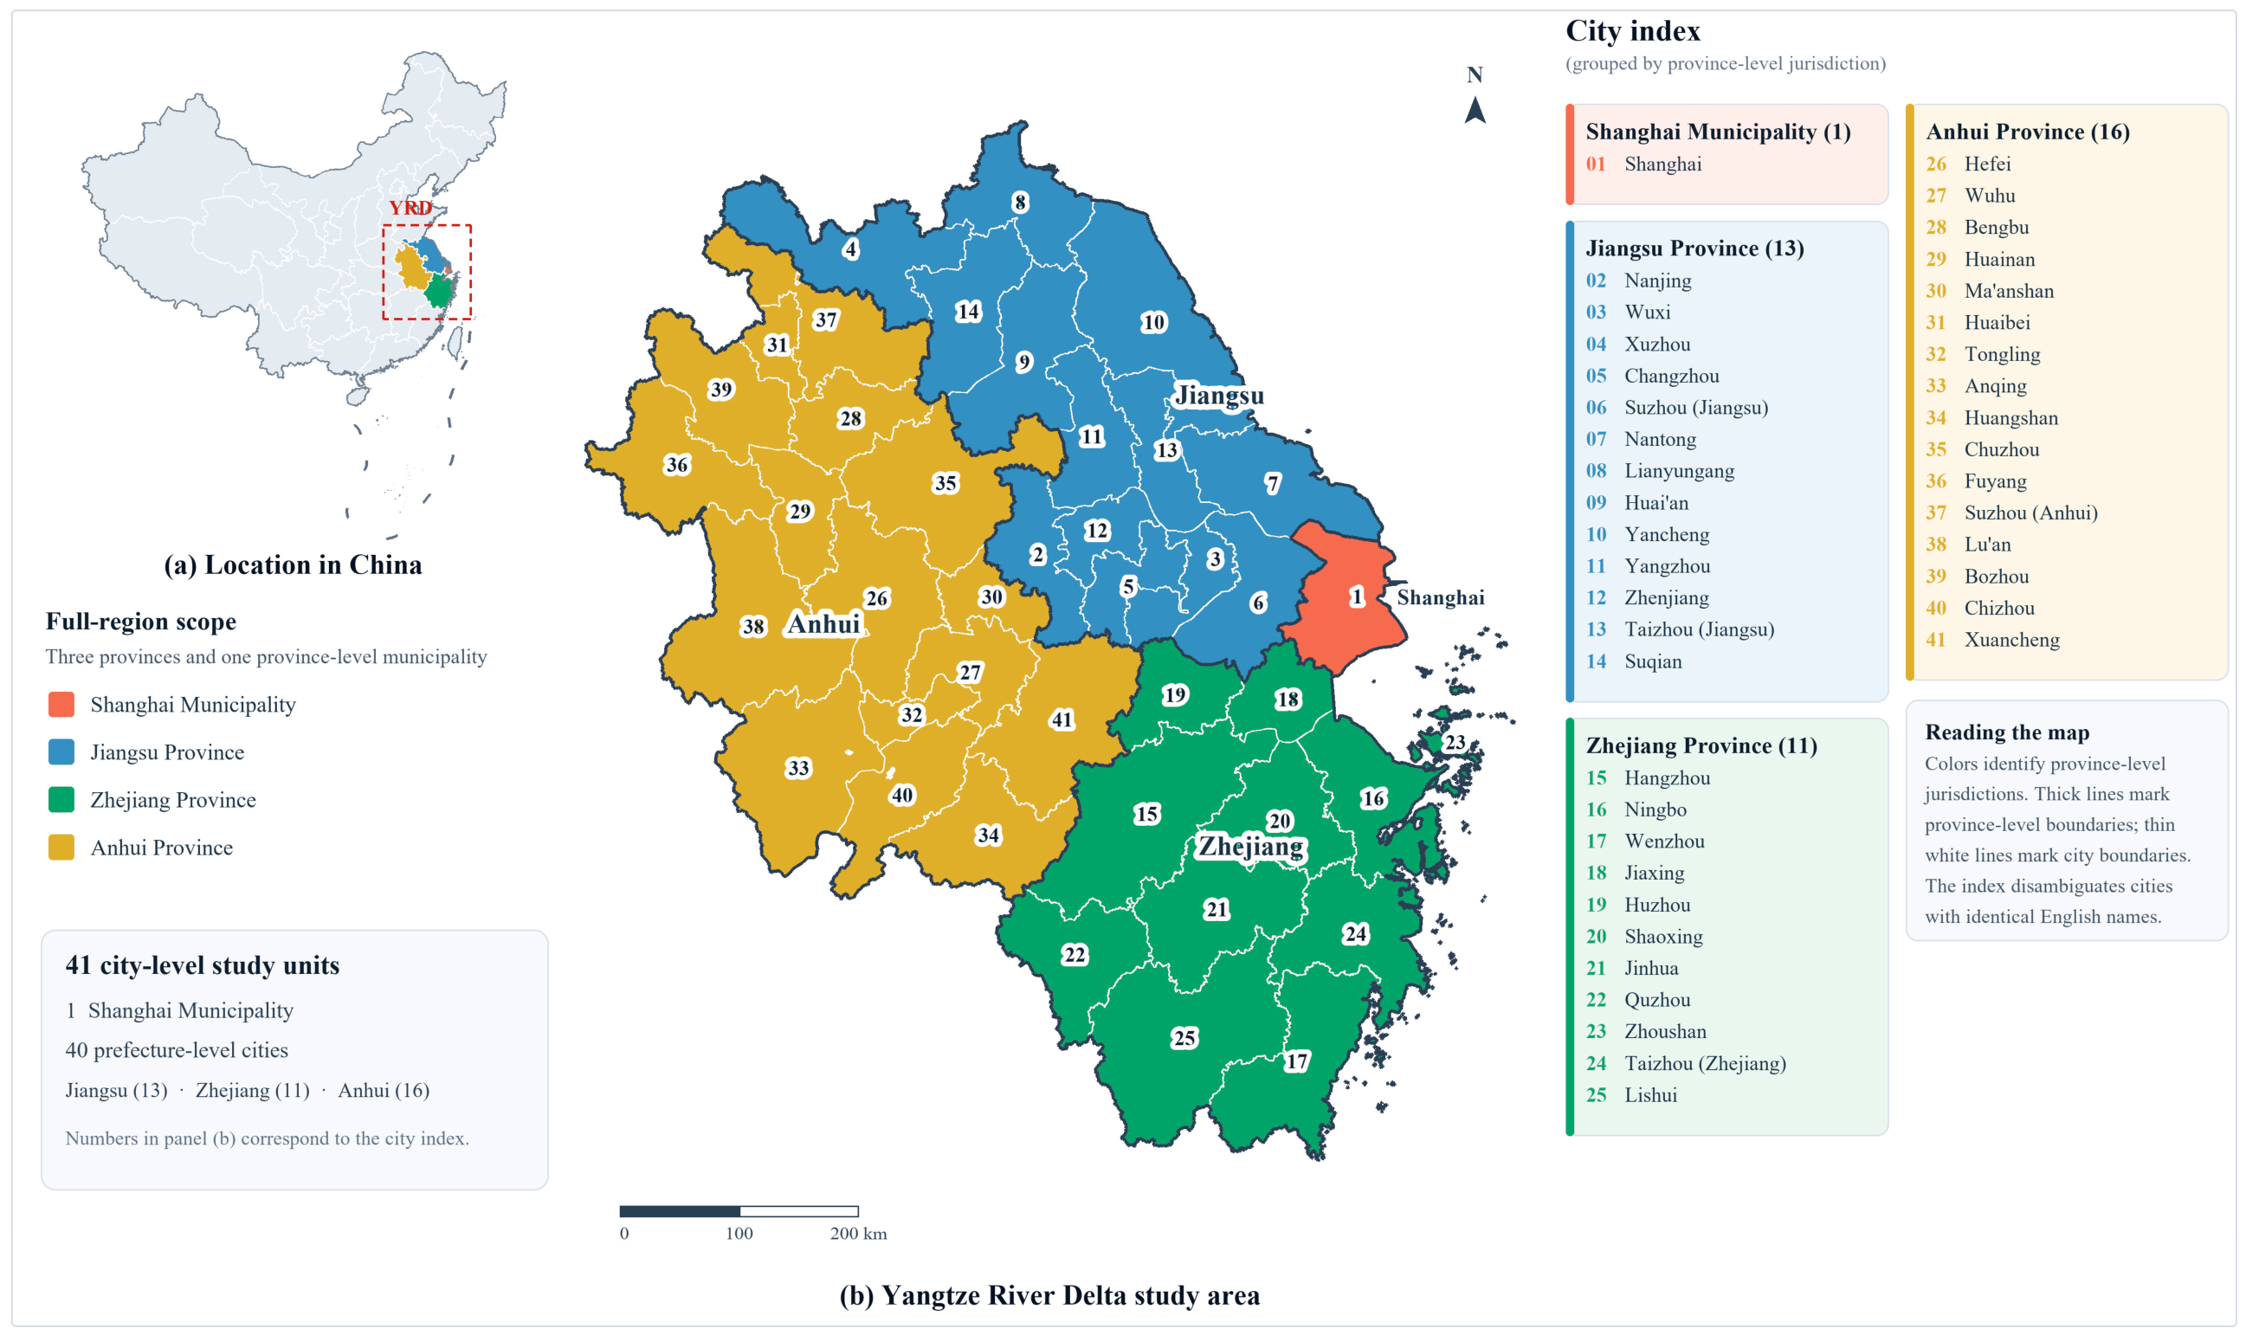
Considering the governance–production nexus, this study selects 10 variables to measure the YRD’s eco-efficiency from 2011 to 2023. The study adopts the full-region scope of the YRD, comprising Shanghai Municipality and Jiangsu, Zhejiang, and Anhui Provinces. The sample includes 41 city-level analytical units: Shanghai, a province-level municipality directly under the central government, and 40 prefecture-level cities administered by the three provinces. Specifically, Jiangsu contains 13 sample cities, Zhejiang 11, and Anhui 16. Figure 2 shows the location of the YRD within China and identifies the province-level affiliation of each city. Eco-efficiency is measured at the city level. When the analysis shifts to the province level, city observations are grouped according to their province-level jurisdiction.
Figure 2.
Location and administrative composition of the YRD study area.
Local government general budgetary expenditure and urban construction land area are used as inputs for the governance stage. Urban road area at year-end, weighted enrollment in ordinary secondary and primary schools, and the number of physicians are used as desirable outputs of the governance stage and as intermediate links to the production stage. The production sector mainly consists of enterprises that supply non-public goods and services. In the production process, the production sector generates gross domestic product (GDP) and undesirable outputs such as CO2 emissions. This study considers electricity consumption [23], urban capital stock [24], and the number of employed persons at year-end [25] as the inputs to the production sector. It considers CO2 emissions as the undesirable output [26] and GDP as the desirable output [27].
Data on GDP, local government general budgetary expenditure, urban construction land area, urban road area at year-end, weighted enrollment in ordinary secondary and primary schools, physicians, electricity consumption, and the number of employed persons at year-end are drawn from the China City Statistical Yearbook (2012–2024). Capital stock, with 2000 as the base year, is estimated using the perpetual inventory method [28]. The depreciation rate is set at 9.6% [29]. CO2 emissions are taken from the Emissions Database for Global Atmospheric Research (EDGAR) [30]. The GDP and local government general budgetary expenditure are deflated to constant 2011 prices using the GDP deflator, which is indirectly derived from the GDP index published by the National Bureau of Statistics. The definitions and descriptive statistics of the ten indicators used in the network SBM–DEA model are summarized in Table 1.
Table 1.
Variables and descriptive statistics used in the network SBM–DEA measurement of eco-efficiency.
3. Empirical Analysis
3.1. Comparison of the Yangtze River Delta’s Eco-Efficiency Considering the Governance–Production Nexus and Traditional Approaches
Table 2 reports the 2023 eco-efficiency results for the YRD under three specifications: the black-box model, the government embedded “black-box” model, and the government embedded network model. The black-box model does not incorporate government output indicators or a network structure. The government-embedded “black-box” model incorporates government output indicators but ignores the network structure. The government-embedded network model incorporates both government outputs and the network structure.
Table 2.
Evaluation results of eco-efficiency in the Yangtze River Delta in 2023 under the three measurement specifications.
The average eco-efficiency values obtained from the black-box, government-embedded “black-box,” and government-embedded network models are 0.656, 0.729, and 0.824, respectively. This indicates that the traditional black-box DEA tends to underestimate efficiency, mainly because it uses relatively few indicators and does not capture the internal management system. The gap between the government-embedded “black-box” model and the government-embedded network model suggests a “network effect” between the two sectors. The government-embedded “black-box” model implicitly assumes that the fewer the intermediate variables between the government and the market, the better, whereas the government-embedded network model treats a richer set of intermediate variables as desirable. Thus, there is systemic tension between the two models. The government-embedded “black-box” model overlooks the linkages between the government and industrial sectors and therefore cannot fully capture actual conditions.
Although the eco-efficiency rankings of the 41 cities differ across the three models, the number of efficient cities increases gradually. This indicates that as more indicators are included and the system is modeled more comprehensively, more cities are identified as efficient. Under the black-box specification, six cities lie on the efficiency frontier in 2023: Shanghai, Wuxi, Hangzhou, Shaoxing, Lishui, and Huangshan. Under the government-embedded “black-box” specification, 14 cities with the highest eco-efficiency are Shanghai, Wuxi, Changzhou, Suzhou (Jiangsu), Yangzhou, Zhenjiang, Hangzhou, Jiaxing, Shaoxing, Zhoushan, Lishui, Tongling, Huangshan, and Chizhou. Under the government-embedded network specification, the number of efficient cities rises to 18: Shanghai, Nanjing, Suzhou (Jiangsu), Hangzhou, Xuzhou, Wenzhou, Shaoxing, Jinhua, Huainan, Huaibei, Fuyang, Suzhou (Anhui), Bengbu, Bozhou, Tongling, Chizhou, Huangshan, and Lishui. In the following analysis, the government-embedded network specification serves as the measure of the eco-efficiency of the governance–production nexus in the YRD, and its spatiotemporal evolution and driving factors are examined in greater detail.
3.2. Temporal Evolution of Eco-Efficiency of the Governance–Production Nexus in the Yangtze River Delta
Traditional cross-sectional DEA models cannot provide detailed information on efficiency changes across years, whereas DEA window analysis can handle cross-sectional data that vary over time. Through DEA window analysis, the eco-efficiency of a given city in a given period can be compared not only with that of other regions but also with its own performance in different periods. The DEA window analysis consists of three steps. First, the window width is determined. Following Wang et al. (2013) [31] and Liu et al. (2023) [32], we set the window width to three years. Second, using the moving-average approach, cities in different years within each window are treated as independent decision-making units to measure their eco-efficiency. This study examines data from 41 cities in the YRD from 2011 to 2023. The first window covers 2011, 2012, and 2013; the second covers 2012, 2013, and 2014; and so on. The final window covers 2021, 2022, and 2023. Thus, each city has three eco-efficiency values, except for 2011 and 2023, which each have only one value, and 2012 and 2022, which each have two values. Third, the average eco-efficiency of each city in the same calendar year is calculated, yielding a new set of efficiency scores for the 41 cities.
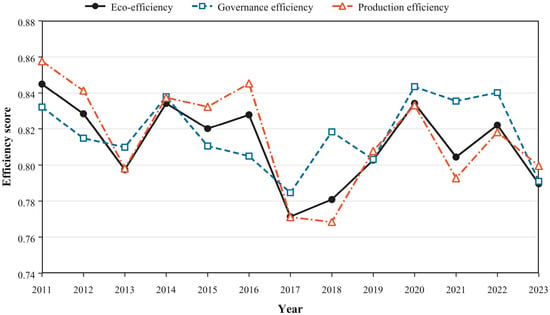
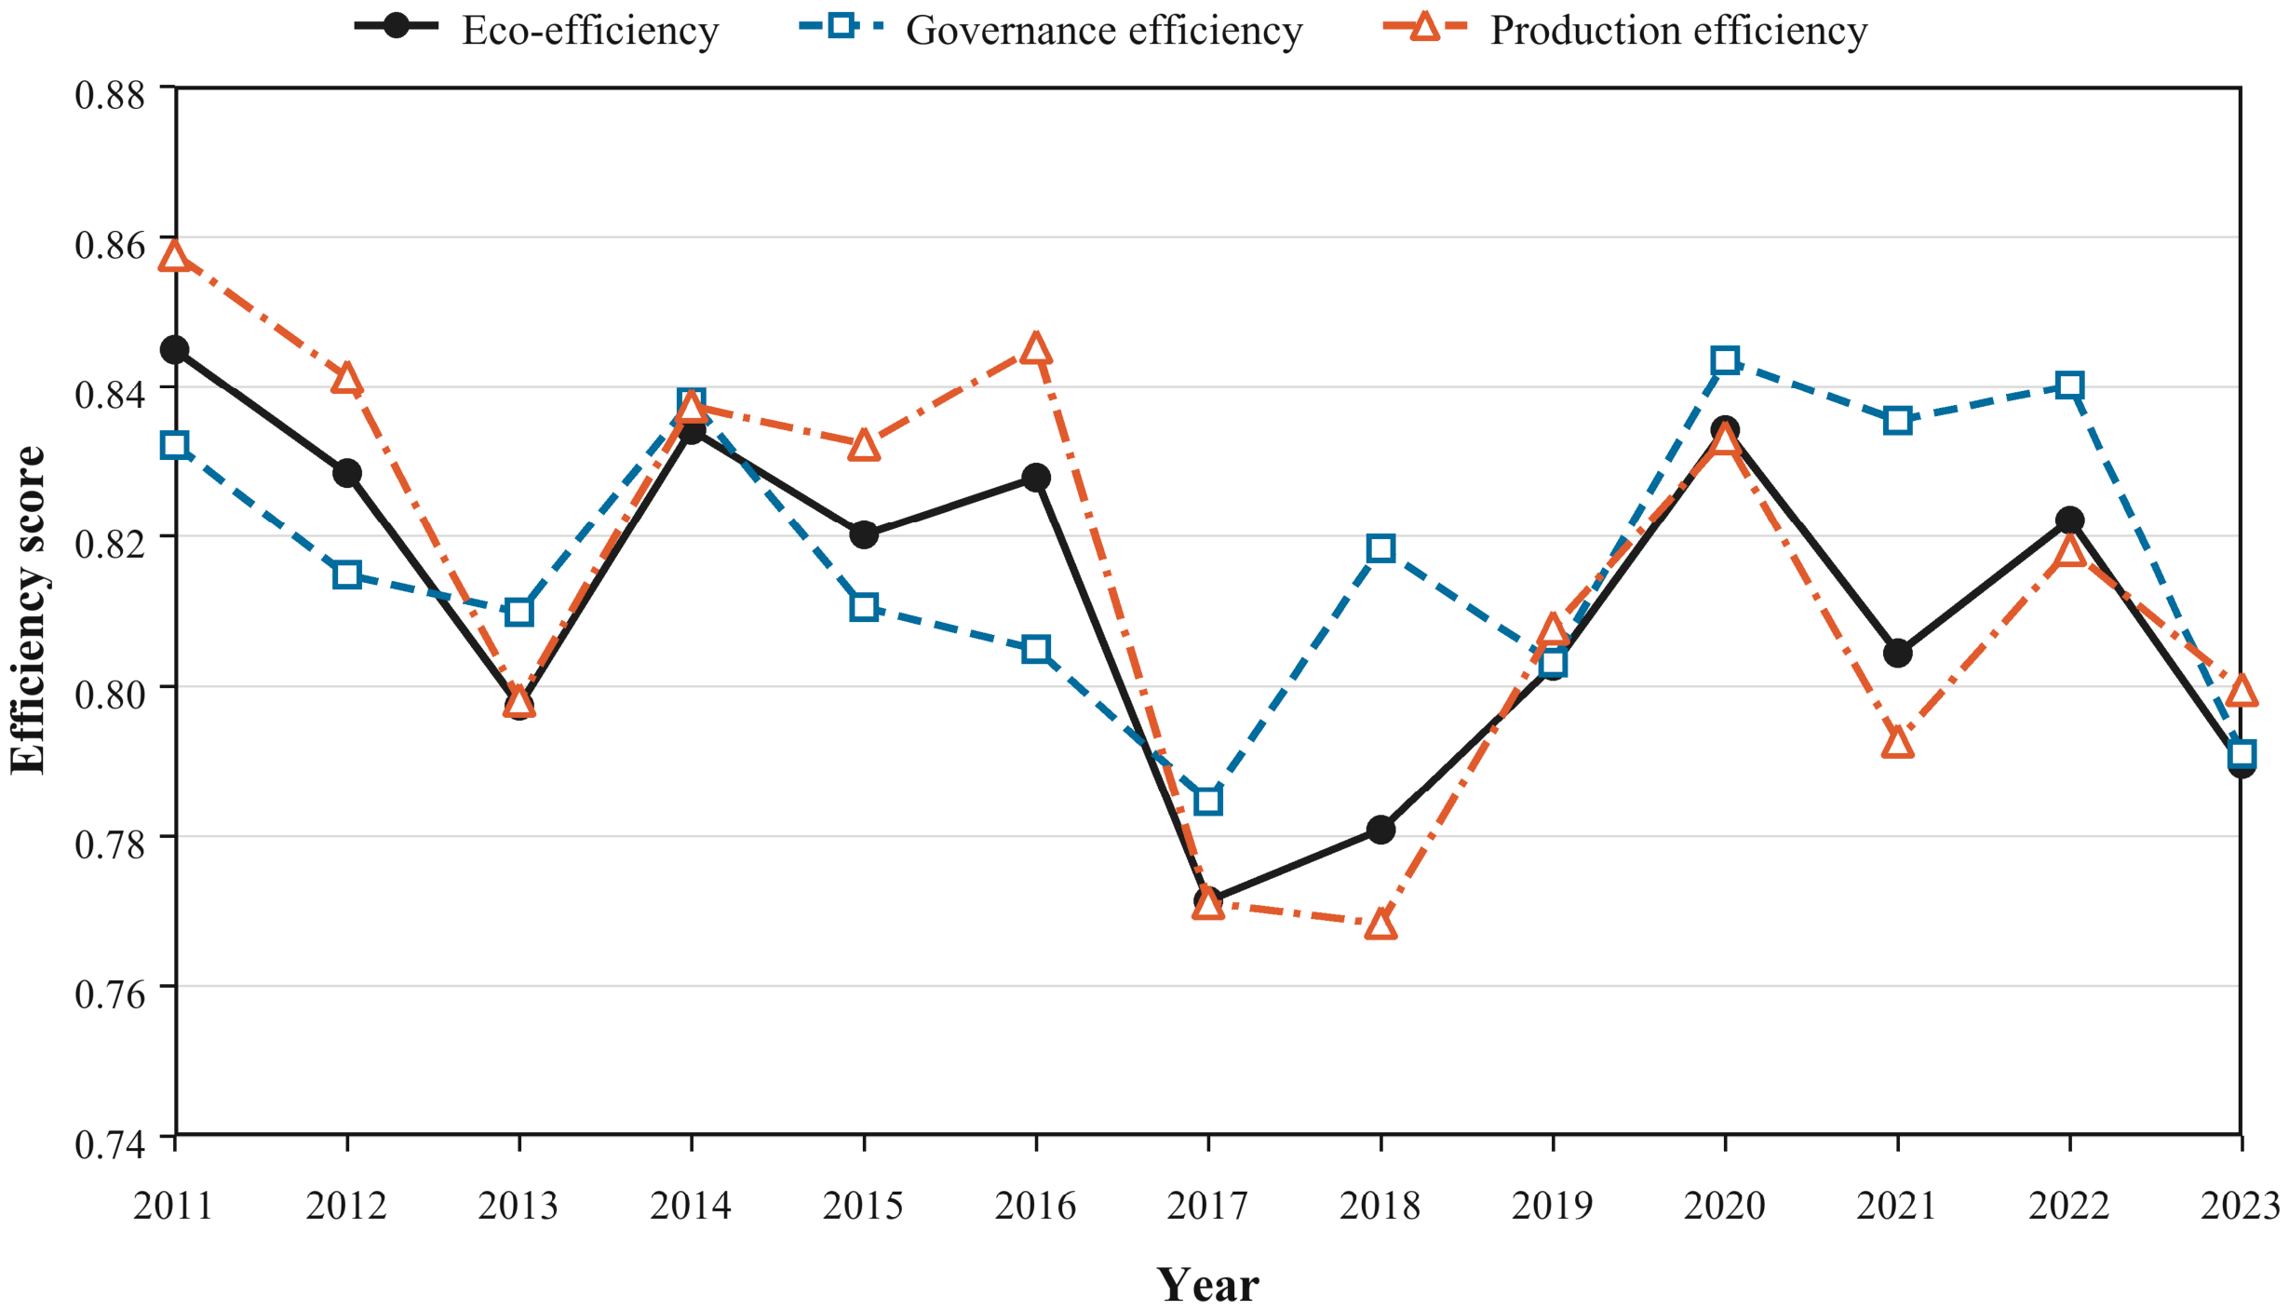
As shown in Figure 3, the YRD’s eco-efficiency, considering the governance–production nexus, exhibits pronounced fluctuations from 2011 to 2023 and overall follows a pattern of “decline–rebound–decline.” These movements can be interpreted more precisely by examining the annual mean governance and production efficiencies. From 2011 to 2013, overall eco-efficiency declined from 0.845 to 0.797. Both stages weakened, but the decrease was more pronounced in production efficiency, which fell from 0.858 to 0.798, than in governance efficiency, which declined from 0.832 to 0.810. This pattern is consistent with increasing pressure on the production stage during a period of resource- and energy-intensive industrial expansion. Overall eco-efficiency subsequently rebounded to 0.834 in 2014, declined to 0.820 in 2015, and recovered to 0.828 in 2016. The 2014 rebound was accompanied by simultaneous improvements in both stages. During 2015–2016, however, governance efficiency declined from 0.838 to 0.805, whereas production efficiency increased to 0.845. Therefore, the fluctuations during this period reflected offsetting movements between the two stages rather than a uniform improvement or deterioration across the governance–production system.
Figure 3.
Trend in eco-efficiency of the governance–production nexus in the Yangtze River Delta.
The 2017 trough of 0.771 was associated with declines in both governance efficiency, from 0.805 to 0.785, and production efficiency, from 0.845 to 0.771. The substantially larger deterioration in the production stage provides the closest measured explanation for the full-sample minimum. The 2017 decrease may reflect short-term adjustment in the production system during a period of increasingly stringent regulation, regulatory compliance, and industrial restructuring. From 2018 to 2020, overall efficiency increased continuously from 0.781 to 0.803 and then to 0.834. The initial increase in 2018 was associated mainly with a recovery in governance efficiency, despite a slight decrease in production efficiency. Production efficiency subsequently rose to 0.808 in 2019 and 0.833 in 2020, while governance efficiency reached 0.843 in 2020. The later part of this recovery coincided with the elevation of YRD integration to a national strategy in late 2018 and the 2019 regional integration outline, which emphasized coordinated innovation, industrial restructuring, and joint ecological protection [33]. The post-2020 trajectory was not a continuous decline. Overall efficiency fell to 0.804 in 2021, recovered to 0.822 in 2022, and declined to 0.790 in 2023. The 2021 decrease and 2022 recovery were concentrated mainly in the production stage, whereas the 2023 decline occurred in both stages and was particularly pronounced in governance efficiency, which fell from 0.840 to 0.791. Thus, the 2023 value remained above the full-sample minimum recorded in 2017.
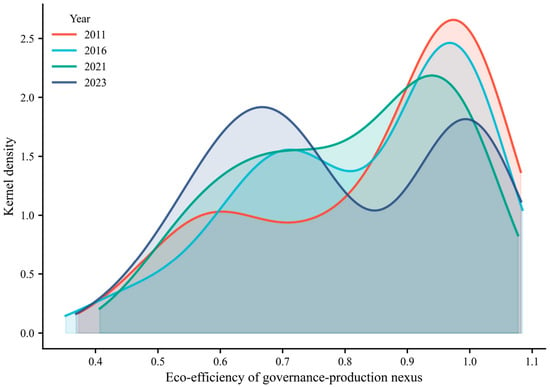
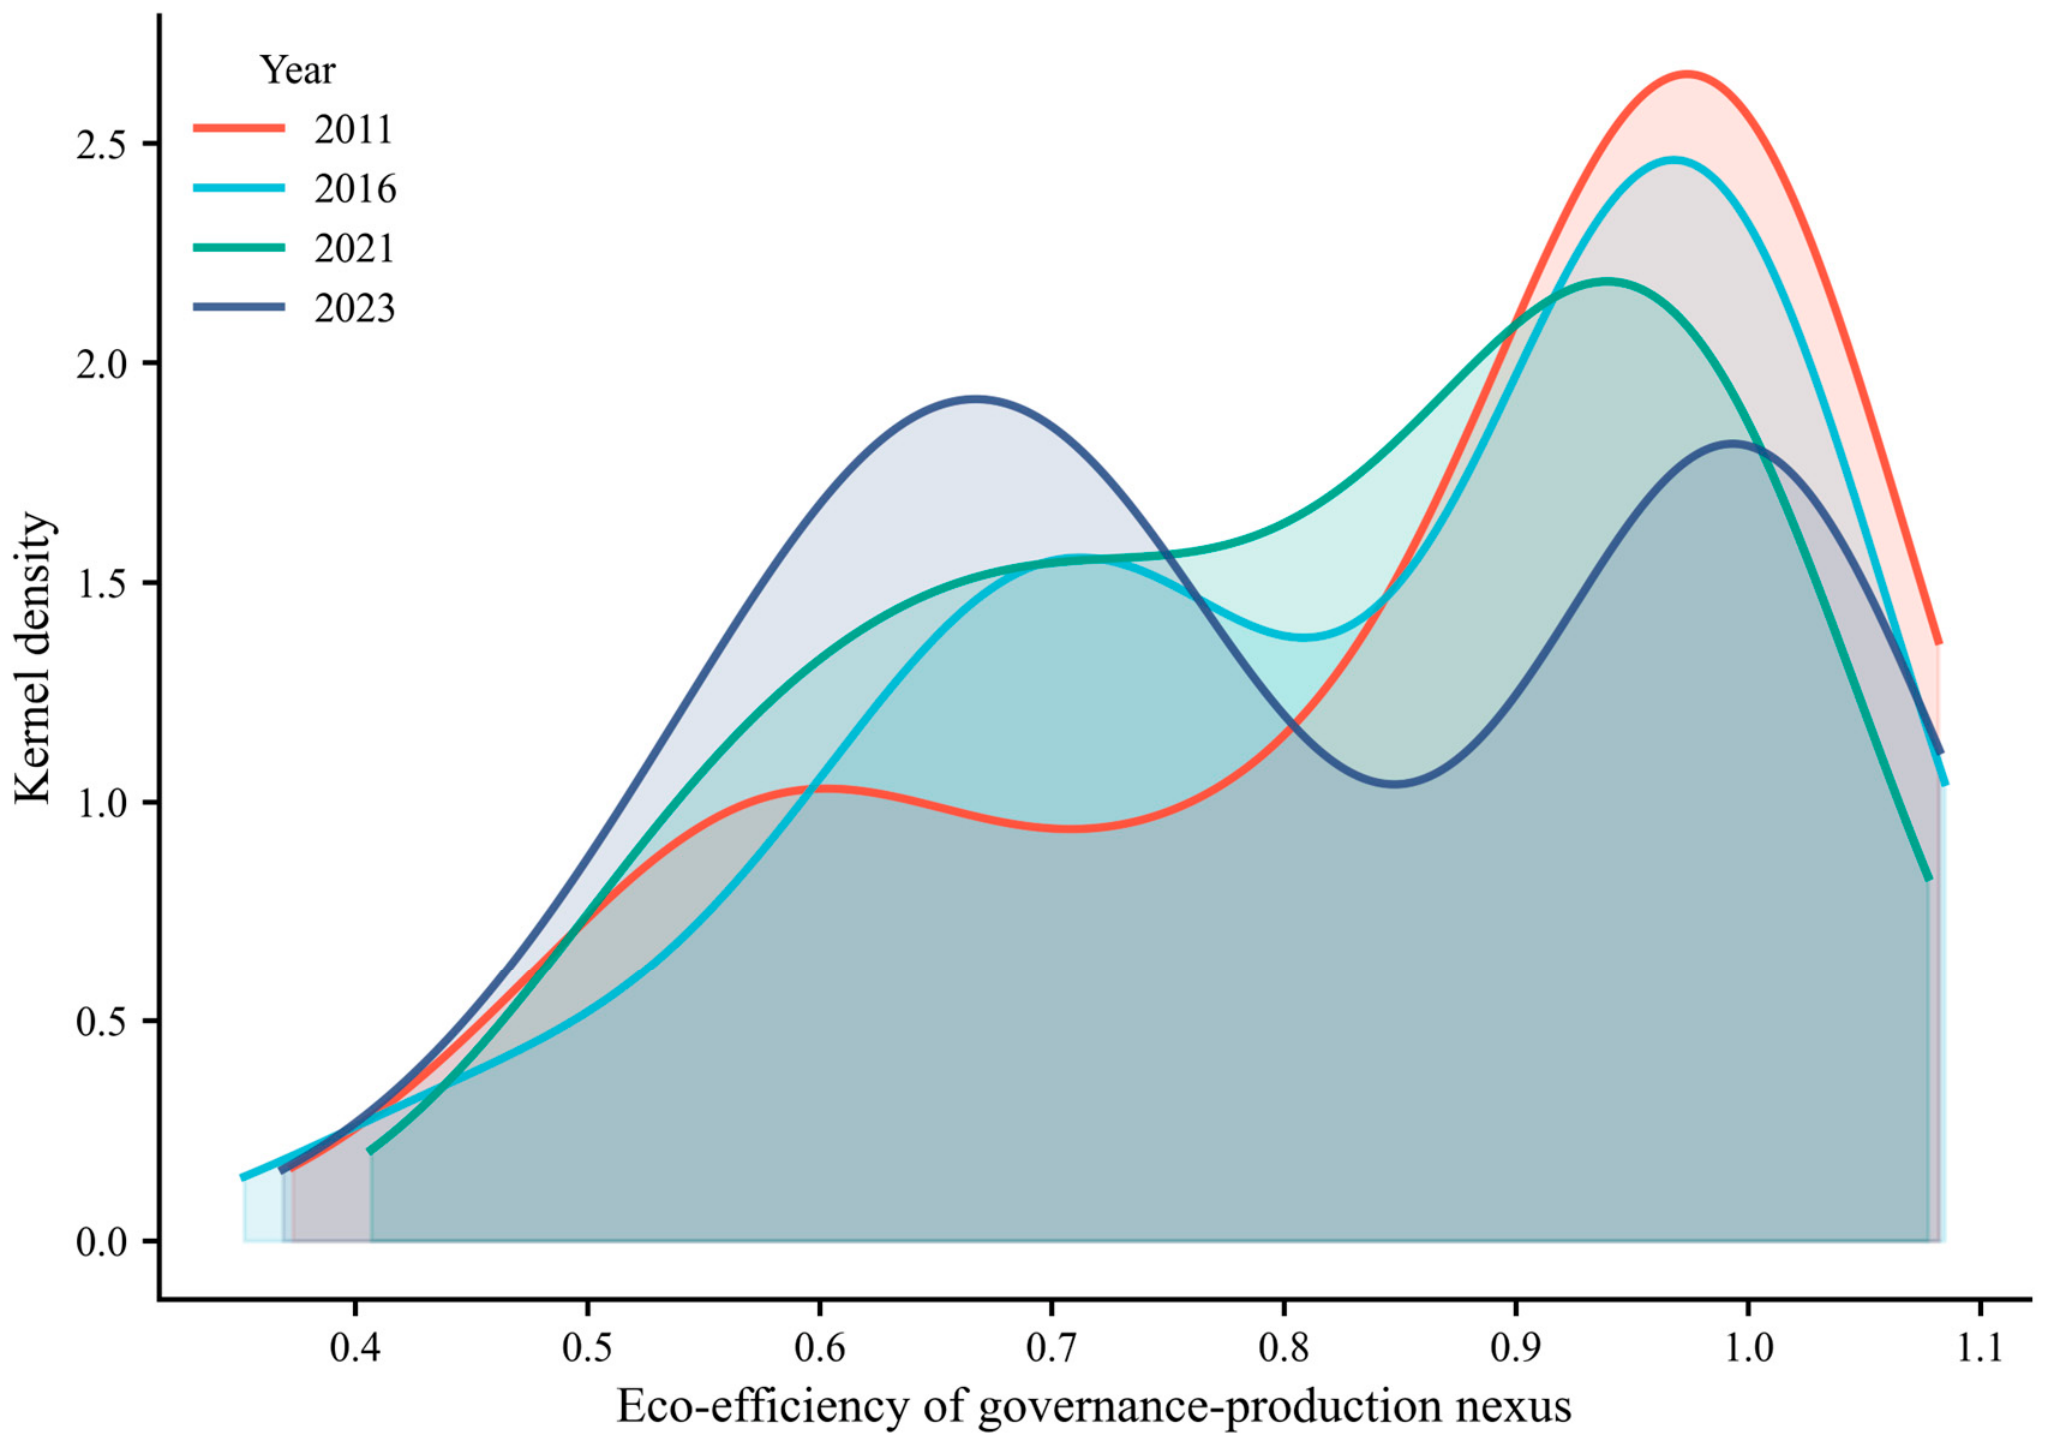
Comparing the early years of the 12th, 13th, and 14th Five-Year Plans with the most recent years, the 14th Five-Year Plan began in 2021 during the COVID-19 pandemic. The government’s pandemic-control policies affected production and everyday life and, to some extent, may have influenced eco-efficiency. Therefore, eco-efficiency in 2021 may exhibit characteristics different from those in other years. Figure 4 presents the kernel density distributions of the eco-efficiency of the governance–production nexus in the YRD for 2011, 2016, 2021, and 2023. The distributions are compared in terms of the number of peaks, peak heights, peak locations, and tail behavior. (1) In 2011, 2016, and 2023, the distributions exhibit two peaks. In 2021, reduced production and weaker market competition resulted in a single peak in eco-efficiency, indicating a relative weakening of the “polarization” phenomenon. (2) In terms of peak height, the primary peak in 2011 was relatively high, whereas the secondary peak was relatively low. By 2016, the primary peak had declined, whereas the secondary peak had increased. By 2023, the former primary peak had become the secondary peak, and the former secondary peak had become the primary peak. This suggests that most cities clustered around the higher-efficiency peak in 2011, whereas by 2023, cities had begun to shift from a high-efficiency peak towards the low-efficiency peak. (3) Both peaks in the 2023 distribution shifted to the right relative to 2011, indicating an overall improvement in eco-efficiency between 2011 and 2023. (4) Regarding tail behavior, the left and right tails remained short in all four years, suggesting that no cities exhibited markedly low eco-efficiency.
Figure 4.
Kernel density distribution of the eco-efficiency of the governance–production nexus in the Yangtze River Delta.
3.3. Regional Differences in Eco-Efficiency Considering the Governance–Production Nexus in the Yangtze River Delta
3.3.1. Overall Differences
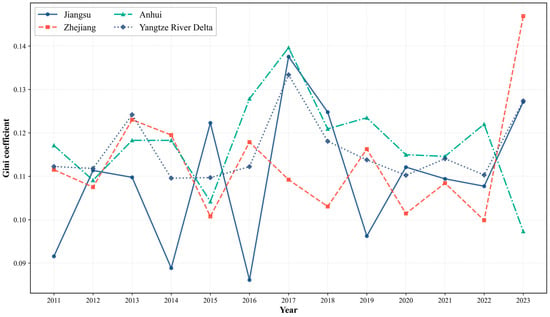
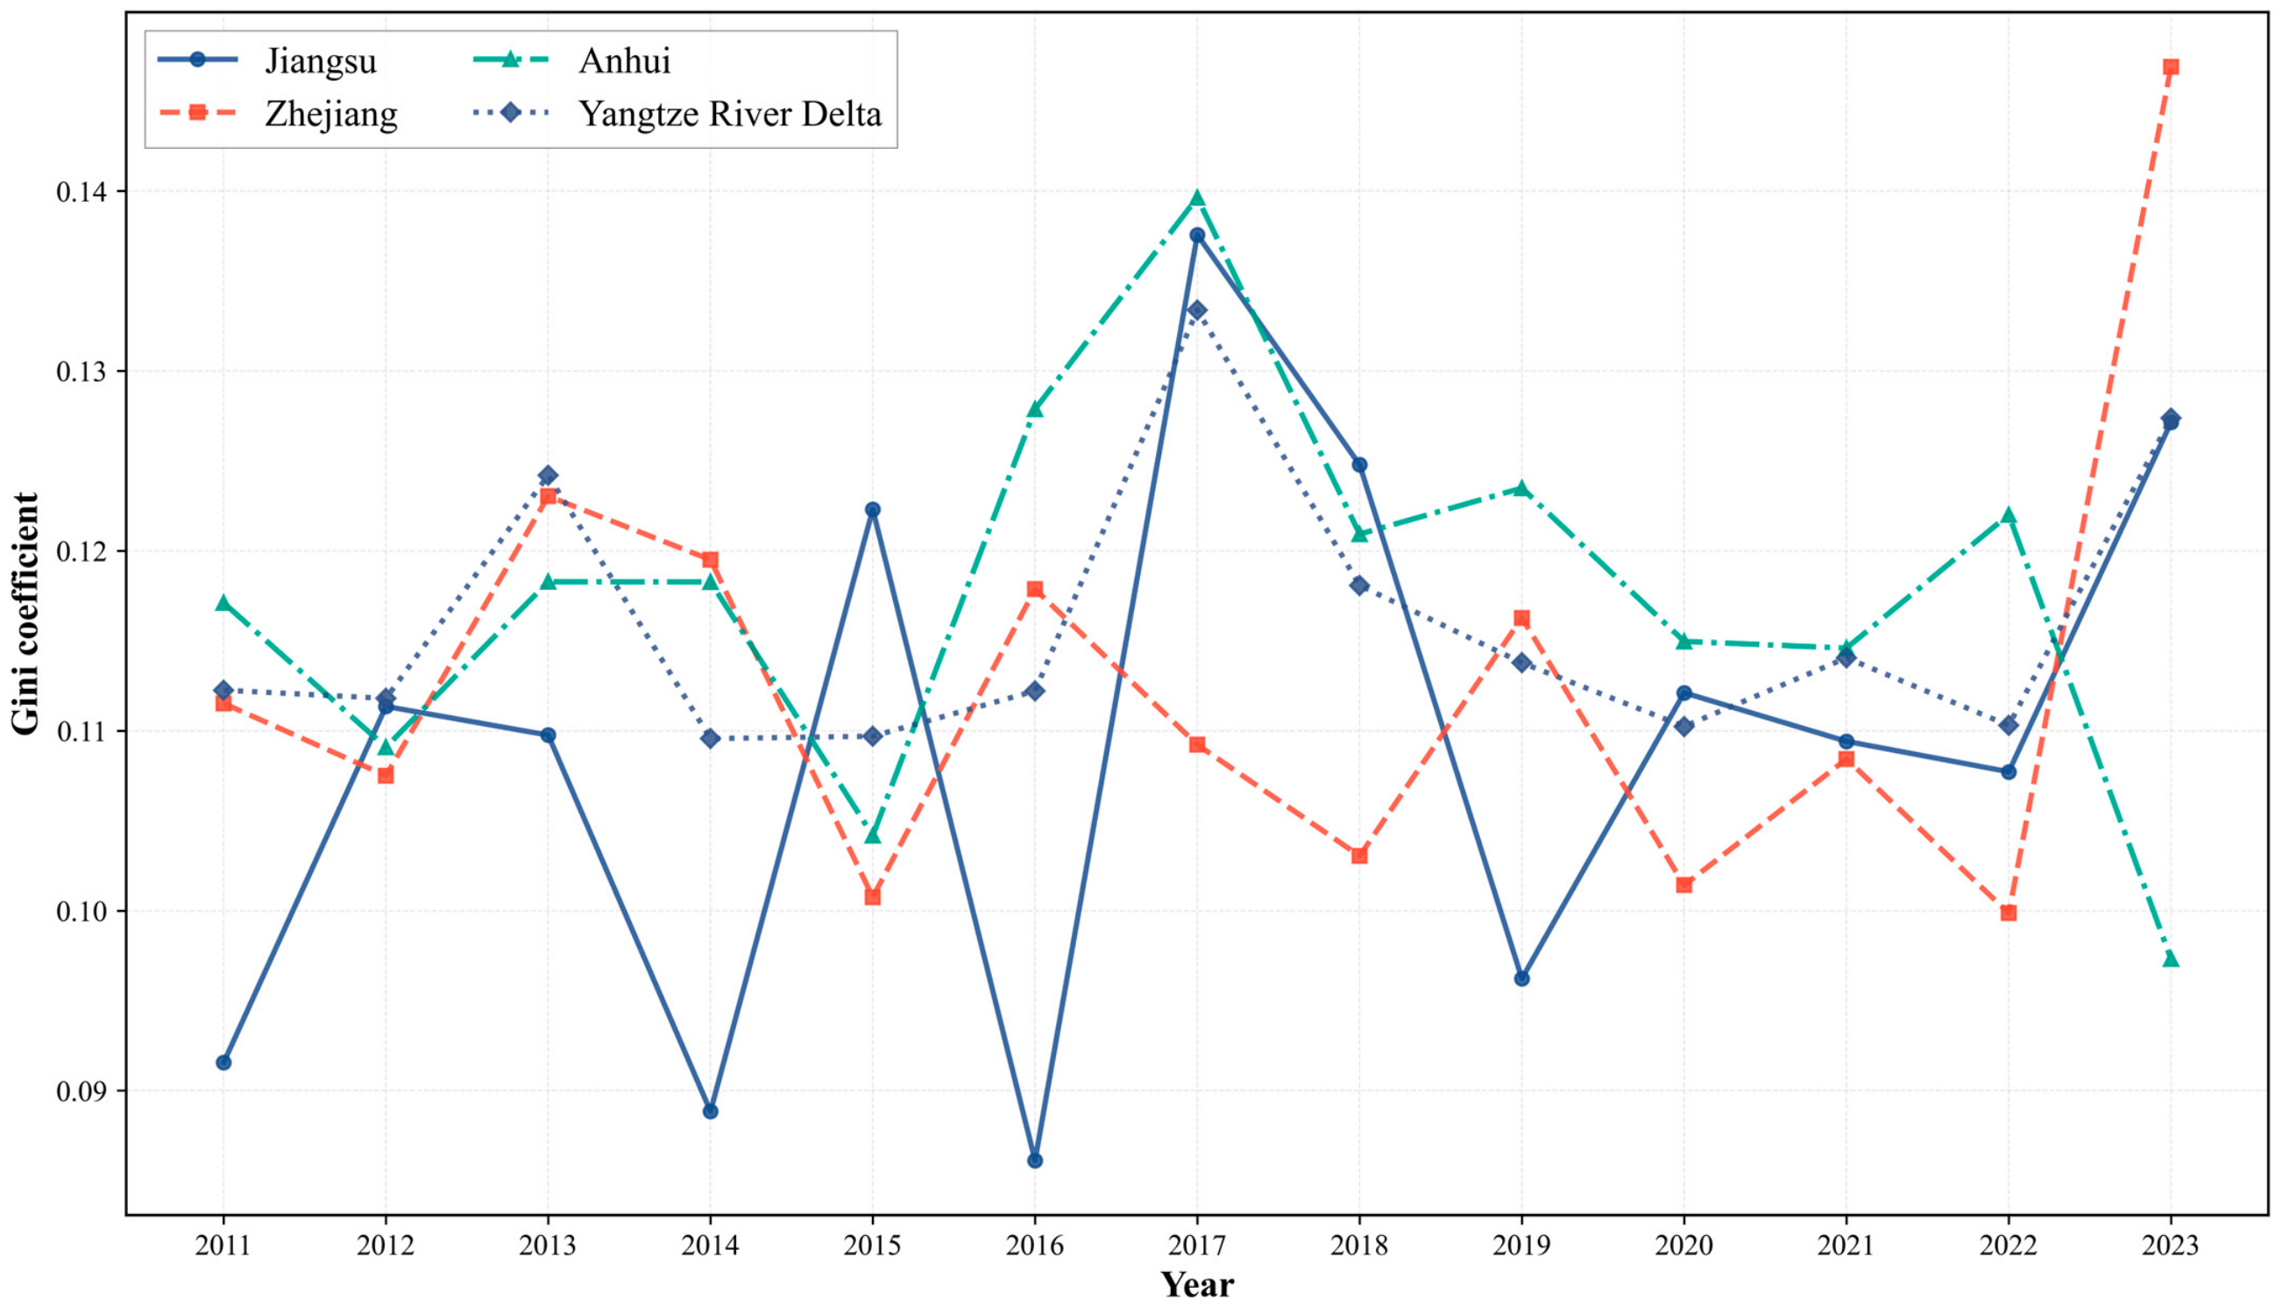
Figure 5 shows the Gini coefficients of eco-efficiency of the governance–production nexus in the YRD, as well as those for Jiangsu, Zhejiang, and Anhui, from 2011 to 2023. For the YRD, eco-efficiency disparities increased, with fluctuations, before 2017. In 2018, the upgrade of the YRD regional integration initiative to a national strategy and the implementation of policies for coordinated environmental governance began to take effect [34]. Consequently, the degree of disparity in eco-efficiency gradually declined. However, by 2023, the digital economy’s rapid expansion may have further intensified the “Matthew effect,” whereby the strong become stronger, widening eco-efficiency disparities again. Thus, internal eco-efficiency disparities within the YRD followed a pattern of “widening–narrowing–widening,” and the overall level of inequality has continued to rise.
Figure 5.
Trends in overall and within-province disparities in the eco-efficiency of the governance–production nexus in the Yangtze River Delta.
3.3.2. Within-Province Disparities
Throughout the study period, Jiangsu’s Gini coefficient for eco-efficiency fluctuated, with particularly sharp volatilities in 2016 and 2017. As shown in Figure 5, Jiangsu’s Gini coefficient dropped to a marked trough in 2016 (0.086) and then surged to 0.138 in 2017. A fluctuation of more than 60% over just two years makes Jiangsu the most volatile of the three provinces. 2016 marked the first year of full-scale central environmental inspections. In July 2016, the third central environmental inspection team was stationed in Jiangsu for one month. Under this pressure, Jiangsu quickly launched rectification measures while vigorously promoting “four batches” of chemical enterprises (shutting down a batch, relocating a batch, upgrading a batch, and reorganizing a batch). In 2016, Jiangsu’s local governments made unprecedented efforts in pollution control, significantly improving government governance efficiency. Consequently, intra-provincial eco-efficiency disparities temporarily narrowed, and the Gini coefficient fell to a low level. By 2017, some enterprises that had been shut down in 2016 resumed production after completing rectification. Simultaneously, Jiangsu fully implemented the 13th Five-Year Plan for environmental protection, further deepened supply-side structural reform, promoted energy-saving and emission-reduction upgrades in coal-fired power, carried out coal-fired boiler remediation, and vigorously developed clean energy. These policies may have affected southern, central, and northern Jiangsu differently. Differences in the speed and effectiveness of the transition among these subregions may have contributed to a sharp widening of intra-provincial eco-efficiency gaps, with the Gini coefficient peaking in 2017. After 2018, Jiangsu’s eco-efficiency Gini coefficient gradually declined and tended to stabilize. This decline coincided with the implementation of the YRD integration strategy, which facilitated interregional flows of technology, capital, and talent [35]. Under the spillover effects of southern Jiangsu, the pace of eco-efficiency improvement accelerated in central and northern Jiangsu. However, in 2023, eco-efficiency disparities increased slightly again. Overall, the degree of disparity in eco-efficiency within Jiangsu increased over the study period.
Zhejiang’s Gini coefficient displays an overall upward trend, rising from 0.112 in 2011 to 0.147 in 2023. This pattern may be associated with the province’s development model and policy orientation. In 2005, during a visit to Anji County, Xi Jinping, then Secretary of the Zhejiang Provincial Party Committee, advocated the scientific thesis that “lucid waters and lush mountains are invaluable assets” [36]. Guided by this concept, Zhejiang has adhered to ecological priority and green development, accelerated the green and low-carbon transformation of traditional industries, and built an industrial production system characterized by efficient resource use and environmental friendliness. However, improvements in eco-efficiency have been uneven across the province. This imbalance in urban development has gradually widened intra-provincial eco-efficiency disparities. Especially after 2020, as Zhejiang vigorously advanced “digital reform” and the “dual carbon” strategy, differences among cities in technological innovation and industrial transformation became more pronounced. Consequently, the Gini coefficient continued to rise, peaking in 2023.
Anhui’s Gini coefficient was relatively low in 2011 (0.117). It rose rapidly to 0.140 in 2017, marking the peak of intra-provincial disparities, and began to decline after 2018. However, it remained the highest among the three provinces for an extended period. Although the central environmental inspections and supply-side reforms in 2016–2017 also affected Anhui, the difficulty of industrial upgrading and the large backlog in environmental infrastructure may have limited in intra-provincial disparities. After 2018, with the advancement of the YRD integration strategy [35], Anhui deepened regional coordinated development, which coincided with a notable reduction in intra-provincial eco-efficiency disparities.
3.3.3. Inter-Provincial Disparities
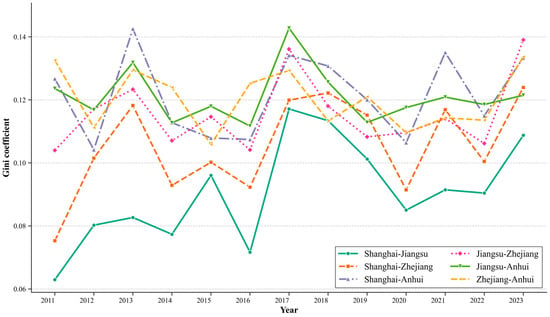
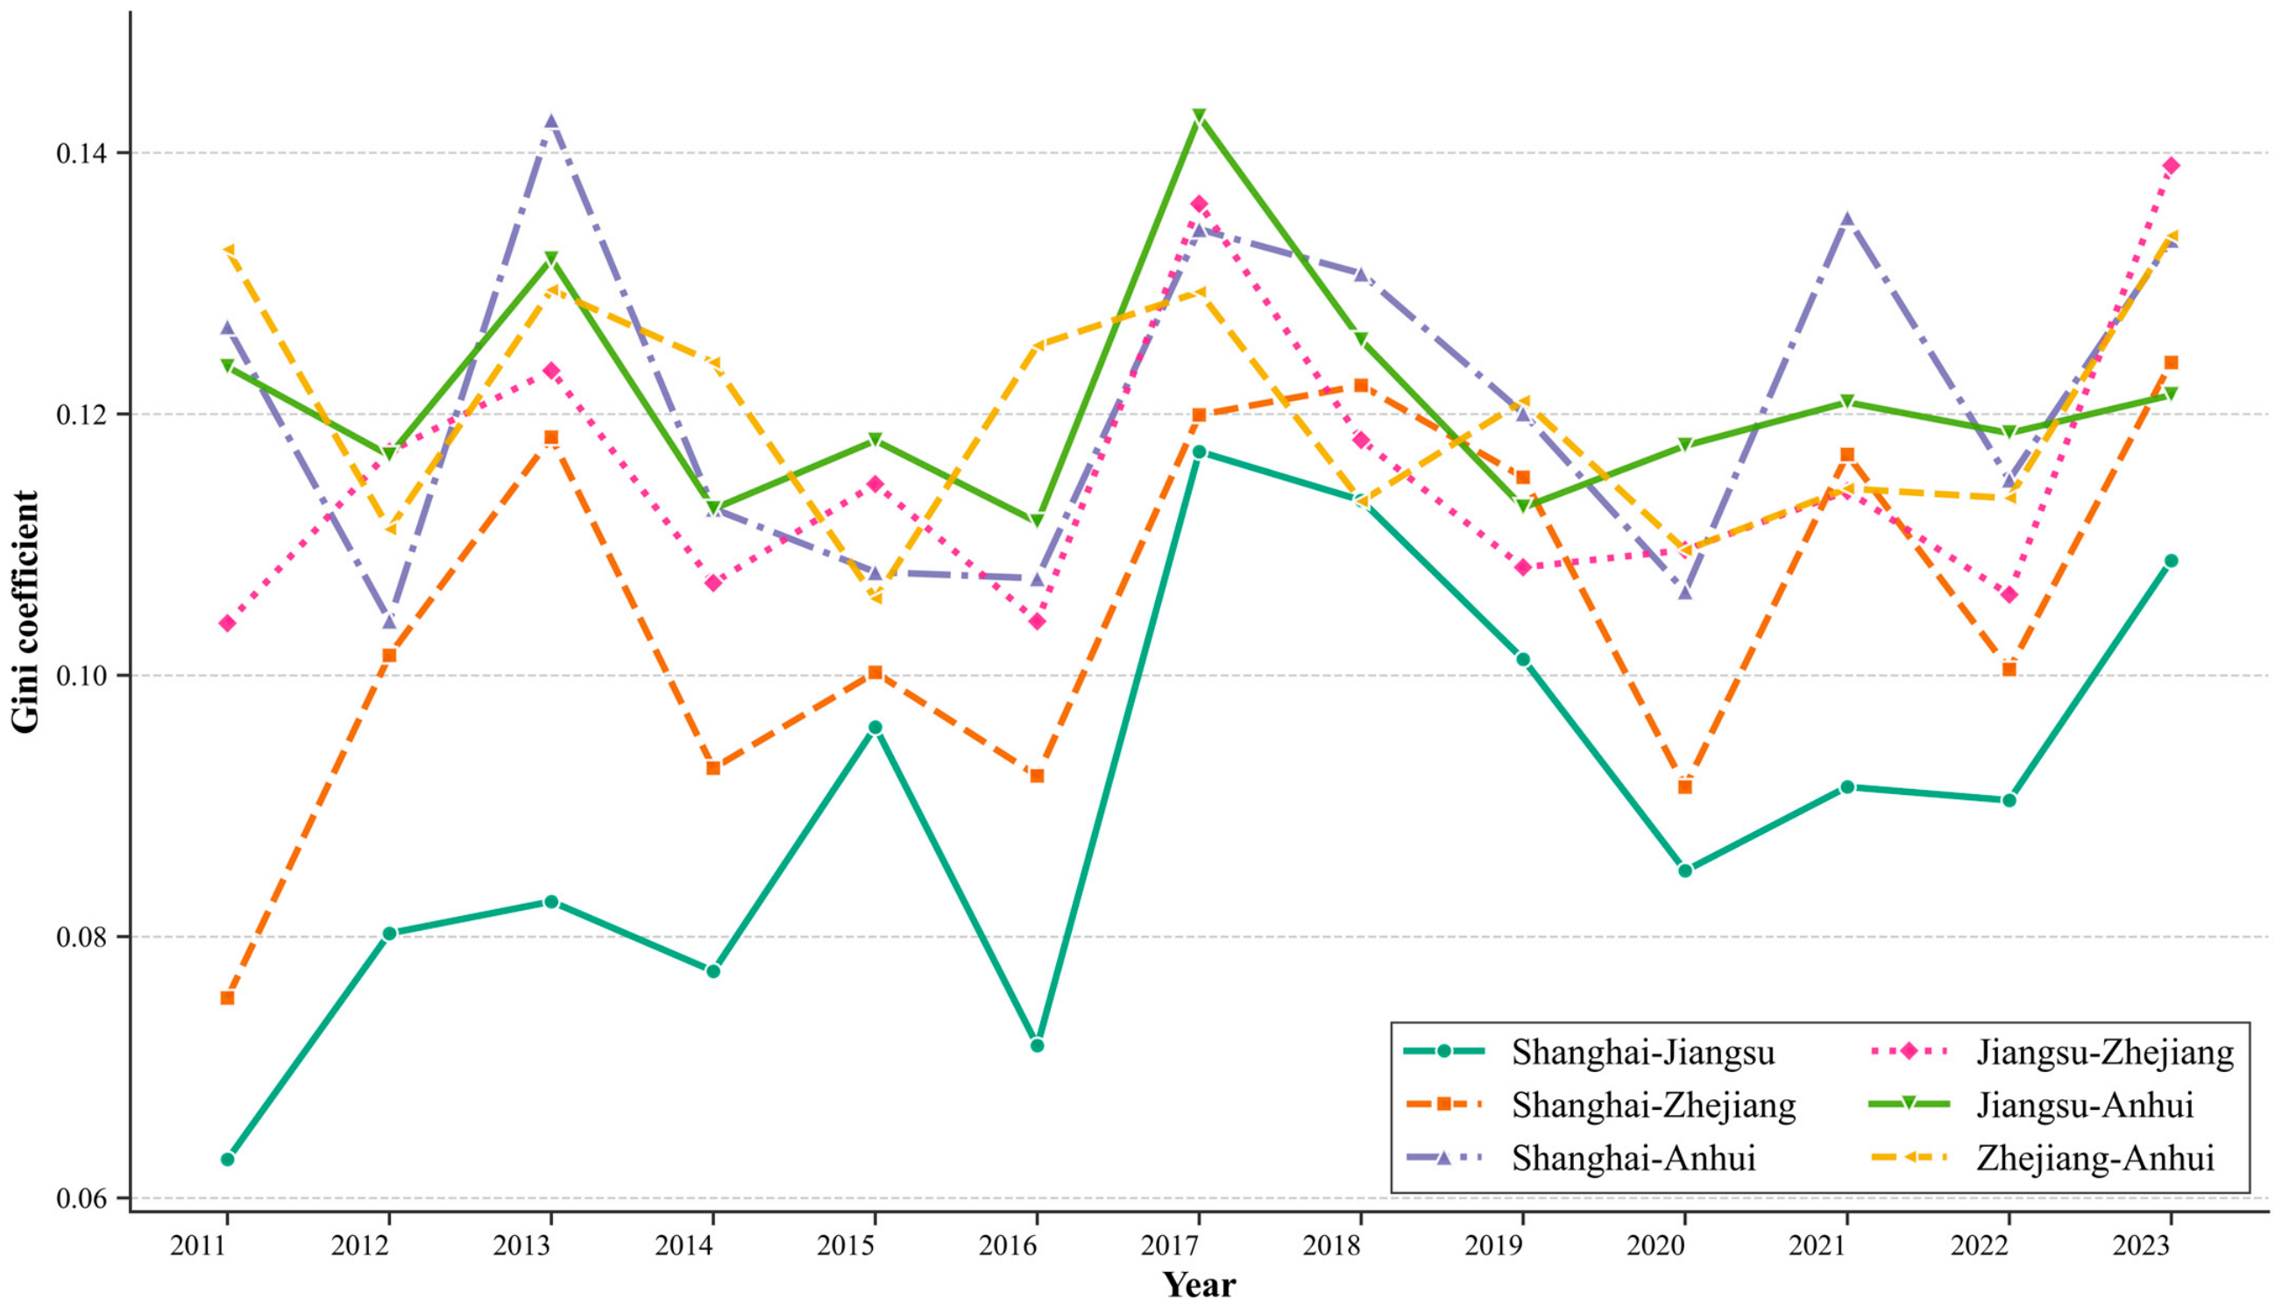
Eco-efficiency disparities among the three provinces and one municipality do not show monotonic convergence or divergence but rather exhibit pronounced volatility, as shown in Figure 6. The year 2017 marked a key turning point. In that year, the Gini coefficients for all inter-provincial pairs either reached or approached their historical peaks, forming a clear “disparity summit.” Subsequently, disparities generally narrowed during 2018–2020 but widened again after 2021. By 2023, most inter-provincial Gini coefficients had rebounded to the 0.12–0.14 range, approaching the 2017 levels. The Gini coefficient between Shanghai and Jiangsu remained relatively low (0.08–0.12 in most years) and even fell to its minimum value (0.072) in 2016, indicating that eco-efficiency levels in Shanghai and Jiangsu are relatively similar. The Shanghai–Zhejiang disparity, while fluctuating, was generally lower than that of any pairing involving Anhui but higher than the Shanghai–Jiangsu disparity. The three pairs involving Anhui (Shanghai–Anhui, Jiangsu–Anhui, Zhejiang–Anhui) showed marked instability, suggesting that Anhui’s catch-up process in eco-efficiency may have been characterized by significant phase-by-phase swings.
Figure 6.
Trends in inter-provincial disparities in the eco-efficiency of the governance–production nexus in the Yangtze River Delta.
In 2017, central environmental inspections covered all provinces. Differences in the intensity of local responses and rectification costs may have contributed to the broad expansion of inter-provincial disparities observed that year. In 2018, the elevation of the YRD integration to a national strategy coincided with the convergence of regional environmental standards [37], establishment of joint prevention and control mechanisms for environmental protection, and enhanced coordination in government governance. These developments may have contributed to an inter-provincial convergence phase in eco-efficiency from 2018 to 2020, with most inter-provincial Gini coefficients falling to period lows in 2020. At the end of 2019, the COVID-19 pandemic caused a broad contraction in economic activity, with production efficiency declining simultaneously across provinces. Under emergency conditions, government governance efficiency converged as all governments shifted their focus toward pandemic control, making 2020 one of the years with the smallest eco-efficiency disparities. However, this trend did not continue after 2021. Following the end of the COVID-19 pandemic, asymmetric economic recovery emerged among provinces and municipalities, and by 2023, eco-efficiency disparities had rebounded across all inter-provincial pairings.
3.3.4. Sources of Disparities and Their Contributions
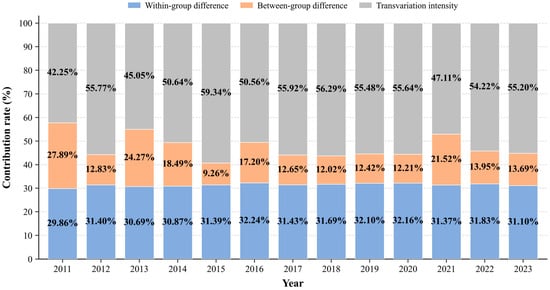
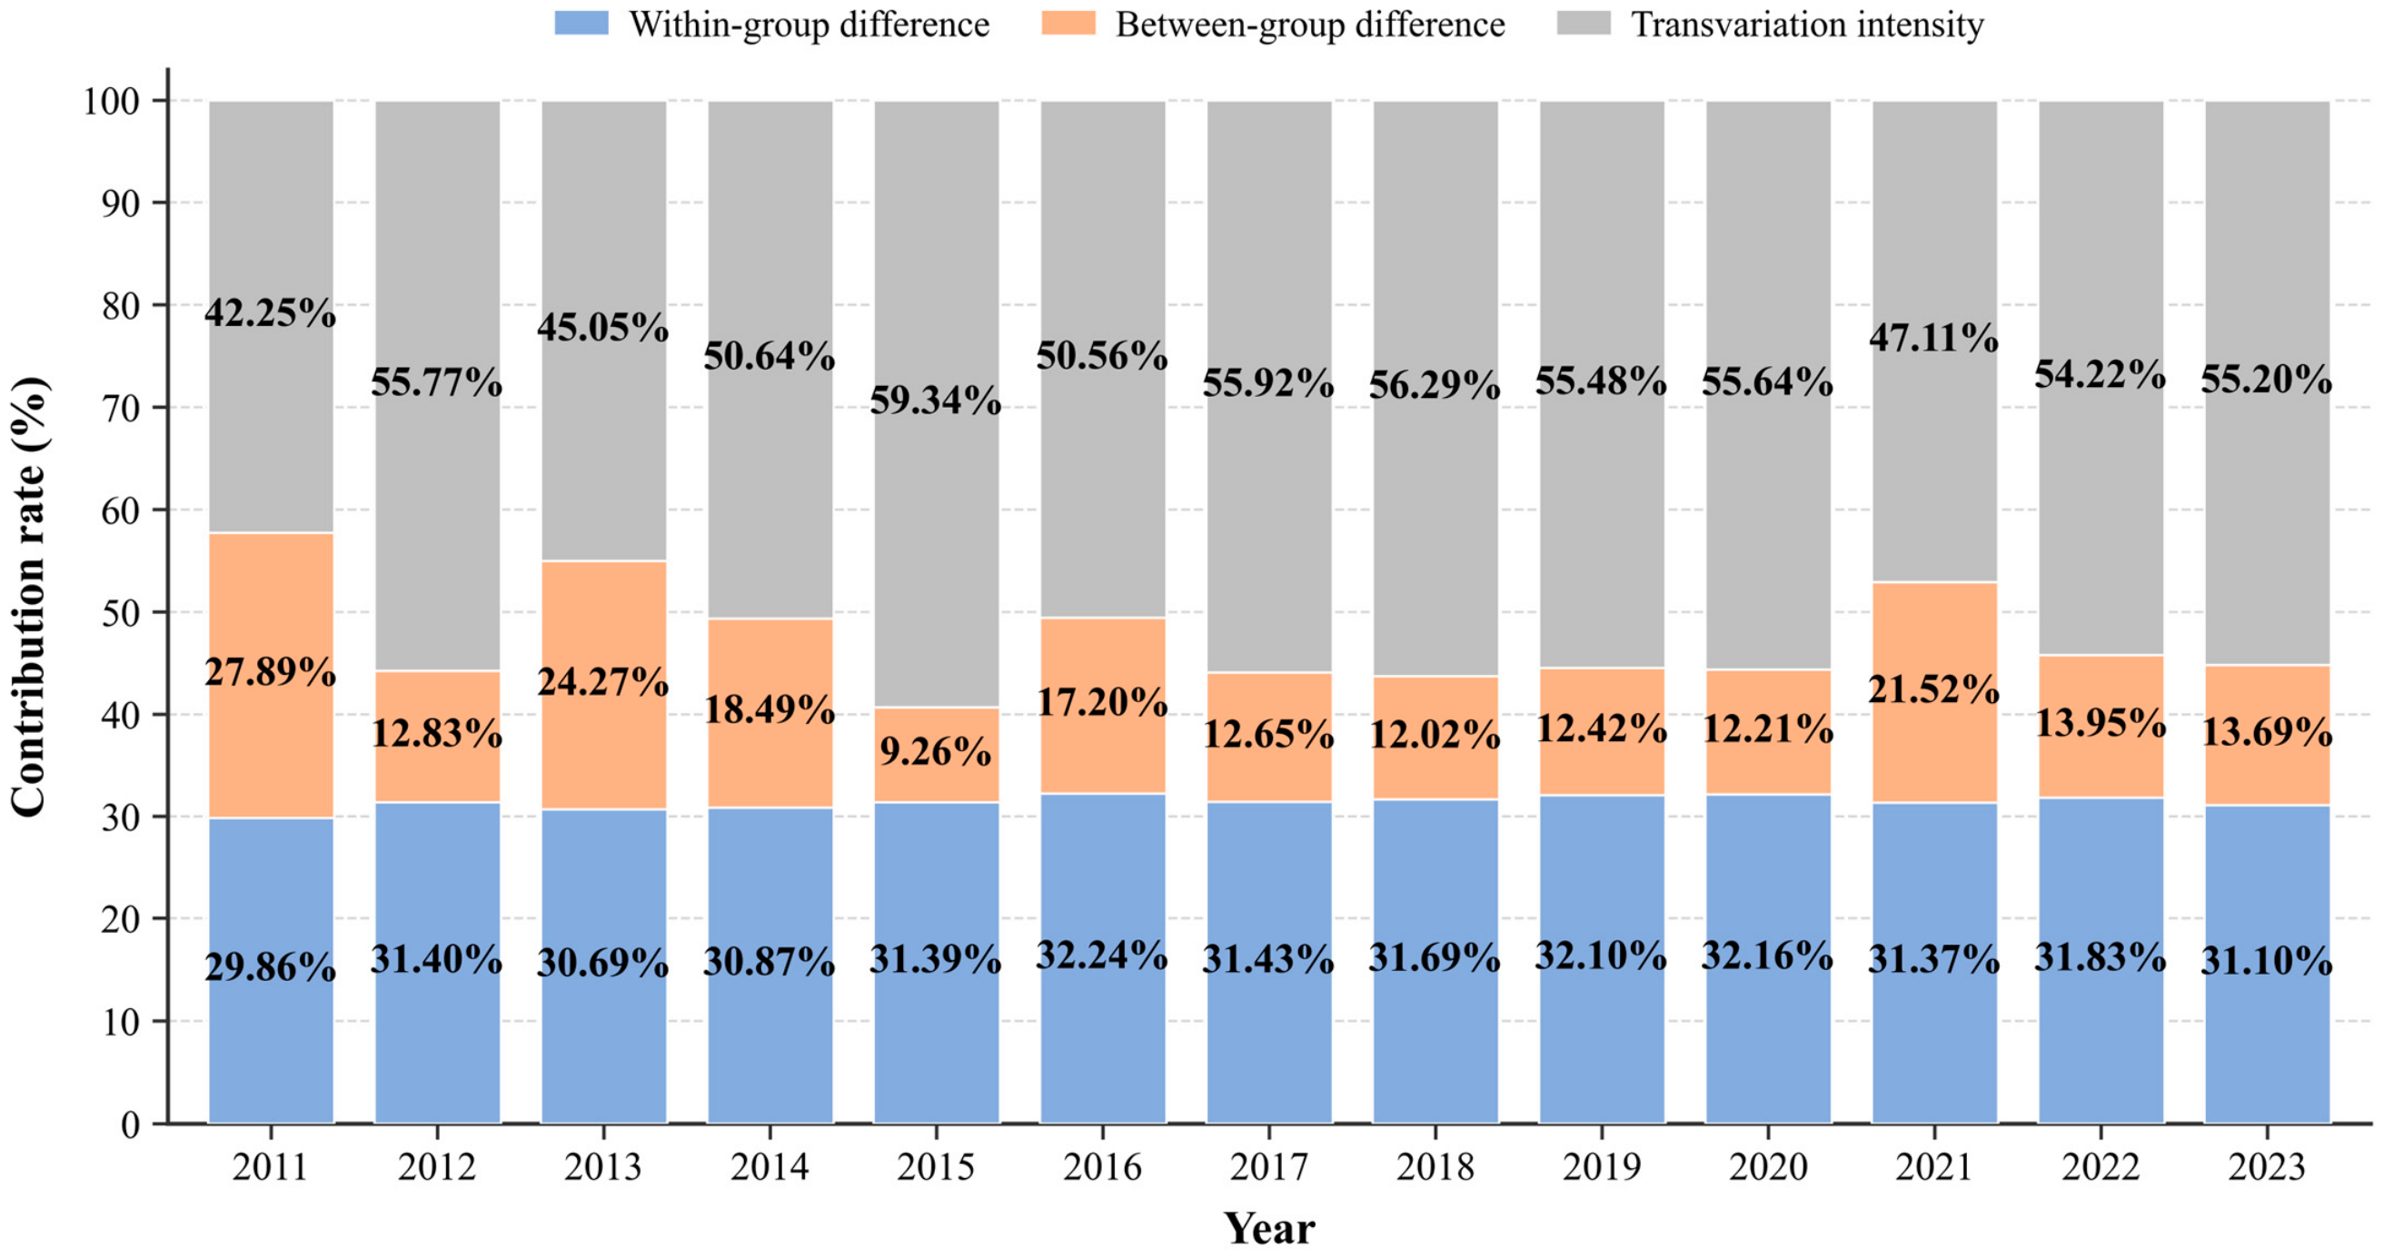
As shown in Figure 7, from 2011 to 2023, the contribution structure of eco-efficiency disparities in the YRD exhibits a pattern in which transvariation density is the dominant contributor, followed by within-group differences, whereas the contribution of between-group differences gradually weakens. The contribution of transvariation density remains relatively stable at approximately 55%, indicating that the substantial overlap among the provincial eco-efficiency distributions has become the primary source of disparities. The contribution of within-group differences is stable and slightly increasing, staying approximately 31% over the long term, suggesting that intra-provincial disparities are a stable secondary source. Contrarily, the contribution of between-group differences fluctuates sharply but shows an overall declining trend.
Figure 7.
Trends in the sources and contributions of disparities of the eco-efficiency of governance–production nexus in the Yangtze River Delta.
In 2010, the State Council approved the first regional plan for the YRD, and in 2018 this strategy was elevated to a national strategy [38]. Since then, the three provinces and one municipality have become more closely aligned in terms of environmental access standards and the stringency of environmental inspections. This has blurred the hierarchical boundaries of eco-efficiency among regions, leading to substantial overlap between subgroups. Furthermore, the cluster effects of industrial isomorphism have further increased the overlap of eco-efficiency distributions across provinces. For example, the homogenized layout of green industries, such as new energy vehicles and photovoltaics, across YRD cities has resulted in extensive intersection in the eco-efficiency distributions of each province. The narrowing of between-group disparities can be attributed to two main factors: (i) Hard constraints on government governance dimensions, such as environmental protection investment and energy consumption control, have converged across the three provinces and one municipality, significantly compressing the space for institutional differences at the inter-provincial level. (ii) As industries in Jiangsu, Zhejiang, and Shanghai have been transferred in an orderly manner to Anhui, and as green manufacturing technologies have been popularized and diffused, technological gaps among these provinces have also narrowed and stabilized at a relatively low level. Despite this institutional and technological convergence across provinces, differences in governmental governance and production efficiencies within each province persist, and this internal heterogeneity exhibits strong path dependence. Consequently, the contributions of within-group disparities remain relatively stable.
Viewed against international evidence, the YRD results support the view that spatial eco-efficiency trajectories are heterogeneous rather than uniform. Studies of Colombian cities, Italian provincial capitals, and global cities likewise report substantial variation in aggregate environmental or sustainability performance [6,7,8]. At broader spatial scales, Camarero et al. [9] found that the most and least eco-efficient OECD countries tended to form separate convergence clubs, whereas Bianchi et al. [10] reported an overall improvement in eco-efficiency across 282 European regions but found no uniform convergence toward a common level. These findings are consistent with the coexistence of narrowing net between-province disparities, persistent within-province heterogeneity, and extensive transvariation across provincial distributions in the YRD. Matsumoto et al. [11] further showed that environmental performance in 27 EU countries fluctuated over time and was adversely affected by the 2007–2008 financial crisis, particularly in eastern EU countries. Although the financial crisis and the COVID-19 shock differ in their origins and transmission mechanisms, both suggest that environmental performance is sensitive to major external disruptions. In the YRD, the temporary narrowing of regional disparities during the COVID-19 period and their subsequent widening may similarly reflect a common shock followed by uneven recovery. These comparisons are qualitative rather than numerical because the studies differ in spatial scale, indicator design, sample period, and institutional setting.
3.4. Analysis of Pathways for Improving the Eco-Efficiency of the Governance–Production Nexus in the Yangtze River Delta
3.4.1. Analysis of Internal Driving Factors
Using Equations (2) and (3), the eco-efficiency of the governance–production nexus in the YRD is decomposed into government governance and production efficiencies, as shown in Table 3. The average eco-efficiency of the governance–production nexus in the YRD is 0.812, indicating a generally high level. Most cities have eco-efficiency values above 0.6; however, several cities have values below this level, including Zhenjiang (0.597), Zhoushan (0.595), and Ma’anshan (0.539). The average government governance efficiency in the YRD is 0.817, and the average production efficiency is 0.816, suggesting that government governance and production efficiencies are generally well balanced. Government governance efficiency exceeds production efficiency in 16 cities, is lower than production efficiency in 23 cities, and is equal to production efficiency in two cities (Nanjing and Hangzhou), indicating relatively well-coordinated development between the government and market systems.
Table 3.
Internal decomposition results of the eco-efficiency of the governance–production nexus in the Yangtze River Delta.
When government governance efficiency is significantly lower than production efficiency (defined as a gap of 0.1 or more), governance efficiency requires improvement. Conversely, when production efficiency is significantly lower, it becomes the priority for improvement. In Zhoushan, Zhenjiang, Yangzhou, Shaoxing, and Ningbo, government governance efficiency is markedly lower than production efficiency, with gaps of 0.226, 0.183, 0.170, 0.162, and 0.116, respectively. These cities exhibit efficiency deficiencies in policy implementation, ecological regulation, and public service provision and therefore need to strengthen government governance efficiency. In Huaibei, Huainan, Ma’anshan, Suqian, Xuzhou, and Suzhou (Anhui), production efficiency is significantly lower than government governance efficiency, with gaps of 0.294, 0.156, 0.155, 0.152, 0.136, and 0.100, respectively. In these cities, public services and governance outcomes are relatively strong, but economic development suffers from efficiency weaknesses. Accordingly, these cities should optimize resource allocation and industrial chains to enhance production efficiency.
Developed cities such as Shanghai, Nanjing, Hangzhou, Wuxi, and Wenzhou perform well across all three dimensions, eco-efficiency, government governance efficiency, and production efficiency, nearly reaching full marks. This indicates that these economically advanced cities possess strong green development capacities and high governance standards. Conversely, cities such as Ma’anshan, Lianyungang, Zhoushan, and Zhenjiang display a pronounced “dual low” in both government governance efficiency and production efficiency, suggesting substantial room for improvement in promoting industrial transformation and upgrading and enhancing public governance capacity. Notably, some less-developed cities in the YRD, such as Fuyang, Lishui, Bozhou, Huangshan, and Chizhou, also exhibit relatively high levels of eco-efficiency and government governance and production efficiencies. This is mainly attributable to the combined effect of refined government governance and a light/green industrial structure. For instance, Lishui, which is at the forefront of Zhejiang’s digital governance and the “At Most One Visit” reform, has implemented mechanisms for realizing the value of ecological products (such as the “Lishui ShanGeng” brand) [39]. Its industries are dominated by eco-tourism, green manufacturing, and specialty agriculture, characterized by low pollution base and strong environmental governance.
3.4.2. Analysis of External Driving Factors
Using Moran’s index, we test whether eco-efficiency and its decomposed indices (government governance and production efficiencies) exhibit spatial correlation (see Table 4). Before the YRD regional integration development plan was elevated to a national strategy, local governments engaged in yardstick competition: neighboring cities imitated one another in investment promotion, environmental regulation, and administrative approval, leading to the geographical clustering of regions with similar governance levels. After the plan was elevated to a national strategy in 2018, Moran’s I for governance efficiency declined to around zero, indicating that the newly established governance coordination mechanisms weakened the previous spatial dependence. The Outline of the Yangtze River Delta Regional Integration Development Plan established cross-provincial coordination mechanisms (such as the Demonstration Zone for Ecological and Green Integrated Development in the Yangtze River Delta) [40]. As a result, neighboring cities no longer need to compete by imitation but instead improve government governance through institutionalized coordination. Contrarily, production efficiency does not exhibit spatial correlation in many periods, which in turn implies that the eco-efficiency of governance–production nexus also lacks spatial dependence in multiple periods. On this basis, this study employs a panel Tobit model to explore the external drivers of the eco-efficiency of the governance–production nexus.
Table 4.
Spatial correlation tests for the eco-efficiency of governance–production nexus and its decomposition in the Yangtze River Delta.
This study initially selects fiscal pressure, urbanization, openness, fiscal investment intensity, economic density, education expenditure level, industrial upgrading, and S&T expenditure as potential determinants of eco-efficiency. Fiscal pressure is measured as (general government expenditure–general government revenue)/GDP; urbanization as urban population/total population; openness as total imports and exports/GDP; fiscal investment intensity as fixed asset investment/general government expenditure; economic density as nighttime light intensity [41]; education expenditure level as education expenditure/general government expenditure; industrial upgrading as tertiary industry output/secondary industry output; and S&T expenditure as per capita S&T expenditure. The LR test strongly rejects the null hypothesis of “no random effects;” therefore, a random-effects panel Tobit model is adopted to investigate the determinants of eco-efficiency.
The baseline specification includes the four explanatory variables derived directly from the theoretical framework: economic density, education expenditure, industrial upgrading, and the logarithm of per capita S&T expenditure. The extended specification additionally controls for fiscal pressure, urbanization, openness, and fiscal investment intensity. After these controls are introduced, the signs of all four core coefficients remain unchanged across the overall, governance, and production efficiency equations. For overall and production efficiency, the pattern of statistical significance at the 5% level remains unchanged. In the governance efficiency equation, economic density and the logarithm of per capita S&T expenditure retain their baseline signs, although their significance weakens from the 5% to the 10% level, whereas education expenditure and industrial upgrading remain significant at the 1% level. The principal findings are therefore qualitatively robust to the inclusion of the additional controls, although some stage-specific estimates become less precise. Among the additional controls, fiscal investment intensity is positively associated with governance efficiency at the 5% level, while openness is positively associated with production efficiency at the 10% level. None of the additional controls is statistically significant in the overall eco-efficiency equation. To establish temporal ordering and allow time for socioeconomic and policy factors to influence eco-efficiency, all explanatory variables are lagged by one year. Consequently, the estimation sample covers 2012–2023 and comprises 492 city–year observations from 41 cities.
Table 5 reports the direct effects of each factor on the eco-efficiency of the governance–production nexus. The results show that education expenditure (1.338), industrial upgrading (0.118), and economic density (0.010) are all significantly positive at the 5% level, whereas S&T expenditure is significantly negative at the 5% level (−0.045). Comparing the direct effects of the determinants on the eco-efficiency of governance–production nexus with the weighted total effects of government governance and production efficiencies (with weights of 1/3 for governance efficiency and 2/3 for production efficiency) [13], we find a high degree of consistency between the direct effects and weighted total effects (e.g., education expenditure 1.338 vs. 1.304; industrial upgrading 0.118 vs. 0.123). This confirms the mathematical completeness of the channel decomposition and indicates that governance and production channels essentially exhaust the pathways through which these factors influence eco-efficiency.
Table 5.
Effects of external driving factors on the eco-efficiency of the governance–production nexus and channel decomposition.
Economic density exerts a significant effect only through the governance channel (coefficient of government governance efficiency: 0.010, p < 0.05), whereas its contribution through the production channel, although as high as 54.36%, is not statistically significant. This suggests that, in the YRD, the environmental improvement effect of economic agglomeration is realized by enhancing environmental governance capacity rather than changing production technology. First, the concentration of pollution emissions associated with agglomeration creates pronounced environmental externalities, which, in turn, force governments to establish stricter regulatory systems, more professional environmental law enforcement teams, and more advanced monitoring technologies. Second, the economic activity reflected by nighttime lights generates substantial fiscal revenue, providing the financial support required for environmental governance. Finally, the concentration of pollution facilitates large-scale, centralized treatment, such as the unified construction of wastewater treatment plants, which lowers the unit cost of environmental management. Production efficiency responds heterogeneously to economic agglomeration. On one hand, agglomeration can enhance production efficiency through economies of scale and technological spillovers. On the other hand, it can reduce production efficiency by causing congestion and increasing land prices.
Education expenditure exhibits a typical “high-governance-effect–high-production-contribution” decoupling pattern. The direct effects show that the marginal impact of education expenditure on governance efficiency (1.732) is 58.9% greater than that on production efficiency (1.090). However, because overall eco-efficiency is dominated by production efficiency, the weighted contributions show the opposite pattern, with the production channel accounting for 55.73% of the total contribution. This finding highlights the importance of subprocess weights: even when a factor is more responsive in the governance process, its overall impact remains constrained when the process has a relatively low weight in aggregate performance. The Wald test indicates that the difference between the two channels is not statistically significant (Z = −0.49, p = 0.622), suggesting that the promoting effect of education expenditure on eco-efficiency in the YRD is essentially a balanced dual-engine drive.
Industrial upgrading has significant effects through both channels, with a stronger governance effect (0.177) than production effect (0.096), although the production channel’s contribution share (52.13%) is slightly higher than that of the governance channel. This reflects the co-evolution of industrial structure upgrades and governance capacity building in the YRD. On the production side, the substitution of services for manufacturing directly reduces energy use and emissions per unit of GDP, enhancing production efficiency. On the governance side, the tax revenue generated by industrial upgrading strengthens the government’s capacity for environmental investment, whereas the stringent environmental regulations and public service requirements of high-end industries (including intellectual property protection and business environment optimization) encourage governments to adopt more refined governance.
S&T expenditure shows a significant negative effect through both channels, with the production channel playing a dominant role (71.60%). S&T expenditure has significant negative impacts on both governance and production efficiencies (−0.045 and −0.057), which runs counter to the conventional view that technological progress promotes green transformation. This paradoxical result may stem from two factors. First, there is a rebound effect: cleaner technologies reduce unit costs, stimulate output expansion, and ultimately increase total pollution. Second, part of the S&T expenditure may be directed toward technological upgrades of traditional capacity rather than genuine green technological breakthroughs, resulting in “pseudo innovation.” The fact that 71.60% of the total effect is transmitted through the production channel indicates that the negative impact of S&T expenditure mainly operates through the production pathway and that its deterioration of the production frontier is more pronounced than its erosion of governance capacity.
To examine whether the estimated relationships are sensitive to the DEA specification, econometric estimator, and sample composition, four robustness checks are conducted. First, eco-efficiency is recalculated using equal weights for the governance and production stages (1/2 and 1/2, respectively), instead of the baseline weights of 1/3 and 2/3. Second, the DEA window width is expanded from three to four years while retaining the baseline stage weights. The lagged random-effects Tobit model is then re-estimated using each alternative eco-efficiency measure. Third, the baseline model is re-estimated using an OLS specification with both city and year fixed effects. Fourth, Shanghai is excluded from the sample, and the random-effects Tobit model is re-estimated. As in the baseline specification, all explanatory variables enter the regressions with a one-year lag. The results are reported in Table 6.
Table 6.
Robustness checks for the effects of external driving factors on eco-efficiency.
The signs of the four coefficients remain unchanged across all specifications: economic density, education expenditure, and industrial upgrading are positively associated with eco-efficiency, whereas S&T expenditure is negatively associated with eco-efficiency. Nevertheless, the statistical precision of some estimates varies. When the DEA window width is increased to four years, the coefficient of economic density remains positive but is significant only at the 10% level (coefficient = 0.0073, p = 0.0745). In the two-way fixed-effects OLS specification, the coefficient of industrial upgrading also remains positive but is not statistically significant at conventional levels (coefficient = 0.0922, p = 0.1089). The remaining estimates retain their baseline directions and remain statistically significant at conventional levels. Excluding Shanghai likewise does not alter the signs of the estimated coefficients. Overall, these results suggest that the main qualitative associations are not driven by the baseline stage weights, DEA window width, econometric specification, or the inclusion of Shanghai.
4. Conclusions
4.1. Major Findings and Managerial Implications
Considering governance–production nexus, this paper constructs a network DEA model to measure the eco-efficiency of the YRD from 2011 to 2023, decomposes eco-efficiency into government governance and production efficiencies, and employs a random-effects panel Tobit model to examine the impacts of various factors on eco-efficiency, identifying the contribution of governance efficiency and production efficiency as mediating channels. The major findings and managerial implications are summarized in the following:
First, traditional “black-box” measurements underestimate eco-efficiency and cannot identify its dual-channel transmission mechanism. Relying on the “effective market and proactive government” framework, eco-efficiency should be enhanced through the coordinated optimization of government governance and production operations. On one hand, the system of zoned ecological and environmental control should be deepened by implementing differentiated governance according to regional resource endowments and environmental carrying capacities. Improving government governance efficiency should be treated as an important lever for realizing the value of ecological products, using policy tools, such as ecological compensation and green taxation to transform ecological advantages into economic and social development advantages. On the other hand, because education expenditure and industrial upgrading influence eco-efficiency primarily through the production channel, the market-based resource allocation system should be improved. Carbon emission, energy-use, water-use, and pollution discharge rights should be incorporated into the overall reform package for factor marketization, enabling market mechanisms to incentivize firms in enhancing production efficiency. Concurrently, a normalized network DEA evaluation mechanism for eco-efficiency should be established to break with traditional “black-box” assessment models, bringing government environmental governance inputs and industrial green outputs into a unified assessment framework. This would help identify bottlenecks in eco-efficiency improvement and provide data support for the transition to dual control of energy consumption and carbon emissions.
Second, eco-efficiency in the YRD exhibits a fluctuating pattern of “decline–rebound–decline again,” with “polarization” particularly pronounced before and after the COVID-19 pandemic. However, after the integration strategy was elevated to a national strategy in 2018, regional disparities narrowed significantly, and inter-regional transvariation intensity became the largest contributor to eco-efficiency disparities, indicating that coordinated cross-boundary governance is a key lever for narrowing gaps. For adjacent interprovincial areas with large eco-efficiency gaps, such as the Jiangsu–Anhui border, where transvariation intensity contributes heavily, a special cross-provincial cooperation mechanism should be established to enhance eco-efficiency. This mechanism would promote unified ecological and environmental access lists and pollution-control performance evaluation standards for key cross-boundary river basins, such as the Lake Taihu region, the Grand Canal, and the Xin’anjiang–Qiandao Lake system. Simultaneously, efforts should be made to explore a dynamic monitoring and early-warning platform for cross-administrative eco-efficiency disparities.
Third, education expenditure and industrial upgrading significantly enhance eco-efficiency mainly through the production channel, whereas S&T expenditure exerts a significant negative effect. This apparent paradox reveals structural blockages between technological innovation and the translation of green productivity. Some S&T expenditures do not effectively align with the demands of green and low-carbon transition, or there are bottlenecks in the chain by which technological achievements are translated into eco-efficiency improvement. The Decision on Promoting Coordinated S&T Innovation in the Yangtze River Delta, to be implemented simultaneously by the three provinces and one municipality in 2025, explicitly proposes reforms, including “promoting deep integration of S&T innovation and industrial innovation [42].” Using these initiatives as a foundation, the YRD should reshape the green performance orientation of S&T investment, carry out ex-post evaluation and dynamic calibration of regional S&T input performance, and incorporate indicators such as green patents, contributions to carbon reduction, and resource-use efficiency into the evaluation systems of S&T innovation platforms. This will help ensure that S&T investment becomes a genuine green engine for improving eco-efficiency. Meanwhile, it is important to leverage the economic agglomeration effects reflected by nighttime light intensity to optimize urban spatial layouts and enhance economic density, thereby strengthening targeted government support for high-value-added, low-environmental-load industries through governance channels.
4.2. Limitations and Future Research
First, the governance-stage outputs used in this study, such as road infrastructure provision, student enrollment, and the number of physicians, represent the observable quantity of public-service provision rather than service quality or overall governance effectiveness. The VRS specification allows returns to vary with operating scale and avoids imposing a constant-returns technology; however, it cannot convert quantity-based outputs into quality-adjusted measures or account for unobserved differences in service accessibility and outcomes. Accordingly, governance efficiency should be interpreted as the relative technical efficiency with which measured governance inputs are transformed into observable public-service outputs rather than as a comprehensive assessment of governance quality. Because comparable city-level quality indicators are not consistently available for all 41 cities throughout 2011–2023, future research could incorporate educational outcomes, healthcare accessibility and outcomes, infrastructure accessibility and reliability, and environmental regulatory performance once harmonized panel data become available.
Second, the scope of inference is constrained by the observational research design and regional sample. Entering the explanatory variables with a one-year lag improves temporal ordering and mitigates contemporaneous simultaneity, while the reported robustness checks assess the stability of the estimates. Nevertheless, these procedures cannot eliminate endogeneity arising from time-varying omitted factors, measurement error, policy selection, or dynamic feedback. The estimated coefficients should therefore be interpreted as conditional associations rather than causal effects, and the stage-specific contribution shares as descriptive decompositions rather than causally identified mediation effects. This caveat is particularly important for the negative association between S&T expenditure and eco-efficiency. The present analysis cannot distinguish among delayed returns, a mismatch between aggregate S&T expenditure and green innovation, inefficient resource allocation, or rebound effects. These explanations should therefore be regarded as plausible hypotheses rather than empirically verified mechanisms. Future research could distinguish green from non-green S&T expenditure, examine distributed and potentially nonlinear lag structures, and exploit plausibly exogenous policy variation through credible instrumental-variable or quasi-experimental designs.
Author Contributions
Conceptualization, J.T.; methodology, J.T.; software, J.X.; validation, J.X.; formal analysis, J.T.; investigation, Q.J.; resources, J.X.; data curation, Y.S.; writing—original draft preparation, J.T.; writing—review and editing, J.X.; visualization, J.T.; supervision, J.X.; project administration, J.X.; funding acquisition, J.T. and J.X. All authors have read and agreed to the published version of the manuscript.
Funding
This research was funded by the National Natural Science Foundation of China (72373129), the Natural Science Foundation of Jiangsu Province (BK20240939), the General Project of Philosophy and Social Science Research in Colleges and Universities of Jiangsu Province (2024SJYB1522), the Open Project of the Grand Canal Research Institute of China (CJ202404), the Humanities and Social Science Research Fund Project of Yangzhou University (xjj2023-10), and Graduate Innovation Project of Business School, Yangzhou University (SXYKYCX202521).
Institutional Review Board Statement
Not applicable.
Informed Consent Statement
Not applicable.
Data Availability Statement
The data presented in this study are available on request from the corresponding author.
Conflicts of Interest
The authors declare no conflicts of interest.
Abbreviations
The following abbreviations are used in this manuscript:
| YRD | the Yangtze River Delta |
| CO2 | carbon dioxide |
| DEA | data envelopment analysis |
| SBM | slacks-based measure |
| VRS | variable returns to scale |
| OLS | ordinary least squares |
| SDM | Spatial Durbin Model |
| SEM | Spatial Error Model |
| SAM | Spatial Autocorrelation Model |
| GDP | gross domestic product |
| EDGAR | the Emissions Database for Global Atmospheric Research |
| S&T | science and technology |
References
- Schaltegger, S.; Sturm, A. Ökologische Rationalität: Ansatzpunkte zur Ausgestaltung von ökologieorientierten Managementinstrumenten. Unternehmung 1990, 44, 273–290. [Google Scholar]
- Huppes, G.; Ishikawa, M. A Framework for Quantified Eco-efficiency Analysis. J. Ind. Ecol. 2005, 9, 25–41. [Google Scholar] [CrossRef] [Scilit]
- National Bureau of Statistics of China. China Statistical Yearbook 2024; China Statistics Press: Beijing, China, 2024.
- Kuosmanen, T.; Kortelainen, M. Measuring Eco-efficiency of Production with Data Envelopment Analysis. J. Ind. Ecol. 2005, 9, 59–72. [Google Scholar] [CrossRef] [Scilit]
- Picazo-Tadeo, A.J.; Gómez-Limón, J.A.; Reig-Martínez, E. Assessing farming eco-efficiency: A Data Envelopment Analysis approach. J. Environ. Manag. 2011, 92, 1154–1164. [Google Scholar] [CrossRef] [Scilit]
- Alfonso Piña, W.; Pardo Martínez, C. Development and Urban Sustainability: An Analysis of Efficiency Using Data Envelopment Analysis. Sustainability 2016, 8, 148. [Google Scholar] [CrossRef] [Scilit]
- Lo Storto, C. Ecological Efficiency Based Ranking of Cities: A Combined DEA Cross-Efficiency and Shannon’s Entropy Method. Sustainability 2016, 8, 124. [Google Scholar] [CrossRef] [Scilit]
- Kourtit, K.; Nijkamp, P.; Suzuki, S. Are global cities sustainability champions? A double delinking analysis of environmental performance of urban agglomerations. Sci. Total Environ. 2020, 709, 134963. [Google Scholar] [CrossRef] [Scilit]
- Camarero, M.; Castillo, J.; Picazo-Tadeo, A.J.; Tamarit, C. Eco-Efficiency and Convergence in OECD Countries. Environ. Resour. Econ. 2013, 55, 87–106. [Google Scholar] [CrossRef] [Scilit]
- Bianchi, M.; del Valle, I.; Tapia, C. Measuring eco-efficiency in European regions: Evidence from a territorial perspective. J. Clean. Prod. 2020, 276, 123246. [Google Scholar] [CrossRef] [Scilit]
- Matsumoto, K.I.; Makridou, G.; Doumpos, M. Evaluating environmental performance using data envelopment analysis: The case of European countries. J. Clean. Prod. 2020, 272, 122637. [Google Scholar] [CrossRef] [Scilit]
- Tone, K.; Tsutsui, M. Network DEA: A slacks-based measure approach. Eur. J. Oper. Res. 2009, 197, 243–252. [Google Scholar] [CrossRef] [Scilit]
- Xiao, H.; Wang, D.; Qi, Y.; Shao, S.; Zhou, Y.; Shan, Y. The governance-production nexus of eco-efficiency in Chinese resource-based cities: A two-stage network DEA approach. Energy Econ. 2021, 101, 105408. [Google Scholar] [CrossRef] [Scilit]
- Feng, X.; Jin, R.; Chiu, Y.-h.; Zhang, L. The government-production nexus of energy efficiency in China’s construction industry: Regional difference and factor analysis. Environ. Sci. Pollut. Res. Int. 2023, 30, 106227–106241. [Google Scholar] [CrossRef] [Scilit]
- Lin, J.Y. New Structural Economics: A Framework for Rethinking Development. World Bank Res. Obs. 2011, 26, 193–221. [Google Scholar] [CrossRef] [Scilit]
- Tone, K.; Tsutsui, M. Dynamic DEA with network structure: A slacks-based measure approach. Omega 2014, 42, 124–131. [Google Scholar] [CrossRef] [Scilit]
- Tang, J.; Wang, Q.; Li, Z.; Gu, J.; Xu, J. Coupling coordination degree of industrial solid waste prevention and treatment efficiencies and its driving factors in China. Ecol. Indic. 2024, 158, 111395. [Google Scholar] [CrossRef] [Scilit]
- Dagum, C. A new approach to the decomposition of the Gini income inequality ratio. Empir. Econ. 1997, 22, 515–531. [Google Scholar] [CrossRef] [Scilit]
- Wu, Y.; Yang, S.; Hu, T.; Cao, K. Spatiotemporal Evolution, Constraints, and Configurational Driving Paths of District-Level Urban Resilience: A Case Study of Xi’an, China. Sustainability 2026, 18, 2513. [Google Scholar] [CrossRef] [Scilit]
- Jia, X.; Yang, M.; Zhu, T. Spatial Disparities and Obstacle Factors in Building a Strong Agricultural Province: An Entropy-Weighted TOPSIS and Dagum Gini Decomposition Analysis from Anhui, China. Sustainability 2026, 18, 5451. [Google Scholar] [CrossRef] [Scilit]
- Zhang, L.; Du, X.; Chiu, Y.; Pang, Q.; Wang, X.; Yu, Q. Measuring industrial operational efficiency and factor analysis: A dynamic series-parallel recycling DEA model. Sci. Total Environ. 2022, 851, 158084. [Google Scholar] [CrossRef] [Scilit]
- Guo, K.; Cao, Y.; Wang, Z.; Li, Z. Urban and industrial environmental pollution control in China: An analysis of capital input, efficiency and influencing factors. J. Environ. Manag. 2022, 316, 115198. [Google Scholar] [CrossRef] [Scilit]
- Xu, A.; Qu, X.; Mao, Y. The Impact of Climate-Adaptive City Construction on Green Total Factor Productivity: Evidence from China. Sustainability 2026, 18, 5881. [Google Scholar] [CrossRef] [Scilit]
- Du, K.; Lu, H.; Yu, K. Sources of the potential CO2 emission reduction in China: A nonparametric metafrontier approach. Appl. Energy 2014, 115, 491–501. [Google Scholar] [CrossRef] [Scilit]
- Li, M.; Jiang, Q. Do Low-Carbon and New Energy Demonstration City Pilots Generate Synergy? Evaluating the Dual-Pilot Policy on Carbon Emission Performance with Double Machine Learning. Sustainability 2026, 18, 5734. [Google Scholar] [CrossRef] [Scilit]
- Li, K.; Lin, B. Metafroniter energy efficiency with CO2 emissions and its convergence analysis for China. Energy Econ. 2015, 48, 230–241. [Google Scholar] [CrossRef] [Scilit]
- Wang, Q.W.; Zhou, P.; Shen, N.; Wang, S.S. Measuring carbon dioxide emission performance in Chinese provinces: A parametric approach. Renew. Sustain. Energy Rev. 2013, 21, 324–330. [Google Scholar] [CrossRef] [Scilit]
- Lai, A.; Li, Z.; Hu, X.; Wang, Q. Does digital economy improve city-level eco-efficiency in China? Econ. Anal. Policy 2024, 81, 1198–1213. [Google Scholar] [CrossRef] [Scilit]
- Li, S.; Chen, C.; Xu, J.; Qi, H.; Na, S. From Gray to Green Infrastructure: Assessing the Impact of China’s Sponge City Pilot Policy on Urban Green Total Factor Productivity. Land 2026, 15, 680. [Google Scholar] [CrossRef] [Scilit]
- Zhang, D.; Tian, C.; Zhang, J.; Wen, H. Shaping Sustainable Urban Development: Spatiotemporal Evolution and Drivers of Newly Established Digital Enterprises in Hangzhou, China. Sustainability 2026, 18, 5745. [Google Scholar] [CrossRef] [Scilit]
- Wang, K.; Yu, S.; Zhang, W. China’s regional energy and environmental efficiency: A DEA window analysis based dynamic evaluation. Math. Comput. Model. 2013, 58, 1117–1127. [Google Scholar] [CrossRef] [Scilit]
- Liu, F.; Li, L.; Ye, B.; Qin, Q. A novel stochastic semi-parametric frontier-based three-stage DEA window model to evaluate China’s industrial green economic efficiency. Energy Econ. 2023, 119, 106566. [Google Scholar] [CrossRef] [Scilit]
- State Council of the People’s Republic of China. Outline Development Plan for Regional Integration of the Yangtze River Delta. Available online: https://app.www.gov.cn/govdata/gov/201912/01/451514/article.html (accessed on 4 August 2026).
- Yin, S.; Zhou, Y.; Zhang, C.; Wu, N. Impact of regional integration policy on urban ecological resilience: A case study of the Yangtze River Delta region, China. J. Clean. Prod. 2024, 485, 144375. [Google Scholar] [CrossRef] [Scilit]
- Lv, K.; Fan, Y.; Cheng, Y. How does regional integration affect CO2 emission intensity? A natural experiment based on the expansion of the Yangtze River Delta, China. Ann. Reg. Sci. 2024, 73, 493–519. [Google Scholar] [CrossRef] [Scilit]
- Zhang, H.; Liu, Y.; Zhang, C.; Hao, H. Theory and Practice of “Lucid Waters and Lush Mountains Are Invaluable Assets” in China, 1st ed.; Springer Nature: Singapore, 2024. [Google Scholar] [CrossRef] [Scilit]
- Wen, C.; Jiawei, W. Strategy of Integrated Development of the Yangtze River Delta. In Dictionary of Contemporary Chinese Economics; Yinxing, H., Ed.; Springer Nature: Singapore, 2025; pp. 2025–2028. [Google Scholar] [CrossRef] [Scilit]
- Tian, Y.; Sun, C.; Ren, Y.; Liu, K.; Zuo, Z. Tax competition, spatial correlation and regional integration development—Evidence from the Yangtze River Delta. Energy Policy 2023, 181, 113715. [Google Scholar] [CrossRef] [Scilit]
- Li, C.; Zhu, C.; Wang, S.; Ouyang, Z. Natural capital accounting status and trends in China. Cell Rep. Sustain. 2026, 3, 100730. [Google Scholar] [CrossRef] [Scilit]
- Wu, N.; Zhou, Y.; Yin, S.; Gong, H.; Zhang, C. Revealing the nonlinear impact of environmental regulation on ecological resilience using the XGBoost-SHAP model: Evidence from the Yangtze River Delta region, China. J. Clean. Prod. 2025, 514, 145700. [Google Scholar] [CrossRef] [Scilit]
- Shang, L.; Xu, C.; Liu, Y. The saturation effect of carbon emissions from urban economic activities: Empirical evidence from nighttime lights. Econ. Anal. Policy 2026, 91, 165–177. [Google Scholar] [CrossRef] [Scilit]
- Shanghai Municipal Bureau of Justice. Decision of the Standing Committee of Shanghai Municipal People’s Congress on Promoting the Collaborative Development of Science and Technology Innovation in the Yangtze River Delta. Available online: https://english.shanghai.gov.cn/en-Bulletin/20251222/65ab67981cce4ecc872429de987fac53.html (accessed on 28 June 2026).

Disclaimer/Publisher’s Note: The statements, opinions and data contained in all publications are solely those of the individual author(s) and contributor(s) and not of MDPI and/or the editor(s). MDPI and/or the editor(s) disclaim responsibility for any injury to people or property resulting from any ideas, methods, instructions or products referred to in the content. |
© 2026 by the authors. Licensee MDPI, Basel, Switzerland. This article is an open access article distributed under the terms and conditions of the Creative Commons Attribution (CC BY) license.