


Abstract
Sustainable development encompasses economic, social, and environmental dimensions. Assessing urban sustainability and regional disparities is essential for promoting high-quality development. This study evaluated 72 cities in the urban agglomerations of the Yellow River Basin, China, based on the United Nations Sustainable Development Goals (SDGs), and analyzed the coordinated development level of the “economy-society-environment” (ESE) system from 2007 to 2022. The results show that: (1) Cities with higher SDGs scores are mainly located in the Shandong Peninsula urban agglomeration (SPUA), while lower scores are concentrated in the Ningxia Yellow River urban agglomeration (NXUA) and the Lanzhou-Xining urban agglomeration (LXUA); (2) During the study period, the coupling coordination level among urban agglomerations in the Yellow River Basin continuously improved. By 2022, most cities in the SPUA had entered the “mild disorder” stage, while the majority of other urban agglomerations remained in the “moderate disorder” stage, indicating that although the overall coordination of the ESE system had improved, significant regional disparities persisted; (3) The Random Forest algorithm (RFA)-SHapley Additive exPlanations (SHAP) model indicates that the urban sprawl index and the economic development level are the important influencing factors of economic sustainability, fiscal expenditure per unit area and urbanization level are associated with social sustainability, and water bodies and cropland are closely related to environmental sustainability. This study provides insights into the spatial disparities and key influencing factors associated with urban sustainable development in the Yellow River Basin, supporting regional sustainability planning.
1. Introduction
As advanced spatial organizational forms of urbanization, urban agglomerations are essential for promoting coordinated regional development. However, their high concentrations of population and economic activity also lead to concentrated manifestations of issues such as urban-rural development imbalances and ecological overload at this spatial scale [1]. To systematically address these challenges, scientifically evaluate the level of urban sustainability, and identify optimization pathways, the United Nations Development Summit in 2015 endorsed the 2030 Agenda for Sustainable Development (hereinafter referred to as the 2030 Agenda), which has 17 primary objectives and 169 subtargets [2]. This agenda aims to integrate development issues across social, economic, and environmental dimensions and to provide a core framework for global sustainable development [3]. Coordinated development among ESE systems is a prerequisite for advancing urban sustainability [4]. Therefore, developing an assessment framework for the ESE system to analyze interconnections among urban subsystems systematically is essential to advancing sustainable urban development.
Coordination and integration among different subsystems are central to achieving sustainable development. Currently, the Coupling Coordination Degree Model (CCDM) is being employed to assess the extent of coupling coordination among subsystems. According to the principle of connection in physics, the CCDM has gained widespread use in social science research because it can precisely characterize the coordinated evolution of systems [5]. Many studies have employed this model and its extensions to reveal complex interactions among subsystems, offering novel perspectives on urban sustainability research. For instance, one study used this model to compare the coordination of the ESE system across China’s four major municipalities [6]. Another analysis applied this method to analyze the degree of coupling and coordination between the ecological environment and the socioeconomic conditions in resource-based cities [7]. However, most existing studies have overlooked the key factors associated with sustainable development and have failed to delve deeply into the intrinsic factors influencing regional sustainable development. To address the CCDM’s limitations in analyzing influencing factors, researchers often enhance analyses using regression models. For instance, geographically weighted regression models have been used to elucidate the inherent linkages among ecosystem services [8] and to analyze the spatiotemporal heterogeneity of the interaction between urbanization and ecosystem health using a geographically and temporally weighted regression model [9]. Other studies have employed spatial Durbin models to analyze drivers of the green transition [10]. However, multicollinearity among variables often arises when these models are used to analyze multisource big data within cities [11]. While removing collinear variables can mitigate statistical bias, it can also omit important information, thereby weakening the robustness of the conclusions [12]. Therefore, this study adopts the RFA-SHAP model, which effectively addresses multicollinearity and accurately identifies key influencing factors, to examine the coupling coordination mechanisms among urban subsystems.
Research on coordinated regional development has yielded substantial findings, but some gaps remain. In terms of the scale of analysis, existing studies have primarily focused on evaluating sustainable development at the provincial level or within individual urban areas [13,14,15], while systematic comparisons of development coordination and spatial disparities among different urban agglomerations remain relatively limited. In terms of research areas, existing studies have largely focused on regions with higher levels of economic development, such as the Yangtze River Delta and the Beijing-Tianjin-Hebei urban agglomeration, while comprehensive evaluations of sustainable development in urban agglomerations within the Yellow River Basin still require further in-depth analysis. Furthermore, existing research often emphasizes coordination analysis between single or dual systems [16,17], and comprehensive evaluations of the coordinated development of multidimensional economic-social-environmental (ESE) systems still need strengthening. At the same time, existing research lacks in-depth exploration of the key drivers and mechanisms underlying disparities in sustainable development across regions [18]. The Yellow River Basin faces both the important task of economic growth and the critical mission of ecological conservation; its various urban agglomerations exhibit significant regional heterogeneity in economic, social, and ecological development, both within and between agglomerations [19]. In recent years, the contradictions between economic development, improvements in residents’ well-being, and ecological and environmental protection have become increasingly prominent, posing severe challenges to regional sustainable development [20]. Against this backdrop, this study constructs a comprehensive evaluation system encompassing economic, social, and environmental dimensions to assess the sustainable development levels of cities within urban agglomerations based on the SDGs framework. It employs the CCDM to measure coordination within the agglomerations’ ESE systems. Building on this, the RFA-SHAP model identifies key factors influencing urban sustainable development. Finally, based on the findings, the study proposes differentiated sustainable development strategies for various regions within the urban agglomerations of the Yellow River Basin.
2. Materials and Methods
2.1. Study Area
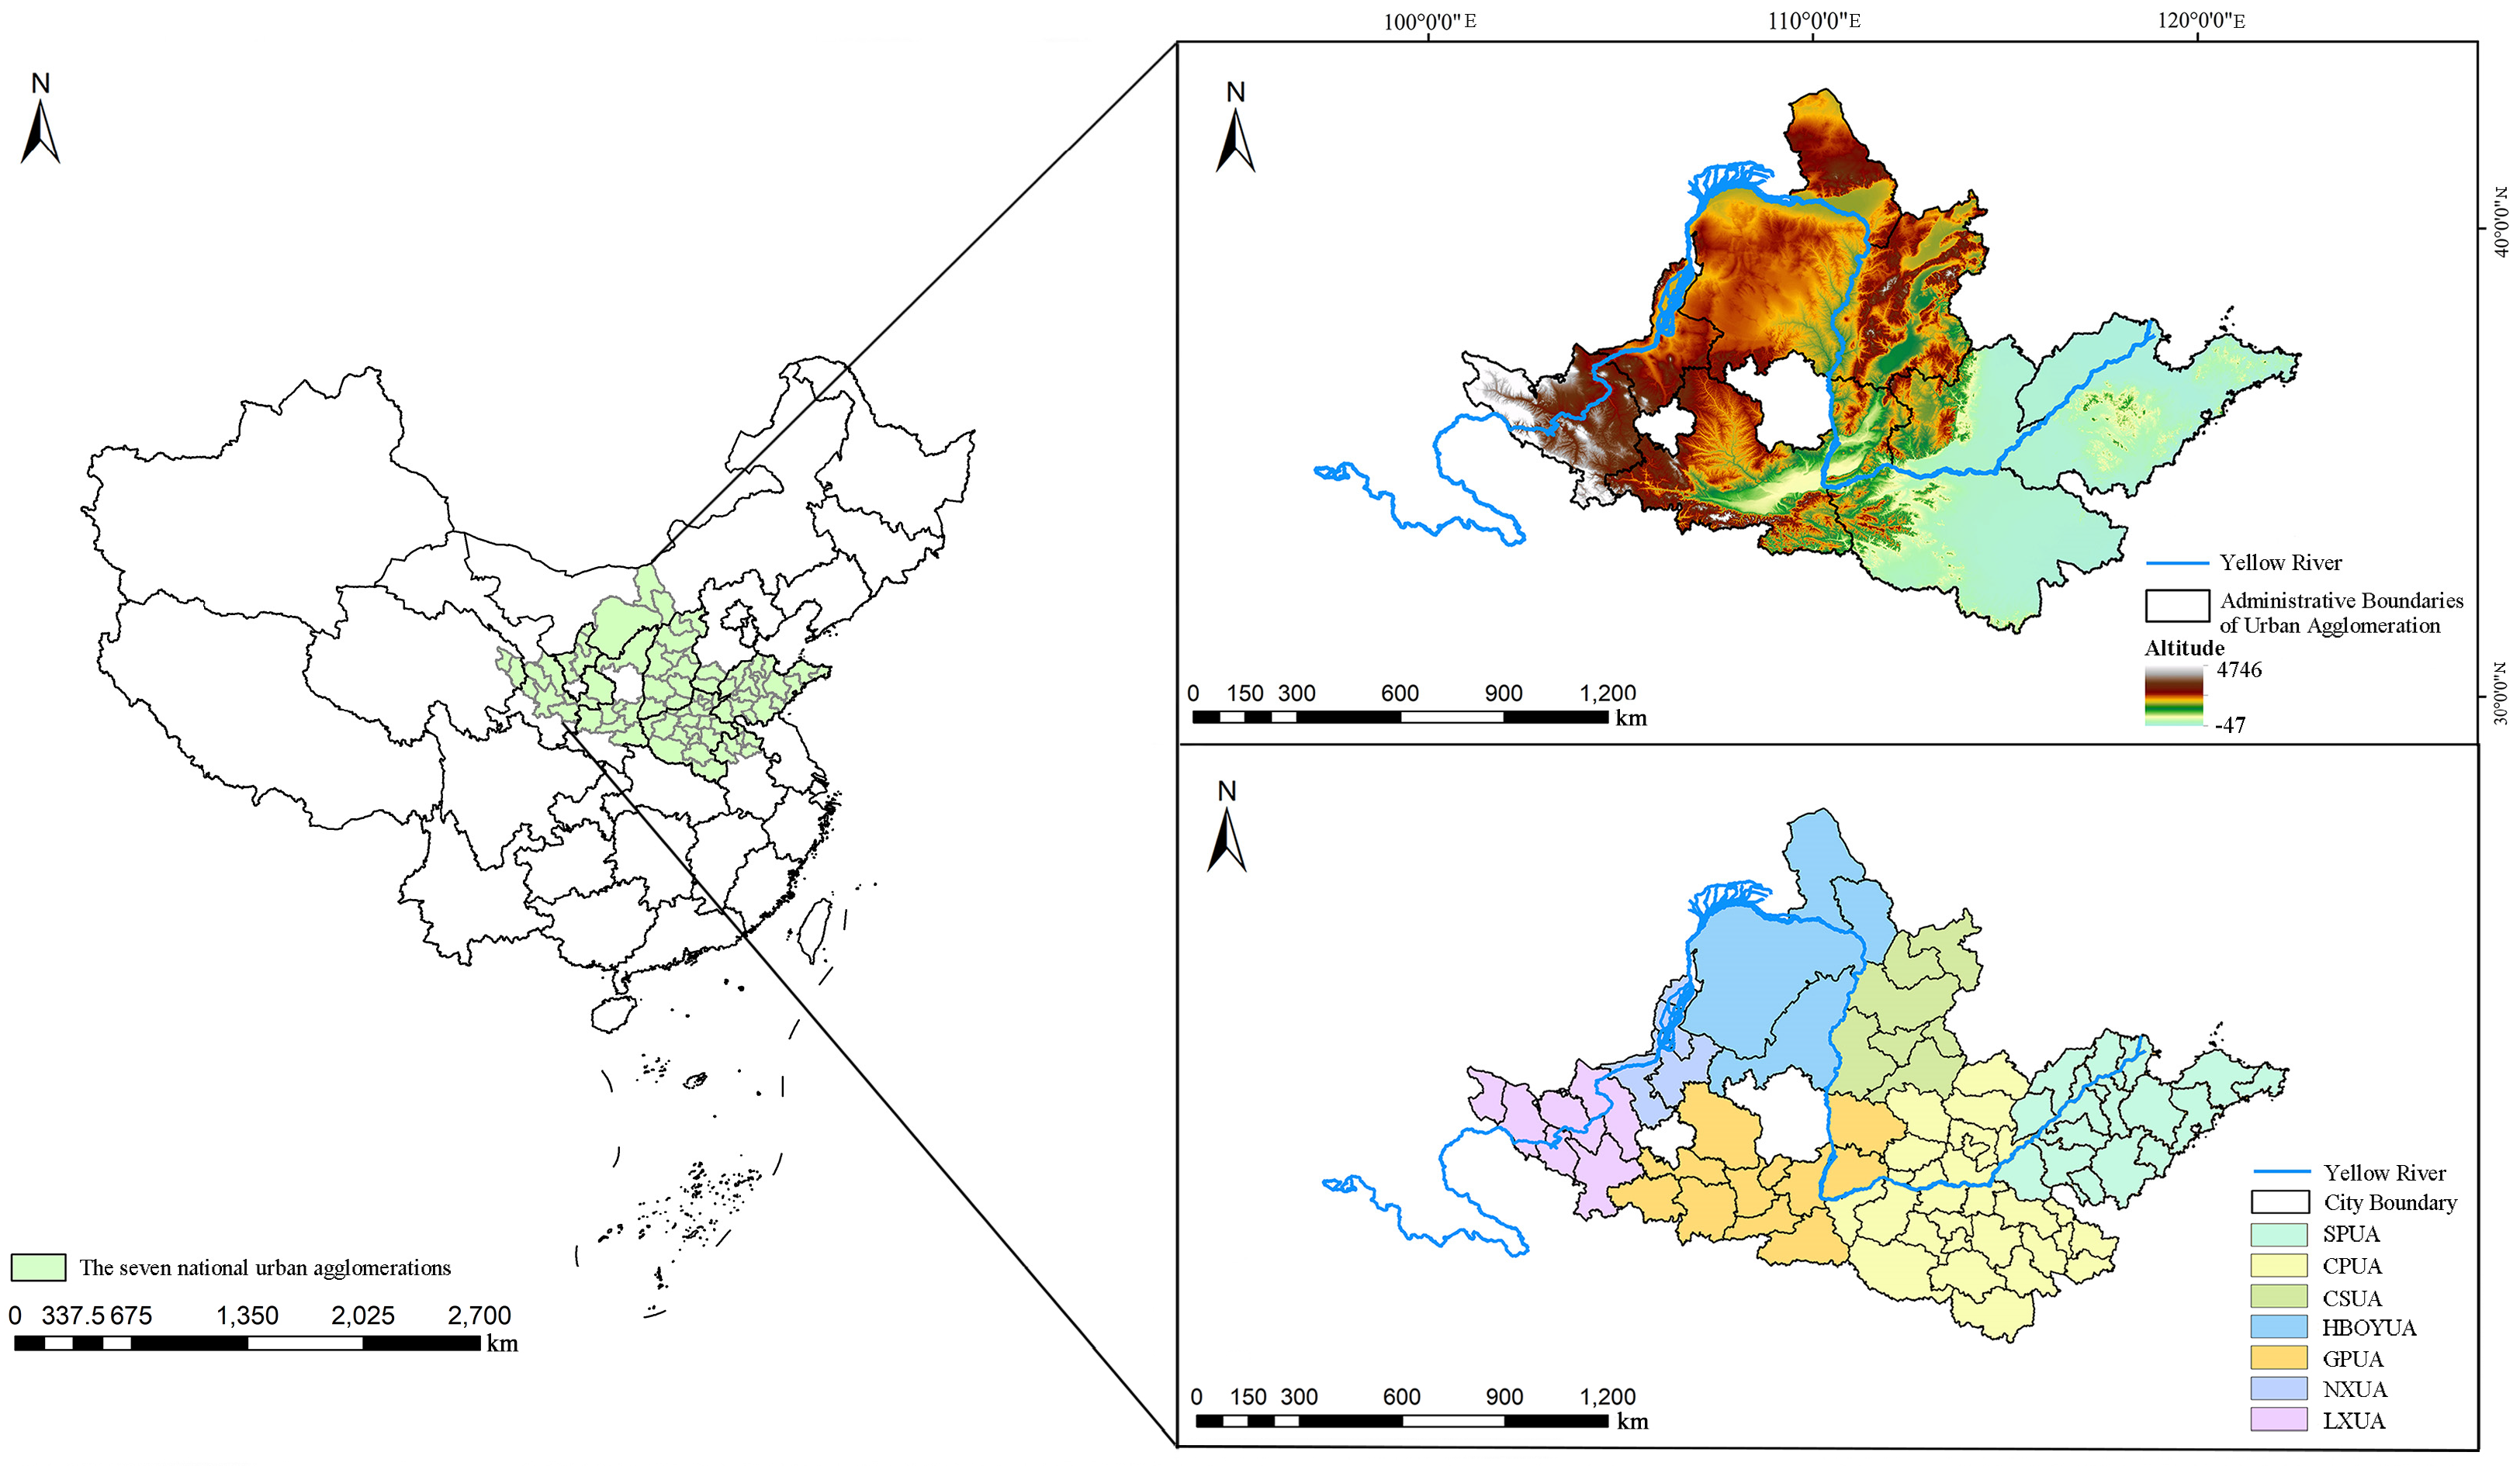
The Yellow River Basin extends from the Qinghai–Tibet Plateau upstream to the Huang-Huai-Hai Plain downstream, passing through the arid, low-rainfall regions of northwest and north China [21]. It encompasses seven urban agglomerations. From downstream to upstream, they are as follows: the Shandong Peninsula Urban Agglomeration (SPUA), the Central Plains Urban Agglomeration (CPUA), the Central Shanxi Urban Agglomeration (CSUA), the Hohhot-Baotou-Ordos-Yulin Urban Agglomeration (HBOYUA), the Guanzhong Plain Urban Agglomeration (GPUA), the Ningxia Yellow River Urban Agglomeration (NXUA), and the Lanzhou-Xining Urban Agglomeration (LXUA). The basin encompasses 72 cities (Table A1 for a complete list). In this study, the assessment includes the entire administrative boundary of each city, which may contain both urban and rural areas (Figure 1).
Figure 1.
Geographical locations of the urban agglomerations in the Yellow River Basin.
2.2. Data Source and Processing
2.2.1. Indicator Selection and Explanation
This research used the 17 SDGs established by the United Nations’ 2030 Agenda as its theoretical foundation and systematically categorized them into the economic, social, and environmental domains. Using this framework, indicators were identified and selected for the 169 specific targets, upholding scientific rigour and practical feasibility. Because of limited data availability, SDG 5 (Gender equality) and SDG 16 (Peace, justice and strong institutions) were excluded from the evaluation framework. Ultimately, an evaluation indicator system for the sustainable development of urban agglomerations in the Yellow River Basin was established, covering 15 Sustainable Development Goals and 86 specific targets, with 54 valid evaluation indicators. The final result was a system for evaluating the level of sustainable development in urban agglomerations in the Yellow River Basin, comprising 15 primary objectives, 86 subtargets, and 54 valid assessment indicators (Table 1). We sourced research data primarily from official statistical materials, including the China Statistical Yearbook, China City Statistical Yearbook, China Urban Construction Statistical Yearbook, and China Environmental Status Bulletin. We also collected additional data from city statistical yearbooks and other relevant official documents for each sampled year. After collecting and supplementing the data as described above, we kept the proportion of missing values in the overall dataset below 5%. For the few remaining missing values in certain indicators, we used linear interpolation to fill in the gaps, ensuring data completeness and temporal consistency.
Table 1.
The “economy-society-environment” sustainability indicator system based on the 17 Sustainable Development Goals.
All statistical analyses and calculations in this study were performed using Python 3.9 (Python Software Foundation, Wilmington, DE, USA). We also conducted all data cleaning, processing, and model implementation in Python, using common models and data analysis methods based on open-source Python libraries such as NumPy (v1.24) and pandas (v2.0). All statistical figures were created using the ggplot2 (v3.5.1) package in R (v4.3.3) (R Foundation for Statistical Computing, Vienna, Austria), while spatial distribution maps were generated using ArcGIS 10.8 (Esri, Redlands, CA, USA).
To ensure comparability of sustainability scores across years, this study uniformly aggregated all indicator values from 2007 to 2022 before normalization and entropy weighting. As a widely adopted method in multi-indicator evaluation, entropy weighting effectively avoids biases from subjective weighting [22]. This study applied this method to assign weights to the indicators listed in Table 1, then aggregated the weighted scores for each indicator within the economic, social, and environmental subsystems to derive the corresponding sustainability scores for each subsystem.
2.2.2. Data Normalization
Normalization is essential to address the substantial disparities in dimensions and attributes among subsystem indicators, ensuring data comparability.
where denotes the -th city and denotes the -th indicator. For positive indicators, a higher value indicates better sustainability; for negative indicators, a higher value indicates poorer sustainability. The probability value () represents the ratio of the value () of the -th city for the -th indicator to the total value () of that indicator across all cities.
2.2.3. Sustainability Score Calculation
Based on the indicator system detailed in (Table 1), the SDGs scores for each city in the Yellow River Basin urban agglomeration were calculated using the entropy method to assign indicator weights.
Entropy and weight calculation:
and denote the information entropy and weight of the -th indicator [23]. Higher entropy values represent greater indicator uncertainty; thus, entropy and weight are negatively correlated.
The SDGs score is calculated as follows:
where represents the -th city’s sustainability score; denotes the normalized value for city of indicator ; for the -th indicator, its weight is represented by , and denotes the total number of indicators in the system.
2.2.4. Coupling Coordination Degree Model
The Coupling Coordination Degree Model (CCDM) quantifies the intensity of interactions and the level of coordinated development between two or more systems [22]. This study applies this model to assess the level of coordinated development of urban ESE systems.
where (0 ≤ ≤ 1) represents the degree of coupling coordination within the ESE system. denotes the degree of coupling among the ESE; is the coordination factor; and , and signify the sustainability levels of the economy, society, and environment. As shown in Table 2, the coordinated development stages of various systems can be categorized into 10 groups based on their CCD values [24].
Table 2.
Classification of coupling coordination levels.
2.2.5. Hotspot Analysis (Getis-Ord Gi*)
Getis-Ord Gi* is a technique used in spatial data analysis, primarily for identifying spatially significant clusters of high values (hot spots) and low values (cold spots) [25].
where is the z score; higher values signify hot spots with better sustainability, while lower values indicate cold spots with relatively poorer sustainability; represents the SDGs score of city ; represents the spatial weight between cities and ; shows the mean of all cities’ SDGs scores; denotes the total number of cities; and denotes the standard deviation of the SDGs scores across all cities.
2.2.6. Interpretability Analysis of Random Forest Using SHAP
In this study, the random forest algorithm (RFA) was employed to address complex multicollinearity issues in multisource urban big data, and SHAP was used to overcome RFA’s limitations in feature interpretability. The SHAP method’s core concept originates from the Shapley value in game theory, a classic approach to allocating benefits in cooperative games. In machine learning, SHAP values quantify the impact of individual features on model outputs by measuring their contribution to model predictions [26]. Integrating RFA and SHAP allows for an examination of how urban spatial structures positively or negatively affect sustainability. The SHAP value for each feature is determined as follows:
where denotes the Shapley value for feature ; represents the set of all features; denotes the subset of excluding feature ; is the model output when feature is included; and is the model output when feature is excluded.
In this study, six influencing factors (Table 3) were selected for analysis: geographical, climatic, economic, policy, urban functional zones, and land use.
Table 3.
Influencing factors selected for this study.
All factors data in this study were obtained from the statistical yearbooks of each region for the corresponding years, except for the data sources listed for some drivers in Table 4.
Table 4.
Data sources for the influencing factors.
2.3. Sensitivity Analysis
2.3.1. Sensitivity Analysis of the Entropy Weighting Method
To test the robustness of the results with respect to the weighting scheme, we compared the aggregated entropy weighting approach used in this study, in which data from all years were pooled before calculating a common set of indicator weights, with an alternative year-specific entropy weighting approach. Specifically, we recalculated entropy weights independently for each year and estimated the corresponding SDG scores for all 72 cities in each assessment year. We then used Spearman’s and Kendall’s correlation coefficients to evaluate consistency between the two weighting strategies. As shown in Table A2, the correlation coefficients remained high across all four assessment years (Spearman’s ρ 0.940–0.965; Kendall’s τ 0.797–0.851), indicating strong agreement in city rankings between the two weighting approaches. These findings demonstrate that the sustainability trajectories identified in this study are robust to alternative entropy weighting strategies, and that the aggregated weighting approach does not substantially affect the interpretation of temporal trends.
2.3.2. Sensitivity Analysis of the CCDM
To assess the robustness of the CCDM results to the equal-weighting assumption, we compared the baseline equal-weighting scheme with three alternative weighting scenarios: economic priority weighting (0.50, 0.25, 0.25), social priority weighting (0.25, 0.50, 0.25), and environmental priority weighting (0.25, 0.25, 0.50). As shown in Table A3, the Spearman correlation coefficients between the rankings derived from the equal weighting scheme and each alternative scenario ranged from 0.949 to 0.988 across all four assessment years, confirming that the coordination rankings are robust to changes in subsystem weights.
2.3.3. Sensitivity Analysis of Spatial Weight Matrix Specifications
To examine the robustness of the Getis-Ord Gi* results under different spatial relationship specifications, we conducted sensitivity analyses by constructing spatial weight matrices with different distance thresholds. Specifically, we used the spatial weight matrix based on the default optimized distance threshold (205,323.8 m) as the baseline scheme. In contrast, we constructed alternative spatial weight matrices using a reduced distance threshold (0.8×, 164,259.0 m) and an expanded distance threshold (1.2×, 246,388.6 m). In addition, we introduced a Zone of Indifference spatial weight matrix for comparative analysis. We evaluated the consistency of hotspot and coldspot classifications under different spatial weight specifications using Cohen’s Kappa coefficient, with detailed results presented in Table A4.
The results showed that the spatial clustering patterns remained generally stable across different spatial weight specifications. Compared with the baseline distance-threshold scheme, the reduced-distance threshold (0.8×) and expanded-distance threshold (1.2×) schemes achieved agreement rates of 77.315% and 79.814%, respectively, with corresponding Cohen’s Kappa coefficients of 0.535 and 0.633, indicating moderate levels of agreement. Furthermore, the comparison between the two alternative distance-threshold schemes showed an agreement rate of 68.517% and a Cohen’s Kappa coefficient of 0.413. These results demonstrate that the identified sustainability hotspots and coldspots were not sensitive to variations in spatial weight matrices and distance thresholds, confirming the robustness of the Getis-Ord Gi* analysis.
2.3.4. Sensitivity Analysis and Validation of the RFA-SHAP Model
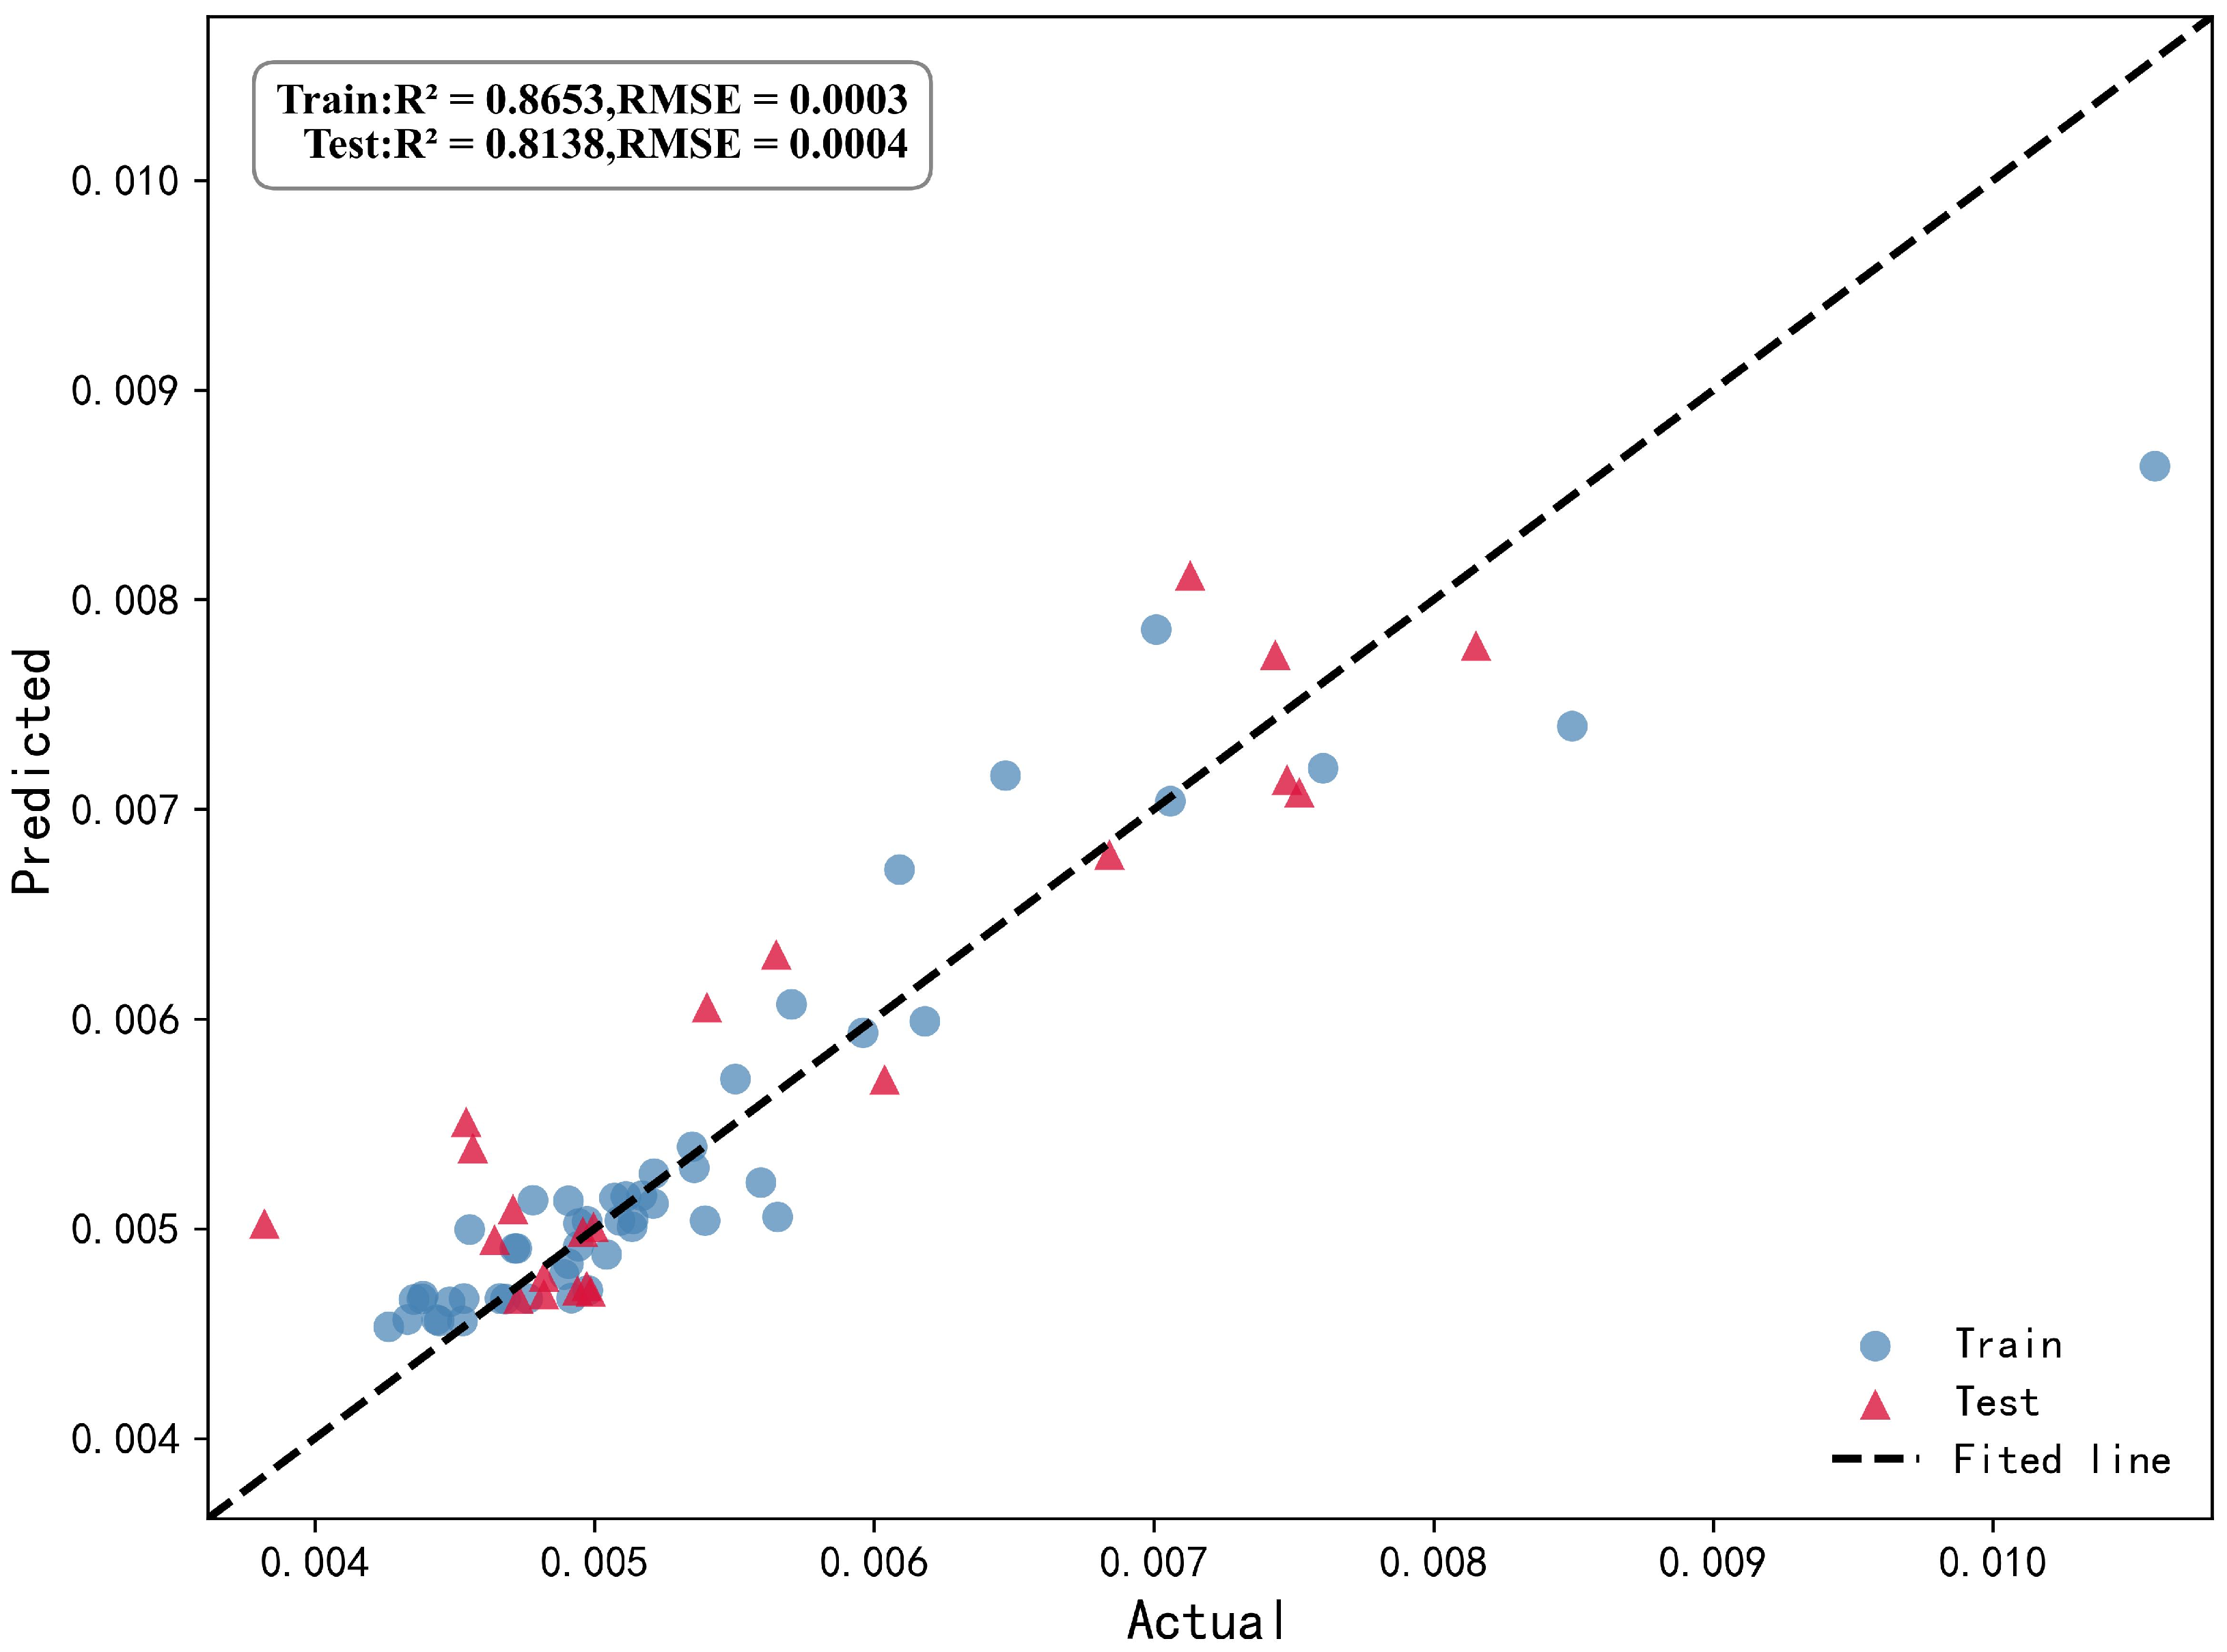
To justify the use of Random Forest and evaluate model performance, we conducted Variance Inflation Factor (VIF) diagnostics for all influencing factors. The results showed that all VIF values ranged from 2.41 to 8.87, well below the threshold of 10, confirming that multicollinearity is not a severe issue and supporting the applicability of the Random Forest algorithm. The model hyperparameters were optimized using Optuna with cross-validation (n_estimators = 135, max_depth = 4). Model performance was evaluated using R2, MAE, and RMSE, achieving R2 values of 0.8653 on the training set and 0.8138 on the test set, indicating good predictive capability. Figure A1 presents a scatter plot of observed versus predicted values for the training and test sets. Detailed results are provided in Table A5, Table A6 and Table A7.
3. Results
3.1. SDGs Performance in the Yellow River Basin Urban Agglomerations
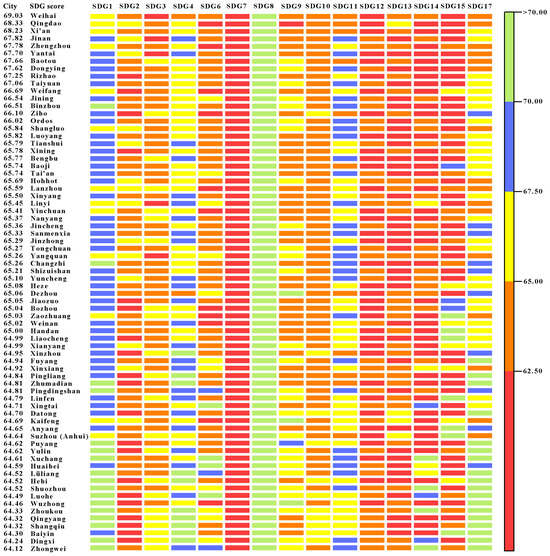
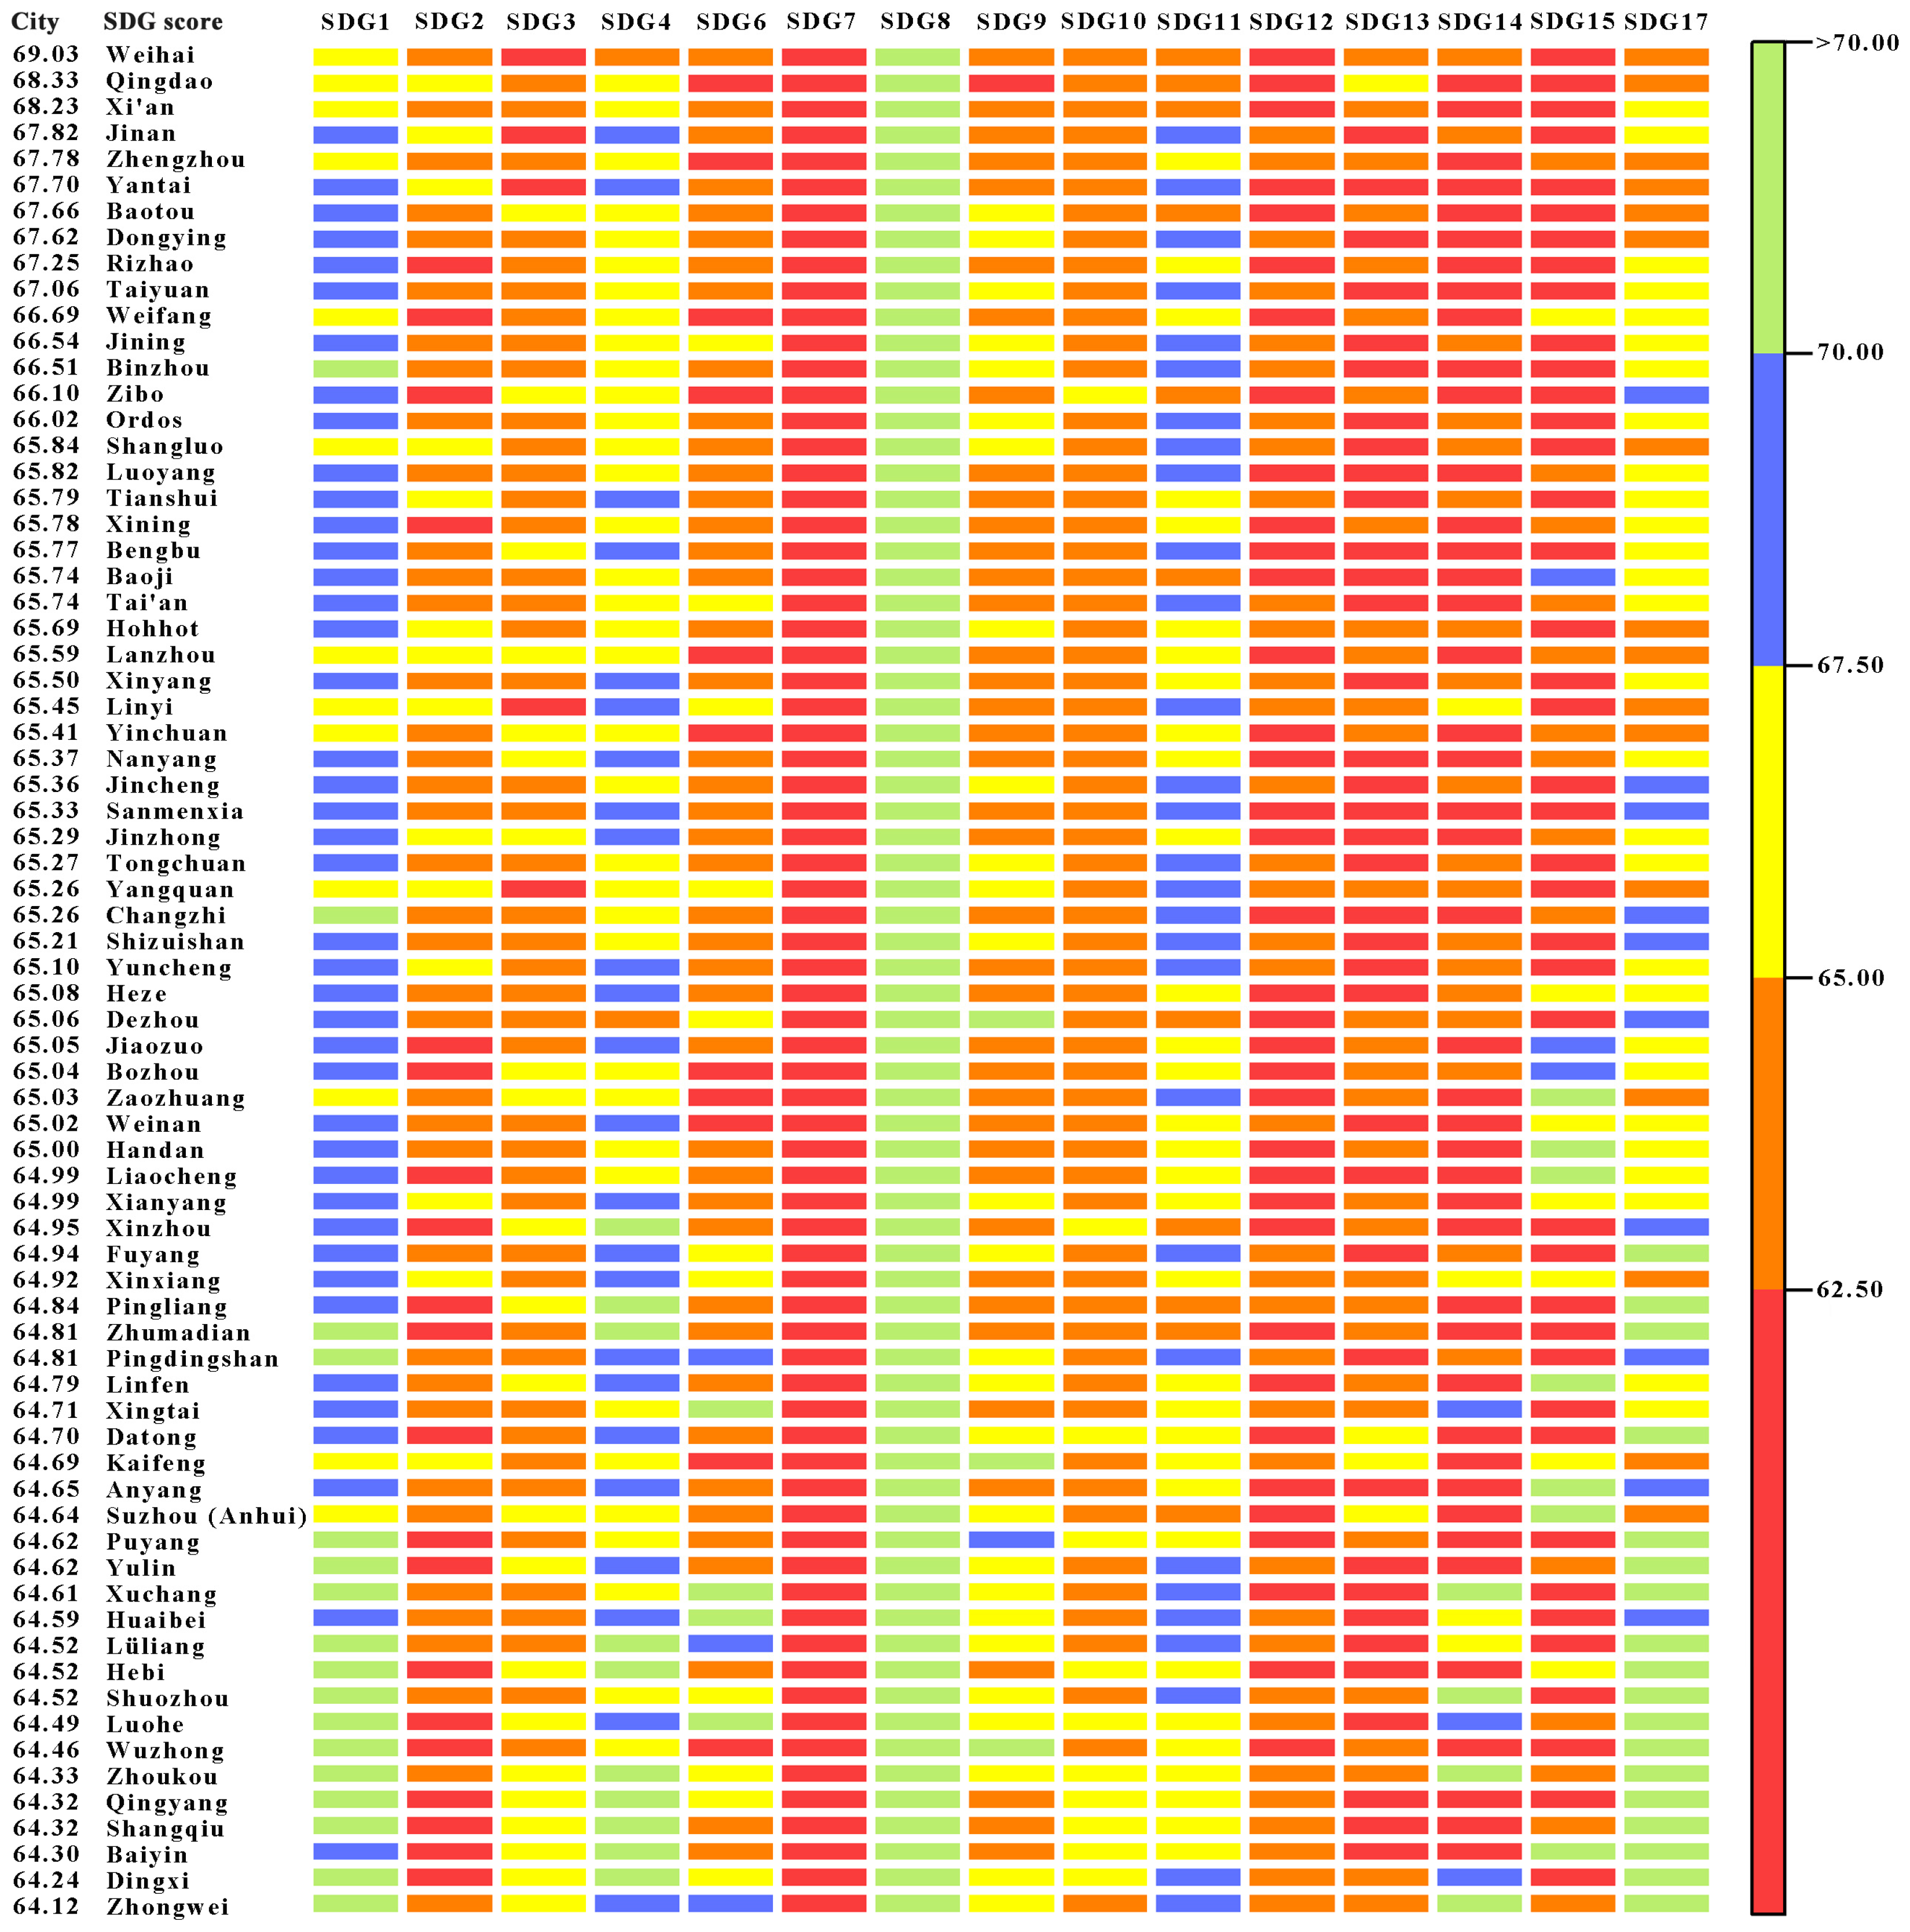
Figure 2 illustrates the scores for 72 cities across SDGs within urban agglomerations. The numbers in parentheses in the text below (e.g., SDG 1) correspond to the Sustainable Development Goals listed in Table 1. Each city’s SDGs score comprehensively reflects its overall level of sustainable development, with higher scores indicating stronger sustainable development capabilities. Cities with superior comprehensive sustainability performance, such as Weihai, Qingdao, Jinan, Yantai, and Dongying, are primarily concentrated in the SPUA. They also include Xi’an in the GPUA, Zhengzhou in the CPUA, and Baotou in the HBOYUA. These cities demonstrate powerful performance in poverty eradication (SDG 1), providing quality education (SDG 4), promoting decent work and economic growth (SDG 8), developing industry, innovation and infrastructure (SDG 9), and reducing inequalities (SDG 10). However, significant room remains to achieve goals related to food security (SDG 2), protecting and sustainably using soil and water resources (SDGs 14 and 15), and climate action (SDG 13). Cities with generally moderate sustainability levels are primarily distributed in the NXUA and the LXUA. These cities demonstrate specific strengths in achieving zero hunger (SDG 2) and climate action (SDG 13), but they need to improve in order to achieve social welfare-related goals such as no poverty (SDG 1), decent work and economic growth (SDG 8), and quality education (SDG 4).
Figure 2.
Sustainable development levels of 72 cities. Colors indicate SDG scores: red (low scores) to green (high scores).
Looking at the rankings within each urban agglomeration, the top three cities in the SPUA were, in order, Weihai (1.3679), Qingdao (1.2613), and Jinan (1.1849), while Liaocheng ranked last (0.7560); In the CPUA, the top three cities are Zhengzhou (1.1784), Luoyang (0.8825), and Bengbu (0.8737), with Shangqiu ranking last (0.6547); In the CSUA, the top three were Taiyuan (1.0702), Jinzhong (0.8008), and Yangquan (0.7970), with Shuozhou ranking last (0.6841); In the HBOYUA, the top three were Baotou (1.1604), Ordos (0.9123), and Hohhot (0.8625), with Yulin ranking last (0.6996); the top three in the GPUA are Xi’an (1.2466), Shangluo (0.8847), and Tianshui (0.8777), with Qingyang ranking last (0.6551); the top three cities in the NXUA were Yinchuan (0.8204), Shizuishan (0.7901), and Wuzhong (0.6753), with Zhongwei ranking last (0.6236); The top three cities in the LXUA are Xining (0.8758), Lanzhou (0.8474), and Baiyin (0.6522), with Dingxi ranking last (0.6427). Overall, sustainable development levels vary significantly among urban agglomerations in the Yellow River Basin. The SPUA leads by a wide margin in sustainable development scores and has significantly more high-quality cities than other urban agglomerations, while the NXUA and the LXUA lag behind overall. Within the urban agglomeration, the SPUA exhibits the widest disparity in scores among its member cities, followed by the CPUA, while the NXUA shows the smallest disparity. This indicates that uneven development also exists within each urban agglomeration; the large gap in scores between the top-ranked and bottom-ranked cities reflects that the central cities have not yet fully leveraged their radiating and driving effects on surrounding cities.
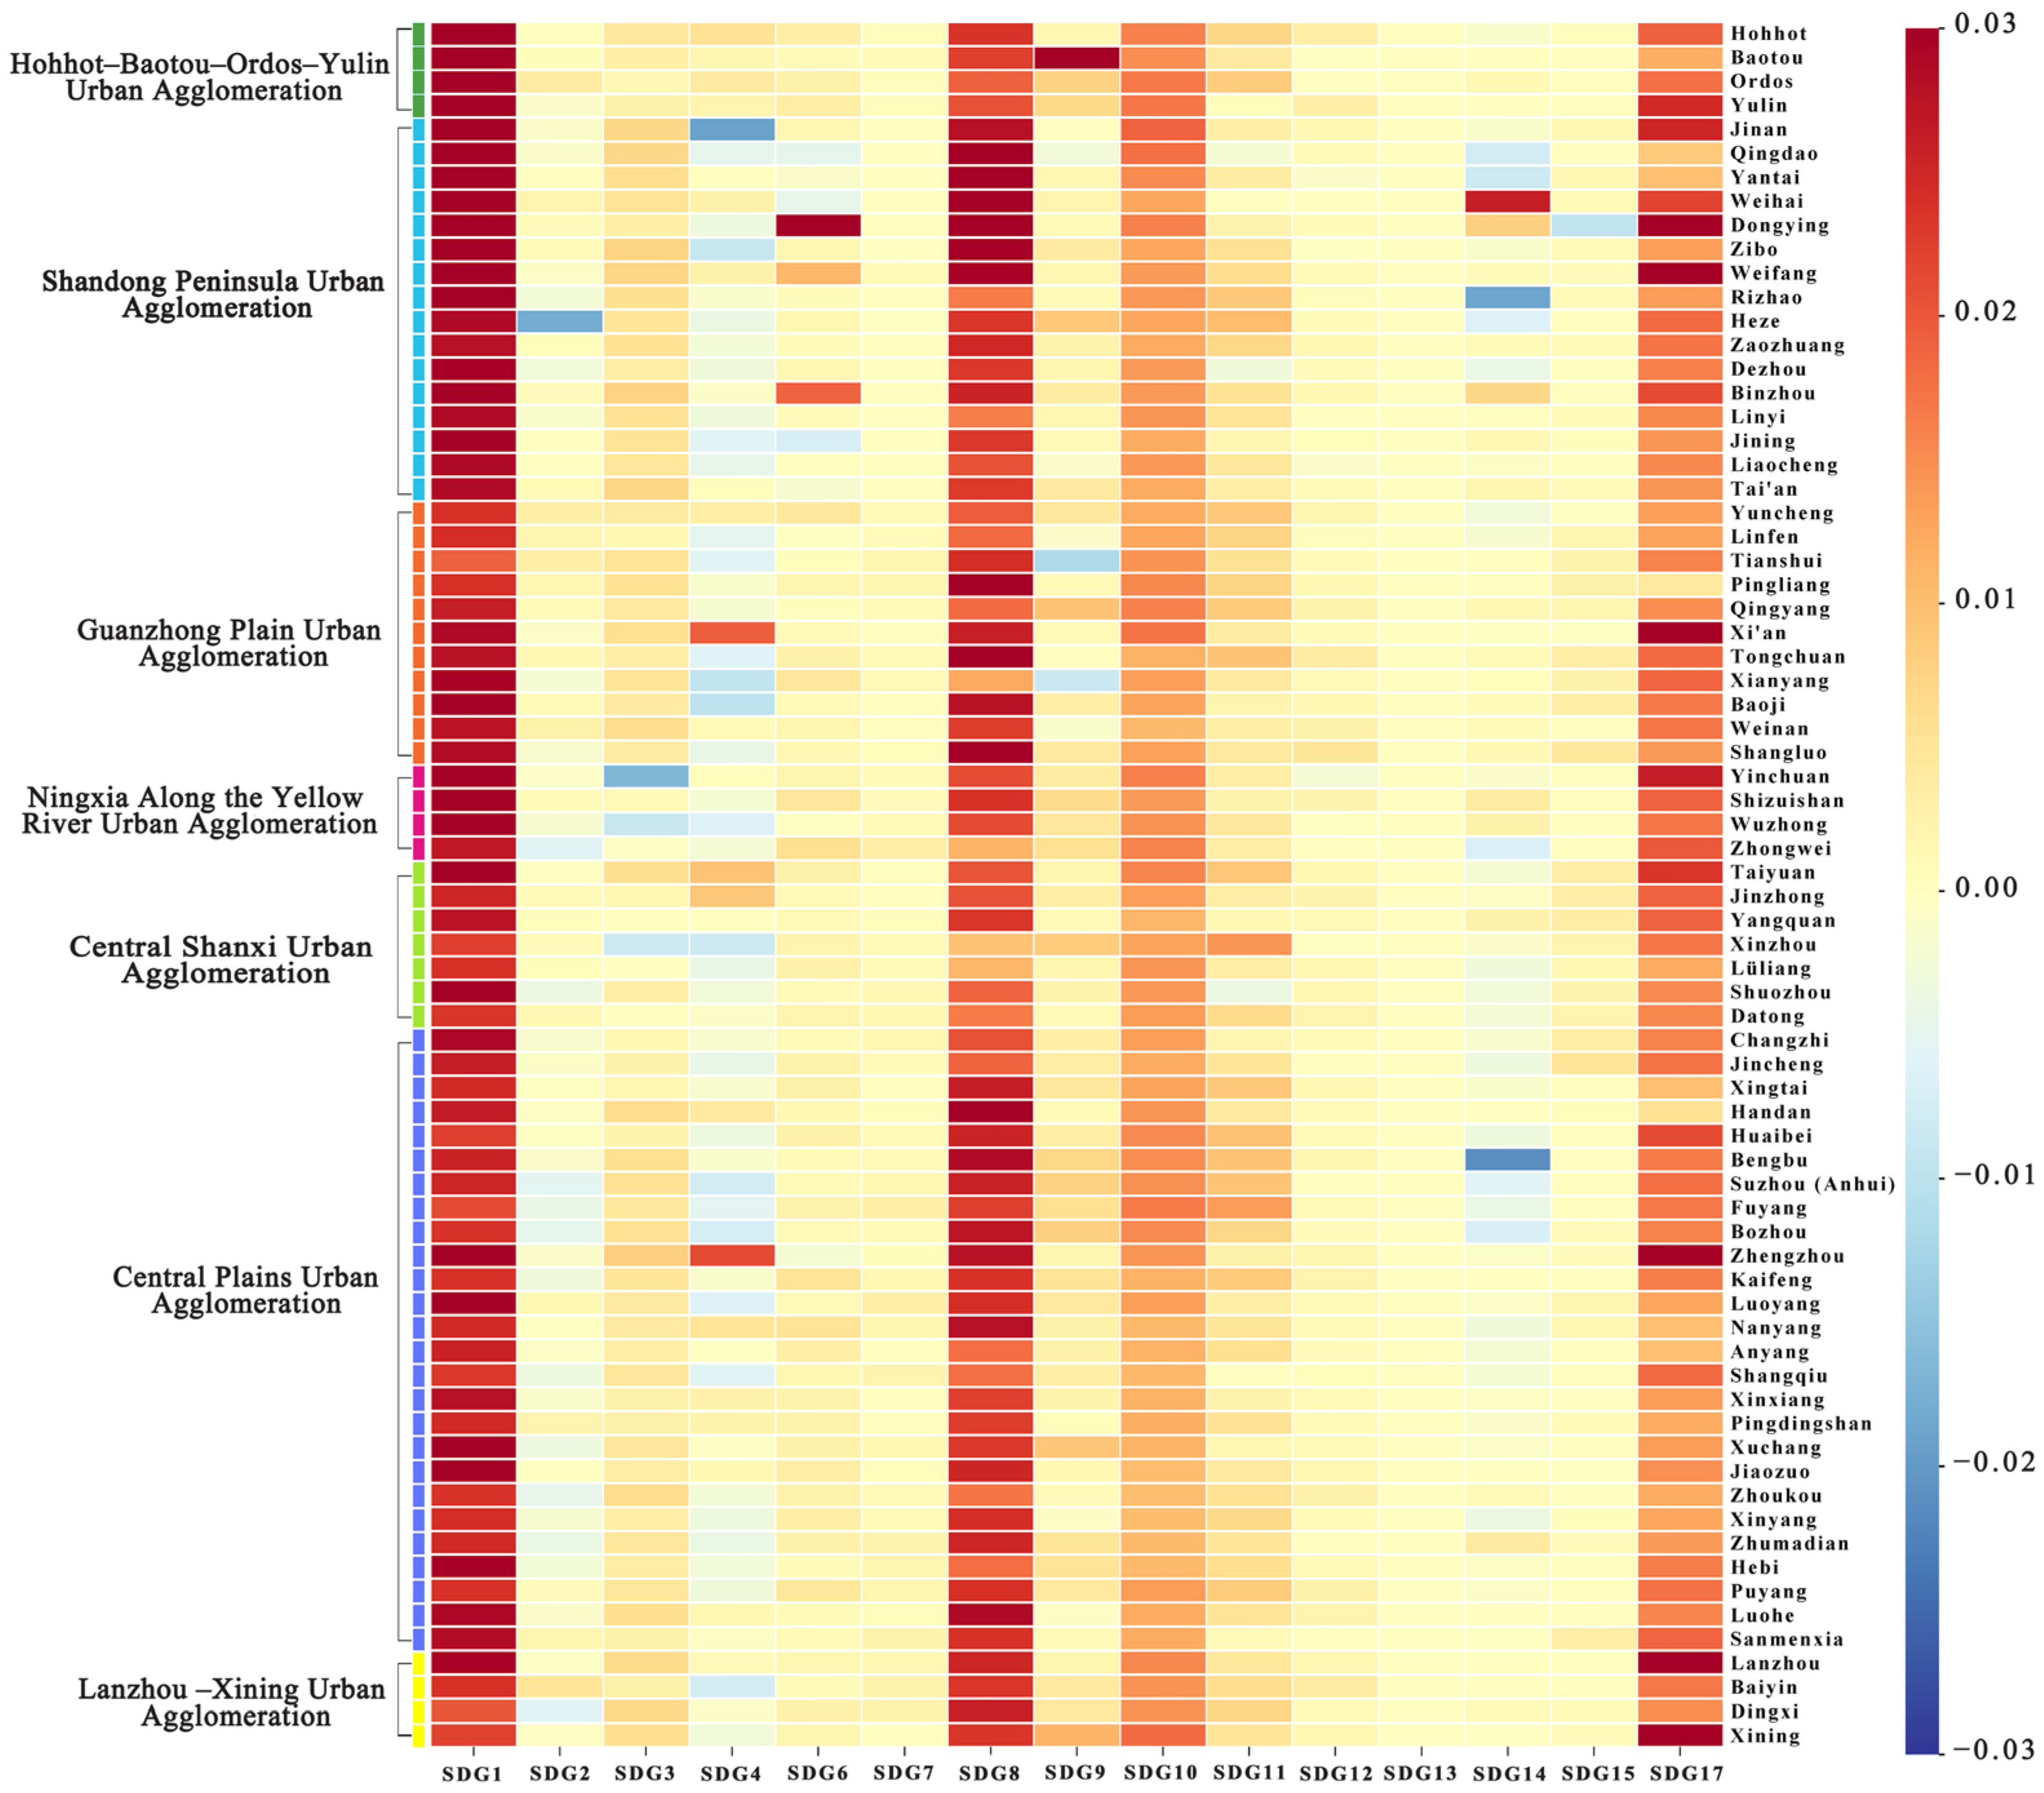
Figure 3 shows that, compared to those in 2007, nearly all cities in the study area achieved significant score improvements in 2022 for the goals of no poverty (SDG 1), decent work and economic growth (SDG 8), reduced inequality (SDG 10), and partnerships for the goals (SDG 17). Most cities demonstrated positive overall trends across the remaining SDGs. However, some cities experienced fluctuations or even declines in indicators for goals such as eliminating hunger (SDG 2), ensuring quality education (SDG 4), and conserving life below water (SDG 14). Among the urban agglomerations, the HBOYUA showed the most significant increase in its overall sustainable development score, followed by the CPUA and CSUA. In contrast, the improvement in the LXUA was relatively slower. These results confirm that the HBOYUA region and the CPUA, among others, have continuously improved their sustainable development levels between 2007 and 2022, achieving rapid expansion and upgrading thanks to their strong real economic foundations.
Figure 3.
Differences in each city’s scores between 2007 and 2022. A value greater than 0 indicates a higher SDG score in 2022 than in 2007, whereas a value less than 0 indicates the opposite.
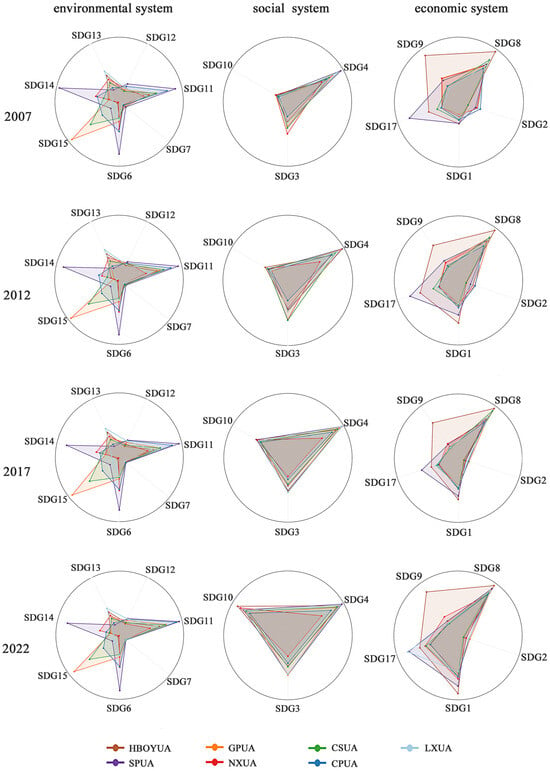
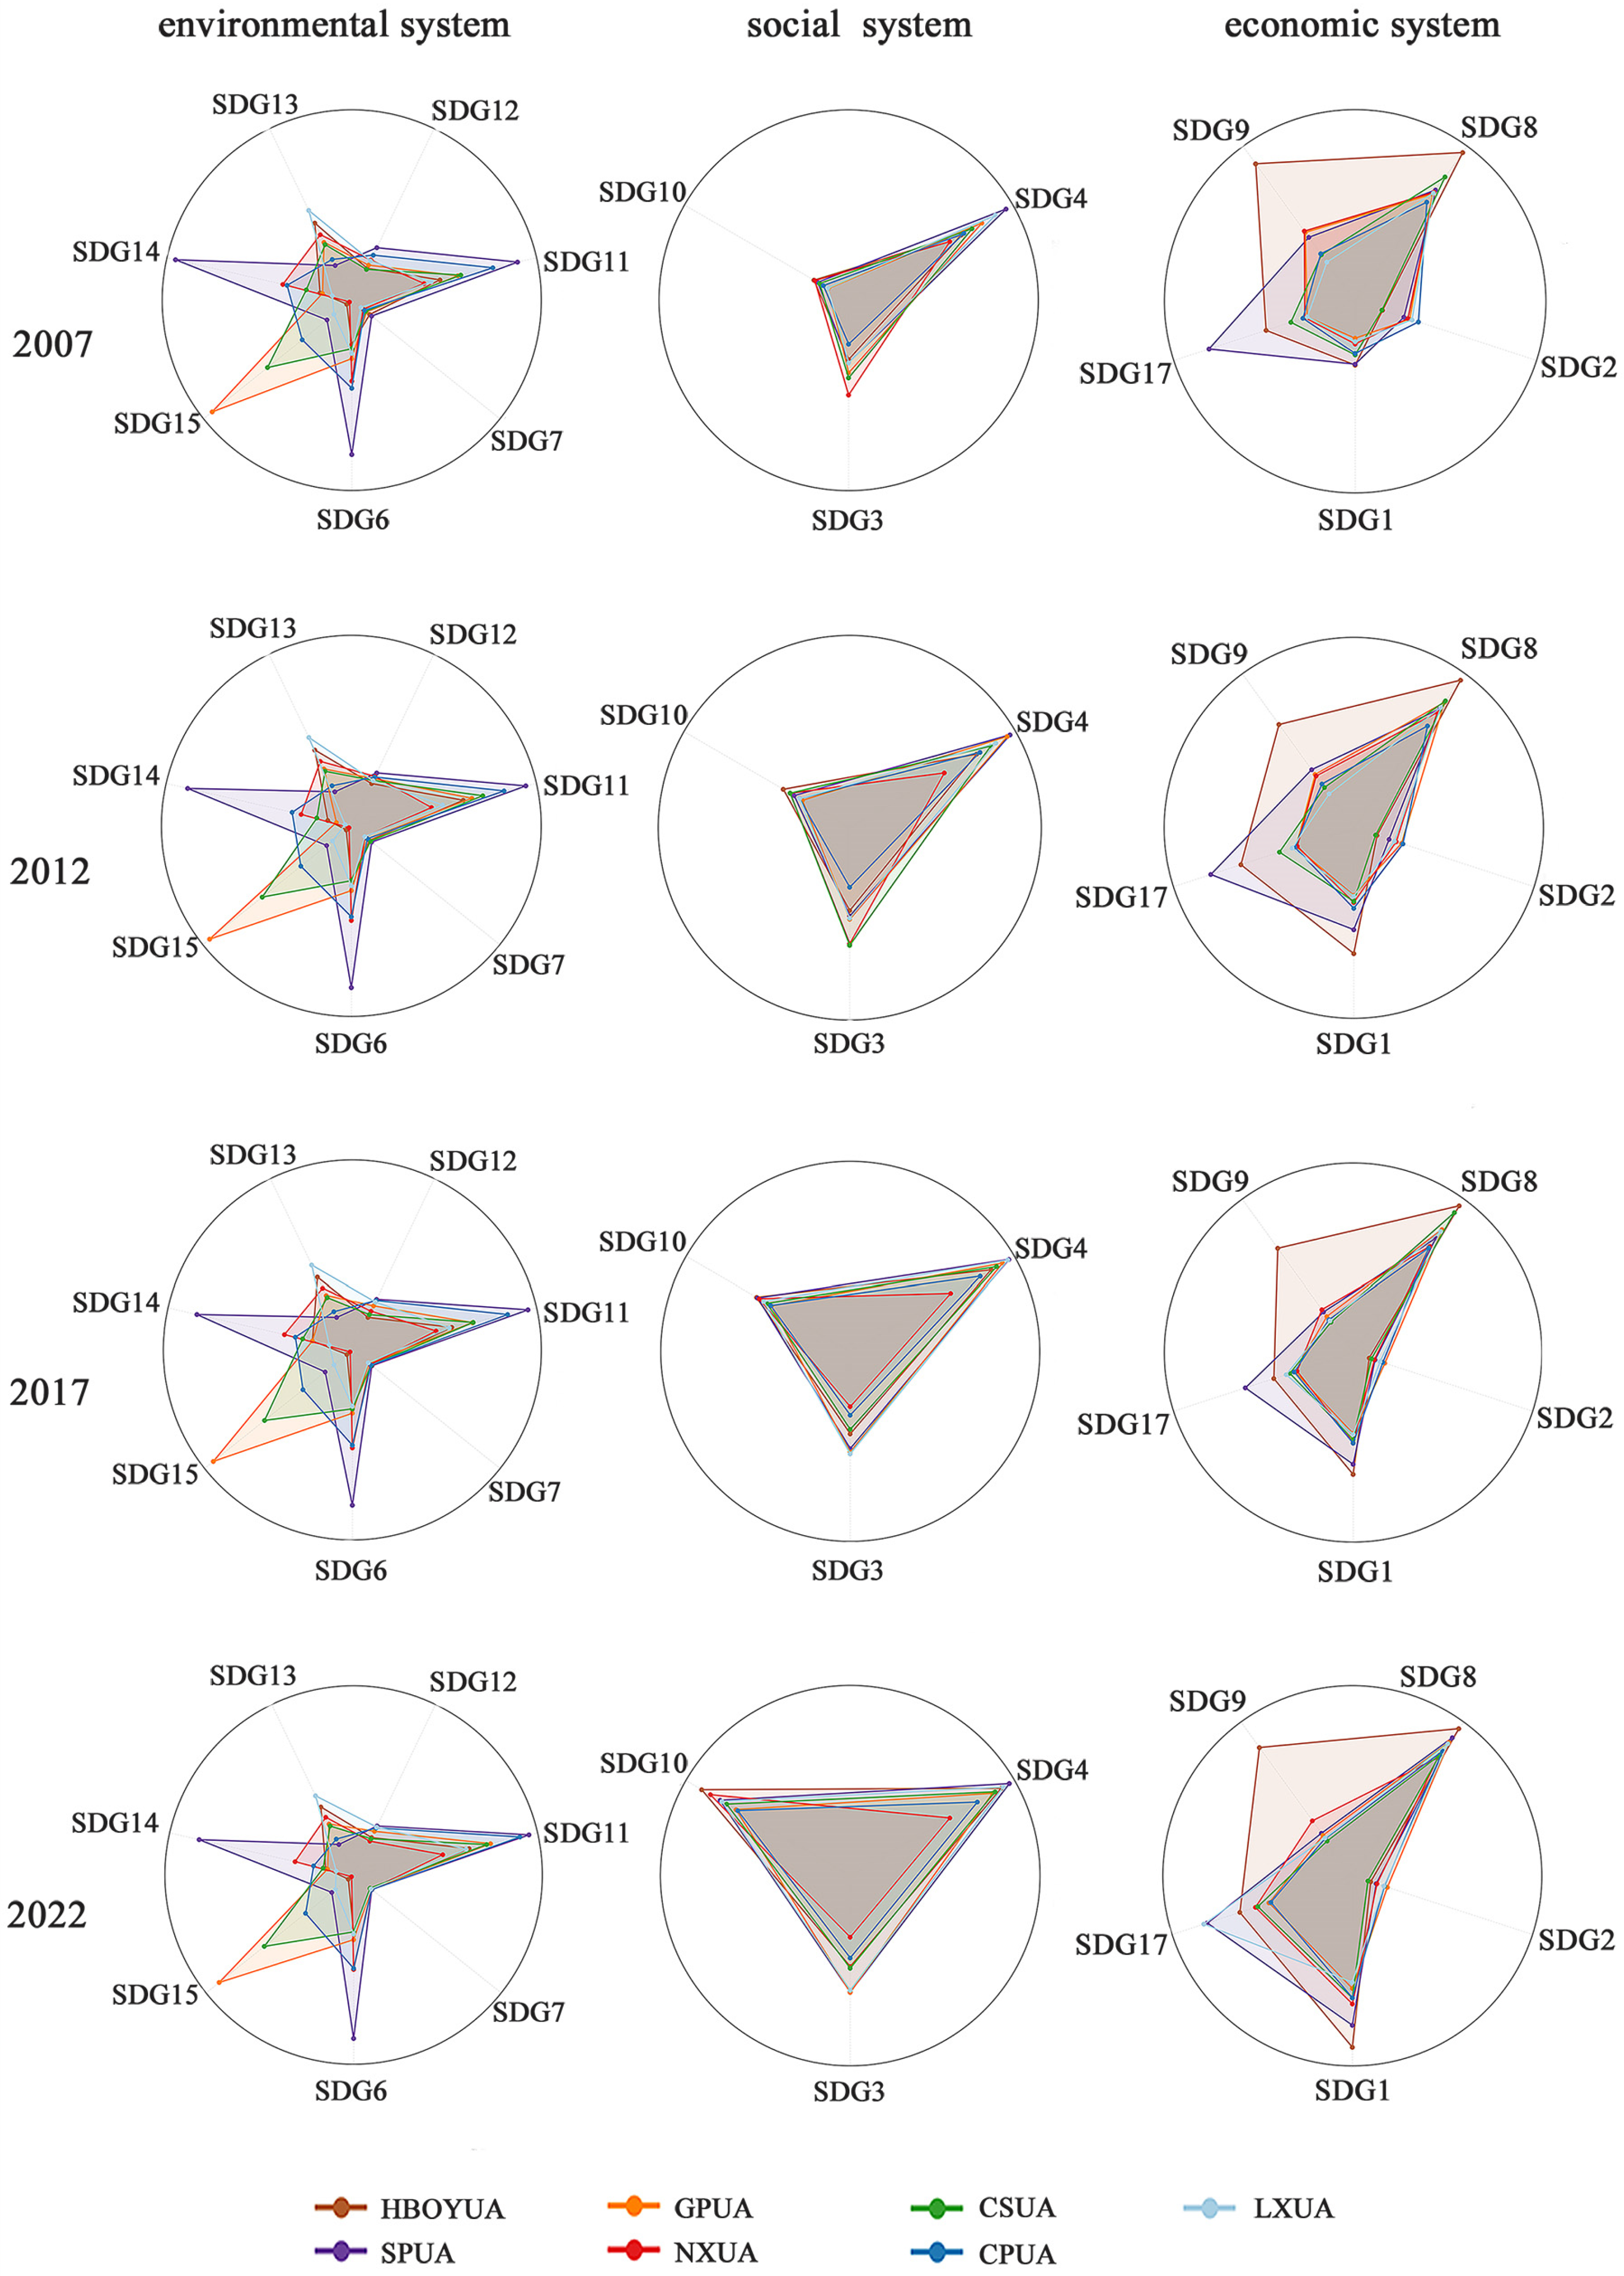
Figure 4 presents the evolution of ESE system development levels for 2007, 2012, 2017, and 2022. Within the economic subsystem, all urban agglomerations generally performed better on decent work and economic growth (SDG 8) than on the other goals. Notably, the HBOYUA and the SPUA made significant progress toward achieving the goal of no poverty (SDG 1). The SPUA consistently excels in fostering partnerships to achieve goals (SDG 17). Additionally, the HBOYUA performed well across industry, innovation, and infrastructure (SDG 9). Within the social subsystem, the SPUA has a clear advantage in educational quality (SDG 4), while the NXUA is relatively disadvantaged. All urban agglomerations made steady progress in ensuring good health and well-being (SDG 3), reflecting overall improvements in regional living standards. Regarding reducing inequalities (SDG 10) in the urban-rural income gap, the NXUA performs well. At the same time, the CSUA performs at an average level, thereby indicating persistent gaps in urban-rural income and consumption levels. Regarding environmental subsystems, the SPUA excels in sustainable cities and communities (SDG 11) and clean water and sanitation (SDG 6). The NXUA and LXUA, however, exhibit relatively average performance. The GPUA scores highly regarding the forest coverage indicators related to terrestrial life (SDG 15). Regarding life below water (SDG 14), the SPUA ranks highest. On climate action (SDG 13), LXUA performed well, while SPUA and CPUA performed relatively average. Overall, sustainable development among urban agglomerations in the Yellow River Basin has steadily advanced in economic growth and social welfare. These urban agglomerations have all made significant progress in health and well-being, educational quality, and coordinated urban-rural development, reflecting the positive spillover effects of economic development on the social sector. However, environmental performance varies markedly among the urban agglomerations, with some still facing shortcomings in areas such as ecological conservation and climate action.
Figure 4.
Trends in SDG levels across economic, social, and environmental systems in 2007–2022.
3.2. Spatial Differences in Urban Sustainability
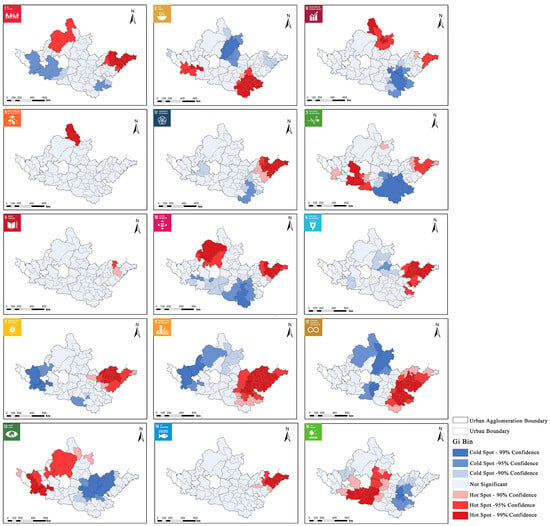
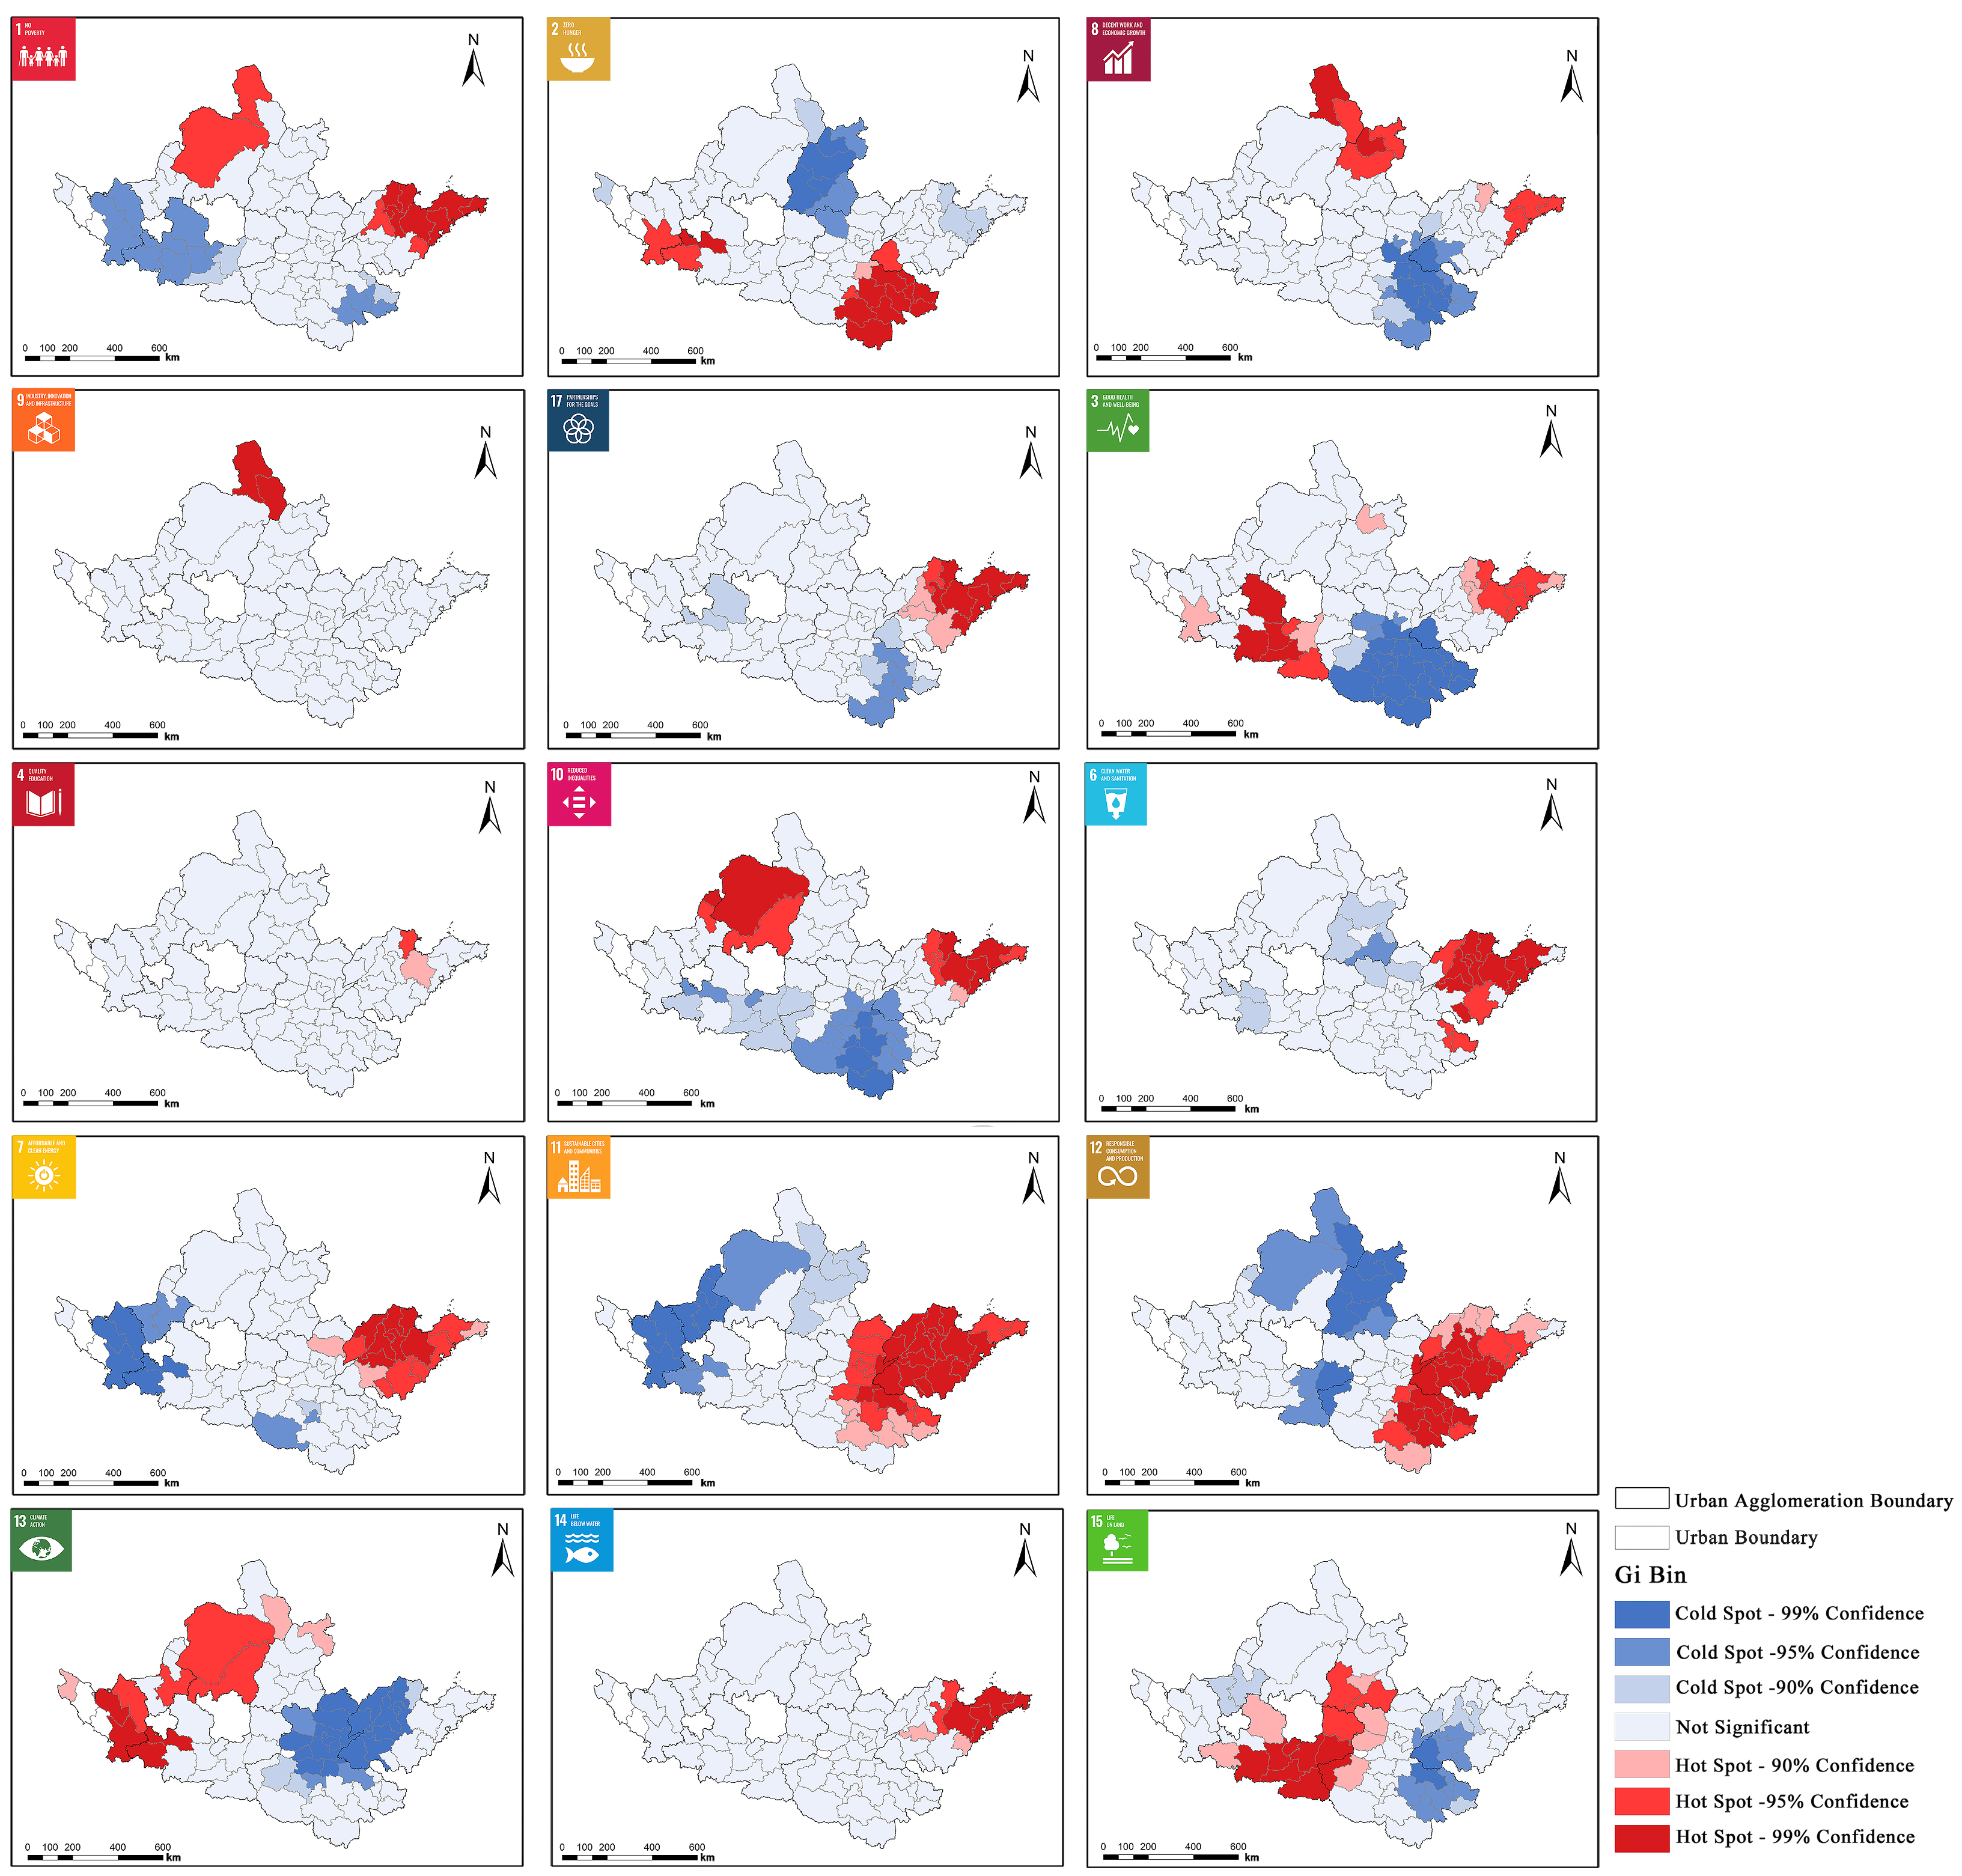
This paper further explores spatial differences in SDGs across urban agglomerations within the Yellow River Basin. Figure 5 illustrates the spatial patterns of SDGs performance, revealing distinct hot spots and cold spots corresponding to areas of high and low sustainable development, respectively. The economic cold spots are concentrated in the LXUA and CSUA, reflecting their relatively low overall economic sustainability. In contrast, SPUA has a more developed economy, with densely clustered hot spots in coastal cities. The HBOYUA also has numerous economic hot spots, indicating robust regional economic development. Socially, the CPUA reveals more cold spots related to reducing inequalities (SDG 10) and ensuring good health and well-being (SDG 3). This highlights persistent challenges regarding healthcare resources, resident welfare, and the urban-rural income gap. Environmentally, the SPUA demonstrates concentrated strengths across multiple SDGs, including clean water and sanitation (SDG 6), affordable and clean energy (SDG 7), sustainable cities and communities (SDG 11), and responsible consumption and production (SDG 12). This reflects its comprehensive advantages in green governance. However, climate action in the western part of this cluster and the northern region of the CPUA is weaker (SDG 13), and air quality is a prominent issue. In contrast, the LXUA and the GPUA have better overall air quality. Additionally, the GPUA performs well on terrestrial life (SDG 15), but its resource recycling efficiency for responsible consumption and production (SDG 12) still needs improvement.
Figure 5.
Spatial distribution of hotspots and coldspots for each SDG.
3.3. Coupling Coordination of the ESE System
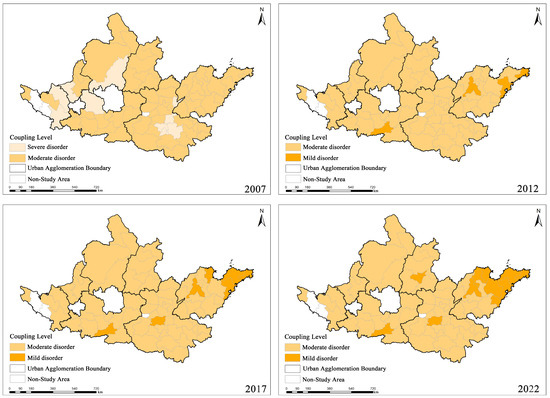
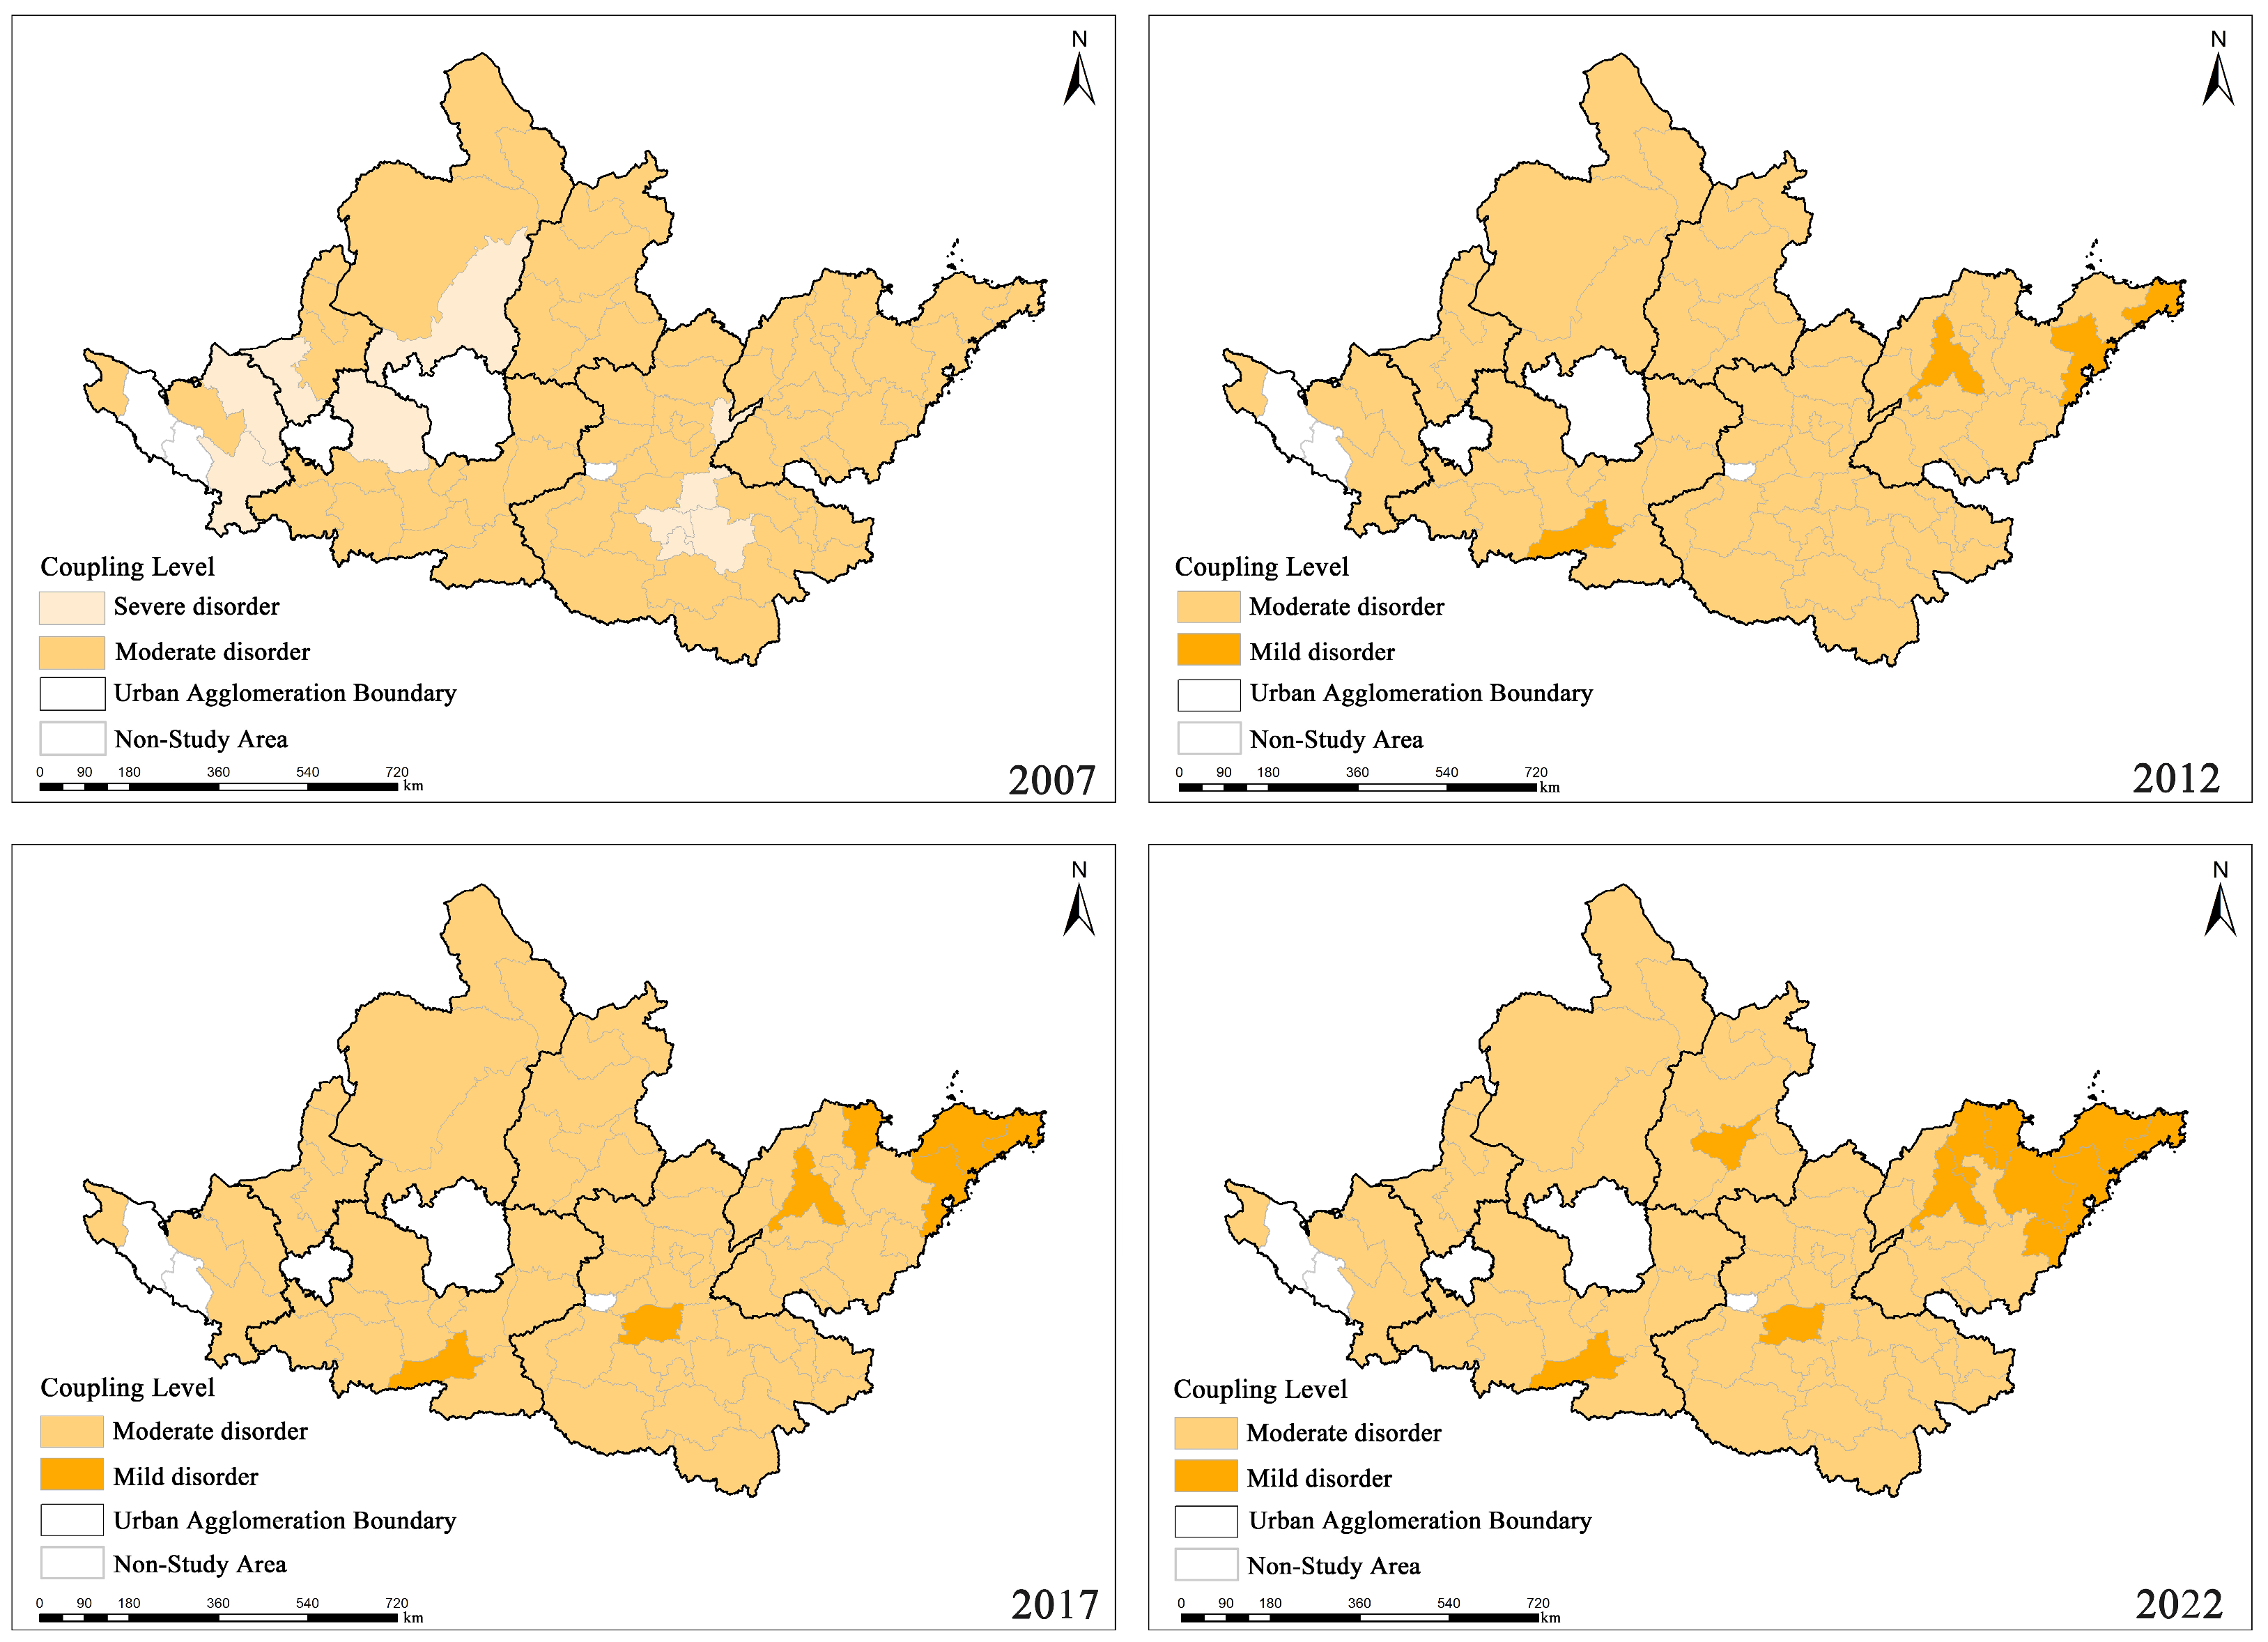
Figure 6 displays the spatiotemporal evolution patterns at four time points: 2007, 2012, 2017, and 2022. In 2007, most cities in the study area were in the “Moderate disorder” stage, while some resource-based and economically underdeveloped cities remained in the “Severe disorder” stage. During this period, the average scores for the economic, social, and environmental subsystems of the Yellow River Basin urban agglomerations were 0.0667, 0.0358, and 0.0559, respectively. The environmental foundation was solid, but economic and social deficiencies constrained coordination. At the city level, the top three cities in terms of coupling coordination D value were Qingdao, Weihai, and Jinan, with scores for their economic, social, and environmental subsystems of (0.1273, 0.0614, 0.0873), (0.0999, 0.0361, 0.1475), and (0.0926, 0.0974, 0.0494), respectively. Their high levels of coordination stem primarily from strong economic foundations, social service capabilities, and ecological support. Among them, Weihai stands out for its environmental strengths, while Qingdao and Jinan rely mainly on their economic and social development advantages to drive coordinated improvement. At the metropolitan area level, spatial disparities between regions are quite significant. The average D values, from highest to lowest, are as follows: the SPUA (0.2477), the GPUA (0.2218), the CSUA (0.2175), the HBOYUA (0.2168), the CPUA (0.2135), the NXUA (0.2118), and the LXUA (0.2064). This reflects the dominant role of economic foundations, urbanization levels, and infrastructure conditions in determining regional coordination levels.
Figure 6.
Spatiotemporal evolution patterns of the economy-society-environment system coupling coordination in the urban agglomerations of the Yellow River Basin.
By 2012, the average scores for the economic, social, and environmental subsystems of urban agglomerations in the Yellow River Basin had risen to 0.0914, 0.0435, and 0.0590. The number of cities classified as “Severe disorder” decreased significantly, and these cities gradually transitioned to the “Moderate disorder” stage. Some cities with strong economic foundations and favorable locational conditions further progressed to the “Mild disorder” stage, including Jinan, Qingdao, and Weihai in the SPUA, as well as Xi’an in the GPUA. The scores for the economic, social, and environmental subsystems in these cities were (0.1241, 0.1042, 0.0573), (0.1529, 0.0653, 0.0871), (0.1321, 0.0435, 0.1405), and (0.1259, 0.1127, 0.0730), respectively. Their early improvement stemmed from strong economies, population agglomeration, and infrastructure. At the urban agglomeration level, D values increased across all agglomerations. The average D values, from highest to lowest, are as follows: SPUA (0.2687), GPUA (0.2465), CSUA (0.2448), HBOYUA (0.2444), CPUA (0.2350), NXUA (0.2286), and LXUA (0.2276), with the SPUA continuing to maintain its leading position.
In 2017, overall coordination among urban agglomerations in the Yellow River Basin continued to improve, with average scores for the economic, social, and environmental subsystems rising to 0.1168, 0.0451, and 0.0618. Among them, Yantai and Dongying in the SPUA, as well as Zhengzhou in the CPUA, shifted from “Moderate disorder” to “Mild disorder.” The scores for the economic, social, and environmental subsystems in these cities were (0.1595, 0.0537, 0.0920), (0.1550, 0.0477, 0.1069), and (0.1713, 0.1057, 0.0534), respectively; Industrial and economic strengths drove their coordination gains. However, some inland cities remain in the “Moderate disorder” stage, affected by industrial restructuring, insufficient growth momentum, and ecological constraints. At the urban agglomeration level, the average D values, from highest to lowest, are as follows: SPUA (0.2804), GPUA (0.2626), HBOYUA (0.2586), CSUA (0.2554), CPUA (0.2501), LXUA (0.2494), and NXUA (0.2370). Among these, the HBOYUA showed a marked improvement in its coordination level, rising to second place.
The implementation of the 2019 Strategy for Ecological Protection and High-Quality Development in the Yellow River Basin provided important policy support for the coordinated development of urban agglomerations, driving ecological governance, industrial transformation, and regional collaboration. By 2022, the average scores for the economic, social, and environmental subsystems of urban agglomerations in the Yellow River Basin had further increased to 0.1392, 0.0515, and 0.0649, respectively, with the overall level of coordination continuing to improve. Most cities in the SPUA reached the “Mild Disorder” stage. At the same time, Taiyuan in the CSUA also showed phased improvement, with scores for its economic, social, and environmental subsystems of 0.1655, 0.0995, and 0.0619, respectively. At the urban agglomeration level, the average D values in 2022, ranked from highest to lowest, were as follows: SPUA (0.2984), HBOYUA (0.2778), GPUA (0.2765), LXUA (0.2698), CSUA (0.2664), CPUA (0.2657), and NXUA (0.2554). The SPUA continued to maintain the highest level, while the NXUA lagged in coordination due to constraints such as its economic foundation and industrial restructuring.
Overall, ESE system coupling and coordination among urban agglomerations in the Yellow River Basin show a trend of continuous improvement. However, regional disparities remain significant due to multiple factors such as resource endowments, industrial structure, location and transportation, and policy orientation. Cities with strong economic foundations, high innovation capacity, and well-developed infrastructure are better positioned to achieve synergistic improvements across subsystems. In the future, differentiated regulatory strategies should be implemented to address shortcomings in ESE systems across regions, thereby promoting further improvements in the level of coordinated development.
3.4. SDGs Influencing Factors
3.4.1. Major Factors Affecting Urban Sustainability
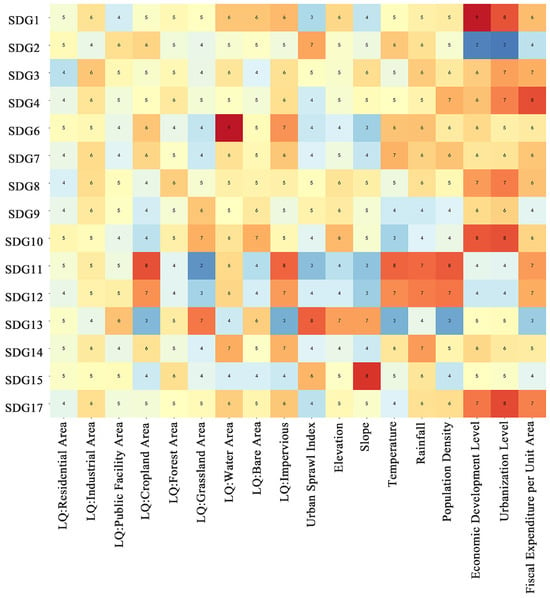
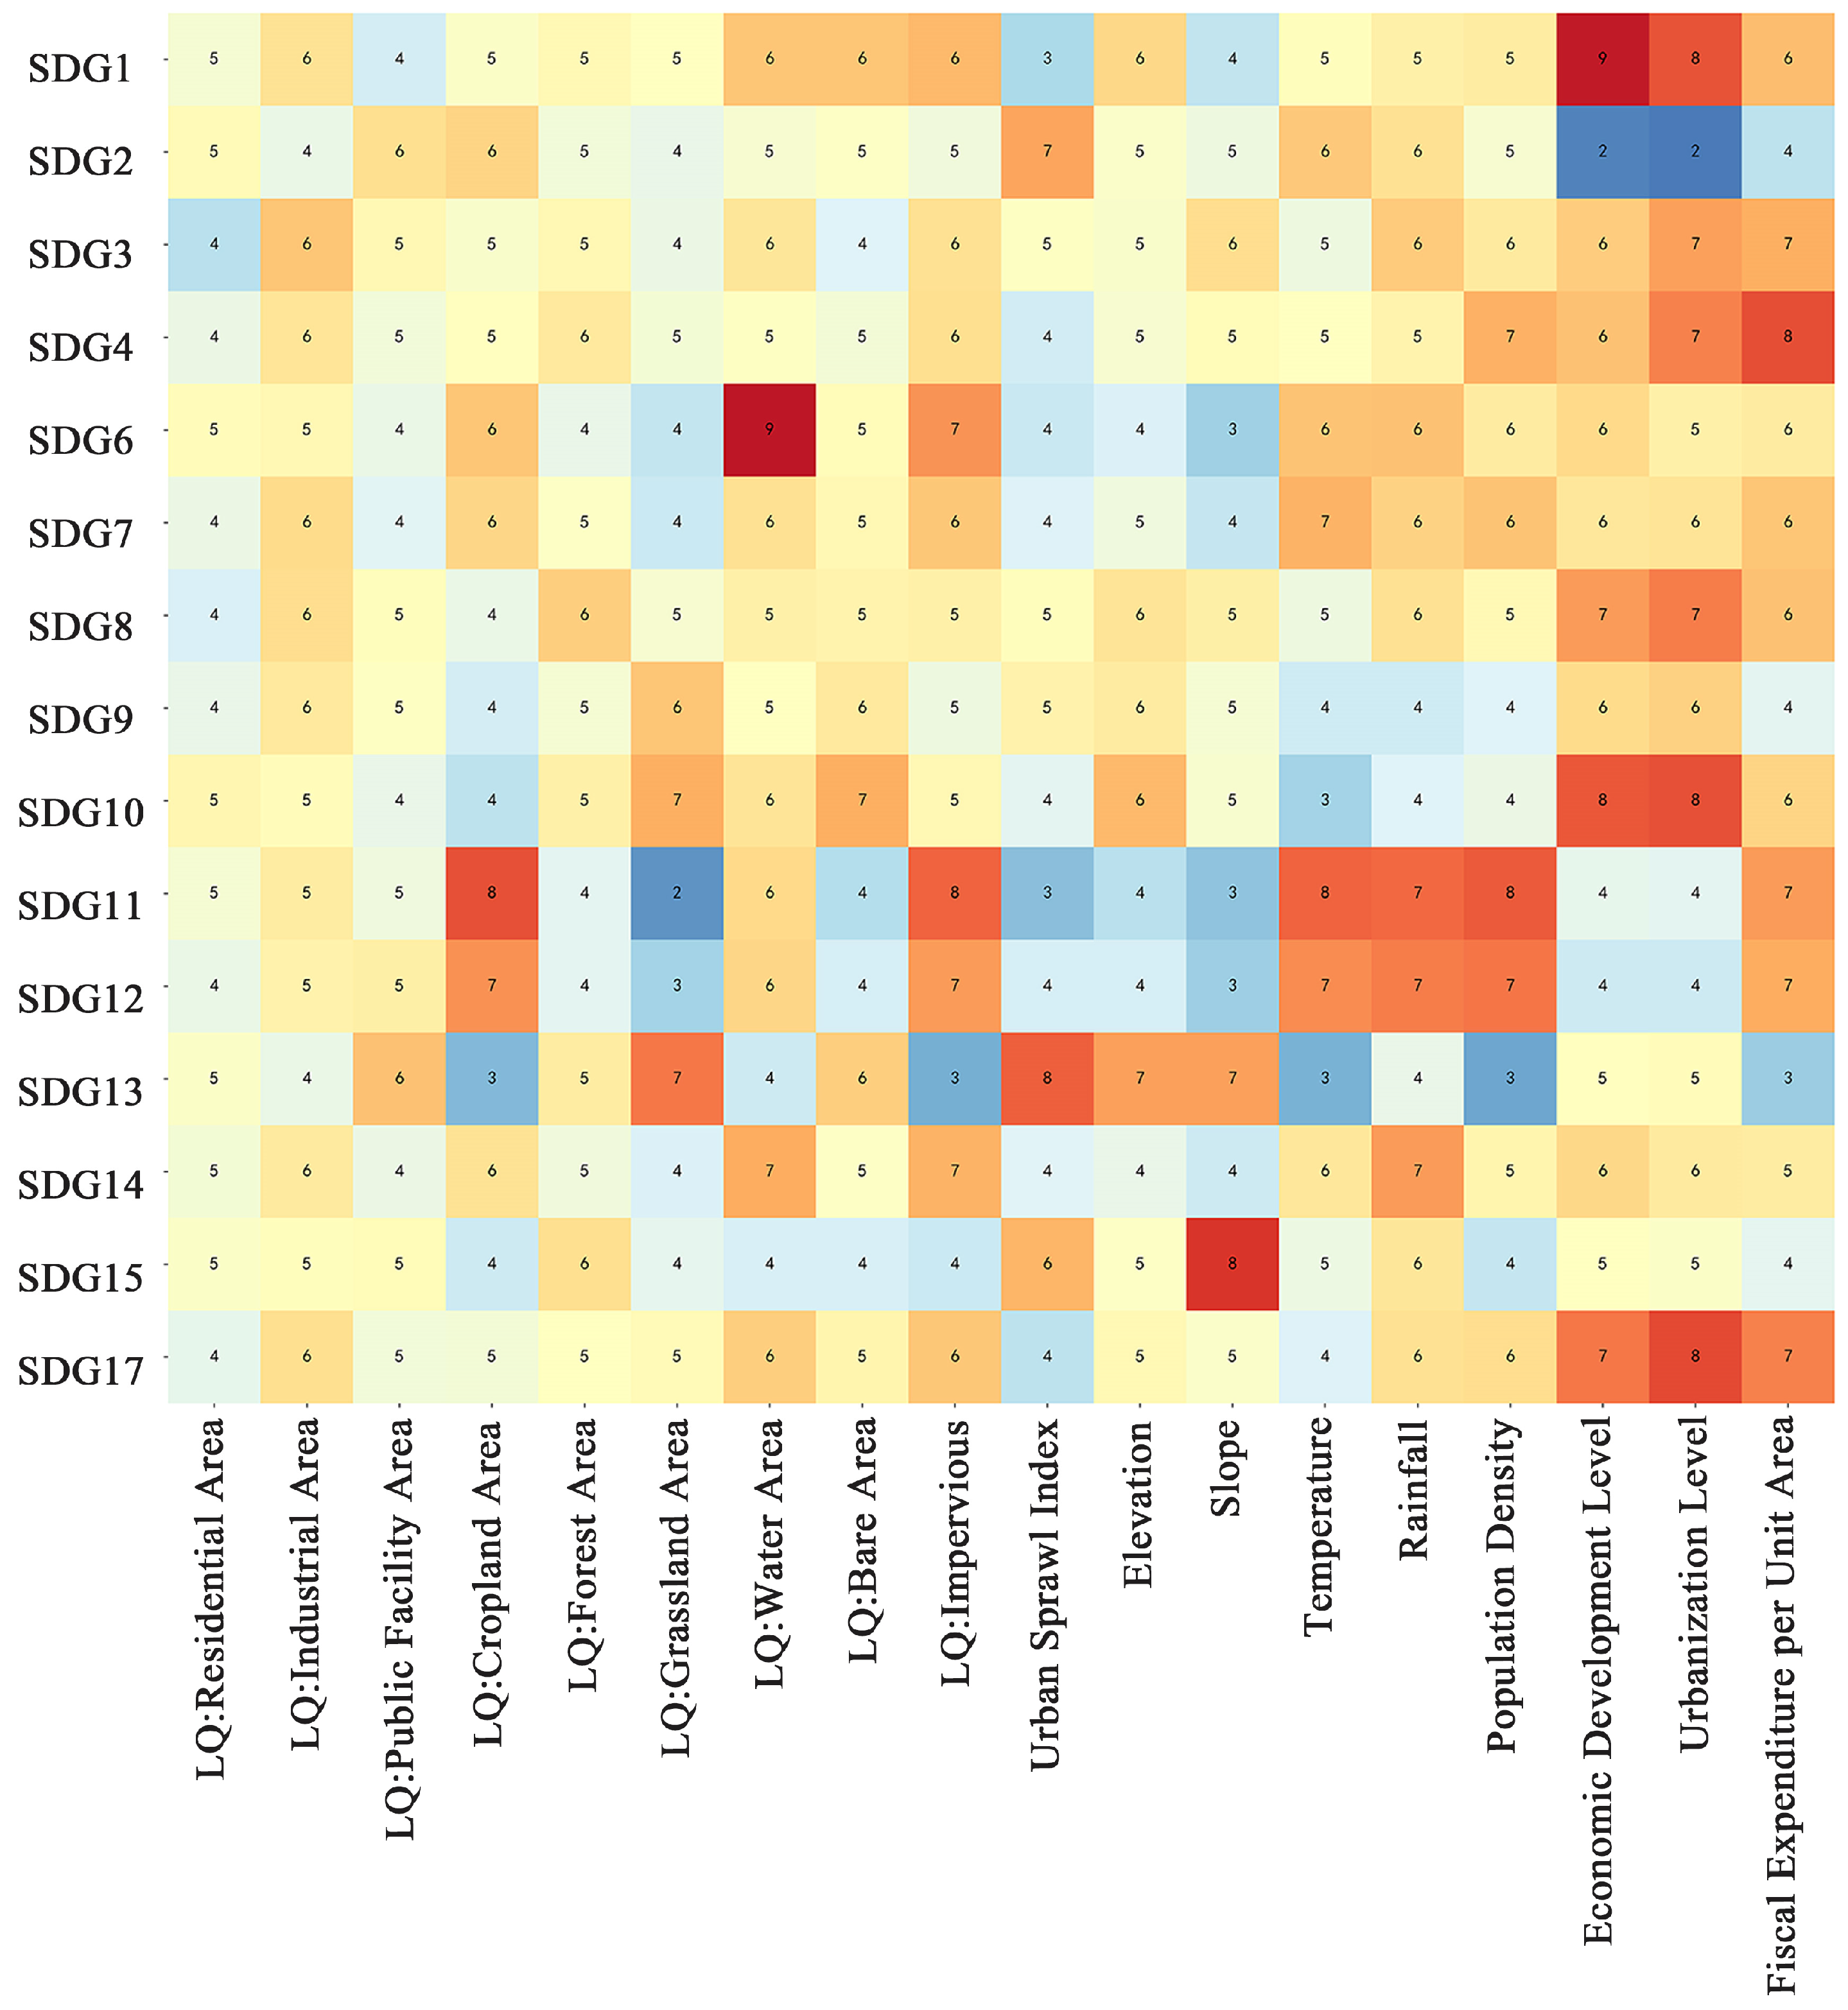
Figure 7 displays the results of an analysis quantifying the relative importance of factors contributing to each SDG. From a longitudinal perspective, certain drivers significantly affect key indicators. Notably, cropland has a substantial impact on sustainable cities and communities (SDG 11). The urban sprawl index is closely associated with the goal of zero hunger (SDG 2). Urban elevation is significantly correlated with climate change (SDG 13). Economic development significantly affects both the goal of no poverty (SDG 1) and the goal of reducing inequalities (SDG 10). Urbanization levels also play a significant role in reducing inequalities (SDG 10).
Figure 7.
Factors influencing analysis for each Sustainable Development Goal. The color gradient ranges from blue to red, with darker red indicating stronger influence and darker blue indicating weaker influence.
From a horizontal perspective, the sustainability of different systems is influenced by the synergistic effects of multiple factors. Urban economic sustainability (related to SDGs 1, 2, 8, 9, and 17) is primarily shaped by the combined effects of urban sprawl, economic development, and urbanization levels. Urban social sustainability (related to SDGs 3, 4, and 10) is primarily driven by fiscal expenditure per unit area, urbanization level, and economic development level. Urban environmental sustainability (related to SDGs 6, 7, 11, 12, 13, 14, and 15) is closely associated with factors such as the percentage of water body coverage, the scale of cropland, and the impervious surface ratio.
3.4.2. Major Influencing Factors of the ESE System
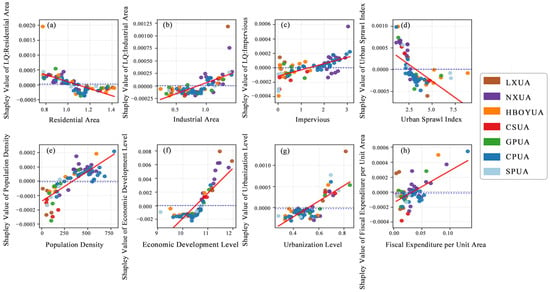
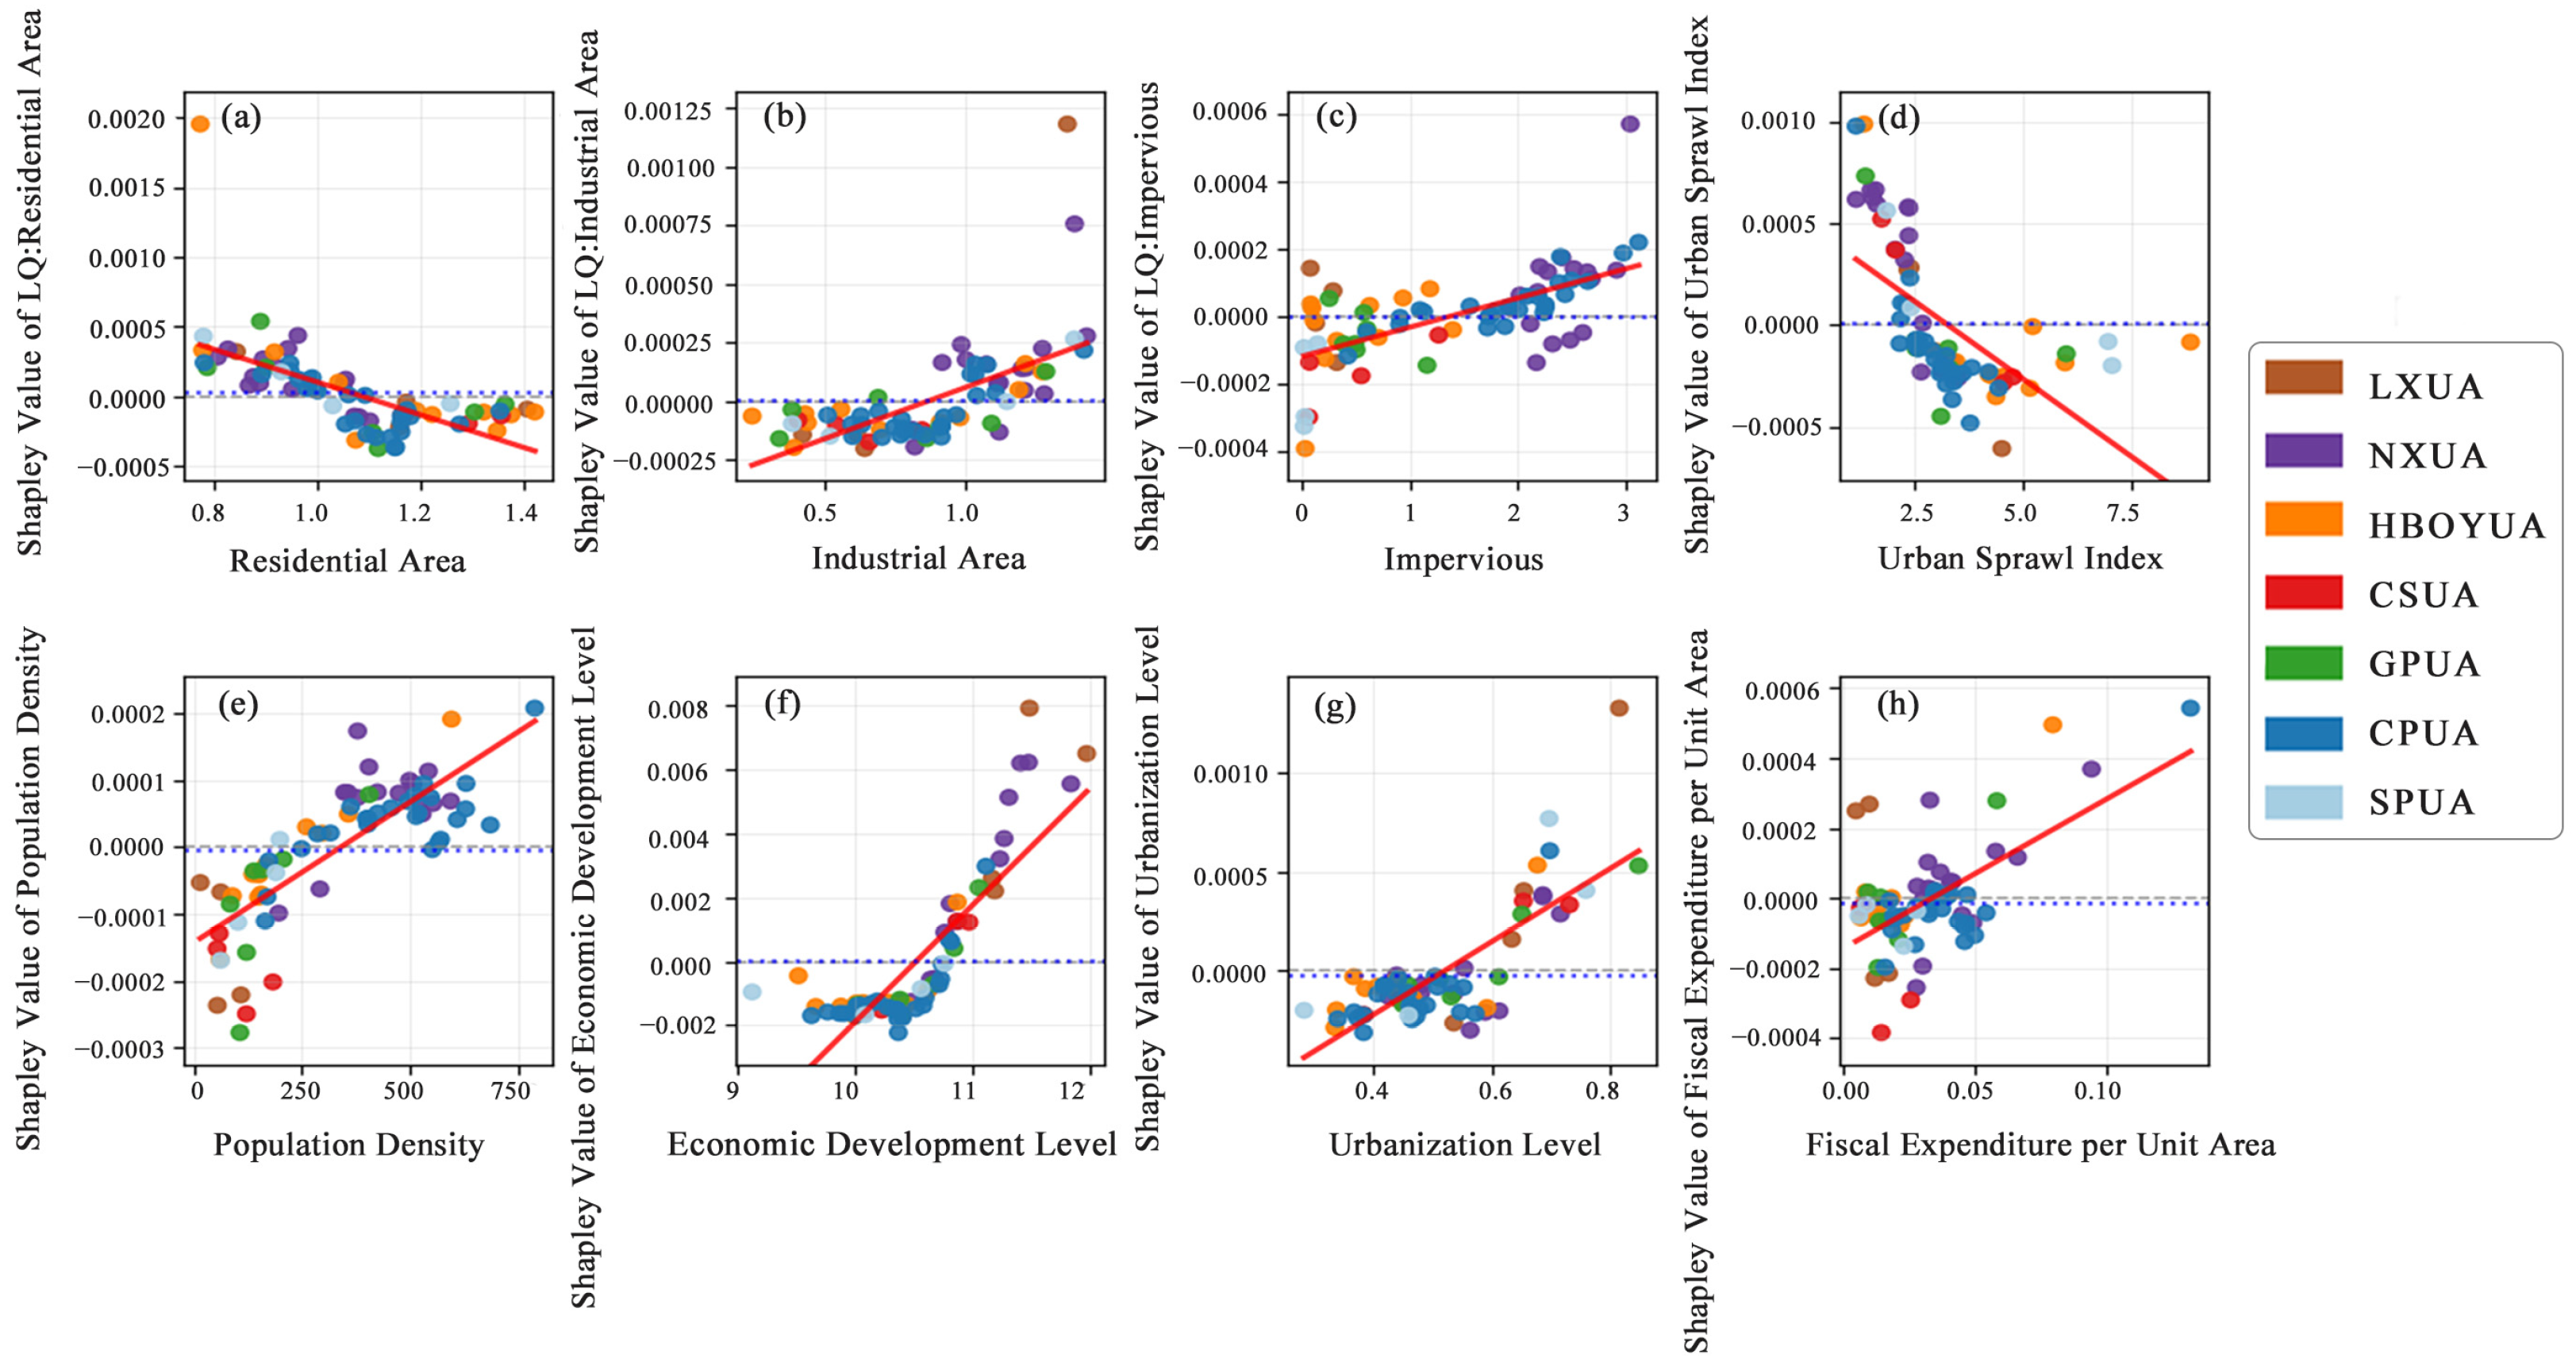
Figure 8, Figure 9 and Figure 10 identify key influencers of economic sustainability, including the ratio of industrial land to impervious surfaces, the urban sprawl index, and population density. A city’s relative advantage in the relevant function is indicated by a location quotient greater than 1 [28]. Analysis of Figure 8 shows that when the location quotient for industrial land exceeds 0.9, it significantly enhances economic development. The impervious surfaces ratio, population density, urbanization level, and fiscal expenditure per unit area are all positively correlated with the economic development levels. Moderate urban sprawl also facilitates economic growth.
Figure 8.
Correlations between Shapley values and economic factors features: (a) Residential area; (b) Industrial area; (c) Impervious; (d) Urban sprawl index; (e) Population density; (f) Economic development level; (g) Urbanization level; (h) Fiscal expenditure per unit area.
Figure 9.
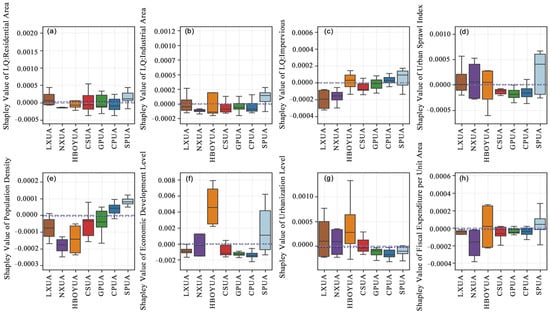
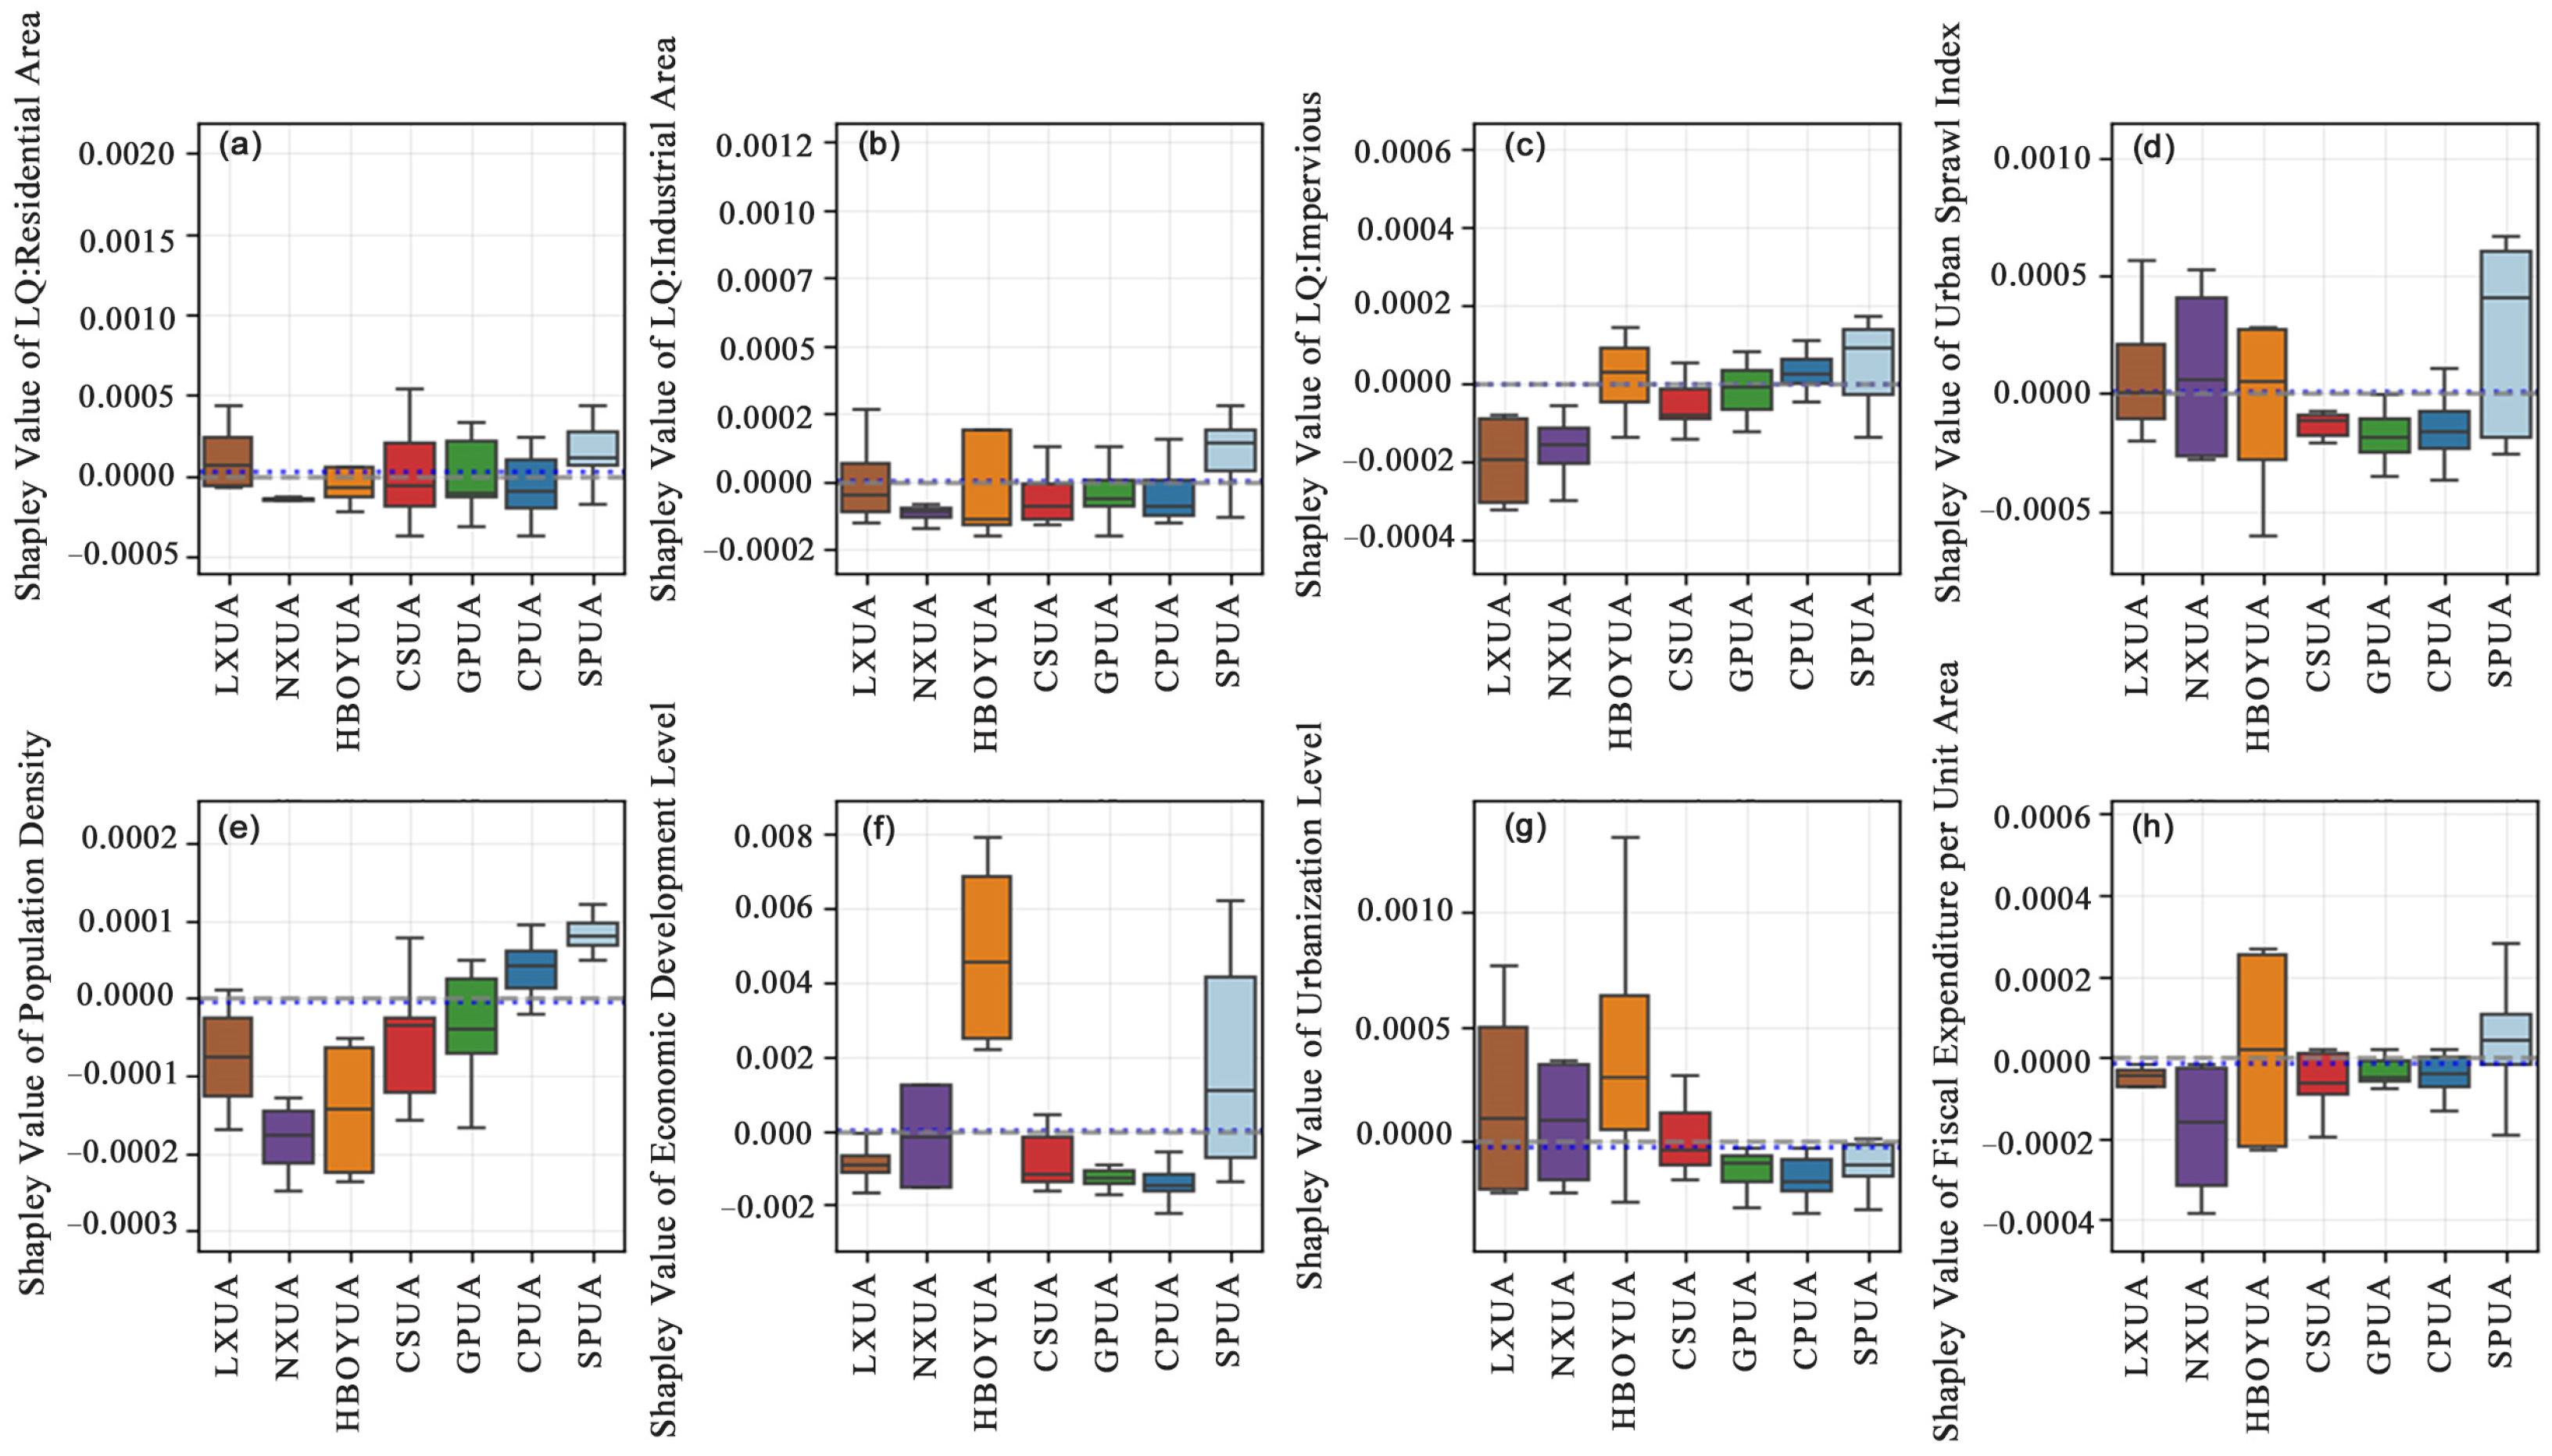
Shapley values of economic factors across urban agglomerations: (a) Residential area; (b) Industrial area; (c) Impervious; (d) Urban sprawl index; (e) Population density; (f) Economic development level; (g) Urbanization level; (h) Fiscal expenditure per unit area.
Figure 10.
Relative weight contributions of the eight key factors in the economic system.
From a regional perspective, urban agglomerations with higher proportions of industrial land (e.g., the SPUA) demonstrate stronger economic performance than those with lower proportions Figure 9b. Urban agglomerations with higher population densities (e.g., the CPUA and SPUA) also demonstrate stronger levels of economic development Figure 9e. From an SDGs perspective, Figure 10 indicates that enhanced economic development not only contributes to poverty eradication (SDG 1) and hunger elimination (SDG 2) but also drives industrial innovation and infrastructure development (SDG 9) while strengthening multistakeholder partnerships to achieve Sustainable Development Goals (SDG 17). Furthermore, higher levels of urbanization provide residents with more decent work and economic growth opportunities (SDG 8), fostering a mutually reinforcing dynamic between economic and social advancement.
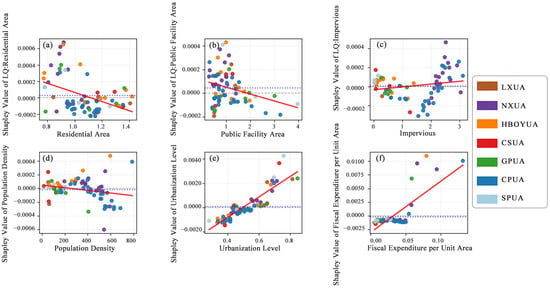
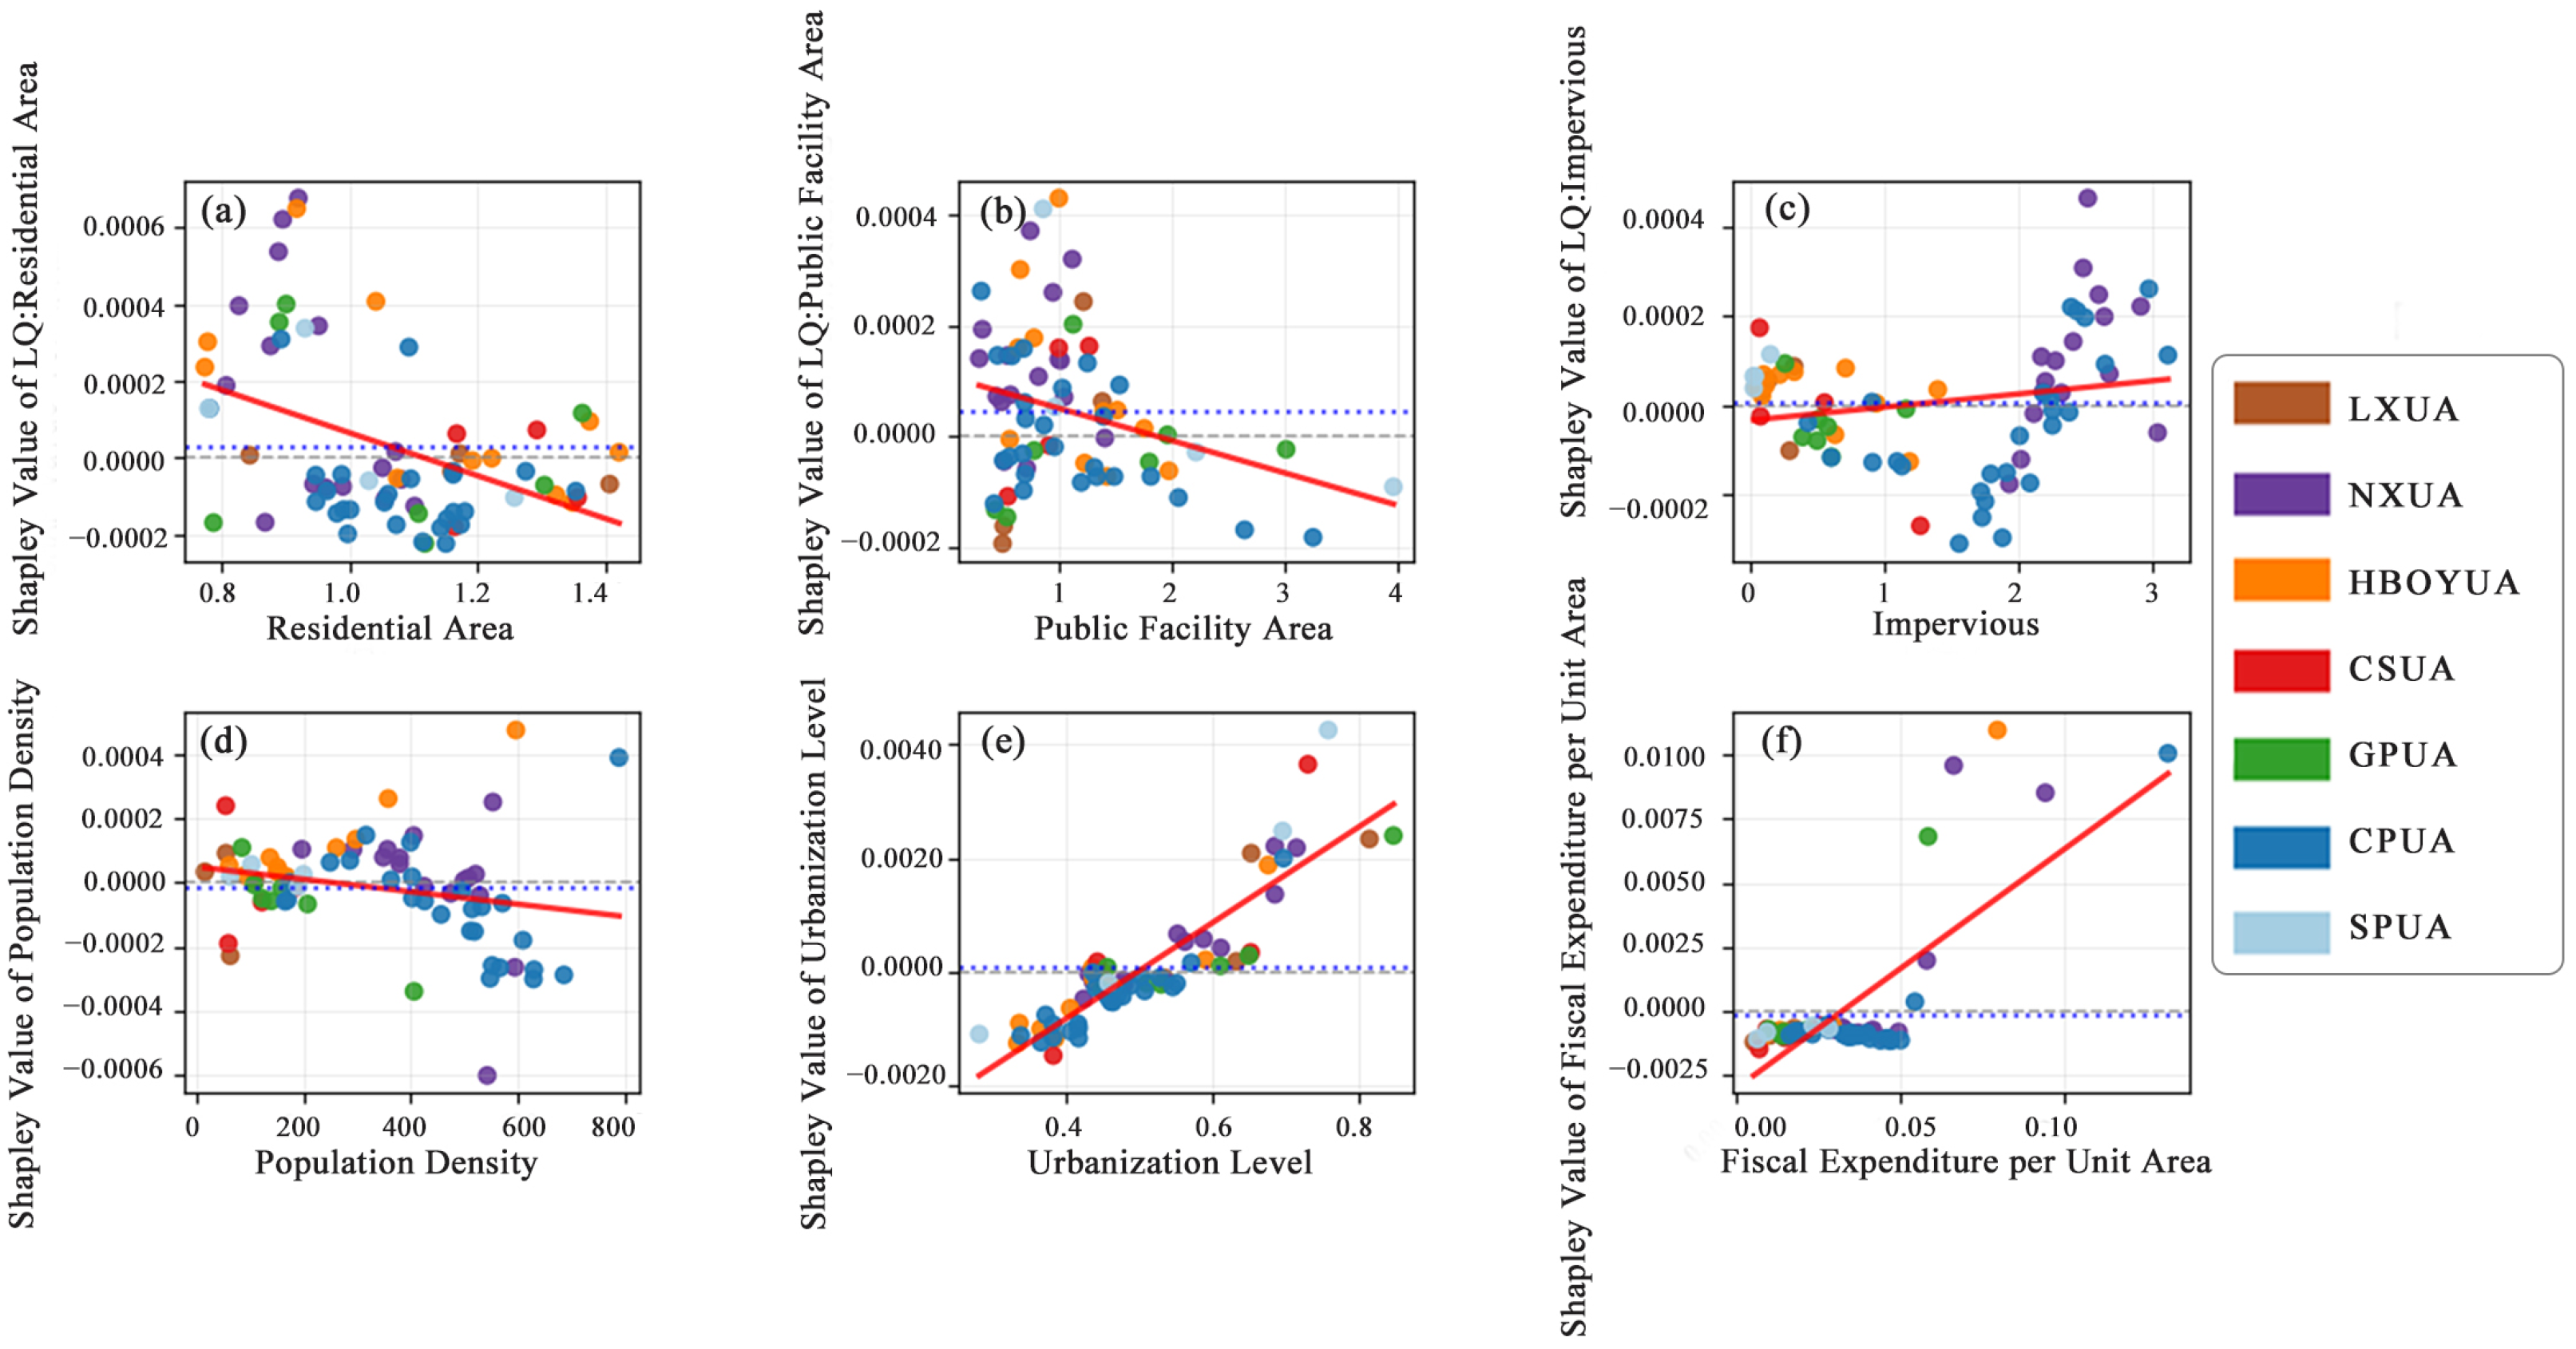
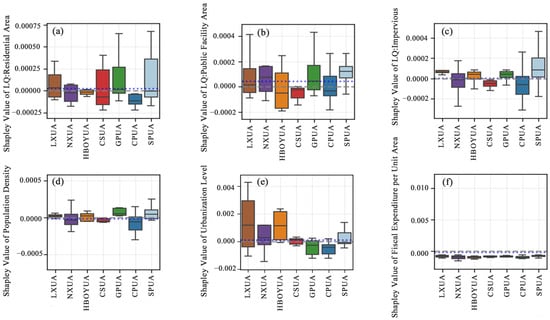
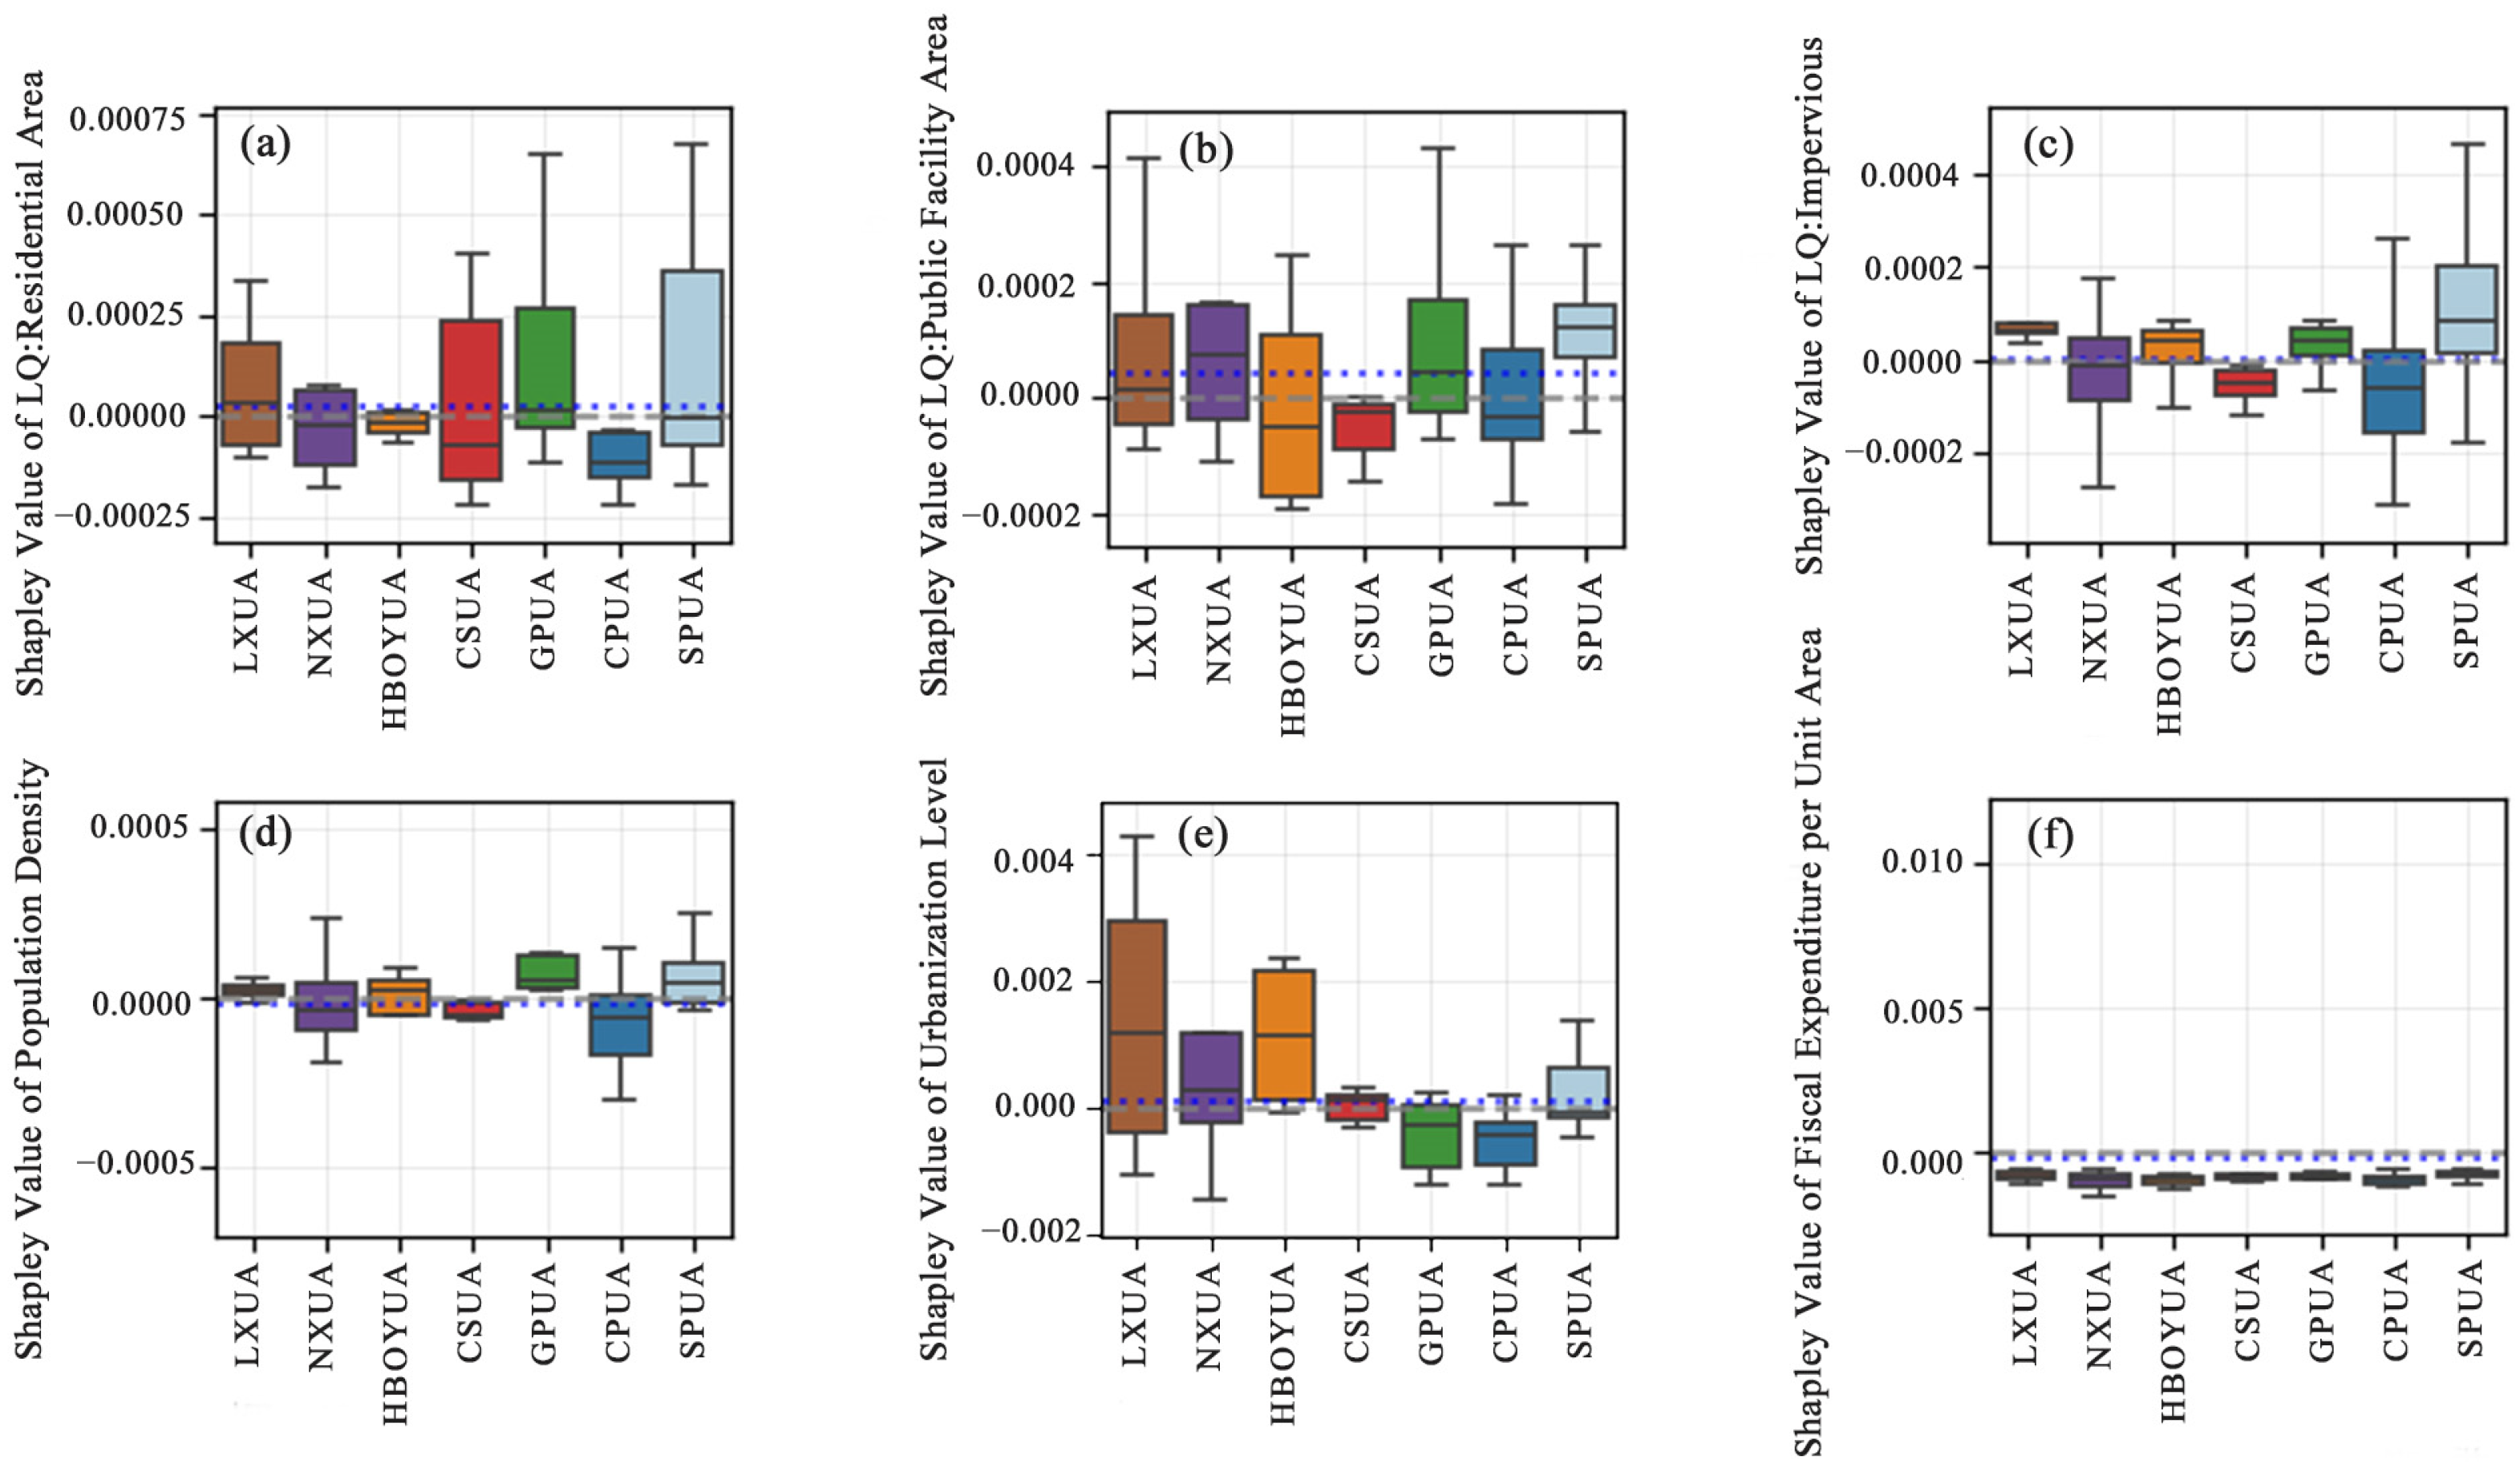
Figure 11, Figure 12 and Figure 13 illustrate the relationships among various factors, including residential areas, public facility land, impervious surfaces, population density, and social sustainability. Figure 11a,d show that social development levels are negatively correlated with the proportions of residential land and population density. Figure 12a,d show that the inhibitory effect on sustainable social development in the GPUA, where residential land proportions and population densities are relatively high, is more pronounced than in other urban agglomerations. Figure 11b and Figure 12b show that the promotional effect of public facility land on social sustainability becomes more pronounced when the location quotient exceeds 1.5. Figure 11c and Figure 12c show a positive correlation between the impervious surface ratio and social sustainability. Compared with other urban agglomerations, the SPUA, with a higher impervious surface ratio, exhibits better overall social sustainability. Figure 11e,f reveal that both urbanization levels and fiscal expenditure per unit area are positively correlated with social sustainability. Figure 12e,f further show that the LXUA has relative advantages in social sustainability driven by its higher level of urbanization and greater fiscal investment intensity. Figure 13 further elucidates the mechanism by which increased urbanization levels help reduce social inequality (SDG 10) and improve residents’ health and well-being (SDG 3), while higher fiscal expenditure per unit area supports the advancement of high-quality education (SDG 4).
Figure 11.
Correlations between Shapley values and social factors features: (a) Residential area; (b) Public facility area; (c) Impervious; (d) Population density; (e) Urbanization level; (f) Fiscal expenditure per unit area.
Figure 12.
Shapley values of social factors across urban agglomerations: (a) Residential area; (b) Public facility area; (c) Impervious; (d) Population density; (e) Urbanization level; (f) Fiscal expenditure per unit.
Figure 13.
Relative weight contributions of the six key factors in the social system.
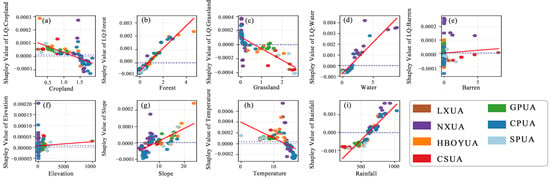
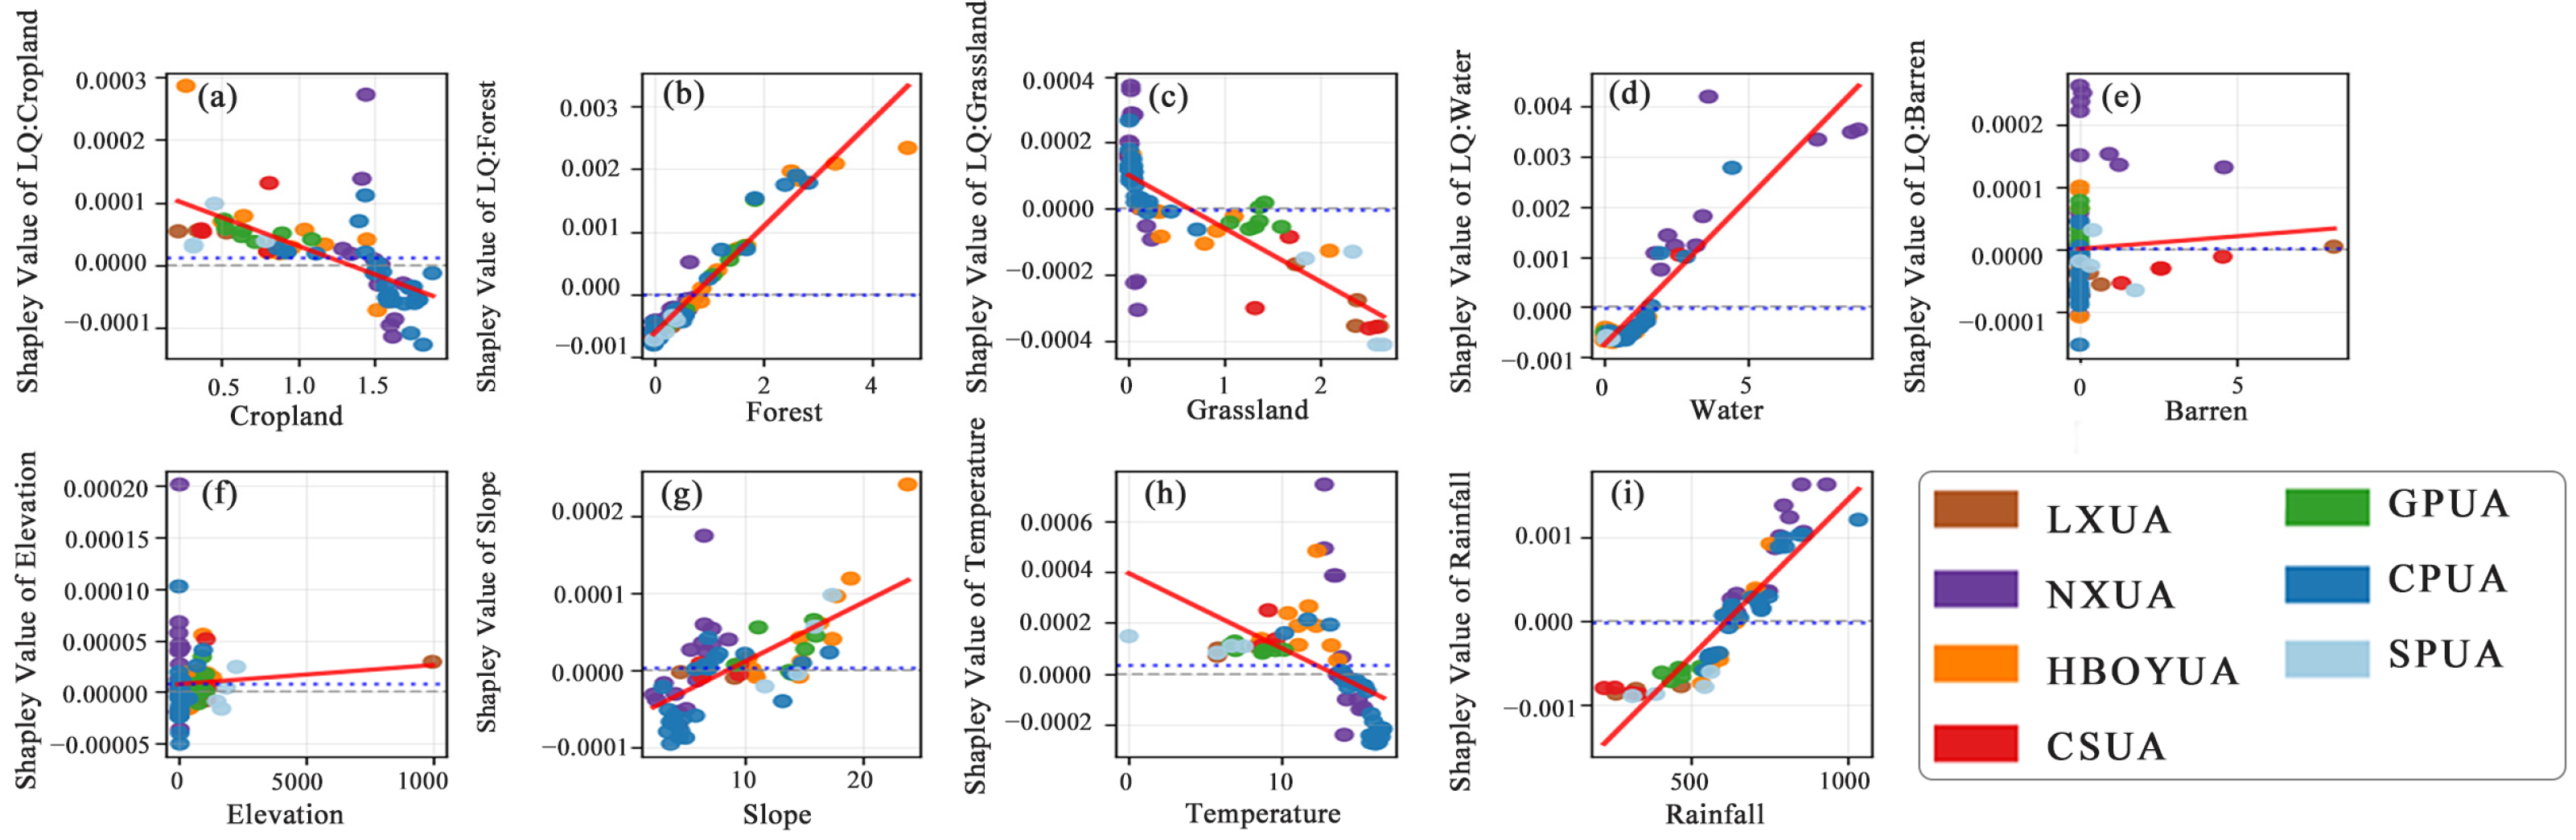
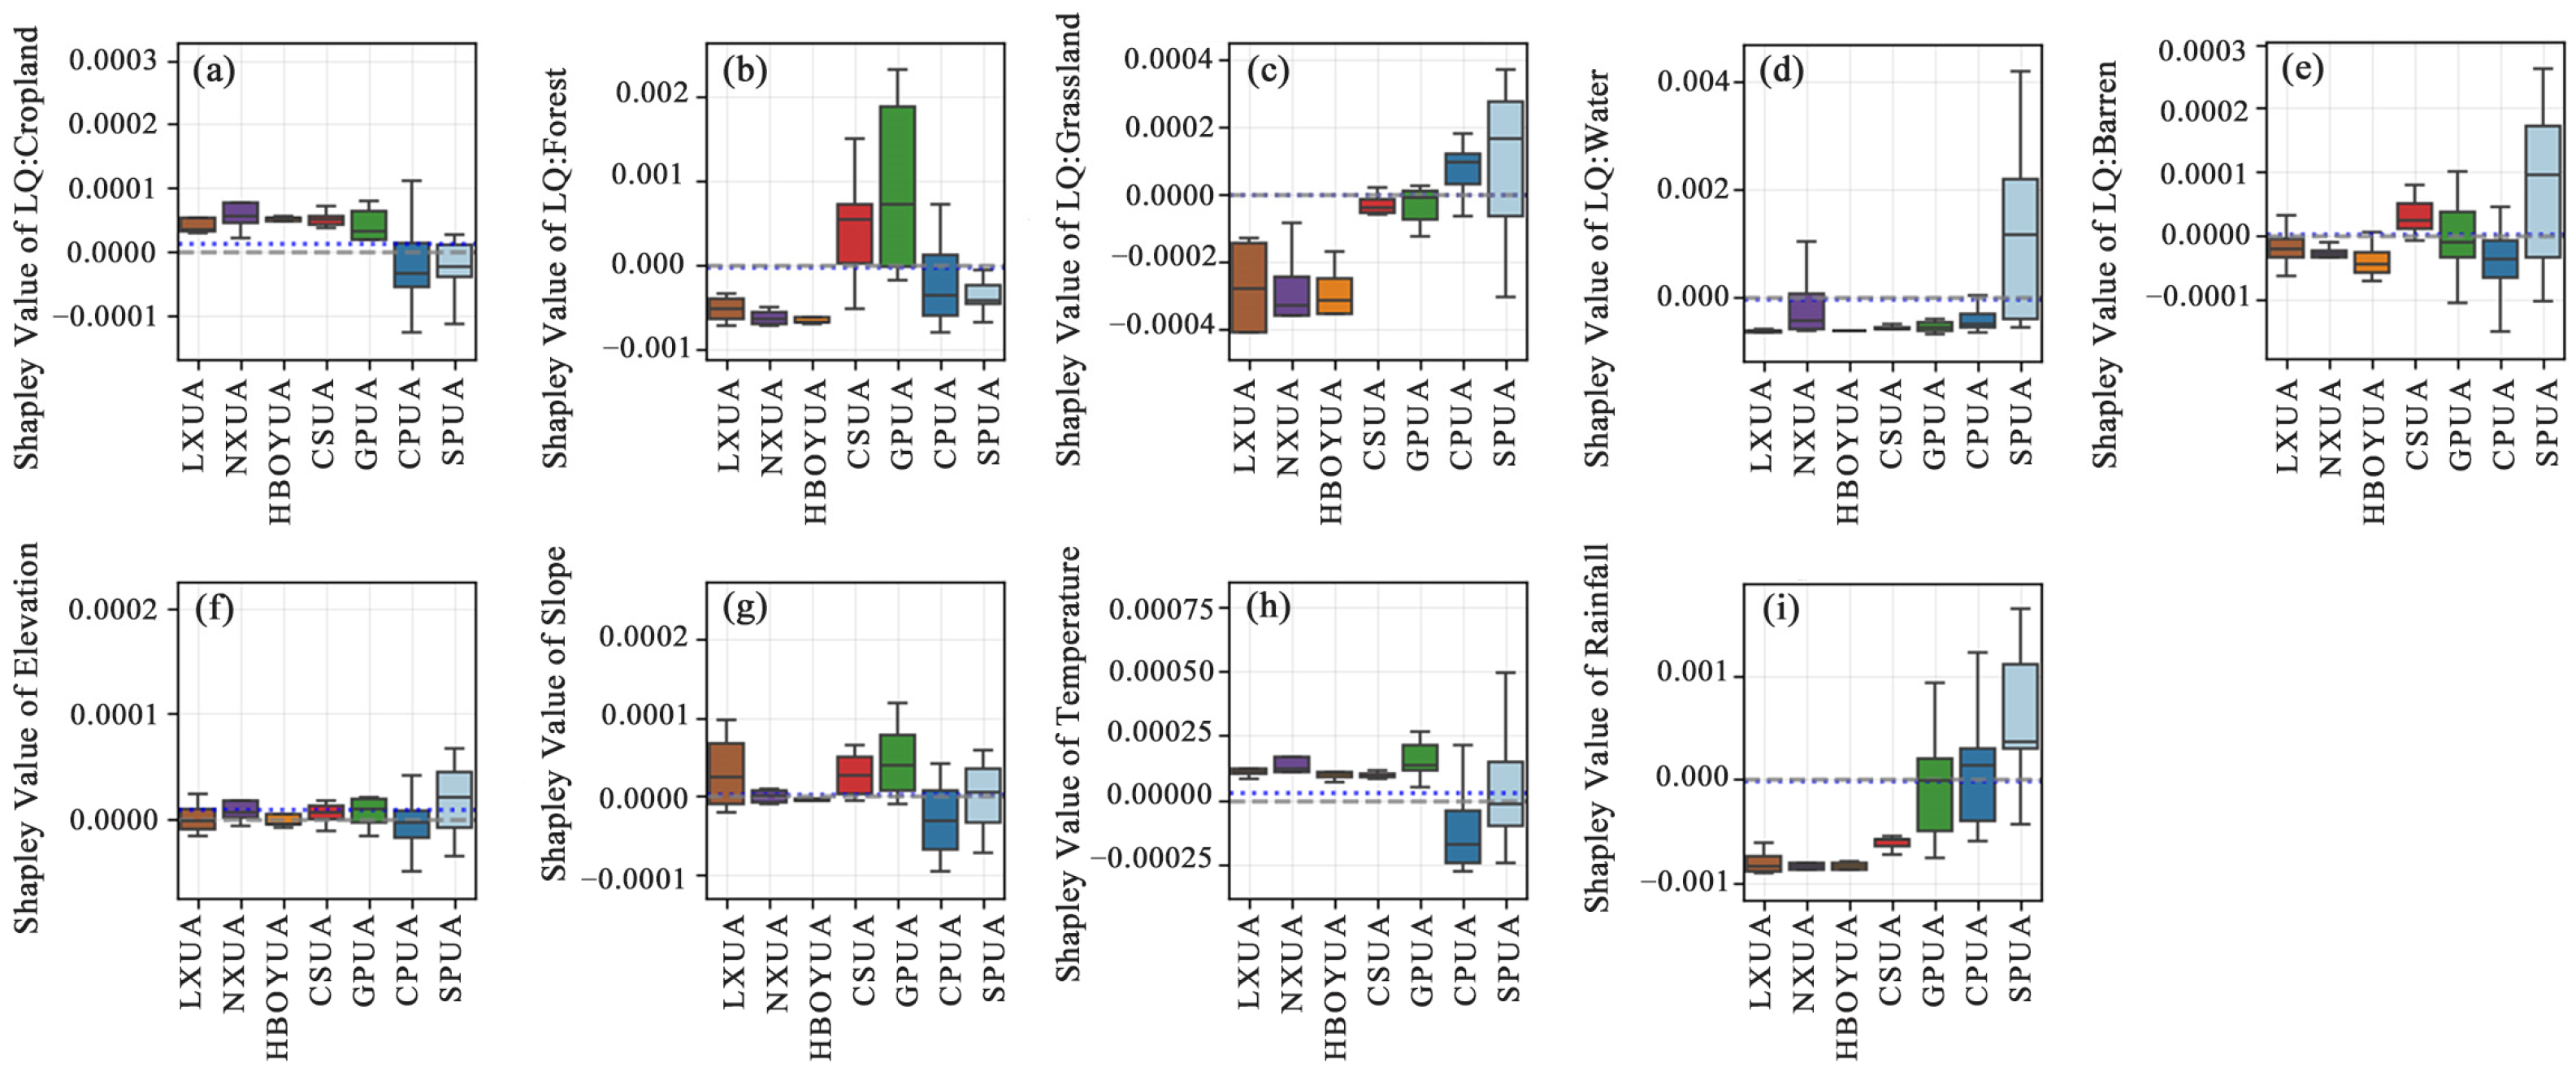
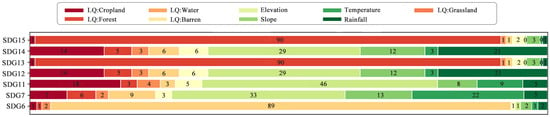
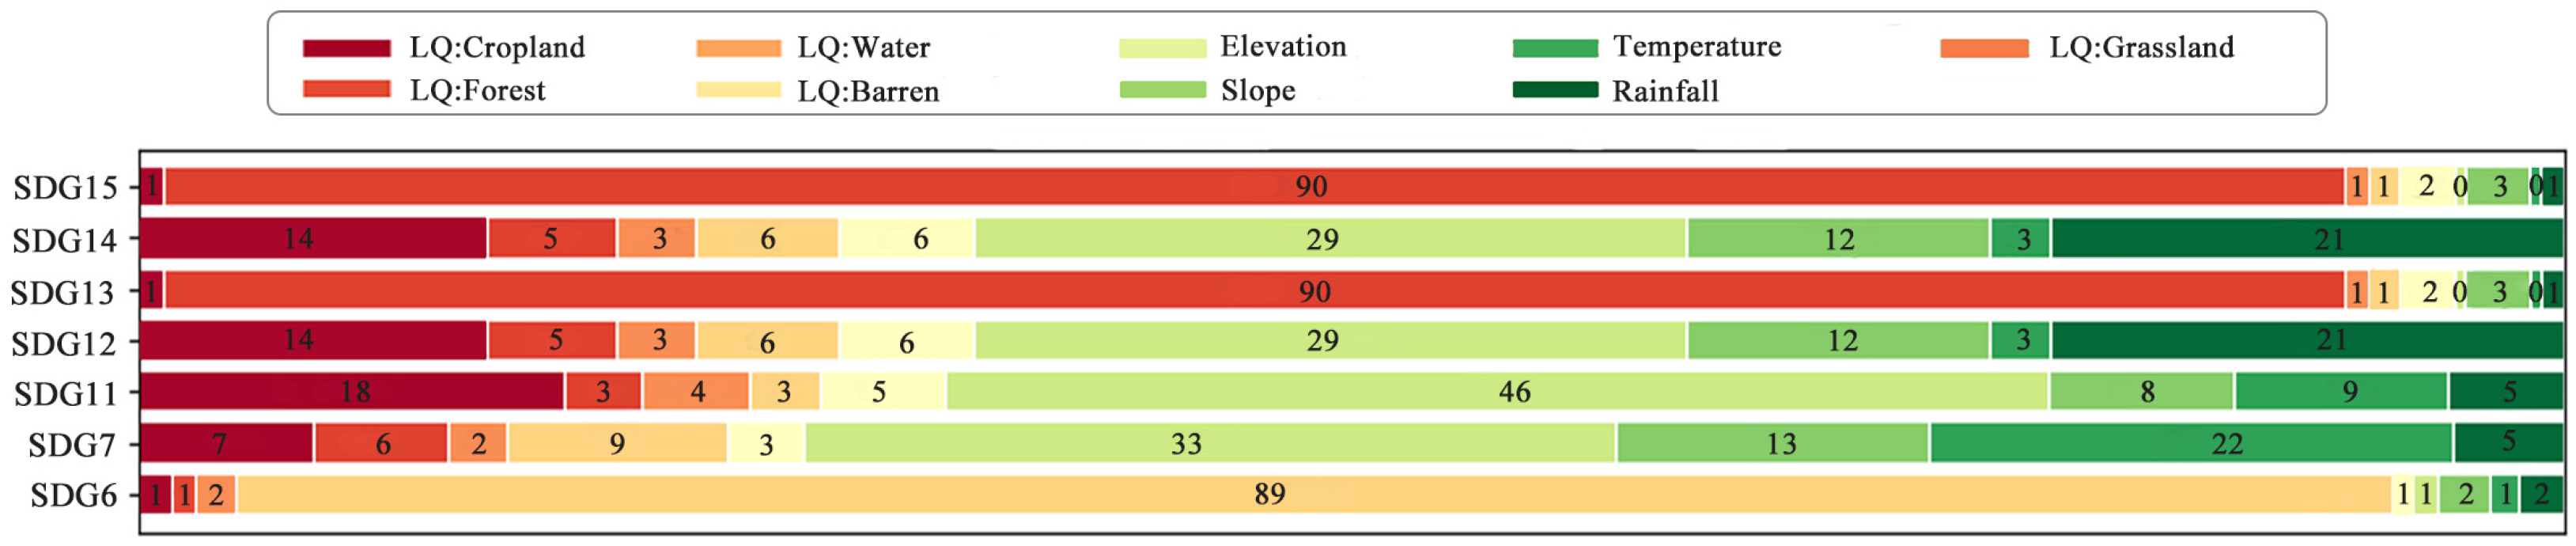
Figure 14, Figure 15 and Figure 16 illustrate the influence of the nine primary factors on the environment and their underlying mechanisms. Figure 14a shows that cropland area is negatively correlated with environmental sustainability, with NXUA having the highest proportion of arable land, while CPUA and SPUA have relatively less arable land Figure 15a. Conversely, increased forest and water body coverage significantly improves environmental sustainability Figure 14b,d, GPUA has higher forest coverage, while SPUA has notably higher water coverage Figure 15b,d. Figure 14c shows that the grassland areas negatively affect environmental sustainability. Regarding climatic conditions, temperatures within the optimal range of 10–15 °C have the most pronounced positive effect on environmental sustainability Figure 14h. Concurrently, Figure 14g,i show that moderate slope and rainfall conditions are closely associated with superior environmental quality. Figure 16 reveals the intrinsic linkages between key environmental factors and the Sustainable Development Goals. Forest coverage is significantly positively correlated with the conservation of terrestrial life (SDG 15) and climate action (SDG 13). Elevation influences multiple goals, including life below water (SDG 14), responsible consumption and production (SDG 12), and sustainable cities and communities (SDG 11). Additionally, the proportion of bare land is significantly positively correlated with access to clean water and sanitation (SDG 6).
Figure 14.
Correlations between Shapley values and environmental factors features: (a) Cropland; (b) Forest; (c) Grassland; (d) Water; (e) Barren; (f) Elevation; (g) Slope; (h) Temperature; (i) Rainfall.
Figure 15.
Shapley values of environmental factors across urban agglomerations: (a) Cropland; (b) Forest; (c) Grassland; (d) Water; (e) Barren land; (f) Elevation; (g) Slope; (h) Temperature; (i) Rainfall.
Figure 16.
Relative weight contributions of the nine key factors in the environmental system.
4. Discussion
4.1. Sustainable Development Levels and Pathways
By establishing an ESE evaluation system, this study systematically assessed sustainable development levels in urban agglomerations within the Yellow River Basin from 2007 to 2022. The results indicate that, driven by rapid urbanization, the level of sustainable development across these urban agglomerations has shown an overall steady upward trend.
From a spatial perspective, sustainable development among urban agglomerations in the Yellow River Basin exhibits a “downstream > middle > upstream” gradient, closely related to each region’s economic development foundations. Downstream urban agglomerations (such as SPUA), benefiting from diversified industrial structures, favorable geographic conditions, and well-developed infrastructure networks, are better able to promote the coordinated development of the economy, society, and the environment [36,37]. In contrast, upstream urban agglomerations (such as NXUA and LXUA), constrained by a single-industry, resource-based economic structure, complex topography, and inadequate infrastructure, lag in sustainable development. Midstream urban agglomerations (such as CSUA), meanwhile, face pressure to transform from traditional heavy industry; the dual challenges of industrial upgrading and ecological conservation constrain rapid improvements in their coordination levels [38]. This spatial pattern provides a macro-level context for understanding differences in sustainable development levels among various urban agglomerations.
Although the SPUA plays a leading role in the Yellow River Basin in terms of openness to the outside world and technological innovation, it has long faced the dilemma of environmental pollution and inadequate pollution control [39,40]. This study further indicates that, while the economic and social subsystems of this urban agglomeration are generally in a leading position, significant score disparities remain among its cities, and notable shortcomings persist in environmental governance and air quality improvement (SDG 13). Regarding the CPUA, previous studies have noted that its level of regional integration is limited and that it faces dual pressures from environmental carrying capacity and economic development [41]. Building on this, the study further finds that the agglomeration’s development factors are overly concentrated in core cities such as Zhengzhou and Luoyang, resulting in low scores for reducing inequality (SDG 10), and that regional coordination mechanisms urgently need strengthening. Relying on abundant energy resources, the HBOYUA has achieved a high level of economic development. However, existing research indicates that carbon emissions and economic growth have not yet been effectively decoupled [42]. This study’s findings are consistent with this, confirming that the region has significant shortcomings in climate action (SDG 13) and responsible consumption and production (SDG 12). The GPUA suffers from prominent environmental pollution issues due to its long-term reliance on a resource-intensive development model. This study found that the agglomeration scored low on responsible consumption and production (SDG 12); in the future, it should systematically improve implementation effectiveness through initiatives such as the “returning farmland to forest” program and ecological restoration projects.
Highly sustainable cities (such as Weihai, Qingdao, and Xi’an) demonstrate relatively strong performance in their economic and social systems. However, they fall short on environmental goals, including food self-sufficiency (SDG 2), the conservation and sustainable use of water and soil resources (SDGs 6 and 15), and climate action (SDG 13). This reflects that, among urban agglomerations in the Yellow River Basin, cities with relatively strong economic sustainability face significant pressure on their environmental systems; they must remain vigilant and avoid economic growth models that come at the expense of environmental quality. Cities with moderate sustainability (such as Heze) should prioritize goals such as good health and well-being (SDG 3), decent work and economic growth (SDG 8), and reduced inequalities (SDG 10). They should enhance the resilience of their social systems by improving public service levels, optimizing the employment structure, and narrowing development gaps. Cities with low sustainability (such as Zhongwei and Dingxi), while possessing a certain foundation in zero hunger (SDG 2) and climate action (SDG 13), need to prioritize social welfare goals such as poverty eradication (SDG 1), creating quality employment (SDG 8), and improving quality education (SDG 4) to achieve systemic sustainable development.
4.2. Spatial Differentiation Characteristics of the Sustainable Development Levels
This paper employs the RFA-SHAP model to analyze the factors influencing the sustainable development of urban agglomerations in the Yellow River Basin.
In the economic subsystem, cities with higher levels of economic sustainability typically exhibit higher population density and urbanization rates, which are the primary drivers of urban economic growth [43]. Furthermore, while cities with a high degree of industrial agglomeration exhibit stronger economic performance, their carbon emissions are correspondingly higher. Therefore, one key to achieving sustainable urban development is decoupling economic growth from carbon emissions. During the study period, urban agglomerations in the Yellow River Basin showed steady improvement in coordination within the ESE system, indicating that alongside rapid economic growth, cities are placing increasing emphasis on ecological and environmental protection.
In the social subsystem, increasing fiscal expenditure per unit and the level of urbanization help promote social sustainability. Furthermore, cities with adequate residential land and land designated for public facilities and services tend to exhibit higher levels of social sustainability [44]. However, infrastructure in many cities currently struggles to meet demands driven by population growth. Therefore, to advance high-quality social sustainability, governments should focus on improving urban infrastructure systems and enhancing the effective provision of public services.
Within the environmental subsystem, increased forest cover and water area generally have a positive impact on environmental sustainability, whereas expanding arable land often shows a negative correlation. Furthermore, topographic conditions, as a crucial natural foundation, profoundly influence the spatial pattern of environmental carrying capacity. Flat terrain is more suitable for concentrated development and orderly urban expansion; however, in recent years, urban construction activities have gradually spread to steep slopes, where such development is prone to causing ecosystem degradation and exacerbating environmental pressures [45]. Against this backdrop, cities with low levels of environmental sustainability urgently need to promote ecological restoration policies actively, focusing on strengthening the key functions of forest systems in maintaining terrestrial biodiversity (SDG 15) and addressing climate change (SDG 13) [46], while also enhancing pollution prevention and control in permanent water bodies and wetlands to ensure water quality safety and ecological balance (SDG 6) [47]. At the same time, existing research indicates a significant positive correlation between access to natural environments in cities and residents’ health and well-being [48]. Therefore, governments should strictly enforce ecological red line controls to ensure that the systemic integrity and ecosystem service functions of key ecological areas remain intact during urbanization.
4.3. Sustainable Strategies for Urban Agglomeration
Based on the above findings, this paper offers the following recommendations for the sustainable development of urban agglomerations at different stages of development in the Yellow River Basin:
The SPUA ranks first in terms of sustainable development among the seven urban agglomerations in the Yellow River Basin, with both its economic and social subsystems leading the way. However, significant disparities remain among cities within the agglomeration, and challenges persist in environmental governance and air quality improvement (SDG 13). According to the SHAP analysis, industrial land ratio, urban sprawl characteristics, and population density are among the important factors influencing sustainability performance in the SPUA. Although these factors contribute positively to economic development, excessive industrial expansion and intensive urban development may increase environmental pressures. Therefore, the SPUA should fully leverage its coastal location and manufacturing advantages to promote the green transformation of traditional industries, improve energy efficiency, and reduce pollution emissions associated with intensive industrial activities. Meanwhile, innovation resources should be directed toward green technologies, the digital economy, and high-end service industries [49], thereby promoting coordinated improvements in economic, social, and environmental sustainability.
The CPUA ranks second only to the SPUA in terms of socioeconomic sustainability. While its secondary sector is relatively well developed, regional integration remains limited, and a marked development gap persists between core and edge cities; in particular, it scores low on reducing inequality (SDG 10). The SHAP analysis indicates that population density, urbanization level, and fiscal expenditure per unit area are key factors affecting the CPUA’s sustainability performance. However, the uneven distribution of development resources limits the positive effects of these factors in peripheral cities. Therefore, the region should leverage its advantage as a large-population province to promote the coordinated development of modern agriculture, advanced manufacturing, and modern services. At the same time, it should strengthen the radiating and driving role of core cities such as Zhengzhou. Through the extension of industrial chains, technology spillovers, and capital flows, the region should accelerate resource transfer to surrounding cities and promote coordinated regional development.
The CSUA still faces significant disparities in urban-rural income and consumption levels, with hotspots of disparity in the sustainable development of its economic subsystems concentrated in specific areas. According to the SHAP results, industrial land intensity plays an important role in determining sustainability performance in the CSUA. Therefore, future development should focus on improving land-use efficiency and promoting innovation-driven industrial upgrading rather than relying on extensive resource consumption and spatial expansion. The agglomeration scored relatively low in industrial innovation and infrastructure development (SDG 9) and in air quality improvement (SDG 13). For this urban agglomeration, breaking away from the traditional resource-dependent economic growth model and shifting industries toward innovation-driven, green development is key to achieving sustainable development.
Leveraging its abundant energy resources and strong economic foundation, the HBOYUA recorded the most significant increase in sustainable development scores among the seven urban agglomerations between 2007 and 2022. While its economic and social systems performed well, its environmental system faces notable bottlenecks, particularly in sustainable cities and communities (SDG 11) and responsible consumption and production (SDG 12). SHAP analysis results indicate that arable land area is a key factor influencing environmental sustainability in this region. To address these issues, future development should fully leverage the region’s abundant energy resources to promote clean, efficient energy sector development and accelerate the transition from a resource-dependent model to one supported by multiple pillars. Furthermore, the government should strengthen environmental oversight while promoting the synergistic coexistence of economic and ecological systems through incentive measures such as subsidies for ecological governance and for green research and development.
The GPUA ranks in the middle range across various economic indicators, but scores low on reducing inequality (SDG 10) within the social system. According to the SHAP analysis, residential land proportion and population density show inhibitory effects on social sustainability, whereas fiscal expenditure per unit area contributes positively. Therefore, the GPUA should optimize urban spatial structures and improve the accessibility and efficiency of public services. Therefore, social policies need to dynamically adjust the social security system and the allocation of public services in light of actual development conditions to narrow the development gap between rural and urban areas.
Among the seven urban agglomerations, the NXUA ranks last in sustainable development, with low overall scores across indicators and pronounced shortcomings in social and economic development. The SHAP analysis indicates that urbanization level and fiscal expenditure per unit area are important mechanisms influencing social sustainability. Therefore, improving investment efficiency in education, healthcare, and other public services should be prioritized to enhance residents’ well-being and reduce regional development disparities. In particular, there are significant deficiencies in quality education (SDG 4) and good health and well-being (SDG 3). The government should prioritize increasing investment in public services such as education and healthcare to improve residents’ quality of life and social welfare effectively.
The LXUA ranks slightly higher than the NXUA in sustainable development, but its rankings on various economic indicators are relatively low. The SHAP results demonstrate that ecological factors, particularly forest coverage and water bodies, contribute positively to environmental sustainability. Therefore, the LXUA should integrate ecological conservation with green industries and ecological tourism, transforming ecological advantages into sustainable economic benefits. In particular, its performance in poverty eradication (SDG 1) is subpar. Within the environmental system, it also scores low on indicators such as sustainable cities and communities (SDG 11) and clean water and sanitation (SDG 6). In the future, the cluster should leverage its abundant natural ecological resources to transform ecological advantages into industrial strengths and, ultimately, economic advantages [50].
4.4. Research Limitations and Outlook
The urban agglomerations in the Yellow River Basin serve as the core vehicles and key regions for promoting harmonious coexistence between humans and nature in the basin and achieving high-quality development; they also constitute an important strategic pillar for the “Belt and Road” initiative. Looking ahead, these urban agglomerations should actively address various challenges in the process of sustainable development, build upon their own resource endowments and comparative advantages, and explore differentiated and distinctive development paths tailored to local conditions.
In future research, we will further explore the following areas: First, the evaluation framework should be further refined to incorporate more SDGs indicators particularly those concerning social equity and institutional quality to provide a more comprehensive assessment of urban sustainability. Second, the spatial scale of sustainability research in the Yellow River Basin should be refined to focus on the specific development challenges faced by each urban agglomeration, enabling more targeted diagnostics and analyses and providing more precise scientific evidence for formulating tailored policies.
This study developed a framework for assessing urban sustainable development, conducted a systematic analysis of the coupling and coordination relationships within the ESE system of urban agglomerations in the Yellow River Basin, and identified key factors influencing sustainability across each subsystem. These findings can provide a scientific basis for policymakers to advance high-quality regional development and implement the Sustainable Development Goals. However, this study still has the following limitations: (1) The assessment framework developed by this study relies heavily on China’s statistical standards and data availability; as a result, it has certain limitations in comprehensively and accurately identifying and quantifying some indicators related to the SDGs. For example, SDG 5 (Gender equality) and SDG 16 (Peace, justice and strong institutions) were not included in this assessment system because relevant data were difficult to obtain. Future research should focus on developing a more systematic and comprehensive system of sustainable development indicators, gradually expanding data sources, and enhancing the completeness of indicator coverage and the representativeness of assessment results. (2) Since this study used monetary indicators and covered the period from 2007 to 2022, it was inevitably influenced by inflation. Future research may consider incorporating inflation adjustments to improve the accuracy of long-term sustainability assessments further. (3) In this study, the determination of whether indicators are positive or negative was based on a uniform assignment of values according to the overall stage of development of the Yellow River Basin. It did not fully account for regional differences among cities in terms of industrial structure, resource endowments, and levels of development. Future research could conduct more detailed, differentiated analyses at the city or subregional level to enhance the relevance and accuracy of the assessment results. (4) Although this study identified several key drivers affecting the level of sustainable development, because of limited data availability, it did not include information on urban functional zones such as transportation and commercial land use, nor did it cover spatial flow data such as traffic volume and accessibility to schools and hospitals. Future research will integrate additional multidimensional data on urban functional and spatial flows to improve the assessment’s precision and explanatory power. (5) Although the RFA-SHAP framework effectively identifies important influencing factors and their relative contributions to sustainability performance, it primarily reveals statistical associations and predictive relationships rather than causal mechanisms. Therefore, the identified factors should be interpreted as important correlates rather than direct causal determinants. Future research could combine causal inference approaches to investigate further the causal relationships between development factors and urban sustainability outcomes.
5. Conclusions
Based on the SDGs, this study constructed a framework to assess urban sustainable development. It analyzed the level of coordinated development of the ESE system in urban agglomerations within the Yellow River Basin from 2007 to 2022. The study found that the level of sustainable development and the coordination of the ESE system in these urban agglomerations have shown an overall upward trend. However, significant differences remain in development levels, rates of change, and spatial patterns. The main findings can be summarized in the following three aspects:
First, in terms of sustainability levels, economic sustainability was particularly prominent in the SPUA and HBOYUA; social sustainability showed a clear advantage in the SPUA; and the Guanzhong Plain urban agglomeration best demonstrated environmental sustainability. Second, in terms of the level of coupled and coordinated development, most cities were in the “moderate disorder” stage during the study period, with significant regional variations. Third, in terms of key influencing factors, the urban sprawl index and the level of economic development are the primary factors influencing economic sustainability; fiscal expenditure per unit area and the level of urbanization jointly promote the enhancement of social sustainability, while the increase in urban green space coverage and the implementation of ecological restoration policies play a significantly positive role in improving urban environmental sustainability.
This study provides a scientific basis and decision reference for the sustainable development of urban agglomerations in the Yellow River Basin, offering theoretical support for promoting high-quality regional development and fostering the coordinated evolution of the ESE system.
Author Contributions
H.L.: conceptualization, methodology, software, validation, formal analysis, data curation, writing—original draft, writing—review and editing. X.L.: formal analysis, data curation. Q.H.: formal analysis, data curation. Y.W.: supervision, writing—review and editing. All authors have read and agreed to the published version of the manuscript.
Funding
This work was supported by the National Natural Science Foundation of China (No.: 32260279), the Special Project of Central Government for Local Science and Technology Development of Inner Mongolia (No.: 2022ZY0137), and the Natural Science Foundation of Inner Mongolia Autonomous Region (No.: 2025MS03066).
Institutional Review Board Statement
Not applicable.
Informed Consent Statement
Not applicable.
Data Availability Statement
The data and code supporting the findings of this study are openly available in the figshare repository at https://doi.org/10.6084/m9.figshare.31072813.
Acknowledgments
The authors gratefully acknowledge the support of the funding.
Conflicts of Interest
The authors declare no conflicts of interest.
Abbreviations
The following abbreviations are used in this manuscript:
| SDGs | Sustainable Development Goals |
| ESE | Economy-Society-Environment |
| CCDM | Coupling Coordination Degree Model |
| RFA | Random Forest Algorithm |
| SHAP | SHapley Additive exPlanations |
| LXUA | Lanzhou-Xining Urban Agglomeration |
| NXUA | Ningxia Yellow River Urban Agglomeration |
| GPUA | Guanzhong Plain Urban Agglomeration |
| HBOYUA | Hohhot-Baotou-Ordos-Yulin Urban Agglomeration |
| CSUA | Central Shanxi Urban Agglomeration |
| CPUA | Central Plains Urban Agglomeration |
| SPUA | Shandong Peninsula Urban Agglomeration |
Appendix A
Table A1.
List of cities included in this study.
Table A2.
Sensitivity analysis of sustainability scores under aggregated and annual entropy weighting schemes.
Table A3.
Sensitivity analysis of CCDM results under alternative subsystem weighting scenarios.
Table A4.
Robustness assessment of Getis-Ord Gi* hotspot and coldspot classifications under alternative spatial weight specifications.
Table A5.
Variance inflation factor diagnostics for all influencing factors.
Table A6.
Optimal hyperparameters of the Random Forest model.
Table A7.
Predictive performance metrics of the Random Forest model.
Figure A1.
Scatter plot of observed versus predicted values for the Random Forest model.
References
- Yang, Y.; Lu, X.; Chen, J.; Li, N. Factor Mobility, Transportation Network and Green Economic Growth of the Urban Agglomeration. Sci. Rep. 2022, 12, 20094. [Google Scholar] [CrossRef] [Scilit] [PubMed]
- Department of Economic and Social Affairs. Transforming Our World: The 2030 Agenda for Sustainable Development. Available online: https://sdgs.un.org/2030agenda (accessed on 28 June 2026).
- Diaz-Sarachaga, J.M.; Jato-Espino, D.; Castro-Fresno, D. Is the Sustainable Development Goals (SDG) Index an Adequate Framework to Measure the Progress of the 2030 Agenda? Sustain. Dev. 2018, 26, 663–671. [Google Scholar] [CrossRef] [Scilit]
- Li, Y.; Zhang, X.; Gao, X. An Evaluation of the Coupling Coordination Degree of an Urban Economy–Society–Environment System Based on a Multi-Scenario Analysis: The Case of Chengde City in China. Sustainability 2022, 14, 6790. [Google Scholar] [CrossRef] [Scilit]
- Li, Y.; Li, Y.; Zhou, Y.; Shi, Y.; Zhu, X. Investigation of a Coupling Model of Coordination between Urbanization and the Environment. J. Environ. Manag. 2012, 98, 127–133. [Google Scholar] [CrossRef] [Scilit] [PubMed]
- Sun, Y.; Cui, Y. Analyzing the Coupling Coordination among Economic, Social, and Environmental Benefits of Urban Infrastructure: Case Study of Four Chinese Autonomous Municipalities. Math. Probl. Eng. 2018, 2018, 8280328. [Google Scholar] [CrossRef] [Scilit]
- Fan, X. Research on the Coupling of Ecological Environment and Socio-Economic Development in Resource-Based Cities: Based on Scenario Simulation Method. Sustain. Cities Soc. 2024, 114, 105810. [Google Scholar] [CrossRef] [Scilit]
- Yang, Y.; Yuan, X.; An, J.; Su, Q.; Chen, B. Drivers of Ecosystem Services and Their Trade-Offs and Synergies in Different Land Use Policy Zones of Shaanxi Province, China. J. Clean. Prod. 2024, 452, 142077. [Google Scholar] [CrossRef] [Scilit]
- Li, W.; Wang, Y.; Xie, S.; Cheng, X. Coupling Coordination Analysis and Spatiotemporal Heterogeneity between Urbanization and Ecosystem Health in Chongqing Municipality, China. Sci. Total Environ. 2021, 791, 148311. [Google Scholar] [CrossRef] [Scilit] [PubMed]
- Zhai, X.; An, Y.; Shi, X.; Liu, X. Measurement of Green Transition and Its Driving Factors: Evidence from China. J. Clean. Prod. 2022, 335, 130292. [Google Scholar] [CrossRef] [Scilit]
- Wu, J.; Li, J.; Peng, J.; Li, W.; Xu, G.; Dong, C. Applying Land Use Regression Model to Estimate Spatial Variation of PM2.5 in Beijing, China. Environ. Sci. Pollut. Res. 2015, 22, 7045–7061. [Google Scholar] [CrossRef] [Scilit] [PubMed]
- Nguyen, V.C.; Ng, C.T. Variable Selection under Multicollinearity Using Modified Log Penalty. J. Appl. Stat. 2020, 47, 201–230. [Google Scholar] [CrossRef] [Scilit] [PubMed]
- Chen, J.; Zhang, W.; Song, L.; Wang, Y. The Coupling Effect between Economic Development and the Urban Ecological Environment in Shanghai Port. Sci. Total Environ. 2022, 841, 156734. [Google Scholar] [CrossRef] [Scilit] [PubMed]
- Xu, M.; Hu, W.-Q. A Research on Coordination between Economy, Society and Environment in China: A Case Study of Jiangsu. J. Clean. Prod. 2020, 258, 120641. [Google Scholar] [CrossRef] [Scilit]
- Wang, M.; Zhou, T.; Li, Y.; Jia, N.; Chen, R. Linking Production-Living-Ecological Space Transformations with Sustainable Development Goals Progress in China’s Urban Agglomerations. Environ. Impact Assess. Rev. 2026, 119, 108394. [Google Scholar] [CrossRef] [Scilit]
- Muyi, H.; Qin, G.; Yuru, T.; Xue, W.; Yixuan, D. Coupling Characteristics between Ecological Security and High-Quality Economic Development in the Yangtze River Delta, China. J. Resour. Ecol. 2025, 16, 603–617. [Google Scholar] [CrossRef] [Scilit]
- Yang, H.; Shao, H.; Zhang, C.; Zhang, C.; Su, W.; Zhao, Q. Optimization Framework for Coupled and Coordinated Development of Ecological Environment and Urbanization in Dual-Core Urban Agglomerations: A Case Study Area of Chengdu-Chongqing. Ecol. Indic. 2025, 176, 113624. [Google Scholar] [CrossRef] [Scilit]
- Kuc-Czarnecka, M.; Markowicz, I.; Sompolska-Rzechuła, A. SDGs Implementation, Their Synergies, and Trade-Offs in EU Countries—Sensitivity Analysis-Based Approach. Ecol. Indic. 2023, 146, 109888. [Google Scholar] [CrossRef] [Scilit]
- Xin, Y.; Liu, X. Coupling Driving Factors of Eco-Environmental Protection and High-Quality Development in the Yellow River Basin. Front. Environ. Sci. 2022, 10, 951218. [Google Scholar] [CrossRef] [Scilit]
- Xiang, X.; Xiao, Y.; Chen, Y.; Huang, H. Assessment of Coupling Coordinated Degree and Driving Mechanism of Population-Resource-Environment-Economy (PREE) System in Yellow River Basin, China. Sci. Rep. 2024, 14, 31135. [Google Scholar] [CrossRef] [Scilit] [PubMed]
- Wang, L.; Yao, W.; Xiao, P.; Hou, X. The Spatiotemporal Characteristics of Flow–Sediment Relationships in a Hilly Watershed of the Chinese Loess Plateau. Int. J. Environ. Res. Public Health 2022, 19, 9089. [Google Scholar] [CrossRef] [Scilit] [PubMed]
- Lu, H.; Lu, X.; Jiao, L.; Zhang, Y. Evaluating Urban Agglomeration Resilience to Disaster in the Yangtze Delta City Group in China. Sustain. Cities Soc. 2022, 76, 103464. [Google Scholar] [CrossRef] [Scilit]
- Shannon, C.E. A Mathematical Theory of Communication. Bell Syst. Tech. J. 1948, 27, 379–423. [Google Scholar] [CrossRef] [Scilit]
- Sun, Y.; Cui, Y. Analyzing Urban Infrastructure Economic Benefit Using an Integrated Approach. Cities 2018, 79, 124–133. [Google Scholar] [CrossRef] [Scilit]
- Chen, Y. New Framework of Getis-Ord’s Indexes Associating Spatial Autocorrelation with Interaction. PLoS ONE 2020, 15, e0236765. [Google Scholar] [CrossRef] [Scilit] [PubMed]
- Lundberg, S.M.; Lee, S.-I. A Unified Approach to Interpreting Model Predictions. In Proceedings of the Advances in Neural Information Processing Systems; Curran Associates, Inc.: Red Hook, NY, USA, 2017; Volume 30. [Google Scholar]
- Frenkel, A.; Ashkenazi, M. Measuring Urban Sprawl: How Can We Deal with It? Environ. Plan. B Plan. Des. 2008, 35, 56–79. [Google Scholar] [CrossRef] [Scilit]
- Ye, C.; Zhu, J.; Li, S.; Yang, S.; Chen, M. Assessment and Analysis of Regional Economic Collaborative Development within an Urban Agglomeration: Yangtze River Delta as a Case Study. Habitat Int. 2019, 83, 20–29. [Google Scholar] [CrossRef] [Scilit]
- DMSP Operational Linescan System (OLS). Available online: https://www.ncei.noaa.gov/products/dmsp-operational-linescan-system (accessed on 30 June 2026).
- Li, Q.; Ding, C.; Song, G. Urban sprawl and productivity: Promotion or suppresion? Analysis based on night light data. J. Manag. Sci. China 2021, 24, 45–62. [Google Scholar]
- Geospatial Data Cloud. Available online: https://www.gscloud.cn/#page1/1 (accessed on 30 June 2026).
- National Tibetan Plateau Data Center. Available online: https://data.tpdc.ac.cn/home (accessed on 30 June 2026).
- ORNL LandScan Viewer—Oak Ridge National Laboratory. Available online: https://landscan.ornl.gov/ (accessed on 30 June 2026).
- National Bureau of Statistics. Available online: https://www.stats.gov.cn/sj/ (accessed on 30 June 2026).
- Yang, J.; Huang, X. The 30 m Annual Land Cover Dataset and Its Dynamics in China from 1990 to 2019. Earth Syst. Sci. Data 2021, 13, 3907–3925. [Google Scholar] [CrossRef] [Scilit]
- Wang, J.; Liu, H.; Peng, D.; Lv, Q.; Sun, Y.; Huang, H.; Liu, H. The County-Scale Economic Spatial Pattern and Influencing Factors of Seven Urban Agglomerations in the Yellow River Basin—A Study Based on the Integrated Nighttime Light Data. Sustainability 2021, 13, 4220. [Google Scholar] [CrossRef] [Scilit]
- Liu, S.; Yang, S.; Liu, N. Estimation of Urban High-Quality Development Level Using a Three-Stage Stacks-Based Measure Model: A Case Study of Urban Agglomerations in the Yellow River Basin. Sustainability 2024, 16, 8130. [Google Scholar] [CrossRef] [Scilit]
- Jin, Z.; Teng, C.; Jiao, X.; Miao, Y.; Wang, C. The Integrated Development and Regional Disparities of Urban Agglomerations in the Yellow River Basin, China. Sustainability 2024, 16, 10353. [Google Scholar] [CrossRef] [Scilit]
- Wang, P.; Tseng, C.-P.; Fan, Y.; Wei, Q.; Qiao, M.; Li, X.; An, R. Assessing Eco-Environmental Quality and Its Drivers in the Shandong Section of the Yellow River Basin with an Improved Remote Sensing Ecological Index. Sci. Rep. 2025, 15, 44615. [Google Scholar] [CrossRef] [Scilit] [PubMed]
- Tian, C. Decoupling Characteristics between Coupling Coordination Degree of Production-Living-Ecological Function and Carbon Emissions in the Urban Agglomeration of the Shandong Peninsula. Land 2024, 13, 996. [Google Scholar] [CrossRef] [Scilit]
- Wu, H.; Jiang, Z.; Zhu, L.; Lin, A.; Zhou, H.; Cen, L. Analyzing Multiscale Associations and Couplings between Integrated Development and Eco-Environmental Systems: A Case Study of the Central Plains Urban Agglomeration, China. Appl. Geogr. 2024, 171, 103387. [Google Scholar] [CrossRef] [Scilit]
- Zhang, J.; Lei, L.; Mu, Y.; Liu, M.; Lu, D. Unraveling the Decoupling Mechanisms and Nonlinear Drivers of Carbon Emissions in Chinese Cities. Ecol. Indic. 2025, 179, 114157. [Google Scholar] [CrossRef] [Scilit]
- Liu, Z.; Qi, W.; Liu, S. The Differences of Urban-Rural Population Change and the Underlying Mechanism in the Populaaation Shrinking Counties in China. Geogr. Sci. 2021, 41, 1116–1128. [Google Scholar] [CrossRef]
- Jing, C.; Zhou, W.; Qian, Y. Spatial Disparities of Social and Ecological Infrastructures and Their Coupled Relationships in Cities. Sustain. Cities Soc. 2022, 86, 104117. [Google Scholar] [CrossRef] [Scilit]
- Zhou, L.; Dang, X.; Mu, H.; Wang, B.; Wang, S. Cities Are Going Uphill: Slope Gradient Analysis of Urban Expansion and Its Driving Factors in China. Sci. Total Environ. 2021, 775, 145836. [Google Scholar] [CrossRef] [Scilit] [PubMed]
- Ma, Y.; Huang, L.; Li, J.; Cao, W.; Cai, Y. Carbon Potential of China’s Grain to Green Program and Its Contribution to the Carbon Target. Resour. Conserv. Recycl. 2024, 200, 107272. [Google Scholar] [CrossRef] [Scilit]
- Cao, S.; Li, X.; Jiang, J.; Lu, L.; Du, M.; Song, W. Investigating the influence of wetland area change on environmental sustainable development goals: Evidence from 31 provinces of China. Environ. Sustain. Indic. 2025, 27, 100776. [Google Scholar] [CrossRef] [Scilit]
- Zhou, X.; Sho, K.; Qiu, H.; Chang, S.; Cen, Q. Association between Exposure to Urban Neighborhood Natural Environments and Human Health: A Systematic Review of Multiple Exposure Indicators. Environ. Sustain. Indic. 2025, 25, 100548. [Google Scholar] [CrossRef] [Scilit]
- Jiang, S.; Yu, H.; Li, Z.; Geng, B.; Li, T. Study on the Evolution of the Spatial-Temporal Pattern and the Influencing Mechanism of the Green Development Level of the Shandong Peninsula Urban Agglomeration. Sustainability 2022, 14, 9549. [Google Scholar] [CrossRef] [Scilit]
- Wang, Z.; Shi, P.; Shi, J.; Zhang, X.; Yao, L. Research on Land Use Pattern and Ecological Risk of Lanzhou–Xining Urban Agglomeration from the Perspective of Terrain Gradient. Land 2023, 12, 996. [Google Scholar] [CrossRef] [Scilit]





Disclaimer/Publisher’s Note: The statements, opinions and data contained in all publications are solely those of the individual author(s) and contributor(s) and not of MDPI and/or the editor(s). MDPI and/or the editor(s) disclaim responsibility for any injury to people or property resulting from any ideas, methods, instructions or products referred to in the content. |
© 2026 by the authors. Licensee MDPI, Basel, Switzerland. This article is an open access article distributed under the terms and conditions of the Creative Commons Attribution (CC BY) license.