Author Contributions
Conceptualization, T.A.S. and A.A.; software, A.A.; formal analysis, A.A.; validation, M.T.N. and D.H.; investigation, M.T.N. and D.H.; resources, S.K. and A.F.; data curation, S.K. and A.F.; writing—original draft preparation, A.A.; writing—review and editing, T.A.S., A.A., M.T.N., D.H., S.K. and A.F.; visualization, A.A.; supervision, S.K. and A.F.; project administration, S.K. and A.F. All authors have read and agreed to the published version of the manuscript.
Figure 1.
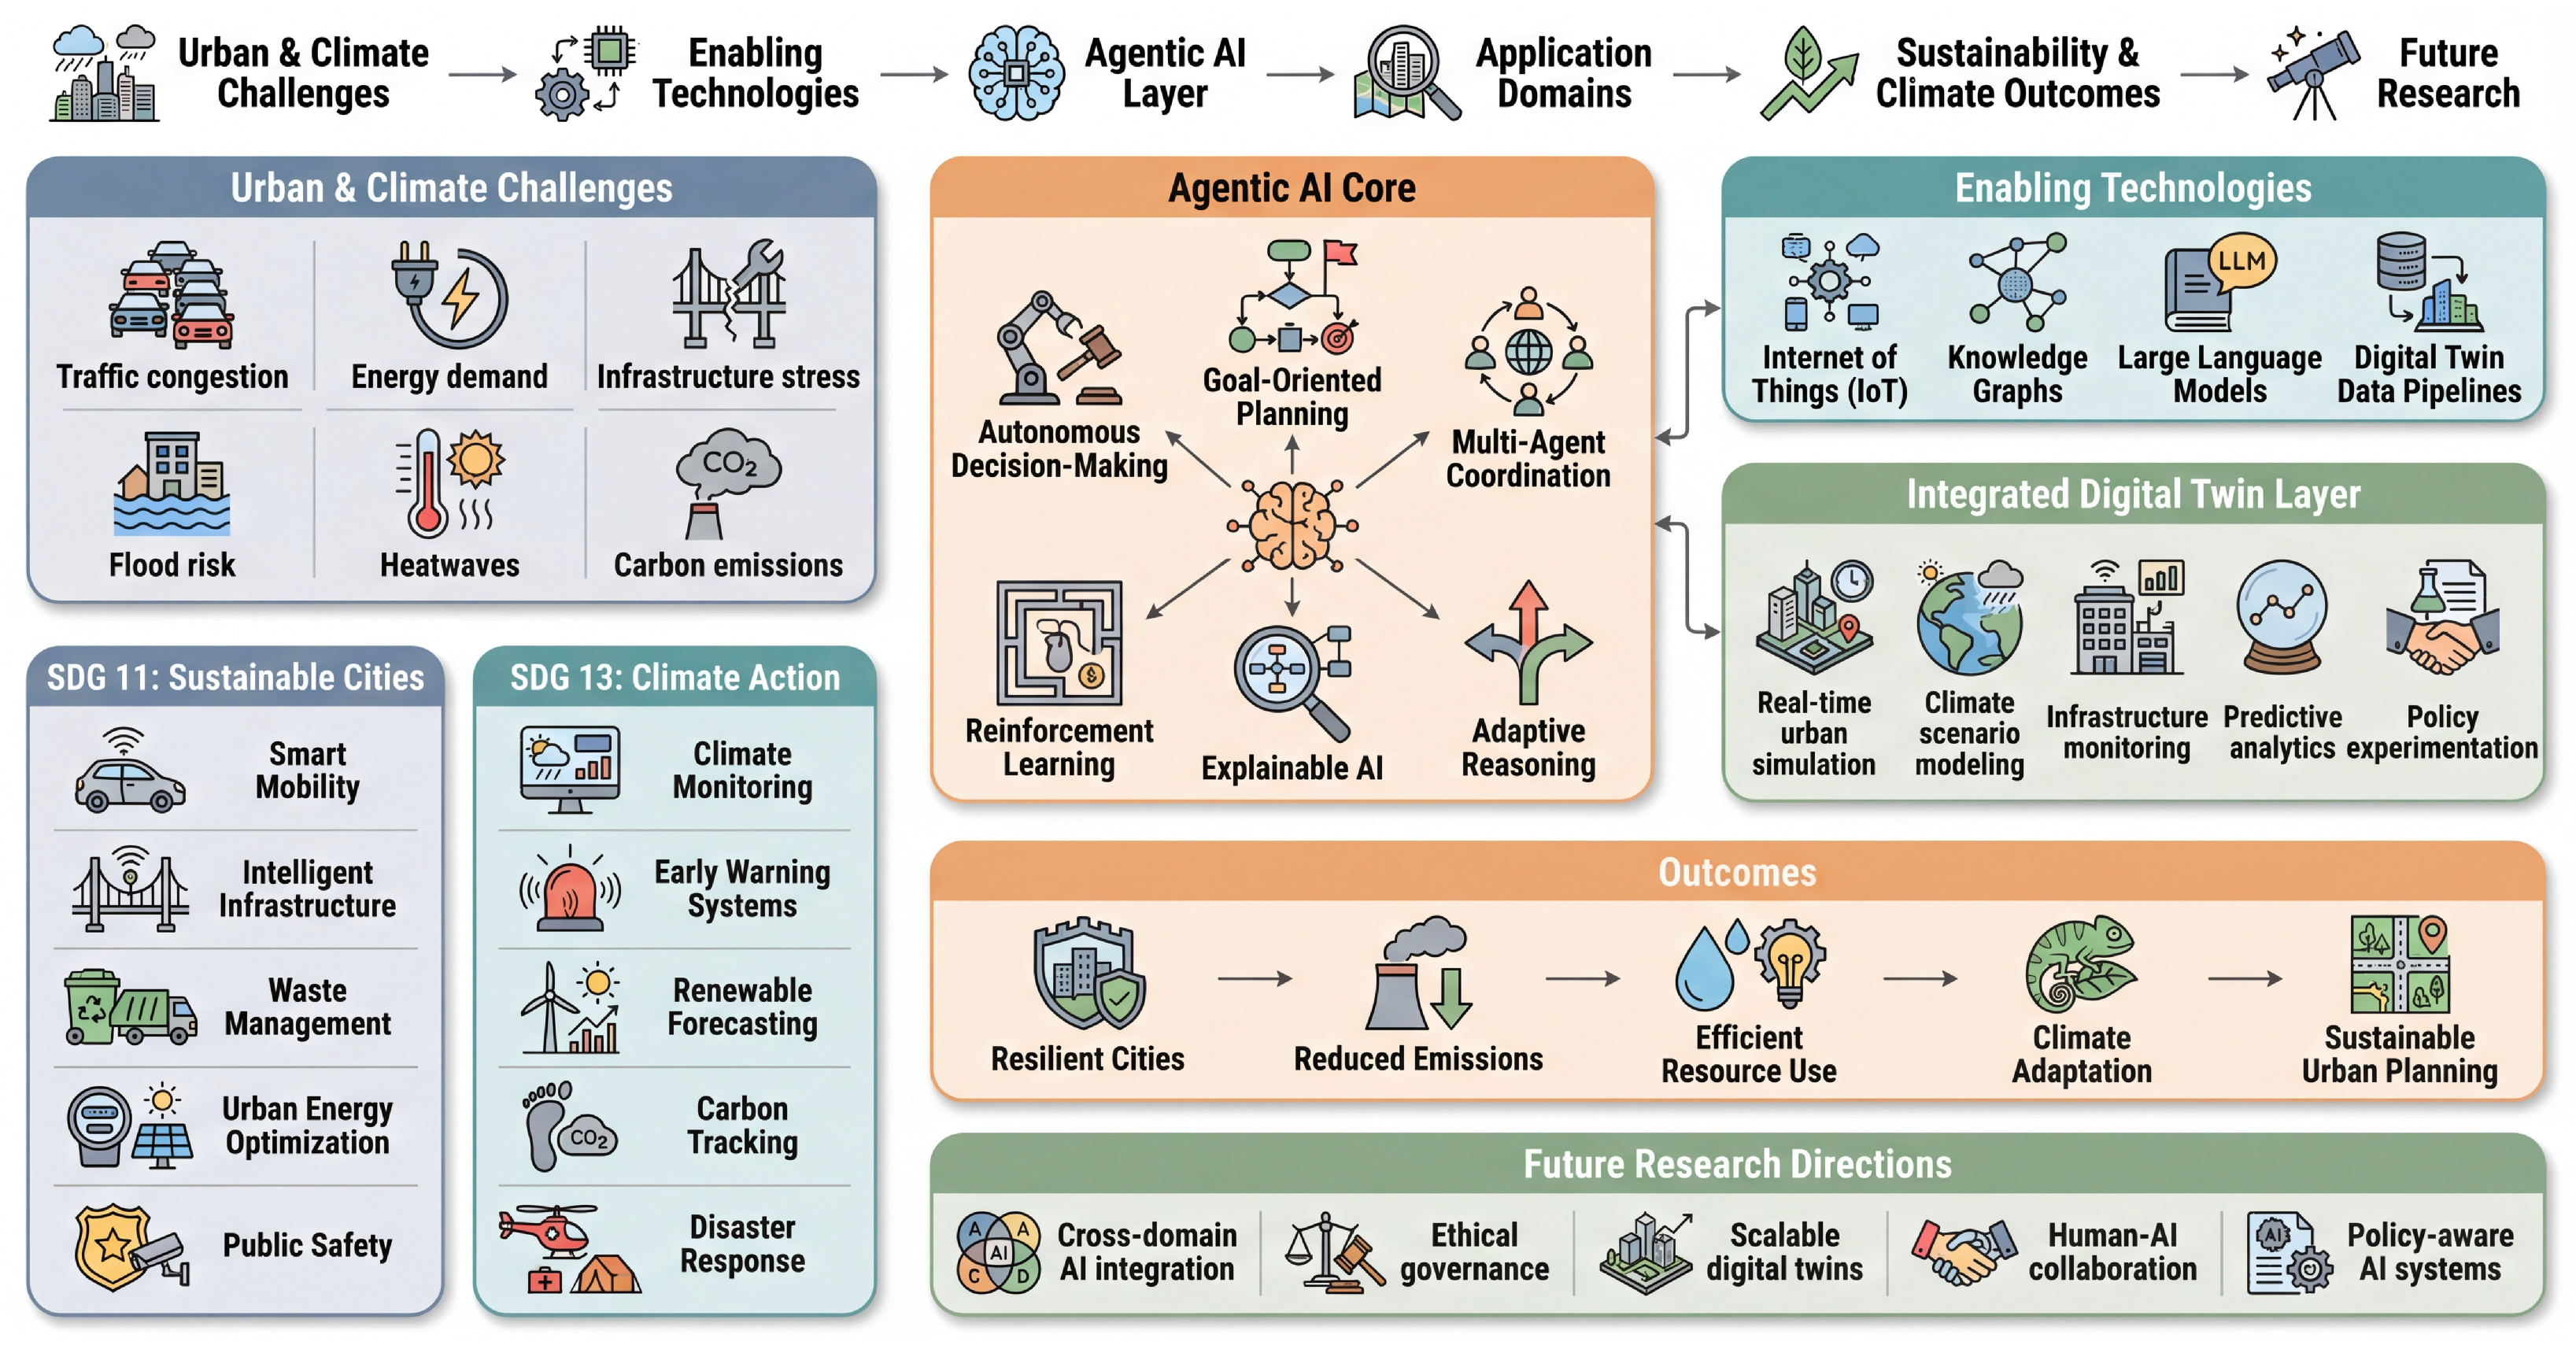
Agentic AI ecosystem for climate-resilient cities. Urban and climate challenges (congestion, energy demand, flood risk, heat) are linked through enabling technologies (IoT, LLMs, knowledge graphs) to an agentic core, an integrated digital twin, and SDG 11/SDG 13 application domains.
Figure 1.
Agentic AI ecosystem for climate-resilient cities. Urban and climate challenges (congestion, energy demand, flood risk, heat) are linked through enabling technologies (IoT, LLMs, knowledge graphs) to an agentic core, an integrated digital twin, and SDG 11/SDG 13 application domains.
Figure 2.
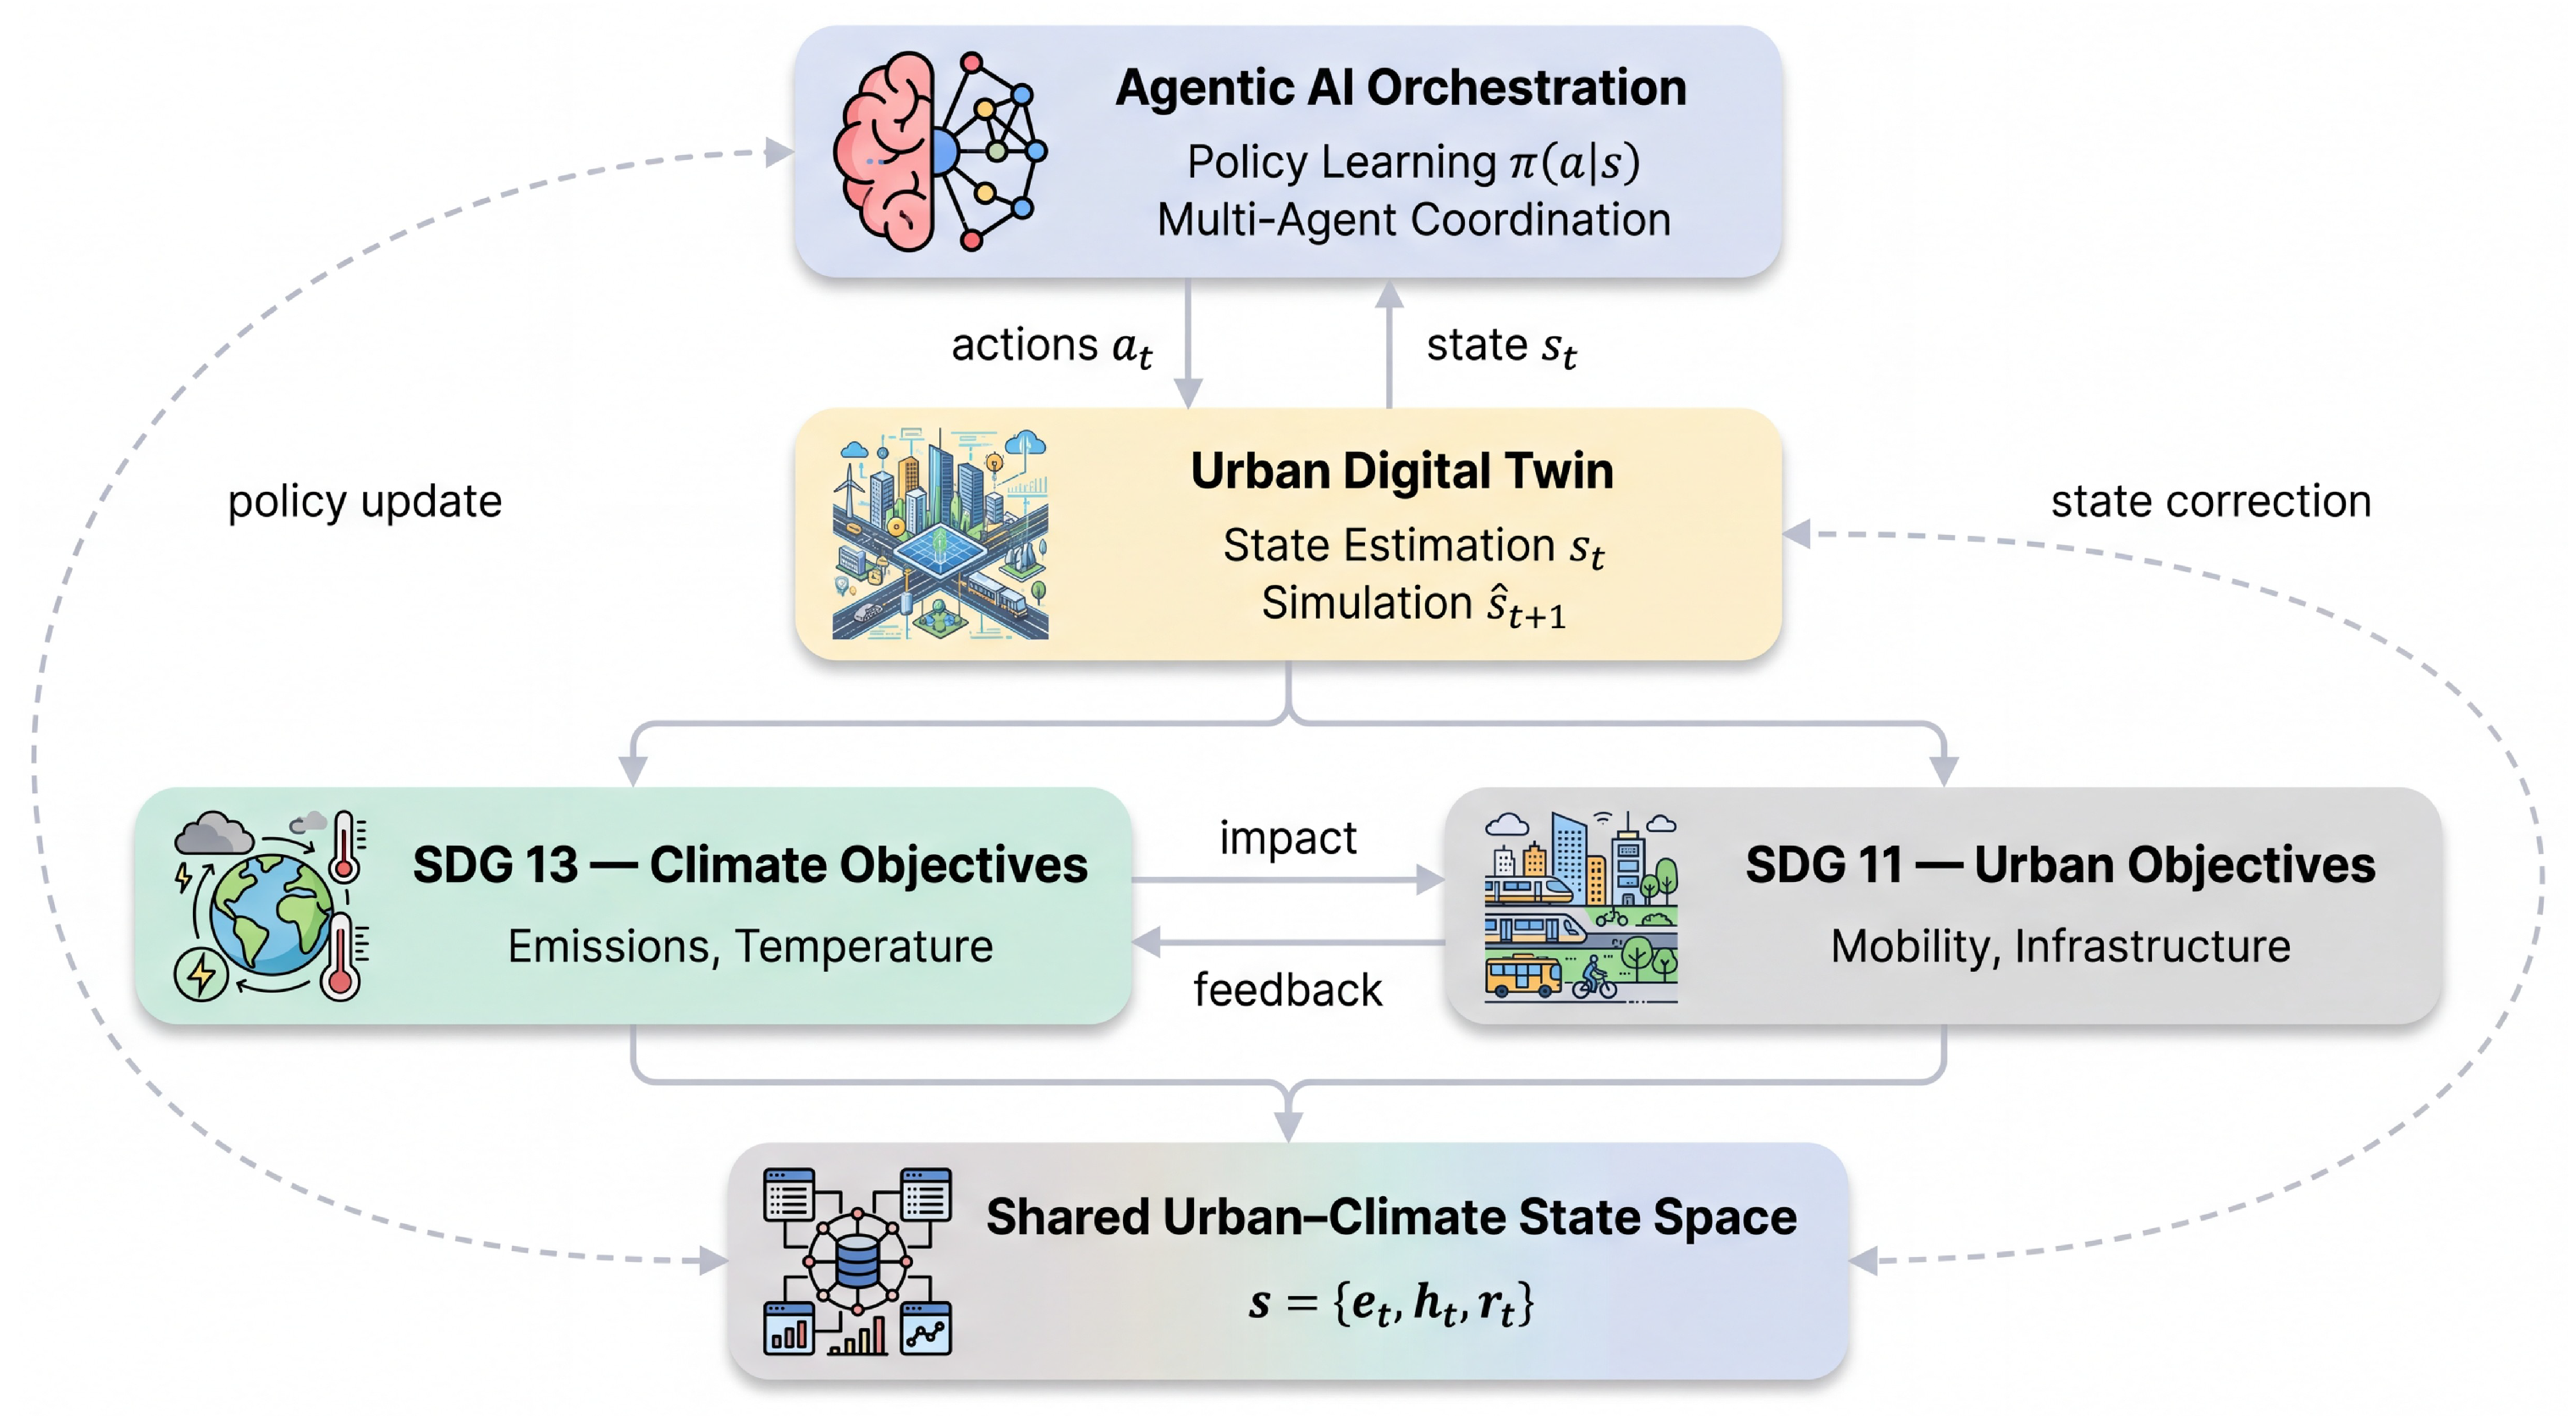
Coupling of SDG 11 and SDG 13 through shared state. An orchestration layer (agentic coordination and reasoning) and a simulation layer (digital twin co-modeling) act on a shared state space of emissions, urban heat, and disaster risk, with bidirectional feedback between policy learning and state estimation.
Figure 2.
Coupling of SDG 11 and SDG 13 through shared state. An orchestration layer (agentic coordination and reasoning) and a simulation layer (digital twin co-modeling) act on a shared state space of emissions, urban heat, and disaster risk, with bidirectional feedback between policy learning and state estimation.
Figure 3.
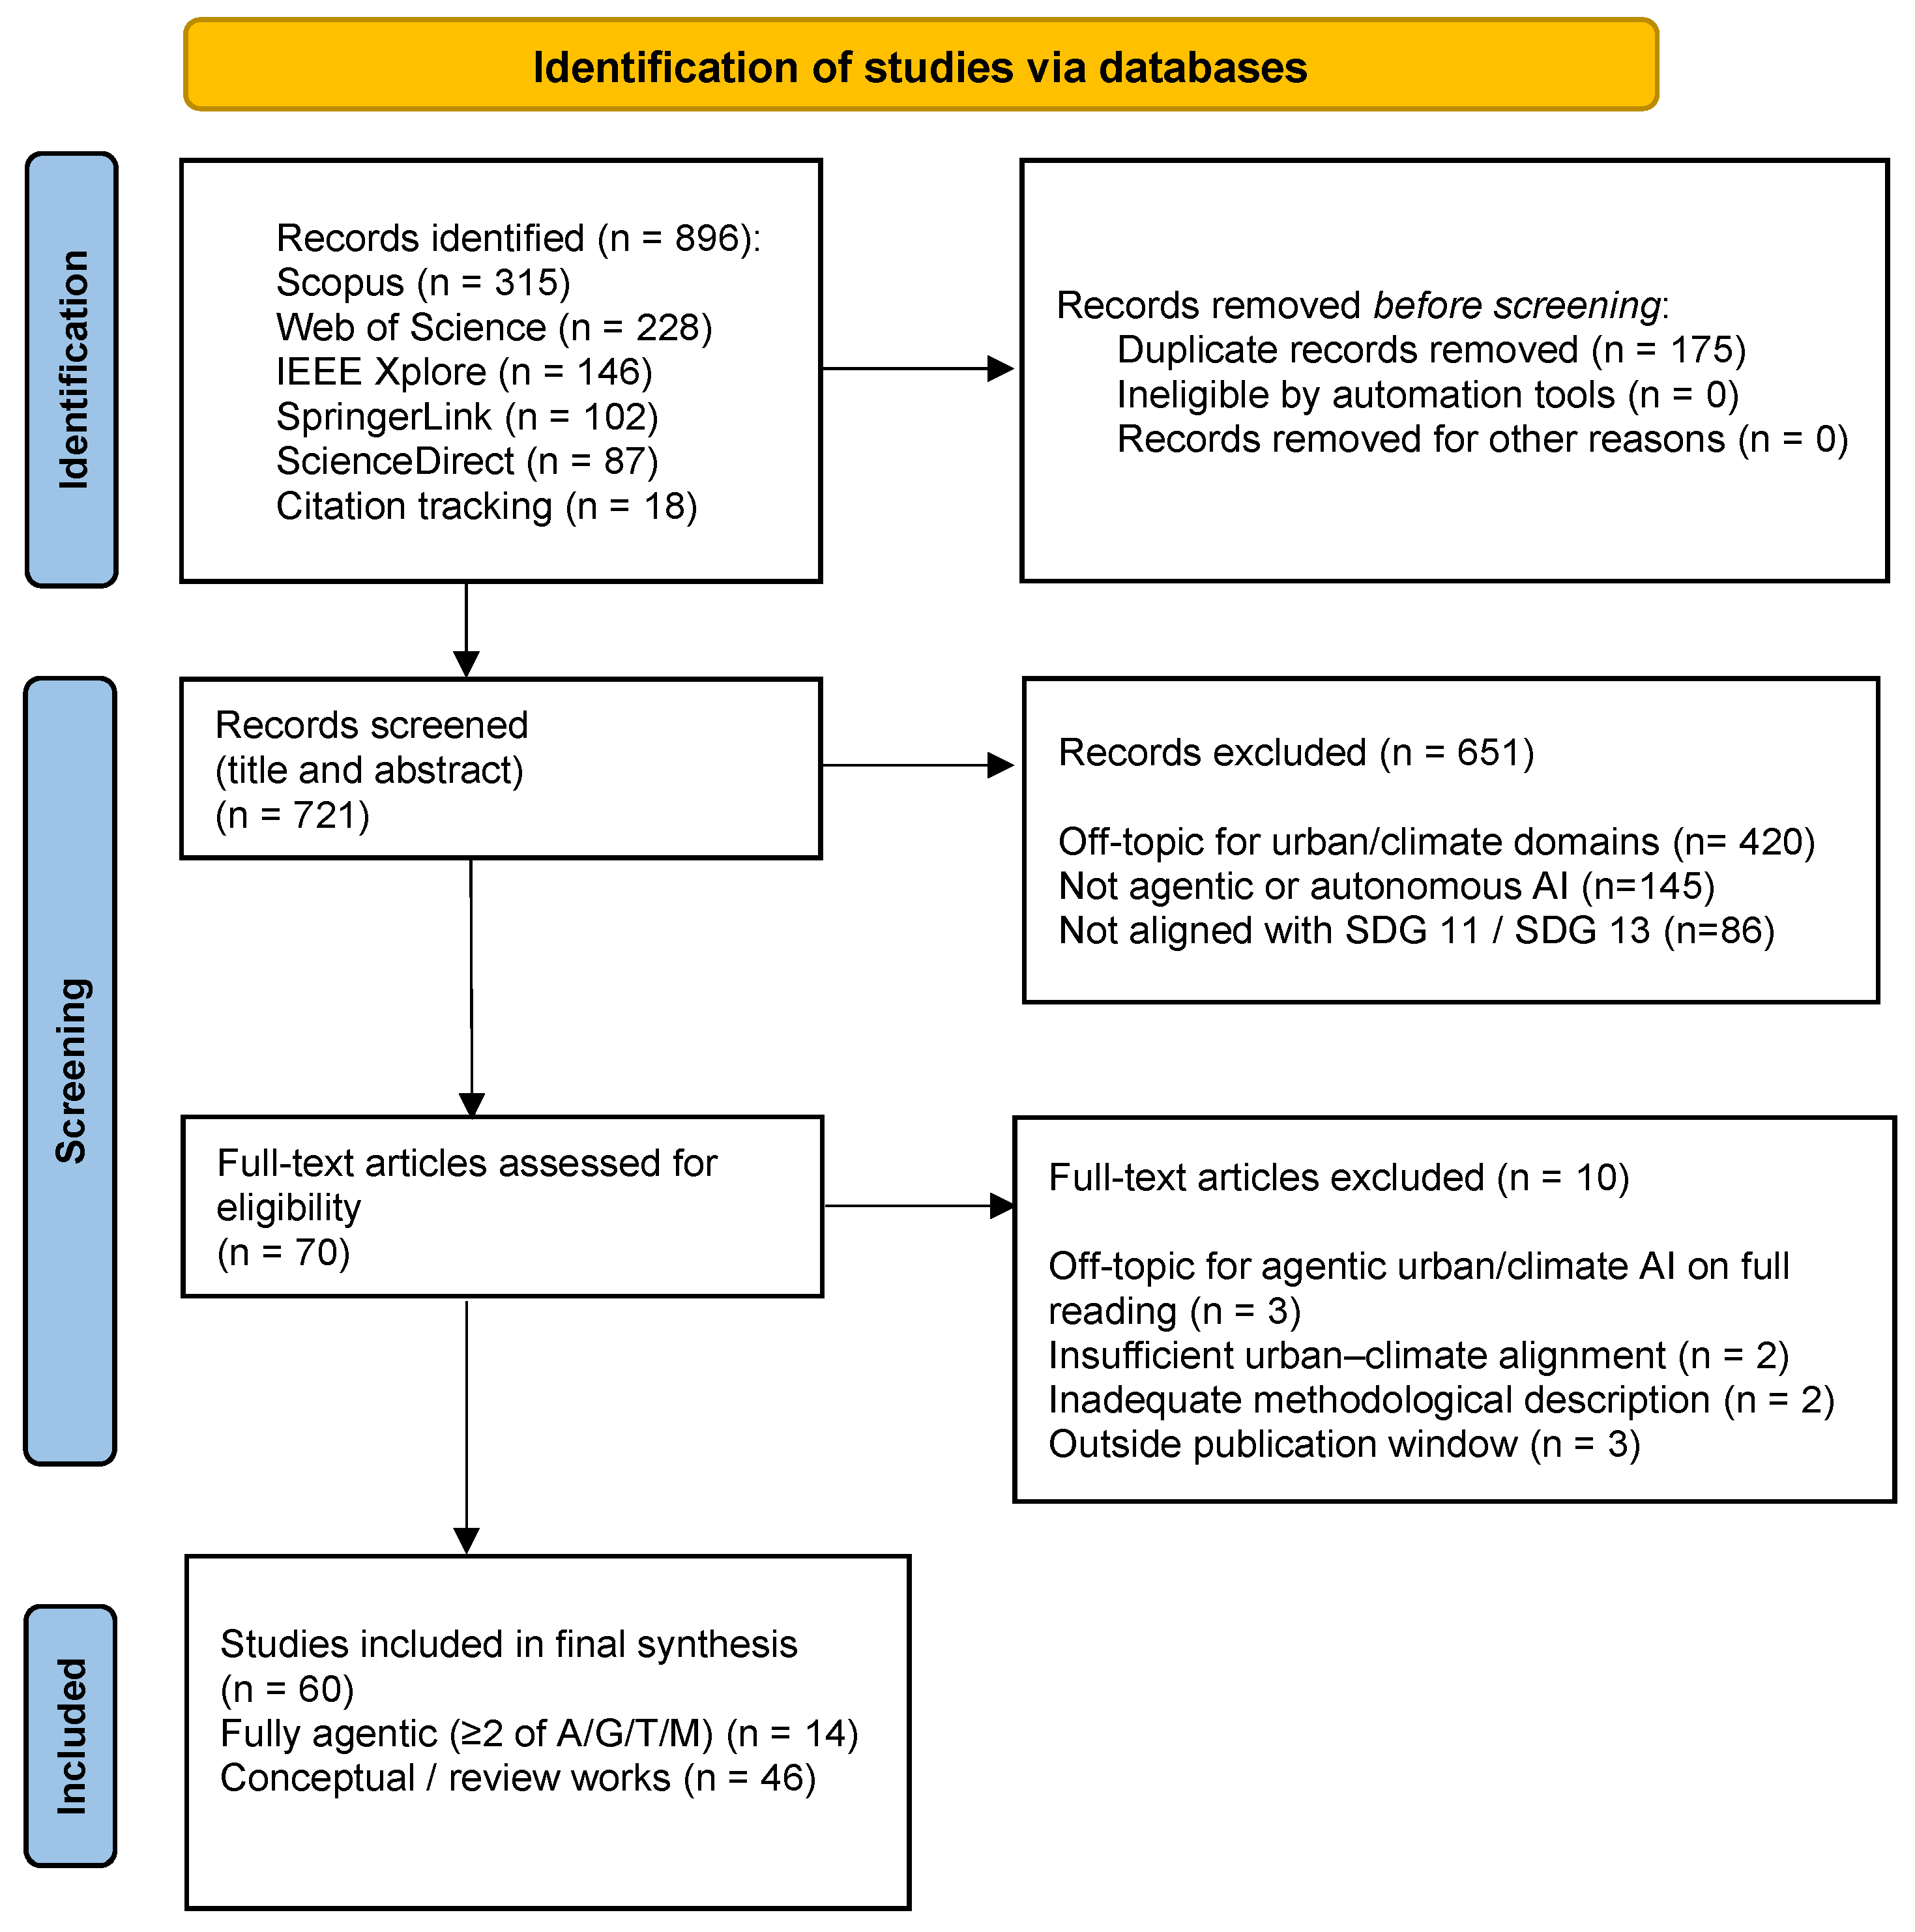
PRISMA 2020 flow diagram of study selection [
23]. Of 896 identified records, 721 were screened after deduplication, 70 underwent full-text assessment, and 60 met all criteria for the final synthesis.
Figure 3.
PRISMA 2020 flow diagram of study selection [
23]. Of 896 identified records, 721 were screened after deduplication, 70 underwent full-text assessment, and 60 met all criteria for the final synthesis.
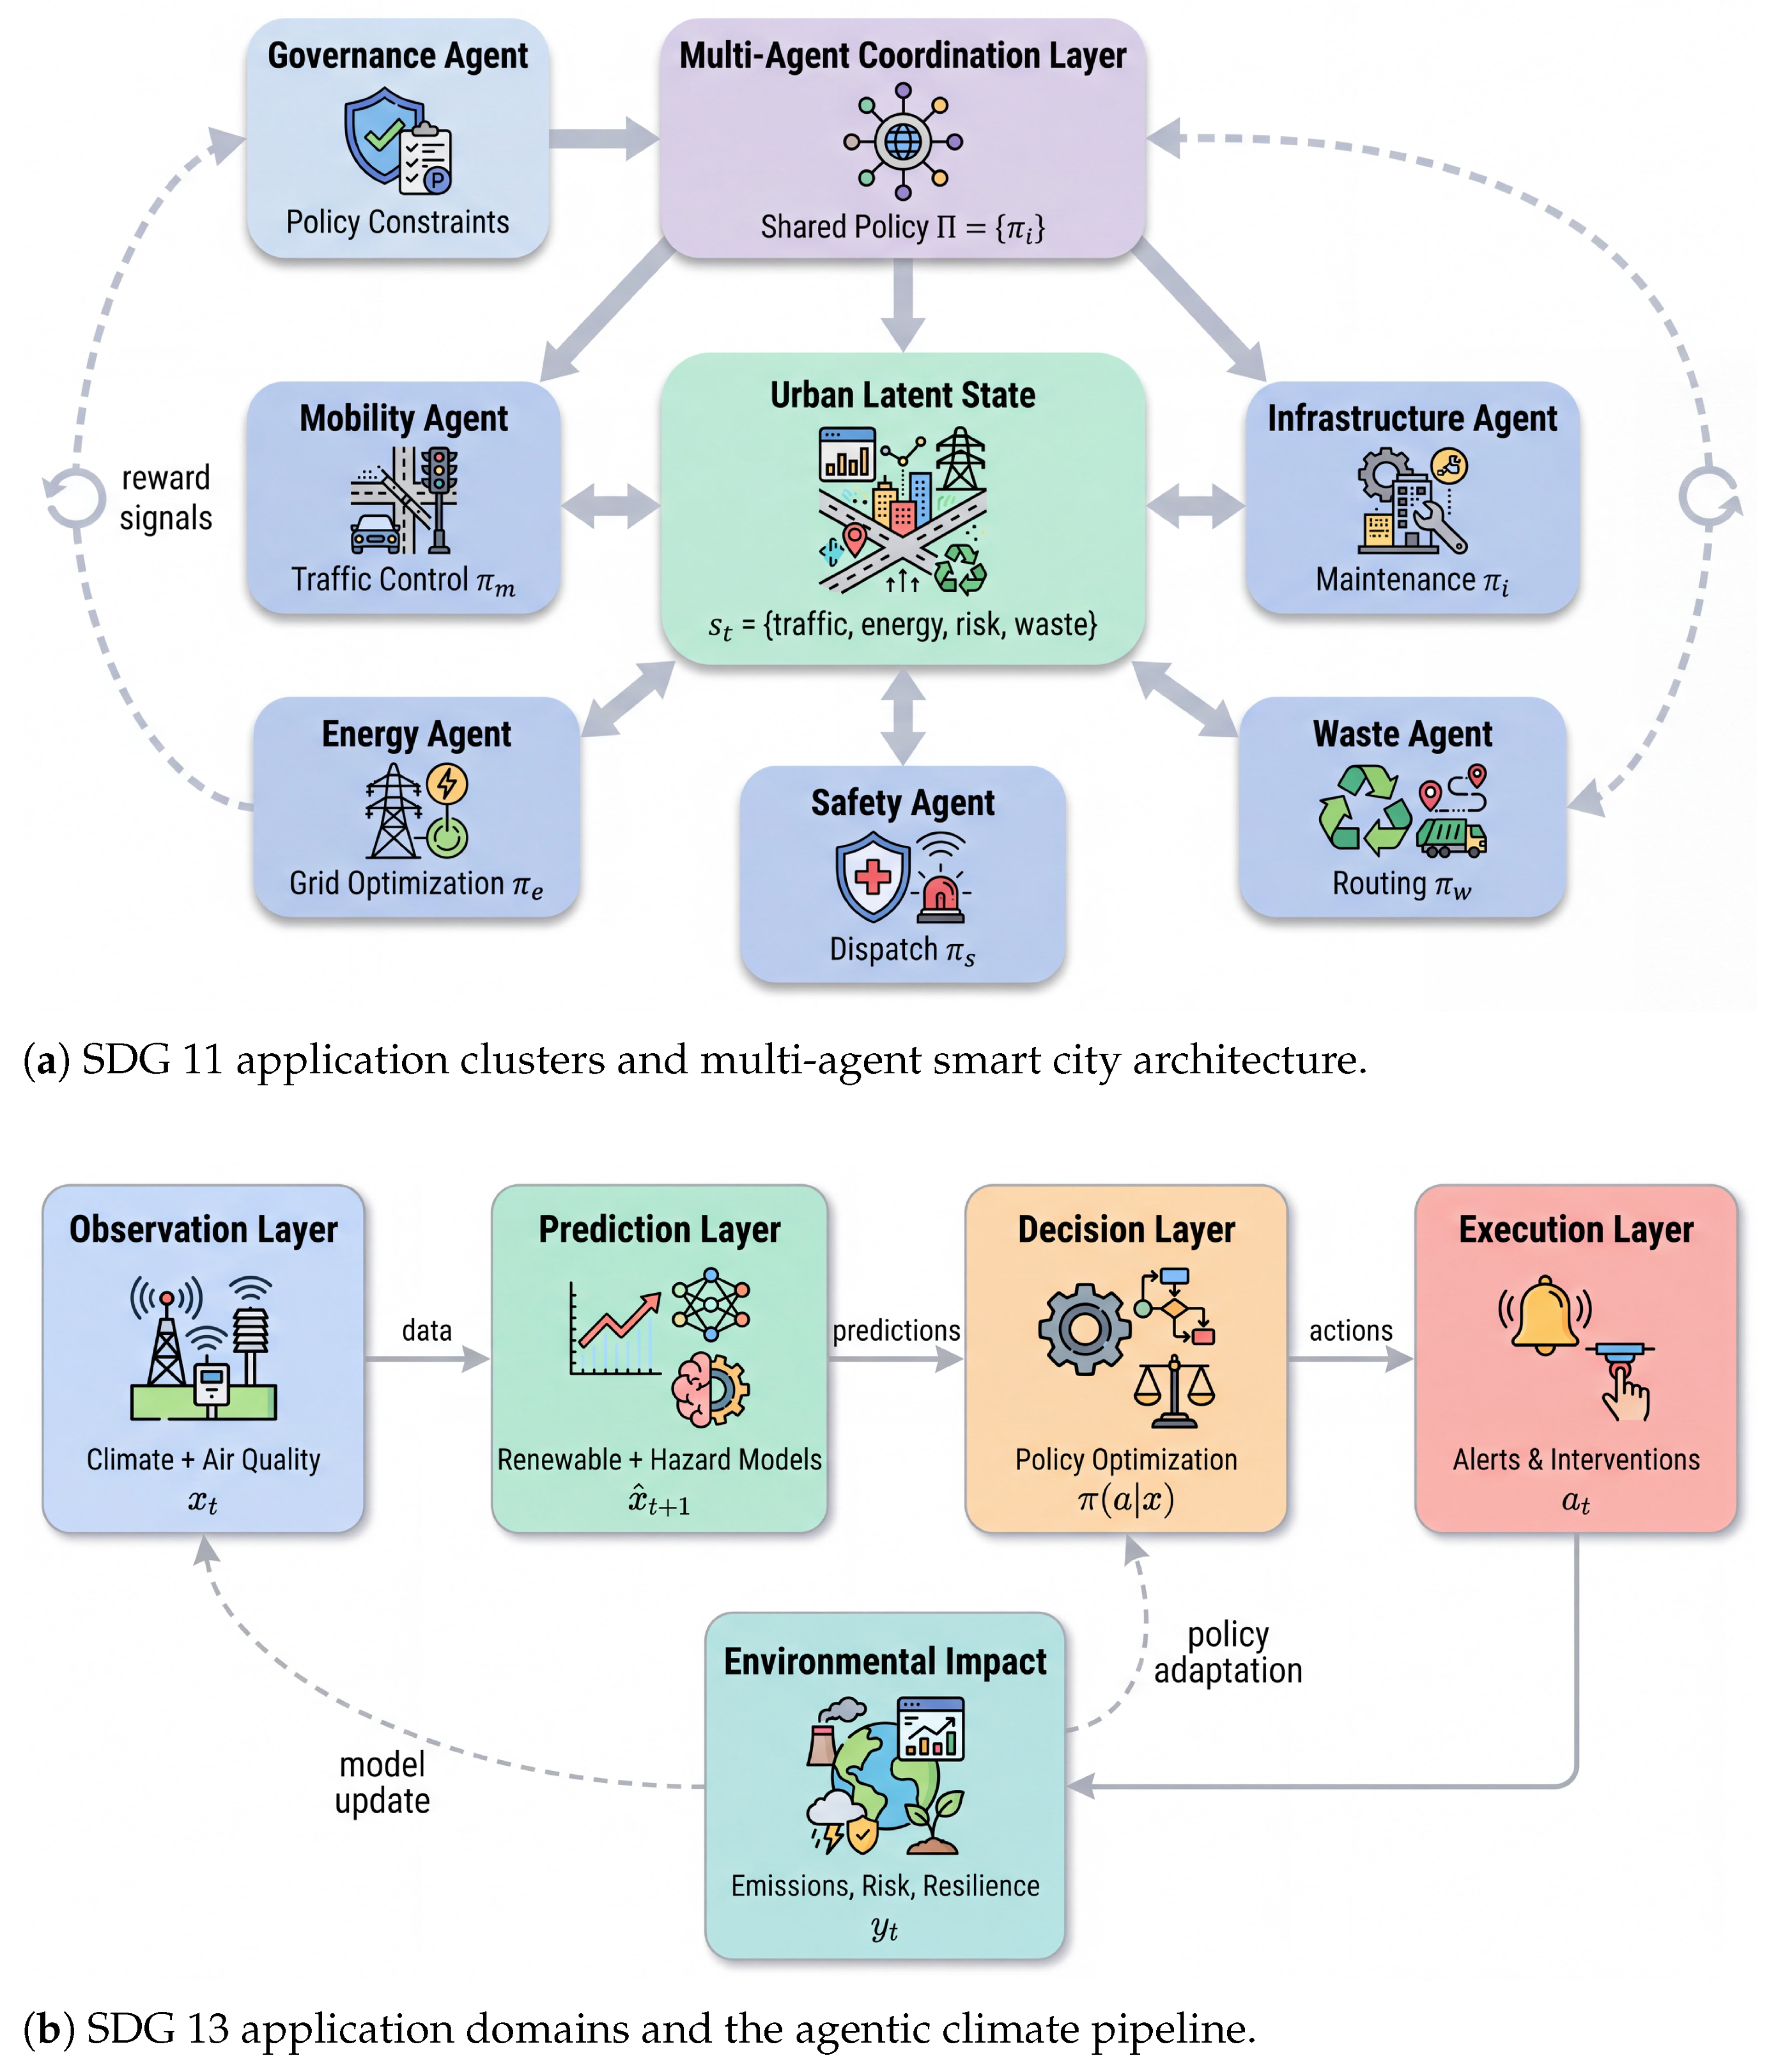
Figure 4.
Application maps for the two goals. (a) Domain-specific agents for mobility, energy, waste, infrastructure, and safety interacting through a shared urban state under centralized coordination and reward-driven learning. (b) Observation, prediction, decision, and execution layers with feedback, spanning renewable forecasting, hazard prediction, and adaptive policy optimization.
Figure 4.
Application maps for the two goals. (a) Domain-specific agents for mobility, energy, waste, infrastructure, and safety interacting through a shared urban state under centralized coordination and reward-driven learning. (b) Observation, prediction, decision, and execution layers with feedback, spanning renewable forecasting, hazard prediction, and adaptive policy optimization.
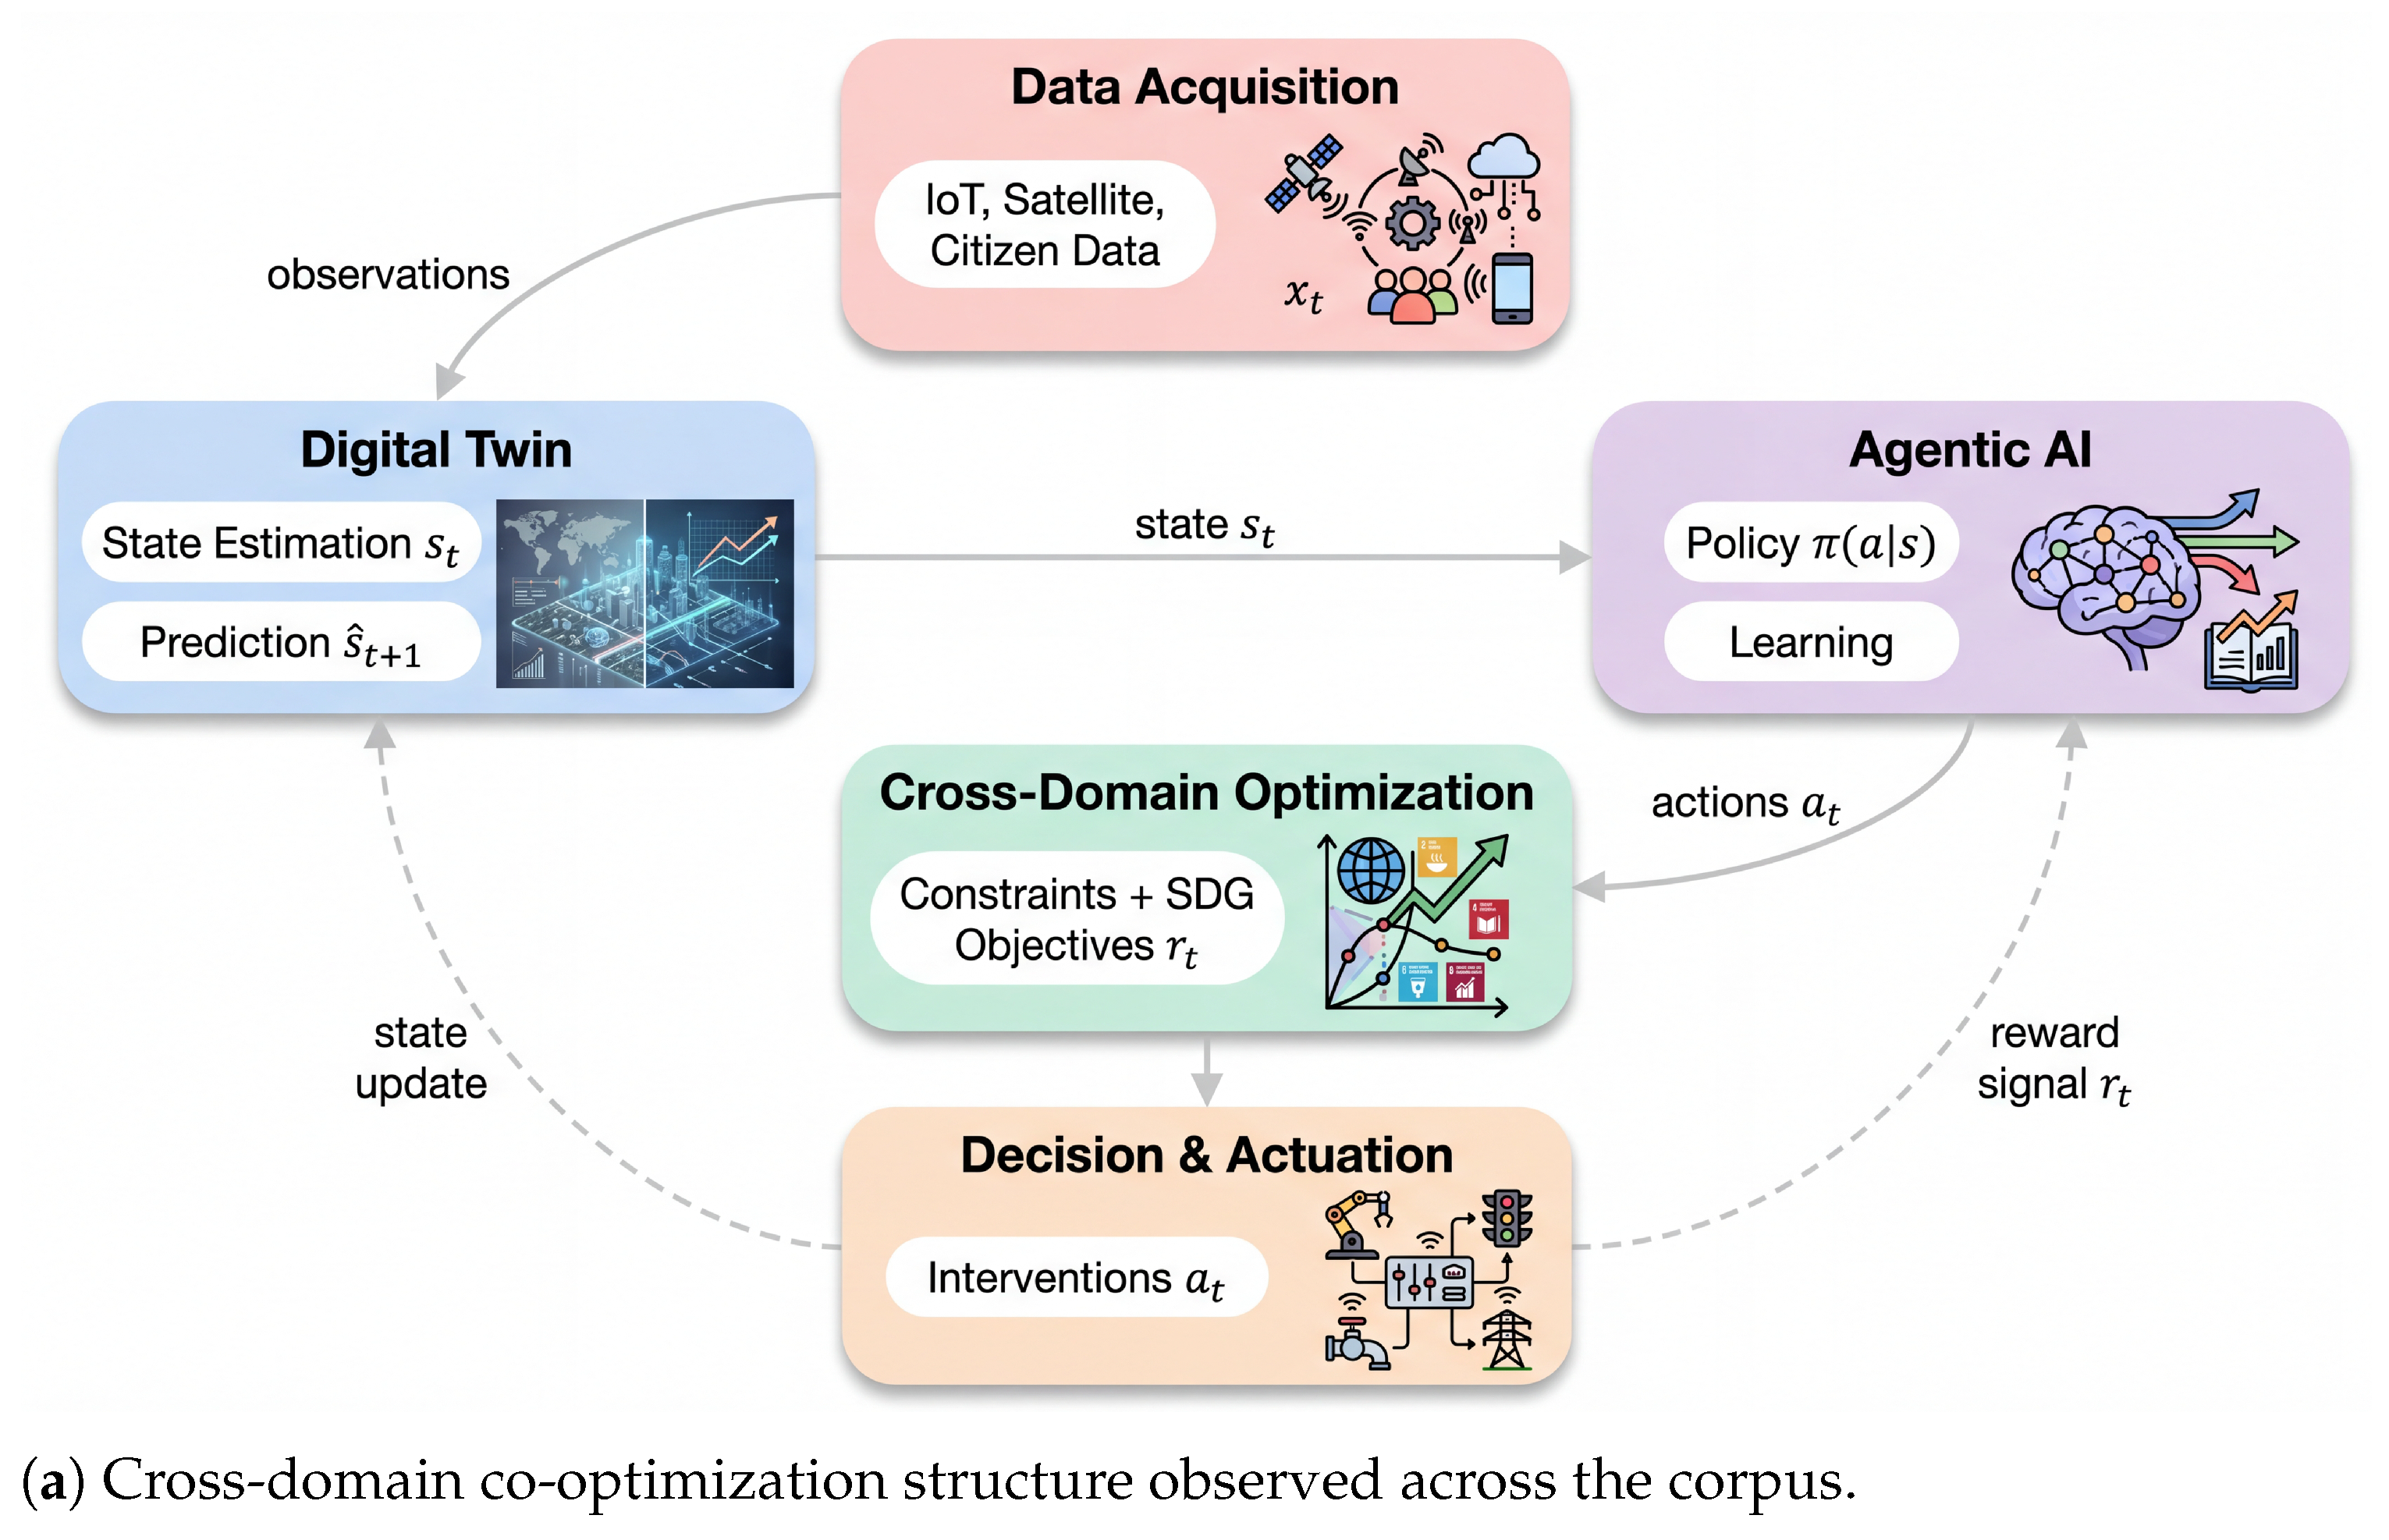
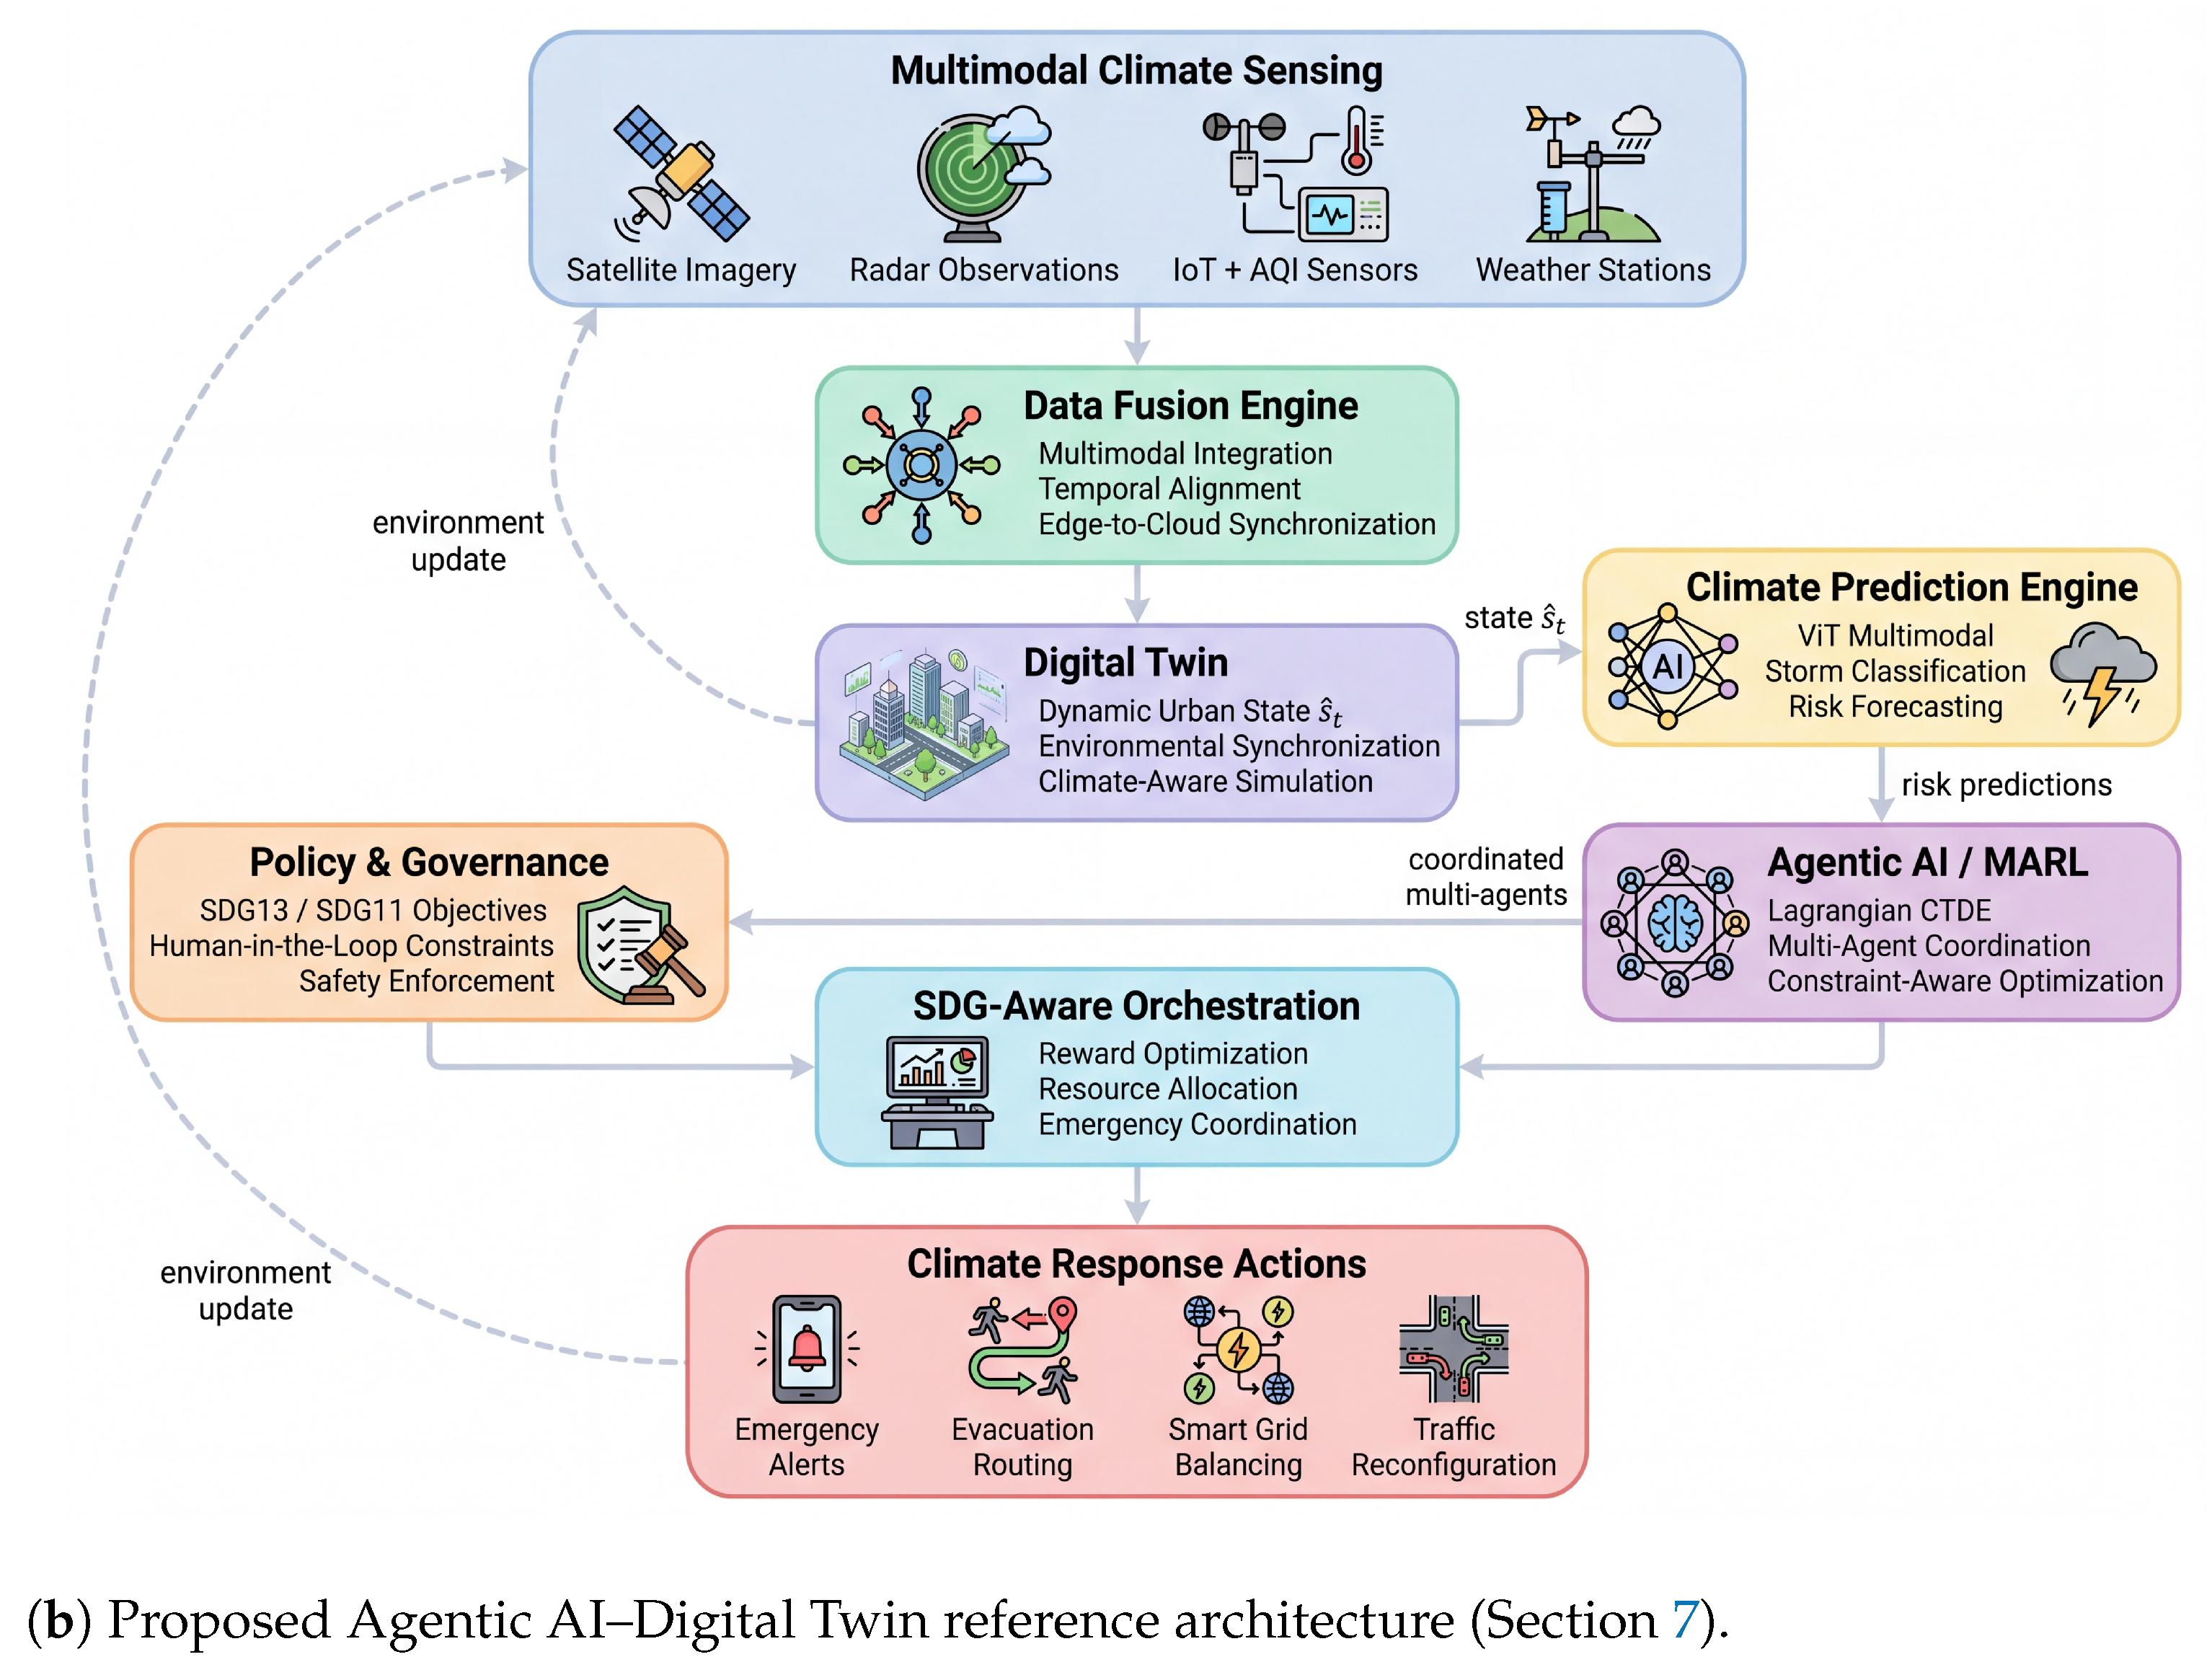
Figure 5.
From observed pattern to reference architecture. (a) Co-optimization structure abstracted from the corpus: data acquisition, state estimation, predictive modeling, policy learning, and constraint-based coordination with feedback. (b) The proposed architecture specifying the interfaces (a) leaves implicit: multimodal sensing, data fusion, climate prediction, agentic optimization, and SDG-aware orchestration under human governance.
Figure 5.
From observed pattern to reference architecture. (a) Co-optimization structure abstracted from the corpus: data acquisition, state estimation, predictive modeling, policy learning, and constraint-based coordination with feedback. (b) The proposed architecture specifying the interfaces (a) leaves implicit: multimodal sensing, data fusion, climate prediction, agentic optimization, and SDG-aware orchestration under human governance.
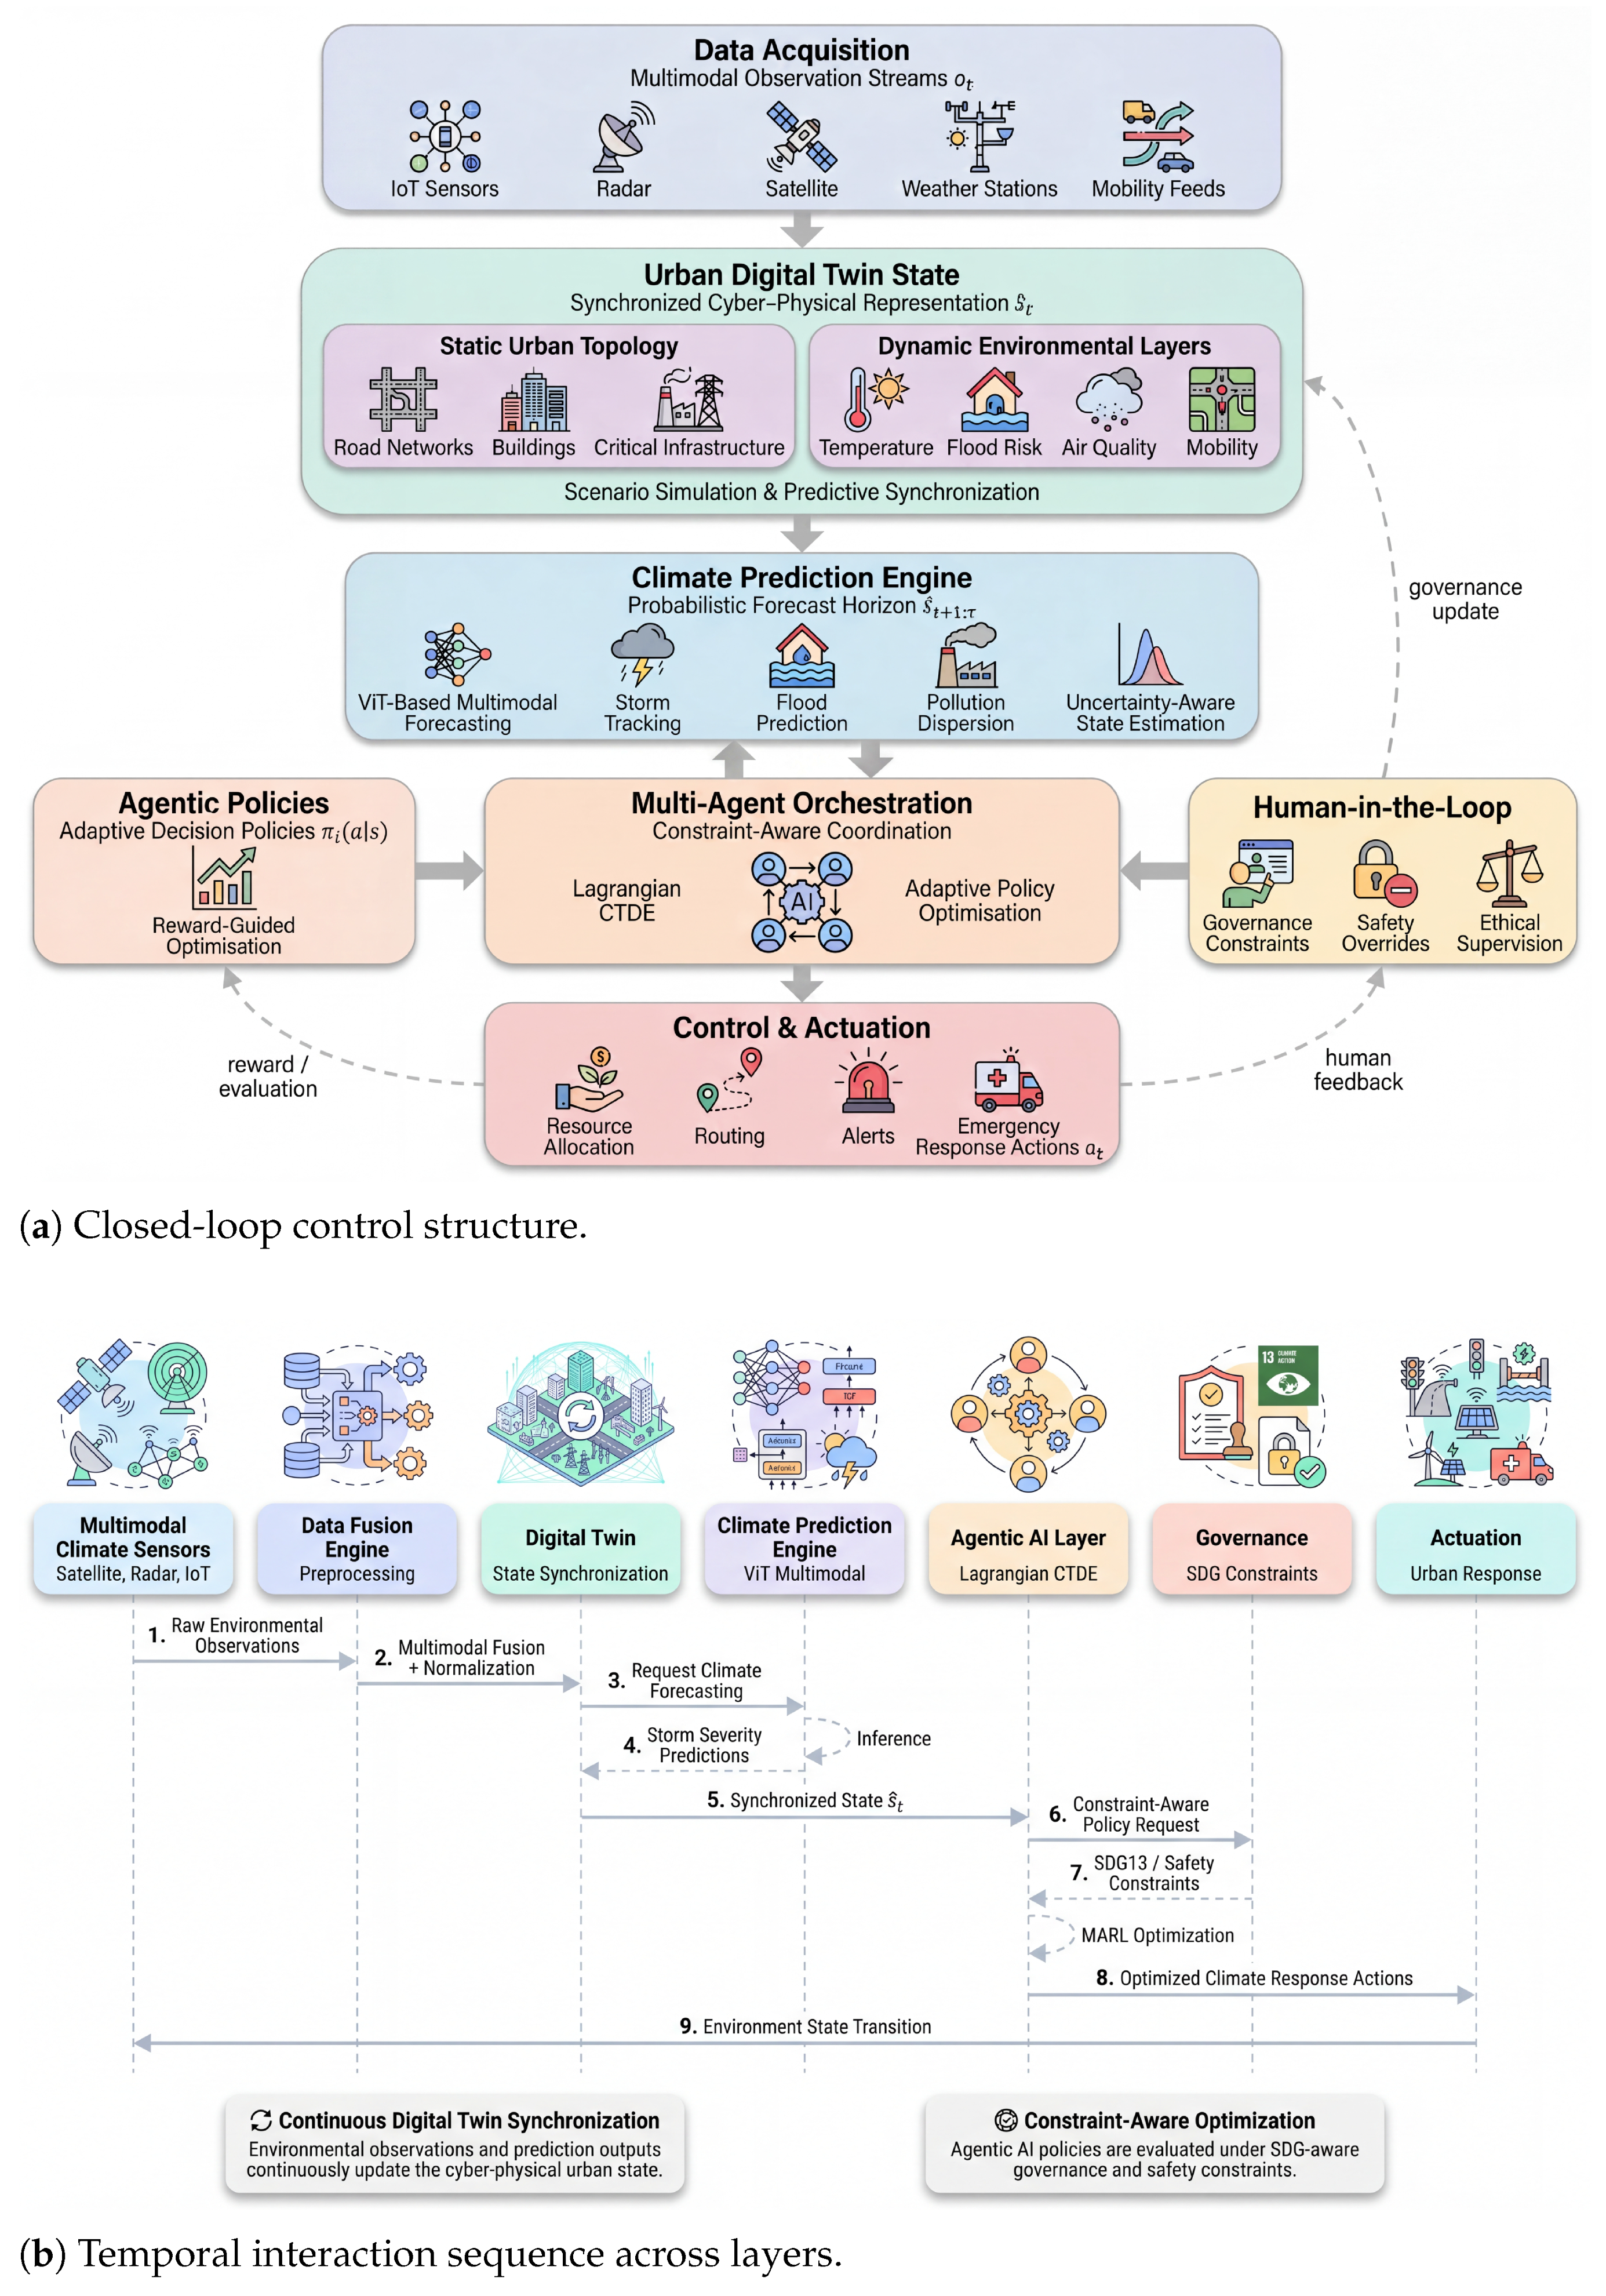
Figure 6.
Layer interaction mechanism. (
a) Closed-loop control: environmental sensing updates the synchronized twin state, which feeds transformer-based forecasting and constraint-aware multi-agent orchestration under human-governed SDG objectives. (
b) Temporal sequence implementing Equation (
1) and the message contract specified in
Section 7.4: fusion, synchronization, prediction, optimization, policy evaluation, actuation, and feedback.
Figure 6.
Layer interaction mechanism. (
a) Closed-loop control: environmental sensing updates the synchronized twin state, which feeds transformer-based forecasting and constraint-aware multi-agent orchestration under human-governed SDG objectives. (
b) Temporal sequence implementing Equation (
1) and the message contract specified in
Section 7.4: fusion, synchronization, prediction, optimization, policy evaluation, actuation, and feedback.
Figure 7.
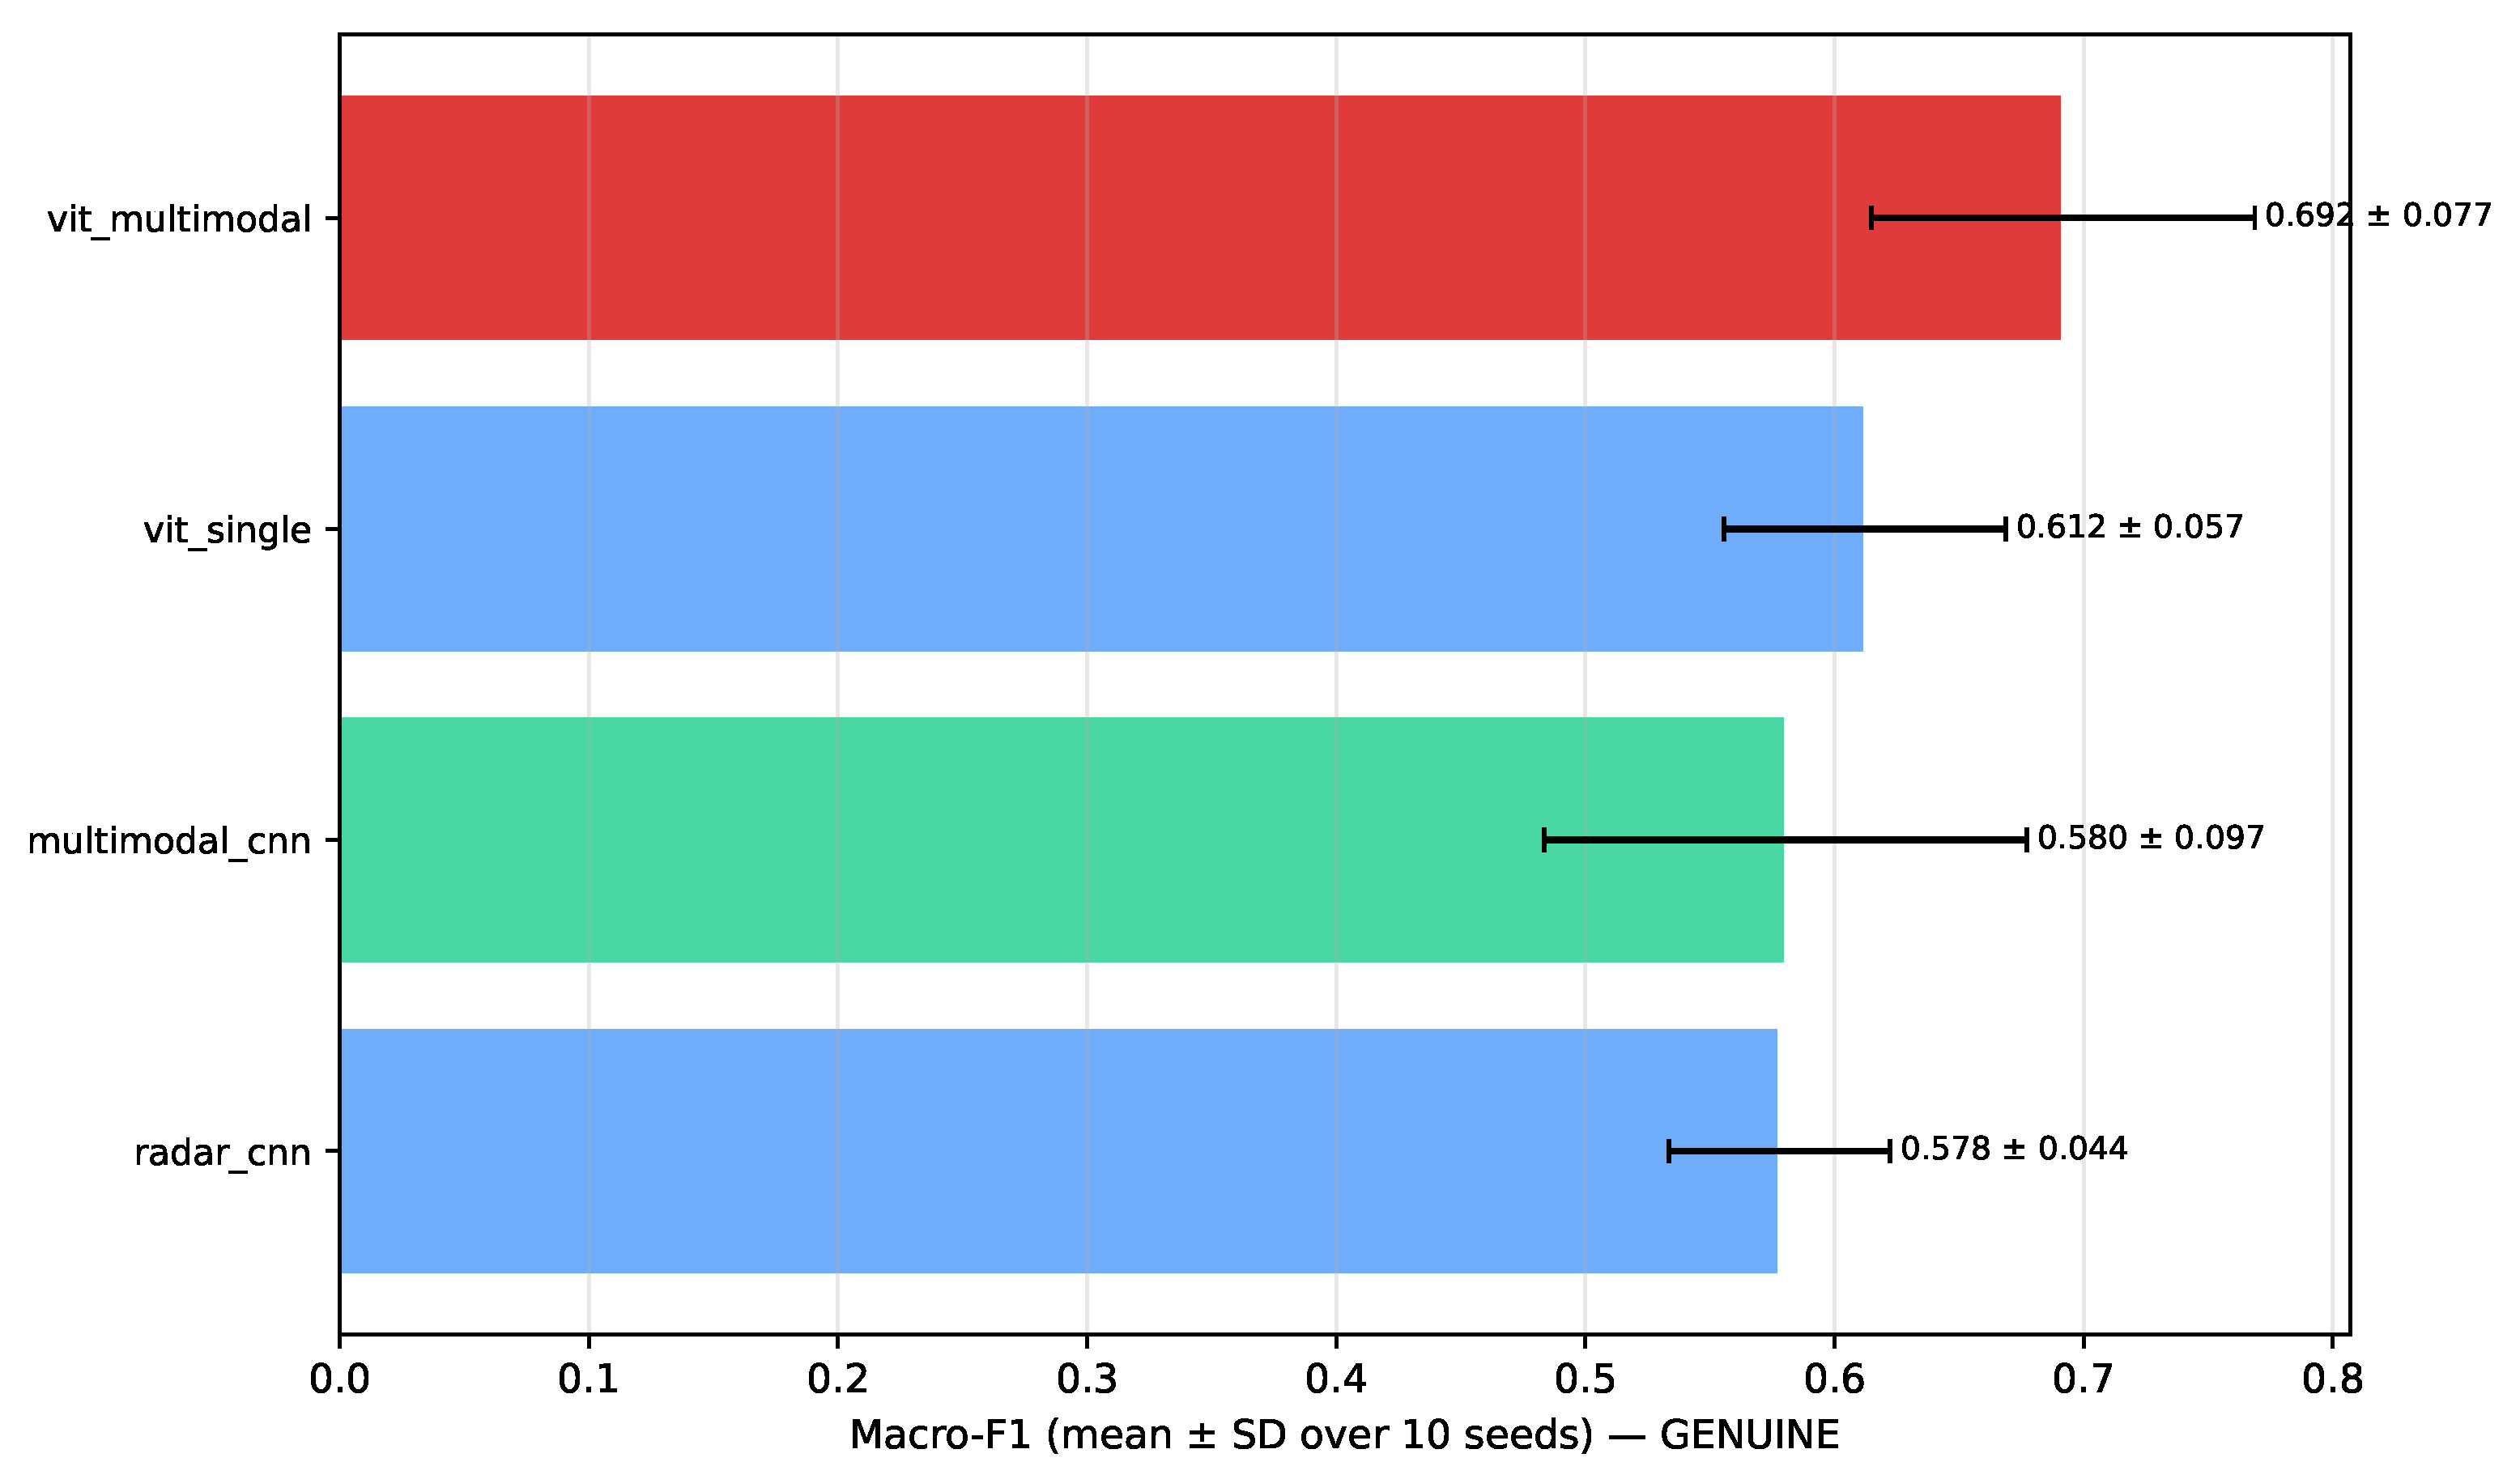
Storm-severity nowcasting on the real SEVIR test events: macro-F1 (mean ± SD over ten seeds). The proposed ViT Multimodal variant attains the highest mean but, with a wide seed-to-seed spread, only marginally exceeds the no-change persistence forecast (
Table 16).
Figure 7.
Storm-severity nowcasting on the real SEVIR test events: macro-F1 (mean ± SD over ten seeds). The proposed ViT Multimodal variant attains the highest mean but, with a wide seed-to-seed spread, only marginally exceeds the no-change persistence forecast (
Table 16).
Figure 8.
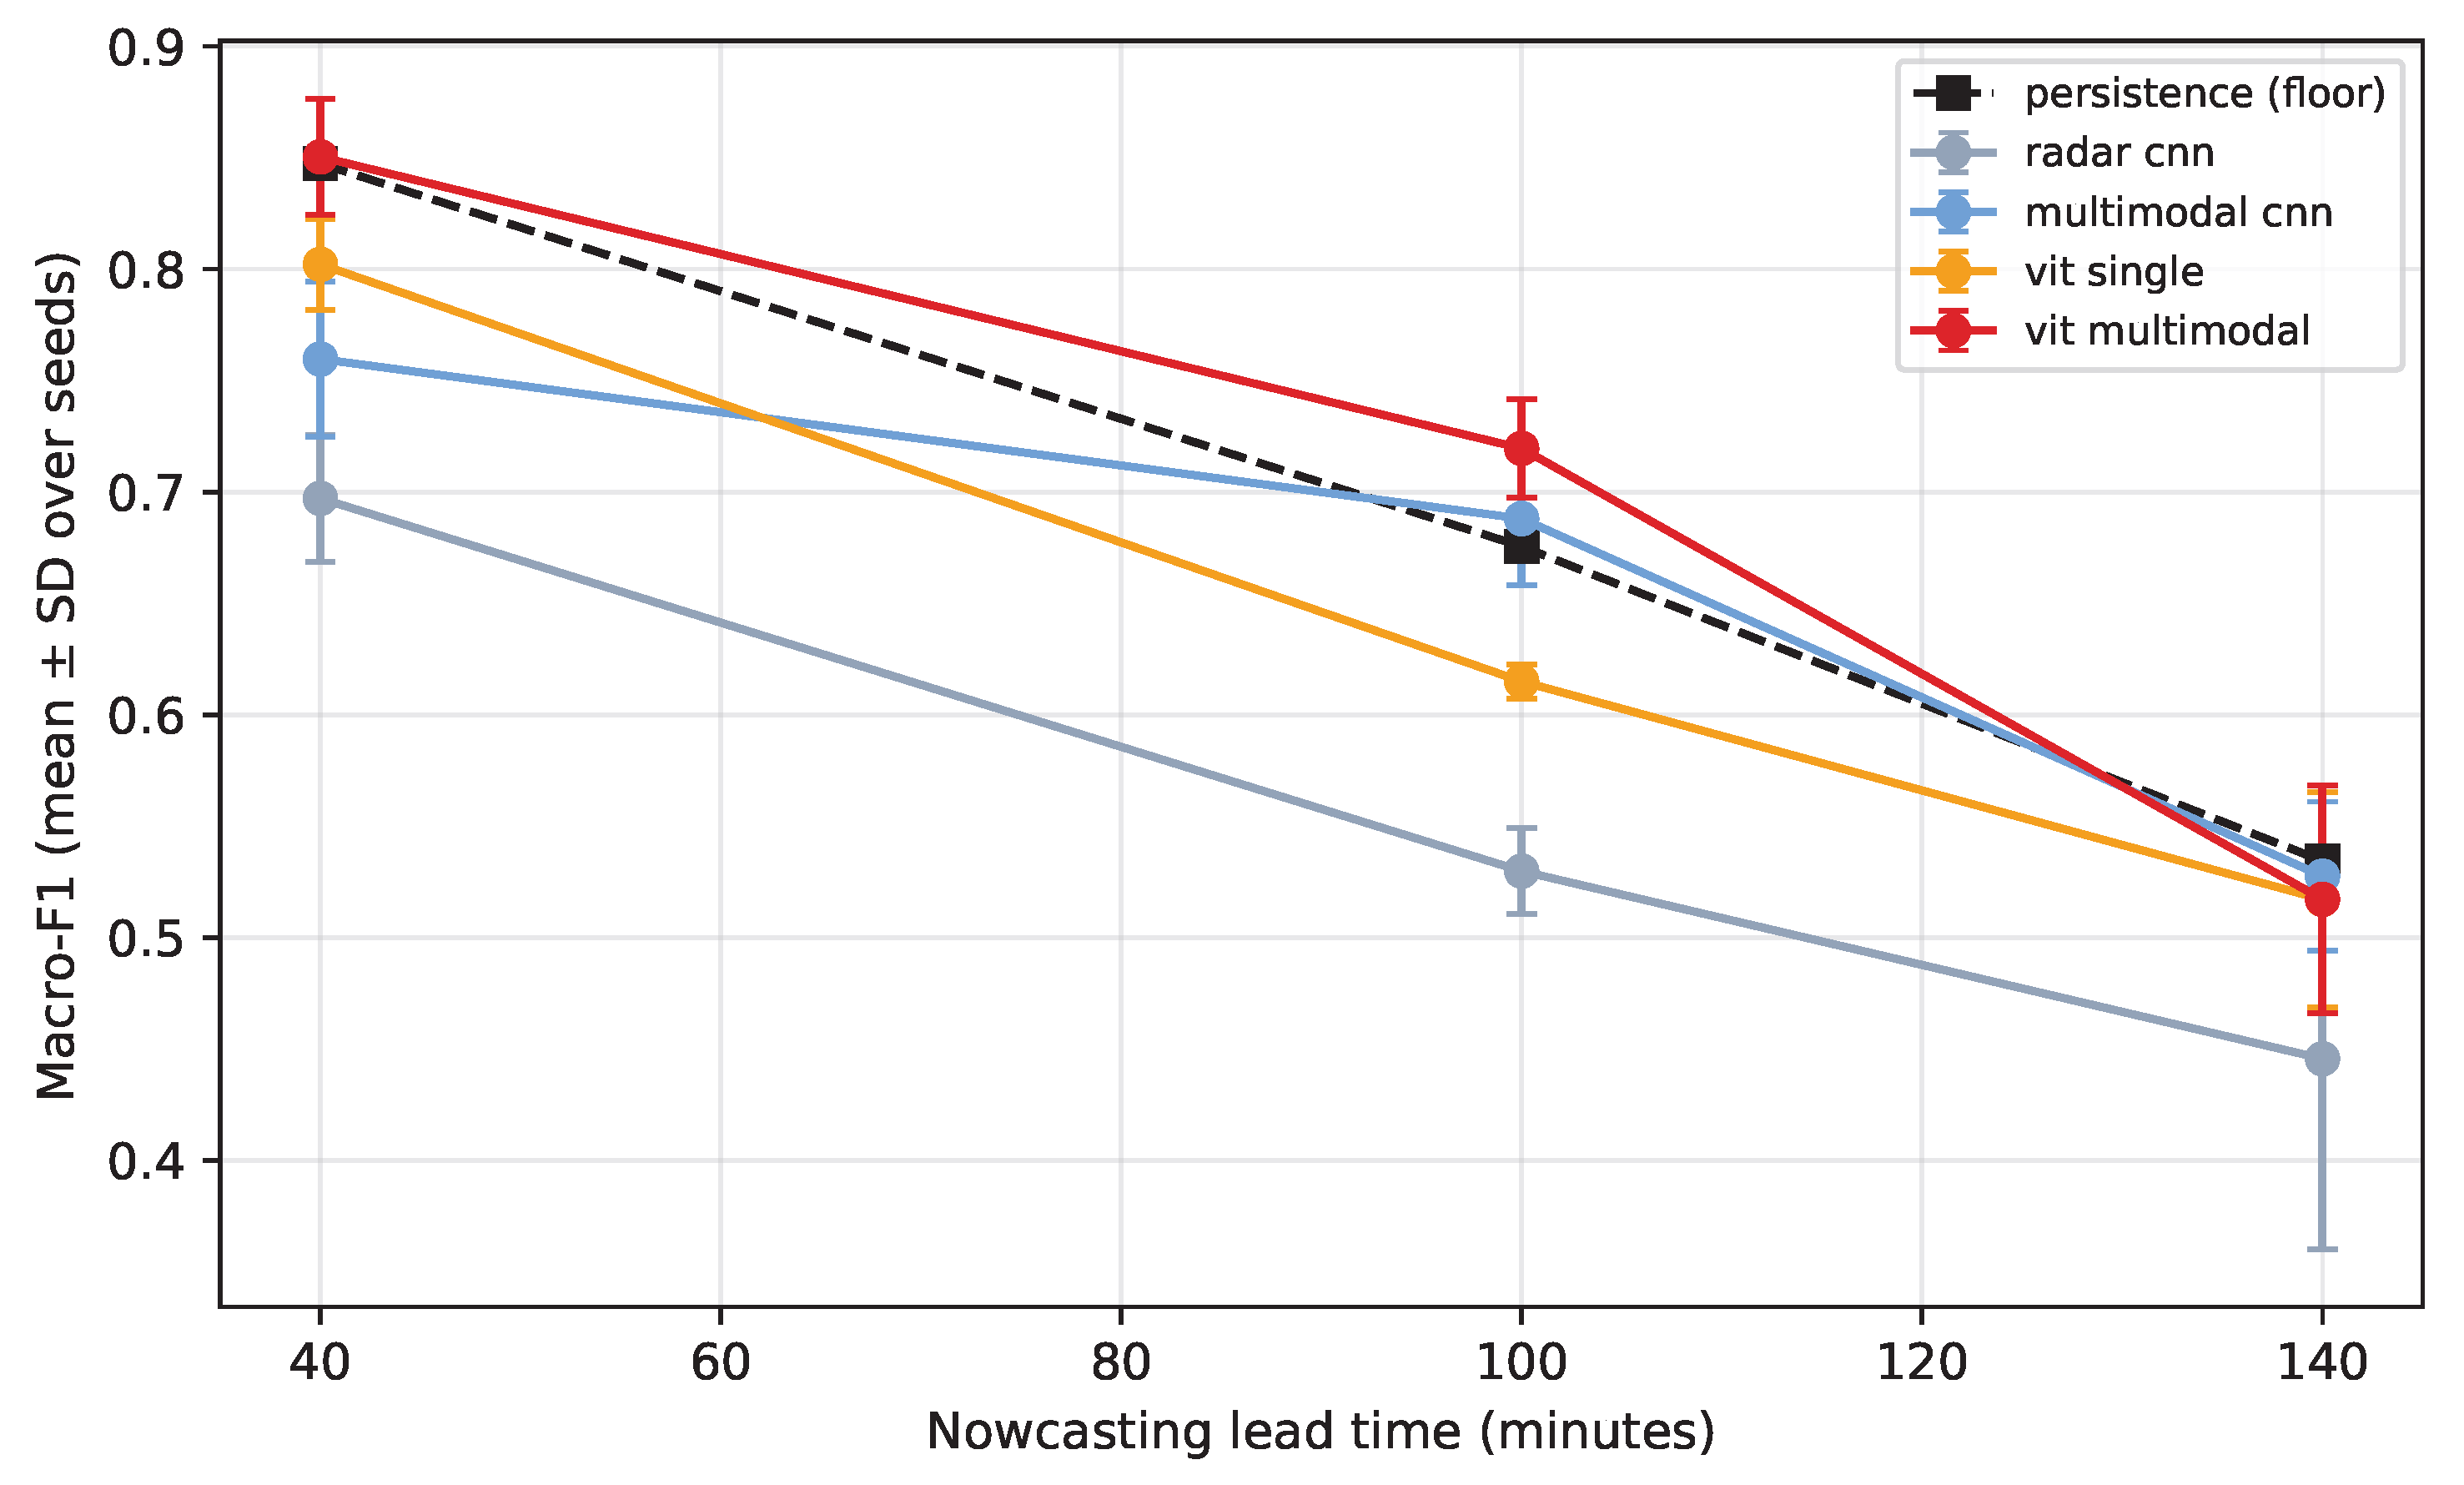
Lead-time sensitivity of storm-severity nowcasting on the real SEVIR test events (macro-F1, mean ± SD over five seeds). At short lead the persistence floor (dashed) matches the best model; at the one-hundred-minute mid-horizon the multimodal models exceed persistence while radar-only models do not; at long lead all models fall to the floor.
Figure 8.
Lead-time sensitivity of storm-severity nowcasting on the real SEVIR test events (macro-F1, mean ± SD over five seeds). At short lead the persistence floor (dashed) matches the best model; at the one-hundred-minute mid-horizon the multimodal models exceed persistence while radar-only models do not; at long lead all models fall to the floor.
Table 1.
Agentic AI versus related paradigms across the four operationalized criteria. ✓ = present; ∼ = partial or situational; ✕ = not evidenced. The rubric in
Table 2 specifies the evidence required for each mark.
Table 1.
Agentic AI versus related paradigms across the four operationalized criteria. ✓ = present; ∼ = partial or situational; ✕ = not evidenced. The rubric in
Table 2 specifies the evidence required for each mark.
| Paradigm | Autonomy
(A) | Goal-Directed
Planning (G) | Tool Use/
Env. Interaction (T) | Multi-Agent
Coordination (M) |
|---|
| Supervised/Rule-based AI | ✕ | ✕ | ✕ | ✕ |
| RL Control (single agent) | ✓ | ∼ | ∼ | ✕ |
| Classic Multi-Agent Systems | ✓ | ∼ | ✕ | ✓ |
| Planning Agents (STRIPS/HTN) | ∼ | ✓ | ✕ | ✕ |
| Agentic AI (this review) | ✓ | ✓ | ✓ | ✓ |
Table 2.
Coding rubric applied to every screened study. Each criterion is scored 1 or 0; evidence must appear in the architecture, experimental setup, or implementation, not in abstract claims alone, and ambiguous cases are coded 0.
Table 2.
Coding rubric applied to every screened study. Each criterion is scored 1 or 0; evidence must appear in the architecture, experimental setup, or implementation, not in abstract claims alone, and ambiguous cases are coded 0.
| Criterion | Coded 1 When the Paper Evidences | Coded 0 Despite Superficial Resemblance |
|---|
| A (Autonomy) | A policy or controller that executes actions without per-decision human authorization inside a stated operational scope, with a closed feedback loop from outcome to next decision. | Decision-support dashboards; systems whose outputs a human must approve before every action; open-loop forecasters. |
| G (Goal-directed planning) | Explicit optimization or search over a horizon greater than one step toward a stated objective: an RL return, a planning objective, a declared multi-step goal decomposition. | Single-step input–output prediction; static optimization solved once offline; objective functions that are only loss functions for supervised fitting. |
| T (Tool use/env. interaction) | Invocation of external APIs, simulators, sensors, retrieval systems, or actuators as part of the action set, with the returned result affecting subsequent behavior. | Reading a static dataset; preprocessing pipelines; visualization of results in an external tool. |
| M (Multi-agent coordination) | Two or more decision-making entities exchanging messages, bids, constraints, or shared state, where the joint outcome depends on the exchange. | Ensembles of models; parallel independent predictors; modular pipelines whose stages do not negotiate. |
Table 3.
Sensitivity of the fully agentic count to the classification threshold, over the 60 included studies. The ≥2 row is the operative threshold for primary implemented evidence; synthesis conclusions drawn from the full corpus are unchanged under stricter thresholds.
Table 3.
Sensitivity of the fully agentic count to the classification threshold, over the 60 included studies. The ≥2 row is the operative threshold for primary implemented evidence; synthesis conclusions drawn from the full corpus are unchanged under stricter thresholds.
| Threshold | Studies Meeting It | Change vs. ≥2 | Effect on the Agentic Subset |
|---|
| ≥1 | 18 | | Adds systems whose only agentic property is task-level autonomy; the distinction from conventional ML collapses. |
| ≥2 | 14 | — | Operative threshold. Requires autonomy plus at least one of planning, interaction, or coordination; these studies form the primary implemented evidence. |
| ≥3 | 3 | | Retains only multi-property architectures; too few for domain-level synthesis, though the qualitative conclusions persist. |
| =4 | 2 | | Full-pattern architectures only; used in Section 7 to identify the recurring architectural pattern. |
Table 4.
Database search strategy and record retrieval by source. Counts reflect pre-deduplication retrieval under the two-tier query of
Section 3.3.
Table 4.
Database search strategy and record retrieval by source. Counts reflect pre-deduplication retrieval under the two-tier query of
Section 3.3.
| Source | Field Code Applied | Records Retrieved |
|---|
| Scopus | TITLE-ABS-KEY | 315 |
| Web of Science | TS (Topic Search) | 228 |
| IEEE Xplore | Full Text & Metadata | 146 |
| SpringerLink | All Content | 102 |
| ScienceDirect | All Fields | 87 |
| Backward citation tracking | Reference scanning of seminal studies | 18 |
| Total | — | 896 |
Table 5.
Study-type stratification of the reference corpus, with evidential weight decreasing down the table. The Implemented, Conceptual, and Review strata form the 60 included studies; Supporting sources are cited only for framing. Percentages are of the full reference set.
Table 5.
Study-type stratification of the reference corpus, with evidential weight decreasing down the table. The Implemented, Conceptual, and Review strata form the 60 included studies; Supporting sources are cited only for framing. Percentages are of the full reference set.
| Stratum | Count | % | Role in Synthesis |
|---|
| Implemented (I) | 24 | 31.6 | Built and evaluated systems; all performance and outcome claims trace here. The 14 that also clear the ≥2 agentic threshold (Table 6) are the primary evidence for agentic operation. |
| Conceptual (C) | 23 | 30.3 | Architectural patterns and design rationale only; no outcome claims. |
| Review/Survey (R) | 13 | 17.1 | Contextual positioning and gap identification; never counted as independent instances. |
| Supporting (S) | 16 | 21.1 | Reporting guidelines, statistical references, normative and intergovernmental documents, foundational agent and digital-twin sources, comparative prior-review citations, and the SEVIR dataset citation used in the feasibility study. |
Included (I + C + R)
Total references | 60
76 | 78.9
100 | Screened synthesis set. |
Table 6.
Cross-tabulation of study type against agentic intensity (the A/G/T/M count) for the 60 included studies. The fully agentic set (≥2, the ≥3 and =2 columns) totals 14, all within the Implemented stratum; no conceptual or review work clears the threshold.
Table 6.
Cross-tabulation of study type against agentic intensity (the A/G/T/M count) for the 60 included studies. The fully agentic set (≥2, the ≥3 and =2 columns) totals 14, all within the Implemented stratum; no conceptual or review work clears the threshold.
| Study Type | ≥3 | =2 | =1 | =0 | Row Total |
|---|
| Implemented (I) | 3 | 11 | 2 | 8 | 24 |
| Conceptual (C) | 0 | 0 | 2 | 21 | 23 |
| Review/Survey (R) | 0 | 0 | 0 | 13 | 13 |
| Total | 3 | 11 | 4 | 42 | 60 |
Table 7.
Agentic coding for 14 representative studies, per the rubric in
Table 2. A = Autonomy; G = Goal-directed planning; T = Tool use or environmental interaction; M = Multi-agent coordination. ✓ = evidenced; — = not evidenced. Type: I = Implemented, C = Conceptual, R = Review.
Table 7.
Agentic coding for 14 representative studies, per the rubric in
Table 2. A = Autonomy; G = Goal-directed planning; T = Tool use or environmental interaction; M = Multi-agent coordination. ✓ = evidenced; — = not evidenced. Type: I = Implemented, C = Conceptual, R = Review.
| Study | Domain | Type | A | G | T | M | Count |
|---|
| Cao et al. [27] | Traffic signal optimization | I | ✓ | ✓ | ✓ | ✓ | 4 |
| Yang et al. [28] | Infrastructure planning | I | ✓ | ✓ | ✓ | — | 3 |
| White et al. [29] | Smart city citizen engagement | I | — | ✓ | ✓ | — | 2 |
| Tiggeloven et al. [30] | Climate early warning | R | ✓ | ✓ | ✓ | — | 3 |
| Algburi et al. [31] | Renewable energy AI | R | — | ✓ | ✓ | — | 2 |
| Cho et al. [32] | Climate policy evaluation | I | — | ✓ | ✓ | — | 2 |
| Magazzino et al. [33] | Climate action evaluation | I | — | ✓ | ✓ | — | 2 |
| Villani et al. [34] | Urban digital twin sustainability | I | ✓ | ✓ | ✓ | — | 3 |
| Ghaffarian [35] | Disaster risk management | R | ✓ | ✓ | — | — | 2 |
| Sacoto-Cabrera et al. [36] | IoT–digital twin integration | R | ✓ | — | ✓ | ✓ | 3 |
| Korkmaz [37] | Resilience digital twin | I | ✓ | ✓ | ✓ | — | 3 |
| Vitanova et al. [38] | Urban climate modeling | I | ✓ | ✓ | ✓ | — | 3 |
| Burger [39] | Mobility governance | C | — | ✓ | ✓ | ✓ | 3 |
| Sharifi et al. [40] | Smart city–SDG synthesis | R | — | ✓ | — | ✓ | 2 |
Table 8.
Temporal distribution of the reference corpus by publication year. Pre-2020 sources are aggregated and are chiefly Supporting-stratum references. Cumulative percentages are rounded down.
Table 8.
Temporal distribution of the reference corpus by publication year. Pre-2020 sources are aggregated and are chiefly Supporting-stratum references. Cumulative percentages are rounded down.
| Year | Before 2020 | 2020 | 2021 | 2022 | 2023 | 2024 | 2025 | 2026 | Total |
|---|
| Studies | 10 | 3 | 4 | 2 | 5 | 7 | 39 | 6 | 76 |
| Cumul. % | 13 | 17 | 22 | 25 | 31 | 40 | 92 | 100 | — |
Table 9.
Distribution of publications by major publisher category; minor publishers are aggregated under “Others”.
Table 9.
Distribution of publications by major publisher category; minor publishers are aggregated under “Others”.
| Publisher Category | Count | Percentage | Example Venues |
|---|
| Elsevier | 16 | 21.1% | Cities, iScience, Sustainable Cities and Society |
| MDPI | 14 | 18.4% | Sustainability, Sensors, Smart Cities |
| Springer/Springer Nature | 13 | 17.1% | Nature Communications, npj Urban Sustainability, Transdisciplinary Perspectives |
| Other Academic Publishers | 27 | 35.5% | ACM, SAGE, IEEE, NeurIPS, Taylor & Francis, Frontiers, Wiley, etc. |
| Technical Reports (UN/Intl.) | 3 | 3.9% | UN SDGs, UNDRR EW4All |
| Independent/Misc. Journals | 3 | 3.9% | WJAETS, EJSMT, AJGR |
| Total | 76 | 100% | |
Table 10.
Distribution of publications by document type, from the submitted reference list.
Table 10.
Distribution of publications by document type, from the submitted reference list.
| Document Type | BibTeX Type | Count | Percentage |
|---|
| Journal Articles | @article | 65 | 85.5% |
| Conference Papers | @inproceedings | 5 | 6.6% |
| Technical Reports | @techreport | 4 | 5.3% |
| Books/Book Chapters | @book/@incollection | 2 | 2.6% |
| Total | | 76 | 100% |
Table 11.
Representative Agentic AI applications in smart mobility (SDG 11). Criteria (A/G/T/M) follow
Table 7; Type: I = Implemented, C = Conceptual, R = Review. For C and R entries, “Key Outcome” is an argued position rather than a measured result.
Table 11.
Representative Agentic AI applications in smart mobility (SDG 11). Criteria (A/G/T/M) follow
Table 7; Type: I = Implemented, C = Conceptual, R = Review. For C and R entries, “Key Outcome” is an argued position rather than a measured result.
| Study | Type | AI Paradigm | Urban Context | Key Outcome | Limitation |
|---|
| Cao et al. [27] | I | Hierarchical MARL (A,G,T,M) | Urban traffic signal control | Sustainability-oriented traffic optimization | Simulation-based; real-world validation needed |
| Khamis [42] | R | MaaS integration AI (G,T,M) | Smart transit planning | Improved modal shift equity | Limited rural applicability |
| Burger [39] | C | Agent-based governance (G,T,M) | Policy simulation | Equitable mobility archetypes | Normative framing required |
| Chong et al. [43] | I | AI policy analysis (G,T) | Southeast Asian cities | Enhanced policy alignment | Cross-context generalizability |
Table 12.
Representative urban–climate co-simulation scenarios and the planning outcomes they support.
Table 12.
Representative urban–climate co-simulation scenarios and the planning outcomes they support.
| Scenario | Simulation Focus | Planning Outcome |
|---|
| Urban Sprawl | Traffic + Emissions + Heatwaves | Identification of high-risk urban heat zones; targeted cooling intervention strategies |
| Renewable Integration | Energy Demand + Climate Variability | Optimal spatial allocation of storage assets and smart grid scheduling |
| Disaster Preparedness | Flood + Storm + Population Density | Emergency response prioritization and pre-positioned resource allocation |
| Green Infrastructure | Land Cover + Urban Temperature + Runoff | Cost-benefit ranking of nature-based adaptation interventions |
Table 13.
Inter-layer message contract for the reference architecture. Frequencies are nominal city-scale design targets; latency budgets give the interval beyond which a message is treated as stale; degradation behavior specifies the required response to a missed or late message.
Table 13.
Inter-layer message contract for the reference architecture. Frequencies are nominal city-scale design targets; latency budgets give the interval beyond which a message is treated as stale; degradation behavior specifies the required response to a missed or late message.
| Interface | Payload | Frequency | Latency Budget | Degradation Behavior |
|---|
| Sensing → Fusion | Per-modality raw records with timestamp and sensor ID | Modality-specific
(1 Hz to 15 min) | — | Modality flagged missing; imputation invoked |
| Fusion → Twin | Observation tensor with per-modality confidence | 1/min | 10 s | Twin propagates via ; confidence decays per |
| Twin → Prediction | Synchronized state | 1/min | 5 s | Last valid reused; staleness flag set |
| Prediction → Twin | Hazard probability vector over | 1/min | 20 s | Hazard surface held; forecast horizon truncated |
| Twin → Agents | Augmented state , per-agent local projection | 1/min | 5 s | Agent falls back to reactive single-step policy |
| Agent ↔ Agent | Intent declarations, bids, constraint messages (DCOP/auction) | Event-driven | 2 s | Non-responding agent excluded from round; local policy applied |
| Agents → Governance | Joint action , predicted risk, SDG contribution estimates | Per decision | 1 s | Action withheld pending human review |
| Agents → Twin | Executed joint action (feeds , Equation (1)) | Per decision | 5 s | Infrastructure partition not advanced; divergence counter incremented |
Table 14.
Mapping of the proposed framework layers to SDG 13 and SDG 11 targets and associated performance indicators.
Table 14.
Mapping of the proposed framework layers to SDG 13 and SDG 11 targets and associated performance indicators.
| Framework Layer | Primary Function | SDG 13 Contribution | SDG 11 Contribution |
|---|
| Data Acquisition | Real-time sensing and multi-source integration | City-scale climate monitoring | Infrastructure efficiency monitoring |
| Digital Twin | Scenario simulation and stress testing | Risk prediction and adaptation | Urban planning and resilience |
| Agentic AI | Autonomous goal-directed coordination | Disaster early warning | Smart mobility optimization |
| Multi-Agent Layer | Distributed resource allocation and negotiation | Emergency management | Public safety and equity |
Table 15.
Hyperparameters for the four storm-classification variants on the real SEVIR subset. ViT variants use a compact hybrid convolutional–transformer configuration matched to the 32 × 32 grid. Seeds follow the fixed list of
Section 8.5.
Table 15.
Hyperparameters for the four storm-classification variants on the real SEVIR subset. ViT variants use a compact hybrid convolutional–transformer configuration matched to the 32 × 32 grid. Seeds follow the fixed list of
Section 8.5.
| Parameter | Radar/Multimodal CNN | ViT Single/ViT Multimodal | Note |
|---|
| Input channels | 1 / 3 | 1 / 3 | radar (VIL); + IR069, IR107 (GOES-16) |
| Input grid | 32 × 32 | 32 × 32 | resampled SEVIR frames |
| Architecture | 3 conv blocks + BN | conv stem + 2–3 transformer layers | patch tokens 8 × 8 |
| Attention heads | N/A | 4 | embedding dim 128 |
| Optimizer | AdamW | AdamW | lr = 1 × 10⁻³, weight decay 10−3 |
| LR schedule | cosine anneal | cosine anneal | — |
| Batch size | 32 | 32 | — |
| Training epochs | 15 | 15 | best-validation checkpoint |
| Loss function | Cross-entropy | Cross-entropy | — |
| Random seeds | | 10 independent runs |
Table 16.
Storm-severity nowcasting across ten seeds on the real SEVIR test events (fifty aligned events, event-level split, one-hundred-minute lead). Macro-F1 and accuracy are mean ± SD; severe recall and ECE (expected calibration error, lower is better) are means over seeds. p-values are Holm-corrected Wilcoxon signed-rank against the proposed variant. Persistence is a deterministic no-change reference floor (ECE undefined). Bold marks the best trained variant per column.
Table 16.
Storm-severity nowcasting across ten seeds on the real SEVIR test events (fifty aligned events, event-level split, one-hundred-minute lead). Macro-F1 and accuracy are mean ± SD; severe recall and ECE (expected calibration error, lower is better) are means over seeds. p-values are Holm-corrected Wilcoxon signed-rank against the proposed variant. Persistence is a deterministic no-change reference floor (ECE undefined). Bold marks the best trained variant per column.
| Model | Modality | Macro-F1 | Accuracy | Severe Recall | ECE | p |
|---|
| Radar CNN (baseline) | Radar | | | | | 0.029 |
| Multimodal CNN (fusion) | Multimodal | | | | | 0.074 |
| ViT Single (radar only) | Radar | | | | | 0.160 |
| ViT Multimodal (proposed) | Multimodal | 0.692 ± 0.077 | 0.762 ± 0.045 | | | — |
| Persistence (no-change) | reference | | | | — | — |
Table 17.
Comparison of representative studies on Agentic AI for sustainable, climate-resilient cities. Criteria follow
Table 7; Type: I = Implemented, C = Conceptual, R = Review. For R and C entries, reported outcomes are argued positions rather than measured results.
Table 17.
Comparison of representative studies on Agentic AI for sustainable, climate-resilient cities. Criteria follow
Table 7; Type: I = Implemented, C = Conceptual, R = Review. For R and C entries, reported outcomes are argued positions rather than measured results.
| Study | Type | AI Paradigm | Digital Twin | Domain | Strength | Limitation |
|---|
| Lee et al. [11] | R | Agentic AI survey | Partial | Sustainability architectures | Comprehensive architecture taxonomy | Survey; no experimental validation |
| Yang et al. [28] | I | Agent-based DT (A,G,T) | Yes | Infrastructure planning | SDG 11 target alignment | High infrastructure cost |
| Tiggeloven et al. [30] | R | Deep learning EWS (G,T) | No | Climate early warning | Broad status assessment | Limited interpretability; not an implemented system |
| White et al. [29] | I | DT citizen platform (G,T) | Yes | Citizen engagement | Participatory DT governance | Limited autonomous decision-making |
| Algburi et al. [31] | R | Energy-AI review (G,T) | No | Renewable energy adoption | Broad policy and technology coverage | Review; no empirical system |
| Cho et al. [32] | I | AI policy model (G,T) | Partial | Climate policy evaluation | SDG interlinkage mapping | Causal inference limitations |
Table 18.
Research gaps and future opportunities in Agentic AI for urban sustainability and climate resilience.
Table 18.
Research gaps and future opportunities in Agentic AI for urban sustainability and climate resilience.
| Research Area | Identified Gap | Future Opportunity |
|---|
| Smart Mobility | Isolated domain optimization models | Integrated multi-agent orchestration across transport modes |
| Climate Forecasting | Limited policy feedback linkage | AI-driven policy simulation with causal inference |
| Digital Twins | High infrastructure and data cost | Scalable federated cloud-based twin architectures |
| Urban Governance | Absence of operational ethical AI frameworks | Responsible AI governance with participatory design |
| Cross-domain AI | Fragmented single-domain deployments | Unified urban intelligence platforms spanning multiple SDGs |
| Equity and Access | AI concentrated in high-income cities | Lightweight architectures for resource-constrained regions |
| Evaluation Practice | Incommensurable baselines and metrics | Shared benchmarks for constrained urban optimization |
Table 19.
Structured comparison with prior reviews across the four adjacent literatures, along six dimensions: agentic criteria, digital twins (DT), multi-agent coordination (MAS), SDG framing, documented protocol with inter-rater agreement (), and an empirical component. ✓ = present; ∼ = partial; ✕ = absent.
Table 19.
Structured comparison with prior reviews across the four adjacent literatures, along six dimensions: agentic criteria, digital twins (DT), multi-agent coordination (MAS), SDG framing, documented protocol with inter-rater agreement (), and an empirical component. ✓ = present; ∼ = partial; ✕ = absent.
| Review | Year | Primary Scope | Agentic Criteria | DT | MAS | SDG Framing | Protocol + | Empirical |
|---|
| Vinuesa et al. [9] | 2020 | AI across all 17 SDGs | ✕ | ✕ | ✕ | ✓ | ∼ | ✕ |
| Rolnick et al. [2] | 2022 | ML for climate change | ✕ | ∼ | ∼ | ∼ | ✕ | ✕ |
| Yigitcanlar et al. [74] | 2019 | Smart city sustainability | ✕ | ✕ | ✕ | ∼ | ✓ | ✕ |
| Shahat et al. [75] | 2021 | City digital twins | ✕ | ✓ | ✕ | ✕ | ∼ | ✕ |
| Sharifi et al. [40] | 2024 | Smart cities and SDGs | ✕ | ✕ | ∼ | ✓ | ✓ | ✕ |
| Sacoto-Cabrera et al. [36] | 2025 | IoT, AI, DT in smart cities | ✕ | ✓ | ∼ | ✕ | ✓ | ✕ |
| Huzzat et al. [63] | 2025 | DT technologies in cities | ✕ | ✓ | ✕ | ✕ | ∼ | ✕ |
| Zhou et al. [76] | 2025 | MAS in land-use planning | ∼ | ∼ | ✓ | ∼ | ∼ | ✕ |
| Lee and Park [11] | 2026 | Agentic AI architectures | ∼ | ∼ | ✓ | ∼ | ✕ | ✕ |
| This review | 2026 | Agentic AI for SDG 11 + 13 | ✓ | ✓ | ✓ | ✓ | ✓ | ∼ |





 ,
,