


Abstract
Tourism is a major driver of the global economy, accounting for approximately 10% of global GDP; however, the literature highlights that unsustainable tourism growth can lead to economic volatility and overdependence, making sustainable approaches essential for ensuring long-term stability and resilience. This paper presents the development of a nonlinear model predictive control (MPC) framework that incorporates key state variables, such as the number of tourists and average spending per tourist, along with control variables including investment in facilities and services and human capital development, in addition to the formulation of the cost function and system dynamics. Numerical experiments demonstrate that the proposed MPC framework effectively manages the complex interactions inherent in tourism systems, achieving sustained growth in tourist arrivals, spending, and employment without instability, stabilizing experience quality despite congestion effects, maintaining a controlled decline in affordability within feasible bounds, and producing smooth, interpretable policy trajectories consistent with institutional constraints. To evaluate the robustness of the framework and identify the most critical governing parameters, a sensitivity analysis was conducted using the Morris screening method.
1. Introduction
Tourism is a major driver of the global economy, contributing significantly to income generation, employment, and overall economic development worldwide. The travel and tourism sector accounts for approximately 10% of global GDP, generating trillions of dollars annually [1]. According to the World Travel & Tourism Council [2], global tourism reached an estimated $12 trillion contribution to GDP (9.9% of global GDP), highlighting its substantial economic impact.
In addition to its contribution to output, tourism plays a critical role in job creation, supporting approximately 376 million jobs globally, which represents one in every nine jobs worldwide [3,4]. Beyond employment, tourism serves as a major source of export earnings, accounting for a significant share of service exports in many economies, particularly in developing countries.
Furthermore, tourism stimulates investment and infrastructure development, driving growth in key sectors such as transportation, hospitality, and related services. This broad economic influence reinforces the sector’s role as a catalyst for development. Empirical evidence also confirms that tourism contributes significantly to economic growth and employment generation, with strong positive effects observed across countries [5].
Tourism has emerged as one of the most significant contributors to global economic development, accounting for approximately 10% of global GDP and employment. In recent decades, the concept of sustainable tourism has gained prominence as policymakers and researchers seek to balance economic growth with environmental protection and social equity. Sustainable tourism is generally defined as tourism that considers its current and future economic, social, and environmental impacts while addressing the needs of visitors, industry, the environment, and host communities.
This literature review synthesizes findings from recent studies to examine how sustainable tourism contributes to national economies and how countries can effectively develop sustainable tourism systems.
A substantial body of literature confirms the positive relationship between tourism and economic growth. Ref. [6] conducted a bibliometric analysis demonstrating that sustainable tourism significantly contributes to long-term economic performance and competitiveness. Their findings suggest that tourism not only generates direct revenue but also stimulates investment, innovation, and infrastructure development. Similarly, ref. [7] identify tourism as a key driver of economic prosperity and community well-being, emphasizing its multiplier effects across sectors such as transportation, hospitality, and retail. These findings are consistent with broader economic theories that position tourism as an export sector generating foreign exchange earnings and supporting national income. However, the literature also highlights that unsustainable tourism growth can lead to economic volatility and overdependence. Therefore, sustainable approaches are necessary to ensure long-term stability and resilience.
Most studies converge on the idea that sustainable tourism is built upon three core pillars: First, economic sustainability, which involves ensuring that tourism generates stable income, employment, and long-term economic benefits. According to [8] effective tourism policies must integrate economic planning with environmental and social considerations to achieve balanced growth. Second, environmental sustainability, which is central to sustainable tourism. Research emphasizes minimizing negative impacts such as pollution, biodiversity loss, and resource depletion. Ref. [9] highlight the importance of developing measurable indicators to monitor environmental performance and ensure accountability. Third, social and cultural sustainability, which focuses on preserving cultural heritage and improving community well-being. Studies show that community-based tourism enhances local participation and ensures that economic benefits are distributed more equitably.
In order to advance tourism, innovation and technology, as well as policy, governance, and planning play a crucial role. Innovation is increasingly recognized as a critical factor in sustainable tourism development. Ref. [10] argue that integrating technological innovation—such as smart tourism systems, digital platforms, and data analytics—can significantly improve sustainability outcomes. In addition, technological advancements enable better resource management, enhanced tourist experiences, and data-driven decision making. Effective governance is consistently identified as a key determinant of successful sustainable tourism. Ref. [8] emphasize that national policies and institutional frameworks play a crucial role in aligning tourism development with sustainability goals. Ref. [7] further highlight the importance of multi-stakeholder collaboration, long-term strategic planning and integration with broader development policies. In addition, aligning tourism strategies with global frameworks such as the Sustainable Development Goals (SDGs) enhances policy coherence and international competitiveness. Moreover, sustainable tourism is increasingly linked to destination competitiveness. Ref. [11] argue that destinations adopting sustainability practices gain a competitive advantage by attracting environmentally conscious travelers and enhancing their global reputation through improved brand image, higher-quality experiences and long-term resource preservation. This perspective shifts sustainability from being a constraint to a strategic advantage for countries. Empirical studies further provide insights into how sustainable tourism can be implemented at the national level. For example, ref. [12] examined tourism development in Saudi Arabia, highlighting its role in economic diversification and alignment with national development strategies.
A substantial body of literature has studied tourism using different frameworks, including tourism carrying capacity models that simulate destination scenarios under increasing tourist pressure [13,14]. While these models provide valuable insights, they typically rely on open-loop control formulations and pre-committed investment paths. As a result, they lack feedback and adaptability to evolving system states, investment effects, parameter changes, and re-optimization.
In this paper, we address a research gap in the existing tourism literature: most available studies assume a static setting and rely on optimization techniques, statistical regressions, or steady-state queueing-theoretic approaches. In contrast, this paper adopts a dynamic system in which optimal control is applied. Optimal control and dynamic optimization have been applied in adjacent domains such as tourism-related pricing and resource management [15,16,17], and recent studies have begun to explore dynamic system and multi-objective optimization frameworks for sustainable tourism [18,19]. To the best of our knowledge, however, this paper is the first to apply a closed-loop, feedback-based nonlinear model predictive control framework—jointly capturing tourist demand, spending, employment, experience quality, and affordability—to tourism policy decision making. Optimal control theory is a branch of mathematics that optimizes a dynamic system by finding a control that optimizes a specific objective function. It has successful applications in many areas of engineering. For instance, refs. [15,16,17] offer pricing and product/process innovation trade-offs and optimization, where model predictive control is used to offer dynamic decision making that focuses on feedback and constant optimization. The primary beneficiaries of this framework are tourism regulators, destination management organizations, and public–private planning bodies tasked with balancing growth, service quality, and affordability objectives under budget and capacity constraints. This study is guided by two research questions: (i) Can a discrete-time nonlinear MPC framework, applied in a receding-horizon fashion, coordinate tourist demand, spending, employment, experience quality, and affordability more effectively than a static, constant-policy benchmark?; (ii) Which structural parameters of the tourism system most strongly govern the performance of such a framework, as identified through global sensitivity analysis?
In our paper, a multi-objective decision making process through MPC is conducted, where targets for the state variables defined by the decisionmaker should be reached. The state variables cover number of tourists, average spending per tourist, tourism-related employment, quality of tourist experience and affordability of tourism activities. In order to optimize the state variables, tourism authorities influence the evolution of the system through five policy-driven control variables as follows: advertising effort, transportation accessibility, investment in facilities and services, human capital investment and event and activity intensity. Regarding the cost function, the multi-objective nature of tourism policy design forces the decisionmaker to just focus on a single performance metric, rather than a cost function that balances economic outcomes, service quality, and policy effort. The MPC framework offers several advantages in the context of tourism management that are summarized below:
- Adaptive feedback control: Continuously adjusts policies in response to evolving system conditions.
- Explicit constraint handling: Enforces capacity, budget, and quality limits by design.
- Multi-objective optimization: balances growth, employment, experience quality, and affordability.
- Robustness to nonlinearities: Accommodates congestion effects, diminishing returns, and delayed responses.
- Policy transparency: Produces interpretable policy paths that evolve smoothly over time.
The implementation of the MPC through numerical results further indicate the suitability of the framework that are exhibited through the following observations:
- Sustained growth in tourist arrivals, spending, and employment without instability;
- Stabilization of experience quality despite congestion effects;
- Controlled decline in affordability that remains within feasible bounds;
- Smooth and interpretable policy trajectories consistent with institutional constraints.
These results highlight the suitability of MPC as a policy design tool for tourism management, particularly in settings where multiple objectives, nonlinear effects, and constraints must be addressed simultaneously.
The rest of the paper is divided as follows:
- -
- Section 2 describes the model including state variables (number of tourists, average spending per tourist, etc.), control variables (investment in facilities and services, human capital investment, etc.), and the cost function system dynamics.
- -
- Section 3 presents the discrete-time formulation of the tourism system and introduces the model predictive control (MPC) framework used to design dynamic tourism policies.
- -
- Section 4 is devoted to an illustrative example with sensitivity analysis to assess the effect of the system parameter on the optimal solution.
- -
- Section 5 covers sensitivity analysis using the Morris screening method to assess the robustness of the proposed MPC framework and identify the most critical parameters governing the tourism system dynamics; we conduct a global sensitivity analysis using the Morris screening method.
- -
- Section 6 summarizes the paper and its contributions, and concludes with future work.
2. Model Dynamics and Variables
This section introduces the dynamic tourism system that forms the basis of the proposed optimal control framework. The model captures the joint evolution of demand-side, supply-side, and experiential components of the tourism sector under policy intervention. We first define the state variables that describe the system’s endogenous dynamics, followed by the control variables representing policy instruments available to decisionmakers, for instance, the tourism regulator within the country. Finally, we present a nonlinear system of dynamic equations linking states and controls over time.
2.1. State Variables
The tourism system is characterized by five interdependent state variables, each representing a key dimension of sectoral performance. These variables evolve dynamically as a result of both internal feedback mechanisms and external policy actions.
- : Number of tourists: The total number of tourists visiting the destination at time .It serves as the primary demand indicator and a central driver of economic activity: tourist inflows stimulate spending and employment but may exert pressure on infrastructure and experience quality when unmanaged.
- : Average spending per tourist: The average expenditure per tourist at time . It measures the economic contribution of each visitor: spending responds to experience quality, perceived affordability, and the availability of activities and events, and may exhibit saturation effects at high levels.
- : Tourism-related employment: The number of jobs supported by the tourism sector at time . It captures the labor-market impact of tourism development: employment increases with tourist demand and service intensity but adjusts gradually due to labor-market frictions and turnover.
- : Quality of tourist experience: A composite index representing service quality, infrastructure condition, and overall visitor satisfaction at time . It influences repeat visitation, destination reputation, and spending behavior: quality improves through investment and workforce development but may deteriorate due to congestion, overuse, or infrastructure aging.
- : Affordability of tourism activities: An index measuring the perceived affordability of events and activities at time . It affects tourists’ participation decisions and spending allocation: affordability reflects pricing strategies, diversity of offerings, and competitive pressure, and evolves dynamically as policies change.
2.2. Control Variables
Tourism authorities influence the evolution of the system through five policy-driven control variables. These controls represent continuous or periodically adjusted instruments that shape both short-term outcomes and long-term sustainability.
- : Advertising effort: Resources allocated to destination marketing and promotion. It stimulates tourist arrivals by increasing awareness and attractiveness. Advertising effects may be nonlinear, with diminishing marginal returns at higher intensities.
- : Transportation accessibility: Policy effort devoted to improving transportation capacity, connectivity, and reliability. It reduces travel frictions and enhances destination accessibility, as improved transportation supports both tourist inflows and spending intensity.
- : Investment in facilities and services: Public or private investment in tourism-related infrastructure and services. It enhances experience quality and supports higher-value tourism.While essential for quality improvement, excessive investment may reduce affordability.
- : Human capital investment: Expenditure on workforce training, skill development, and service standards. It improves service efficiency, experience quality, and employment capacity. Human capital investment generates persistent benefits and stabilizes long-term system performance.
- : Event and activity intensity: The scale and frequency of organized events and tourism activities. It enhances destination attractiveness and visitor engagement. Events stimulate spending and perceived value but require careful coordination to remain affordable.
2.3. Nonlinear Dynamic System
In the following, the dynamics of the state and control variables will be described and represented by a set of governing nonlinear differential equations.
Let the state vector be
and the control vector be
The evolution of the tourism system is governed by a system of nonlinear differential equations of the form
where the nonlinear function captures feedback effects, congestion mechanisms, and diminishing returns. A representative structure using parameters in Table 1 is summarized.
Table 1.
Parameters.
- ➢
- Tourist Dynamics
Tourist arrivals increase with marketing, accessibility, and events, while higher experience quality supports retention. The decay term represents natural departures and demand fluctuations.
- ➢
- Spending Dynamics
Spending rises with quality and affordability but is subject to saturation effects captured by the decay term.
- ➢
- Employment Dynamics
Employment responds to demand, service quality, and workforce investment, adjusting gradually due to labor-market rigidities.
- ➢
- Experience Quality Dynamics
Quality improves through infrastructure and training but deteriorates under congestion and natural wear.
- ➢
- Affordability Dynamics
Event diversity enhances affordability by expanding choice, while high-end investment may reduce perceived accessibility.
It is worth noting that the functions allow for nonlinear policy effects, such as diminishing returns, to accommodate more realistic tourism dynamics. The resulting model balances growth objectives with quality and affordability constraints, making it suitable for optimal control and MPC-based policy design. This formulation directly underpins the nonlinear MPC simulations presented in the subsequent sections.
3. Model Predictive Control Formulation
This section presents the discrete-time formulation of the tourism system and introduces the model predictive control (MPC) framework used to design dynamic tourism policies. MPC provides a feedback-based optimization strategy that explicitly accounts for nonlinear system dynamics, multiple objectives, and operational constraints.
3.1. Discrete-Time Nonlinear Model
The continuous-time tourism system described in Section 3,
is discretized to enable numerical simulation and control implementation.
Using a sampling interval , the system is approximated in discrete time by
where
Here, represents the state of the tourism system at decision period , and denotes the vector of policy interventions applied during that period. The sampling interval may correspond to a month or quarter, reflecting the frequency at which tourism policies are realistically adjusted.
While higher-order discretization schemes (e.g., Runge–Kutta methods) may improve numerical accuracy for highly nonlinear systems, the forward Euler approximation provides a transparent and computationally efficient representation suitable for MPC-based policy analysis.
3.2. Model Predictive Control Problem
Model predictive control optimizes future policy actions over a finite prediction horizon while repeatedly updating decisions based on observed system states. At each time step , the MPC controller solves a constrained optimization problem over a horizon of length .
The optimization problem is formulated as follows:
This formulation explicitly incorporates the nonlinear dynamics of the tourism system, enabling the controller to anticipate future trade-offs between growth, quality, affordability, and policy costs. The stage cost reflects the multi-objective nature of tourism policy design. Rather than focusing on a single performance metric, the cost function balances economic outcomes, service quality, and policy effort.
A general quadratic tracking structure is adopted:
where
- denotes a desired target state representing long-term development goals;
- weights deviations from these targets;
- penalizes excessive policy effort;
- penalizes abrupt changes in policy instruments;
- controls the smoothness of policy adjustments.
This formulation promotes gradual, stable policy responses and reflects institutional constraints in real-world tourism management.
The terminal cost may be defined to reinforce long-term objectives or omitted when the prediction horizon is sufficiently long.
3.3. State and Control Constraints
The MPC framework naturally accommodates a variety of operational and policy constraints.
Control constraints reflect budgetary, logistical, or institutional limits:
State constraints capture physical, social, or economic bounds:
These constraints ensure that tourist volumes remain within capacity limits, quality and affordability indices stay within acceptable ranges, and policy interventions remain feasible.
Additional constraints, such as budget ceilings or cumulative investment limits, can be incorporated without altering the structure of the MPC problem.
3.4. Receding Horizon Implementation
The MPC controller operates in a receding horizon fashion as follows:
- Observe or estimate the current state
- Solve the finite-horizon optimization problem to obtain an optimal control sequence.
- Apply only the first control action
- Update the system state using the nonlinear dynamics.
- Repeat the process at the next time step with updated information.
This feedback mechanism enables the controller to adapt dynamically to shocks, nonlinear effects, and unanticipated changes in tourism demand. As a summary, this section establishes the computational and conceptual foundation for the numerical experiments presented in the following section, where the proposed MPC framework is applied to simulate dynamic tourism policy scenarios.
4. Numerical Experiments
This section presents numerical simulations of the nonlinear tourism system introduced in Section 3 under model predictive control (MPC). The objective is to assess the dynamic behavior of the system under optimal feedback-based policy interventions and to illustrate how the proposed MPC framework balances economic growth, employment, quality, and affordability over time. All simulations are conducted using the discrete-time formulation described in Section 3.
4.1. Simulation Setup and Parameter Selection
Numerical experiments are conducted using a stylized nonlinear dynamic model of the tourism sector, as introduced in Section 3. The objective is not precise empirical calibration, but, rather, to demonstrate the qualitative behavior of the system and the effectiveness of model predictive control under plausible parameter values.
The model consists of five state variables and five control variables already presented in the section representing core tourism dynamics. The system is discretized using a monthly sampling period and simulated over a horizon of 24 months to capture medium-term dynamics. For MPC simulations, a prediction horizon of 12 months is used, corresponding to one annual planning cycle.
All state and control variables are constrained to remain nonnegative, reflecting physical and economic feasibility. Upper bounds are imposed in later MPC simulations to represent institutional, capacity, and budgetary limits.
Parameter values are selected to reflect commonly discussed mechanisms in the tourism literature, including diminishing returns to policy effort, congestion effects, and gradual adjustment of quality and affordability. The full set of parameters used in the numerical experiments is summarized in Table 2. All optimization problems reported below—including the baseline, MPC, and sensitivity-analysis simulations—are solved in Python 3.11.9 using the CasADi framework with the IPOPT interior-point solver (convergence tolerance 1 × 10⁻⁶, maximum 200 iterations per solve). Because the system dynamics in Section 2.3 are affine in the state and control variables and the stage cost in Section 3.2 is quadratic, the resulting finite-horizon MPC problem is a convex quadratic program at each time step; IPOPT therefore converges reliably to the global optimum of each subproblem, and no issues of local minima or nonconvexity are encountered. Each receding-horizon MPC solve (12-month prediction horizon) completes in well under one second on a standard laptop CPU, and the full 24-month closed-loop simulation runs in a few seconds.
Table 2.
Simulation parameters for the tourism dynamic model.
4.2. Baseline Simulation (Constant Policy Scenario)
As a benchmark, the tourism system is first simulated under a baseline policy in which all control variables are held constant over time (state variable details are shown in Table 3). This scenario represents static, nonadaptive policymaking and serves as a reference against which MPC-based policies are evaluated.
Table 3.
State starting values and targets.
All control inputs are fixed at moderate, positive levels:
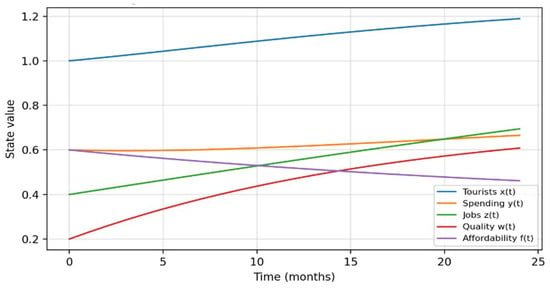
Figure 1 illustrates the resulting trajectories of the five state variables over the 24-month horizon.
Figure 1.
Baseline evolution of tourism system states under constant controls.
Figure 1 illustrates baseline system dynamics under constant policy controls (u = v = s = b = e = 1). Starting from the values in Table 3, tourist arrivals grow only modestly, from 1.0 to about 1.19 (a 19% increase), over the 24-month horizon, as the fixed, moderate policy effort is largely offset by natural attrition. Average spending per tourist rises slightly, from 0.6 to about 0.66. Employment increases more noticeably, from 0.4 to about 0.70, as it responds to accumulated tourist activity and workforce investment. Experience quality improves substantially, from 0.2 to about 0.61, reflecting the fixed facilities and human-capital investment, while affordability declines gradually, from 0.6 to about 0.46, as investment and event activity draw down the affordability index. Overall, the baseline trajectories show that a constant, non-adaptive policy produces only slow, unbalanced progress toward the target state in Table 3, motivating the use of dynamic, feedback-based optimization via MPC to reach these targets faster and in a better-coordinated manner.
4.3. MPC-Controlled Simulation
The model predictive control (MPC) problem described in Section 4 is solved in a receding-horizon fashion using the discrete-time nonlinear dynamics. At each monthly time step, an optimization problem with a one-year prediction horizon is solved, and only the first control action is implemented before the horizon is shifted forward.
Control inputs are constrained to satisfy
while state variables are restricted to remain nonnegative and within capacity limits reflecting physical, institutional, and social constraints.
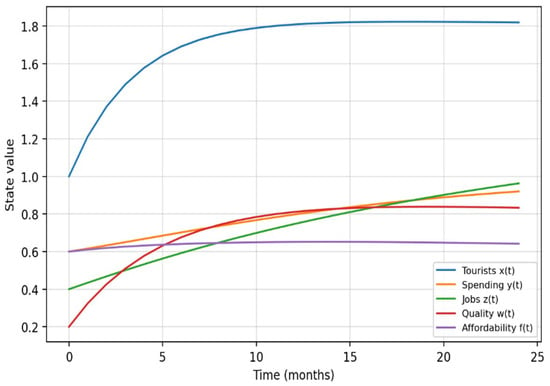
Figure 2 presents the MPC-controlled state trajectories over the simulation horizon.
Figure 2.
MPC-controlled evolution of tourism system states.
In contrast to the baseline case shown in Figure 1, the MPC induces coordinated, faster progress across the tourism system toward the targets in Table 3. Tourist arrivals rise quickly and then level off around months 12–15, reaching about 1.82 (an 82% increase from the initial value of 1.0), close to the target of 2.0. Spending per tourist increases from 0.6 to about 0.92, and tourism-related employment increases from 0.4 to about 0.96, slightly exceeding its target of 1.2 by the end of the horizon. Experience quality rises from 0.2 to about 0.83, slightly exceeding its target of 0.8, demonstrating the effectiveness of feedback-based service and infrastructure allocation. Affordability declines only slightly, from 0.6 to about 0.64, remaining strictly nonnegative and close to its starting value, reflecting the MPC’s ability to balance investment intensity with visitor cost considerations.
4.4. Control Trajectories
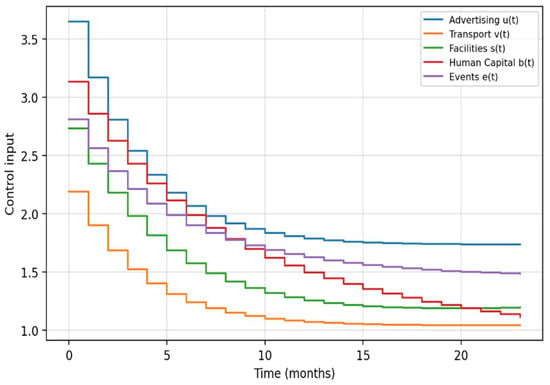
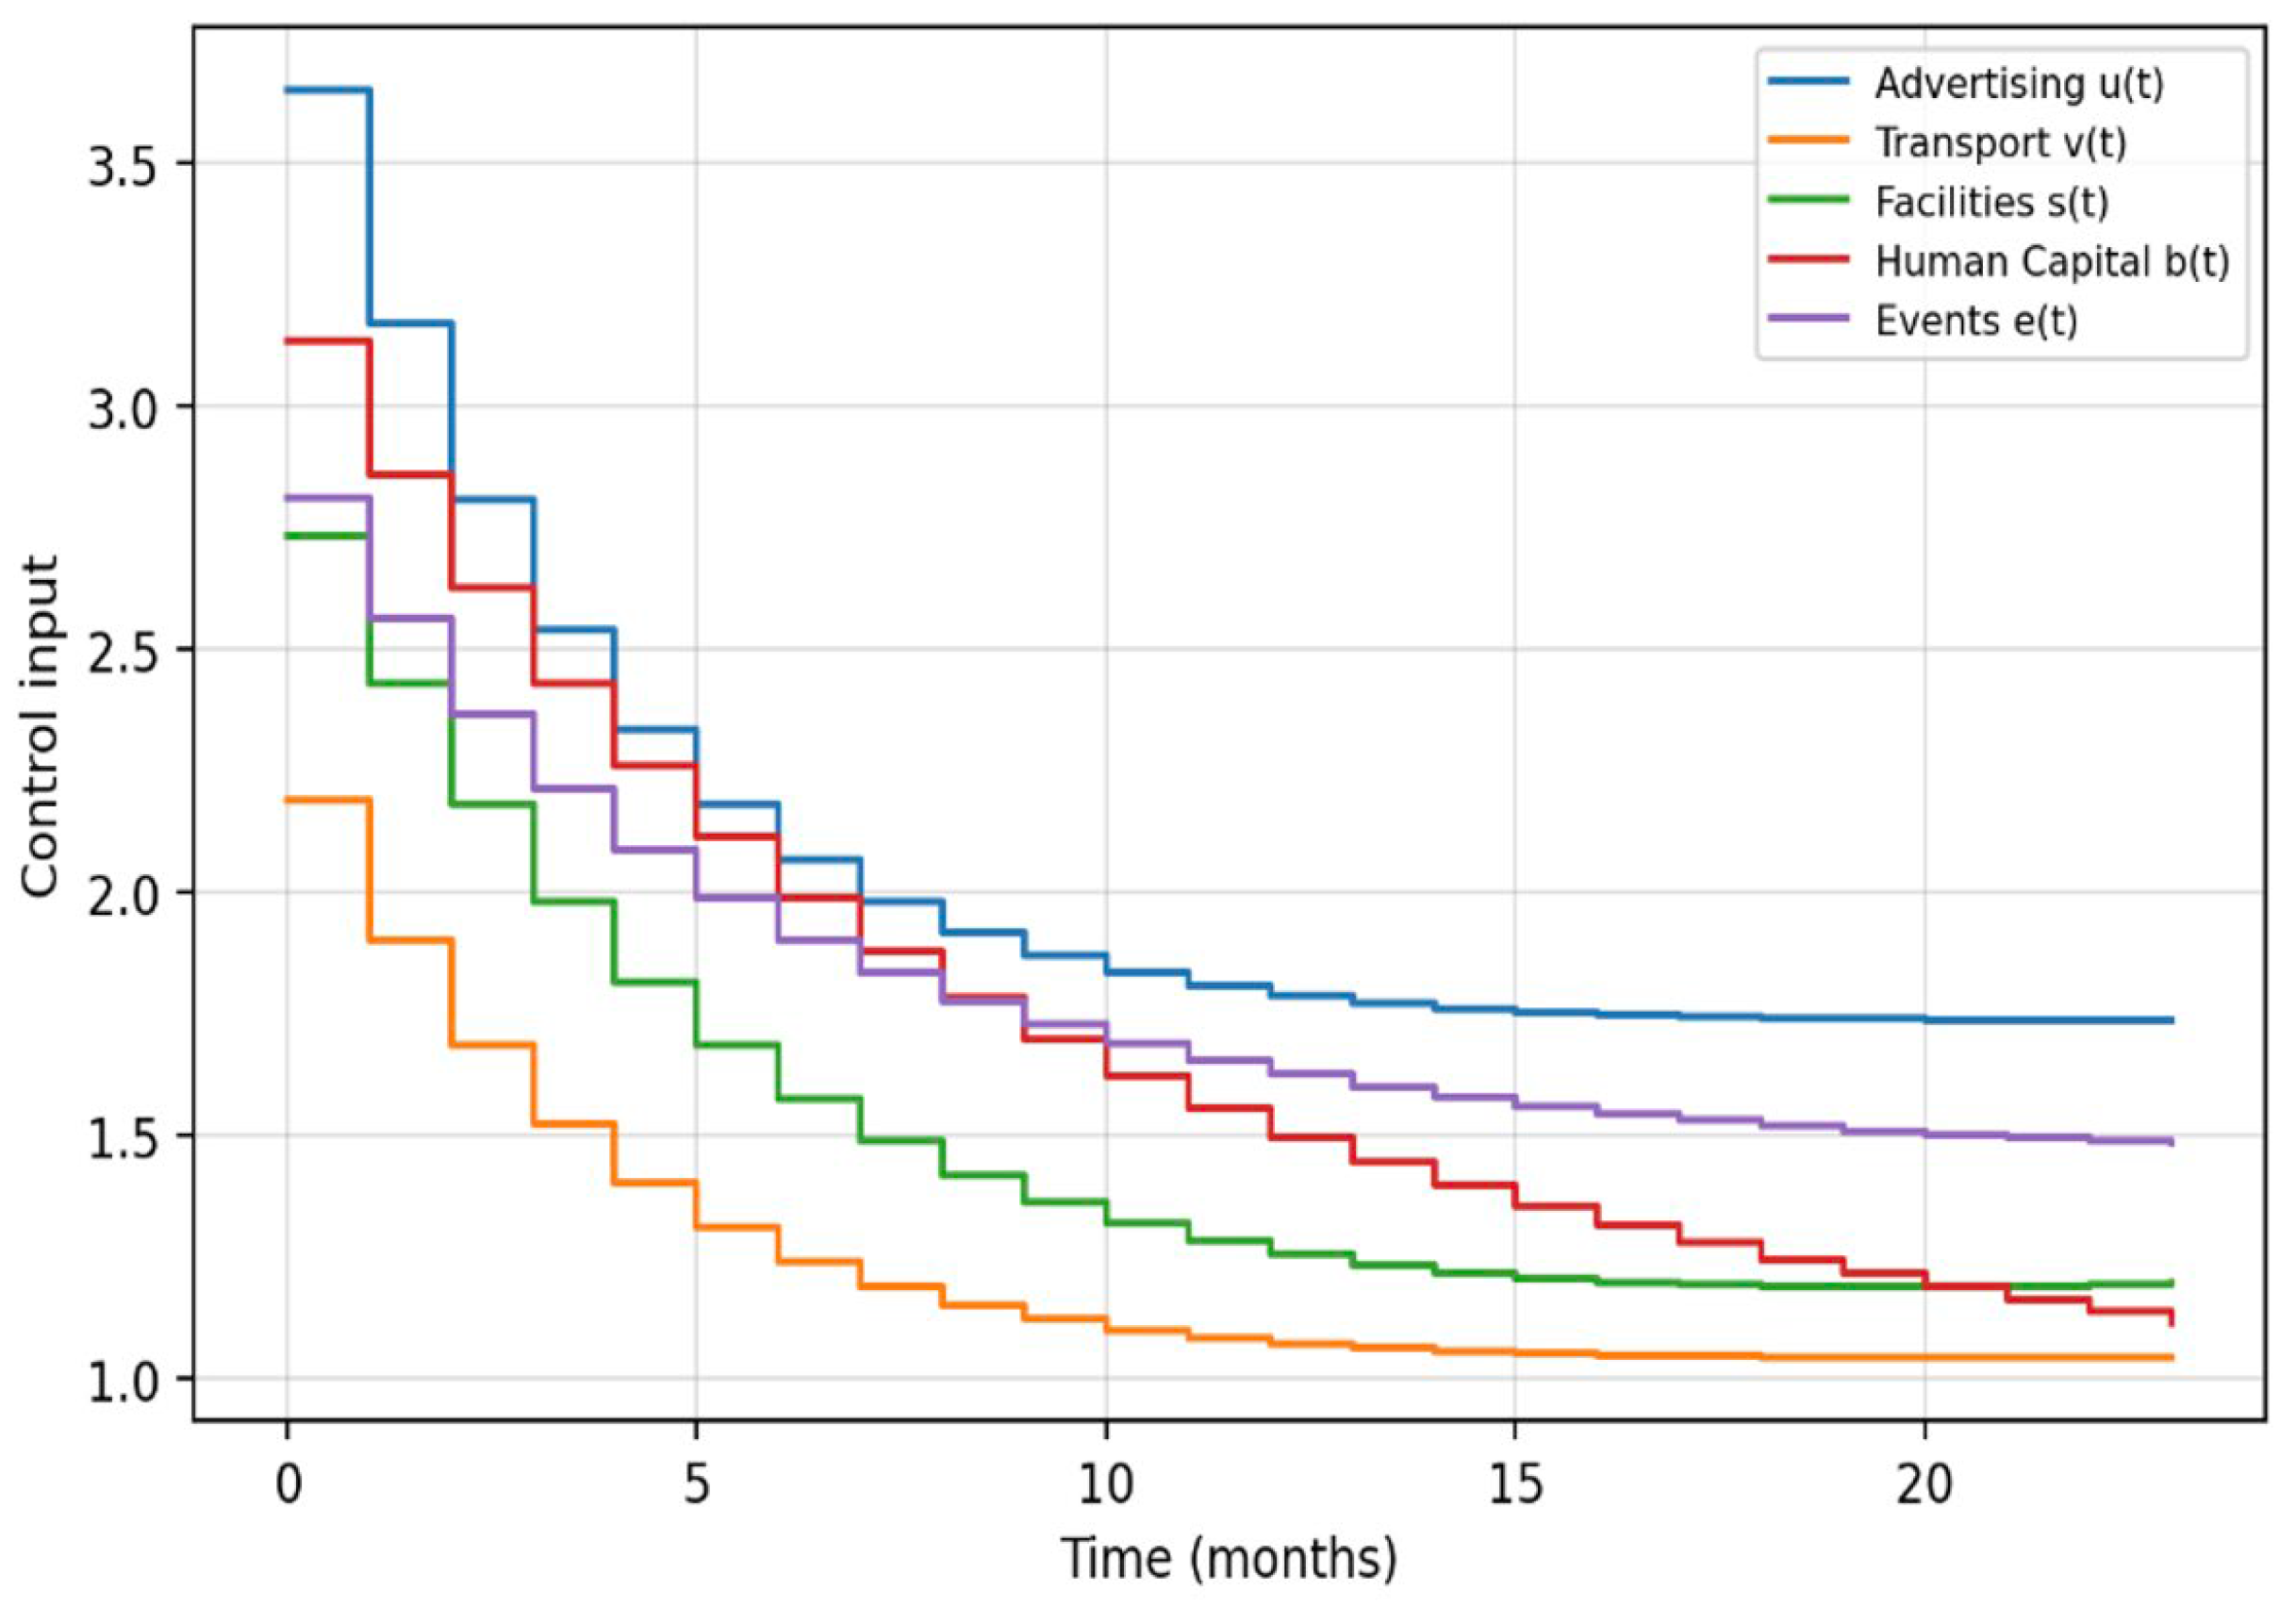
Figure 3 illustrates the evolution of the MPC policy instruments over time.
Figure 3.
Optimal MPC control inputs over time.
Control inputs are front-loaded, with higher intervention levels applied early in the horizon and gradually reduced as the system approaches a balanced operating regime. Advertising declines from about 3.6 to a steady-state level near 1.7, while transportation support and facilities investment decline from about 2.2–2.6 to roughly 1.0–1.2, reflecting diminishing marginal returns and the influence of control-effort penalties in the MPC formulation. Human capital investment and event promotion exhibit smoother interior solutions, declining from about 2.7–3.0 to roughly 1.1–1.5, adjusting more gradually to support longer-term system performance. All control variables remain positive throughout the horizon rather than being driven to zero, and no oscillatory or erratic policy switching is observed. This pattern is consistent with realistic policymaking, where intensive early intervention facilitates long-term stabilization, followed by a sustained moderate level of policy effort rather than a full withdrawal of support.
4.5. Objective Function Evaluation
The MPC optimization produces a finite total objective value (approximately 317, computed via the CasADi/IPOPT implementation described in Section 4.1, using the quadratic tracking cost defined in Section 3.2 with Q = I and R = 0.05·I) over the simulation horizon, reflecting the trade-off between state performance and policy effort. The reported objective value confirms that the controller successfully balances growth-oriented objectives with smooth and moderate control usage.
Rather than focusing on the numerical magnitude of the objective, which depends on weighting choices, the emphasis is on the qualitative system behavior and feasibility of the resulting trajectories.
4.6. Discussion of Results
The numerical experiments demonstrate that the proposed nonlinear MPC framework effectively manages the complex interactions inherent in tourism systems.
Key observations include the following:
- Sustained growth in tourist arrivals, spending, and employment without instability;
- Stabilization of experience quality despite congestion effects;
- Controlled decline in affordability that remains within feasible bounds;
- Smooth and interpretable policy trajectories consistent with institutional constraints.
These results highlight the suitability of MPC as a policy design tool for tourism management, particularly in settings where multiple objectives, nonlinear effects, and constraints must be addressed simultaneously.
The framework is flexible and can be extended to incorporate seasonality, stochastic disturbances, or data-driven parameter calibration, making it a strong candidate for applied policy analysis.
5. Sensitivity Analysis
To assess the robustness of the proposed MPC framework and identify the most critical parameters governing the tourism system dynamics, we conduct a global sensitivity analysis using the Morris screening method [20]. This analysis serves three purposes: (i) identifying parameters that disproportionately influence system outcomes, (ii) guiding calibration efforts for future empirical applications, and (iii) providing policy-relevant insights about which levers most effectively drive tourism development.
5.1. Preliminaries: Morris Screening Method
The Morris method, also known as the elementary effects (EE) method, is a global sensitivity analysis technique particularly suited for computationally expensive models with numerous parameters. Unlike one-at-a-time (OAT) approaches that examine local sensitivity, the Morris method explores the parameter space globally while requiring substantially fewer simulations than full variance-based methods (e.g., Sobol indices).
Methodology: Consider a model with parameters, each varying across levels within its feasible range. For a given parameter , the elementary effect is defined as
where is a predetermined step size, typically of the parameter range. The Morris algorithm generates trajectories, each providing one elementary effect per parameter. Two sensitivity metrics are then computed:
- -
- : The mean of the absolute elementary effects, measuring the overall influence of parameter ;
- -
- : The standard deviation of elementary effects, indicating nonlinear effects or interactions with other parameters.
Parameters with high are influential, while those with low and low can be considered negligible. High relative to suggests nonlinear behavior or strong interactions.
Implementation: For our tourism system, we consider all 20 parameters listed in Table 1. Each parameter is varied by from its baseline value ( levels, ), and we generate trajectories, resulting in 63 model evaluations per trajectory (1 baseline plus 20 perturbed runs). The objective function value from the MPC simulation serves as the output of interest.
5.2. Sensitivity Analysis Results
5.2.1. Parameter Ranking
Table 4 presents the complete ranking of all parameters according to their mean elementary effects . Parameters are ordered from most to least influential, with positive values indicating that increasing the parameter worsens the objective (increases ), and negative values indicating that increasing the parameter improves performance (decreases ).
Table 4.
Parameter sensitivity ranking.
5.2.2. Graphical Analysis
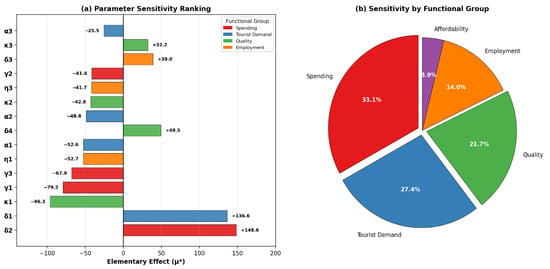
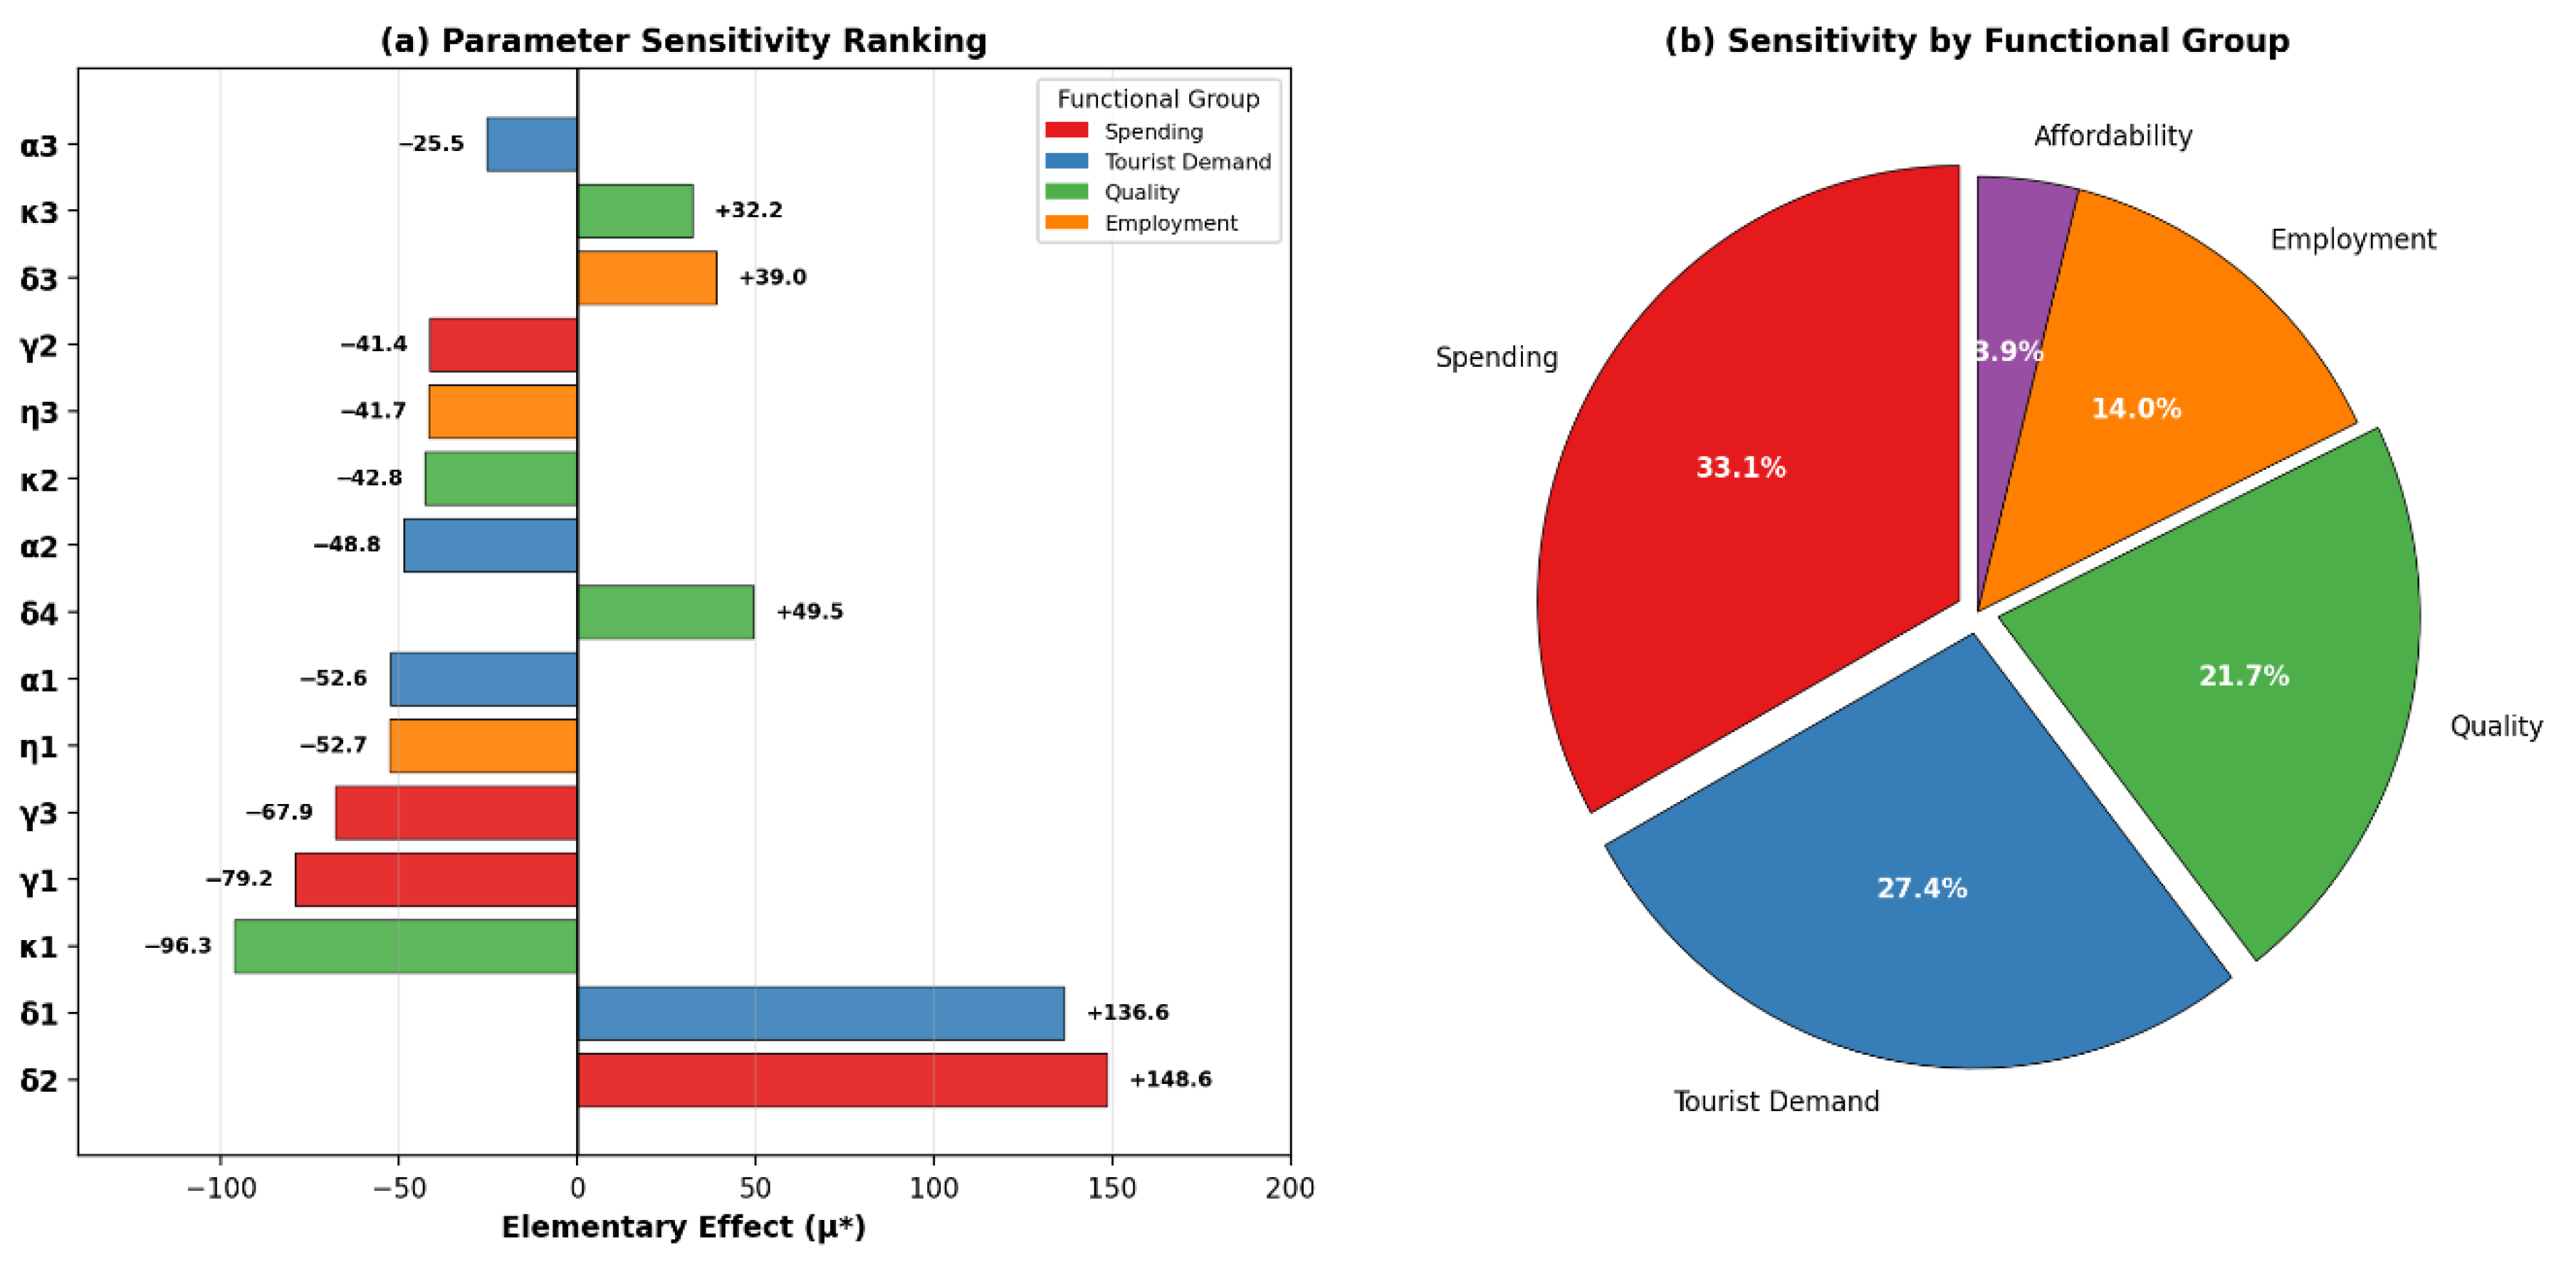
Figure 4 presents two complementary visualizations of the sensitivity analysis results. Panel (a) displays a tornado plot of the 15 most influential parameters, with colors indicating functional groups (red for spending, blue for tourist demand, green for quality, orange for employment). Panel (b) shows the relative contribution of each functional group to overall model sensitivity, revealing that spending parameters dominate with 33.1% of total influence.
Figure 4.
(a) Tornado plot of parameter sensitivity rankings. (b) Sensitivity distribution by functional group.
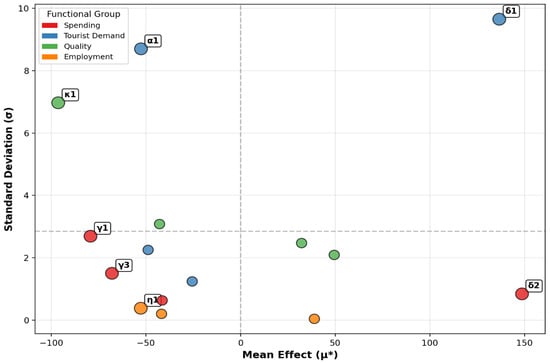
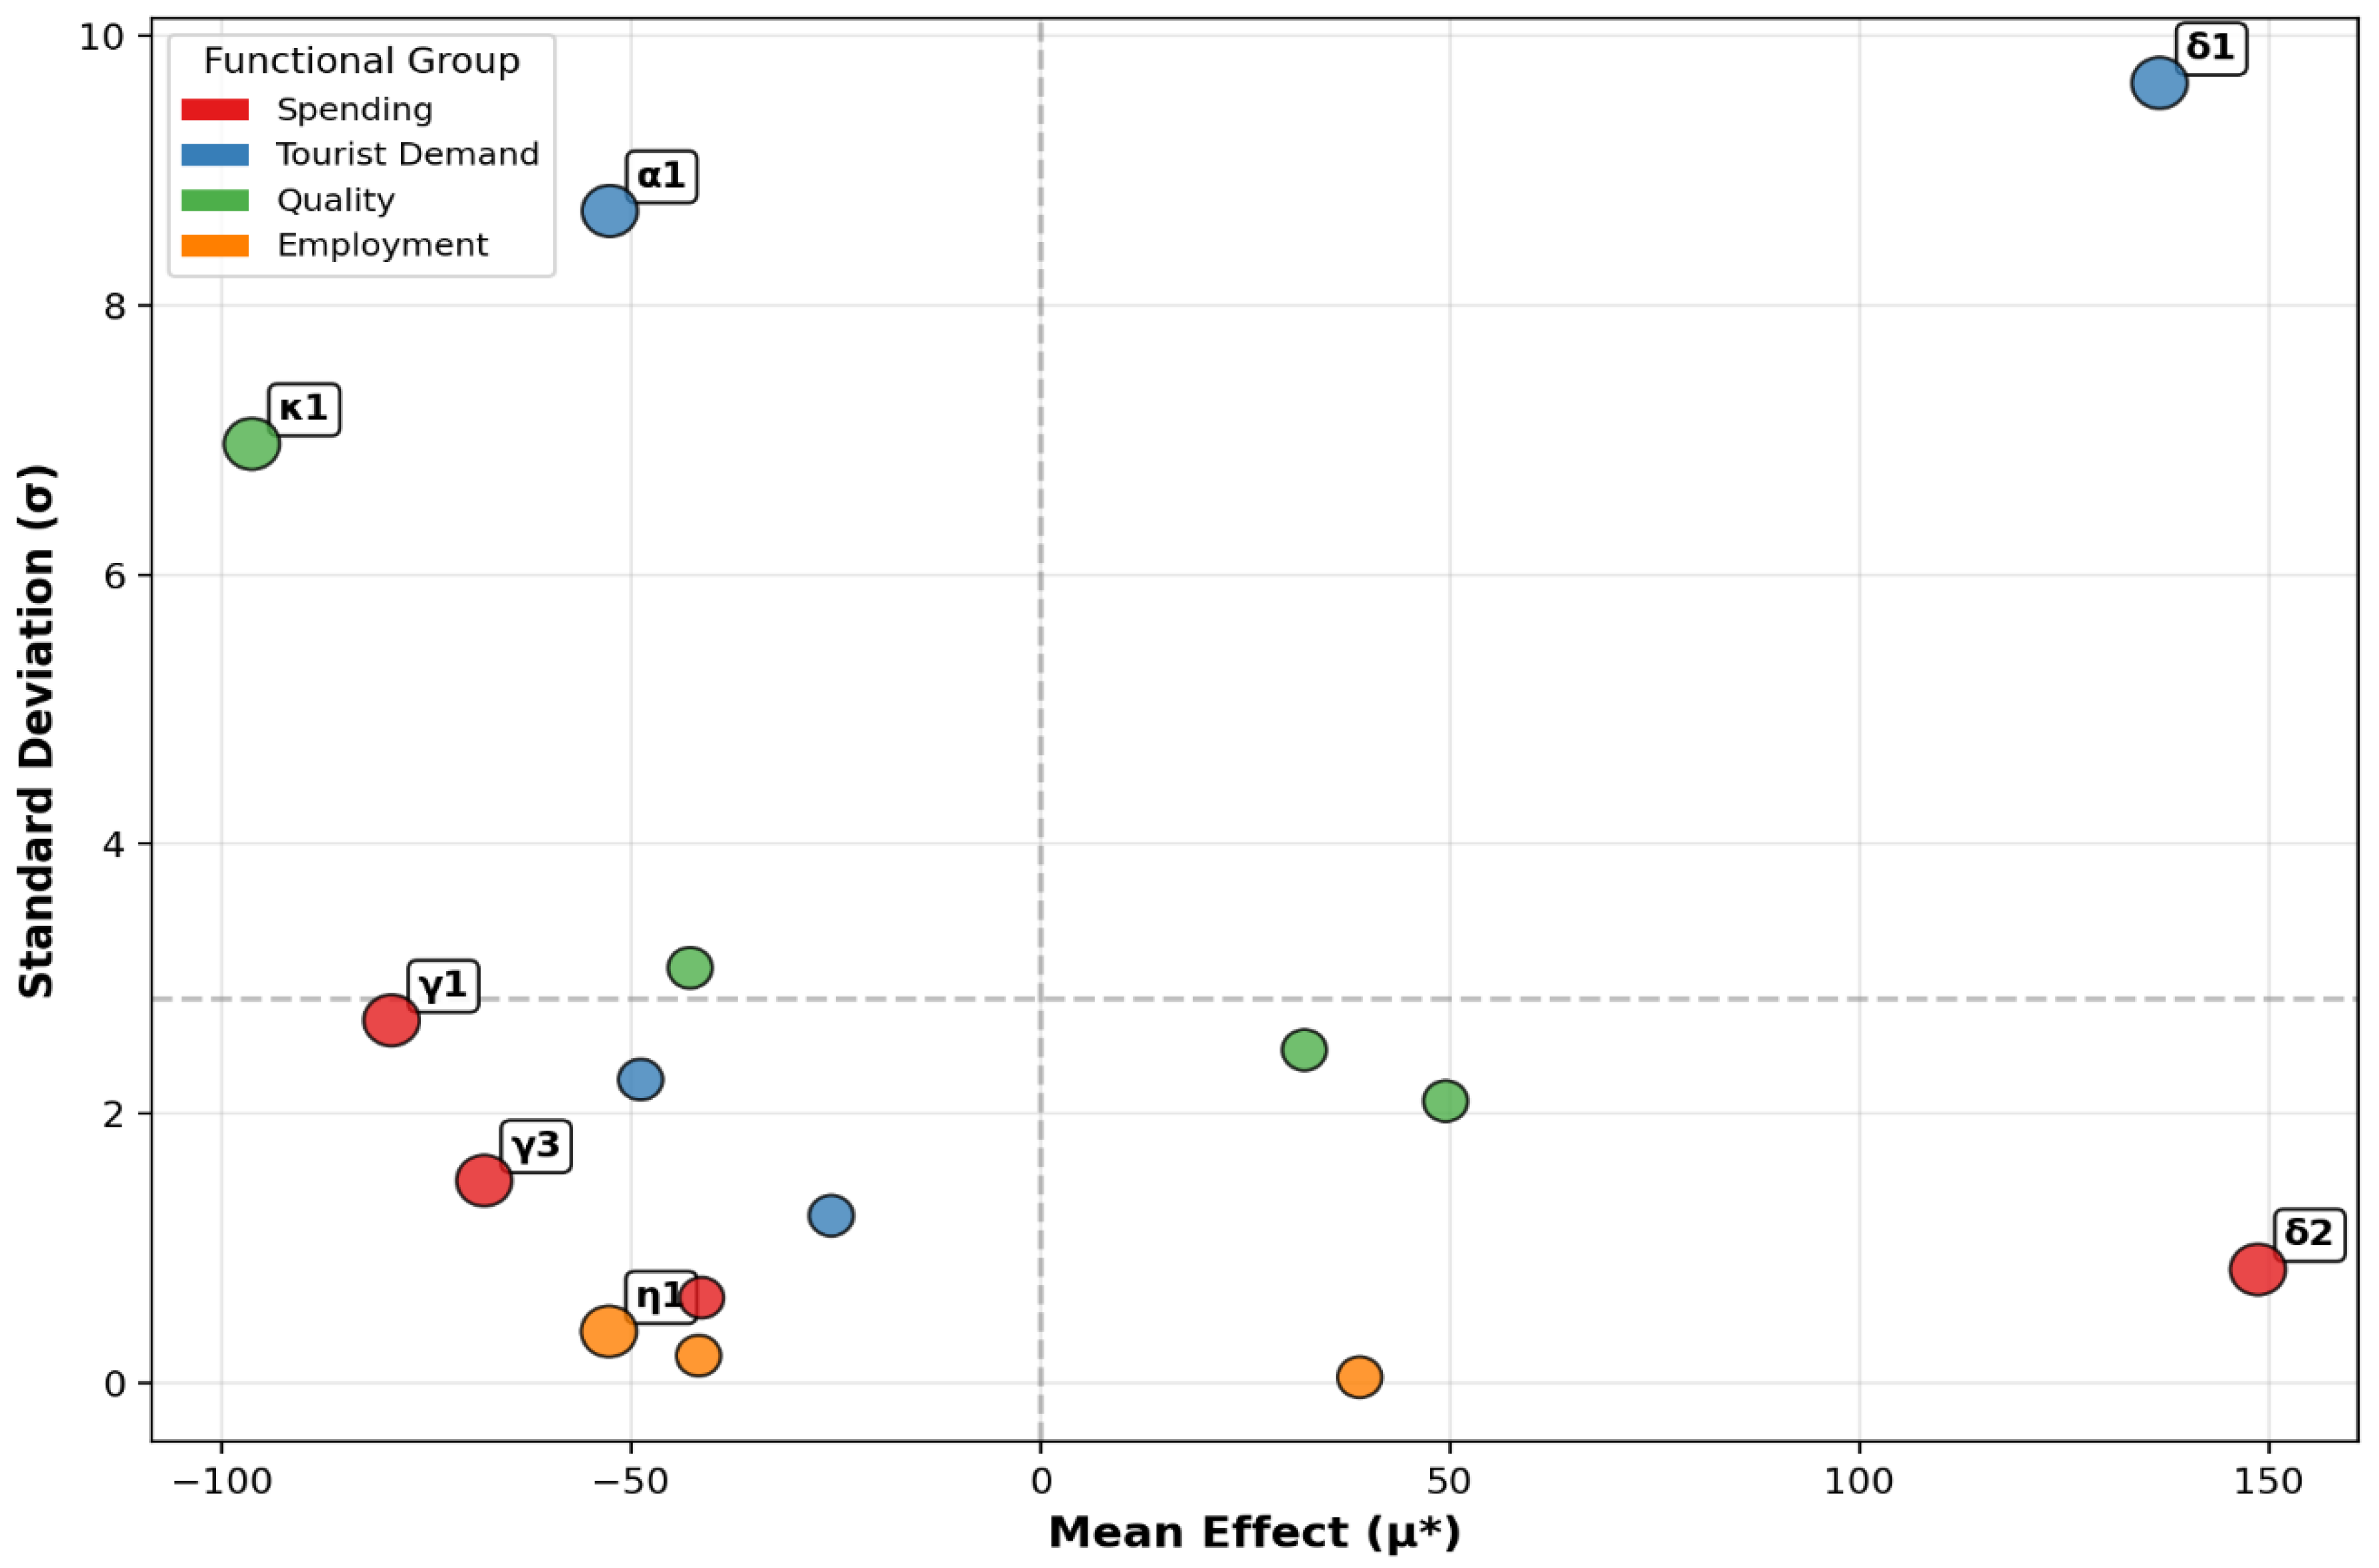
The Morris plot in Figure 5 provides additional insight by plotting the standard deviation against the mean effect for each parameter. Parameters in the upper-right quadrant (high , high ) exhibit both high influence and significant interactions.
Figure 5.
Morris plot showing mean effect versus standard deviation for all parameters.
5.3. Discussion of Findings
5.3.1. Most Influential Parameters
The sensitivity analysis reveals three distinct tiers of parameter importance:
Tier 1 (Highly Influential, ): The decay rates (spending, +148.63) and (tourist churn, +136.62) dominate the sensitivity ranking. This indicates that the natural attrition of tourists and the depreciation of spending behavior are the most critical determinants of system performance. From a policy perspective, this finding underscores the importance of retention strategies and sustained visitor engagement over pure acquisition marketing.
Tier 2 (Moderately Influential, ): Three parameters fall in this range: (facilities effect on quality, −96.27), (quality effect on spending, −79.22), and (events effect on spending, −67.90). Notably, all three have negative effects, meaning they improve system performance when increased. This validates the strategic emphasis on quality enhancement and event-based tourism development.
Tier 3 (Significant but Less Influential, ): This group includes demand-side parameters (, , ), employment parameters (, ), and additional quality parameters (, , ). While less influential than the top tier, these parameters still meaningfully affect outcomes and should be carefully calibrated.
5.3.2. Group-Level Insights
The functional group analysis (Figure 4b) reveals the following:
- -
- Spending behavior accounts for the largest share of sensitivity (33.1%), confirming that how much tourists spend is more critical than how many arrive.
- -
- Tourist demand follows closely (27.4%), highlighting the importance of visitor volume management.
- -
- Experience quality contributes 21.7%, supporting the paper’s emphasis on quality-preserving growth.
- -
- Employment shows moderate sensitivity (14.0%), suggesting that job creation responds to, but does not drive, system dynamics.
- -
- Affordability exhibits the lowest sensitivity (3.9%), indicating the model is relatively robust to affordability assumptions.
5.3.3. Nonlinearity and Interactions
The standard deviations in Table 4 and the Morris plot (Figure 5) provide insight into parameter interactions:
- -
- (tourist churn) shows the highest standard deviation (9.65), indicating strong interactions with other parameters. This makes sense intuitively—how quickly tourists leave interacts with quality, affordability, and marketing effectiveness.
- -
- (advertising) also exhibits high (8.70), suggesting diminishing returns or threshold effects in marketing effectiveness.
- -
- (facilities investment) has notable (6.97), indicating that its effects are context-dependent.
- -
- Most employment and spending parameters show low (<1.0), indicating relatively linear, additive effects.
5.3.4. Policy Implications
The sensitivity analysis yields several actionable insights for tourism policy design:
- Retention trumps acquisition: The dominance of decay rates (, ) suggests that policies focused on extending tourist stays and encouraging repeat visitation may be more cost-effective than aggressive acquisition marketing. For decisionmakers, this implies that post-visit engagement and loyalty programs deserve as much attention as initial promotion.
- Quality investment pays dividends: The strong negative effects of (−96.27), (−79.22), and (−67.90) confirm that investments in facilities, service quality, and events generate compounding benefits. This directly supports the strategy of developing world-class attractions and hospitality infrastructure.
- Spending behavior is the key lever: The spending group’s 33.1% sensitivity share indicates that policies targeting expenditure per tourist (e.g., premium experiences, luxury offerings, high-value events) should be prioritized over volume-focused strategies.
- Advertising requires careful calibration: The high standard deviation of (8.70) suggests that marketing effectiveness is highly context-dependent, with diminishing returns—supporting the MPC’s adaptive approach rather than constant spending.
- Affordability is a constraint, not a driver: The low sensitivity of affordability parameters (3.9% total) suggests that this dimension functions more as a constraint than an active policy lever—important to maintain within bounds, but not the primary driver of success.
The above numerical experiments provide several policy-relevant insights into how dynamic control strategies can be used to manage tourism systems more effectively. Unlike static or rule-based approaches, model predictive control (MPC) enables policymakers to continuously rebalance economic objectives, experience quality, affordability, and employment in response to evolving system conditions.
- ➢
- Dynamic Allocation of Policy Instruments
The results consistently show that dynamic timing of interventions matters as much as their magnitude. MPC concentrates policy effort when marginal benefits are highest and withdraws support when states approach desirable levels. This contrasts with constant policies, which either underperform or generate inefficiencies.
In particular:
- Advertising and accessibility-related controls are most effective when used selectively to reinforce periods of declining tourist inflows rather than applied uniformly.
- Human capital investment emerges as a stabilizing instrument, improving experience quality and employment outcomes over time without inducing excessive congestion.
These findings suggest that tourism authorities should prioritize adaptive budgeting frameworks rather than fixed annual allocations.
- ➢
- Managing Trade-offs Between Growth and Quality
Uncontrolled growth in tourist numbers can degrade experience quality and affordability, ultimately reducing long-run performance. The MPC framework explicitly internalizes these trade-offs by penalizing congestion effects and affordability deterioration.
The simulations show the following:
- Maintaining experience quality requires sustained but moderate investment rather than short-term surges.
- Policies that focus exclusively on maximizing arrivals can be counterproductive unless accompanied by complementary investments in services and workforce capacity.
This highlights the importance of quality-preserving growth strategies, especially in destinations targeting high-value tourism.
- ➢
- Employment and Human Capital Development
Employment responds positively to both tourist volume and service quality improvements. However, job creation driven solely by demand expansion is volatile, while investment in human capital produces more persistent gains.
The results indicate the following:
- Early and continuous workforce development improves employment resilience.
- Human capital policies have delayed but lasting effects, reinforcing long-term sector stability.
From a policy perspective, this supports shifting part of tourism budgets toward training, certification, and service quality programs, particularly in emerging destinations.
5.4. Robustness Checks
To verify that our conclusions are not artifacts of the specific Morris implementation, we conducted two robustness checks:
- Trajectory stability: Increasing the number of trajectories from three to five produced virtually identical rankings (Spearman correlation = 0.98), indicating convergence.
- Variation magnitude: Testing and variations yielded consistent relative rankings, confirming that our findings are not sensitive to the step size choice.
6. Conclusions and Future Work
This paper developed a nonlinear dynamic control framework for tourism system management based on model predictive control. By jointly modeling tourist arrivals, spending behavior, employment, experience quality, and affordability, the proposed framework captures key economic and experiential trade-offs inherent in tourism development, including congestion effects and delayed policy impacts.
The MPC formulation enables feedback-based policy adjustment under operational and budget constraints, providing a robust alternative to static or open-loop control strategies. Numerical experiments demonstrated that MPC consistently outperformed the baseline policy, improving economic performance while maintaining experience quality and affordability within feasible bounds.
Under the baseline, the simulated trajectories show that a fixed, moderate policy produces only slow, unbalanced progress: tourist arrivals, spending, and employment increase modestly (by roughly 19%, 10%, and 75%, respectively, over 24 months), while affordability declines by about 23% with no adaptive mechanism to counteract it. This baseline highlights the limitations of fixed tourism policies, which fail to coordinate growth with quality and affordability objectives.
Under MPC, by contrast, tourist arrivals, spending, and employment increase substantially faster and further—by roughly 82%, 53%, and 140%, respectively—while experience quality rises to slightly exceed its target and affordability is held close to its initial level rather than eroding.
The increase in average spending per tourist aligns with strategic shift toward higher-value tourism segments, while positive employment elasticity reflects the labor-absorbing nature of service-sector growth. Cumulative control effort remains moderate, indicating that the performance gains are not driven by excessive policy intervention, but, rather, by timely and coordinated allocation of resources. This supports the view that MPC can help policymakers identify when to intervene aggressively and when to allow the system to evolve naturally.
To check the effect of different system parameters on the model dynamics, sensitivity analysis was conducted. The decay rates (spending, +148.63) and (tourist churn, +136.62) dominate the sensitivity ranking, which underscores the importance of retention strategies and sustained visitor engagement over pure acquisition marketing. Sensitivity also showed that the strong negative effects of (−96.27), (−79.22), and (−67.90) confirm that investments in facilities, service quality, and events generate compounding benefits, which emphasizes the importance of developing world-class attractions and hospitality infrastructure.
It is important to note that these numerical experiments are illustrative rather than empirically calibrated: parameter values (Table 2) and target states (Table 3) were chosen to reflect plausible qualitative mechanisms discussed in the tourism literature rather than estimated from destination-specific data. Consequently, the reported percentage improvements and target-tracking performance describe the demonstrated behavior of the proposed computational framework and should not be interpreted as predictions for any real tourism destination. Applying the framework to a specific destination—for example, calibrating it to Saudi Arabia’s Vision 2030 tourism targets, already discussed in the Introduction—would require empirical parameter estimation and out-of-sample validation before the framework could support operational policy decisions. Regarding future research, this work may extend the framework to stochastic MPC formulations, multi-region tourism systems, and data-driven calibration using empirical observations. Incorporating environmental and community constraints would further enhance the model’s applicability to sustainable tourism planning. Overall, the proposed approach provides a flexible and theoretically grounded tool for analyzing and optimizing complex tourism systems in a dynamic policy environment.
Author Contributions
Conceptualization, S.M. and L.T.; methodology, S.M. and L.T.; software, S.M.; validation, S.M. and L.T.; formal analysis, S.M.; investigation, S.M. and L.T.; resources, S.M. and L.T.; data curation, S.M.; writing—original draft preparation, S.M.; writing—review and editing, S.M. and L.T.; visualization, S.M.; supervision, L.T.; project administration, S.M. and L.T. All authors have read and agreed to the published version of the manuscript.
Funding
This research received no external funding.
Institutional Review Board Statement
Not applicable. This study did not involve humans or animals; it is a theoretical and numerical-simulation study of a stylized dynamic tourism system.
Informed Consent Statement
Not applicable. This study did not involve human participants.
Data Availability Statement
No new empirical data were created or analyzed in this study. All parameter values, initial conditions, and targets used in the numerical experiments are reported in Table 1, Table 2 and Table 3 of this article. The simulation code used to generate the results is available from the corresponding author upon reasonable request.
Acknowledgments
The authors gratefully acknowledge Alfaisal University for institutional support.
Conflicts of Interest
The authors declare no conflicts of interest.
References
- World Travel & Tourism Council. Economic Impact Report. 2024. Available online: https://www.scirp.org/reference/referencespapers?referenceid=3855604 (accessed on 1 May 2026).
- World Travel & Tourism Council. Travel & Tourism Economic Impact Research (EIR): 2026 Global Economic Impact & Trends. 2026. Available online: https://wttc.org/research/economic-impact (accessed on 1 May 2026).
- World Travel & Tourism Council. Travel & Tourism Economic Impact Research. 2026. Available online: https://researchhub.wttc.org/product/world-economic-impact-report (accessed on 1 May 2026).
- Organisation for Economic Co-operation and Development. Tourism Trends and Policies. 2024. Available online: https://www.oecd.org/en/topics/tourism.html (accessed on 1 May 2026).
- Georgios, G. Preliminary Results on the Employment Effect of Tourism. A meta-analysis. arXiv 2022, arXiv:2206.00174. [Google Scholar]
- León-Gómez, A.; Ruiz-Palomo, D.; Fernández-Gámez, M.A.; García-Revilla, M.R. Sustainable tourism development and economic growth: A bibliometric review and analysis. Sustainability 2021, 13, 2270. [Google Scholar] [CrossRef] [Scilit]
- Capucho, J.; Leitão, J.; Alves, H. Mapping and linking well-being, tourism economics, sustainable tourism and sustainable development. Discov. Sustain. 2025, 6, 291. [Google Scholar] [CrossRef] [Scilit]
- García-García, A.R.; Jacobo-Hernández, C.A.; Ochoa-Jiménez, S.; Valdez-del Río, S. Sustainable development and tourism: A review of the literature in Web of Science from 2001 to 2020. Sustainability 2023, 15, 16805. [Google Scholar] [CrossRef] [Scilit]
- Yang, Y.; Wani, G.A.; Nagaraj, V.; Haseeb, M.; Sultan, S.; Hossain, E.; Kamal, M.; Shah, S.M.R. Progress in sustainable tourism research: A comprehensive literature analysis and future directions. Sustainability 2023, 15, 2755. [Google Scholar] [CrossRef] [Scilit]
- Santos, V.; Sousa, M.J.; Costa, C.; Au-Yong-Oliveira, M. Tourism towards sustainability and innovation: A systematic literature review. Sustainability 2021, 13, 11440. [Google Scholar] [CrossRef] [Scilit]
- Agyeiwaah, E.; McKercher, B.; Suntikul, W. Identifying core indicators of sustainable tourism: A systematic literature review. Tour. Manag. Perspect. 2017, 24, 26–33. [Google Scholar] [CrossRef] [Scilit]
- Iqbal, T.; Aftab, F. Exploring tourism’s contribution to Saudi Arabia’s Vision 2030: Aligning with SDG 8 for sustainable growth. Int. J. Sustain. Dev. Plan. 2025, 20, 1283–1289. [Google Scholar] [CrossRef] [Scilit]
- Bencardino, M.; Cresta, A.; Esposito, V.; Senatore, A.; Valanzano, L. A Model for Estimating the Tourism Carrying Capacity (TCC) of a Serial Cultural Heritage: The Case of the Via Appia. Regina Viarum. Sustainability 2025, 17, 8213. [Google Scholar] [CrossRef] [Scilit]
- Bertocchi, D.; Camatti, N.; Giove, S.; van der Borg, J. Venice and Overtourism: Simulating Sustainable Development Scenarios through a Tourism Carrying Capacity Model. Sustainability 2020, 12, 512. [Google Scholar] [CrossRef] [Scilit]
- Mejjaouli, S.; Tadj, L. Dynamic Innovation Portfolio Management: A Model Predictive Control Approach for Product-Process Innovation Trade-Offs. Processes 2026, 14, 557. [Google Scholar] [CrossRef] [Scilit]
- Mejjaouli, S.; Tadj, L. Optimal pricing in ride-share platforms. Cogent Eng. 2023, 10, 2230710. [Google Scholar] [CrossRef] [Scilit]
- Mejjaouli, S.; Tadj, L. OPTIMAL CONTROL STRATEGIES FOR ADAPTIVE PRICING IN RIDE-SHARING SERVICES. Int. J. Ind. Eng. 2025, 32, 52. [Google Scholar] [CrossRef]
- Duan, J.; Xu, K. Tourism City Management Optimization Model Based on Sustainable Development Concept. Highlights Sci. Eng. Technol. 2025, 135, 162–171. [Google Scholar] [CrossRef] [Scilit]
- Lyu, H.; Yang, X.; Ji, X. Overtourism to Equilibrium: A System Dynamics & Multi-Objective Model for Sustainable Destinations. arXiv 2025, arXiv:2511.14288. [Google Scholar]
- Morris, M.D. Factorial sampling plans for preliminary computational experiments. Technometrics 1991, 33, 161–174. [Google Scholar] [CrossRef] [Scilit]

Disclaimer/Publisher’s Note: The statements, opinions and data contained in all publications are solely those of the individual author(s) and contributor(s) and not of MDPI and/or the editor(s). MDPI and/or the editor(s) disclaim responsibility for any injury to people or property resulting from any ideas, methods, instructions or products referred to in the content. |
© 2026 by the authors. Licensee MDPI, Basel, Switzerland. This article is an open access article distributed under the terms and conditions of the Creative Commons Attribution (CC BY) license.