


Abstract
In the contemporary world, artificial intelligence (AI) is driving profound changes across global institutional, technological, and social processes. However, countries’ readiness for its integration varies substantially by economic development, regional characteristics, and digital maturity. Accordingly, this article aims to assess the alignment between the AI publication footprint, based on Scopus publication data, and national AI readiness, measured by the IMF AI Preparedness Index, across 173 countries, classified by geographic region and income level. The application of analysis of variance (ANOVA), the Kruskal–Wallis test and post hoc comparisons, correlation, regression, and cluster analysis enabled the identification of multidimensional relationships between scientific activity and the four key dimensions of digital maturity: digital infrastructure, human capital/labor market, innovation/economic integration, and regulation/ethics. The results revealed a strong overall global correlation between AI publication footprint and national AI readiness (r = 0.68, R2 = 0.46), with the highest level of alignment observed in high-income countries’ readiness (r = 0.67, R2 = 0.45), and regions such as the Americas (r = 0.72, R2 = 0.51) and Europe (r = 0.57, R2 = 0.33). At the same time, lower-income countries demonstrate weak or statistically insignificant relationships, indicating persistent structural barriers. Cluster analysis identified four types of countries, ranging from those with high levels of digital maturity to those with lower levels of national AI readiness. These findings highlight diverse national development trajectories and the need for differentiated policy approaches. However, the AI Publication Footprint is based on absolute cumulative Scopus publication counts and should be interpreted as a proxy for AI knowledge-production capacity rather than a normalized measure of research intensity or actual AI adoption. Given the cross-sectional and primarily bivariate design, the results indicate associations rather than causal effects and do not directly capture educational outcomes. The findings may have implications for education and sustainability by suggesting that disparities in infrastructure, human capital, innovation capacity, and responsible governance may shape the conditions for inclusive and sustainable AI-enabled education; these implications require direct empirical testing. Accordingly, the study emphasizes the need for adaptive policy frameworks that account for regional and economic disparities.
1. Introduction
The rapid development and widespread public deployment of artificial intelligence (AI) technologies have led to substantial changes in economic, social, and governance processes. According to researchers from Stanford University, AI can be regarded as the most transformative technology of the twenty-first century, having ceased to be solely a subject of academic research and having become actively integrated into government strategies, business models, and social life [1]. According to estimates by the International Monetary Fund, almost 40% of jobs worldwide are exposed to AI. In comparison, in advanced economies this figure reaches 60%, which requires a reconsideration of employment and education policies [2].
In this context, collaboration between humans and artificial intelligence acquires new significance, as technologies can complement human capabilities and increase productivity, creativity, and adaptability in the context of digital transformation [3]. However, effective AI implementation requires not only technical infrastructure but also social infrastructure supporting inclusiveness, the ethical use of technologies, and the fair distribution of benefits [4]. Thus, the development and adoption of AI depend not only on algorithms but also on human capital, institutional capacity, trust, transparency, and mutual learning.
At the same time, the level of AI implementation varies significantly across countries, determined not only by technological capabilities but also by institutional readiness and strategic vision. As noted in the OECD report [5], after the launch of ChatGPT in 2022, AI became a central topic of political debate, prompting the active development of national strategies: as of 2023, more than 70 countries had reported over 930 policy initiatives aimed at the development and regulation of AI.
To assess these dynamics, this study distinguishes between three related but distinct dimensions of national AI development: (1) AI publication footprint, measured through the volume of AI-related publications and interpreted as an indicator of national knowledge-production capacity; (2) governmental AI readiness, capturing structural and institutional conditions for AI development and deployment; and (3) actual AI implementation or adoption, understood as a downstream outcome that is not directly measured in this study. Accordingly, a strong relationship between AI publication footprint and governmental AI readiness should not be interpreted as evidence of successful implementation.
An important indicator of such research readiness is the intensity of scientific research, since a high concentration of academic developments indicates a state’s potential for knowledge transfer and the integration of innovations into the real sector of the economy. In this context, universities become strategic hubs that not only generate knowledge but also form a critical mass of human capital capable of providing intellectual support for digital transformation. However, developed countries have considerably greater resources to invest in research, infrastructure, and personnel training. In contrast, many developing countries face limited access to digital resources, a weak regulatory framework, and insufficient digital literacy among the population.
Nevertheless, despite evident progress in knowledge generation, an open question remains: whether scientific activity corresponds to countries’ actual readiness and capacities to integrate this knowledge into practice, and to what extent this depends on geographic criteria or on countries’ levels of development. While existing cross-country literature has frequently evaluated macroeconomic or infrastructure metrics in isolation, the systematic alignment between academic research output and governmental readiness across diverse income tiers remains insufficiently explored.
Beyond its economic and administrative implications, national readiness for AI is directly relevant to the sustainability of education systems. The integration of AI into education requires more than the availability of digital tools. It depends on stable infrastructure, a sufficiently prepared teaching and research workforce, institutional capacity for innovation, and governance mechanisms that ensure equity, ethics, and inclusion. In this sense, the education sector is not only a beneficiary of AI readiness but also a core mechanism: universities and schools produce human capital, shape digital literacy, support research translation, and determine whether AI contributes to inclusive, long-term development or reinforces existing inequalities. Therefore, evaluating how national research aligns with institutional readiness provides vital insights into whether countries can successfully build sustainable, creative, and inclusive educational ecosystems in the era of artificial intelligence.
2. Current Research Analysis
In contemporary scientific discourse, AI occupies a significant place and is considered not only as a technological phenomenon but also as a strategic instrument of digital transformation across all spheres of social activity [6,7]. Its learning capacity, generation of new knowledge, and processing of large volumes of data determine its role in shaping innovative approaches to governance, education, medicine, the economy, and other fields [8,9].
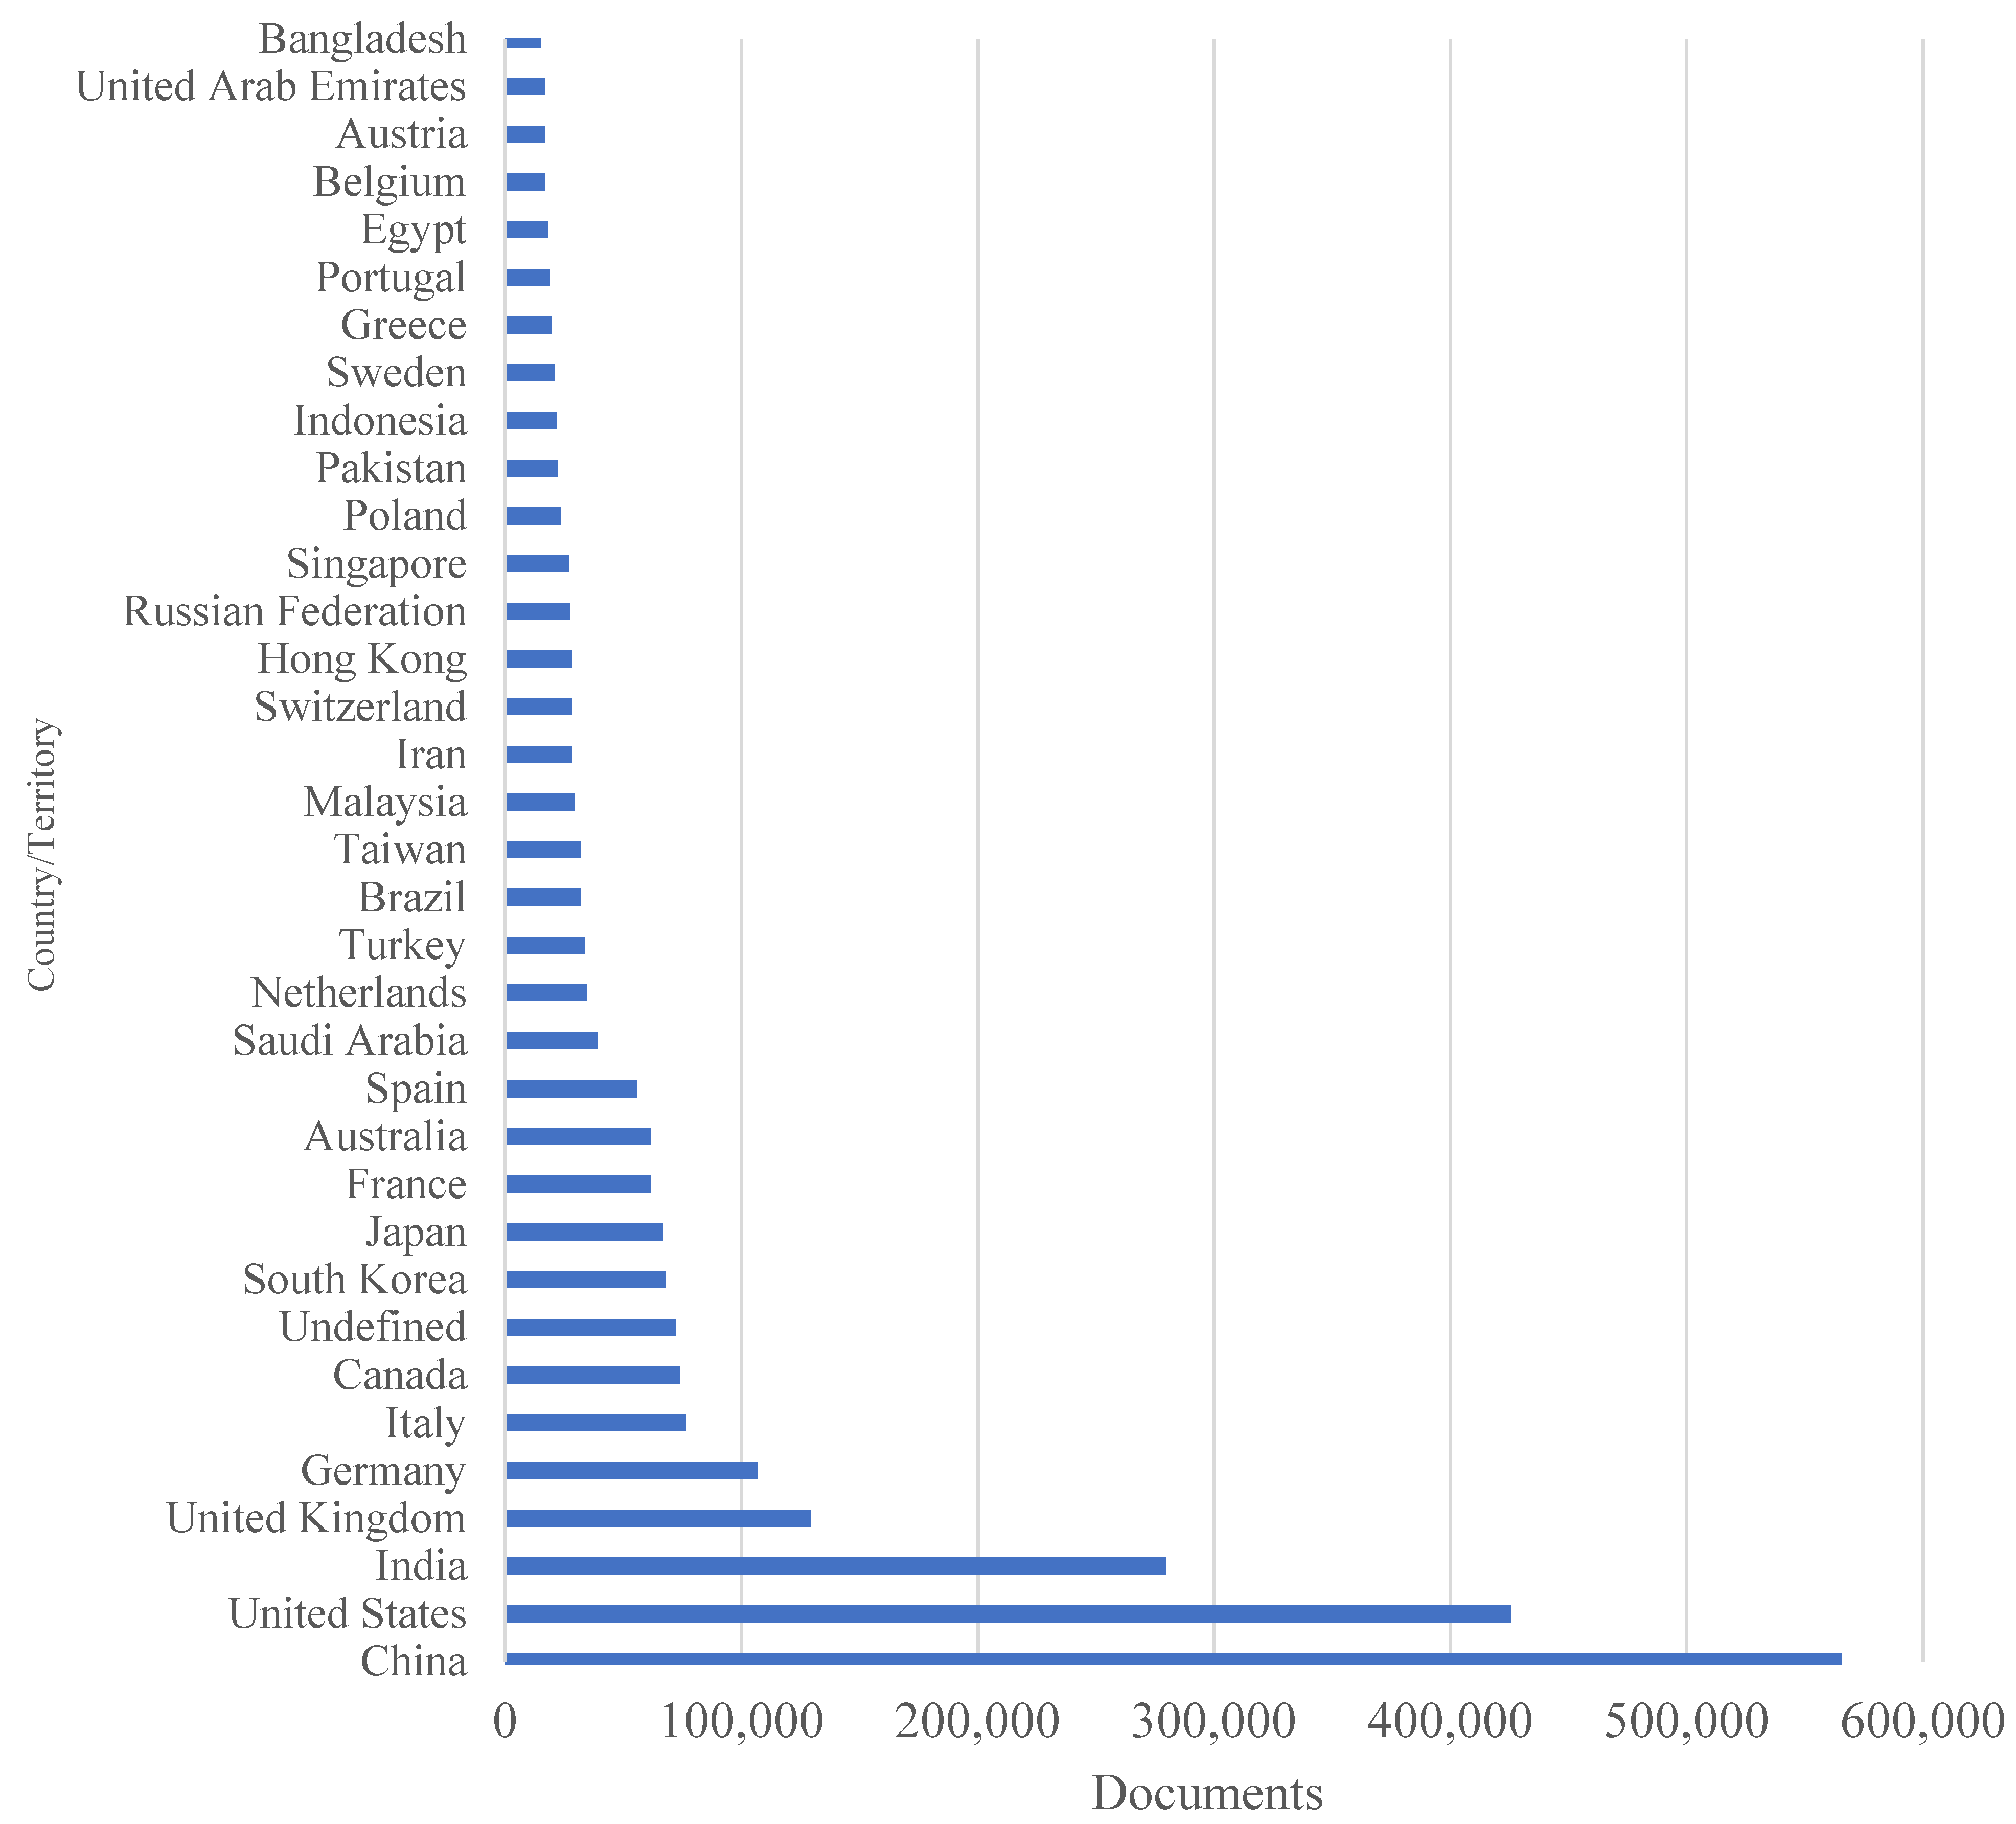
This growing interest in AI is clearly reflected in scientometric indicators. According to the Scopus scientometric database, as of March 2026, the total number of scientific publications for 1980–2025 devoted to research in the field of artificial intelligence, including the keywords artificial intelligence, machine learning, deep learning, generative AI, and large language models, exceeds 2.2 million. The growth dynamics (Appendix A, Figure A1) demonstrate a clear progressive trend, indicating a rapid expansion of scientific interest in this field. The largest number of publications is concentrated in computer science, with more than 1.3 million documents, as expected given the technical nature of AI. At the same time, a significant share of research falls within engineering, mathematics, medicine, physics, social sciences, and management decision-making, indicating the active integration of AI into applied and humanities-related domains (Appendix A, Figure A2). From a geographic perspective, China and the United States are the leading contributors, accounting for almost 38% of all research worldwide (Appendix A, Figure A3).
These trends are consistent with the results of previous studies. In particular, Auza-Santiváñez et al. [10], Bajpai, Yadav, and Nagwani [11], and Turmuzi and Tyaningsih [12], based on bibliometric analysis, report an exponential increase in the number of studies addressing algorithmic methods, advanced machine-learning techniques, data-driven automation, and ethical aspects of AI applications. Sousa et al. [13] emphasize that AI is a driver of new business models and more efficient production processes, while the most extensively studied areas include robotics, machine learning, and predictive analytics. Delcea et al. [14] identify the active use of AI to address regional challenges such as resource management and urban planning, with machine learning, neural networks, and logistic regression among the dominant technologies.
The technological evolution of AI accompanies the expansion of scientific interest. Owing to the rapid development of computing power and algorithmic solutions, AI is evolving from solving narrowly specialized tasks to addressing more complex, multifaceted, and context-dependent problems involving social interaction, creativity, design, science, and art [15]. Contemporary research pays particular attention to generative AI models, which demonstrate considerable potential for supporting decision-making processes. As Mittelsteadt notes, the integration of generative AI into policy and governance creates opportunities for more evidence-informed decision-making through the analysis of large volumes of data [16].
Taken together, this literature demonstrates the rapid growth, broad diffusion, and increasing social relevance of AI research. However, most bibliometric studies focus on publication growth, thematic development, or geographic concentration. They do not generally examine whether a high level of AI publication footprint is accompanied by the structural conditions required for national AI adoption and implementation.
2.1. National AI Readiness and Its Dimensions
Scientific research indicates that the effective adoption of AI depends not only on technological availability but also on a country’s level of national AI readiness. This readiness includes infrastructural, educational, institutional, regulatory, and ethical components. Mandon [17] finds that countries demonstrating higher AI preparedness than expected on the basis of their economic profile share common features, including effective regulation, ethical frameworks, and adaptive coordination among the state, the market, and scientific institutions. Thakur [18] similarly shows that human capital, innovation capacity, and digital infrastructure are important factors in the integration of AI into public administration and the economy.
The IMF AI Preparedness Index used in the present study reflects this multidimensional understanding of national AI readiness [2]. Its components include digital infrastructure, human capital and labor-market conditions, innovation and economic integration, and regulation and ethics. These dimensions indicate that national readiness is broader than the existence of government strategies alone and includes the structural conditions that support the adoption and responsible use of AI [19,20].
However, technological preparedness is not always accompanied by responsible implementation [21,22]. Nzobonimpa and Savard [23] show that even highly developed democracies with high scores on the Government AI Readiness Index do not necessarily ensure adequate transparency, inclusiveness, privacy protection, and accountability. Accordingly, AI readiness should not be interpreted as a guarantee of effective or responsible implementation [22]. Rather, it represents a set of structural conditions that may support implementation while still requiring appropriate governance, institutional coordination, and public accountability [24,25,26].
2.2. Possible Mechanisms Linking AI Research and National Readiness
The relationship between AI publication footprint and national AI readiness may operate through several related mechanisms. First, academic research can contribute to evidence-informed policymaking by producing analytical knowledge relevant to national AI strategies, regulatory frameworks, and ethical governance [16,24]. Nevertheless, research output alone does not guarantee that scientific knowledge will be incorporated into public policy.
Second, universities contribute to human-capital development by training specialists and researchers who may later support digital transformation in public institutions, businesses, and education systems [18,27,28]. In this sense, an AI publication footprint may indicate not only the volume of scientific output but also the development of expertise relevant to AI adoption. However, the availability of trained specialists does not necessarily ensure their effective integration into national innovation and governance systems.
Third, knowledge spillovers may emerge through collaboration among academia, industry, and government. Such interactions can facilitate the diffusion of AI-related knowledge into innovation ecosystems, public administration, and economic activity [29,30]. Their effectiveness, however, depends on institutional quality, organizational adaptability, financing, and the existence of mechanisms for knowledge transfer.
Sectoral evidence confirms that AI-related outcomes are highly context-dependent. Studies of renewable-energy entrepreneurship, supply chains, pharmaceutical research, publishing, and creative industries show that AI can create new innovation and productivity opportunities, but that these effects depend on financing conditions, professional expertise, knowledge management, organizational adaptability, and institutional readiness [31,32,33,34,35,36,37,38]. Thus, the presence of AI research or technological solutions does not automatically produce effective implementation across sectors.
2.3. Geographic, Income-Based, and Institutional Disparities
Previous research shows that AI-related scientific output does not automatically imply equal capacity for responsible implementation across countries, sectors, or income groups [39,40]. Research outcomes depend on socioeconomic conditions, institutional maturity, and local implementation environments [38,41]. The World Economic Forum identifies an AI divide between the Global North and the Global South, where access to data, infrastructure, and human capital remains substantially uneven [3,42,43,44,45]. Digital capacity also has geopolitical and security dimensions that differ across countries [46], while public perceptions of AI vary according to trust, exposure, and perceived benefits [47,48].
Another important direction that complements this analysis is the assessment of AI readiness in relation to economic complexity. Mandon [17] uses the IMF AI Preparedness Index and the multidimensional Economic Complexity Index to identify countries whose observed preparedness exceeds expected levels. This approach demonstrates that national AI readiness cannot be interpreted independently of countries’ broader economic and institutional structures.
At the same time, the relationship between AI publication footprint and national AI readiness may partly reflect general development conditions rather than a specific effect of AI research. Larger countries may produce more publications because of their population size, number of universities, and overall research capacity. Wealthier countries generally have greater R&D expenditure, stronger infrastructure, and more developed innovation systems, which may simultaneously increase AI publication output and AI preparedness. Institutional quality, regulatory capacity, and general levels of economic development may also influence both dimensions. Therefore, the observed relationship should be interpreted cautiously as an association that may be shaped by broader structural factors rather than as evidence of a direct effect of AI research on national readiness.
2.4. AI, Education, and Sustainability
A particularly important yet still underdeveloped dimension of this discussion concerns education and sustainability. Recent research shows that education systems are not merely downstream users of AI but key institutional sites where AI is integrated into teaching, learning, assessment, and academic administration [49,50]. Systematic reviews show that AI is already reshaping instructional design, adaptive learning, assessment practices, student support, and administrative decision-making, while also raising governance and leadership questions at the institutional level [51,52].
At the same time, education systems function as long-term producers of human capital, digital literacy, teacher capability, research capacity, and innovation readiness. Recent reviews emphasize that digital and AI literacy are foundational competencies for both students and faculty, and that sustainable integration depends not only on tools but also on faculty development, institutional strategy, and pedagogical reform [27,53,54,55]. The teacher education literature is especially clear that AI literacy remains underdeveloped and that stronger professional preparation is needed if AI is to be adopted responsibly and effectively across education systems [28,56,57,58].
This matters because unequal AI capacity may produce unequal educational futures. Recent work links AI in education to SDG 4, inclusive access, digital equity, and responsible governance [54]. Systematic reviews on responsible AI in education underline the importance of fairness, privacy, transparency, agency, and accountability [55]. Education is therefore an important institutional channel through which national AI capacity can be reproduced over time, although the present study does not directly measure classroom adoption, student creativity, or educational outcomes.
2.5. Research Gap and Contribution
Despite the significant number of studies devoted to individual aspects of digital transformation and AI development, the relationship between AI publication footprint and national AI readiness remains insufficiently explored. Existing studies have generally examined these dimensions separately: bibliometric research focuses on the volume and distribution of scientific activity, while AI preparedness studies focus on infrastructure, human capital, innovation, economic integration, regulation, and ethics [10,11,12,13,14,15,16,17,18,23,24]. Other studies link AI development to innovation outputs, patent activity, or economic complexity [30], but do not directly assess whether national AI knowledge-production capacity is aligned with structural readiness for AI adoption across geographic regions and income groups.
This gap is especially important for education, where AI adoption is highly sensitive to unequal access to infrastructure, teacher preparedness, institutional support, and broader human-capital conditions. AI publication footprint is therefore relevant but insufficient for understanding whether countries possess the conditions required for inclusive and sustainable AI-enabled education.
The contribution of this study is not limited to describing the global distribution of AI research. It provides a comparative assessment of the alignment between AI publication footprint and national AI readiness across countries and examines how this alignment differs by geographic region and income group. The study thereby highlights the conditions under which AI may support inclusive digital transformation, responsible governance, and sustainable development, including the long-term transformation of education systems.
In the present study, sustainability is understood in its institutional, social, economic, and technological dimensions rather than as a direct measure of environmental performance or progress toward a specific Sustainable Development Goal. Sustainable AI transformation requires more than the production of scientific knowledge. It also depends on durable digital infrastructure, human-capital formation, innovation capacity, economic integration, and regulatory and ethical institutions that support the responsible and inclusive use of AI. These dimensions are represented by the four components of the AI Preparedness Index. Geographic and income-based differences in their alignment with scientific activity may indicate whether the capacity to participate in AI-driven transformation is distributed equitably across countries. Accordingly, the study examines structural conditions associated with inclusive and institutionally sustainable digital transformation.
Accordingly, this study aims to assess the association between the AI Publication Footprint and national AI readiness and to examine whether the distributions of these indicators vary across geographic regions and country income groups. The working hypotheses are as follows:
H1.
At the global level, the AI Publication Footprint is positively associated with national AI readiness.
H2.
The distributions of the AI Publication Footprint, the overall AI Preparedness Index, and its component indicators differ across geographic regions.
H3.
The distributions of the AI Publication Footprint, the overall AI Preparedness Index, and its component indicators differ across country income groups.
3. Materials and Methods
This study uses official data from the International Monetary Fund on the AI Preparedness Index (aipi), which assesses countries’ readiness to implement artificial intelligence. The index is based on a broad set of macroeconomic and structural indicators covering digital infrastructure (dig_infr), human capital and the labor market (humc_labm), innovation and economic integration (innov_econint), as well as regulation and ethical aspects (reg_eth). In the context of this research, the human capital and labor market dimension is interpreted not only as an economic indicator but also as a proxy for educational and training capacity, reflecting a country’s structural ability to prepare, attract, and retain a workforce capable of developing and adopting AI.
For this study, the AIPI components are interpreted as complementary structural dimensions of national implementation capacity. Digital infrastructure represents the technological foundation required for sustained access to and deployment of AI. Human capital and labor-market policies represent the social and skills-related capacity to participate in technological transformation. Innovation and economic integration reflect the capacity to translate knowledge into broader economic and institutional applications. Regulation and ethics represent the governance conditions required for responsible, transparent, and socially acceptable implementation. The study does not combine these indicators into a new sustainability measure. Rather, it examines their relationship with scientific activity and their unequal distribution across geographic and income groups as structural aspects of inclusive digital transformation.
In addition, data from the Scopus scientometric database on the number of AI-related scientific publications (docum) were used as a publication-based proxy for the absolute scale of visible national AI knowledge production. This indicator captures the cumulative volume of AI-related academic output. The search was conducted using document metadata (TITLE-ABS-KEY), covering titles, abstracts, and keywords. The search query was structured as follows:
TITLE-ABS-KEY(“artificial intelligence” OR “AI” OR “machine learning” OR “deep learning” OR “generative AI” OR “large language model” OR “large language models”)
To capture the full spectrum of AI-related scientific activity, the search strategy was designed to be inclusive, recognizing artificial intelligence as a general-purpose technology rather than a domain restricted to specific subject areas. A multidisciplinary criterion was applied, deliberately avoiding limitations to computer science or other narrow fields. This ensures that the resulting publication volume reflects a nation’s holistic capacity for AI-driven transformation, capturing AI-related publication output across medicine, economics, engineering, social sciences, and other fields. The multidisciplinary search strategy was intended to provide broad coverage of AI-related academic output, rather than to measure the full range of national AI research and innovation capacity.
To ensure a common reference year, the Scopus publication database was closed at the end of 2023, corresponding to the latest available observation of the AI Preparedness Index. However, the publication measure is cumulative for the period 1980–2023 and is therefore interpreted as a historical stock of AI knowledge production rather than as a measure of current annual publication volume. The analysis thus compares accumulated national AI publication output with contemporaneous national AI preparedness in 2023. To ensure data quality, non-primary research outputs (such as non-indexed documents or sources lacking English metadata) were excluded from the dataset.
The analysis covers 173 countries worldwide, classified by regional affiliation according to the United Nations system and by income level according to the World Bank classification (Table 1). However, hierarchical cluster analysis was conducted on 164 (Appendix B Table A1) unique countries with complete observations for all clustering variables. Nine countries (Uzbekistan, Maldives, South Sudan, Puerto Rico, São Tomé and Príncipe, Somalia, Afghanistan, Macao, and Taiwan, China) were excluded because of missing values in one or more clustering variables.
Table 1.
Distribution of countries included in the analysis by UN regional classification and World Bank income groups.
Due to the limited number of countries in the regions of North America () and Oceania (), these regions were combined with Latin America and the Caribbean, and with Asia, respectively, to form aggregated macro-groups. This methodological aggregation was necessary to ensure sufficient statistical power for variance and non-parametric testing, thereby mitigating the risk of Type II errors associated with extremely small sub-sample sizes. This grouping balances geographic proximity with the requirement for statistical reliability, while subsequent income-level classifications and cluster analyses provide a more granular perspective on cross-country disparities.
Data preprocessing involved testing the normality of the variable distributions using the Shapiro–Wilk test, as well as applying a logarithmic transformation to the docum indicator to reduce the influence of outliers and approximate the distribution to normality. To unify variable scales and ensure comparable results, all quantitative variables were standardized using the z-score transformation. Standardization enabled the elimination of unit-of-measurement and scale differences, which is particularly important for correlation analysis and clustering.
To compare regional and income-level groups, both parametric and non-parametric procedures were considered. The homogeneity of variances was assessed using Bartlett’s test. A non-significant Bartlett test () indicated that the equal-variance assumption was not rejected, whereas a significant result () indicated heterogeneity of variances. Because significant variance heterogeneity was observed for several variables, the Kruskal–Wallis H-test was treated as the primary procedure for those comparisons. Conventional ANOVA results were interpreted as supplementary evidence and were not used as the sole basis for substantive conclusions when the homogeneity-of-variance assumption was violated.
When the Kruskal–Wallis test indicated a statistically significant omnibus difference, Dunn’s pairwise post hoc comparisons were conducted to identify the specific regional or income-group pairs that differed. Holm’s stepwise adjustment was applied to control for multiple comparisons within each family of six pairwise comparisons for a given indicator. These post hoc tests were interpreted as evidence of differences in indicator distributions and were not used to infer differences in correlation coefficients or regression slopes across groups.
Correlation and simple linear regression analyses were used to examine the unadjusted association between AI publication output and national AI readiness. In each model, publication output was the sole explanatory variable, while the composite AIPI score or one of its four components was treated as the dependent variable. These models were specified as exploratory bivariate models and were not intended to estimate an independent or causal effect of AI publication footprint on national AI readiness.
The component-level models were estimated separately to describe whether the unadjusted association with publication output varied across different dimensions of national AI readiness. The coefficients should therefore be interpreted as associations rather than causal effects or adjusted predictors of AI readiness.
In addition, region- and income-specific associations between the AI Publication Footprint and national AI readiness were examined as an exploratory objective rather than as statistically tested differences between groups.
Because each regression contains only one explanatory variable, multicollinearity among predictors does not arise within these models. Correlations among the AIPI components remain conceptually relevant because the components represent related dimensions of a composite index. However, they do not distort the standard error of the publication-intensity coefficient in the separately estimated regressions. The results are therefore interpreted as unadjusted bivariate associations rather than causal or independently adjusted effects. The models do not control for potential confounders such as historical development, research investment, country size, or institutional quality.
Country clustering was performed using hierarchical Ward’s linkage method based on standardized indicators. The optimal number of clusters was determined using the Calinski–Harabasz and Duda–Hart indices to ensure the robustness of the classification.
All statistical computations were performed using MS Excel for data preprocessing and Stata/SE 12.0 for advanced computational analysis.
4. Results
4.1. Geographic Patterns in the Relationship Between AI Publication Footprint and National AI Readiness
Scientific and technological progress has substantially changed the global landscape, transforming approaches to governance, economic development, and public policy. One of its most prominent manifestations is digital transformation, which has encompassed all countries of the world, although to varying degrees. In particular, the rapid growth of interest in AI brings to the forefront the issue of countries’ readiness for its implementation. However, the level of this readiness, as well as the intensity of AI research, is heterogeneous and depends to a considerable extent on geographic context.
To identify regional differences in AI publication output and national AI readiness, both ANOVA and the Kruskal–Wallis test were applied (Table 2). The ANOVA results indicated statistically significant differences in group means for all examined variables. However, Bartlett’s test revealed significant heterogeneity of variances for AIPI, digital infrastructure, innovation and economic integration, human capital and labor-market policies, and publication output (). Therefore, for these variables, the Kruskal–Wallis test was treated as the primary inferential procedure, while the conventional ANOVA results were considered supplementary. For regulation and ethics, Bartlett’s test was not statistically significant (); therefore, the equal-variance assumption was not rejected.
Table 2.
Evaluation of regional intergroup differences through ANOVA and the Kruskal–Wallis test.
The Kruskal–Wallis test indicated statistically significant differences in the distributions of all six variables across the four regional groups (). These results provide rank-based evidence of regional differences. However, the omnibus tests do not identify which specific pairs of regions differ.
Following the statistically significant Kruskal–Wallis tests, Dunn’s pairwise post hoc comparisons with Holm adjustment were conducted to identify the specific regional differences (Appendix C, Table A2). For the AIPI and its four components, all pairwise regional comparisons were statistically significant except for the comparison between Asia and Oceania and the Americas. For publication output, significant differences were observed between Africa and Asia and Oceania, Africa and Europe, Asia and Oceania and the Americas, and Europe and the Americas. The comparisons between Africa and the Americas and between Asia and Oceania and Europe were not statistically significant after Holm adjustment.
At the next stage, correlation and simple linear regression analyses were then conducted to examine the unadjusted bivariate associations between AI publication output and the AI Preparedness Index (AIPI), including its individual components, across different regions (Table 3). Detailed regression results by region are provided in Appendix C, Table A3.
Table 3.
Correlation and regression analysis of the relationship between AI Publication Footprint and National AI Readiness by region.
The results indicate moderate to strong positive bivariate associations between AI publication output and the composite AIPI and most of its components. At the global level, all reported associations are positive and statistically significant, supporting H1. The strongest global association is observed for digital infrastructure. The component-level regressions describe separate unadjusted associations between publication output and the individual dimensions of national AI readiness; they do not identify the independent contribution of any single component or establish a causal relationship.
For the global component-level models, the values of range from 0.294 to 0.552. These values indicate the proportion of cross-sectional variation accounted for by the corresponding bivariate models, but they may also reflect broader socioeconomic, institutional, and historical conditions. Therefore, they should not be interpreted as the unique contribution of AI publication footprint to national AI readiness.
To visualize the relationship between the intensity of scientific research in the field of artificial intelligence, measured by the number of publications in Scopus, and the level of governmental digital readiness, measured by the AIPI, scatter plots with regression lines were constructed for each geographic region (Figure 1).
Figure 1.
Relationship between AI Preparedness Index (AIPI) and the number of AI-related scientific publications by region.
From a regional perspective, the estimated associations vary across the four groups. In the Americas, the highest observed correlations and explanatory values are found for digital infrastructure (, ) and human capital and the labor market (, ). These results indicate that, within this regional group, AI publication output is most closely associated with these dimensions of national AI readiness.
Europe demonstrates relatively high estimated associations, particularly between AI publication output and innovation and economic integration (, ) and digital infrastructure (, ). These results describe a relatively strong statistical association between publication output and the corresponding readiness dimensions.
In the Asia and Oceania region, all examined associations are positive and statistically significant. The highest values are observed for digital infrastructure () and regulation and ethics ().
In Africa, the estimated associations are generally weaker, with values not exceeding 0.343. The association between AI publication output and innovation and economic integration is negative and statistically insignificant (). This result indicates the absence of evidence of a statistically significant bivariate association for this particular dimension and regional group. It should not, by itself, be interpreted as direct evidence of structural barriers.
The regional coefficients therefore show descriptive variation in the strength and direction of the estimated associations. However, because no formal cross-region comparison of regression slopes or correlation coefficients was performed, these results do not establish that the coefficients differ statistically between regions. In particular, a statistically significant coefficient in one region and a non-significant coefficient in another should not be interpreted as formal evidence of a difference between the two coefficients. Accordingly, the regional findings are treated as exploratory and descriptive rather than as formal confirmation that geographic location affects the relationship between AI publication footprint and national AI readiness.
The regional differences in the levels and distributions of AI research output and national AI readiness indicators are consistent with H2. The subgroup-specific associations reported in Table 3 are presented as exploratory descriptive patterns and are not interpreted as formal evidence that regression coefficients differ significantly across regions. These findings do not imply that geographic location causally determines either research activity or national AI readiness.
4.2. Income-Level Patterns in the Relationship Between AI Publication Footprint and National AI Readiness
The geographic analysis enabled the identification of regional differences in AI publication output and national AI readiness. However, geographic location alone may not fully explain the observed patterns. Therefore, socioeconomic characteristics, particularly countries’ income levels, were also examined.
The analysis of differences in group means and rank distributions (Table 4) identified statistically significant differences across income groups for all AI Preparedness Index dimensions and publication output. The Kruskal–Wallis test was statistically significant for all examined variables: AIPI, digital infrastructure, innovation and economic integration, human capital and labor-market policies, regulation and ethics, and publication output ().
Table 4.
Evaluation of income level intergroup differences through ANOVA and the Kruskal–Wallis test.
Descriptively, the mean values generally decreased from high-income to low-income groups across all indicators. These results indicate differences in the levels and distributions of AI publication output and national AI readiness across income groups. They should not, however, be interpreted as evidence that income level directly causes differences in national AI readiness or publication output. Because Bartlett’s test indicated heterogeneous variances for several variables, the Kruskal–Wallis results were treated as the primary evidence for those comparisons, while conventional ANOVA results were considered supplementary.
To examine the unadjusted associations between AI publication output and the indicators of the AI Preparedness Index, correlation and simple linear regression analyses were conducted separately for each income group (Table 5).
Table 5.
Correlation and regression analysis of the relationship between AI Publication Footprint and National AI Readiness indicators by income group.
Dunn’s pairwise post hoc comparisons with Holm adjustment showed that all pairwise income-group comparisons (Appendix C, Table A4) were statistically significant for AIPI, digital infrastructure, human capital and labor-market policies, and regulation and ethics. For innovation and economic integration, high-income countries differed significantly from each of the other three income groups, whereas no statistically significant differences were found among low-income, lower-middle-income, and upper-middle-income countries.
For publication output, high-income countries differed significantly from all other income groups, and the comparison between low-income and lower-middle-income countries was also statistically significant. However, the difference between lower-middle-income and upper-middle-income countries was not statistically significant after Holm adjustment.
To identify the existing interdependencies between the number of scientific publications in the field of artificial intelligence and the indicators of the AI Preparedness Index, correlation and regression analyses were again conducted, with countries classified by income level; the results are presented in Table 5, and detailed regression results by income group are provided in Appendix C, Table A5.
Among high-income countries, all five examined associations are positive and statistically significant. The strongest observed relationships are found between publication output and digital infrastructure (, ) and between publication output and innovation and economic integration (, ). These results indicate relatively strong bivariate associations between AI publication output and the corresponding dimensions of national AI readiness.
In upper-middle-income countries, positive statistically significant associations are observed for AIPI, digital infrastructure, innovation and economic integration, and human capital and labor-market policies. The strongest observed correlation is again found for digital infrastructure (, ). The association with regulation and ethics is weaker and statistically insignificant (). This pattern is consistent with a weaker observed association between publication output and the regulatory and ethical dimension of national AI readiness in this income group. It does not, however, establish why this association is weaker.
In lower-middle-income countries, the point estimates are generally lower than those observed for high-income countries, although the strength of the associations is not formally compared across income groups in the present analysis. Digital infrastructure retains a relatively strong positive association with publication output (, ). Positive statistically significant associations are also observed for AIPI, human capital and labor-market policies, and regulation and ethics. The association with innovation and economic integration is statistically insignificant (), which may be consistent with the possibility that the relationship between AI research output and innovation-related readiness varies across countries in this income group.
In low-income countries, most of the estimated associations are positive but statistically insignificant. The only statistically significant association is observed for digital infrastructure (, ). The associations with AIPI, innovation and economic integration, human capital and labor-market policies, and regulation and ethics are not statistically significant. These results indicate that, within this subgroup, publication output is most consistently associated with the infrastructure dimension of national AI readiness. The observed pattern may be consistent with the possibility that broader socioeconomic and institutional conditions shape the relationship between AI research output and national AI readiness; however, these conditions were not directly tested in the present models.
The visualization of the relationship between the intensity of scientific research in the field of artificial intelligence, measured by the number of publications in Scopus, and the overall level of governmental digital readiness, measured by the AIPI, is presented in Figure 2.
Figure 2.
Relationship between AI Preparedness Index (AIPI) and the number of AI-related scientific publications by income group.
The income-group analysis identified descriptive differences in the levels and distributions of AI publication output and national AI readiness indicators, consistent with H3. However, the subgroup-specific correlation and regression coefficients are reported as exploratory patterns. Because no formal cross-income comparison of regression slopes or correlation coefficients was performed, these results do not establish that the strength of the associations differs statistically between income groups. They also do not imply that income level causally determines AI research output or national AI readiness.
4.3. Cluster Analysis of Countries Based on AI Publication Footprint and National AI Readiness
The previous analyses by geographic region and country income group identified substantial differences in AI publication output and national AI readiness. To examine multidimensional similarities between countries, hierarchical cluster analysis was conducted using Ward’s method. The analysis was intended to identify internally homogeneous groups of countries with similar profiles across the selected AI readiness indicators and publication output.
The full country-level dataset comprised 173 countries. After data validation, countries with missing values were removed, and the final clustering dataset consisted of 164 unique countries with complete observations for all clustering variables. The nine countries excluded from the clustering procedure because of missing values are listed in Appendix A. The cluster analysis was therefore conducted on the complete-case clustering dataset rather than on the full country-level sample.
The optimal number of clusters was determined using the Calinski–Harabasz and Duda–Hart methods (Table 6). Although the Calinski–Harabasz index attains its highest value for two clusters, this division is overly general and merely confirms the existence of a global dichotomy between “digital leaders” and “catching-up countries.” Therefore, the Duda–Hart result was taken as the basis, indicating the optimality of a four-cluster model. In addition to purely mathematical criteria, the choice of the four-cluster model is driven by the need to verify hypotheses H2 and H3 in detail. Unlike the two-cluster division, this configuration allows identification not only of the poles of the global divide but also of intermediate groups of countries.
Table 6.
Determination of the optimal number of clusters using the Calinski–Harabasz and Duda–Hart methods.
At the next stage, the characteristics of each of the four formed clusters were analyzed (Table 7). The list of countries included in each cluster is provided in Appendix A, and their distribution is shown in Figure 3 below.
Table 7.
Characteristics of clusters based on AI Publication Footprint and National AI Readiness.
Figure 3.
World map of cluster distribution by AI Publication Footprint and National AI Readiness.
The first cluster, which comprises 36 countries (21.95% of the clustered sample), is characterized by moderately high values of the index and its components, as well as by AI publication output above the overall clustered-sample average. These countries demonstrate relatively positive observed conditions for the development of digital technologies and may have the potential to further strengthen their research and institutional bases. They can be regarded as countries at an intermediate stage of transition toward a more mature digital ecosystem.
The following national policy examples are provided as contextual illustrations. They were not included as clustering variables and therefore do not constitute direct empirical characteristics of the clusters. Contextual policy information indicates that many countries in this cluster are developing or improving their national AI strategies. For example, the United Arab Emirates (UAE) has adopted a National Strategy for AI and established institutional arrangements for AI governance, which may be consistent with strong political support and strategic attention to AI development. Other countries in the region, such as Saudi Arabia, Mexico, Oman, and Bahrain, have also developed national AI strategies or are preparing related policy documents. These countries predominantly use forms of “soft regulation” based on ethical principles, roadmaps, and recommendations (International Association of Privacy Professionals).
Contextual policy reports also describe ongoing AI-related regulatory and institutional initiatives in Ukraine, including the development of a roadmap for AI regulation, a regulatory sandbox, and participation in international pilot projects. These examples are used to illustrate the policy context and were not used to define the cluster.
The second cluster, which includes 22 countries (13.41% of the clustered sample), demonstrates the highest mean values across all indicators. This cluster is characterized by comparatively high observed levels of national AI readiness and AI publication output, as well as strong digital, innovation, human-capital, regulatory, and ethical dimensions. It includes economically developed countries with well-developed digital infrastructure, active innovation and scientific activity, and established AI-related policies.
Contextual policy information indicates that countries in this cluster have developed national AI strategies addressing areas such as ethics, security, innovation, education, and data governance. For example, the United States, the United Kingdom, and Canada have adopted comprehensive AI policy frameworks, while European countries such as France, the Netherlands, Denmark, and Finland implement relevant provisions of the EU AI Act. Singapore and South Korea also demonstrate strong institutional support for AI innovation and start-up development [19]. These policy examples are illustrative and were not included as variables in the cluster construction.
The observed cluster profile may provide favorable structural conditions for the integration of AI into higher education, professional development, and innovation-oriented learning environments. However, educational implementation was not directly measured in the cluster analysis.
The third cluster, which comprises 50 countries (30.49% of the clustered sample), includes countries with average or slightly below-average values across the examined indicators. Most countries in this cluster have some basic prerequisites for AI development, but their policy frameworks may remain at the stages of development, consultation, or partial implementation.
For example, India and Brazil have national AI strategies focused on inclusive development, while their implementation may be affected by institutional and coordination challenges. Georgia, Armenia, Moldova, and Belarus demonstrate active interest in digital transformation, although their AI policy frameworks may not be fully developed. In Asian countries such as Indonesia, Bangladesh, and Sri Lanka, AI policies are often integrated into broader digitalization strategies rather than enacted through separate regulatory acts. Pakistan and Iran have developed conceptual policy documents, although their implementation may be influenced by broader political and economic conditions.
African countries, including Ghana, Nigeria, Egypt, Rwanda, and South Africa, among others, have developed or launched national AI strategies that include ethical principles, educational initiatives, and infrastructure development plans [42]. These examples are consistent with efforts to address the digital divide through regional coordination. In particular, the Africa Declaration on Artificial Intelligence provides a framework for the development of national AI bodies, ethical standards, and responsible AI implementation [43]. These policy examples are contextual and were not used as clustering variables.
The fourth cluster is the largest, comprising 56 countries (34.15% of the clustered sample), and brings together countries with the lowest observed values across the AIPI components and the lowest level of AI publication output. This cluster therefore represents countries with comparatively weaker observed structural conditions for AI adoption and lower levels of publication-based AI knowledge production.
Contextual policy information suggests that countries in this cluster are increasingly integrating AI into broader digital transformation agendas in healthcare, education, agriculture, and public administration. Some initiatives are implemented with the support of international partners, including the African Union, the United Nations, the World Bank, and technology companies. These examples provide contextual information about possible policy environments but were not included in the cluster analysis.
For example, Benin has developed a National Strategy for AI and Big Data that includes ethical principles and human-capital development. In Cameroon and Burkina Faso, AI is being integrated into broader digital strategies, while Zambia has reported AI-related initiatives aimed at addressing disinformation during elections. These examples suggest the relevance of locally adapted approaches that take into account socioeconomic conditions, levels of digital literacy, and access to basic technologies [44]. They should not, however, be interpreted as direct empirical explanations of the cluster profile.
The implications of these different national contexts for sustainable educational use of AI are considered in the Section 5. In particular, the extent to which education systems can use AI sustainably may depend on infrastructure, human capital, institutional support, and responsible governance, although these educational outcomes were not directly measured in the present cluster analysis.
5. Discussion
The results indicate a complex and multidimensional association between AI publication footprint and national AI readiness across geographic regions and income groups. In this study, AI publication footprint is used as an indirect indicator of national AI knowledge-production capacity rather than as a direct measure of implementation readiness. National AI readiness is understood as a multidimensional set of infrastructural, human-capital, institutional, and governance conditions relevant to the adoption and responsible use of AI. The results should therefore be interpreted as evidence of statistical alignment between knowledge production and structural preparedness, rather than as evidence that scientific activity directly causes national AI readiness or successful AI implementation.
Several plausible mechanisms may help explain this association. First, evidence-informed policymaking may connect academic research with the development of national AI strategies and regulatory frameworks. Second, universities may contribute to human-capital formation by training specialists whose expertise can support digital transformation in public institutions and other sectors. Third, knowledge exchange may emerge through collaboration among academia, industry, and government. These mechanisms were not directly tested in the present study and should therefore be interpreted as possible explanatory pathways rather than demonstrated causal effects.
At the same time, these mechanisms should not be treated as the only possible explanations for the observed relationship. The association may partly reflect broader socioeconomic and institutional conditions that influence both AI publication output and national AI readiness. Wealthier countries may have greater R&D capacity, more universities and researchers, stronger scientific infrastructure, and higher levels of institutional quality. Population size may also contribute to higher publication counts. General research capacity and historical scientific accumulation may similarly affect both variables. In addition, some components of the AI Preparedness Index, particularly human capital and innovation and economic integration, may conceptually overlap with the factors that support scientific publication activity. The observed relationship may therefore partly reflect shared structural conditions or a partly mechanical association rather than a specific effect of AI publication footprint. Because the present models are bivariate and cross-sectional, they cannot distinguish these alternative explanations.
These findings are consistent with several international studies that have also identified substantial regional and socioeconomic disparities in AI development. In particular, Alonso et al. emphasize that the implementation of AI may deepen global economic divides, as countries with advanced technological development receive disproportionate benefits. At the same time, less developed economies may lose competitive advantage due to the automation of low-skilled labor [45].
In turn, the World Economic Forum highlights an “AI divide” between the Global North and the Global South, where access to data, infrastructure, and human capital remains substantially uneven [3]. This raises the possibility that AI may fail to reduce digital inequality and may instead intensify it unless inclusive access to technologies and adaptive regulation are ensured. Taken together, these findings support the importance of context-sensitive policy frameworks that account for structural differences between countries.
The study by Mohammadi and Maghsoudi also found that perceptions of AI differ substantially across countries by income level [48]. In high-income countries, discussions of ethical aspects, algorithmic transparency, and the risks of automation dominate, whereas in low-income countries, the main topics are economic challenges and barriers to access to technologies. These findings are consistent with the weaker observed relationship between AI publication output and regulatory and ethical readiness in some lower-income groups. At the same time, the closer integration of AI with digital governance policies reported in high-income countries may be associated with stronger institutional trust in technology, although this mechanism was not directly examined in the present study.
Another important direction that complements this analysis is the assessment of countries’ readiness for AI implementation based on their economic complexity. Mandon uses the IMF AI Preparedness Index and the multidimensional Economic Complexity Index and proposes a data-oriented methodology for identifying countries that exceed expected levels of AI preparedness [17]. This approach allows countries to be classified as global or local leaders according to the extent to which their observed indicators exceed predicted values and the medians of their respective income groups.
One possible implication of these findings concerns the sustainability of education systems under conditions of rapid AI diffusion. Although the present study does not measure specific classroom tools, institutional AI adoption, teacher AI literacy, pedagogical outcomes, student digital competencies, or student creativity, it highlights national conditions that may be relevant to the development, adaptation, and sustainability of such educational innovations. National AI readiness may therefore represent a macro-level enabling condition for more equitable and context-sensitive AI-enabled education, but this interpretation is not a direct empirical finding of the present study.
Recent research suggests that AI adoption in education is increasingly associated with personalized learning, assessment support, administrative optimization, and new forms of instructional design, yet these benefits are unevenly distributed across institutional and national contexts [53]. Systematic reviews further show that, without adequate safeguards, the expansion of AI in education may reproduce or deepen existing inequalities related to access, capability, and governance [54.55]. In this sense, the global AI divide may also have an educational dimension.
From a sustainability perspective, durable educational transformation requires countries to build institutional capacity in at least three interconnected areas: digital infrastructure, human-capital formation, and responsible governance. Recent reviews on responsible AI in education emphasize that sustainable adoption depends not only on the availability of tools but also on fairness, transparency, privacy protection, accountability, and context-sensitive implementation [54]. At the same time, studies on digital and AI literacy show that meaningful integration also requires long-term investment in teachers’, students’, and institutions’ capabilities [56]. Without such alignment, AI adoption in education may remain superficial, inequitable, or dependent on external platforms rather than contributing to locally embedded and sustainable learning ecosystems.
Future research should connect national AI readiness indicators with education-specific measures, including institutional AI adoption, teacher AI literacy, digital learning infrastructure, student digital competencies, educational access, educational expenditure, and AI-supported learning outcomes.
For policymakers, these patterns suggest that investment in AI should not be limited to research output, innovation branding, or national competitiveness narratives alone. Attention should also be given to teacher training, curriculum modernization, university research capacity, public digital infrastructure, and ethical governance within educational institutions. Recent evidence shows that structured teacher training can improve AI literacy and confidence [57]. In contrast, reviews of teacher professional development identify the need for systematic institutional support if AI is to be integrated responsibly into educational practice [58]. Accordingly, education may be considered an important institutional domain through which national AI capacity can be strengthened over time, although this proposition requires direct empirical testing.
Despite the cross-country approach to analyzing the alignment between AI research output and national AI readiness, the study has several limitations. First, the use of scientometric data from the Scopus database enables the assessment of global trends and ensures comparability across countries. However, the number of AI-related publications reflects academic research output only. It does not directly capture AI investment, technology adoption, patent activity, startup ecosystems, computational and data infrastructure, or the practical implementation of AI in public and private sectors. Therefore, publication output should be interpreted as a proxy for publication-based AI knowledge-production capacity rather than as a comprehensive indicator of national AI capacity or readiness. In addition, Scopus data do not capture all local publications, applied developments, and informal initiatives that may substantially influence digital transformation in individual countries.
Second, the cumulative Scopus publication count is sensitive to population size, the number of universities and researchers, GDP, R&D expenditure, and the historical accumulation of scientific activity. Because the present study does not use population-, researcher-, GDP-, or R&D-normalized indicators, docum should be interpreted as a measure of the absolute scale of publication-based AI knowledge production rather than as an efficiency-adjusted indicator of research volume. This limitation is particularly important for cross-country comparisons, as larger and wealthier countries may produce more publications because of their broader scientific and economic base. Future research could complement the present approach with normalized and field-adjusted indicators.
Third, the aggregated AI Preparedness Index used in the study does not always reflect current changes caused by new policy decisions, investments, or crisis events. However, its use enables comparability across countries and provides a general picture of structural AI preparedness. Future research should complement composite indicators with more flexible measures that account for contextual changes and the specific features of national strategies.
Fourth, the scientometric corpus was constructed through extensive keyword-based searches and includes publications from different fields, document types, and research contexts. Although this approach supports broad coverage, it may not provide a fully standardized measure of research quality or practical relevance. Publication counts primarily capture the volume of visible research output and do not necessarily reflect its methodological quality, citation influence, technological novelty, or real-world impact. The inclusion of the standalone term “AI” may also have introduced false-positive records because the abbreviation can occur in unrelated contexts. In addition, the exclusion of records without sufficient English-language metadata may have created language and geographic bias, potentially underrepresenting research from countries where publication metadata are less consistently available in English. Future bibliometric studies should apply transparent and reproducible inclusion criteria and compare the current query with more restrictive search strategies.
Fifth, the regression models are bivariate and cross-sectional. They describe the observed association between publication output and each readiness indicator but do not estimate causal effects or the independent contribution of individual AIPI components. Shared underlying conditions, including country size, historical economic development, research investment, institutional quality, and integration into international scientific networks, may influence these relationships. Moreover, the human-capital and innovation-related components of the AIPI may partly overlap conceptually with the factors that support publication activity. The possibility of omitted-variable confounding, mechanical association, and reverse association should therefore be considered when interpreting the coefficients and values.
The regional and income-group analyses also have several statistical limitations. The subgroup-specific coefficients were estimated separately, but formal tests of differences between regression slopes or correlation coefficients were not conducted. Therefore, differences in the magnitude or statistical significance of subgroup coefficients should be interpreted descriptively rather than as formal evidence that the strength of the association differs between groups. In addition, the analyses involve multiple comparisons, heterogeneous variances, and unequal subgroup sizes. These factors may increase uncertainty and the risk of false-positive findings, particularly because the reported p-values were not adjusted through a formal multiple-testing procedure.
Sixth, after data validation and removal of duplicate country assignments, the cluster analysis was conducted on 164 unique country observations with complete data for all clustering variables, whereas the broader country-level dataset contained 173 countries. The nine countries excluded from the clustering procedure and the treatment of missing observations are reported in Appendix A. Because the Calinski–Harabasz and Duda–Hart criteria did not provide fully convergent evidence regarding the optimal number of clusters, and because formal cluster-stability analysis was not conducted, the four-cluster solution should be interpreted as exploratory.
Seventh, another limitation concerns the temporal comparability of the variables. The AI Preparedness Index reflects countries’ structural preparedness in 2023, whereas the Scopus indicator aggregates AI-related publications accumulated between 1980 and 2023. Consequently, the publication variable captures a historical stock of knowledge production and may reflect research capacity developed over several decades rather than current research activity. The common 2023 endpoint improves reference-year consistency but does not eliminate this conceptual difference. The results should therefore be interpreted as an association between accumulated AI knowledge production and contemporaneous national AI preparedness. Future research should examine whether the findings remain stable when recent publication windows, annual averages, publication growth rates, or rolling-period measures are used.
6. Conclusions
This study aimed to assess the alignment between AI publication footprint, measured using data from the Scopus scientometric database, and national AI readiness, measured by the IMF AI Preparedness Index, across countries grouped by geographic region and income level. The results indicate an observed global association, but its nature is complex, multidimensional, and related to regional policies, infrastructure, and institutional environments. AI publication footprint and national AI readiness should therefore be understood as related but distinct dimensions of national AI capacity.
Regional analysis reveals significant differences in the levels of the examined indicators and variation in the estimated bivariate associations. In the Americas, the observed associations are strongest, particularly between AI publication output, digital infrastructure, and human capital. In Europe, AI research output is associated with innovation-oriented integration, while in Asia and Oceania, it is associated with digital infrastructure and regulatory and ethical readiness. Conversely, Africa demonstrates generally lower relationship coefficients, with a statistically insignificant association between publication output and innovation and economic integration.
Analysis by income level further reveals socioeconomic differences in the observed patterns. High-income countries demonstrate stronger observed associations between publication output, infrastructure, and economic integration. As income levels decrease, the estimated associations generally become weaker, particularly with respect to regulatory and ethical readiness. In low-income countries, digital infrastructure is the only dimension showing a statistically significant association with publication output. These patterns may reflect broader socioeconomic and institutional conditions that were not directly modeled in the present study.
The cluster analysis identified distinct national profiles based on AI readiness indicators and publication output. Countries in Cluster 2 exhibit the highest observed values across the examined indicators, whereas Cluster 4 contains countries with the lowest observed values. These results suggest that countries may follow different pathways toward national AI readiness rather than a single linear model of development. However, the four-cluster solution should be interpreted as exploratory, particularly because the clustering criteria did not provide fully convergent evidence and the cluster analysis was based on 164 complete country observations.
These findings may have potential implications for future research and policy discussions on sustainable education. However, because the study does not directly measure classroom technologies, institutional AI adoption, teacher AI literacy, pedagogical outcomes, or student creativity, it should not be interpreted as evidence that AI publication footprint or national AI readiness directly improve educational outcomes. Rather, the findings suggest a hypothesis that infrastructure, human capital, innovation ecosystems, and responsible governance may shape the context in which inclusive and sustainable AI-supported educational initiatives can develop. This hypothesis requires direct testing using education-specific, longitudinal, and outcome-based data.
Taken together, the findings support a differentiated and context-sensitive approach to AI policy. National strategies should account not only for geographic and economic characteristics but also for structural conditions related to infrastructure, human-capital formation, innovation capacity, and responsible governance. However, the AI Publication Footprint measures the absolute cumulative volume of AI-related Scopus publications from 1980 to 2023; it is not a normalized measure of research intensity and does not directly capture AI investment, adoption, implementation, or educational outcomes. The study therefore examines the association between a historical stock of knowledge production and contemporaneous national AI preparedness in 2023. Because the analysis is cross-sectional and primarily bivariate, the results indicate observed associations rather than causal effects and cannot rule out confounding. Accordingly, the implications for education and sustainability should be understood as hypotheses and potential policy considerations requiring direct empirical testing.
Author Contributions
Conceptualization, A.V. and A.A.; methodology, A.V.; software, A.A. and D.C.; validation, A.V., N.A., and D.C.; formal analysis, N.A.; investigation, A.V. and N.A.; resources, D.C.; data curation, A.V. and N.A.; writing—original draft preparation, A.V. and A.A.; writing—review and editing, N.A. and D.C.; visualization, N.A.; supervision, A.V.; project administration, A.A.; funding acquisition, N.A. and D.C. All authors have read and agreed to the published version of the manuscript.
Funding
This research was funded by the Ministry of Education and Science of Ukraine, “Modeling and forecasting of socioeconomic consequences of higher education and science reforms in wartime” (No. 0124U000545) and by EU project “Immersive Marketing in Education: Model Testing and Consumers’ Behavior” (No. 09I03-03-V04-00522/2024/VA).
Institutional Review Board Statement
Not applicable.
Informed Consent Statement
Not applicable.
Data Availability Statement
The raw data supporting the conclusions of this article will be made available by the authors on request.
Acknowledgments
The authors thank the reviewers for their valuable advice, which significantly improved the quality of the manuscript.
Conflicts of Interest
The authors declare no conflicts of interest.:
Abbreviations
The following abbreviations are used in this manuscript:
| AI | Artificial intelligence |
| AIPI | AI Preparedness Index |
| ANOVA | Analysis of variance |
| IMF | International Monetary Fund |
| OECD | Organization for Economic Co-operation and Development |
| SDG | Sustainable Development Goal |
| UN | United Nations |
| EU | European Union |
| UAE | United Arab Emirates |
| UK | United Kingdom |
| MS Excel | Microsoft Excel |
Appendix A
Figure A1.
Dynamics of scientific publications dedicated to research in the field of artificial intelligence in the Scopus database, 1980–2025.
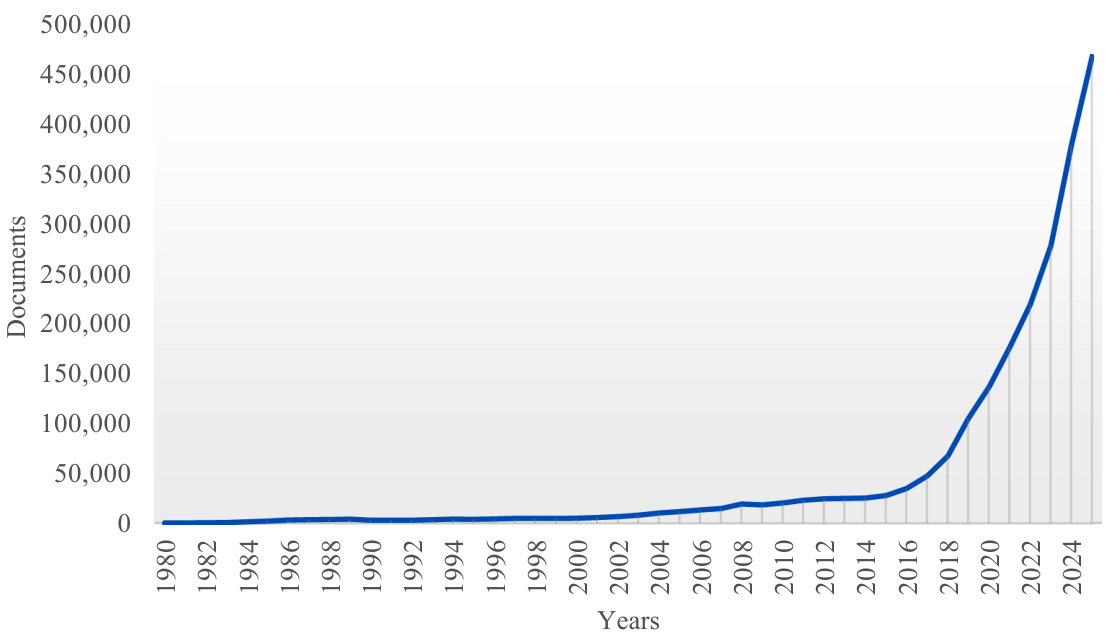
Figure A2.
Distribution of scientific publications dedicated to research in the field of artificial intelligence in the Scopus database by subject area, 1980–2025.
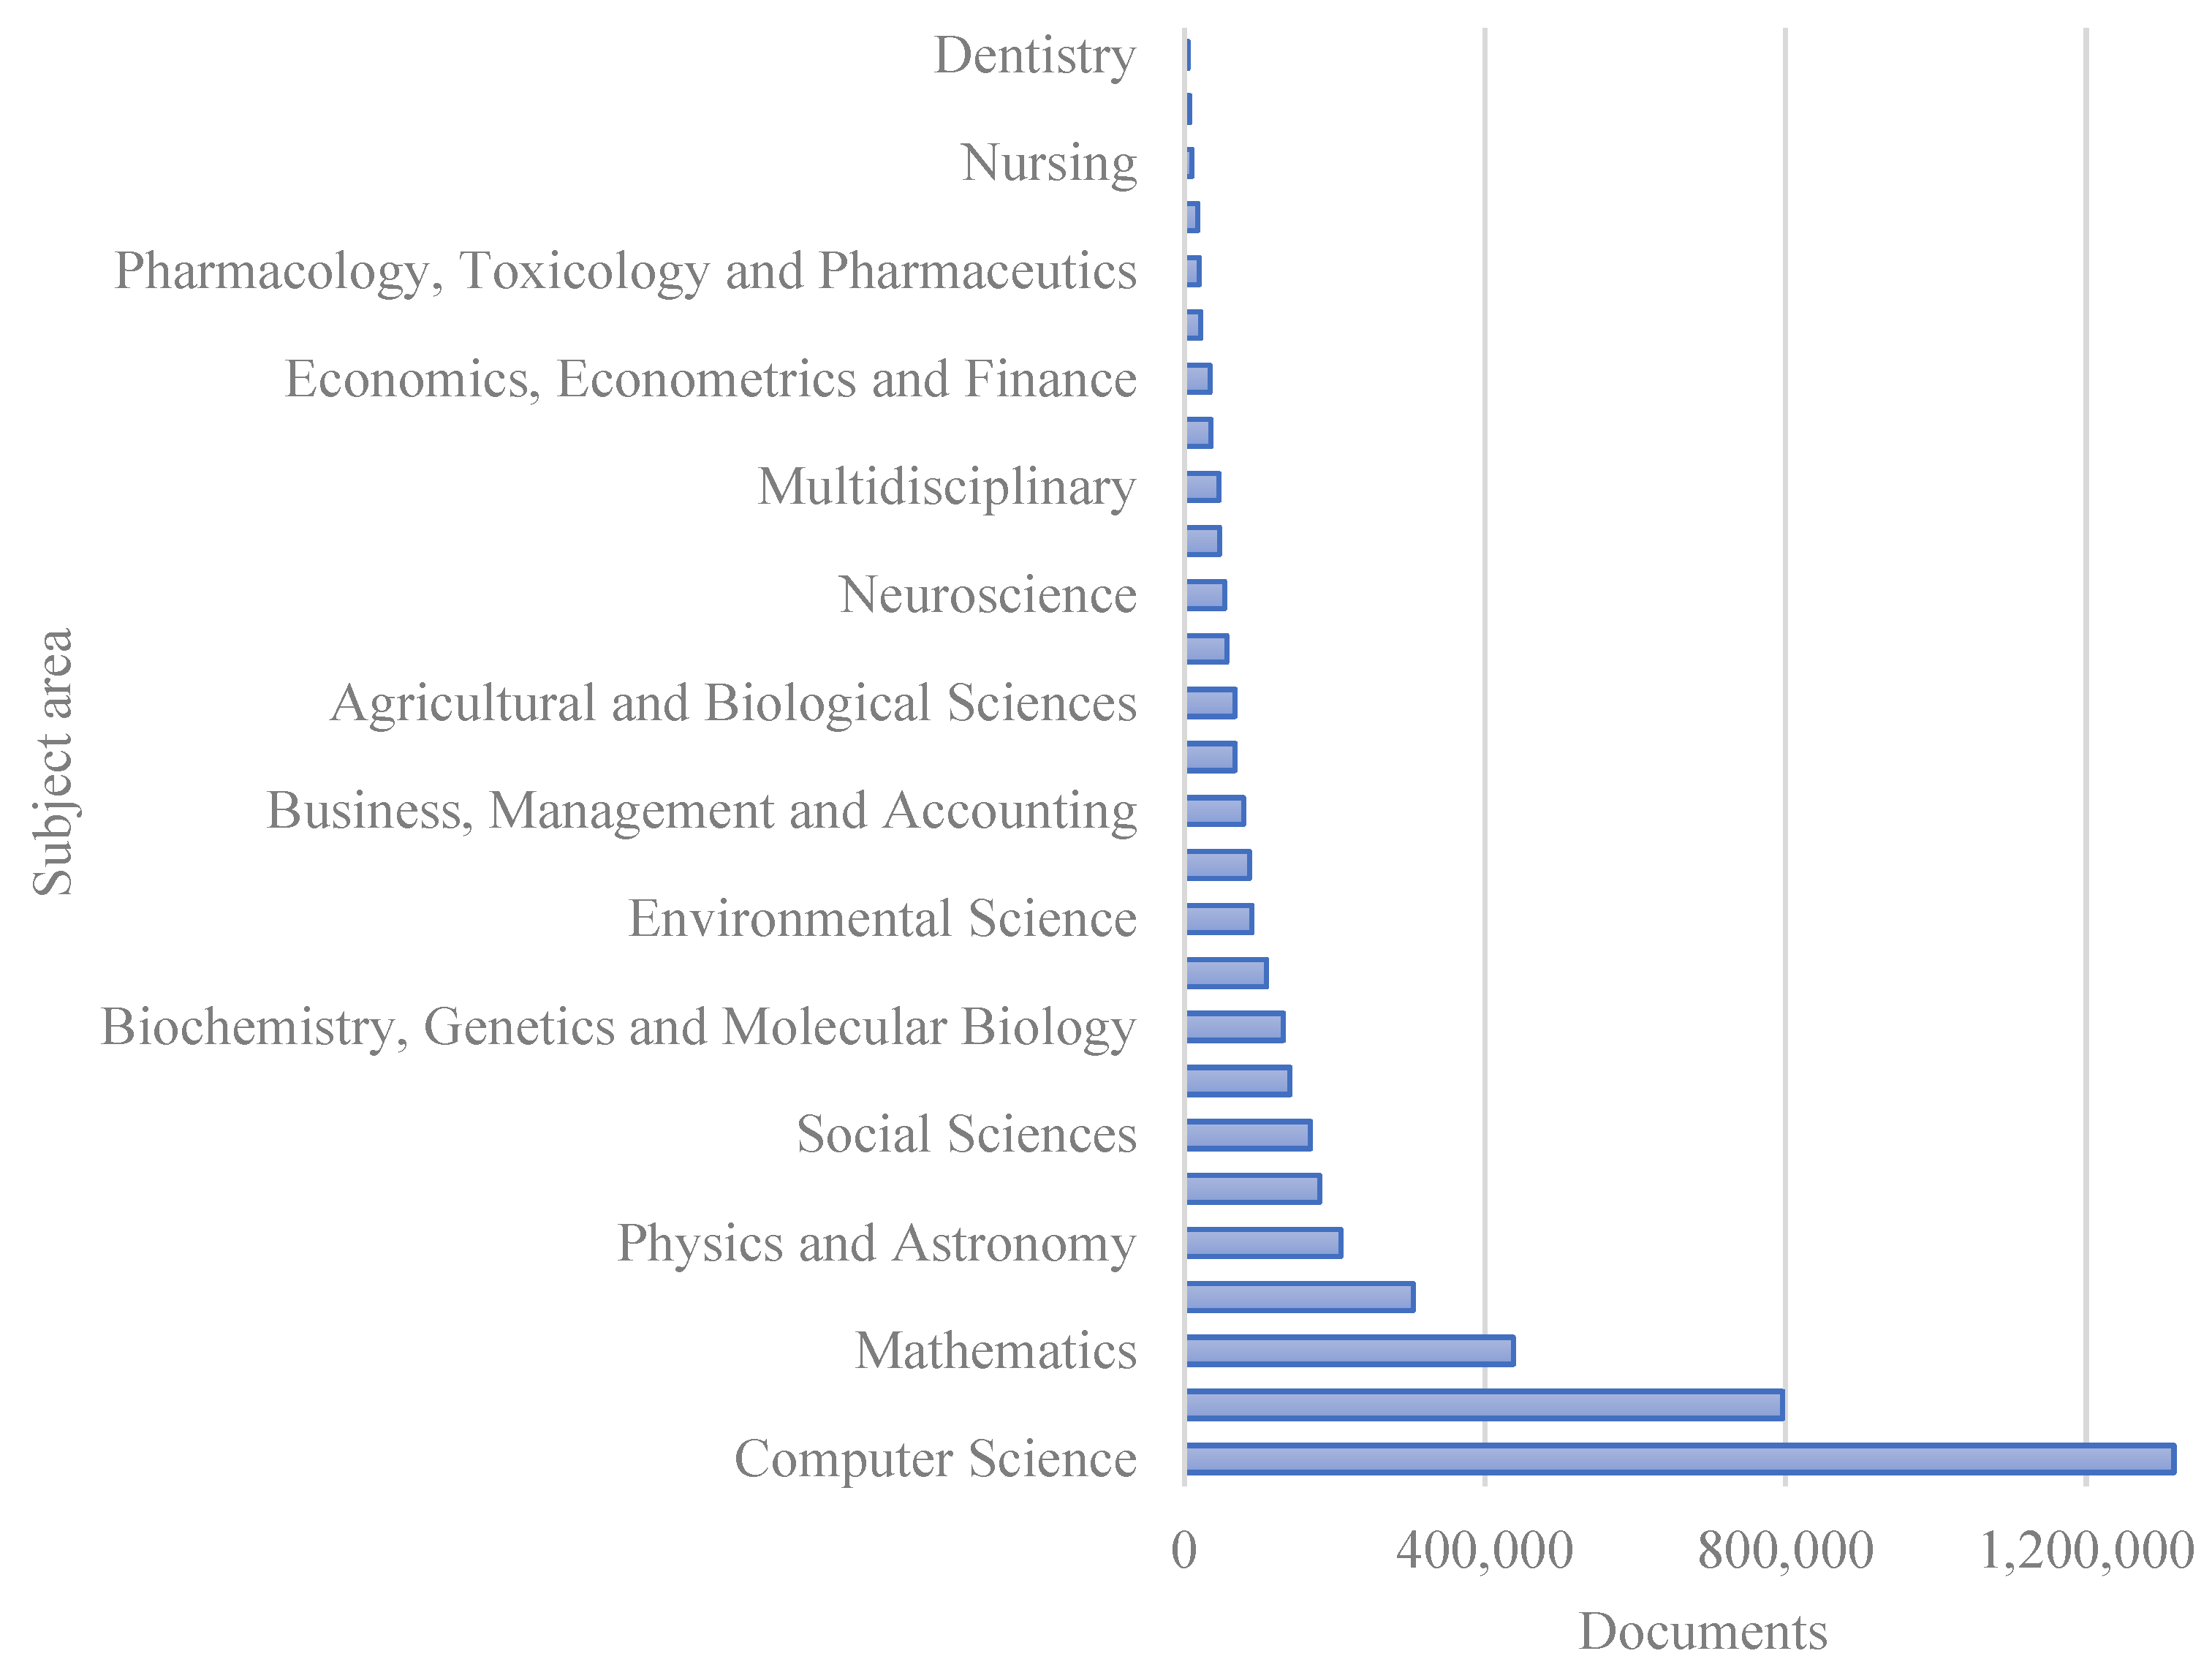
Figure A3.
Distribution of scientific publications dedicated to research in the field of artificial intelligence in the Scopus database by geographical regions.
Appendix B
Table A1.
Cluster distribution by AI readiness and research activity.
Appendix C
Table A2.
Holm-adjusted Dunn’s pairwise post hoc comparisons across geographic regions.
Table A3.
Detailed regression analysis of the relationship between AI publications and AI Preparedness Index indicators by region.
Table A4.
Holm-adjusted Dunn’s pairwise post hoc comparisons across income groups.
Table A5.
Detailed regression analysis of the relationship between AI publications and AI Preparedness Index indicators by income group.
References
- Stanford University. AI Index Report 2025; Stanford University Human-Centered Artificial Intelligence: Stanford, CA, USA, 2025; Available online: https://hai.stanford.edu/assets/files/hai_ai_index_report_2025.pdf (accessed on 11 June 2025).
- Cazzaniga, M.; Jaumotte, F.; Li, L.; Melina, G.; Panton, A.; Pizzinelli, C.; Rockall, E.; Tavares, M.M. Gen-AI: Artificial Intelligence and the Future of Work. IMF Staff Discuss. Note 2024, 2024, 41. [Google Scholar] [CrossRef] [Scilit]
- World Economic Forum. AI in Action: Beyond Experimentation to Transform Industry; Flagship White Paper Series; World Economic Forum: Cologny/Geneva, Switzerland, 2025; Available online: https://reports.weforum.org/docs/WEF_AI_in_Action_Beyond_Experimentation_to_Transform_Industry_2025.pdf (accessed on 15 June 2025).
- Huchler, N. More than Bias: Social and Technological Selectivities of (Subsymbolic) Artificial Intelligence. Artif. Intell. Soc. 2024, 51–79. [Google Scholar] [CrossRef] [Scilit]
- OECD. The State of Implementation of the OECD AI Principles Four Years On. 2023. Available online: https://doi.org/10.1787/835641c9-en (accessed on 11 June 2025). [CrossRef] [Scilit]
- Espina-Romero, L.; Guerrero-Alcedo, J. Fields Touched by Digitalization: Analysis of Scientific Activity in Scopus. Sustainability 2022, 14, 14425. [Google Scholar] [CrossRef] [Scilit]
- Bijou, M.; Elmoutaouakkil, A. Synergy between Artificial Intelligence and Digital Transformation: A Systematic Review and Bibliometric Analysis. In Proceedings of the 6th International Advanced Research in Accounting, Economics, and Management, Prague, Czech Republic, 20–22 September 2024; Volume 2, pp. 12–30. [Google Scholar] [CrossRef] [Scilit]
- Duan, Y.; Edwards, J.S.; Dwivedi, Y.K. Artificial Intelligence for Decision Making in the Era of Big Data—Evolution, Challenges and Research Agenda. Int. J. Inf. Manag. 2019, 48, 63–71. [Google Scholar] [CrossRef] [Scilit]
- Alzubi, T.M.; Alzubi, J.A.; Singh, A.; Alzubi, O.A.; Subramanian, M. A Multimodal Human-Computer Interaction for Smart Learning System. Int. J. Hum.-Comput. Interact. 2023, 41, 1718–1728. [Google Scholar] [CrossRef] [Scilit]
- Auza-Santiváñez, J.C.; Díaz, J.A.C.; Cruz, O.A.V.; Robles-Nina, S.M.; Escalante, C.S.; Huanca, B.A. Bibliometric Analysis of the Worldwide Scholarly Output on Artificial Intelligence in Scopus. SAP Gamification Augment. Real. 2023, 1, 11. [Google Scholar] [CrossRef] [Scilit]
- Bajpai, A.; Yadav, S.; Nagwani, N.K. An Extensive Bibliometric Analysis of Artificial Intelligence Techniques from 2013 to 2023. J. Supercomput. 2025, 81, 540. [Google Scholar] [CrossRef] [Scilit]
- Turmuzi, M.; Tyaningsih, R.Y. A Bibliometric Analysis of the Development of Artificial Intelligence (AI) Research in Education in Scopus Indexed Journals: What Are the Future Trends of This Research? TEM J. 2025, 14, 671–683. [Google Scholar] [CrossRef] [Scilit]
- Sousa, M.J.; Martins, G.; Tavares, N.J. Artificial Intelligence Trends: Insights for Digital Economy Policymakers. In Information and Knowledge in Internet of Things; Springer International Publishing: Cham, Switzerland, 2021; pp. 163–186. [Google Scholar] [CrossRef] [Scilit]
- Delcea, C.; Nica, I.; Ionescu, Ș.; Cibu, B.; Țibrea, H. Mapping the Frontier: A Bibliometric Analysis of Artificial Intelligence Applications in Local and Regional Studies. Algorithms 2024, 17, 418. [Google Scholar] [CrossRef] [Scilit]
- Amabile, T. Creativity, Artificial Intelligence, and a World of Surprises Guidepost Letter for Academy of Management Discoveries. Acad. Manag. Discov. 2019, 6, 351–354. [Google Scholar] [CrossRef] [Scilit]
- Mittelsteadt, M. Artificial Intelligence: An Introduction for Policymakers. Available online: https://ssrn.com/abstract=4361563 (accessed on 15 May 2026).
- Mandon, P. Beyond the AI Divide: A Straightforward Approach to Identifying Global and Local Overperformers in AI Preparedness. Digit. Bus. 2025, 5, 100136. [Google Scholar] [CrossRef] [Scilit]
- Thakur, S. AI Readiness across Nations: A Panel Analysis of Policy, Governance, and Innovation Factors. Int. J. Multidiscip. Res. 2025, 7, 1–11. [Google Scholar]
- OECD. OECD AI’s Live Repository of Over 260 AI Strategies & Policies. Available online: https://oecd.ai/dashboards (accessed on 15 May 2026).
- Hohman, M. Global Round-Up: National AI Policies; Computer & Communications Industry Association: Washington, DC, USA, 2025. [Google Scholar]
- Springs, D. Smart Leadership Adaptations in Artificial Intelligence Dual Use Functions and Ethical Implications in Healthcare Organizations and Biotechnology Innovations. Health Econ. Manag. Rev. 2025, 6, 28–37. [Google Scholar] [CrossRef] [Scilit]
- Mujtaba, B.G. Human-AI Intersection: Understanding the Ethical Challenges, Opportunities, and Governance Protocols for a Changing Data-Driven Digital World. Bus. Ethics Leadersh. 2025, 9, 109–126. [Google Scholar] [CrossRef] [Scilit]
- Nzobonimpa, S.; Savard, J. Ready but Irresponsible? Analysis of the Government Artificial Intelligence Readiness Index. Policy Internet 2023, 15, 397–414. [Google Scholar] [CrossRef] [Scilit]
- Madanchian, M.; Taherdoost, H. Ethical Theories, Governance Models, and Strategic Frameworks for Responsible AI Adoption and Organizational Success. Front. Artif. Intell. 2025, 8, 1619029. [Google Scholar] [CrossRef] [Scilit]
- Roba, M.; Moulay, O.K. Risk Management in Using Artificial Neural Networks. Socioecon. Chall. 2024, 8, 302–313. [Google Scholar] [CrossRef] [Scilit]
- Sitnicka, S.; Mursalov, M.; Mammadov, H.; Babaiev, D.; Zhou, Y. Ethics, Institutions, Infrastructure, and Governance in AI National-Level Readiness: A Hidden Driver of Banking Transformation. Bus. Ethics Leadersh. 2025, 9, 290–304. [Google Scholar] [CrossRef] [Scilit]
- Ramdana, A.D.; Munir; Furqon, C. Advancing Digital Literacy in Higher Education through Pedagogical Innovations and Institutional Strategies between 2014 and 2025. Discov. Educ. 2026, 5, 227. [Google Scholar] [CrossRef] [Scilit]
- Sperling, K.; Stenberg, C.-J.; McGrath, C.; Åkerfeldt, A.; Heintz, F.; Stenliden, L. In Search of Artificial Intelligence (AI) Literacy in Teacher Education: A Scoping Review. Comput. Educ. Open 2024, 6, 100169. [Google Scholar] [CrossRef] [Scilit]
- Napieralski, P.; Wojciechowski, A.; Korjonen-Kuusipuro, K. Artificial Intelligence for Scientific Research—Large Language Models in Manuscript Preparation. Hum. Technol. 2024, 20, 416–419. [Google Scholar] [CrossRef] [Scilit]
- Temerbulatova, Z.; Zhidebekkyzy, A.; Sagiyeva, R.; Ludwiczak, A. Artificial Intelligence as a Driver of Innovation and Patent Activity: An Empirical Analysis of Cross-Country Data. Econ. Sociol. 2025, 18, 184–201. [Google Scholar] [CrossRef] [Scilit]
- Škare, M.; Porada-Rochon, M.; Veselica Celić, R. Total Factor Productivity Dynamics and the Artificial Intelligence Paradox: Evidence from Long-Memory Analysis. J. Int. Stud. 2025, 18, 218–242. [Google Scholar] [CrossRef] [Scilit]
- Njegovanović, A. Complex Systems in Interdisciplinary Interaction. Financ. Mark. Inst. Risks 2024, 8, 94–107. [Google Scholar] [CrossRef] [Scilit]
- Dobrovolska, O.; Ortmanns, W.; Podosynnikov, S.; Halynskyi, D.; Miniailo, A. Start-Ups and Entrepreneurship in Renewable Energy: Investments and Risks. Financ. Mark. Inst. Risks 2024, 8, 213–240. [Google Scholar] [CrossRef] [Scilit]
- Kemrichard, P.; Ribiere, V.; Boehnlein, N.; Hjornered, J.; Vongsurakrai, S. A Strategic Competitive Advantage Driven by Knowledge and Evolving AI Innovation: An Empirical Case Study of Ethical Enterprise Leadership in Automobile Manufacturing Management and Supply Chain Intelligence in China. Bus. Ethics Leadersh. 2026, 10, 384–415. [Google Scholar] [CrossRef] [Scilit]
- Kildei, A.; Tumpach, M.; Shafranova, K. Artificial Intelligence for Smart Customer Feedback Management: Improving Content Analysis Approaches. Knowl. Econ. Lifelong Learn. 2025, 1, 48–65. [Google Scholar] [CrossRef] [Scilit]
- Kritikos, I.; Sarantopoulos, A.; Roumeliotis, A.; Vasiliades, J.; Matsinas, I. Unlocking the Potential of Artificial Intelligence in Pharma Research and Development: Insights from Investor and Researcher Perspectives. Health Econ. Manag. Rev. 2025, 6, 1–16. [Google Scholar] [CrossRef] [Scilit]
- Olszewski, R.; Krawczyk, D. Impact of Artificial Intelligence on the Book Industry: A Path Toward the Knowledge Economy. Knowl. Econ. Lifelong Learn. 2026, 2, 67–98. [Google Scholar] [CrossRef] [Scilit]
- Schinello, S. Challenges and Opportunities in the Use of Artificial Intelligence in Creative Economy: Insights from Expert Interviews. Econ. Sociol. 2025, 18, 199–216. [Google Scholar] [CrossRef] [Scilit]
- Frimpong, V. The Challenge of Context-Free Validity: Introducing the Contextual Research Validity Index Framework for Situated Legitimacy under Socioeconomic Challenges. Socioecon. Chall. 2026, 10, 42–49. [Google Scholar] [CrossRef] [Scilit]
- Haley, P. Artificial Intelligence and Ethical Dimensions of Automated Traffic Enforcement: Implications for Public Health, Healthcare Equity, and Social Justice. Health Econ. Manag. Rev. 2025, 6, 32–49. [Google Scholar] [CrossRef] [Scilit]
- Haley, P.; Burrell, D.N. Integrating Artificial Intelligence into Law Enforcement: Socioeconomic and Ethical Challenges. Socioecon. Chall. 2025, 9, 60–77. [Google Scholar] [CrossRef] [Scilit]
- AI Policy Lab African National AI Strategies. Available online: https://www.aipolicy.africa/national-strategies (accessed on 15 May 2026).
- Digital Policy Alert Artificial Intelligence Authority Governance in the Africa Declaration on Artificial Intelligence. Available online: https://digitalpolicyalert.org/change/14109-artificial-intelligence-authority-governance-in-the-africa-declaration-on-artificial-intelligence (accessed on 15 May 2025).
- Asiegbu, C.; Okolo, C.T. How AI Is Impacting Policy Processes and Outcomes in Africa. Available online: https://www.brookings.edu/articles/how-ai-is-impacting-policy-processes-and-outcomes-in-africa/ (accessed on 15 May 2026).
- Alonso, C.; Kothari, S.; Rehman, S. How Artificial Intelligence Could Widen the Gap Between Rich and Poor Nations. Available online: https://www.imf.org/en/Blogs/Articles/2020/12/02/blog-how-artificial-intelligence-could-widen-the-gap-between-rich-and-poor-nations (accessed on 15 May 2025).
- Zámek, D.; Zakharkina, Z. Research Trends in the Impact of Digitization and Transparency on National Security: Bibliometric Analysis. Financ. Mark. Inst. Risks 2024, 8, 173–188. [Google Scholar] [CrossRef] [Scilit]
- Yarovenko, H.; Kuzior, A.; Norek, T.; Lopatka, A. The Future of Artificial Intelligence: Fear, Hope or Indifference? Hum. Technol. 2024, 20, 611–639. [Google Scholar] [CrossRef] [Scilit]
- Alfiras, M.I.I.; Emran, A.Q.; Mohamed, A.M. Ethics and Governance of Generative AI in Education: A Systematic Review on Responsible Adoption. Discov. Educ. 2025, 5, 37. [Google Scholar] [CrossRef] [Scilit]
- Leon, C.; Lipuma, J.; Oviedo-Torres, X. Artificial Intelligence in STEM Education: A Transdisciplinary Framework for Engagement and Innovation. Front. Educ. 2025, 10, 1619888. [Google Scholar] [CrossRef] [Scilit]
- Yusuf, A.; Pervin, N.; Román-González, M.; Noor, N. Generative AI in Education and Research: A Systematic Mapping Review. Rev. Educ. 2024, 12, e3489. [Google Scholar] [CrossRef] [Scilit]
- Khairullah, S.A.; Harris, S.; Hadi, H.J.; Sandhu, R.A.; Ahmad, N.; Alshara, M.A. Implementing Artificial Intelligence in Academic and Administrative Processes through Responsible Strategic Leadership in the Higher Education Institutions. Front. Educ. 2025, 10, 1548104. [Google Scholar] [CrossRef] [Scilit]
- Fu, Y.; Weng, Z. Navigating the Ethical Terrain of AI in Education: A Systematic Review on Framing Responsible Human-Centered AI Practices. Comput. Educ. Artif. Intell. 2024, 7, 100306. [Google Scholar] [CrossRef] [Scilit]
- Mimoudi, A. Generative AI to Bridge the Educational Divide: Personalized Learning and Challenges. Soc. Sci. Humanit. Open 2025, 12, 102140. [Google Scholar] [CrossRef] [Scilit]
- Mohammadi, A.; Maghsoudi, M. Bridging Perspectives on Artificial Intelligence: A Comparative Analysis of Hopes and Concerns in Developed and Developing Countries. AI Soc. 2025, 40, 5713–5734. [Google Scholar] [CrossRef] [Scilit]
- Zimosz, P.; Ober, J. Impact of Artificial Intelligence on Education. Knowl. Econ. Lifelong Learn. 2025, 1, 77–98. [Google Scholar] [CrossRef] [Scilit]
- Vinci, V.; Agrati, L.S.; Berardi, P.; Beri, A. Artificial Intelligence as a Catalyst for Transformative Assessment: Designing Teacher Literacy at the Crossroads of Ethics, Pedagogy, and Human Relationships. Front. Educ. 2026, 11, 1760626. [Google Scholar] [CrossRef] [Scilit]
- Lademann, J.; Henze, J.; Honke, N.; Wollny, C.; Becker-Genschow, S. Teacher Training in the Age of AI: Impact on AI Literacy and Teachers’ Attitudes. Front. Educ. 2026, 10, 1671306. [Google Scholar] [CrossRef] [Scilit]
- Li, K.; Wang, P.; Chen, G. How Can AI Be Integrated into Teacher Professional Development Programs? A Systematic Review Based on an Adapted Technology-Based Learning Model. Teach. Teach. Educ. 2025, 168, 105219. [Google Scholar] [CrossRef] [Scilit]
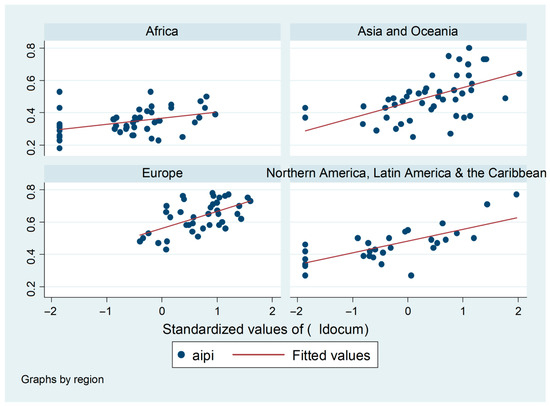
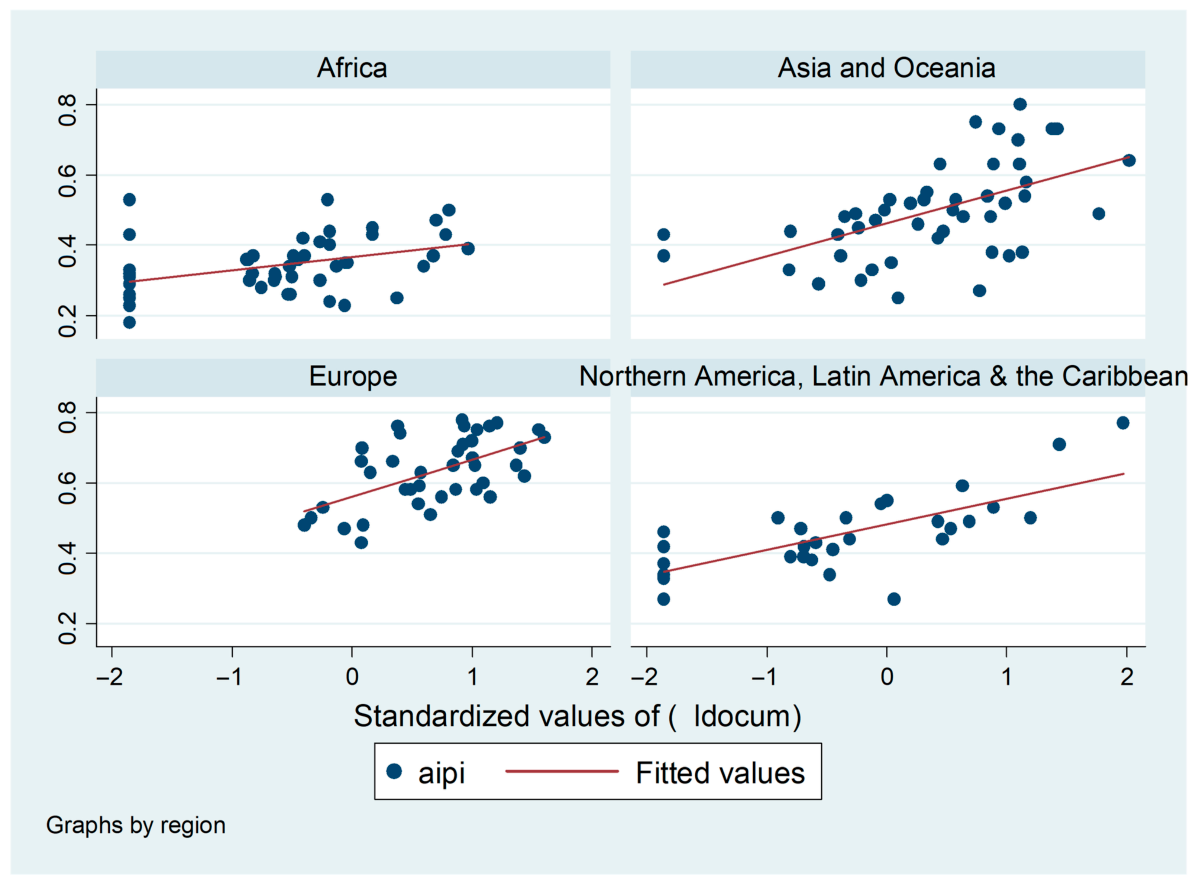
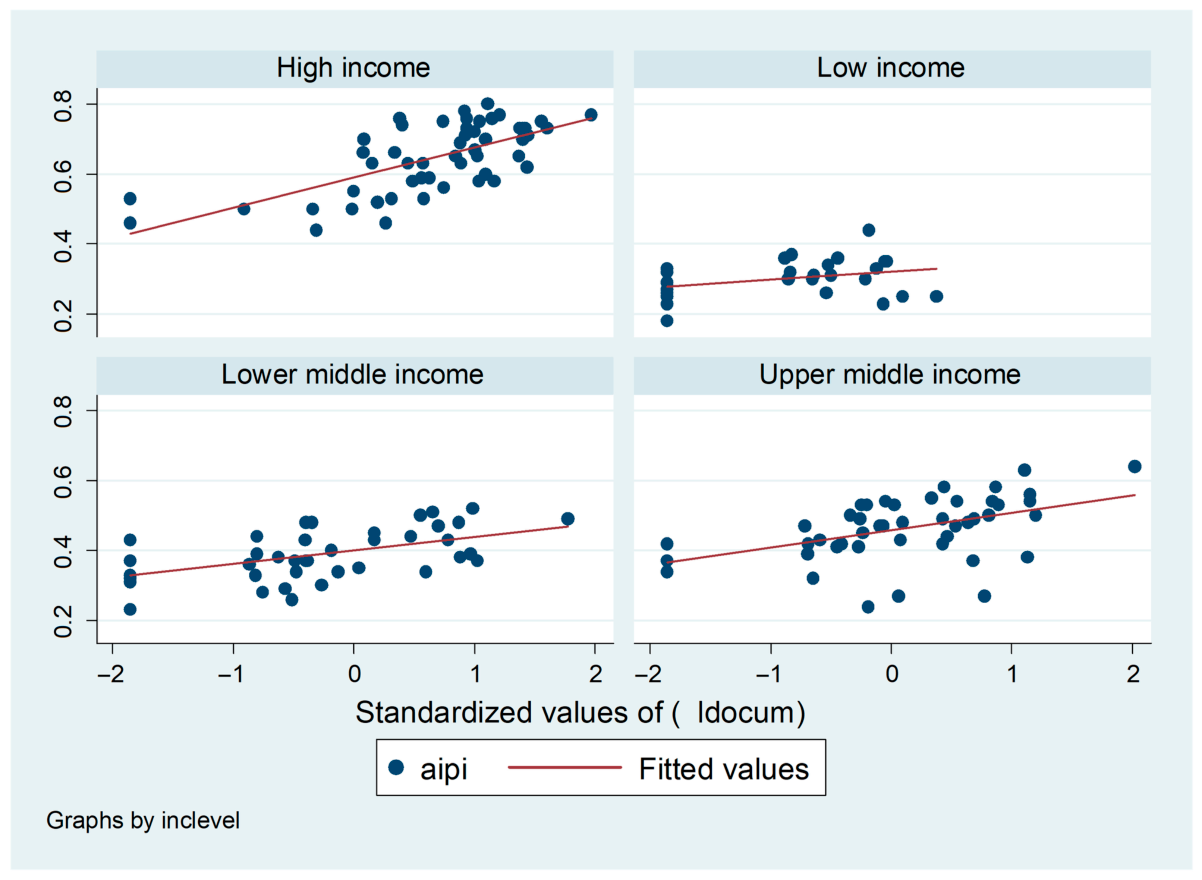
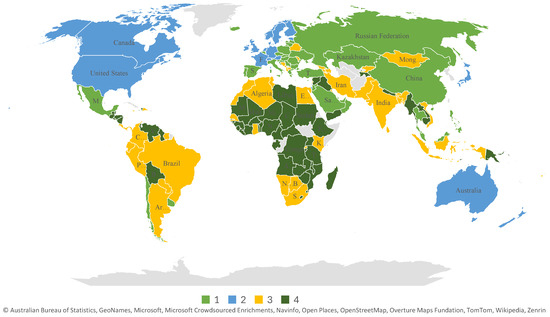
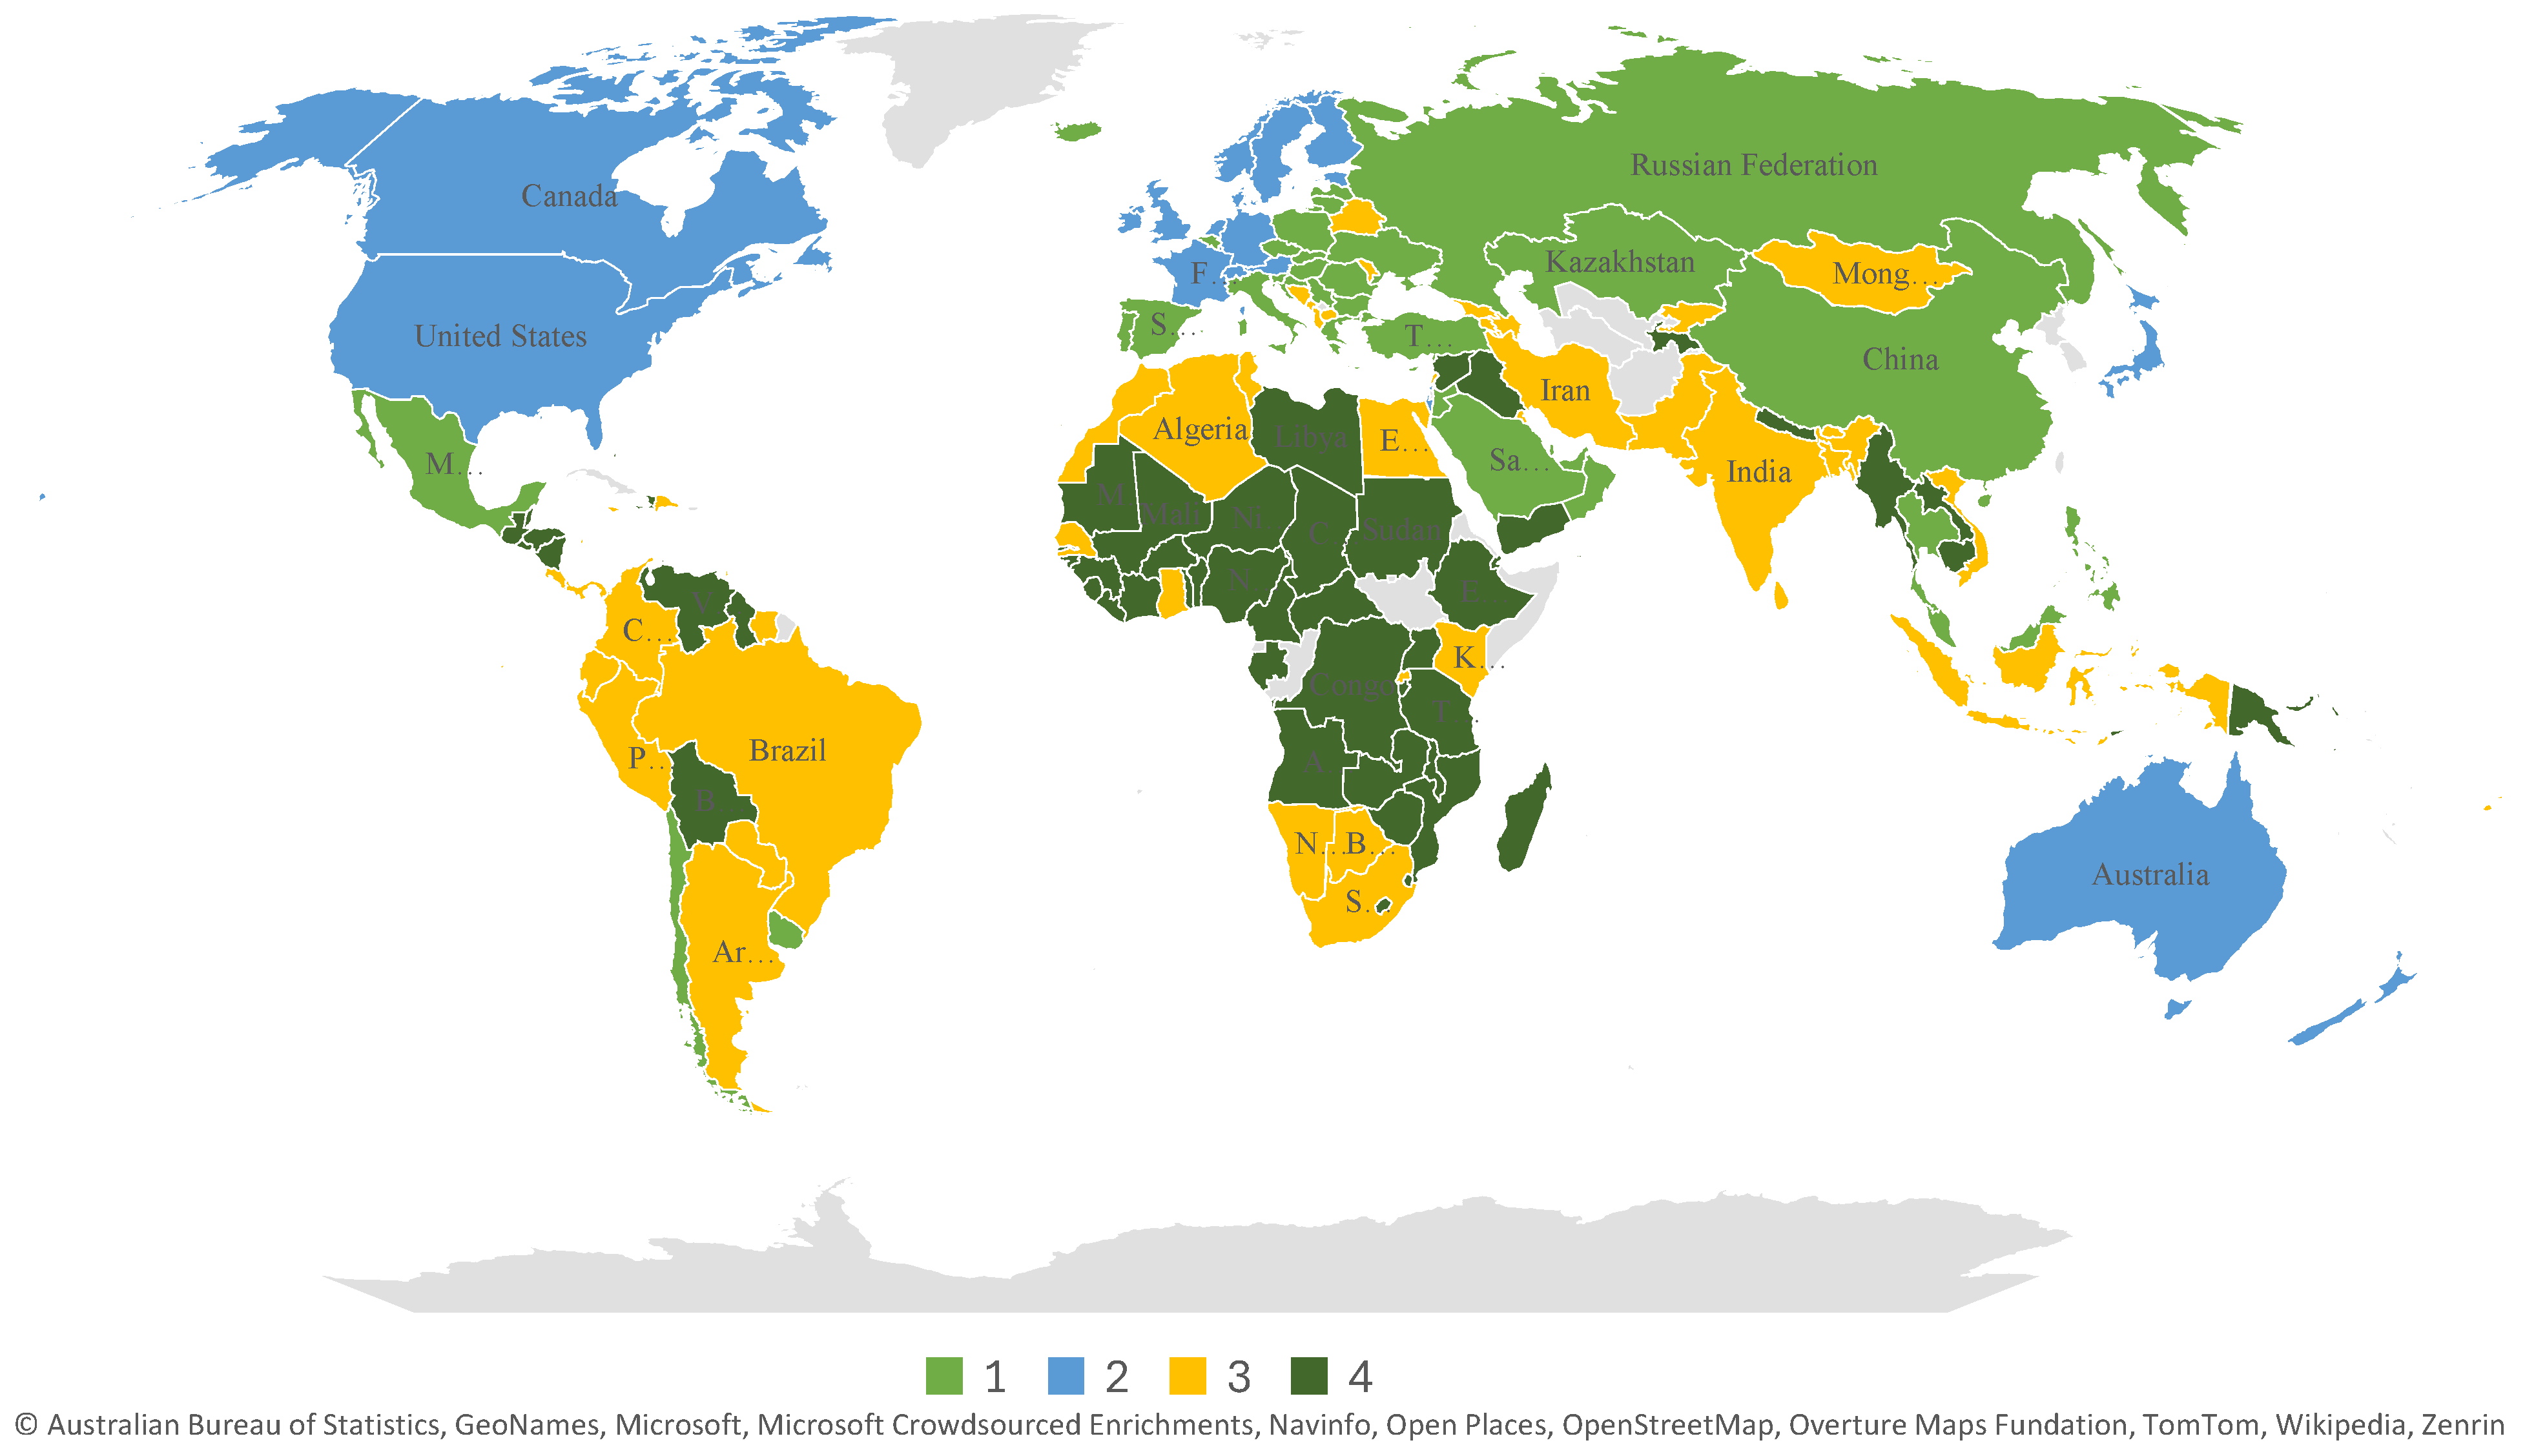

Disclaimer/Publisher’s Note: The statements, opinions and data contained in all publications are solely those of the individual author(s) and contributor(s) and not of MDPI and/or the editor(s). MDPI and/or the editor(s) disclaim responsibility for any injury to people or property resulting from any ideas, methods, instructions or products referred to in the content. |
© 2026 by the authors. Licensee MDPI, Basel, Switzerland. This article is an open access article distributed under the terms and conditions of the Creative Commons Attribution (CC BY) license.