


Abstract
China’s smart-city and green-transition policies have made digital-green integration an important pathway for improving urban ecological resilience. This study examines whether digital-green integration enhances urban ecological resilience, through which channels this effect occurs, and under what regional conditions it becomes more pronounced. The analysis uses a balanced panel of 510 observations for 30 Chinese provincial-level regions from 2005 to 2021, compiled from national and provincial statistical yearbooks. An indicator system encompassing resistance, recovery, and renewal is used to assess urban ecological resilience, and the composite index is calculated using the entropy-weighting method. Digital–green integration is captured by a coupling coordination index linking digital infrastructure with green finance. Its effect is estimated within a two-way fixed-effects framework, with additional tests used to assess the robustness of the findings and explore the underlying mechanisms, moderating conditions, and regional differences. The results show that: (1) digital–green integration significantly enhances urban ecological resilience, with its effect concentrated primarily in the recovery dimension; (2) industrial-structure upgrading and improvements in energy efficiency serve as important transmission channels, while better traffic infrastructure further strengthens this positive relationship; and (3) the effect is more pronounced in provinces with lower levels of urbanization and stronger environmental regulation. Governments should promote digital-green integration to support industrial-structure upgrading and energy-efficiency improvement, thereby strengthening cities’ capacity to recover from ecological shocks. Greater support should be directed to less urbanized regions, while areas with weaker environmental regulation should improve disclosure, verification, and enforcement. Future research could employ city-level data and spatial econometric models to examine the magnitude, geographic reach, and transmission mechanisms of cross-regional spillovers.
1. Introduction
Under the combined pressures of climate change, rapid urbanization, and ecological degradation, cities worldwide face both acute shocks, such as floods, heatwaves, and storms, and chronic stresses, including pollution, resource constraints, and declining ecosystem functions. Recent international policy initiatives increasingly frame urban ecological governance as a multisectoral and multilevel undertaking. UN-Habitat Assembly Resolution 2/4 calls for biodiversity and ecosystem services to be mainstreamed into urban and territorial planning [1], while The 29th Session of the Conference of the Parties to the United Nations Framework Convention on Climate Change further promotes nature-positive urban development, digital solutions, and urban climate finance to support resilient and healthy cities [2]. That means urban environmental governance must therefore go beyond limiting disaster losses to restoring damaged ecosystems and their functions. Ecological restoration refers to assisting the recovery of ecosystems that have been degraded, damaged, or destroyed and is widely applied to wetlands, river corridors, and degraded land [3,4]. However, conventional environmental governance typically emphasizes outcome indicators, such as pollution reduction and improvements in environmental quality, which cannot fully capture a city’s dynamic capacity to maintain, recover, and renew ecological functions following disturbances. This limitation highlights the relevance of urban ecological resilience, defined by Meerow et al. as the capacity of urban systems and their social, ecological, and technological networks to maintain or rapidly recover essential functions under disturbance and to adapt and transform in response to change [5]. Copenhagen’s post-cloudburst development of an integrated blue-green infrastructure system comprising parks, streets, waterways, and drainage facilities illustrates the shift from post-disaster restoration toward long-term resilience building [6].
Ecological restoration and resilience building require both long-term finance and timely, reliable environmental information, creating complementary roles for green finance and digital technologies. Green finance mobilizes capital and directs it toward environmental protection, thereby providing relatively stable funding for long-term projects. The G20 Green Finance Study Group (2016) defines green finance as the financing of investments that generate environmental benefits within the broader context of environmentally sustainable development [7]. A representative example is the USD 25 million Environmental Impact Bond issued by the District of Columbia Water and Sewer Authority to finance stormwater-management infrastructure. Post-implementation monitoring showed that runoff entering Rock Creek declined by nearly 20% [8]. Finance alone, however, does not guarantee environmental outcomes. Information asymmetry is also recognized as a major constraint on green finance, as financial institutions cannot allocate and oversee green capital effectively without timely, accurate, and verifiable data. Digital technologies can therefore strengthen the information base for resilience building [7].
As digital information capabilities interact with green capital, digitalization and greening can evolve from separate transition pathways into a mutually reinforcing process. International literature defines digital-green integration as the “twin green and digital transition,” emphasizing the use of digital technologies to advance environmental goals while controlling the energy consumption of digitalization itself [9]. The Chinese definition focuses more on implementation pathways, namely greening the digital sector itself and using digital technologies to enable the green transformation of traditional industries [10]. Despite this difference in emphasis, both definitions require digital capabilities to be practically connected with environmental objectives. Huzhou’s “Carbon Efficiency Code” illustrates this connection by integrating firms’ energy-consumption and carbon-emission data and applying the resulting carbon-efficiency assessments to green lending, thereby linking digital information with green capital [11]. Based on this common element, this study defines digital-green integration as the degree of coordinated development between digital infrastructure and green finance: the former provides environmental data capabilities, while the latter uses the resulting information to identify and monitor green projects.
Combining the above concepts, a key international question is whether the environmental gains from digital-green integration translate into stronger resistance, recovery, and long-term adaptive capacity. This is not automatic. Industrial structure, energy-use efficiency [12], financial development, and broader territorial capacities vary considerably across cities [13], making the resilience gains from digital-green integration likely to be uneven [14]. China’s pronounced provincial differences provide a useful setting for identifying which resilience dimensions benefit and what supporting conditions are required, offering lessons for more context-sensitive urban resilience policies elsewhere.
Research on urban ecological resilience provides the conceptual basis for this study. Holling introduced the concept of ecological resilience by emphasizing the ability of ecological systems to absorb disturbances while retaining their essential functions [15]. Carpenter et al. further advanced resilience research by asking “resilience of what to what?” and moving the concept from metaphor toward measurement [16]. Walker et al. subsequently extended resilience theory to social–ecological systems [17], while Meerow et al. brought it into the urban context by highlighting cities’ capacity to withstand disturbances, recover essential functions, and adapt or transform over time [5].
Regarding measurement, no consensus has emerged on how urban ecological resilience should be assessed [18,19,20]. Existing studies differ in their choice of measurement frameworks, indicator-weighting methods, and approaches to ensuring comparability across cities of different scales and stages of development. For analytical clarity, the methods reviewed in this study are grouped into three broad categories: disturbance-response, indicator-based, and model-based approaches. These approaches differ in their data requirements, interpretability, and suitability for particular urban contexts.
The disturbance–response approach estimates resistance from the immediate change in a selected ecological function following a disturbance and recovery from the rate or extent of its subsequent return toward the pre-disturbance state. Yi and Jackson review applications drawing on remote-sensing and tree-ring records, laboratory and field observations, and hydrological–climatic data to quantify ecosystem responses to disturbance [21]. Because it measures realized system trajectories, this approach captures the dynamic nature of resilience more directly than static assessments. Its estimates, however, depend on the type and magnitude of the disturbance, the ecological function selected, and the baseline used to define the pre-disturbance state. It also requires sufficiently continuous observations before and after the event. These requirements limit its suitability for long-term cross-regional comparisons, particularly when regions are exposed to disturbances of different intensities or when no discrete shock can be identified during the observation period.
The indicator-based approach operationalizes urban ecological resilience through observable indicators, either by using a focused ecological proxy or by aggregating broader measures of resource endowments, environmental conditions, and governance capacity, such as carbon emissions and vegetation cover. Shi et al. used net primary productivity as a resilience surrogate and constructed an evaluation index based on ecosystem sensitivity and adaptability [22]. Zhang et al. developed an assessment framework based on the pressure–state–response model [23], whereas Wang and Liu compared cities in the Yangtze River Economic Belt and the Yellow River Basin across the dimensions of resistance, adaptation, and recovery [24]. Indicator selection necessarily entails a degree of researcher judgment, and the resulting estimates may be sensitive to the underlying theoretical framework, the choice and organization of indicators, normalization procedures, and weighting schemes. Entropy weighting can reduce subjectivity in the assignment of numerical weights, but it cannot eliminate the theoretical choices involved in selecting and grouping indicators. Despite these limitations, indicator-based assessment provides broad thematic coverage, is relatively straightforward to implement, and is well suited to large samples and long observation periods. It has therefore become a widely used approach to measuring urban ecological resilience.
The model-based approach constructs a simplified representation of an urban ecosystem and simulates its responses under alternative disturbance or development scenarios. Xia et al., for example, used a land-use simulation model to project the spatial pattern of Hangzhou under two urban-development scenarios and estimated ecological resilience under each scenario [25]. This enabled them to examine how alternative development pathways might shape future resilience rather than merely describing historical changes. Model-based analysis can therefore assess risks that have not yet materialized and reveal spatial heterogeneity within a city. Its findings, however, remain conditional on the model structure, parameter settings, and scenario assumptions. Moreover, a model calibrated for one city may not be directly transferable to other urban contexts.
Studies on digital-green integration have developed mainly along three lines. The first examines the regional heterogeneity of digital–green transformation. Drawing on China’s national and regional innovation policies, Brueck, Losacker, and Liefner [26] show that national digital and green objectives are often reinterpreted and recombined at the local level, giving rise to differentiated regional transition pathways. Their findings indicate that the outcomes of digital–green integration are closely related to local development conditions and should therefore be assessed in light of regional differences. A second line of research focuses on the pathways through which digital and green transformation generate synergistic effects. Liu and Sun [27] examine the configurations through which digital–green synergy contributes to economic resilience. Their results suggest that digitalization and green transformation do not operate through a single linear pathway; rather, their joint effects depend on combinations of digital foundations, industrial conditions, and policy support. A third line considers how digital–green integration operates in specific organizational contexts. Zhang et al. find that digital–green convergence enhances firm competitiveness, partly by improving corporate ESG performance [28]. Taken together, these studies provide initial evidence of the potential benefits and context-dependent nature of digital–green integration. However, its implications for urban ecological resilience and the mechanisms through which such effects arise remain insufficiently examined.
Although previous studies have advanced research on urban ecological resilience and digital–green integration separately, the intersection between these two fields remains under-explored. Against this background, the overall objective of this study is to assess whether and how digital–green integration is associated with urban ecological resilience and to identify the conditions under which this relationship varies. Three research questions guide the analysis. First, how is digital–green integration associated with urban ecological resilience, and does this relationship differ across the resistance, recovery, and renewal dimensions? Second, do industrial-structure upgrading and energy-efficiency improvement represent plausible transmission channels underlying this relationship? Third, does traffic infrastructure strengthen this relationship, and does its magnitude vary across regions with different levels of urbanization and environmental regulation?
To answer these questions, this study uses a balanced annual panel of 30 Chinese provincial-level regions from 2005 to 2021. The empirical analysis proceeds through five sequential tasks. First, provincial-level indices of digital–green integration and urban ecological resilience are constructed using the coupling coordination and entropy-weighting methods, respectively. Second, the baseline relationship is estimated using a two-way fixed-effects model and further evaluated through robustness and instrumental-variable tests. Third, separate estimations are conducted for the resistance, recovery, and renewal dimensions of urban ecological resilience. Fourth, industrial-structure upgrading and energy-efficiency improvement are examined as potential transmission channels, while traffic infrastructure is evaluated as a moderating condition. Finally, heterogeneity is assessed across provinces with different levels of urbanization and environmental regulation.
2. Theoretical Framework and Research Hypotheses
2.1. Theoretical Analysis
Resilience refers to the maximum magnitude of disturbance that an ecosystem can absorb before transitioning into a state dominated by a different set of operating mechanisms. This theory was proposed by Bruneau et al. [29], who argued that system resilience can be enhanced through four dimensions when a system is exposed to external shocks and disturbances. Drawing on the 4R framework’s logic of withstanding shocks, mobilizing resources, and restoring functions, and recognizing that urban ecological systems face both sudden disturbances and sustained environmental pressures, this study adapts the framework into three dimensions: resistance, recovery, and renewal.
The first dimension is resistance, which forms the foundation of urban ecological resilience by reflecting a city’s initial capacity to withstand sudden environmental shocks. Cities with abundant water resources, high green space coverage, and well-distributed ecological infrastructure tend to display greater resistance, making their ecological functions less likely to be severely disrupted by pollution events or extreme weather. Conversely, limited water availability, insufficient green space, or poorly distributed ecological assets can weaken this capacity and leave urban ecosystems more vulnerable to disturbance.
The second dimension is recovery, which refers to the capacity of an urban ecological system to restore its essential functions following a disturbance. Lower pollution pressures can reduce the severity of ecological damage, while timely environmental monitoring and adequate remediation facilities facilitate the identification and treatment of environmental problems. Together, these conditions enable ecological functions to be restored more rapidly after a disturbance.
The third dimension is renewal, which refers to the longer-term capacity of an urban ecological system to adapt, improve, and transform rather than merely return to its pre-disturbance state. The adoption of green technologies, the improvement of environmental governance and institutional arrangements, and sustained investment in ecological protection can promote the upgrading of environmental infrastructure and governance practices. These changes reduce vulnerability to future pressures and strengthen the long-term adaptive capacity of urban ecological systems.
Based on the above analysis, this study investigates in detail how digital-green integration influences urban ecological resilience and formulates hypotheses regarding its direct and indirect effects.
2.2. Research Hypotheses
The hypotheses are derived from four connected layers: the direct effect of digital-green integration, its transmission through industrial-structure upgrading and energy efficiency, the moderating role of traffic infrastructure, and the possibility that regional development conditions reshape the effect. Figure 1 summarizes the analytical framework and research hypotheses in this section.
Figure 1.
The framework for the direct, indirect, moderating, and heterogeneous effects of digital-green integration on urban ecological resilience. Source: Authors’ own elaboration based on the theoretical arguments and literature reviewed in Section 2.
2.2.1. Direct Impacts
Digital-green integration may strengthen urban ecological resilience by improving the informational basis of green investment. Digital systems make ecological conditions, emerging risks, and project performance more transparent, helping financial institutions identify suitable green projects, verify their environmental benefits, and track the use and outcomes of funds after financing. Green finance, in turn, converts these informational gains into funding for ecological restoration, climate adaptation, and low-carbon infrastructure. The central mechanism is therefore a feedback between information and finance: more credible environmental data improve project selection and oversight, while access to green capital creates stronger incentives to generate and disclose such information [30,31].
Yet this synergy also carries environmental and governance costs. Digital infrastructure is not immaterial: data centers and communication networks require electricity, hardware production consumes carbon- and resource-intensive inputs, and rapid equipment turnover contributes to electronic waste [32]. Efficiency improvements may also expand the demand for digital services, giving rise to rebound effects that offset part of the expected energy and emission savings [33]. On the financial side, weak disclosure and verification can prevent lenders from distinguishing genuinely green investment from conventionally financed activities relabelled as green, allowing capital to flow toward projects with limited additional ecological value [34]. The overall effect of digital–green integration is therefore not predetermined, but depends on whether its informational and allocative gains outweigh its direct environmental footprint, rebound effects, and governance failures.
H1a.
Digital-green integration strengthens urban ecological resilience.
H1b.
Digital-green integration weakens urban ecological resilience.
2.2.2. Indirect Effects
Digital-green integration may strengthen urban ecological resilience by reshaping the organization of production and improving the efficiency with which energy is used. One potential channel is industrial-structure upgrading. Digital infrastructure improves access to market, technological, and environmental information, making it easier for firms and governments to identify cleaner production opportunities and coordinate industrial transformation [35]. Green finance complements this process by directing capital toward technologically advanced, less pollution-intensive activities and supporting the replacement of outdated production capacity [36]. Together, these forces can shift economic activity toward sectors with higher productivity and lower resource dependence, reducing persistent environmental pressure and improving a city’s capacity to withstand and recover from ecological disturbances [37]. On this basis, the following hypothesis is proposed:
H2a.
Digital-green integration enhances urban ecological resilience by promoting industrial-structure upgrading.
A second channel operates through energy efficiency. Digital technologies enable more accurate monitoring of energy use, reveal inefficiencies in production and infrastructure systems, and support the real-time adjustment of resource allocation [38]. Green finance provides the capital required for energy-saving equipment, cleaner production processes, and low-carbon technological upgrading. Their interaction can therefore reduce the amount of energy required to generate a given level of economic output [39]. By lowering routine energy demand and the associated environmental burden, improved energy efficiency leaves urban ecological systems less exposed to cumulative stress and better able to absorb external shocks. Accordingly:
H2b.
Digital-green integration enhances urban ecological resilience by improving energy efficiency.
2.2.3. Moderating Effects
Traffic infrastructure may shape how effectively digital-green integration is translated into urban ecological resilience. Digital information and green finance can improve the identification and funding of environmental projects, but their practical effects also depend on the movement of personnel, equipment, materials, and services across space. Well-developed transport networks reduce spatial frictions, facilitate the circulation of labor and production factors, and extend the reach of digital economic activities. They also maintain access to essential services and enable resources to be mobilized more rapidly during disruption and recovery.
Traffic infrastructure therefore acts as a complementary implementation condition. Where connectivity is stronger, environmental information and green capital can be converted more efficiently into ecological restoration, low-carbon infrastructure, and emergency response, allowing damaged urban functions to be restored more rapidly. Where transport links are weak, delays in project implementation and resource delivery may limit the resilience benefits of digital-green integration. This argument does not imply that transport expansion is inherently environmentally beneficial; rather, it emphasizes the role of connectivity in turning digital and financial capacity into timely and coordinated action. Accordingly, the following hypothesis is proposed:
H3.
The effect of digital-green integration on urban ecological resilience varies with the level of traffic infrastructure.
2.2.4. Heterogeneity Effects
The relationship between digital–green integration and urban ecological resilience may vary across regional contexts. Urbanization reflects both the stage of regional development and the maturity of infrastructure, public services, and administrative capacity. Highly urbanized regions may have less scope for additional gains because these systems are already relatively well established. By contrast, less urbanized regions may obtain greater marginal benefits when digital technologies and green finance help alleviate gaps in information access, infrastructure provision, and environmental management.
Environmental regulation represents a distinct institutional condition. Stronger regulation improves monitoring and disclosure, raises the cost of non-compliance, and encourages green capital to support projects with verifiable environmental benefits. Conversely, weaker enforcement and incomplete disclosure may limit the extent to which digital capabilities and green finance are translated into ecological improvements.
H4.
The effect of digital-green integration on urban ecological resilience varies with the level of urbanization and the intensity of environmental regulation.
3. Materials and Methods
3.1. Data Sources
Due to substantial data gaps for Tibet and differences in statistical coverage for Taiwan, Hong Kong, and Macao, this study uses annual panel data for 30 provincial-level regions in China from 2005 to 2021. The original data were mainly obtained from the China City Statistical Yearbook [40,41,42,43,44,45,46,47,48,49,50,51,52,53,54,55,56], China Statistical Yearbook on Science and Technology [57,58,59,60,61,62,63,64,65,66,67,68,69,70,71,72,73], China Industry Statistical Yearbook [74,75,76,77,78,79,80,81,82,83,84,85,86,87,88,89,90], China Energy Statistical Yearbook [91,92,93,94,95,96,97,98,99,100,101,102,103,104,105,106,107], the statistical yearbooks published by the statistical bureaus of the 30 sampled provinces and municipalities [108,109,110,111,112,113,114,115,116,117,118,119,120,121,122,123,124], and the Wind Economic Database [125]. After cross-checking and matching data from these sources, a balanced panel of 510 region-year observations was obtained.
3.2. Variable Selection
3.2.1. Dependent Variables
Urban ecological resilience serves as the dependent variable. It refers to the capacity of an urban ecosystem to preserve basic ecological functions, absorb environmental risks, repair damaged structures, and adjust under resource constraints, pollution emissions, climate change, and external uncertainty. Following Chu, the indicator system is adjusted with reference to the 4R framework and organized around resistance, recovery, and renewal [126]. Due to data availability constraints, the “reorganization” dimension is not separately measured in this provincial-level dataset; instead, it is partially reflected in the recovery and renewal indicators through variables that capture treatment capacity and governance upgrading. Entropy weights are then used to calculate the provincial resilience index. Table 1 presents the resulting indicator system and indicates whether each indicator contributes positively or negatively to ecological resilience. Based on these 14 indicators, the provincial urban ecological resilience index is constructed using the entropy-weighting method, which reduces the subjectivity associated with predetermined weights. The calculation consists of the following three steps.
Table 1.
Indicator System for Measuring Urban Ecological Resilience: Dimensions, Indicators, and Expected Directions.
- (1)
- Standardization of indicators
To ensure comparability across indicators with different units and directional meanings, min-max normalization is applied separately to positive and negative indicators as follows:
In Equation (1), denotes the original value of indicator j for province i in year t, while denotes its standardized value. The maximum and minimum values are determined from all province-year observations for each indicator. Following this transformation, a larger value of consistently represents a more favorable contribution to urban ecological resilience.
- (2)
- Determination of entropy weights
The share of each province-year observation in indicator (j) is calculated as follows:
The entropy value of indicator j, which reflects the variation in that indicator across all observations, is then computed as:
Finally, the entropy weight assigned to indicator j is obtained as:
In Equations (2)–(4), , , and , index provinces, years, and indicators, respectively, where , , and . Accordingly, denotes the total number of province-year observations. is the standardized value of indicator j for province i in year t, and is its share in the sum of all standardized values of indicator j, such that . ej denotes the information entropy of indicator j, while represents its information utility. is the resulting entropy weight, with . When , the term is defined as zero, consistent with . A more dispersed indicator has a lower entropy value and greater information utility, and therefore receives a larger weight. Conversely, an indicator with less variation provides weaker discriminatory information and is assigned a smaller weight. Thus, the weights reflect the information contained in each indicator rather than being predetermined subjectively.
- (3)
- Calculation of urban ecological resilience
The urban ecological resilience index for province i in year t is calculated as follows:
In Equation (5), represents the urban ecological resilience index of province i in year t. A higher value indicates greater urban ecological resilience. For the dimension-specific analysis, the same calculation procedure is applied separately to the three-level indicators associated with resistance, recovery, and renewal.
3.2.2. Core Explanatory Variable
The core explanatory variable, digital-green integration (DGI), is measured using the coupling coordination degree (CCD) model. This approach accounts for both the relative coupling between digital infrastructure and green finance and their composite level of development. Digital infrastructure development is proxied by the frequency of digital-economy-related terms in central, provincial, and municipal government work reports [127]. Green finance development is measured using a regional composite index covering green credit, green investment, green insurance, green bonds, green support, green funds, and green equity, with indicator weights determined using the entropy-weighting method [128]. Before calculating the CCD, both component indices are normalized to the interval [0, 1] to ensure comparability. The calculation proceeds in three steps.
- (1)
- Calculation of the coupling degree
The coupling degree between digital infrastructure and green finance is first calculated as follows:
In Equation (6), and denote the normalized levels of digital infrastructure and green finance in province i during year t, respectively. measures the relative coupling between the two subsystems and ranges from 0 to 1. A higher value indicates a closer correspondence between their levels of development.
- (2)
- Calculation of the composite development index
Because the coupling degree does not reflect the absolute development levels of the two subsystems, a composite development index is further constructed as follows:
In Equation (7), represents the composite development level of digital infrastructure and green finance. Given their equal importance in the digital–green integration system, the two components are assigned equal weights, such that α = β = 0.5.
- (3)
- Calculation of the coupling coordination degree
Finally, the coupling degree and composite development index are combined to obtain the digital–green integration index:
In Equation (8), denotes the coupling coordination degree between digital infrastructure and green finance in province i during year t. The index ranges from 0 to 1, with a higher value indicating both a higher composite level of development and stronger coordination between the two subsystems. This variable is denoted as DGI in the subsequent empirical analysis.
3.2.3. Control Variables
Control variables are included to reduce omitted-variable bias. Urban is the urbanization rate, measured as the share of the urban population in the year-end permanent resident population. Service are measured by the shares of tertiary-industry value added in regional GDP. People refers to the regular higher-education enrollment divided by the year-end permanent resident population. FDI is the ratio of foreign direct investment to regional GDP., and Gap is the urban-rural difference in per capita disposable income. RD represents intramural expenditure on research and development, while ln_GDP is the natural logarithm of regional gross domestic product.
3.2.4. Mediating Variables
The mediation analysis uses two variables. Industry is measured as the ratio of tertiary-industry value added to secondary-industry value added and captures the industrial-structure upgrading channel. Energy consumption per unit of gross domestic product (ECPG) is used as an inverse measure of energy efficiency to examine this transmission channel. Together, these variables test whether digital-green integration improves ecological resilience through innovation output and lower energy intensity.
3.2.5. Moderating Variables
This study uses traffic infrastructure (Traffic) as the moderating variable. Traffic is measured by the natural logarithm of the total freight volume within each administrative region. Traffic infrastructure reflects regional connectivity and the efficiency with which personnel, equipment, materials, and services move across space. Digital information and green finance may improve the identification and financing of environmental projects, but their practical value also depends on whether the required resources can reach project sites and be deployed in a timely manner. Better transport connectivity can reduce implementation delays, support the circulation of production factors, and facilitate pollution control, ecological restoration, and emergency response. At the same time, transport expansion may increase energy consumption and emissions, so its moderating role cannot be assumed to be uniformly positive. Traffic infrastructure is therefore incorporated into the moderation analysis to examine whether the effect of digital-green integration on urban ecological resilience varies with regional connectivity.
3.3. Methodology
Figure 2 outlines the empirical strategy, from the construction of the main variables to the analysis of the baseline effect, underlying mechanisms, moderation, and regional heterogeneity. These stages map directly onto the hypotheses. H1a and H1b are assessed from the sign and statistical significance of the DGI coefficient in the baseline model. H2a and H2b are examined through separate regressions for green technological innovation and energy efficiency, while H3 is tested using the interaction between DGI and the share of secondary industry. H4 is assessed by re-estimating Equation (9) for subsamples with different levels of urbanization and financial development. The detailed specifications follow.
Figure 2.
Empirical analysis framework for assessing the effects of digital-green integration on urban ecological resilience.
3.3.1. Baseline Regression Model
H1a and H1b imply opposite signs for the effect of digital–green integration on urban ecological resilience. We assess these alternatives using a two-way fixed-effects model. Province fixed effects control for persistent regional differences that may be related to both variables, while year fixed effects capture changes shared by all provinces. First, the impact of digital empowerment on urban ecological resilience is modeled as follows:
where denotes the level of urban ecological resilience in province i at year t, is the interaction term between digital empowerment and green development , representing digital-green integration. is the intercept; , , , are the regression coefficients; represents province fixed effects, controlling for time-invariant provincial characteristics; denotes year fixed effects, controlling for common temporal shocks; and is the idiosyncratic error term. The coefficient of interest is , which captures the net effect of digital-green integration on urban ecological resilience. A significantly positive estimate supports H1a, whereas a significantly negative estimate supports H1b. If is statistically insignificant, neither hypothesis is supported.
Moreover, to determine whether the aggregate relationship is driven by a particular component of urban ecological resilience, Equation (9) is subsequently re-estimated using resistance, recovery, and renewal as the dependent variables in turn. The control variables and province and year fixed effects remain unchanged across the three regressions, ensuring that the dimensional estimates are directly comparable. The coefficient on DGI in each regression indicates whether digital–green integration is associated with a city’s capacity to withstand ecological disturbances, restore ecological functions after disruption, or achieve longer-term ecological adaptation and renewal.
3.3.2. Instrumental-Variable Identification Strategy
To assess whether the baseline estimates are sensitive to potential endogeneity, we supplement Equation (9) with a fixed-effects two-stage least squares model. The excluded instrument is constructed as
where denotes the postal and telecommunications conditions of province i in 1984, and denotes the national number of Internet users in year t. The historical component captures predetermined cross-provincial differences in communications infrastructure, whereas the national Internet-user series represents the common expansion of Internet use over time. Their interaction measures the extent to which provinces with different initial communications endowments were differentially exposed to this nationwide technological expansion.
The fixed-effects 2SLS model is estimated in two stages. The first-stage equation is
and the second-stage equation is
In Equation (11), captures the relevance of the excluded instrument for DGI. Equation (12) replaces the observed value of DGI with its first-stage fitted value, , thereby isolating the component of DGI predicted by the instrument. The coefficient is the parameter of primary interest. The control variables and fixed effects are defined as in the baseline model, and heteroskedasticity-robust standard errors are used throughout.
The identification strategy relies on both relevance and exclusion. Relevance follows from the premise that provinces with stronger historical communications foundations were better positioned to translate the nationwide expansion of Internet use into digital–green coordination. Regarding exclusion, the historical postal and telecommunications component is fixed before the sample period, while the national Internet-user series is common to all provinces. Their respective main effects are therefore absorbed by province and year fixed effects, leaving identification to arise from their interaction. Conditional on the control variables and fixed effects, this interaction is assumed to influence current urban ecological resilience through its effect on DGI.
Instrument relevance and identification strength are evaluated using the Kleibergen–Paap rk LM and Wald F statistics. Because conventional 2SLS inference may be sensitive to weak instruments, the Anderson–Rubin and Stock–Wright tests are additionally used to obtain weak-instrument-robust inference. As the model contains one excluded instrument for one endogenous regressor, it is exactly identified and does not permit a test of overidentifying restrictions.
3.3.3. Mechanism-Testing Model
To examine the mechanisms proposed in H2a and H2b, we estimate separate two-way fixed-effects models for industrial-structure upgrading and energy efficiency. The model is written as follows.
In Equation (10), represents the mechanism variable, defined as the ratio of tertiary-industry value added to secondary-industry value added, or by energy consumption per unit of GDP (ECPG). The remaining variables are defined as above. The coefficient captures the strength and direction of digital-green integration’s impact on the mechanism variable, providing insight into the transmission mechanisms through which digital-green integration affects urban ecological resilience.
Equation (10) is estimated separately for the two mechanism variables. When Industry is the dependent variable, a significantly positive indicates that digital-green integration promotes industrial-structure upgrading, providing evidence consistent with H2a. When ECPG is the dependent variable, a significantly negative indicates that digital-green integration reduces energy consumption per unit of output and thus improves energy efficiency, providing evidence consistent with H2b. An insignificant coefficient would indicate that the corresponding mechanism is not supported by the data.
Industrial-structure upgrading and energy efficiency are selected as mechanism variables because both shape the capacity of urban ecological systems to absorb environmental pressure and recover from disturbance [129]. Industrial upgrading reallocates production factors from pollution-intensive activities toward cleaner and more productive sectors, thereby reducing persistent ecological stress and strengthening the foundations for ecological restoration and adaptation [130]. Greater energy efficiency lowers the energy inputs and associated emissions required for a given level of output, which alleviates cumulative environmental burdens and enhances the capacity of urban systems to respond to ecological and climate-related risks [131].
3.3.4. Moderating Effect Model
H3 proposes that traffic infrastructure may condition the effect of digital-green integration on urban ecological resilience. To examine this moderating role, the baseline model is extended by including traffic infrastructure and its interaction with digital–green integration:
In Equation (14), represents the level of traffic infrastructure, while the interaction term is introduced to examine whether traffic infrastructure shapes the effect of digital-green integration on urban ecological resilience. The coefficient of primary interest is . A positive and statistically significant β3 indicates that better traffic infrastructure strengthens the positive relationship between digital–green integration and urban ecological resilience. All other variables are defined as above.
4. Results
4.1. Descriptive Statistics
Table 2 presents the descriptive statistics for the variables used in the empirical analysis, providing a suitable basis for the subsequent panel estimations.
Table 2.
Descriptive Statistics for the Main Variables across 30 Chinese Provincial-Level Regions, 2005–2021.
4.2. Baseline Regression Analysis
Table 3 reports the baseline regression results for the relationship between digital–green integration (DGI) and urban ecological resilience. Column (1) presents the random-effects estimates without control variables. The coefficient on DGI is 0.116, with a standard error of 0.011, and is statistically significant at the 1% level. Column (2) retains the random-effects specification and introduces the full set of control variables. The DGI coefficient decreases to 0.035, with a standard error of 0.018, but remains significant at the 5% level. Column (3) further incorporates province and year fixed effects while retaining the control variables. The estimated coefficient on DGI is 0.056, with a standard error of 0.027, and remains significant at the 5% level. By accounting for time-invariant provincial characteristics and common annual shocks, Column (3) serves as the preferred specification in this study.
Table 3.
Baseline Regression Results for the Relationship between Digital–Green Integration and Urban Ecological Resilience: Random-Effects and Two-Way Fixed-Effects Estimates.
The coefficient on DGI is positive and statistically significant in all three columns. Its direction and significance remain stable across different estimation methods, indicating that the main finding is not contingent on a particular estimator. These results support H1a, suggesting that the resilience-enhancing benefits of DGI outweigh its environmental costs, whereas H1b is not supported.
4.3. Dimension-Specific Regression Analysis
Table 4 reports the estimated effects of digital–green integration (DGI) on the three dimensions of urban ecological resilience: resistance, recovery, and renewal. All three specifications include the same control variables as well as province and year fixed effects, and each is estimated using 510 province-year observations.
Table 4.
Dimension-Specific Two-Way Fixed-Effects Estimates for the Relationship between Digital–Green Integration and Urban Ecological Resistance, Recovery, and Renewal.
In Column (1), the coefficient on DGI is 0.018, with a standard error of 0.021, but it is not statistically significant, indicating that DGI has no detectable effect on urban ecological resistance. Column (2) reports a DGI coefficient of 0.048, with a standard error of 0.023, which is positive and significant at the 5% level. This result suggests that DGI strengthens the capacity of urban ecological systems to restore their functions following environmental disturbances. In Column (3), the coefficient on DGI is 0.014, with a standard error of 0.019, and does not reach conventional significance levels, providing no clear evidence that DGI promotes ecological renewal. The reported R2 values are 0.5086, 0.2232, and 0.6086 for resistance, recovery, and renewal, respectively. Overall, the effect of DGI is concentrated in the recovery dimension, while no statistically significant effects are identified for resistance or renewal.
4.4. Endogeneity Test
Table 5 reports the fixed-effects 2SLS estimates. Column (1) presents the first-stage regression, in which DGI is the dependent variable, and Column (2) reports the second-stage regression with urban ecological resilience as the outcome. The instrument-provincial postal and telecommunications data in 1984 interacted with the national number of Internet users in year t has a positive first-stage coefficient of 0.0107, with a robust standard error of 0.0034 (p < 0.01). This result indicates that provinces with stronger historical communications foundations experienced larger increases in DGI as Internet use expanded nationwide.
Table 5.
Instrumental-Variable Estimates of the Relationship between Digital–Green Integration and Urban Ecological Resilience: First- and Second-Stage Results.
The Kleibergen–Paap rk LM statistic is 9.984 (p = 0.0016), rejecting the null of underidentification and confirming that the instrument provides identifying variation for DGI. The Kleibergen–Paap rk Wald F-statistic is 9.770, however, so the instrument cannot be described as unambiguously strong. We therefore supplement the conventional first-stage diagnostics with tests that remain valid under weak identification. The Anderson–Rubin Wald F-statistic is 82.68 and the Stock–Wright LM S statistic is 79.46, with both tests yielding p < 0.001. These results indicate that the statistical evidence for the DGI coefficient does not depend solely on conventional strong-instrument approximations.
In Column (2), the estimated coefficient on instrumented DGI is 1.1346, with a robust standard error of 0.3836 (p < 0.01). Its positive sign is consistent with the baseline estimate, indicating that the positive relationship between DGI and urban ecological resilience remains after addressing potential endogeneity through the IV specification. The model is exactly identified because one excluded instrument is used for one endogenous variable; consequently, the Hansen J and Sargan tests cannot be performed. Overall, the 2SLS estimates and weak-instrument-robust tests provide convergent evidence that the positive relationship between DGI and urban ecological resilience persists after potential endogeneity is taken into account.
4.5. Robustness Tests
Table 6 summarizes three robustness tests examining whether the baseline result is sensitive to the temporal specification, sample composition, and extreme values. Column (1) replaces current DGI with its one-period lag. Column (2) excludes Beijing, Shanghai, Tianjin, and Chongqing from the sample. Column (3) winsorizes the continuous variables to limit the influence of extreme observations. All three specifications retain the same control variables, province fixed effects, and year fixed effects as the baseline model. The purpose, implementation, and results of each test are explained below.
Table 6.
Robustness Checks Using Lagged Digital–Green Integration, Municipality Exclusion, and Winsorization.
4.5.1. Lagged Variable Robustness Check
As a robustness check, the core explanatory variable is replaced with its one-period lag. The estimated coefficient is 0.05, with a standard error of 0.023, and remains significant at the 5% level. The positive association remains when lagged DGI is used, which indicates that the baseline relationship is not simply a contemporaneous correlation. However, the lagged specification should be interpreted as an additional robustness test rather than a complete solution to endogeneity. More rigorous causal identification, such as instrumental-variable estimation or quasi-natural experiments, is therefore noted as a limitation and a direction for future research.
4.5.2. Excluding Samples from Municipalities Directly Under the Central Government
Municipalities directly under the central government may differ sharply from other provinces in economic scale, digital infrastructure, and green-finance capacity. To reduce the influence of these administratively special observations, they are excluded from the sample. The coefficient of DGI is 0.072 and remains significant at the 5% level.
4.5.3. Truncation
Extreme values are further addressed through a two-tailed 1% trimming procedure. After trimming, the coefficient remains positive and significant at the 5% level. The lagged-variable test, municipality exclusion, and trimming exercise all preserve the sign and approximate magnitude of the main coefficient, strengthening confidence in the benchmark conclusion.
4.6. Mechanism Test
Table 7 examines whether digital-green integration affects urban ecological resilience through environmental improvement and energy efficiency. Both specifications include the full set of control variables as well as province and year fixed effects.
Table 7.
Mechanism Analysis of Digital-Green Integration and Urban Ecological Resilience.
Column (1) examines whether digital-green integration promotes the upgrading of the industrial structure. After controlling for other socioeconomic factors as well as province and year fixed effects, the coefficient of DGI is positive and statistically significant at the 1% level. This indicates that closer coordination between digital infrastructure and green finance is associated with a higher degree of industrial-structure advancement.
Column (2) reports a negative and statistically significant coefficient for DGI in the ln(ECPG) equation. Since ECPG measures energy consumption per unit of GDP, a lower value represents higher energy efficiency. The negative coefficient therefore indicates that digital–green integration reduces energy intensity. Digital technologies can improve the identification and management of inefficient energy use, while green finance provides funding for cleaner production, energy-saving equipment, and low-carbon technological upgrading.
Taken together, the results support both hypotheses. Digital–green integration contributes to urban ecological resilience by improving environmental performance and reducing energy consumption per unit of output.
4.7. Moderating Effect Test
Table 8 evaluates not only whether traffic infrastructure moderates the effect of digital–green integration on urban ecological resilience, but also whether this moderating relationship can be adequately represented by a linear specification. Column (1) presents the baseline interaction model. The positive and highly significant interaction term indicates that traffic infrastructure strengthens the resilience effect of DGI rather than merely exerting an independent influence on resilience. This moderating role is also reflected in the simple-slope estimates: when traffic infrastructure is low or close to its sample mean, the effect of DGI cannot be statistically distinguished from zero, whereas it becomes significantly positive at a relatively high level of traffic infrastructure.
Table 8.
Moderating Effect of Traffic Infrastructure on the Relationship between Digital–Green Integration and Urban Ecological Resilience.
Column (2) examines whether this strengthening effect changes nonlinearly as traffic infrastructure develops. It extends the baseline model by introducing the squared term of traffic infrastructure and its interaction with DGI. Neither term is statistically significant, and the improvement in model fit is modest. The evidence therefore does not support a pronounced threshold, U-shaped, or inverted U-shaped moderating pattern. Rather, the results suggest that traffic infrastructure operates as a broadly linear enabling factor: as transport conditions improve, the capacity of digital–green integration to enhance urban ecological resilience increases steadily.
4.8. Heterogeneity Analysis
Heterogeneity is examined by splitting the sample according to urbanization and environmental regulation intensity. To improve reproducibility, provinces are classified using the median values of urbanization and environmental regulation intensity over the sample period. Provinces at or above the median are classified as high-level regions, and those below the median are classified as low-level regions. Fixed-effects regressions are estimated separately for each group, with results shown in Table 9.
Table 9.
Heterogeneity Analysis by Urbanization and Environmental Regulation Intensity.
4.8.1. Grouping by Urbanization Level
Columns (1) and (2) report the estimates for provinces with high and low urbanization levels, respectively. In the high-urbanization group, the coefficient of DGI is positive but statistically insignificant. In the low-urbanization group, the coefficient rises to 0.123 and is significant at the 10% level. The estimates therefore suggest that the resilience-enhancing effect of digital–green integration is more evident in less urbanized provinces.
This pattern may reflect differences in the marginal benefits generated by digital and green inputs. Provinces with relatively low urbanization commonly face larger gaps in digital infrastructure, green financing, environmental information systems, and local governance capacity. Under such conditions, the integration of digital technologies with green financial resources can improve access to environmental information, reduce the cost of identifying green projects, and direct capital toward infrastructure upgrading and ecological restoration. Because the initial level of these supporting conditions is relatively low, improvements brought about by digital–green integration are more likely to produce visible gains in ecological resilience.
The insignificant coefficient in highly urbanized provinces does not imply that digital–green integration has no value in these regions. Their digital infrastructure, financial systems, and environmental governance arrangements are generally more developed, leaving less room for immediate marginal improvement. At the same time, dense economic activity, concentrated populations, and more complex pollution sources may increase the difficulty of translating digital and financial advantages into short-term resilience gains. Consequently, the effect of digital–green integration may depend more heavily on improvements in resource coordination, technological conversion, and cross-departmental governance in highly urbanized regions.
4.8.2. Grouping by Level of Environmental Regulation Intensity
Columns (3) and (4) present the estimates for provinces with high and low environmental regulation intensity. In the high-regulation group, the coefficient of DGI is positive and significant at the 5% level. In contrast, the coefficient in the low-regulation group is close to zero and statistically insignificant. These results indicate that stronger environmental regulation is associated with a more pronounced resilience effect of digital–green integration.
Environmental regulation can strengthen this effect by creating clearer institutional incentives and constraints. More stringent regulation increases the demand for environmental monitoring, information disclosure, emissions verification, and performance assessment. Digital technologies can respond to these demands by improving data collection and reducing information asymmetry, while green finance can channel capital toward firms and projects that meet environmental requirements. When regulation is effectively implemented, the two components are therefore more likely to complement each other and generate measurable improvements in ecological resilience.
By comparison, weak environmental regulation may limit the conversion of digital and green resources into substantive environmental outcomes. Where enforcement is insufficient and environmental information remains incomplete, firms face weaker incentives to undertake costly green transformation. Financial institutions may also find it difficult to distinguish genuinely green projects from those with limited environmental benefits. Under these circumstances, digital infrastructure may improve the availability of information without ensuring its effective use, while green capital may not be allocated to projects that materially strengthen ecological resilience. This helps explain why the estimated effect of DGI is statistically insignificant in provinces with relatively weak environmental regulation.
Taken together, the subgroup estimates suggest that the effect of digital–green integration is stronger in provinces with lower urbanization and more stringent environmental regulation. These patterns should nevertheless be interpreted as indicative evidence, since differences in coefficient size and statistical significance across subsamples do not by themselves establish statistically significant cross-group differences.
5. Discussion and Conclusions
5.1. Discussion
China’s simultaneous digital and green transitions have created new opportunities for urban ecological governance while also giving rise to coordination challenges of broader international relevance. Digital infrastructure can strengthen environmental monitoring, information transmission, and risk identification, whereas green finance can provide the capital required for pollution control, ecological restoration, and low-carbon development. However, asynchronous development, inconsistent data standards, and weak institutional linkages may prevent these complementary advantages from being translated into tangible gains in ecological resilience [132,133]. This coordination challenge is not unique to China; it has also emerged across countries seeking to align their digital and green transitions [133,134]. To address this issue, this study draws on the 4R resilience framework and conceptualizes urban ecological resilience as a multidimensional capacity encompassing resistance, recovery, and renewal, rather than as a single environmental outcome. Methodologically, unlike previous studies that examine the digital economy and green finance separately or capture their combined influence through a simple multiplicative interaction term [135,136,137], this study employs a coupling coordination degree index to measure the coordinated development of digital infrastructure and green finance. Urban ecological resilience is further evaluated through a multidimensional entropy-weighted indicator system. The empirical strategy combines a two-way fixed-effects model with instrumental-variable estimation, robustness tests, mechanism analysis, moderation analysis, and regional heterogeneity analysis. By exploiting within-province variation over time while controlling for time-invariant provincial characteristics and common year-specific shocks, this research design provides a more credible assessment of the overall relationship between digital-green integration and urban ecological resilience. The subsequent analyses further explore the potential pathways through which this relationship operates and the regional conditions under which it becomes more pronounced.
Taken together, these findings extend the existing literature in three respects. First, by treating urban ecological resilience as a multidimensional outcome, the analysis shows that the positive relationship with digital–green integration is concentrated primarily in the recovery dimension rather than being uniformly distributed across resistance, recovery, and renewal. Second, the mechanism results are consistent with the roles of industrial-structure upgrading and energy-efficiency improvement as potential transmission channels, while the moderation analysis identifies traffic infrastructure as an enabling condition that strengthens the relationship. Third, the heterogeneity results show that the relationship is not uniform across regions but is more pronounced in provinces with lower levels of urbanization and stronger environmental regulation. These findings provide a more differentiated and context-sensitive understanding of how digital–green integration is associated with urban ecological resilience.
The findings indicate that the coordinated development of digital infrastructure and green finance contributes to improving urban ecological resilience. The practical value of this effect should be understood across the full process of ecological disturbance, including risk prevention before a shock, emergency response during the shock, ecological restoration after the shock, and long-term resilience building. Before a disturbance occurs, public authorities should establish interoperable environmental-data standards and risk-warning mechanisms, enterprises should monitor and disclose their energy use, emissions, and environmental risks, and financial institutions should use these data to assess green projects and design contingency credit and environmental insurance arrangements. Digital technologies and green finance should also jointly support cleaner production, industrial upgrading, and energy-efficiency improvements to reduce routine ecological pressures at the source. When a disturbance occurs, real-time monitoring should activate coordinated responses among government agencies, enterprises, and financial institutions. Enterprises should implement contingency plans, financial institutions are supposed to provide rapid credit and insurance compensation. After the immediate shock, enterprises should undertake pollution treatment and ecological remediation, financial institutions should direct capital toward projects with verifiable recovery outcomes, and third-party organizations and local communities should participate in monitoring restoration performance. Over the longer term, all actors should contribute to ecological restoration and ecosystem conservation. The sequencing of these actions should also reflect regional conditions, including differences in urbanization and environmental regulation intensity.
Despite its potential benefits, digital–green integration also entails governmental, economic, and social risks. From a governmental perspective, digital platforms and green-finance programs may lead to duplicated investment, fragmented data systems, fiscal dependence, and greenwashing when verification and performance evaluation are weak. Economically, digital infrastructure may crowd out conventional environmental expenditure, increase electricity demand, widen regional disparities, and generate rebound effects that offset expected efficiency gains. Socially, unequal access to digital technologies may deepen disparities across regions, firms, and social groups, while automated governance may marginalize populations with limited digital literacy. Data integration also raises concerns regarding privacy, algorithmic transparency, and accountability. Digital-green integration should therefore be viewed not as a universally applicable technological solution, but as a governance process that requires effective coordination, institutional safeguards, and inclusive implementation.
A further limitation concerns the measurement of urban ecological resilience. The current education-related indicator mainly captures formal higher education and does not fully reflect basic and secondary education, vocational education and training, or other capacity-building activities. Consequently, the index may not fully capture the contribution of broader human-capacity development to urban ecological resilience. Future research should incorporate more comprehensive indicators of education and training and systematically examine how different forms of capacity building contribute to urban ecological resilience.
5.2. Conclusions
The present study employs a two-way fixed-effects model to examine the relationship between digital–green integration and urban ecological resilience using a balanced panel of 30 Chinese provincial-level regions from 2005 to 2021. Digital–green integration is measured through the coordinated development of digital infrastructure and green finance, while urban ecological resilience is evaluated across the dimensions of resistance, recovery, and renewal. The study further investigates the potential transmission channels of industrial-structure upgrading and energy-efficiency improvement, together with the moderating role of traffic infrastructure and regional differences associated with urbanization and environmental regulation intensity. The findings show, first, that digital–green integration is positively associated with urban ecological resilience, and this conclusion remains stable after alternative variable specifications, sample adjustments, winsorization, and instrumental-variable estimation. Second, the positive effect is concentrated mainly in ecological recovery, whereas no statistically significant effects are identified for resistance or renewal, indicating that digital–green integration is more effective in supporting environmental response and ecological restoration than in immediately strengthening long-term preventive and transformative capacities. Third, the mechanism results are consistent with the view that digital–green integration enhances resilience by promoting industrial-structure upgrading and improving energy efficiency. Finally, the positive relationship becomes more evident where traffic infrastructure is better developed and in provinces with lower urbanization or stronger environmental regulation.
5.3. Recommendations
Digital–green integration strengthens urban ecological resilience primarily by improving the restoration of ecological functions after disturbances, while its contribution to longer-term resistance and renewal remains comparatively limited. Accordingly, digital systems and green financial instruments should be more closely connected with rapid damage assessment, emergency financing, restoration procurement, and the continuous evaluation of recovery outcomes. Dedicated financing channels can be established for pollution treatment, damaged-facility repair, and ecosystem restoration, with funding released according to verified project progress. However, faster recovery should not be mistaken for stronger long-term resilience. Ecological infrastructure, land-use controls, habitat connectivity, and the maintenance of natural buffers still require sustained investment beyond the digital–green policy framework.
The resilience benefits of digital–green integration are also associated with a cleaner industrial structure and more efficient energy use. Its performance should therefore be judged by changes in production and resource use, not by the number of digital platforms established or financial products labeled as green. Enterprises can incorporate energy and emissions data into equipment renewal, procurement, and production planning. Financial institutions, in turn, can adjust credit conditions according to verified reductions in energy intensity and improvements in environmental performance. Sectoral transition roadmaps would provide a common reference for both sides, helping capital move away from inefficient and pollution-intensive activities. In this way, digital information does more than improve visibility: it changes investment decisions, reshapes production, and reduces the environmental pressures that make cities more vulnerable to disturbance.
The benefits of digital–green integration are more visible where transport infrastructure is relatively well developed and in provinces with lower urbanization or stronger environmental regulation. These differences call for regional sequencing rather than a uniform policy package. Less urbanized areas need reliable digital access, usable environmental data, and green financial services that smaller enterprises and local projects can actually reach. Where transport connectivity remains weak, the priority is to improve the movement of technical personnel, emergency equipment, and restoration materials. Regions with weaker environmental regulation face a different constraint: information may be collected and finance may be labeled green, yet neither necessarily produces environmental improvement. Credible disclosure, independent verification, enforcement, and accountability must therefore take priority. Highly urbanized regions, by contrast, may gain more from integrating existing systems, improving project quality, and coordinating ecological governance across administrative boundaries than from simply expanding investment.
Author Contributions
Y.Q.: Conceptualization, Methodology, Software, Formal analysis, Data curation, Visualization, Writing—original draft, Writing—review and editing. Y.L.: Supervision, Validation, Project administration, Writing—review and editing. All authors have read and agreed to the published version of the manuscript.
Funding
This research received no external funding.
Institutional Review Board Statement
Not applicable.
Informed Consent Statement
Not applicable.
Data Availability Statement
The datasets used and analyzed in this study are included in the article. Further inquiries can be directed to the corresponding author.
Conflicts of Interest
The authors declare no conflicts of interest.
References
- United Nations Human Settlements Programme (UN-Habitat). Resolution 2/4: Biodiverse and Resilient Cities: Mainstreaming Biodiversity and Ecosystem Services into Urban and Territorial Planning; HSP/HA.2/Res.4; UN-Habitat: Nairobi, Kenya, 2023. [Google Scholar]
- COP29 Presidency. COP29 Declaration on Multisectoral Actions Pathways (MAP) to Resilient and Healthy Cities; COP29 Presidency: Baku, Azerbaijan, 2024. [Google Scholar]
- Gann, G.D.; McDonald, T.; Walder, B.; Aronson, J.; Nelson, C.R.; Jonson, J.; Hallett, J.G.; Eisenberg, C.; Guariguata, M.R.; Liu, J.; et al. International principles and standards for the practice of ecological restoration. Second edition. Restor. Ecol. 2019, 27, S1–S46. [Google Scholar] [CrossRef] [Scilit]
- United Nations Environment Programme (UNEP); Food and Agriculture Organization of the United Nations (FAO). Becoming #GenerationRestoration: Ecosystem Restoration for People, Nature and Climate; United Nations Environment Programme: Nairobi, Kenya, 2021; ISBN 978-92-807-3864-3. [Google Scholar]
- Meerow, S.; Newell, J.P.; Stults, M. Defining urban resilience: A review. Landsc. Urban Plan 2015, 147, 38–49. [Google Scholar] [CrossRef] [Scilit]
- Liu, L.; Fryd, O.; Zhang, S. Blue-Green Infrastructure for Sustainable Urban Stormwater Management—Lessons from Six Municipality-Led Pilot Projects in Beijing and Copenhagen. Water 2019, 11, 2024. [Google Scholar] [CrossRef] [Scilit]
- G20 Green Finance Study Group. G20 Green Finance Synthesis Report; G20 Green Finance Study Group: Nairobi, Kenya, 2016. [Google Scholar]
- District of Columbia Water and Sewer Authority (DC Water). DC Water, Goldman Sachs and Calvert Foundation Pioneer Environmental Impact Bond. Available online: https://www.dcwater.com/about-dc-water/media/news/dc-water-goldman-sachs-and-calvert-foundation-pioneer-environmental (accessed on 4 August 2026).
- Muench, S.; Stoermer, E.; Jensen, K.; Asikainen, T.; Salvi, M.; Scapolo, F. Towards a Green & Digital Future–Key Requirements for Successful Twin Transitions in the European Union; Publications Office of the European Union: Luxembourg, 2022; Available online: https://data.europa.eu/doi/10.2760/977331 (accessed on 4 August 2026).
- Huang, X.; Ren, Y.; Lü, Z. Influential Factors and Configurational Effects of Digital–Green Collaborative Transformation for Long-Term Preservation of Archive Resources. Arch. Sci. Study 2025, 39, 107–115. (In Chinese) [Google Scholar] [CrossRef]
- Wang, Y.; Ling, T.; Zhao, Y. Experience and Implications of Huzhou’s Pilot Reform of Industrial Carbon Efficiency. Theory Pract. New Ind. 2024, 1, 102–108. (In Chinese) [Google Scholar]
- Zhao, B.; Fang, L.; Zhang, J.; Li, W.; Tao, L.; Yu, Q.; Wen, C. Impact of digital finance on urban ecological resilience: Evidence from the Yangtze River Economic Belt in China. Environ. Sci. Pollut. Res. 2024, 31, 9218–9236. [Google Scholar] [CrossRef] [Scilit]
- Wang, H.; Zheng, M.; Yin, H.; Chang, C. Green innovation, industrial structure and urban eco-efficiency in Chinese cities. Econ. Anal. Policy 2024, 82, 1011–1024. [Google Scholar] [CrossRef] [Scilit]
- OECD. A Territoryial approach to climate action and resilience. In OECD Regional Development Studies; OECD Publishing: Paris, France, 2023. [Google Scholar] [CrossRef] [Scilit]
- Holling, C.S. Resilience and stability of ecological systems. Annu. Rev. Ecol. Syst. 1973, 4, 1–23. [Google Scholar] [CrossRef] [Scilit]
- Carpenter, S.; Walker, B.; Anderies, J.M.; Abel, N. From Metaphor to Measurement: Resilience of What to What? Ecosystems 2001, 4, 765–781. [Google Scholar] [CrossRef] [Scilit]
- Walker, B.; Holling, C.S.; Carpenter, S.R.; Kinzig, A. Resilience, adaptability, and transformability in social-ecological systems. Ecol. Soc. 2004, 9, 5. [Google Scholar] [CrossRef] [Scilit]
- Ingrisch, J.; Bahn, M. Towards a comparable quantification of resilience. Trends Ecol. Evol. 2018, 33, 251–259. [Google Scholar] [CrossRef] [Scilit]
- Tong, P. Characteristics, dimensions and methods of current assessment for urban resilience to climate-related disasters: A systematic review of the literature. Int. J. Disaster Risk Reduct. 2021, 60, 102276. [Google Scholar] [CrossRef] [Scilit]
- Gao, Y.; Zhang, Y.; Xu, D. A systematic review of urban ecological resilience: Emerging frontiers in process-oriented metabolic research. Ecol. Model. 2025, 510, 111319. [Google Scholar] [CrossRef] [Scilit]
- Yi, C.; Jackson, N. A review of measuring ecosystem resilience to disturbance. Environ. Res. Lett. 2021, 16, 053008. [Google Scholar] [CrossRef] [Scilit]
- Shi, C.; Zhu, X.; Wu, H.; Li, Z. Assessment of urban ecological resilience and its influencing factors: A case study of the Beijing-Tianjin-Hebei Urban Agglomeration of China. Land 2022, 11, 921. [Google Scholar] [CrossRef] [Scilit]
- Zhang, Q.; Huang, T.; Xu, S. Assessment of urban Ecological resilience based on PSR framework in the Pearl River Delta Urban Agglomeration, China. Land 2023, 12, 1089. [Google Scholar] [CrossRef] [Scilit]
- Wang, Z.; Liu, W. A comparative study of urban ecological resilience in the Yangtze River Economic Belt and the Yellow River Basin. Humanit. Soc. Sci. Commun. 2024, 11, 1471. [Google Scholar] [CrossRef] [Scilit]
- Xia, C.; Dong, Z.; Chen, B. Spatio-Temporal Analysis and Simulation of Urban Ecological Resilience: A Case Study of Hangzhou. Acta Ecol. Sin. 2022, 42, 116–126. (In Chinese) [Google Scholar] [CrossRef] [Scilit]
- Brueck, C.; Losacker, S.; Liefner, I. China’s digital and green (twin) transition: Insights from national and regional innovation policies. Reg. Stud. 2024, 59, 2384411. [Google Scholar] [CrossRef] [Scilit]
- Liu, N.; Sun, M. Configuration Pathways for Enhancing Economic Resilience Driven by the Synergy of Digital and Green Transformations: An Empirical Analysis Using a Hybrid Method of Dynamic QCA and Random Forest. Sci. Technol. Prog. Policy 2025, 42, 13–23. [Google Scholar]
- Zhang, Y.; Yue, S.; Lai, X. Exploring digital green convergence for firm competitiveness. Financ. Res. Lett. 2024, 70, 106363. [Google Scholar] [CrossRef] [Scilit]
- Bruneau, M.; Chang, S.E.; Eguchi, R.T.; Lee, G.C.; O’Rourke, T.D.; Reinhorn, A.M.; Shinozuka, M.; Tierney, K.; Wallace, W.A.; Von Winterfeldt, D. A framework to quantitatively assess and enhance the seismic resilience of communities. Earthq. Spectra 2003, 19, 733–752. [Google Scholar] [CrossRef] [Scilit]
- Wu, F.; Hu, Y.; Shen, M. The color of FinTech: FinTech and corporate green transformation in China. Int. Rev. Financ. Anal. 2024, 94, 103254. [Google Scholar] [CrossRef] [Scilit]
- Wan, J.; Niu, Z.; Li, B. Does Fintech improve the carbon reduction effect of green credit policy? Evidence from China. Econ. Anal. Policy 2025, 85, 1258–1269. [Google Scholar] [CrossRef] [Scilit]
- Freitag, C.; Berners-Lee, M.; Widdicks, K.; Knowles, B.; Blair, G.S.; Friday, A. The real climate and transformative impact of ICT: A critique of estimates, trends, and regulations. Patterns 2021, 2, 100340. [Google Scholar] [CrossRef] [Scilit]
- Zhu, Y.; Lan, M. Digital economy and carbon rebound effect: Evidence from Chinese cities. Energy Econ. 2023, 126, 106957. [Google Scholar] [CrossRef] [Scilit]
- Liu, C.; Wang, J.; Ji, Q.; Zhang, D. To be green or not to be: How governmental regulation shapes financial institutions’ greenwashing behaviors in green finance. Int. Rev. Financ. Anal. 2024, 93, 103225. [Google Scholar] [CrossRef] [Scilit]
- Zhao, S.; Peng, D.; Wen, H.; Song, H. Does the digital economy promote upgrading the industrial structure of Chinese cities? Sustainability 2022, 14, 10235. [Google Scholar] [CrossRef] [Scilit]
- Wang, X.; Wang, Q. Research on the impact of green finance on the upgrading of China’s regional industrial structure from the perspective of sustainable development. Resour. Policy 2021, 74, 102436. [Google Scholar] [CrossRef] [Scilit]
- Han, Y.; Zhang, F.; Huang, L.; Peng, K.; Wang, X. Does industrial upgrading promote eco-efficiency? ─A panel space estimation based on Chinese evidence. Energy Policy 2021, 154, 112286. [Google Scholar] [CrossRef] [Scilit]
- Jia, S.; Chen, X.; Jin, J. Digital disruption and energy efficiency: The impact of regional digitalization on China’s industrial sector. Energy 2024, 300, 131542. [Google Scholar] [CrossRef] [Scilit]
- Lee, C.; Wang, C.; Wang, C.; He, Z.; Xing, W.; Wang, K. How does green finance affect energy efficiency? The role of green technology innovation and energy structure. Renew. Energy 2023, 219, 119417. [Google Scholar] [CrossRef] [Scilit]
- National Bureau of Statistics of China. China City Statistical Yearbook 2006; China Statistics Press: Beijing, China, 2006. (In Chinese) [Google Scholar]
- National Bureau of Statistics of China. China City Statistical Yearbook 2007; China Statistics Press: Beijing, China, 2007. (In Chinese) [Google Scholar]
- National Bureau of Statistics of China. China City Statistical Yearbook 2008; China Statistics Press: Beijing, China, 2008. (In Chinese) [Google Scholar]
- National Bureau of Statistics of China. China City Statistical Yearbook 2009; China Statistics Press: Beijing, China, 2009. (In Chinese) [Google Scholar]
- National Bureau of Statistics of China. China City Statistical Yearbook 2010; China Statistics Press: Beijing, China, 2010. (In Chinese) [Google Scholar]
- National Bureau of Statistics of China. China City Statistical Yearbook 2011; China Statistics Press: Beijing, China, 2011. (In Chinese) [Google Scholar]
- National Bureau of Statistics of China. China City Statistical Yearbook 2012; China Statistics Press: Beijing, China, 2012. (In Chinese) [Google Scholar]
- National Bureau of Statistics of China. China City Statistical Yearbook 2013; China Statistics Press: Beijing, China, 2013. (In Chinese) [Google Scholar]
- National Bureau of Statistics of China. China City Statistical Yearbook 2014; China Statistics Press: Beijing, China, 2014. (In Chinese) [Google Scholar]
- National Bureau of Statistics of China. China City Statistical Yearbook 2015; China Statistics Press: Beijing, China, 2015. (In Chinese) [Google Scholar]
- National Bureau of Statistics of China. China City Statistical Yearbook 2016; China Statistics Press: Beijing, China, 2016. (In Chinese) [Google Scholar]
- National Bureau of Statistics of China. China City Statistical Yearbook 2017; China Statistics Press: Beijing, China, 2017. (In Chinese) [Google Scholar]
- National Bureau of Statistics of China. China City Statistical Yearbook 2018; China Statistics Press: Beijing, China, 2018. (In Chinese) [Google Scholar]
- National Bureau of Statistics of China. China City Statistical Yearbook 2019; China Statistics Press: Beijing, China, 2019. (In Chinese) [Google Scholar]
- National Bureau of Statistics of China. China City Statistical Yearbook 2020; China Statistics Press: Beijing, China, 2020. (In Chinese) [Google Scholar]
- National Bureau of Statistics of China. China City Statistical Yearbook 2021; China Statistics Press: Beijing, China, 2021. (In Chinese) [Google Scholar]
- National Bureau of Statistics of China. China City Statistical Yearbook 2022; China Statistics Press: Beijing, China, 2022. (In Chinese) [Google Scholar]
- National Bureau of Statistics of China; Ministry of Science and Technology of China. China Statistical Yearbook on Science and Technology 2006; China Statistics Press: Beijing, China, 2006. (In Chinese) [Google Scholar]
- National Bureau of Statistics of China; Ministry of Science and Technology of China. China Statistical Yearbook on Science and Technology 2007; China Statistics Press: Beijing, China, 2007. (In Chinese) [Google Scholar]
- National Bureau of Statistics of China; Ministry of Science and Technology of China. China Statistical Yearbook on Science and Technology 2008; China Statistics Press: Beijing, China, 2008. (In Chinese) [Google Scholar]
- National Bureau of Statistics of China; Ministry of Science and Technology of China. China Statistical Yearbook on Science and Technology 2009; China Statistics Press: Beijing, China, 2009. (In Chinese) [Google Scholar]
- National Bureau of Statistics of China; Ministry of Science and Technology of China. China Statistical Yearbook on Science and Technology 2010; China Statistics Press: Beijing, China, 2010. (In Chinese) [Google Scholar]
- National Bureau of Statistics of China; Ministry of Science and Technology of China. China Statistical Yearbook on Science and Technology 2011; China Statistics Press: Beijing, China, 2011. (In Chinese) [Google Scholar]
- National Bureau of Statistics of China; Ministry of Science and Technology of China. China Statistical Yearbook on Science and Technology 2012; China Statistics Press: Beijing, China, 2012. (In Chinese) [Google Scholar]
- National Bureau of Statistics of China; Ministry of Science and Technology of China. China Statistical Yearbook on Science and Technology 2013; China Statistics Press: Beijing, China, 2013. (In Chinese) [Google Scholar]
- National Bureau of Statistics of China; Ministry of Science and Technology of China. China Statistical Yearbook on Science and Technology 2014; China Statistics Press: Beijing, China, 2014. (In Chinese) [Google Scholar]
- National Bureau of Statistics of China; Ministry of Science and Technology of China. China Statistical Yearbook on Science and Technology 2015; China Statistics Press: Beijing, China, 2015. (In Chinese) [Google Scholar]
- National Bureau of Statistics of China; Ministry of Science and Technology of China. China Statistical Yearbook on Science and Technology 2016; China Statistics Press: Beijing, China, 2016. (In Chinese) [Google Scholar]
- National Bureau of Statistics of China; Ministry of Science and Technology of China. China Statistical Yearbook on Science and Technology 2017; China Statistics Press: Beijing, China, 2017. (In Chinese) [Google Scholar]
- National Bureau of Statistics of China; Ministry of Science and Technology of China. China Statistical Yearbook on Science and Technology 2018; China Statistics Press: Beijing, China, 2018. (In Chinese) [Google Scholar]
- National Bureau of Statistics of China; Ministry of Science and Technology of China. China Statistical Yearbook on Science and Technology 2019; China Statistics Press: Beijing, China, 2019. (In Chinese) [Google Scholar]
- National Bureau of Statistics of China; Ministry of Science and Technology of China. China Statistical Yearbook on Science and Technology 2020; China Statistics Press: Beijing, China, 2020. (In Chinese) [Google Scholar]
- National Bureau of Statistics of China; Ministry of Science and Technology of China. China Statistical Yearbook on Science and Technology 2021; China Statistics Press: Beijing, China, 2021. (In Chinese) [Google Scholar]
- National Bureau of Statistics of China; Ministry of Science and Technology of China. China Statistical Yearbook on Science and Technology 2022; China Statistics Press: Beijing, China, 2022. (In Chinese) [Google Scholar]
- National Bureau of Statistics of China. China Industry Statistical Yearbook 2006; China Statistics Press: Beijing, China, 2006. (In Chinese) [Google Scholar]
- National Bureau of Statistics of China. China Industry Statistical Yearbook 2007; China Statistics Press: Beijing, China, 2007. (In Chinese) [Google Scholar]
- National Bureau of Statistics of China. China Industry Statistical Yearbook 2008; China Statistics Press: Beijing, China, 2008. (In Chinese) [Google Scholar]
- National Bureau of Statistics of China. China Industry Statistical Yearbook 2009; China Statistics Press: Beijing, China, 2009. (In Chinese) [Google Scholar]
- National Bureau of Statistics of China. China Industry Statistical Yearbook 2010; China Statistics Press: Beijing, China, 2010. (In Chinese) [Google Scholar]
- National Bureau of Statistics of China. China Industry Statistical Yearbook 2011; China Statistics Press: Beijing, China, 2011. (In Chinese) [Google Scholar]
- National Bureau of Statistics of China. China Industry Statistical Yearbook 2012; China Statistics Press: Beijing, China, 2012. (In Chinese) [Google Scholar]
- National Bureau of Statistics of China. China Industry Statistical Yearbook 2013; China Statistics Press: Beijing, China, 2013. (In Chinese) [Google Scholar]
- National Bureau of Statistics of China. China Industry Statistical Yearbook 2014; China Statistics Press: Beijing, China, 2014. (In Chinese) [Google Scholar]
- National Bureau of Statistics of China. China Industry Statistical Yearbook 2015; China Statistics Press: Beijing, China, 2015. (In Chinese) [Google Scholar]
- National Bureau of Statistics of China. China Industry Statistical Yearbook 2016; China Statistics Press: Beijing, China, 2016. (In Chinese) [Google Scholar]
- National Bureau of Statistics of China. China Industry Statistical Yearbook 2017; China Statistics Press: Beijing, China, 2017. (In Chinese) [Google Scholar]
- National Bureau of Statistics of China. China Industry Statistical Yearbook 2018; China Statistics Press: Beijing, China, 2018. (In Chinese) [Google Scholar]
- National Bureau of Statistics of China. China Industry Statistical Yearbook 2019; China Statistics Press: Beijing, China, 2019. (In Chinese) [Google Scholar]
- National Bureau of Statistics of China. China Industry Statistical Yearbook 2020; China Statistics Press: Beijing, China, 2020. (In Chinese) [Google Scholar]
- National Bureau of Statistics of China. China Industry Statistical Yearbook 2021; China Statistics Press: Beijing, China, 2021. (In Chinese) [Google Scholar]
- National Bureau of Statistics of China. China Industry Statistical Yearbook 2022; China Statistics Press: Beijing, China, 2022. (In Chinese) [Google Scholar]
- National Bureau of Statistics of China. China Energy Statistical Yearbook 2006; China Statistics Press: Beijing, China, 2006. (In Chinese) [Google Scholar]
- National Bureau of Statistics of China. China Energy Statistical Yearbook 2007; China Statistics Press: Beijing, China, 2007. (In Chinese) [Google Scholar]
- National Bureau of Statistics of China. China Energy Statistical Yearbook 2008; China Statistics Press: Beijing, China, 2008. (In Chinese) [Google Scholar]
- National Bureau of Statistics of China. China Energy Statistical Yearbook 2009; China Statistics Press: Beijing, China, 2009. (In Chinese) [Google Scholar]
- National Bureau of Statistics of China. China Energy Statistical Yearbook 2010; China Statistics Press: Beijing, China, 2010. (In Chinese) [Google Scholar]
- National Bureau of Statistics of China. China Energy Statistical Yearbook 2011; China Statistics Press: Beijing, China, 2011. (In Chinese) [Google Scholar]
- National Bureau of Statistics of China. China Energy Statistical Yearbook 2012; China Statistics Press: Beijing, China, 2012. (In Chinese) [Google Scholar]
- National Bureau of Statistics of China. China Energy Statistical Yearbook 2013; China Statistics Press: Beijing, China, 2013. (In Chinese) [Google Scholar]
- National Bureau of Statistics of China. China Energy Statistical Yearbook 2014; China Statistics Press: Beijing, China, 2014. (In Chinese) [Google Scholar]
- National Bureau of Statistics of China. China Energy Statistical Yearbook 2015; China Statistics Press: Beijing, China, 2015. (In Chinese) [Google Scholar]
- National Bureau of Statistics of China. China Energy Statistical Yearbook 2016; China Statistics Press: Beijing, China, 2016. (In Chinese) [Google Scholar]
- National Bureau of Statistics of China. China Energy Statistical Yearbook 2017; China Statistics Press: Beijing, China, 2017. (In Chinese) [Google Scholar]
- National Bureau of Statistics of China. China Energy Statistical Yearbook 2018; China Statistics Press: Beijing, China, 2018. (In Chinese) [Google Scholar]
- National Bureau of Statistics of China. China Energy Statistical Yearbook 2019; China Statistics Press: Beijing, China, 2019. (In Chinese) [Google Scholar]
- National Bureau of Statistics of China. China Energy Statistical Yearbook 2020; China Statistics Press: Beijing, China, 2020. (In Chinese) [Google Scholar]
- National Bureau of Statistics of China. China Energy Statistical Yearbook 2021; China Statistics Press: Beijing, China, 2021. (In Chinese) [Google Scholar]
- National Bureau of Statistics of China. China Energy Statistical Yearbook 2022; China Statistics Press: Beijing, China, 2022. (In Chinese) [Google Scholar]
- Statistical Bureaus of the Sampled Provincial-Level Regions. Provincial Statistical Yearbooks 2006; China Statistics Press and Respective Local Publishers: Beijing, China, 2006. (In Chinese) [Google Scholar]
- Statistical Bureaus of the Sampled Provincial-Level Regions. Provincial Statistical Yearbooks 2007; China Statistics Press and Respective Local Publishers: Beijing, China, 2007. (In Chinese) [Google Scholar]
- Statistical Bureaus of the Sampled Provincial-Level Regions. Provincial Statistical Yearbooks 2008; China Statistics Press and Respective Local Publishers: Beijing, China, 2008. (In Chinese) [Google Scholar]
- Statistical Bureaus of the Sampled Provincial-Level Regions. Provincial Statistical Yearbooks 2009; China Statistics Press and Respective Local Publishers: Beijing, China, 2009. (In Chinese) [Google Scholar]
- Statistical Bureaus of the Sampled Provincial-Level Regions. Provincial Statistical Yearbooks 2010; China Statistics Press and Respective Local Publishers: Beijing, China, 2010. (In Chinese) [Google Scholar]
- Statistical Bureaus of the Sampled Provincial-Level Regions. Provincial Statistical Yearbooks 2011; China Statistics Press and Respective Local Publishers: Beijing, China, 2011. (In Chinese) [Google Scholar]
- Statistical Bureaus of the Sampled Provincial-Level Regions. Provincial Statistical Yearbooks 2012; China Statistics Press and Respective Local Publishers: Beijing, China, 2012. (In Chinese) [Google Scholar]
- Statistical Bureaus of the Sampled Provincial-Level Regions. Provincial Statistical Yearbooks 2013; China Statistics Press and Respective Local Publishers: Beijing, China, 2013. (In Chinese) [Google Scholar]
- Statistical Bureaus of the Sampled Provincial-Level Regions. Provincial Statistical Yearbooks 2014; China Statistics Press and Respective Local Publishers: Beijing, China, 2014. (In Chinese) [Google Scholar]
- Statistical Bureaus of the Sampled Provincial-Level Regions. Provincial Statistical Yearbooks 2015; China Statistics Press and Respective Local Publishers: Beijing, China, 2015. (In Chinese) [Google Scholar]
- Statistical Bureaus of the Sampled Provincial-Level Regions. Provincial Statistical Yearbooks 2016; China Statistics Press and Respective Local Publishers: Beijing, China, 2016. (In Chinese) [Google Scholar]
- Statistical Bureaus of the Sampled Provincial-Level Regions. Provincial Statistical Yearbooks 2017; China Statistics Press and Respective Local Publishers: Beijing, China, 2017. (In Chinese) [Google Scholar]
- Statistical Bureaus of the Sampled Provincial-Level Regions. Provincial Statistical Yearbooks 2018; China Statistics Press and Respective Local Publishers: Beijing, China, 2018. (In Chinese) [Google Scholar]
- Statistical Bureaus of the Sampled Provincial-Level Regions. Provincial Statistical Yearbooks 2019; China Statistics Press and Respective Local Publishers: Beijing, China, 2019. (In Chinese) [Google Scholar]
- Statistical Bureaus of the Sampled Provincial-Level Regions. Provincial Statistical Yearbooks 2020; China Statistics Press and Respective Local Publishers: Beijing, China, 2020. (In Chinese) [Google Scholar]
- Statistical Bureaus of the Sampled Provincial-Level Regions. Provincial Statistical Yearbooks 2021; China Statistics Press and Respective Local Publishers: Beijing, China, 2021. (In Chinese) [Google Scholar]
- Statistical Bureaus of the Sampled Provincial-Level Regions. Provincial Statistical Yearbooks 2022; China Statistics Press and Respective Local Publishers: Beijing, China, 2022. (In Chinese) [Google Scholar]
- Wind Information Co., Ltd. Wind Economic Database. Available online: https://www.wind.com.cn/portal/zh/EDB/index.html (accessed on 11 August 2026).
- Chu, M.; Sun, H.; Li, Y. A study on the impact of smart city development on ecological and environmental resilience. J. Manag. 2023, 36, 21–37. [Google Scholar] [CrossRef]
- Zhang, K.; Cao, B.; Guo, Z.; Li, R.; Li, L. Research on the impact of government attention on the digital economy of Chinese provinces. Innov. Green Dev. 2023, 3, 100118. [Google Scholar] [CrossRef] [Scilit]
- Wang, P.; Xu, X. Green finance and energy efficiency improvement: The role of green innovation and industrial upgrading. Innov. Green Dev. 2025, 4, 100200. [Google Scholar] [CrossRef] [Scilit]
- Wang, S.; Niu, J.; Jiang, H.; He, Z. The Impact and Spatial Spillover of Tourism Economy on Ecological Resilience in the Yellow River Basin. Geogr. Res. 2025, 44, 205–222. [Google Scholar] [CrossRef]
- Zhang, A.; Miao, C.; Chen, Z. Urban Ecological Resilience, Social Networks and Its Influencing Factors in the Yellow River Basin. Arid Land Geogr. 2025, 48, 130–142. [Google Scholar] [CrossRef]
- Shi, C.; Guo, N.; Gao, X.; Wu, F. How Carbon Emission Reduction Is Going to Affect Urban Resilience. J. Clean. Prod. 2022, 372, 133737. [Google Scholar] [CrossRef] [Scilit]
- Zhang, L.; Zhao, Y. Research on the Coupling Coordination of Green Finance, Digital Economy, and Ecological Environment in China. Sustainability 2023, 15, 7551. [Google Scholar] [CrossRef] [Scilit]
- Bianchini, S.; Damioli, G.; Ghisetti, C. The Environmental Effects of the “Twin” Green and Digital Transition in European Regions. Environ. Resour. Econ. 2023, 84, 877–918. [Google Scholar] [CrossRef] [Scilit]
- Siedschlag, I.; Mohan, G.; Yan, W. Twin Transitions across Enterprises: Do Digital Technologies and Sustainability Go Together? J. Clean. Prod. 2024, 481, 144025. [Google Scholar] [CrossRef] [Scilit]
- Zhang, Y.; Wang, J.; Liu, Y.; Zhao, J. The Impact of the Digital Economy on Urban Ecological Resilience: Empirical Evidence from China’s Comprehensive Big Data Pilot Zone Policy. Sustainability 2024, 16, 3611. [Google Scholar] [CrossRef] [Scilit]
- Wang, S.; Guo, B. Impact of Green Finance on Urban Ecological and Environmental Resilience: Evidence from China. Sustainability 2026, 18, 706. [Google Scholar] [CrossRef] [Scilit]
- Li, H.; Malim, N.A.K.; Xie, X.; Du, X. Interaction Effects of Green Finance and Digital Platforms on China’s Economic Growth. Sustainability 2025, 17, 8171. [Google Scholar] [CrossRef] [Scilit]
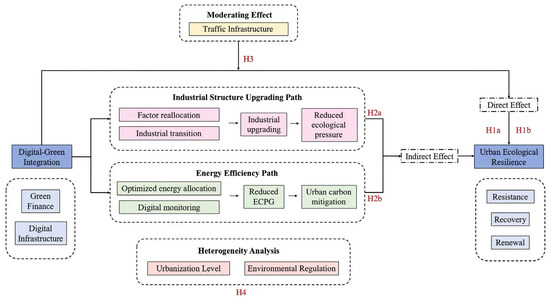
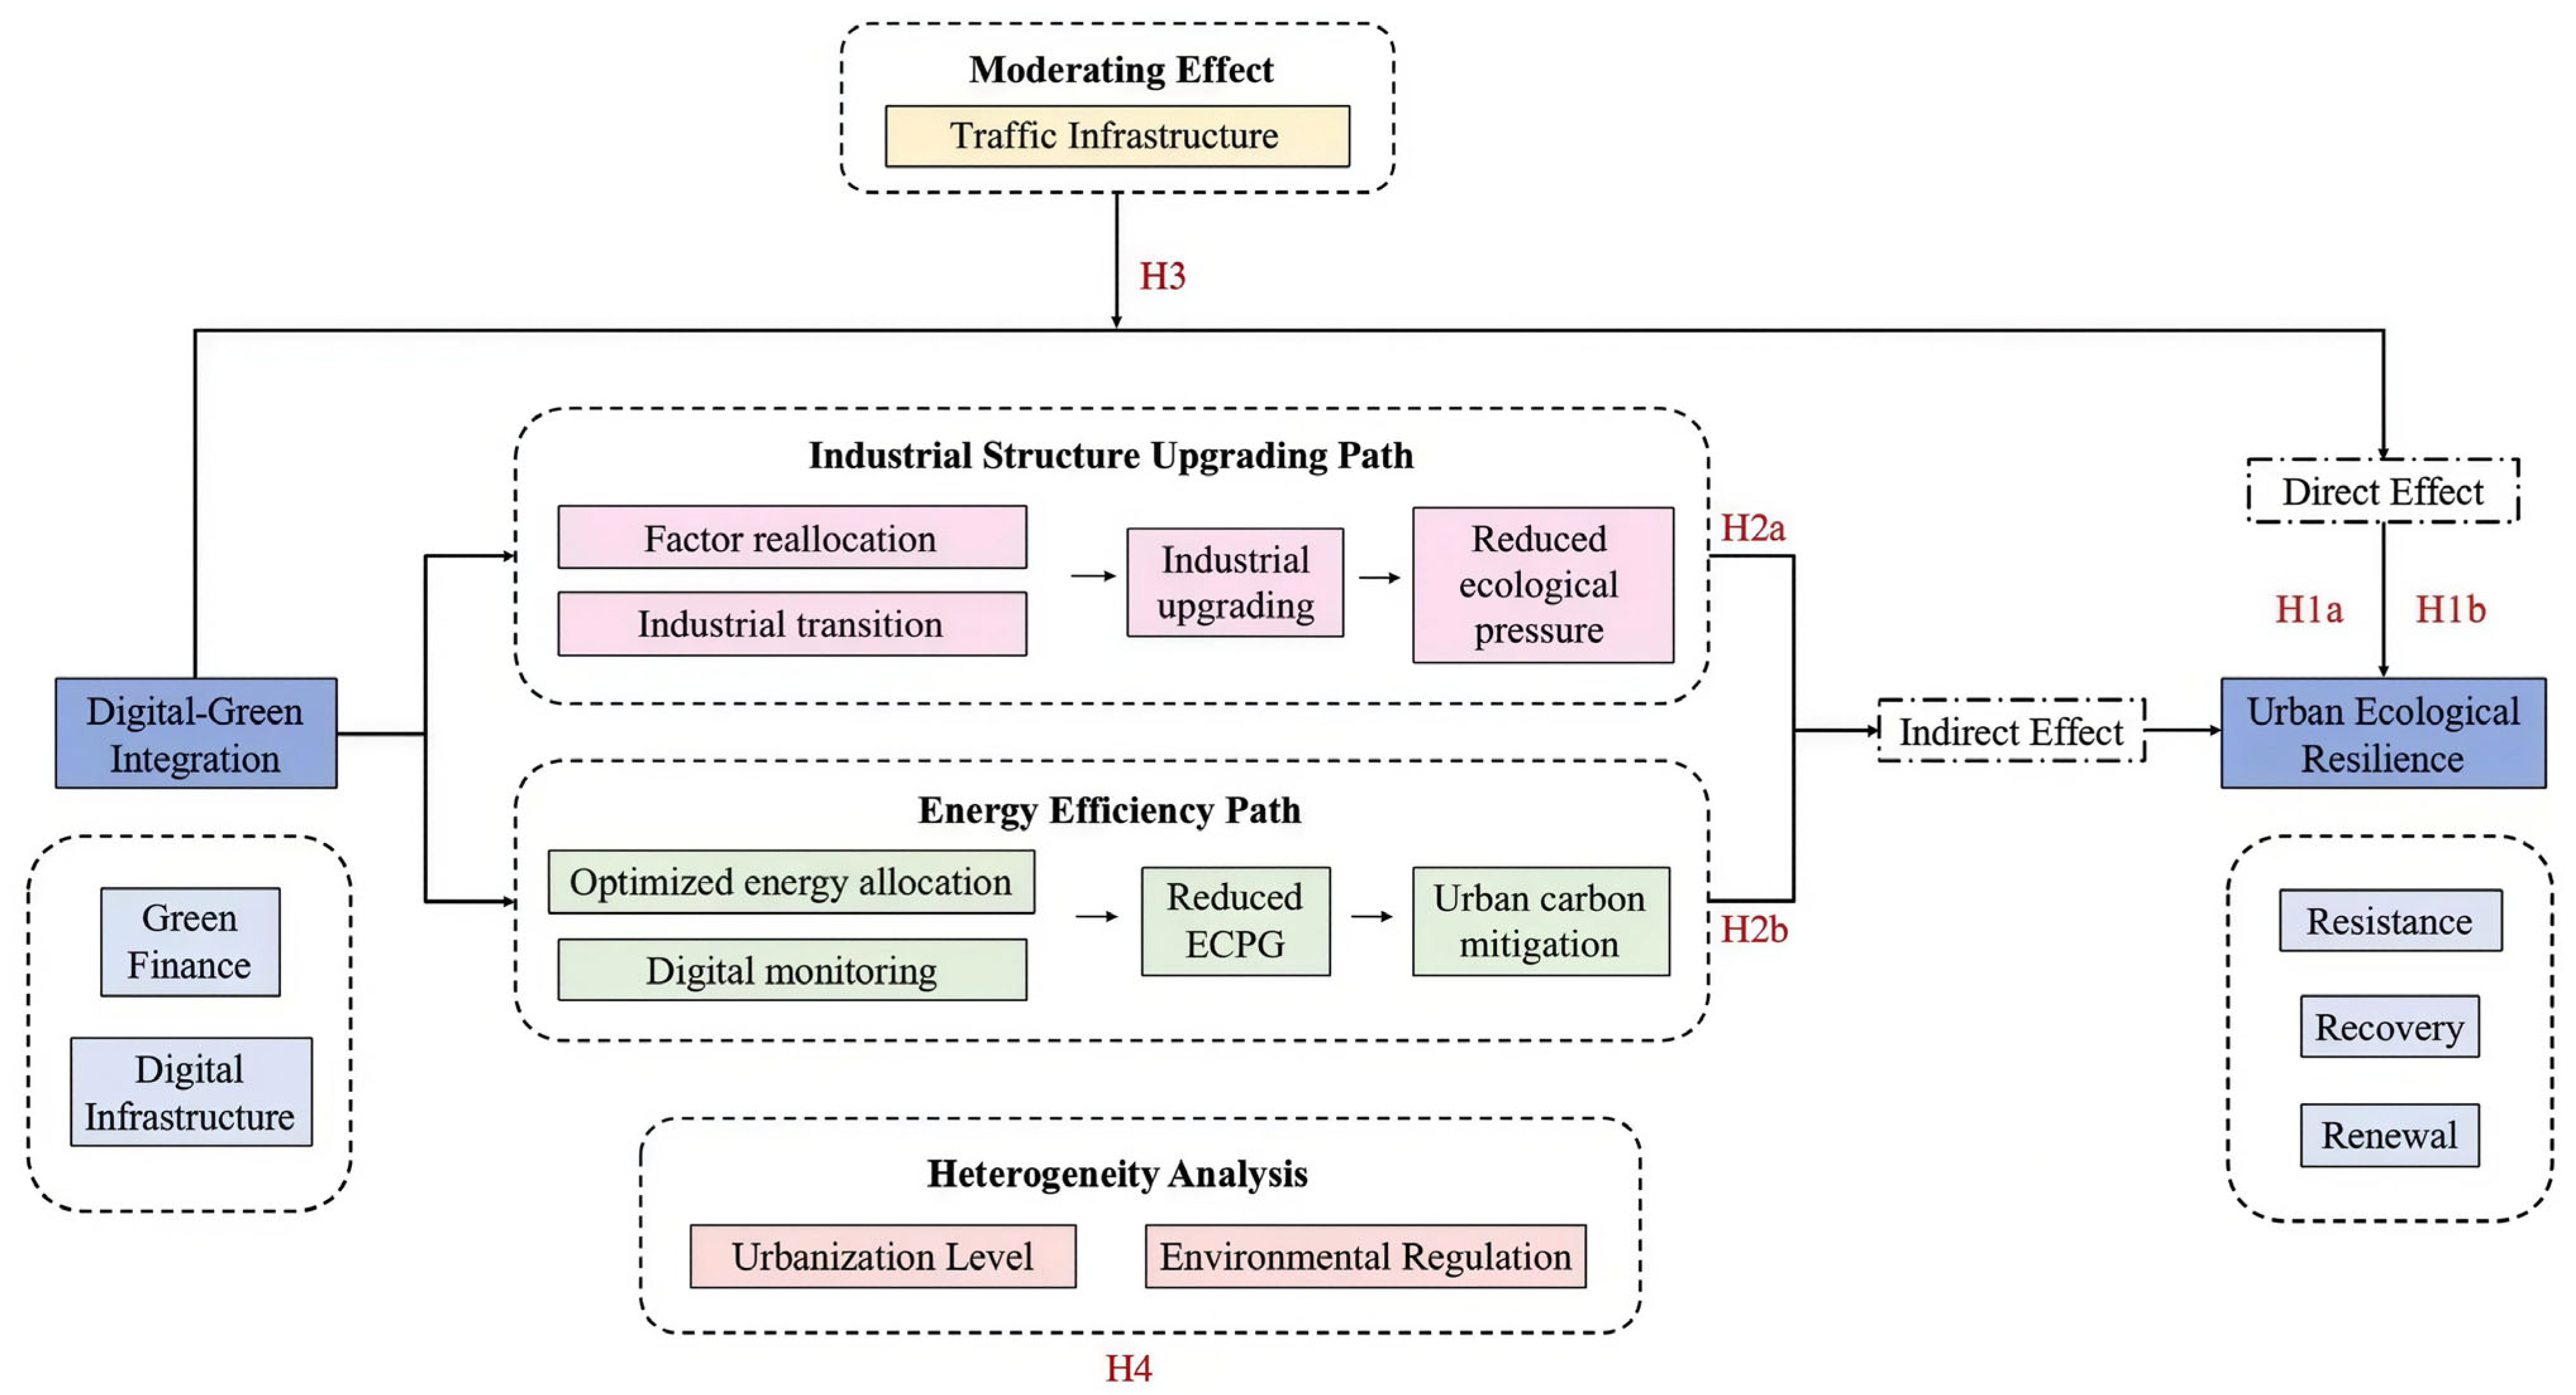
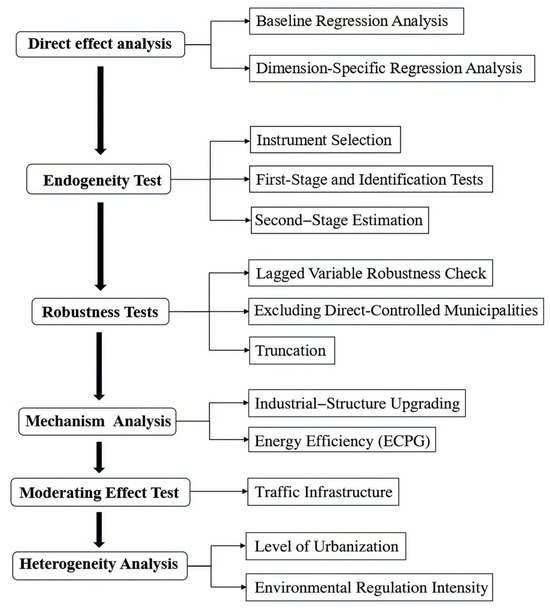
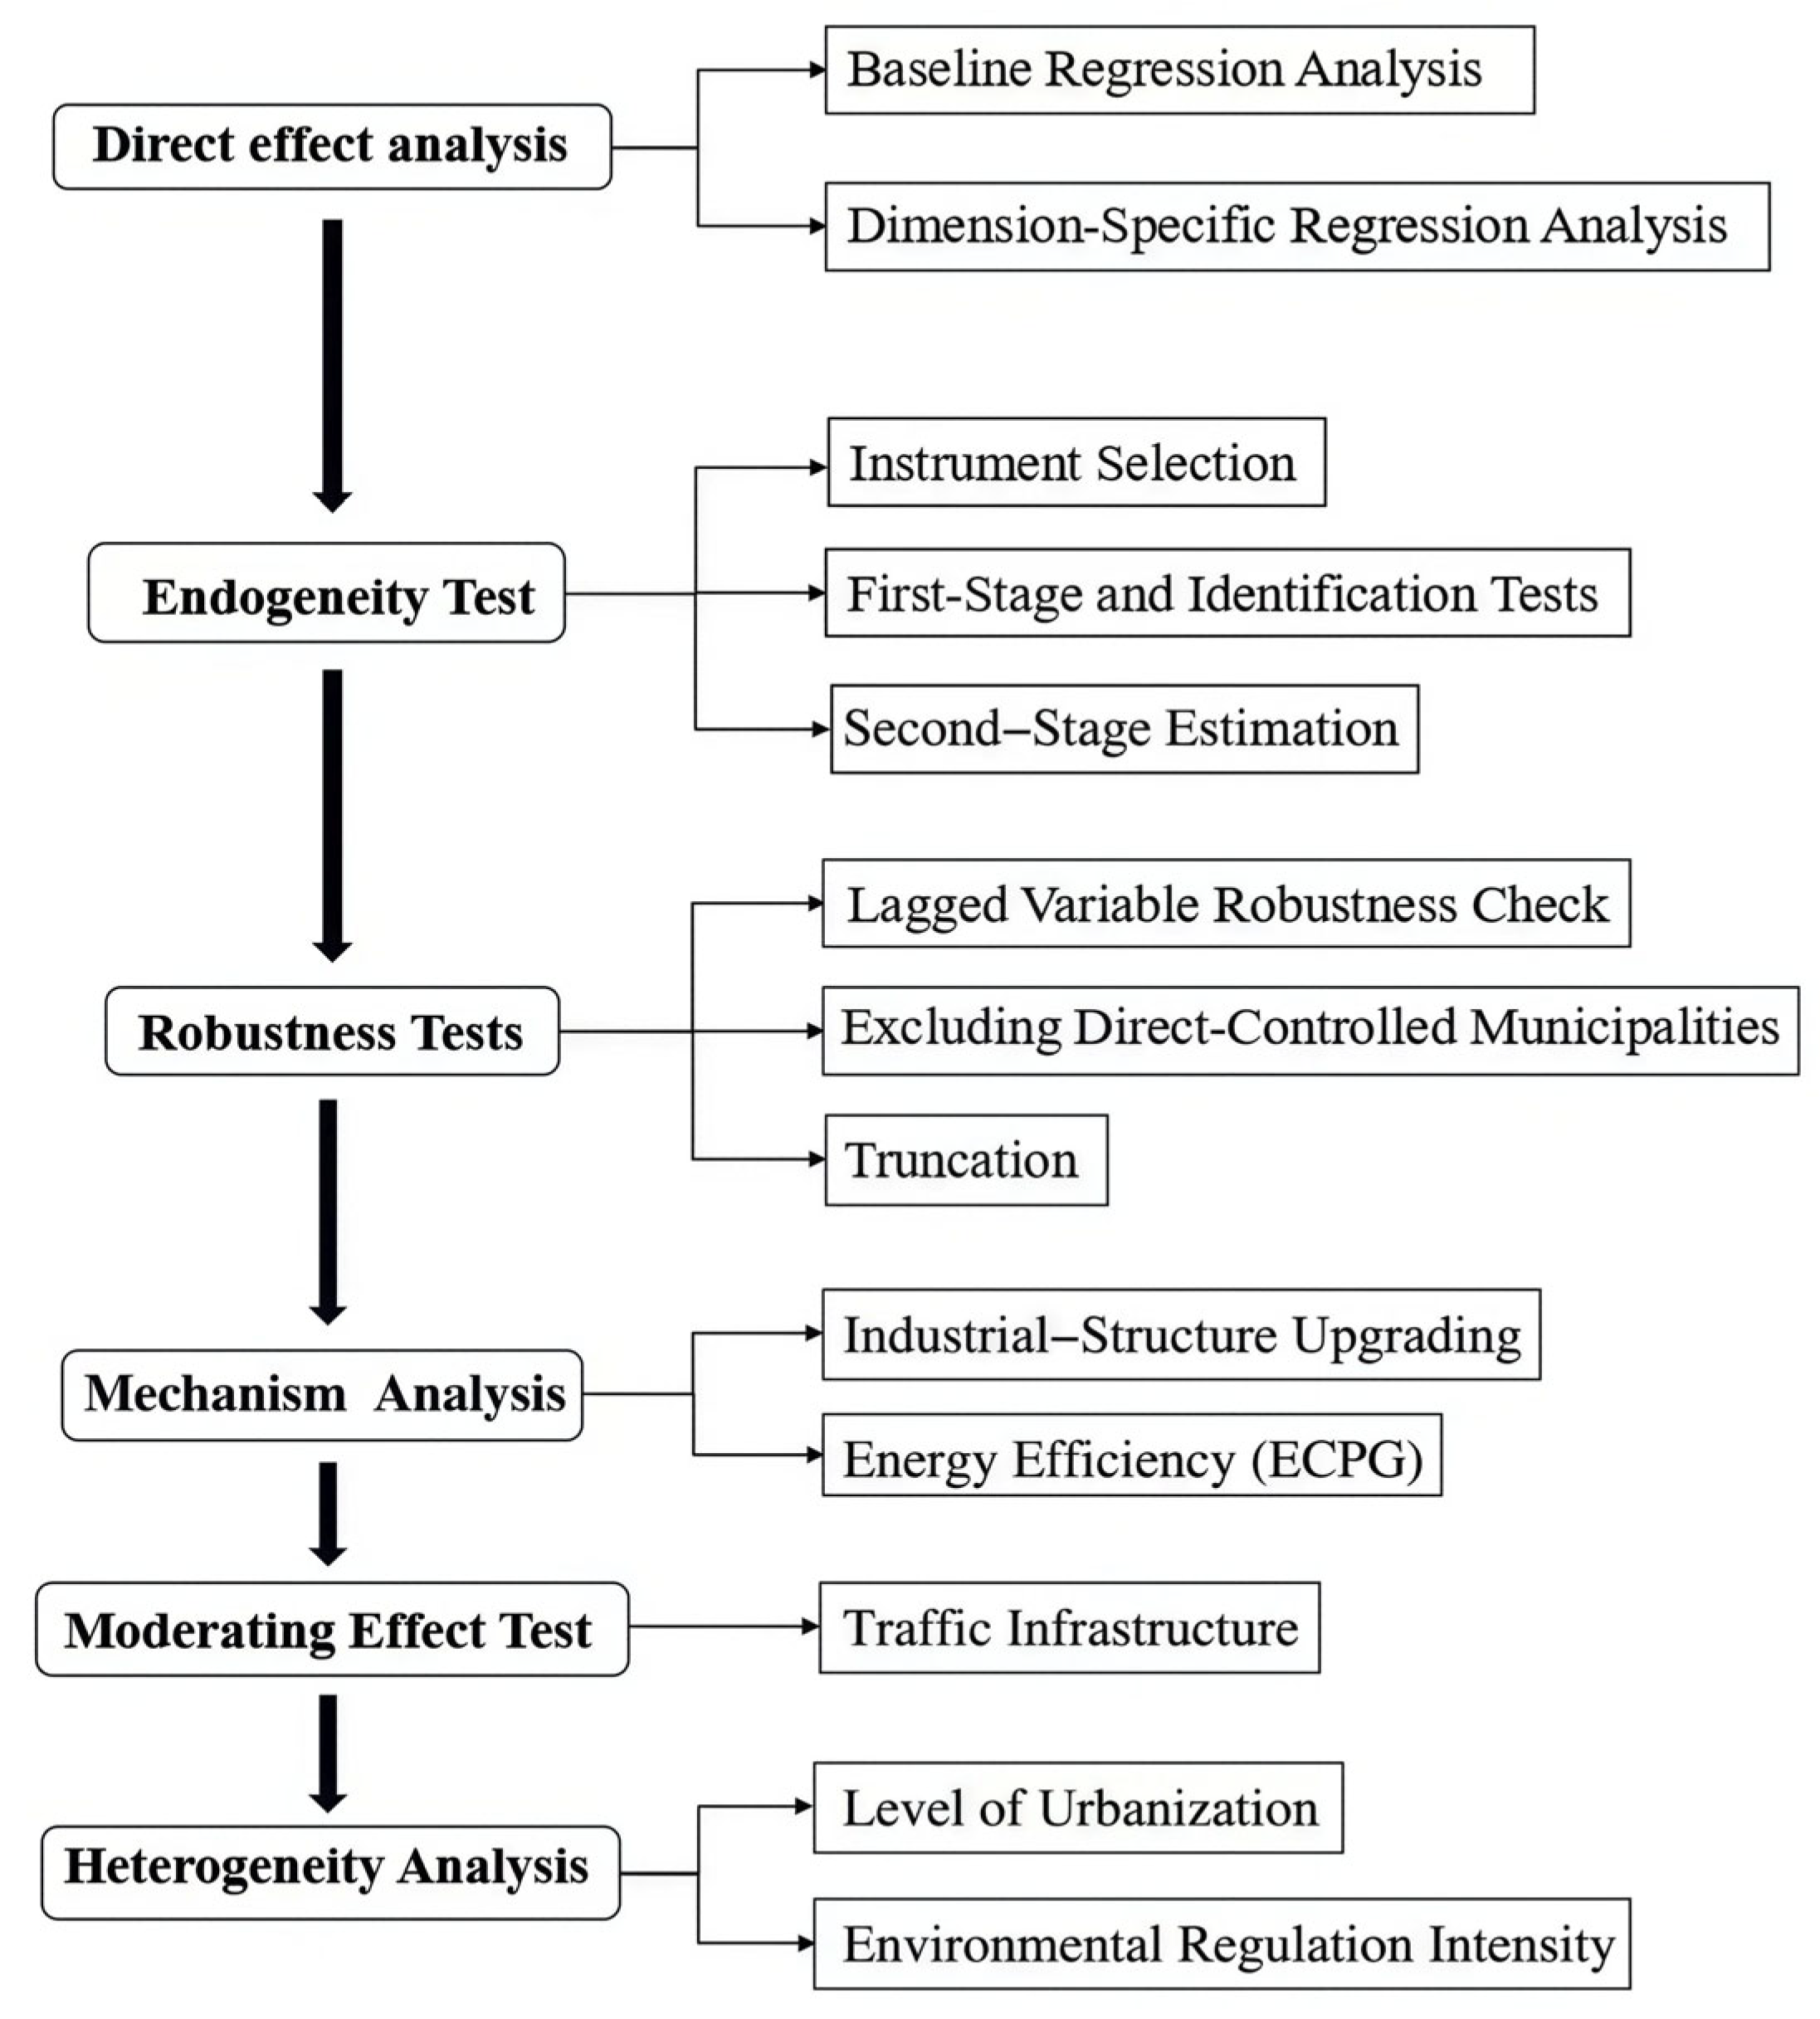

Disclaimer/Publisher’s Note: The statements, opinions and data contained in all publications are solely those of the individual author(s) and contributor(s) and not of MDPI and/or the editor(s). MDPI and/or the editor(s) disclaim responsibility for any injury to people or property resulting from any ideas, methods, instructions or products referred to in the content. |
© 2026 by the authors. Licensee MDPI, Basel, Switzerland. This article is an open access article distributed under the terms and conditions of the Creative Commons Attribution (CC BY) license.