


Abstract
Carbon emissions have gained media attention and public discussion. Motivated by recent trends and scholarly debate on climate change, this study explores whether firms in carbon-intensive industries exhibit inferior financial reporting quality relative to other sectors and examines how the relationship evolves. Our analysis which used data from US firms for the period between 2006 and 2024 indicates that companies in high-emissions industries engage in more earnings management activities compared to those in other sectors. Interestingly, the discretionary accruals disparity between carbon-intensive and other sectors has diminished over time, while the real earnings management gap persists but narrows. This research adds to the growing body of research examining the impact of climate-related uncertainties on corporate information disclosure.
1. Introduction
Corporate managers are increasingly integrating climate considerations into strategic decision-making and risk management, reflecting heightened climate awareness and growing public pressure. Environmental and climate change, particularly carbon emission, strategies are becoming more deeply embedded in business practice and academic research. Prior work has extensively examined the relation between environmental performance and earnings management (EM, hereafter) yet theoretical predictions remain mixed. Agency-based arguments suggest that managers may strategically employ environmental initiatives to obscure opportunistic behavior, resulting in lower financial reporting quality [1,2]. In contrast, stakeholder-oriented perspectives imply that managers who are intrinsically motivated to meet stakeholder interests may strengthen earnings quality as part of a broader commitment to sustainability [3,4]. Despite this growing literature, it remains unresolved whether firms operating in carbon-intensive industries exhibit higher or lower financial reporting quality than firms in other sectors.
Empirical evidence within carbon-intensive settings has also been concentrated in a narrow set of sectors and circumstances. Much of the existing EM evidence pertains to the oil and gas sector, where studies document income-decreasing reporting behavior around periods of heightened profitability and political visibility, such as oil price surges and major events [5,6,7]. While these findings are consistent with the political cost hypothesis derived from the positive accounting theory, they leave open whether similar incentives characterize these industries more broadly and if any carbon-related EM differential is stable or evolves as climate awareness, disclosure expectations, and oversight intensify.
In this paper, we argue, consistent with our evidence, that firms in carbon-intensive industries exhibit stronger incentives to manage earnings due to heightened information asymmetry and political costs. First, increased uncertainty in these sectors complicates external assessment of performance and strategy, which can widen information asymmetry and create scope for opportunistic reporting choices [8,9]. Second, political cost hypothesis predicts that firms facing greater scrutiny may adjust reported earnings to mitigate regulatory attention and reputational pressure [5]. However, legitimacy-based arguments also suggest that firms adapt reporting and disclosure to align with evolving societal expectations, especially when environmental pressure and stranded-asset concerns intensify [10,11]. Market forces and consumer demand increasingly push firms toward sustainability-oriented practices [12,13,14], and global regulatory developments further reinforce corporate climate commitments, potentially altering both the incentives and constraints surrounding EM over time.
Using data on U.S. firms from 2006 to 2024, we investigate whether firms in carbon-intensive industries manage earnings more than those in other sectors and if this differential attenuates. We employ five widely used financial reporting quality proxies (two accrual-based and three real EM measures) to address limitations inherent in any single metric. Across these measures, higher EM reflects lower financial reporting quality in terms of transparency and the timely recognition of earnings. To address potential selection bias and confounding baseline characteristics, we employ propensity score matching (PSM) and confirm strong covariate balance across groups (standardized mean differences < 0.05). Our results indicate that firms in these industries exhibit higher discretionary accruals (DAM) and higher real EM (REM) than those in the other sectors, with the economic magnitude substantially larger for real EM. Importantly, consistent with increased climate-related monitoring and scrutiny emphasized in our conclusion, the accrual-based differential diminishes and becomes much weaker in more recent years, whereas real EM remains but narrows.
This study makes three incremental contributions to related research. First, we contribute to the political cost literature by clarifying how climate-related uncertainty and carbon exposure relate to financial reporting quality in a broad cross-industry setting. While prior evidence often centers on oil and gas firms during discrete events [5,6,7], our results suggest that earnings manipulation is a more general feature of high-emissions industries. Beyond oil and gas, the documentation on carbon-intensive industries’ reporting quality remains comparatively limited, with evidence in mining [15] and chemical industries [16] representing important but narrow cases. Second, in addition to providing broader evidence and highlighting differences across EM channels, we provide findings that are consistent with the view that climate-related scrutiny and evolving monitoring can reduce accrual discretion, while operational channels may remain available or may reflect contemporaneous operating adjustments in industries facing transition risk.
Finally, our study also enriches research on climate risk and information disclosure. The importance of environmental and climate responsibility is increasingly recognized [17], alongside debate over the durability of climate compliance. Some scholars argue that compliance has become difficult for regulators or politicians to reverse [18]. Related works suggest that high-carbon firms can benefit from improved carbon disclosure through legitimacy gains and lower capital costs [19,20]. Consistent with this broader shift in the climate information environment, we find that the disparity in accrual-based EM between firms in carbon-intensive industries and those in other sectors has narrowed over time and largely disappeared in recent years. This pattern is consistent with the increasing salience of voluntary carbon-reduction commitments for building stakeholder trust, strengthening corporate reputation or addressing risks associated with regulatory uncertainty.
2. Literature Review and Hypotheses Development
2.1. Environemental Performance and Earnings Management
A substantial body of research examines the association between environmental performance or disclosure and EM, yet the predicted direction is ambiguous. Velayutham [2] and Kim et al. [1] frame this relationship through agency theory, arguing that managers may use environmental initiatives strategically to mask opportunistic behavior, thereby weakening financial reporting quality. In contrast, stakeholder theory suggests that managers may be intrinsically motivated to meet stakeholder interests, which can improve both environmental performance and earnings quality. Consistent with this view, Velte [21] contends that sustainable firms emphasize long-term relationships with shareholders and stakeholders, implying that managers engaged in substantive environmental initiatives are less inclined to manipulate earnings. Relatedly, Litt et al. [3], Luo & Wu [4] and Timbate & Park [22] report that firms prioritizing environmental sustainability or transparency tend to exhibit lower EM.
Despite these contributions, extant evidence has not been conclusively established if firms in carbon-intensive industries exhibited higher or lower financial reporting quality than others. The prior literature treats reporting quality in polluting firms as time-invariant, failing to evaluate how climate policy watersheds (such as the 2015 Paris Agreement) and concurrent institutional forces (ESG capital growth, SEC guidance, audit scrutiny) alter the cost–benefit trade-offs of earnings management over time.
2.2. Political Cost and the Carbon-Intensive Sector
The theoretical link between sector-level carbon intensity and earnings management is deeply rooted in the political cost hypothesis of Positive Accounting Theory [23]. Politically visible firms, particularly those operating in highly regulated, environmentally sensitive, or high-emissions industries, face elevated risks of adverse regulatory actions, environmental fines, statutory emission caps, or windfall profit taxes. To minimize public backlash and deflect regulatory scrutiny, managers in politically exposed firms possess strong incentives to exercise accounting discretion to manage reported earnings downward during high-visibility periods [5,6,7].
Empirical validation of political cost theory in carbon-intensive settings has primarily focused on specific industry subsets during crisis windows. For example, Hall [5] reports income-decreasing EM among ten oil firms over a decade, particularly during periods of rising oil prices. Han & Wang [6] similarly show that U.S. petroleum refining firms used income-decreasing accruals following oil price surges associated with the 1990 Gulf crisis, and Byard et al. [7] observe comparable behavior following the 2005 hurricanes. Beyond oil and gas, Cahan et al. [16] provide evidence of EM in chemical companies during legislative debates on environmental regulation, while Bird et al. [15] examine environmental reporting choices in mining companies. However, these prior studies remain event-specific and narrow in scope, leaving the question of whether political cost incentives induce persistent, generalized earnings management across carbon-intensive sectors relative to non-carbon sectors unanswered.
2.3. Hypotheses Development
We formulate our hypotheses based on the interaction between information asymmetry, political costs, and institutional climate oversight. Accordingly, we predict higher EM in these industries, and we expect the carbon-other differential in EM to compress over time. The first mechanism is information asymmetry stemming from heightened uncertainty in carbon-intensive industries [9,24]. Greater uncertainty makes it more difficult for outsiders to evaluate performance and strategy, increasing the scope for managerial opportunism in line with agency theory. Consistent with this logic, Richardson [8] shows that the propensity to manage earnings increases with information asymmetry. In parallel, signaling theory suggests that managers may use reporting choices to communicate stability and long-term viability to investors [23]. Because the carbon-intensive industry faces volatile demand, policy risk, and potential transition shocks, managers may rely more heavily on EM to convey resilience even when underlying risk remains elevated.
The second mechanism is political cost. Carbon-intensive industries have historically borne higher political costs [5] due to emissions and environmental risks, which are associated with greater scrutiny and disclosure demands [25,26]. Political cost hypothesis predicts that firms under greater regulatory attention may manage earnings to reduce perceived risk, reduce calls for intervention, or influence public opinion. Consistent with this view, Long et al. [27] argue that emission-regulated firms manipulate earnings to mitigate external financing costs when investors and creditors demand higher risk premia.
Finally, the legitimacy theory further implies that firms facing environmental pressure seek to align observed behavior and reporting with societal expectations. Hu et al. [10] support this perspective by showing that rising public environmental awareness can distort polluting firms’ financial reporting behavior. Together, these arguments imply stronger incentives for firms in these industries to manage earnings, including through real activity channels that may be less directly constrained by heightened monitoring of accrual discretion. Therefore, our first hypothesis states:
H1.
Firms operating in carbon-intensive industries are associated with higher EM (lower financial reporting quality) relative to firms in other sectors.
However, the reporting quality differential between carbon-intensive and other firms is unlikely to remain constant over time. With increased awareness of climate issues, carbon-intensive industries are increasingly scrutinized by the public and consequently face rising stakeholder expectations and pressure [12,14]. It has also been recorded that sustainable firms substantially outperform their counterparts in the long run [13]. Such forces increase the stakes of reputational damage from opaque reporting and increase the demand for credible financial disclosure and operational discipline. Meanwhile, better governance mechanisms and further integration of climate risk into capital markets can constrain managerial discretion and thus leave less room for EM. We therefore argue that as climate awareness increases and external pressure builds, the quality gap in reporting between carbon-intensive and other industries will narrow over time, particularly as market discipline and governance oversight become more effective.
H2.
The disparity in financial reporting quality between carbon-intensive and other sectors is likely to decrease over time.
3. Data and Research Design
3.1. Data and Sample
This study used a sample of US firms for the period ranging from 2006 to 2024 exactly nine years before and after the Paris Agreement (2015). Following Tran [28] and other prior studies, we delete financial institutions, utilities and observations with missing data for any of the variables. We winsorize each continuous variable at one percent and ninety-nine percent levels to eliminate the influence of outliers. Upon completion of the variable calculations, the resulting size of the full sample consists of 60,931 firm-year observations of which 19,862 (32.6%) represent firm years from carbon-intensive industries. We base our discussions and conclusions on the 39,724 (19,862 carbon and 19,862 control) firm years matched using the propensity score matching method (PSM). The PSM method allows us to compare the EM of firms that otherwise share similar characteristics. PSM is a popular and more robust technique for estimating average treatment effects [29,30] in a non-experimental research setting. Consistent with recommendations from prior studies [29], we use a one-to-one nearest-neighborhood matching technique without replacement. We use the following model to estimate propensity scores.
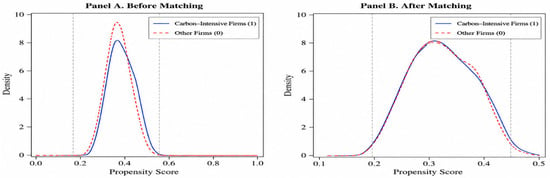
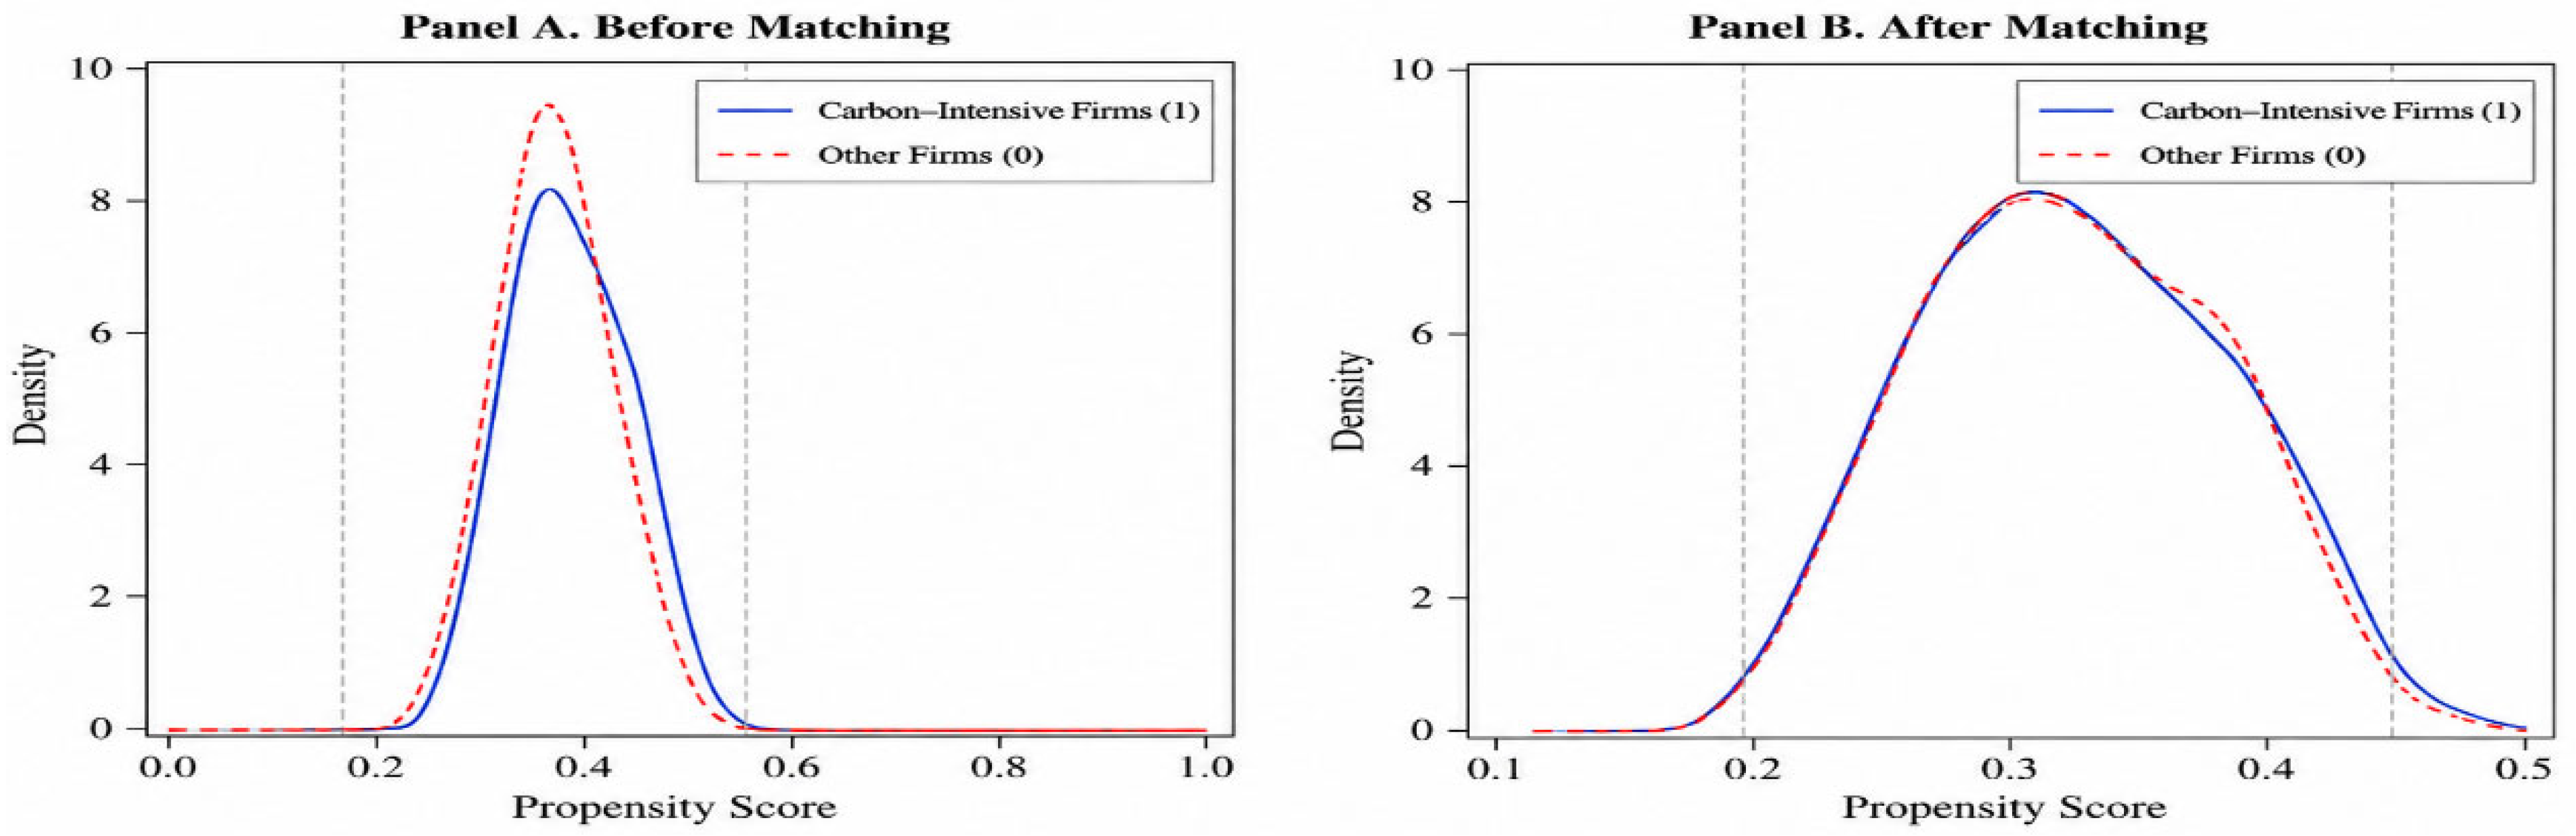
As presented in Table 1 and Figure 1, common support density distributions and standardized mean differences (0.0006) across all matched covariates confirm robust covariate balance and common support overlap between carbon-intensive and control cohorts.
Table 1.
Propensity Score Information. This table reports the propensity score distributions before and after matching. Prior to matching, the mean propensity score differs slightly between carbon-intensive and non-carbon-intensive firms (0.339 versus 0.330), with a mean difference of 0.0090. After one-to-one propensity score matching, the treated and control groups have virtually identical average propensity scores (0.339), and the mean difference declines to only 0.0006. The similarity in both the propensity score distributions and their ranges indicates that the matching procedure achieves excellent covariate balance and satisfies the common support assumption.
Figure 1.
Propensity score density plots. This figure displays kernel density estimates of the propensity scores for carbon-intensive firms (CARBON = 1) and other firms (CARBON = 0) before matching (Panel (A)) and after matching (Panel (B)). The vertical dashed lines indicate the region of common support.
3.2. Variables Measurement
3.2.1. Dependent Variable
We employ a total of five variations in EM metrics (two discretionary accrual and three real earning management metrics). The subscripts i, and t refer to a specific firm and year to which the observation belongs, respectively. All models (Equations (2)–(6)) were estimated by four-digit SIC industry and year with at least 5 firm-year observations per cell. The two accrual-based EM metrics are estimated using Dechow et al.’s [31] modified Jones model and Ball & Shivakumar’s [32] conditional conservatism model. We use the absolute values of the residuals from the following two models as DAM1it and DAM2it, respectively.
where TACit is total accrual which is calculated by subtracting the operating cash flows (OANCF) from the income before extraordinary items from the statement of cash flows (IBC) and then scaling it by the lagged total assets; 1/TAit−1 1 divided by lagged total assets; ΔSALESit/ΔRECit refer to change in sales/receivables which is the difference between current and lagged sales/receivables deflated to lagged total assets and PPEit represents the total net property, plant, and equipment (PPENT), scaled by the lagged total assets (AT). ΔSALES–ΔRECit represents the difference between change in sales and change in receivables. OCFit is operating cash flows deflated by lagged total assets, DOCFit is an indicator variable for negative OCF and OCF*DOCFit is an interaction term between OCFit and DOCFit.
Following Roychowdhury [33] and Cohen & Zarowin [34], we first estimate firms’ abnormal production costs (ABNPRODit), abnormal discretionary expenses (ABNDISXit) and abnormal cash flow from operations (ABNOCFit) as the values of the residuals from the following three equations, respectively:
PRODit is total production cost (cost of goods sold + change in inventories), while DISXit is total discretionary expenses (advertising expenses + research and development expenses + selling and general administrative expenses), both deflated by lagged total assets. Higher ABNPRODit, lower ABNDISXit and lower ABNOCFit values indicate higher EM. For consistent interpretation, we multiply ABNDISXit and ABNOCFit by −1 and then calculate the three real EM metrics we use in our model as follows:
3.2.2. Independent Variable
CARBONit: An indicator variable equal to 1 if a firm belongs to carbon-intensive industries (GICS codes 1010, 1510 and 2010), 0 otherwise. These industries are energy (oil, gas, coal and consumable fuels), materials (chemicals, construction materials, containing and packaging, metals and mining, paper and forest products), and capital goods (aerospace, defense, construction and machinery).
3.2.3. Moderating Variable
CARBONit ∗ TIME: An interaction term constructed as the product CARBONit and TIME. TIME is defined as the number of years elapsed since the beginning of the sample period (2006). CARBONit ∗ TIME captures how the EM difference between carbon-intensive and the other sectors evolves each year.
3.2.4. Control Variables
We control for the following variables following Chen et al. [35] and others. SIZEit−1 is the firm size at the beginning of the year defined as the natural logarithm of the lagged market value of equity (CSHO ∗ PRCC_F). ROAit is the return on assets measured as the ratio of earnings before interest and tax (EBIT) divided by total assets (AT). LEVERit−1 is leverage calculated by dividing the firm’s lagged total liabilities (LT) by lagged total assets (AT). MTBit−1 is lagged market-to-book ratio equal to lagged market value of equity (CSHO ∗ PRCC_F) divided by lagged total stockholders’ equity (SEQ). BIGNit is an indicator variable equal to 1 for firm years with a Big-N auditor (i.e., if the value for COMPUSTAT’S auditor variable is from 1 to 8). ZSCOREit−1 is the natural logarithm of the lagged Altman’s z-score equal to 0.3 ∗ NI/AT + 1.0 ∗ REVT/AT + 1.4 ∗ RE/AT + 1.2 ∗ (ACTLCT)/AT + 0.6 ∗ (CSHO ∗ PRCC_F)/LT. Finally, time effects are also included to control time-varying effects.
3.3. Empirical Model
We test the two hypotheses stated above using the following multivariate regression model. The subscripts i and t refer to a specific firm and year to which the observation belongs, respectively, while X stands for the set of control variables used in the model. If the first hypothesis holds, β1 in Equations (10)–(14) should be positive and significant.
To test the second hypothesis, we added TIME and the interaction term CARBONit ∗ TIME into the above specifications. Support for the second hypothesis implies a negative coefficient on β3 in Equations (15)–(19) below, consistent with a declining disparity in financial reporting quality between carbon-intensive and other sectors.
The empirical specifications above include a set of time-varying controls to mitigate confounding differences in firm characteristics and aggregate shocks. The key variable of interest captures membership in a carbon-intensive industry. This approach emphasizes cross-industry differences in exposure to emissions-related scrutiny and transition risk, while holding constant time-variant firm attributes. Additionally, the propensity score matching (PSM) we employ to construct a more comparable control group could reduce concerns about non-random selection and observable differences between carbon and non-carbon sectors. By balancing observed covariates, the matched-sample design helps reduce endogeneity concerns arising from systematic differences in firm characteristics. Moreover, we provide supplementary analyses using a difference-in-differences (DiD) approach. Nevertheless, endogeneity concerns remain.
4. Results and Discussion
4.1. Descriptive Statistics and Correlation
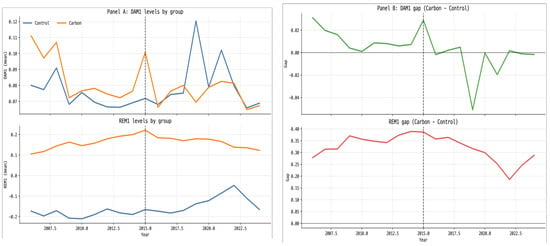
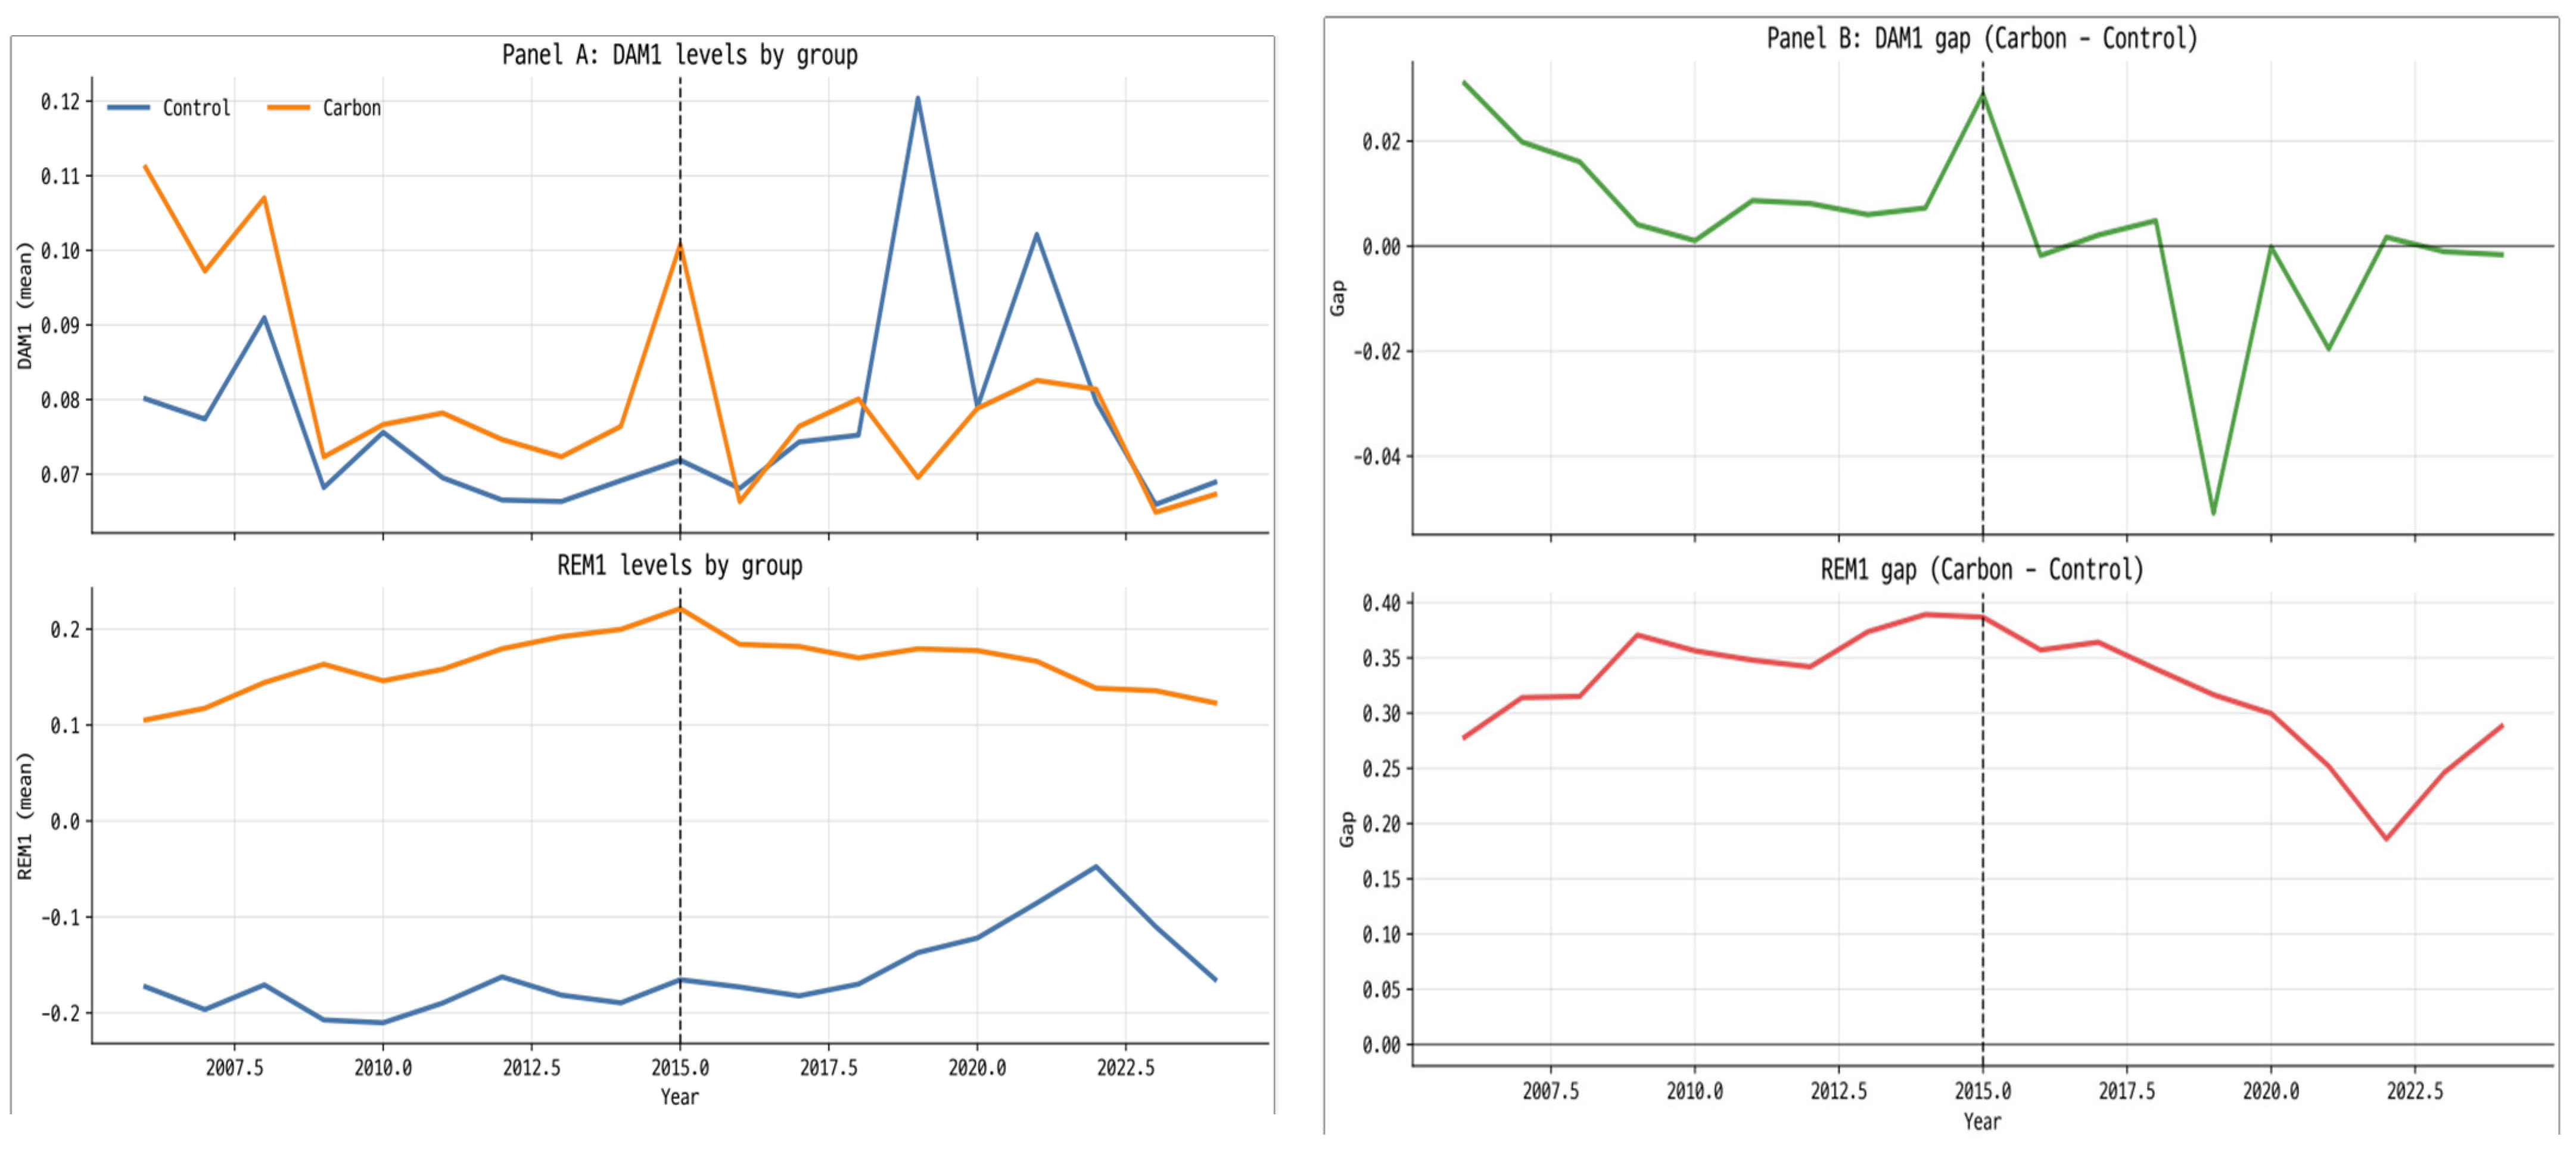
Table 2 reports the mean, median, standard deviation, and the first and third quartiles for all variables used in the multivariate analyses. Panel A presents descriptive statistics for the full PSM-matched sample, partitioned into carbon-intensive firm years and matched control firm years. Panel B reports the same statistics for firm years grouped into three periods: pre-2015, 2015 (the Paris Agreement year), and post-2015. Carbon-intensive industries exhibit higher overall EM than the controls (median values of 0.0430 to 0.212 versus −0.086 to 0.042). The difference is significantly large for real EM. Real EM is also higher in the post-Paris period (median values of 0.078 to 0.139) relative to earlier years (median values of 0.057 to 0.106). However, as shown in Figure 2 (Panel A), there is a recent modest decline in EM among carbon-intensive industries, and their EM level is comparatively more stable than that of the controls.
Table 2.
Descriptive Statistics. This table presents summary statistics (mean, median, standard deviation, 1st quartile and 3rd quartile values) for the variables used in the empirical analyses. While Panel A presents summary statistics for the whole sample and samples divided into carbon-intensive and control, Panel B shows comparative summary statistics for the sample period divided into pre-2015, 2015 and post-2015. All variables are defined under Section 3.1 and Appendix A.
Figure 2.
Trends in earnings management (EM) and the gap in EM between carbon-control groups. This figure presents the time-series patterns in two earnings management (EM) proxies for the carbon-intensive (CARBONit = 1) and the control (CARBONit = 0) group over 2006–2024, with a vertical reference line marking 2015 (the Paris Agreement). In Panel (A), the figure plots the annual mean levels of EM for the two groups, shown separately for DAM1it (top subplot) and REM1it (bottom subplot), allowing a direct comparison of EM levels between carbon-control over time. In Panel (B), the figure reports the carbon-control difference (gap) for each EM proxy computed each year as the difference between the two mean EMs with DAM1it gap (top) and REM1it gap (bottom).
Table 3 presents Pearson correlations for all the variables used in this study. p-values written in bold indicate the strength of the correlations. The two accrual-based EM metrics, DAM1it (0.011) and DAM2it (0.005), have only slight correlations with CARBONit, whereas REM1it (0.293), REM2it (0.326), and REM3it (0.329) are moderately and positively correlated with CARBONit (all p < 0.0001), suggesting that carbon intensity is more closely associated with real EM than with these accrual-based measures at a univariate level. CARBONit is essentially unrelated to SIZEit−1 (−0.003; not significant), but is positively correlated with ROAit (0.189; p < 0.0001) and negatively correlated with LEVEit−1 (−0.053; p < 0.0001), MTBit−1 (−0.127; p < 0.0001), BIGNit (−0.047; p < 0.0001), and Z-SCOREit−1 (−0.020; p = 0.0005), implying that carbon-intensive industries in this sample tend to be modestly more profitable but exhibit lower growth opportunities, slightly lower leverage, lower Big-N association, and marginally lower financial health in simple pairwise terms.
Table 3.
Correlation Matrix. This table displays Pearson correlation for the 39,724 matched firm-year observations spanning the period 2006–2024. p-values are written in bold. All variables are defined under Section 3.1 and Appendix A.
4.2. Multivariate Tests
Table 4 displays the results of multiple regression analyses conducted to test H1. In Panel A, results for the whole sample (N = 39,724) indicate CARBONit is significantly positively related to DAM1it (0.011, t = 5.83, p < 0.01) and DAM2it (0.009, t = 4.68, p < 0.01), while it is economically and statistically much larger for the REM measures. REM1it (0.315, t = 30.63), REM2it (0.191, t = 32.78), and REM3it (0.301, t = 27.66), all p < 0.01. In the pre-2015 subsample presented in Panel B (N = 20,478), the coefficient on CARBONit is significantly positive for both accrual proxies (DAM1it = 0.015, t = 5.73; DAM2it = 0.013, t = 5.05; both p < 0.01) and remains strongly positive for REM1it, REM2it and REM3it (0.332, 0.201, 0.327; all t-values ≥ 25.29; p < 0.01). In contrast, in the post-2015 subsample (N = 17,110), the coefficient on CARBONit becomes statistically insignificant for discretionary accruals (DAM1it = 0.004, t = 1.30; DAM2it = 0.001, t = 0.36), yet it continues to load positively and very significantly on real EM (REM1it = 0.288, t = 23.01; REM2it = 0.178, t = 23.98; REM3it = 0.265, t = 20.15; all p < 0.01). Overall, the estimated carbon-intensive indicator implies a 0.012 higher discretionary accrual measure (DA1it), which is approximately 26.7% of the sample median (0.045), and a 0.288 higher real EM measure (REM1it), which is about 3.35 times the sample median (0.086). However, accrual-based differences are concentrated in the earlier period and largely disappear after 2015.
Table 4.
H1 Regression Results. This table presents results for multiple regression where two discretionary accrual and three real earnings manipulations metrics are the dependent variables. The variable of interest is CARBONit (a dummy coded 1 if the firm-year observation is in carbon-intensive industries and 0 if not). Panels A, B, and C report results for the matched sample over the full 2006–2024 period, the pre-2015 subsample, and the post-2015 subsample, respectively. All specifications include year fixed effects, and standard errors are clustered at the firm level. All p-values are two-tailed. ***, ** and * indicate 1, 5 and 10 percent significance levels, respectively. All variables are defined under Section 3.1 and Appendix A.
Panel A of Table 5 shows that the association between carbon intensity and EM declines over time, as indicated by significantly negative coefficients on CARBONit ∗ TIME across both accrual-based and real EM measures. Economically, these estimates imply that the carbon premium in discretionary accruals and real EM declines at roughly 0.001 and 0.05 per year, respectively. These results are consistent with our second hypothesis, which predicts that the higher EM exhibited by these industries progressively compresses. Two points are worth emphasizing in Table 5 (Panel A). First, the coefficients on TIME are consistently positive, indicating that EM increases over time for the control group. However, the negative coefficients on CARBONit ∗ TIME imply that the relative earnings management differential for carbon-intensive industries declines. The carbon-control gap in EM narrows through time. Second, although the REM gap narrows, the carbon-related difference in REM remains economically meaningful in later years. Thus, while the DA gap diminishes, the REM gap persists at a declining rate. The pattern shown in Figure 2 (Panel B) corroborates this same trend.
Table 5.
H2 Regression Results. This table presents results for multiple regression where two discretionary accrual and three real earnings manipulations metrics are the dependent variables. The variables of interest are CARBONit ∗ TIME in Panel A and CARBONit ∗ POST in Panel B. Panel A reports the piecewise time-trend estimates over 2006–2024, capturing both the baseline evolution in EM and the gradual change in EM between carbon-intensive and other sectors, whereas Panel B presents the difference-in-differences results centered on the 2015 Paris Agreement (excluding data for 2015), isolating how the post-2015 period alters EM and the incremental change in EM between carbon-intensive and other sectors. In all specifications, standard errors are clustered at the firm level. All p-values are two-tailed. ***, ** indicate 1, 5 percent significance levels, respectively. All variables are defined under Section 3.1 and Appendix A.
4.3. Additional Tests
As an additional robustness test, we implement a difference-in-differences (DiD) design exploiting a major climate policy milestone (the Paris Agreement; 2015 announcement) and report the estimates in Table 5 Panel B. The Paris Agreement is widely regarded as a pivotal milestone in global climate governance and a landmark diplomatic breakthrough, largely because of its novel and flexible architecture that enabled broad participation [36]. The DiD specification will compare changes in EM outcomes for carbon versus other sectors nine years before and nine years after the event, while including year fixed effects and clustered standard errors at the firm level. We are not presuming equivalent EM levels for the two groups prior to 2015. We are solely examining whether the recent nine years following the Paris Agreement exhibit a different pattern in EM compared to the preceding nine years among the two groups. According to Panel B, REM increases in the post-2015 period for the control group (i.e., the POST coefficient is positive in the REM metrics). At the same time, the interaction term CARBONit ∗ POST is negative and statistically significant for both DAM and REM, indicating that the carbon-other differential in each EM channel narrows after the Paris Agreement. In other words, heightened post-2015 scrutiny appears to compress the carbon premium in both accrual-based and real activity manipulation, even though the overall post-2015 trend in REM is upward.
We conduct additional robustness tests (not tabulated) to corroborate our inferences and to address potential structural breaks and macroeconomic shocks that could affect the estimates. Specifically, we modify the baseline specification by including two country-level macroeconomic controls (GDP per capita and inflation) to absorb time-varying macro conditions that may influence operating environments and incentives for EM. In addition, because 2008/2009 (the global financial crisis) and 2020 (the COVID-19 shock) represent unusually large and pervasive disruptions during our sample period, we exclude these years from our sample to mitigate concerns that the results are driven by crisis-specific dynamics. Across these specifications, our results remain unchanged and are consistent with the main findings.
4.4. Discussion
The overall findings presented in this study provide strong empirical support for the political cost hypothesis. By analyzing the EM behaviors of carbon-intensive industries relative to the matched sample over an eighteen-year period, several key findings emerge regarding the financial reporting-related responses to escalating environmental scrutiny.
The initial multivariate tests (Table 4) reveal that carbon-intensive industries engage in significantly higher levels of both accrual-based and real EM compared to their peers. This ‘carbon premium’ in EM suggests that industries facing higher exposure to environmental regulations and public pressure utilize financial reporting discretion to mitigate political costs consistent with the political cost hypothesis [23]. Notably, the magnitude of manipulation is substantially larger for REM than for discretionary accruals. Relative to sample baseline means, operating in a carbon-intensive sector is associated with a 12.4% increase in DAM magnitude, but a 28.6% increase in REM. This pronounced managerial preference for real activity distortion, such as overproducing. This preference for real activity manipulation (such as cutting R&D or overproducing to lower unit costs) likely reflects the higher level of ‘audit-proofing’ offered by REM. While accruals are subject to reversal and auditor scrutiny, real activity manipulations are harder for outsiders to detect [34], making them a safer vehicle to manipulate earnings.
Another important contribution of this study is the documentation of a significant shift in reporting behavior through time. While the control group shows an overall upward trend in EM, reflecting an increase in EM, carbon-intensive industries show a relative decline in their manipulation levels as shown in Table 5. Additional tests also indicate that firms in carbon-intensive industries utilized both accrual and real EM channels to manage earnings prior to the Paris Agreement. However, in the post-2015 era, the carbon-control accrual-based gap virtually disappears, while the REM gap, though narrowing, remains robust and statistically significant. This bifurcation can be explained by the heightened transparency and institutional pressure created due to the increased public awareness about climate change following the Paris Agreement. Furthermore, as climate-related disclosure requirements became more regulated and standardized recently [37], heightened scrutiny likely constrained the use of discretionary accounting accruals among carbon-intensive industries. Consequently, these industries appear to have abandoned incremental accrual-based manipulation while the more opaque REM channel remains significant.
A key methodological issue in capital markets research is whether abnormal production costs and discretionary expense reductions in carbon-intensive firms indicate opportunistic earnings manipulation or necessary adjustments to energy transition shocks. These industries contend with challenges like supply chain changes and carbon price exposure. To clarify operational manipulation versus legitimate friction, the study included sector-specific commodity price indices and macroeconomic demand controls in its analyses. Despite addressing these factors, elevated abnormal activity metrics persisted in carbon-intensive firms compared to controls.
These findings extend Positive Accounting Theory by introducing a dual-channel cost–benefit substitution boundary. Under weak oversight and lower public awareness, managers in visible sectors exploit both accrual and real operational channels due to low manipulation costs. However, stringent oversight and increased environmental awareness increases penalties for accrual discretion, leading managers to significantly forgo accruals. Economically, the decline in DAM post-2015 restores accounting parity between carbon and non-carbon sectors; yet a persistent REM gap of 0.038 standard deviations represents a significant annual operational distortion for the average carbon-intensive firm. This indicates that while financial accounting has improved recently in carbon-intensive sectors, managerial discretion in operational practices still persists.
5. Conclusions
This study examines whether firms in carbon-intensive industries engage in different EM practices than others and whether these differences have changed over time in an environment of rising climate-related scrutiny. Using a sample of U.S. firms from 2006 to 2024, we document that firms in these industries exhibit higher EM than other, with the differential substantially stronger for real EM than for discretionary accruals. Time-trend evidence indicates that, although EM in the control group increases, the relative carbon premium in EM declines year by year: the accrual gap largely fades, while the real EM gap persists but narrows. These patterns are corroborated by specifications that account for macroeconomic conditions, exclude major shock years, and implement a difference-in-difference design around the 2015 Paris Agreement, collectively pointing to a post-2015 environment in which carbon-intensive industries exhibit a reduced incremental tendency toward earnings manipulation, particularly through accrual discretion.
These findings contribute to research on political costs and climate-related uncertainty by showing that climate-related monitoring pressures are associated with a meaningful reallocation in the intensity of EM in carbon-exposed sectors. By documenting distinct dynamics for accrual-based versus real activity manipulation and by moving beyond settings focused primarily on oil and gas, our evidence is consistent with the view that heightened scrutiny can constrain accounting discretion.
The results also have implications for financial statement users. For investors and analysts, elevated EM proxies in carbon-intensive industries underscore the importance of complementing accounting-based signals with information about exposure to climate policy, transition risk, and related changes in product market conditions. For auditors and regulators, the evidence highlights the value of industry-tailored risk assessment and that intensified monitoring of accruals should be supported by an emphasis on real activity channels.
This study’s inferences should be interpreted in light of several limitations. Carbon intensity is proxied using industry classification and therefore does not capture within-industry heterogeneity in firm-level emissions or abatement opportunities. Future work could integrate firm-level emissions data to evaluate whether the documented patterns vary with direct measures of emissions intensity. In addition, while our designs incorporate fixed effects, matching, and robustness analyses, residual endogeneity may remain due to omitted time-varying shocks and non-random selection into carbon-intensive industries. Research exploiting plausibly exogenous variation in climate policy or enforcement intensity would further strengthen causal interpretation.
Author Contributions
Conceptualization, L.T.; Methodology, L.T.; Formal analysis, L.T.; Resources, D.-I.K.; Writing–original draft, L.T.; Writing–review & editing, D.-I.K.; Supervision, D.-I.K. All authors have read and agreed to the published version of the manuscript.
Funding
This research was supported by the Bisa Research Grant of Keimyung University in 2024 (20240551).
Institutional Review Board Statement
Not applicable.
Informed Consent Statement
Not applicable.
Data Availability Statement
The data presented in this study are openly available in WRDS, https://wrds-www.wharton.upenn.edu/pages/about/data-vendors/ (accessed on 10 June 2025).
Conflicts of Interest
The authors declare no conflict of interest.
Appendix A. Definition of Variables
| No. | Name | Description | Definition |
| 1. | DAM1it | Discretionary Accruals Management 2 | Firm’s discretionary accrual estimated using the modified Jones model (Dechow et al., 1995 [31]). Dechow et al. (1995) [31] updated the Jones (1991) [38] model for credit sales growth to decrease Type II errors. Credit sales are often manipulated; therefore, this change strengthens the Jones model to provide a residual uncorrelated with predicted (i.e., normal) revenue accruals and better reflecting revenue manipulation. |
| 2. | DAM2it | Discretionary Accruals Management 3 | Firm’s discretionary accrual estimated using the Ball and Shivakumar (2006) [32] model. Measures timeliness in financial statement recognition of economic losses. According to Ball & Shivakumar (2006) [32], timely loss recognition improves financial statement usefulness by reducing managers’ risk of negative-NPV investments and operating with negative cash flows, and by providing accurate loan pricing information and triggering covenant violations. |
| 3. | REM1it | Real Earnings Management 1 | The sum of abnormal production costs and abnormal discretionary expenses. It measures the extent of artificially inflated reported earnings by reducing the costs of sales with an increase in production so as to spread the fixed costs of production over a larger number of units and by reducing the amount of discretionary research and development, advertising, and selling, general and administrative expenses. |
| 4. | REM2it | Real Earnings Management 2 | The sum of abnormal discretionary expenses and abnormal cash flows. It measures the extent of artificially inflated reported earnings by reducing the amount of discretionary research and development, advertising, and selling, general and administrative expenses and using techniques such as aggressive price cuts and/or easier credit terms that lead to abnormally low cash flow from operations. |
| 5. | REM3it | Real Earnings Management 3 | The aggregate of sum of abnormal production costs, abnormal discretionary expenses and abnormal cash flows. It is the aggregate real EM of a firm for a given year. |
| 6. | CARBONit | Carbon-Intensive Industries | An indicator variable equal to 1 if a firm belongs to the carbon-intensive industries (GICS codes 1010, 1510 and 2010), 0 otherwise. |
| 7. | TIME | Time from the 2006 | TIME is defined as the number of years elapsed since the beginning of the sample period (2006). |
| 8. | CARBONit ∗ TIME | Interaction term between CARBONit and TIME | An interaction term constructed as the product CARBONit and TIME. CARBONit ∗ TIME captures how the EM difference between carbon-intensive and other sectors evolves each year. |
| 9. | POST | The post-2015 period | An indicator variable equal to 1 for the post-2015 period (2016 to 2024), 0 otherwise. |
| 10. | CARBONit ∗ POST | Interaction term between CARBONit and POST | An interaction term constructed as the product CARBONit and POST. CARBONit ∗ POST captures how the EM difference between carbon-intensive and other sectors changes after 2015 (the Paris agreement). |
| 11. | SIZEit−1 | Firm Size | The natural logarithm of the firm’s market value. |
| 12. | ROAit | Return on Assets | Firm profitability measured using the ratio of earnings before interest and tax (EBIT) divided by total assets (AT). |
| 13. | LEVit−1 | Financial Leverage | Leverage calculated by dividing the firm’s lagged total liabilities (LT) by lagged total assets (AT). Higher values show lower solvency. |
| 14. | MTBit−1 | Firm Growth | Lagged market to book ratio equal to lagged market value of equity (CSHO ∗ PRCC_F) divided by lagged total stockholders’ equity (SEQ). Higher values show a higher growth rate. |
| 15. | BIGNit | Audit Quality | An indicator variable equal to 1 for firm years with a Big-N auditor. Big-N auditors are regarded as providing superior audit services. |
| 16. | Z-SCOREit−1 | Distance From Bankruptcy | Altman’s z-score estimating how far a firm is from experiencing bankruptcy risk. Higher values show lower bankruptcy risk. |
References
- Kim, Y.; Park, M.S.; Wier, B. Is earnings quality associated with corporate social responsibility? Account. Rev. 2012, 87, 761–796. [Google Scholar] [CrossRef] [Scilit]
- Velayutham, E. Sustainability disclosure and earnings management. In Research Handbook of Finance and Sustainability; Boubaker, S., Cumming, D., Nguyen, D.K., Eds.; Edward Elgar Publishing: Cheltenham, UK, 2018; pp. 532–549. [Google Scholar] [CrossRef] [Scilit]
- Litt, B.; Sharma, D.; Sharma, V. Environmental initiatives and earnings management. Manag. Audit. J. 2014, 29, 76–106. [Google Scholar] [CrossRef] [Scilit]
- Luo, L.; Wu, H. Voluntary carbon transparency: A substitute for or complement to financial transparency? J. Int. Account. Res. 2019, 18, 65–88. [Google Scholar] [CrossRef] [Scilit]
- Hall, S.C. Political scrutiny and earnings management in the oil refining industry. J. Account. Public Policy 1993, 12, 325–351. [Google Scholar] [CrossRef] [Scilit]
- Han, J.C.; Wang, S.W. Political costs and earnings management of oil companies during the 1990 Persian Gulf crisis. Account. Rev. 1998, 73, 103–117. [Google Scholar] [CrossRef] [Scilit]
- Byard, D.; Hossain, M.; Mitra, S. US oil companies’ earnings management in response to Hurricanes Katrina and Rita. J. Account. Public Policy 2007, 26, 733–748. [Google Scholar] [CrossRef] [Scilit]
- Richardson, V.J. Information asymmetry and earnings management: Some evidence. Rev. Quant. Financ. Account. 2000, 15, 325–347. [Google Scholar] [CrossRef] [Scilit]
- Ferguson, A.; Grosse, M.; Kean, S.; Scott, T. Your governance or mine? Aust. Account. Rev. 2011, 21, 406–417. [Google Scholar] [CrossRef] [Scilit]
- Hu, N.; Mao, Y.; Tan, L. An unintended consequence of raising public environmental awareness: Evidence from the release of the environmental documentary “under the Dome” on earnings management. J. Account. Public Policy 2024, 48, 107260. [Google Scholar] [CrossRef] [Scilit]
- Ilhan, E.; Sautner, Z.; Vilkov, G. Carbon tail risk. Rev. Financ. Stud. 2021, 34, 1540–1571. [Google Scholar] [CrossRef] [Scilit]
- Clark, C.E.; Crawford, E.P. Influencing climate change policy: The effect of shareholder pressure and firm environmental performance. Bus. Soc. 2012, 51, 148–175. [Google Scholar] [CrossRef] [Scilit]
- Eccles, R.G.; Ioannou, I.; Serafeim, G. The impact of corporate sustainability on organizational processes and performance. Manag. Sci. 2014, 60, 2835–2857. [Google Scholar] [CrossRef] [Scilit]
- González, J.P. Acting green? Private environmental coalitions in the United States. Bus. Soc. 2025, 65, 43–47. [Google Scholar] [CrossRef] [Scilit]
- Bird, R.; Grosse, M.; Yeung, D. The market response to exploration, resource and reserve announcements by mining companies: Australian data. Aust. J. Manag. 2013, 38, 311–331. [Google Scholar] [CrossRef] [Scilit]
- Cahan, S.F.; Chavis, B.M.; Elmendorf, R.G. Earnings management of chemical firms in response to political costs from environmental legislation. J. Account. Audit. Financ. 1997, 12, 37–65. [Google Scholar] [CrossRef] [Scilit]
- Garel, A.; Petit-Romec, A. Investor rewards to environmental responsibility: Evidence from the COVID-19 crisis. J. Corp. Financ. 2021, 68, 101948. [Google Scholar] [CrossRef] [Scilit]
- Gill, T.M. The state of US empire in the Americas under the Trump administration. In The Future of US Empire in the Americas: The Trump Administration and Beyond; Routledge: New York, NY, USA, 2020; pp. 1–16. [Google Scholar]
- He, Y.; Tang, Q.; Wang, K. Carbon disclosure, carbon performance and cost of capital. China J. Account. Stud. 2013, 1, 190–220. [Google Scholar] [CrossRef] [Scilit]
- Lemma, T.T.; Freedman, M.; Mlilo, M.; Park, J.D. Corporate carbon risk, voluntary disclosure and cost of capital: South African evidence. Bus. Strategy Environ. 2019, 28, 111–126. [Google Scholar] [CrossRef] [Scilit]
- Velte, P. The bidirectional relationship between ESG performance and earnings management—Empirical evidence from Germany. J. Glob. Responsib. 2019, 10, 322–338. [Google Scholar] [CrossRef] [Scilit]
- Timbate, L.; Park, C.K. CSR performance, financial reporting, and investors’ perception of financial reporting. Sustainability 2018, 10, 522. [Google Scholar] [CrossRef] [Scilit]
- Watts, R.L.; Zimmerman, J.L. Towards a positive theory of the determination of accounting standards. Account. Rev. 1978, 53, 112–134. [Google Scholar] [CrossRef] [Scilit]
- Dai, L.; Ngo, P. Political uncertainty and accounting conservatism. Eur. Account. Rev. 2021, 30, 277–307. [Google Scholar] [CrossRef] [Scilit]
- Connelly, B.L.; Certo, S.T.; Ireland, R.D.; Reutzel, C.R. Signaling theory: A review and assessment. J. Manag. 2011, 37, 39–67. [Google Scholar] [CrossRef] [Scilit]
- Mani, A.; Budd, T.; Maine, E. Emissions-intensive and trade-exposed industries: Technological innovation and climate policy solutions to achieve net-zero emissions by 2050. RSC Sustain. 2023, 2, 903–927. [Google Scholar] [CrossRef] [Scilit]
- Long, W.; Qu, X.; Yin, S. How does carbon emissions trading policy affect accrued earnings management in corporations? Evidence from China. Financ. Res. Lett. 2023, 55, 103840. [Google Scholar] [CrossRef] [Scilit]
- Tran, V. Climate policy uncertainty and earnings management. Financ. Res. Lett. 2024, 71, 106393. [Google Scholar] [CrossRef] [Scilit]
- Shipman, J.E.; Swanquist, Q.T.; Whited, R.L. Propensity score matching in accounting research. Account. Rev. 2017, 92, 213–244. [Google Scholar] [CrossRef] [Scilit]
- DeFond, M.; Erkens, D.H.; Zhang, J. Do client characteristics really drive the Big N audit quality effect? New evidence from propensity score matching. Manag. Sci. 2017, 63, 3628–3649. [Google Scholar] [CrossRef] [Scilit]
- Dechow, P.M.; Sloan, R.G.; Sweeney, A.P. Detecting earnings management. Account. Rev. 1995, 70, 193–225. [Google Scholar] [CrossRef] [Scilit]
- Ball, R.; Shivakumar, L. The role of accruals in asymmetrically timely gain and loss recognition. J. Account. Res. 2006, 44, 207–242. [Google Scholar] [CrossRef] [Scilit]
- Roychowdhury, S. Earnings management through real activities manipulation. J. Account. Econ. 2006, 42, 335–370. [Google Scholar] [CrossRef] [Scilit]
- Cohen, D.A.; Zarowin, P. Accrual-based and real earnings management activities around seasoned equity offerings. J. Account. Econ. 2010, 50, 2–19. [Google Scholar] [CrossRef] [Scilit]
- Chen, W.; Hribar, P.; Melessa, S. Incorrect inferences when using residuals as dependent variables. J. Account. Res. 2018, 56, 751–796. [Google Scholar] [CrossRef] [Scilit]
- Lemma, T.T.; Tavakolifar, M.; Mihret, D.; Timbate, L. When climate commitment fades: Exit from the Paris Agreement and financial reporting quality. J. Account. Lit. 2026, 1–24. [Google Scholar] [CrossRef] [Scilit]
- Tomar, S. Greenhouse gas disclosure and emissions benchmarking. J. Account. Res. 2023, 61, 451–492. [Google Scholar] [CrossRef] [Scilit]
- Jones, J. Earnings management during import relief investigations. J. Account. Res. 1991, 29, 193–228. [Google Scholar] [CrossRef] [Scilit]

Disclaimer/Publisher’s Note: The statements, opinions and data contained in all publications are solely those of the individual author(s) and contributor(s) and not of MDPI and/or the editor(s). MDPI and/or the editor(s) disclaim responsibility for any injury to people or property resulting from any ideas, methods, instructions or products referred to in the content. |
© 2026 by the authors. Licensee MDPI, Basel, Switzerland. This article is an open access article distributed under the terms and conditions of the Creative Commons Attribution (CC BY) license.