1. Introduction
Degraded industrial sites in arid and semi-arid regions are widely distributed in areas associated with mining, coal-fired power generation, metallurgy, and resource-based industries. Such sites are commonly characterized by loose surface substrates, unstable pore structures, weak water-retention capacity, high wind-erosion risk, and difficulty in natural vegetation recovery. In ash storage yards of coal-fired power plants, fly ash or the covering soil layer is often exposed to dry, windy, and strongly evaporative conditions for long periods. This can lead to dust disturbance and water loss, thereby limiting seed germination, seedling establishment, and early vegetation growth [
1]. Conventional ecological management measures mainly rely on soil covering, irrigation, and artificial planting. Although these measures can improve surface conditions to some extent, they often require continuous maintenance and are difficult to integrate with the combined needs of degraded land reuse, ecological restoration, and renewable energy development [
2]. Therefore, coordinating PV deployment with ecological restoration may provide a pathway for the sustainable and multifunctional reuse of ash-storage-yard land by combining renewable-energy production with the improvement of near-surface habitat conditions [
3].
PV systems were traditionally designed primarily for solar-radiation capture and electricity generation, but their application has expanded to agrivoltaic, desert, building-integrated, floating, and other land-integrated systems [
4]. In addition to producing electricity, PV panels modify surface radiation, near-surface airflow, soil temperature, and soil moisture through shading and aerodynamic obstruction [
5,
6]. These effects are particularly relevant in arid and semi-arid regions, where water limitation, strong evaporation, and wind exposure make soil hydrothermal conditions sensitive to changes in shading and airflow [
7].
Existing studies on PV–land interactions have mainly focused on farmland agrivoltaic systems and desert PV systems, whereas industrial solid-waste sites have received comparatively less attention. Farmland agrivoltaic research generally emphasizes canopy radiation distribution, crop photosynthesis, yield, water-use efficiency, and the coordination of agricultural production with electricity generation [
8]. Desert PV research more commonly focuses on wind-speed reduction, sand fixation, surface-temperature regulation, soil-moisture conservation, and vegetation recovery beneath large-scale PV arrays [
9]. In contrast, industrial solid-waste sites, such as ash storage yards, are additionally constrained by loose and heterogeneous substrates, limited water-retention capacity, high wind-erosion sensitivity, and potentially unfavorable physicochemical properties [
10,
11]. Therefore, models developed for conventional farmland or natural desert environments may not be directly applicable to the assessment of PV-induced ecological regulation in ash storage yards without site-specific adjustment.
Existing models do not fully meet the requirements for evaluating PV-based ecological utilization in ash storage yards. Conventional PV-performance models emphasize irradiance, module temperature, and electricity output but do not describe soil hydrothermal or vegetation responses [
12]. Agrivoltaic shading–crop models focus mainly on light distribution, photosynthesis, and agricultural yield and, therefore, do not represent the unstable and water-limited substrates of industrial solid-waste sites [
13]. Process-based crop models, such as DSSAT, require detailed soil, crop, management, and long-term meteorological inputs and are generally intended for crop-yield prediction rather than relative comparison of PV-induced microenvironmental regulation [
14].
Existing microenvironmental assessments also commonly treat soil temperature, soil moisture, and wind speed as separate indicators, making it difficult to express their combined hydrothermal suitability for early vegetation establishment. This study, therefore, used a Gaussian suitability function and AHP-CRITIC coupled weighting to integrate soil temperature and moisture into a model-based hydrothermal suitability framework, while retaining wind speed and substrate properties as mechanistic and site-specific explanatory factors [
15,
16].
This study investigated an ash storage yard in Ordos, Inner Mongolia, using 36°, 43°, and 50° as representative lower-, latitude-reference-, and higher-tilt engineering scenarios. Numerical simulation, hydrothermal suitability evaluation, field monitoring, and a first-order PV performance assessment were combined to compare microenvironmental regulation, early plant-establishment suitability, and ecological–energy trade-offs. The three configurations were treated as discrete scenarios rather than as a continuous optimization sequence. From a sustainability perspective, this integrated approach treats the ash storage yard not only as a degraded disposal site, but also as a multifunctional land resource that may jointly support renewable-energy generation and early ecological rehabilitation. The central engineering question is, therefore, not simply which tilt angle maximizes an individual response, but which configuration provides a defensible balance between energy production and habitat improvement under site-specific constraints.
The main objectives of this study were (1) to establish a multi-physics coupling model describing PV-induced near-surface airflow, water-vapor transport, and soil hydrothermal migration, and to compare the spatial distributions of soil temperature and moisture under different tilt angles; (2) to convert changes in soil temperature and moisture into model-based hydrothermal suitability indicators for early plant establishment using a Gaussian suitability function and an AHP-CRITIC coupled weighting method; (3) to validate the short-term soil hydrothermal simulation trends using field monitoring data and to compare the observed early plant-height responses among the monitoring zones; (4) to conduct a first-order assessment of annual plane-of-array irradiation and photovoltaic energy yield and to discuss the ecological–energy trade-off among the three tilt-angle scenarios; and (5) to discuss the applicability and limitations of the proposed framework in other arid and semi-arid degraded industrial sites.
2. Materials and Methods
2.1. Multi-Physics Model of the PV-Induced Near-Surface Microenvironment
A multi-physics coupling model was established to describe near-surface microenvironmental changes under the influence of PV panels. The model mainly included three physical processes: near-surface airflow, water-vapor transport, and heat and moisture migration in soil porous media. The purpose of the model was not to accurately simulate heat transfer within the multi-layer structure of PV modules or variations in power generation. Instead, it was used to compare the relative regulation differences of PV panels on soil temperature, soil moisture, and the spatial distribution of the heat–moisture affected zone under three fixed tilt angles of 36°, 43°, and 50°.
In the model, the PV panel was treated as an external boundary structure affecting surface radiation input, shading distribution, and near-surface air-exchange pathways. The air region was defined as a moist-air flow region to describGramanarly e airflow and water-vapor transport around the PV panel. The soil region was defined as a porous medium with hygroscopic characteristics to describe liquid-water migration, water-vapor diffusion, and heat conduction. This treatment retained the main physical mechanisms of PV shading, near-surface air exchange, and soil hydrothermal coupling, and was suitable for comparing microenvironmental regulation differences under different PV tilt angles [
17].
The multi-physics simulations were implemented using COMSOL Multiphysics 6.3 (COMSOL AB, Stockholm, Sweden). A two-dimensional computational domain was established at a 1:1 scale relative to the experimental cross-section, with a width of 1.0 m, a total height of 0.8 m, and a porous soil layer thickness of 0.3 m. The model coupled near-surface airflow, heat and water-vapor transport in moist air, and heat–moisture migration in the porous soil domain. The PV panel was represented as an external geometric obstruction and thermal-boundary structure.
The airflow field was governed by the continuity and momentum equations for incompressible flow. The continuity equation was expressed as follows:
where
is the air-velocity vector. Heat transport in the moist-air and soil domains was described in the general form:
where
,
,
,
, and
denote density, specific heat capacity, temperature, effective thermal conductivity, and the volumetric heat-source term, respectively. Water-vapor transport in the moist-air domain was expressed as
where
,
, and
are the water-vapor concentration, effective diffusivity, and source term, respectively. In the soil domain, conductive heat flux followed Fourier’s law,
, while liquid-water migration was described using a Darcy-type relationship,
. Water-vapor diffusion and capillary effects were also incorporated through the porous-medium coupling. These equations were implemented through the corresponding built-in physics interfaces in COMSOL Multiphysics.
To ensure comparability among different tilt-angle scenarios, all parameters other than the PV tilt angle were kept consistent in the model, including basic soil properties, initial soil temperature, initial soil moisture content, boundary conditions, and heat-input assumptions. The PV panel was simplified as a geometric obstruction and thermal-boundary structure rather than a complete PV power-generation component. Therefore, the simulation results should be interpreted as a relative comparison of soil hydrothermal responses under different tilt angles, rather than as an accurate prediction of PV-module temperature or power-generation efficiency. The photovoltaic energy performance of the three tilt-angle configurations was assessed separately using PVsyst, as described in
Section 2.7.
Soil hydrothermal migration was described based on heat transfer, moisture migration, and water-vapor diffusion relationships in porous media [
18]. Because the relevant governing equations have been widely applied in studies on soil hydrothermal coupling and porous-media heat and mass transfer [
19], this study did not provide a lengthy derivation of these equations. Instead, it focused on explaining the physical assumptions, boundary settings, computational outputs, and field validation of the model. The model outputs included soil temperature, soil moisture, and near-surface wind speed under different tilt angles. Soil temperature and moisture were used as inputs to the subsequent hydrothermal suitability evaluation, whereas near-surface wind speed was used to interpret airflow regulation, potential soil-moisture loss, and wind-erosion disturbance, rather than being directly included in the CGI.
Unlike models that focus only on PV power-generation efficiency or a single environmental factor, the model in this study emphasized the combined influence of PV tilt angle on root-zone soil temperature and moisture after changes in shading distribution and air exchange. This setting provided a simulation basis for evaluating the hydrothermal suitability of early plant establishment under different PV tilt angles in degraded industrial sites.
2.2. Basis for Selecting Representative PV Tilt Angles
The tilt angle of a fixed PV system is usually related to local latitude, solar altitude angle, seasonal radiation variation, and engineering deployment objectives [
20]. In PV engineering, where maximizing power generation is the main objective, tilt-angle design is generally centered on solar radiation reception. However, in scenarios involving the coordination of PV deployment and ecological utilization, the tilt angle also affects the shading continuity beneath PV panels, near-surface wind speed, soil evaporation, and root-zone hydrothermal stability. Therefore, the tilt-angle selection in this study considered not only the local latitude conditions, but also the potential influence of tilt angle on the near-surface microenvironment and plant growth suitability in the ash storage yard.
The study area is located in Ordos, Inner Mongolia Autonomous Region, China, which is a typical arid and semi-arid transition region. The region has abundant solar energy resources, strong evaporation, and significant effects of near-surface wind speed variations on surface soil moisture and seedling growth. According to the local latitude of approximately 43°, this study set 43° as the local latitude reference tilt angle. On this basis, 36° and 50° were selected as representative scenarios to compare the effects of lower and higher tilt angles on the shading range and soil hydrothermal distribution. Thus, three fixed tilt-angle scenarios of 36°, 43°, and 50° were formed.
Among them, 36° represents a lower tilt angle below the local latitude reference value, which may expand the horizontal shading range and enhance the temperature–moisture buffering effect in the rear area of the panel. The 43° case represents the reference tilt angle close to the local latitude. The 50° case represents a higher tilt angle above the local latitude reference value, whose shading and hydrothermal regulation effects may be more concentrated. By comparing these three tilt-angle scenarios, the influence direction of PV tilt angle on soil temperature, soil moisture, and plant growth suitability can be analyzed.
The three tilt angles were selected as representative engineering scenarios rather than as a continuous optimization sequence. Accordingly, the analysis provides a relative comparison among lower-, latitude-reference-, and higher-tilt configurations under the site and growing-season conditions and does not define an optimal tilt angle or optimal tilt-angle interval.
2.3. Model-Based Hydrothermal Suitability Evaluation for Early Plant Establishment
To convert the simulated soil temperature and soil moisture conditions under different PV tilt angles into comparable indicators of hydrothermal suitability for early plant establishment, this study developed an evaluation method based on single-factor suitability and integrated weighting. Alfalfa and
Elymus nutans were selected as the target species. Because the two species differ in their suitable and tolerance ranges for soil temperature and moisture [
21,
22], the simulated soil temperature and moisture values were first converted into single-factor suitability values. Monthly hydrothermal suitability values and the growing-season comprehensive growth index (CGI) were then obtained through weighted integration.
The CGI developed in this study is a model-based hydrothermal suitability indicator rather than a direct measure of plant yield, biomass, or long-term community recovery. It quantifies the relative closeness of the simulated soil temperature and moisture conditions to the species-specific suitable ranges. Because the CGI was not statistically calibrated against plant height, aboveground biomass, root morphology, vegetation coverage, or community diversity, it was used only for relative comparison among the three selected tilt-angle scenarios and should not be interpreted as a predictor of long-term ecological restoration outcomes.
The Gaussian suitability function was used to describe the nonlinear relationship between each hydrothermal factor and species-specific suitability. Unlike a simple threshold-based judgment, the Gaussian function can reflect the continuous decrease in plant growth suitability when an environmental factor deviates from the optimum value toward the tolerance boundary. When soil temperature or soil moisture is close to the optimum range for plant growth, the suitability value approaches 1. When the environmental factor gradually deviates from the optimum value and approaches the tolerance boundary, the suitability value gradually decreases. This method can more reasonably represent the effect of continuous soil hydrothermal fluctuations on plant suitability during the growing season. The conversion of multiple environmental conditions into continuous suitability values is consistent with previous multi-criteria crop-suitability assessment approaches [
23].
For plant species
and environmental factor
, the suitability value
S was calculated as follows:
where
is the measured value of the environmental factor
;
is the optimal growth value of plant species
for factor
;
is the scale parameter;
is the upper tolerance limit of plant species
for factor
and
is the lower tolerance limit of plant species
for factor
.
For weighting, an AHP-CRITIC coupled weighting method was adopted. The AHP component mainly reflects plant growth requirements, expert experience, and the relative importance of different factors in terms of physiological and ecological significance. The CRITIC method determines objective weights according to the variability of monitoring or simulation data and the contrast among indicators. Coupling the two methods can reduce the bias caused by single subjective weighting or single objective weighting, so that the final weight reflects both plant growth mechanisms and the information contained in the data itself.
The subjective weights were obtained by the authors using an improved three-scale AHP pairwise-comparison procedure. The comparison was informed by the species-specific optimum and tolerance ranges summarized in
Table 1, the published physiological evidence for the two target species, and the water-limited early-establishment conditions of the ash yard site. No independent external expert questionnaire was used.
The objective weights were calculated using the CRITIC method from the standardized soil-temperature and soil-moisture indicator dataset used in the CGI assessment. Indicator contrast was characterized by the standard deviation, whereas inter-indicator conflict was characterized by the correlation coefficient between the soil temperature and the soil moisture. The subjective and objective weights were subsequently coupled in MATLAB R2024a (MathWorks, Natick, MA, USA) using Equation (6), and the resulting weights are reported in
Table 2.
where
is the comprehensive weight of the
-th indicator;
is the subjective weight of the
-th indicator; and
is the objective weight of the
-th indicator.
After obtaining the single-factor suitability values and comprehensive weights, this study first integrated the suitability values of soil temperature and soil moisture by weighted summation to obtain the monthly plant growth evaluation value. Then, considering that different months from June to August play different roles in the plant growing season, monthly weights were introduced to further integrate the monthly hydrothermal suitability value and obtain the comprehensive growth index for the whole growing season.
where
is the comprehensive growth index of plant species
under tilt angle
;
is the monthly weight; and
is the monthly evaluation value of plant species
under tilt angle
in month
.
Only soil temperature and soil moisture were included as direct input variables in the CGI. Near-surface wind speed was analyzed separately to interpret airflow regulation, potential soil-moisture loss, wind-erosion disturbance, and mechanical stress on seedlings, but it was not included in the CGI calculation. Future extensions of the evaluation framework may incorporate wind speed, solar radiation, soil salinity, and substrate chemical properties after obtaining appropriate field data and calibration relationships.
2.4. Field Experimental Design and Monitoring Methods
2.4.1. Study Area and Monitoring Zones
The field experiment was conducted in an ash storage yard of a coal-fired power plant in Ordos, Inner Mongolia Autonomous Region, China. The study area is located in a typical arid and semi-arid transition zone. During the growing season, evaporation is strong, the near-surface wind speed varies markedly, and the surface substrate of the ash storage yard has limited water-retention capacity. Early vegetation establishment is, therefore, easily constrained by the combined effects of water deficit, temperature fluctuation, and wind-erosion disturbance [
24,
25]. Thus, this site is suitable as a case area for evaluating the regulatory effect of PV deployment on the near-surface microenvironment of degraded industrial sites.
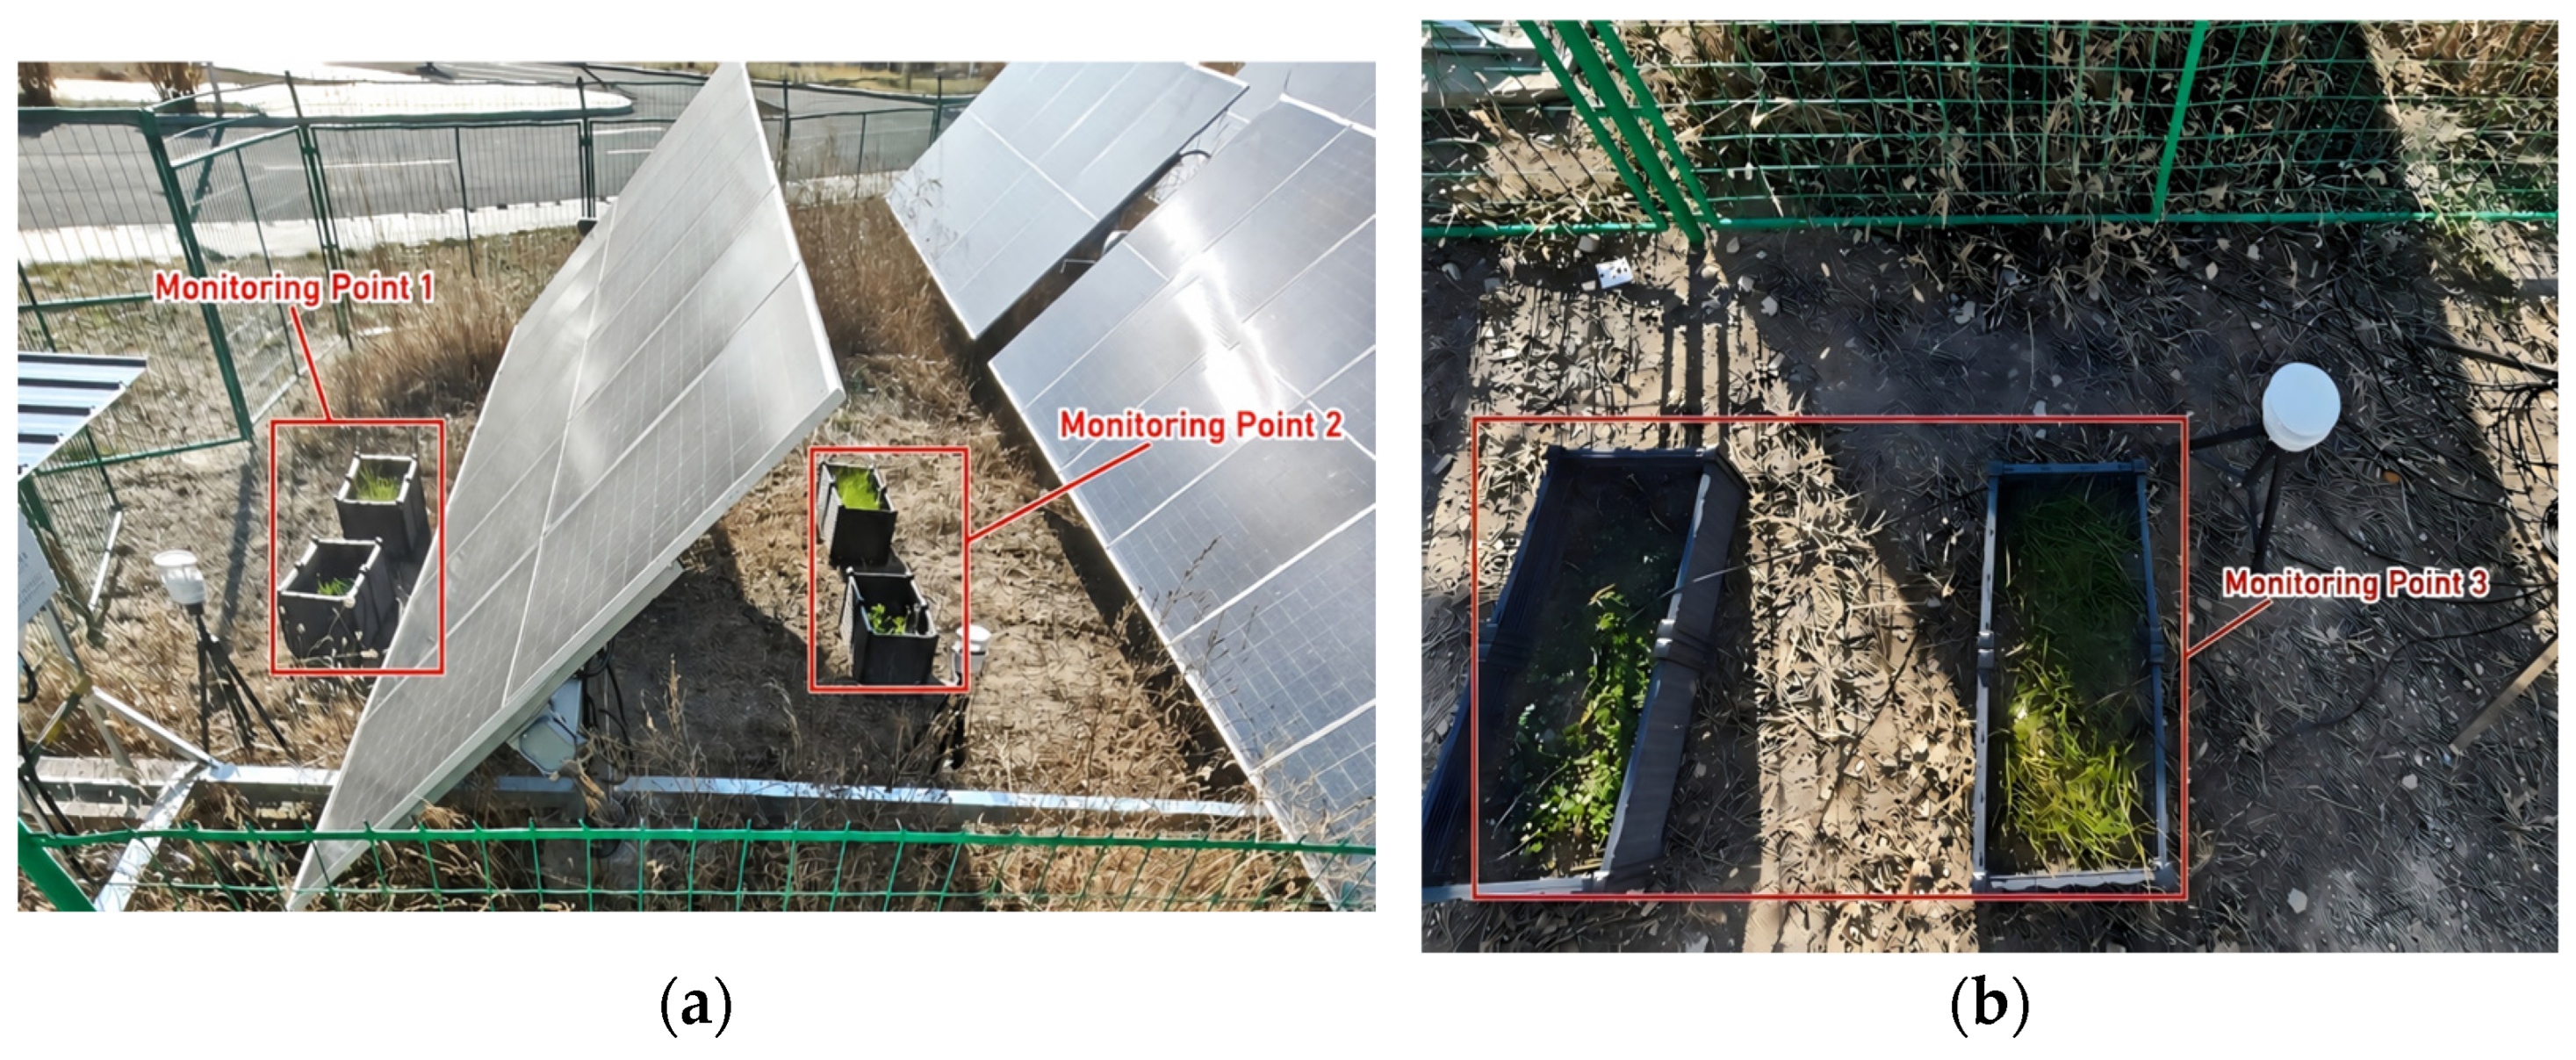
According to the relative positions between the PV panel and the monitoring points, three monitoring zones were established: the front area of the PV panel, the rear area of the PV panel, and the outside reference area. The front area was used to represent the microenvironmental characteristics of the windward side of the PV panel or the area with weaker shading influence. The rear area was used to represent the area where PV-panel shading, wind-speed reduction, and moisture-retention effects were relatively obvious. The outside area was used as an external reference area under field conditions and was compared with the PV-affected areas. The locations of the three monitoring points are shown in
Figure 1.
2.4.2. Experimental Design and Monitoring Layout
Monitoring point 1 was located in the front area of the PV panel. Monitoring point 2 was located in the rear area of the PV panel, and monitoring point 3 was located in the outside reference area. The three monitoring points were used to compare the soil temperature, soil moisture, near-surface wind speed, and plant growth responses at different spatial locations. During monitoring-point layout, the sensor height, burial depth, sampling frequency, and vegetation observation method were kept as consistent as possible to reduce the influence of instrument-layout differences on the results. The distance between the PV panels was approximately 3.5 m, and the distances from monitoring points 1, 2, and 3 to the edge of the target PV panel were each approximately 1 m. All long-term field-monitoring results presented in the manuscript were obtained around a fixed PV panel installed at a tilt angle of 43°. Therefore, the front, rear, and outside monitoring zones represent spatial responses around the same 43° PV configuration rather than direct field comparisons among the 36°, 43°, and 50° tilt-angle scenarios.
Soil temperature and volumetric soil moisture sensors were buried at a depth of 30 cm. Two soil temperature–moisture measurement points were arranged in each zone, and their arithmetic mean was used as the representative value of the corresponding zone. Near-surface wind speed sensors were installed at a height of 1.2 m, and one wind-speed measurement point was arranged in each zone. In addition, background meteorological conditions were recorded using a six-parameter automatic weather station (JIOUSU, Hebei Ousu Electronic Technology Co., Ltd., Shijiazhuang, China). All monitoring variables were automatically recorded with a sampling interval of 5 min. Plant growth status was assessed using plant height as a preliminary indicator of early vegetation establishment. During measurement, the highest and lowest extreme individuals were excluded. A steel tape with an accuracy of 1 mm was used to measure each plant three times, and the average value was taken as the plant height result.
To reduce the influence of non-PV factors on plant growth comparisons, the plant species, initial planting time, substrate source, planting container or quadrat conditions, and artificial management methods were kept consistent among the three monitoring zones. Owing to limitations in field experimental conditions, aboveground biomass, root length, vegetation coverage, and community diversity were not further measured in this study. Therefore, the field vegetation observations represent only early plant-height responses under the influence of PV panels and do not provide evidence of long-term biomass accumulation, community succession, or ecological restoration stability.
2.4.3. Surface Substrate and Initial Monitoring Conditions
To clarify the basic conditions used for model validation and field monitoring, the surface substrate type, initial soil temperature, initial soil moisture, and main monitoring conditions of the ash storage yard were summarized in
Table 3. The initial soil temperature and initial soil moisture in the table were obtained from the first field measurement during the validation period for each tilt-angle scenario and were used as the initial input conditions for model validation.
The substrate type was recorded during field monitoring, but a comprehensive physicochemical characterization of the ash-yard substrate was not conducted. Therefore, its pH, electrical conductivity, organic-matter content, nutrient composition, particle-size distribution, salinity, and heavy-metal concentrations were not systematically available for the present analysis. Consequently, the field data were used to compare relative differences in physical microenvironmental conditions and early plant-height responses among the monitoring zones, rather than to quantify the effects of the substrate physicochemical properties on vegetation establishment. Future field campaigns will include systematic substrate sampling and laboratory characterization to evaluate the effects of substrate hydraulic and physicochemical properties on soil hydrothermal regulation and early vegetation establishment. This limitation is further discussed in
Section 4.6.
2.5. Model Validation Based on Field Measurements
To examine the ability of the model to reproduce short-term soil hydrothermal variation trends, three consecutive typical sunny days from 22 to 24 August 2025 were selected as the model validation period. The three days corresponded to PV tilt-angle scenarios of 36°, 43°, and 50°, respectively, and continuous observations were conducted from 14:00 to 15:00 each day. For each tilt-angle scenario, 12 paired simulated and measured values were obtained at 5 min intervals during the 1 h validation period. This short validation window was designed to examine whether the model could reproduce the dominant afternoon soil-warming and moisture-depletion trends under relatively stable sunny conditions. Therefore, the validation represents a short-term trend assessment and does not demonstrate predictive capability for complete diurnal cycles, seasonal hydrothermal dynamics, or long-term soil–water processes.
The field-measured soil temperature and soil moisture at 14:00 each day were set as the initial model conditions. The changes in soil temperature and soil moisture beneath the PV panel from 14:00 to 15:00 were then simulated and compared with the synchronous field measurements. The near-surface wind speed was monitored for mechanistic interpretation but was not included in the quantitative model-validation statistics. Soil temperature and soil moisture were recorded every 5 min. The relative error was calculated as follows:
where
RE is the relative error;
S is the simulated value; and
M is the measured value.
To further quantify the model validation effect, the minimum relative error, maximum relative error, mean relative error, and root mean square error were calculated for the soil temperature and soil moisture under the three PV tilt angles. Among them, relative error was used to characterize the deviation between simulated and measured values, while root mean square error was used to reflect the overall dispersion level of the simulation results.
2.6. Extraction and Calculation of Hydrothermal and Airflow Indicators
To further quantify the soil hydrothermal and near-surface airflow responses under different PV tilt angles, soil temperature, volumetric soil water content, and near-surface wind speed were extracted and compared for the 36°, 43°, and 50° scenarios under the June, July, and August simulation conditions. The same spatial averaging domains and output-processing method were applied to all angle–month combinations to ensure comparability among the scenarios.
Soil temperature and volumetric soil water content were volume-averaged over the PV-affected soil domain extending from the ground surface to a depth of 0.3 m beneath and immediately adjacent to the PV panel. This domain covered the main root-zone soil layer and the principal heat–moisture-affected region identified in the vertical contour results. Near-surface wind speed was volume-averaged over the predefined air subdomain around and beneath the PV panel. The same air-averaging domain was applied to all angle–month combinations to ensure comparability among the simulated scenarios.
For each angle–month combination, the mean soil temperature and mean near-surface wind speed were calculated from the corresponding volume-averaged model outputs. Soil-temperature change and net volumetric soil-water-content change were calculated as the differences between the last and first stored output states within the selected short-duration simulation interval:
where
is the short-term change in volume-averaged soil temperature, and
is the net change in volume-averaged volumetric soil water content. Soil-water-content changes are expressed in percentage points. Positive values indicate that the last stored output was higher than the first stored output.
The net change in volumetric soil water content was used only to characterize the short-term moisture-state response of the simulated soil domain. Because validated soil-surface evaporation and atmospheric water-vapor fluxes were not directly available from the present model outputs, was not converted into an evaporation rate or interpreted as actual soil evaporation. Accordingly, the quantitative results represent changes in hydrothermal state variables and near-surface airflow rather than direct measurements of evaporation or water-vapor flux.
2.7. First-Order Photovoltaic Performance Assessment
To provide a first-order estimate of solar-radiation interception and annual photovoltaic energy yield, the 36°, 43°, and 50° configurations were evaluated using PVsyst 8.1.4. Hourly synthetic meteorological data were generated using Meteonorm 9.0 for the study site located at 42.8000° N, 111.1629° E, and 1186 m above sea level.
A standardized 3.0 kWp grid-connected photovoltaic system was established, consisting of ten generic monocrystalline silicon modules with a rated capacity of 300 Wp each and one 3.0 kW grid-connected inverter. The photovoltaic modules were installed on a fixed south-facing plane with an azimuth angle of 0°.
To isolate the effect of tilt angle, the meteorological dataset, module and inverter types, installed capacity, series–parallel configuration, azimuth angle, ground albedo, and electrical-loss parameters were kept identical among the three scenarios. Only the module tilt angle was varied. No near-field obstacle shading or three-dimensional row-to-row shading was included.
The annual plane-of-array irradiation (GlobInc), effective irradiation after incidence-angle modification losses (GlobEff), array energy output (EArray), grid-connected energy output (E_Grid), specific energy yield, and performance ratio (PR) were extracted to compare the photovoltaic performance of the three configurations.
Because the 43° configuration produced the highest annual grid-connected energy output among the three scenarios, it was used as the reference for calculating the relative energy-output difference:
where
is the relative change in annual grid-connected energy output at tilt angle
.
Tilt-dependent soiling was not explicitly modeled because the corresponding annual field measurements were unavailable, and all other system-loss parameters were kept identical among the three configurations. Therefore, the PVsyst results represent a standardized first-order comparison of the relative effects of tilt angle rather than an exact prediction of full-scale power-plant output. Because only three discrete tilt angles were assessed, the ecological–energy comparison was treated as a scenario-based trade-off analysis and did not constitute a formal continuous multi-objective or Pareto optimization. Accordingly, the photovoltaic-performance assessment was included to avoid evaluating the ecological benefits in isolation from renewable-energy performance and to support a sustainability-oriented ecological–energy comparison.
3. Results
3.1. Model Validation Results
The validation statistics are summarized in
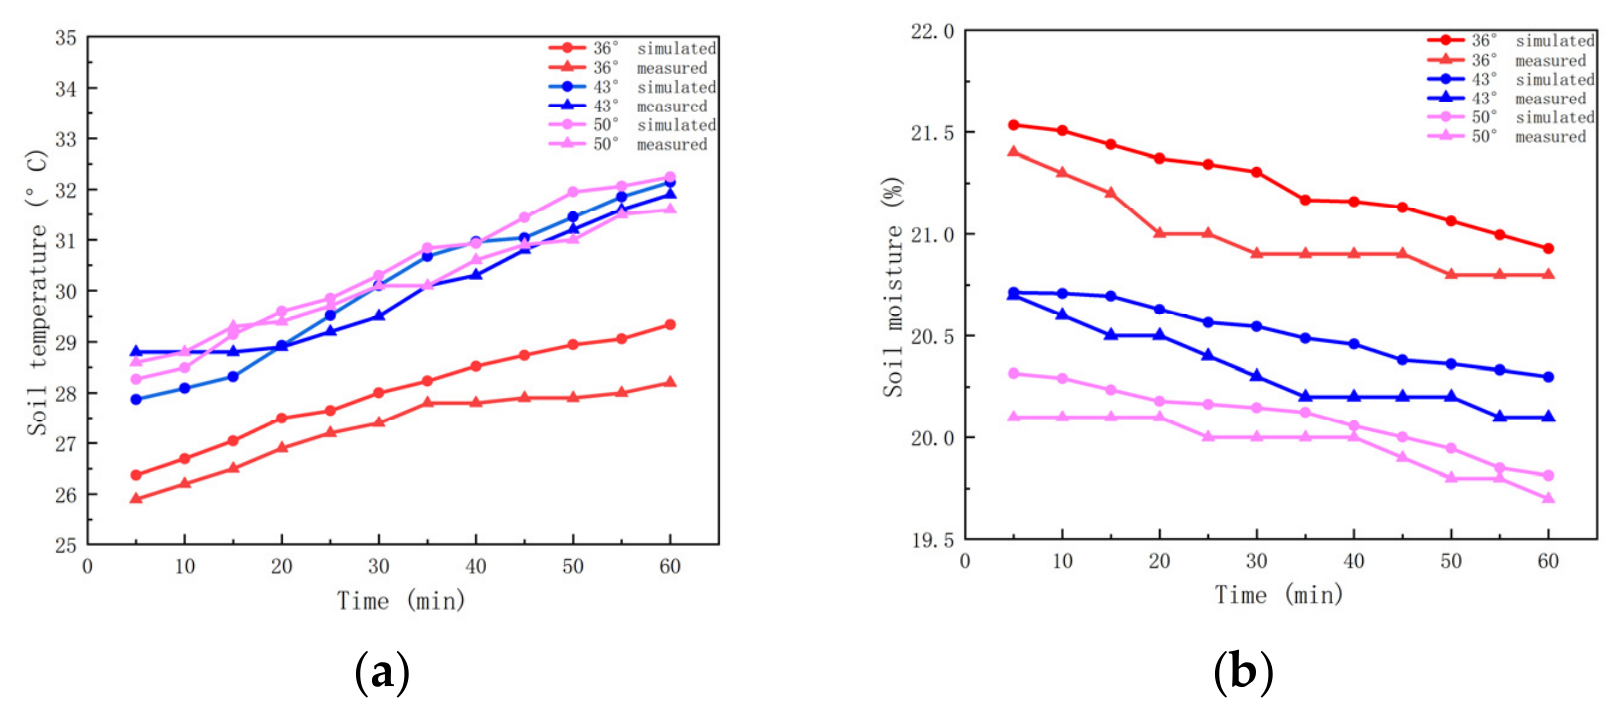
Table 4. The mean relative errors of soil temperature under the 36°, 43°, and 50° scenarios were 2.55%, 1.48%, and 1.39%, respectively, whereas those of soil moisture were 1.21%, 0.89%, and 0.63%, respectively. The generally low error levels indicate that the model could reasonably reproduce the short-term afternoon trends of soil warming and soil-moisture depletion under typical sunny conditions.
As shown in
Figure 2, the simulated and measured values under the three PV tilt angles showed similar variation trends from 14:00 to 15:00. Soil temperature generally increased, whereas soil moisture generally decreased, indicating that the model could capture the dominant afternoon processes of soil warming and soil-moisture decline. Some deviations remained between the simulated and measured values under different tilt angles, which may be related to field wind-speed fluctuations, local differences in the sensor burial environments, spatial heterogeneity in the initial soil moisture, and environmental disturbances in the open field.
This validation mainly examined the model’s ability to reproduce short-term afternoon soil hydrothermal trends and should not be interpreted as validation of complete diurnal cycles, seasonal variation, or long-term predictive capability. The three tilt-angle scenarios were tested on three consecutive sunny days. Although day-to-day meteorological differences could not be completely eliminated, the stable sunny weather reduced external disturbances associated with rainfall and strong cloud-cover variability. Therefore, the remaining discrepancies between simulated and measured values mainly reflect the model’s ability to describe the effects of PV tilt angle on short-term soil hydrothermal responses. Accordingly, the model was used for a relative comparison of microenvironmental regulation among the three tilt-angle scenarios rather than as a substitute for long-term field monitoring.
3.2. Effects of Different PV Tilt Angles on Soil Temperature Distribution
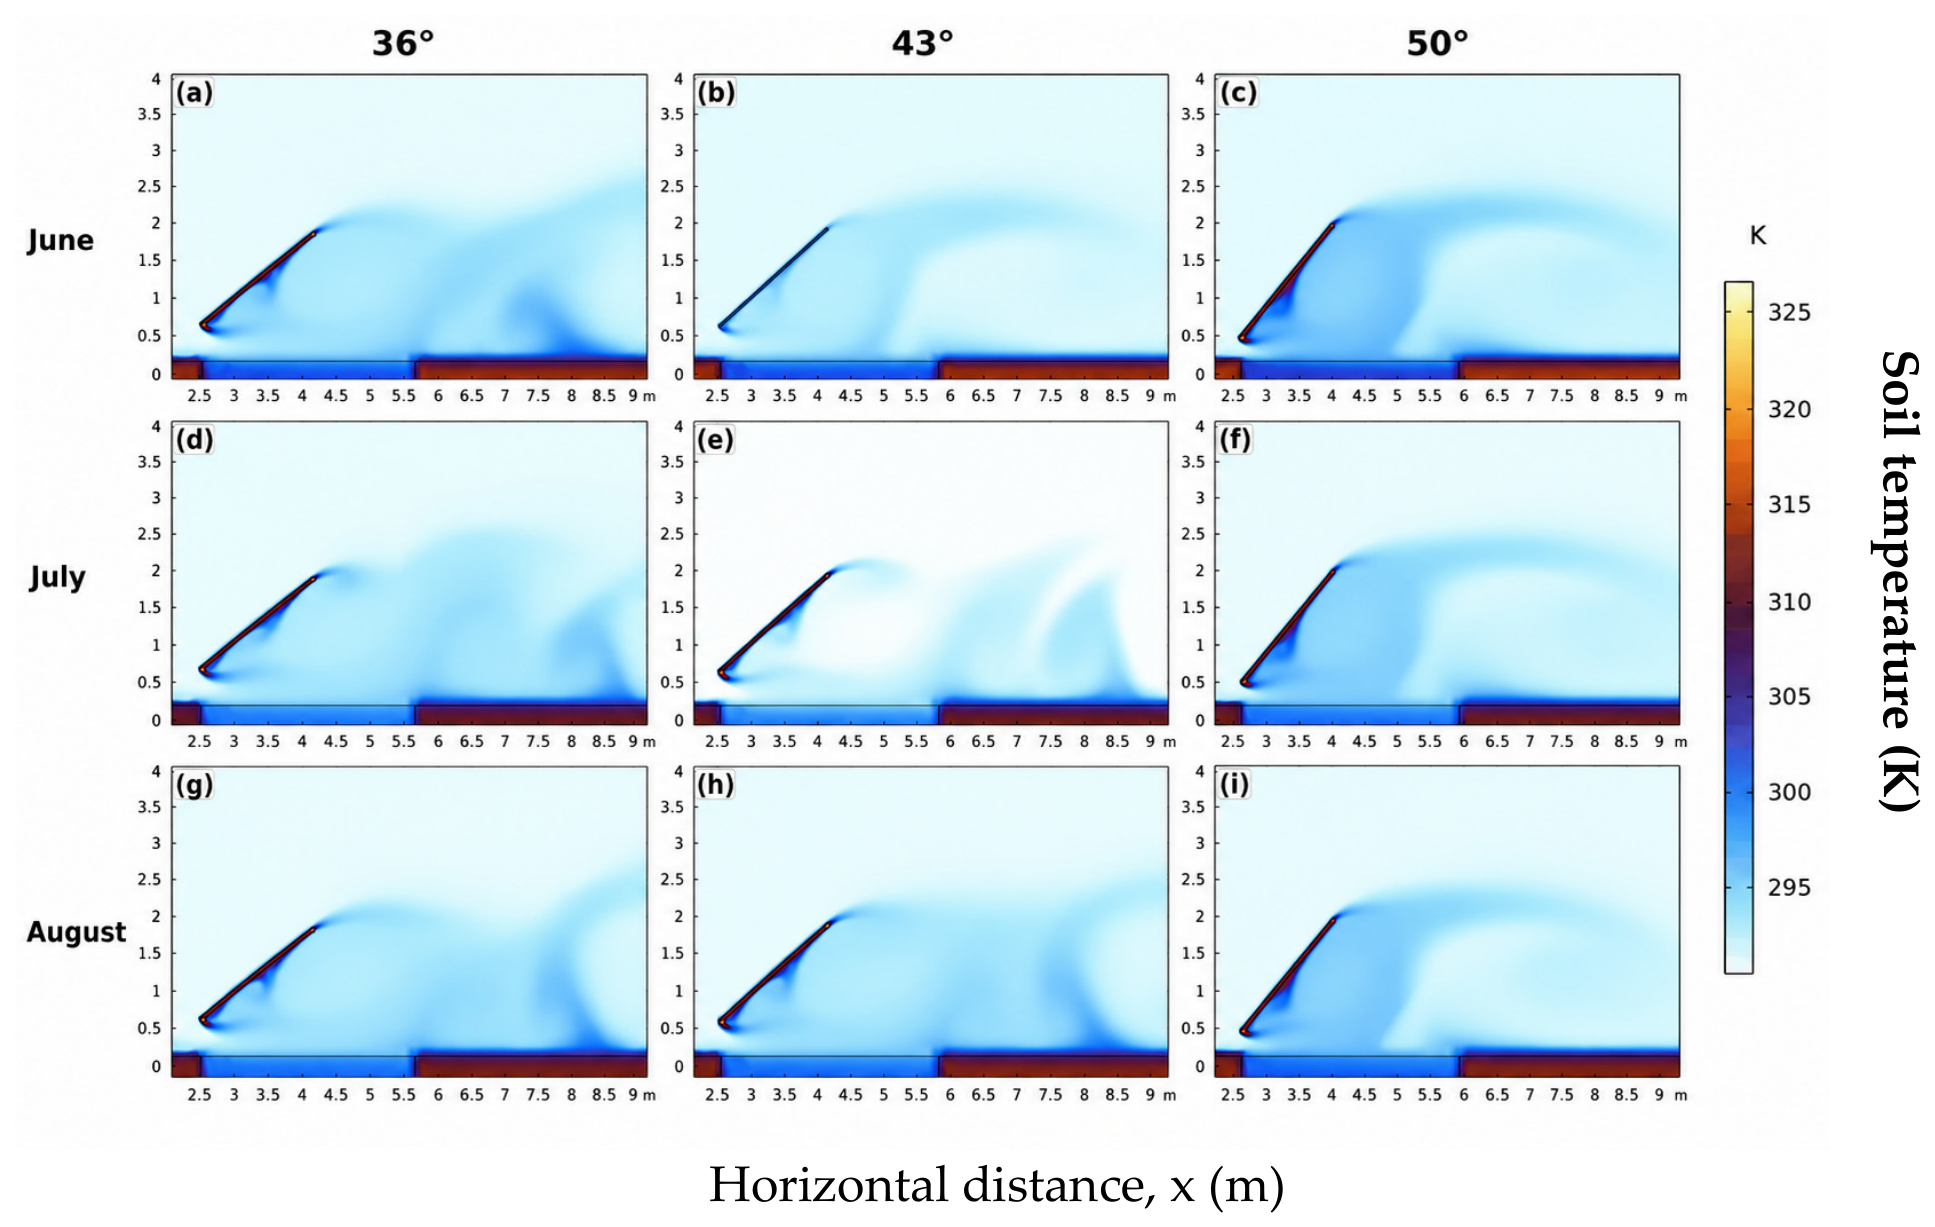
To present the spatial distribution characteristics of soil temperature under different PV tilt angles, a two-dimensional vertical section passing through the centerline of the PV panel was extracted from the multi-physics simulation results. Temperature contour maps were then drawn on this section. These contour maps were not interpolated from a limited number of field monitoring points but were directly exported from the finite-element mesh results within the numerical model domain. In the contour maps, the horizontal direction represents the spatial position along the ground surface, and the vertical direction represents the vertical position of the air and soil domains. To ensure comparability among different tilt angles and months, all contour maps for the same variable used the same computational domain and color scale. As shown in
Figure 3, soil temperature fields differed spatially under different PV tilt angles. Under the 36° tilt angle, the thermally affected zone beneath the panel extended more obviously in the horizontal direction, forming a relatively continuous temperature-buffering zone. Under the 43° tilt angle, the temperature-affected range was close to that under 36°, but the horizontal continuity was slightly weakened. Under the 50° tilt angle, the temperature-affected zone was more concentrated, and the horizontal temperature-buffering effect was relatively weaker. These results indicate that, among the three representative scenarios set in this study, the lower tilt angle and the latitude reference tilt angle were both conducive to forming a certain temperature-regulation effect beneath the panel, whereas the temperature response under the higher tilt angle was more localized.
3.3. Effects of Different PV Tilt Angles on Soil Moisture Distribution
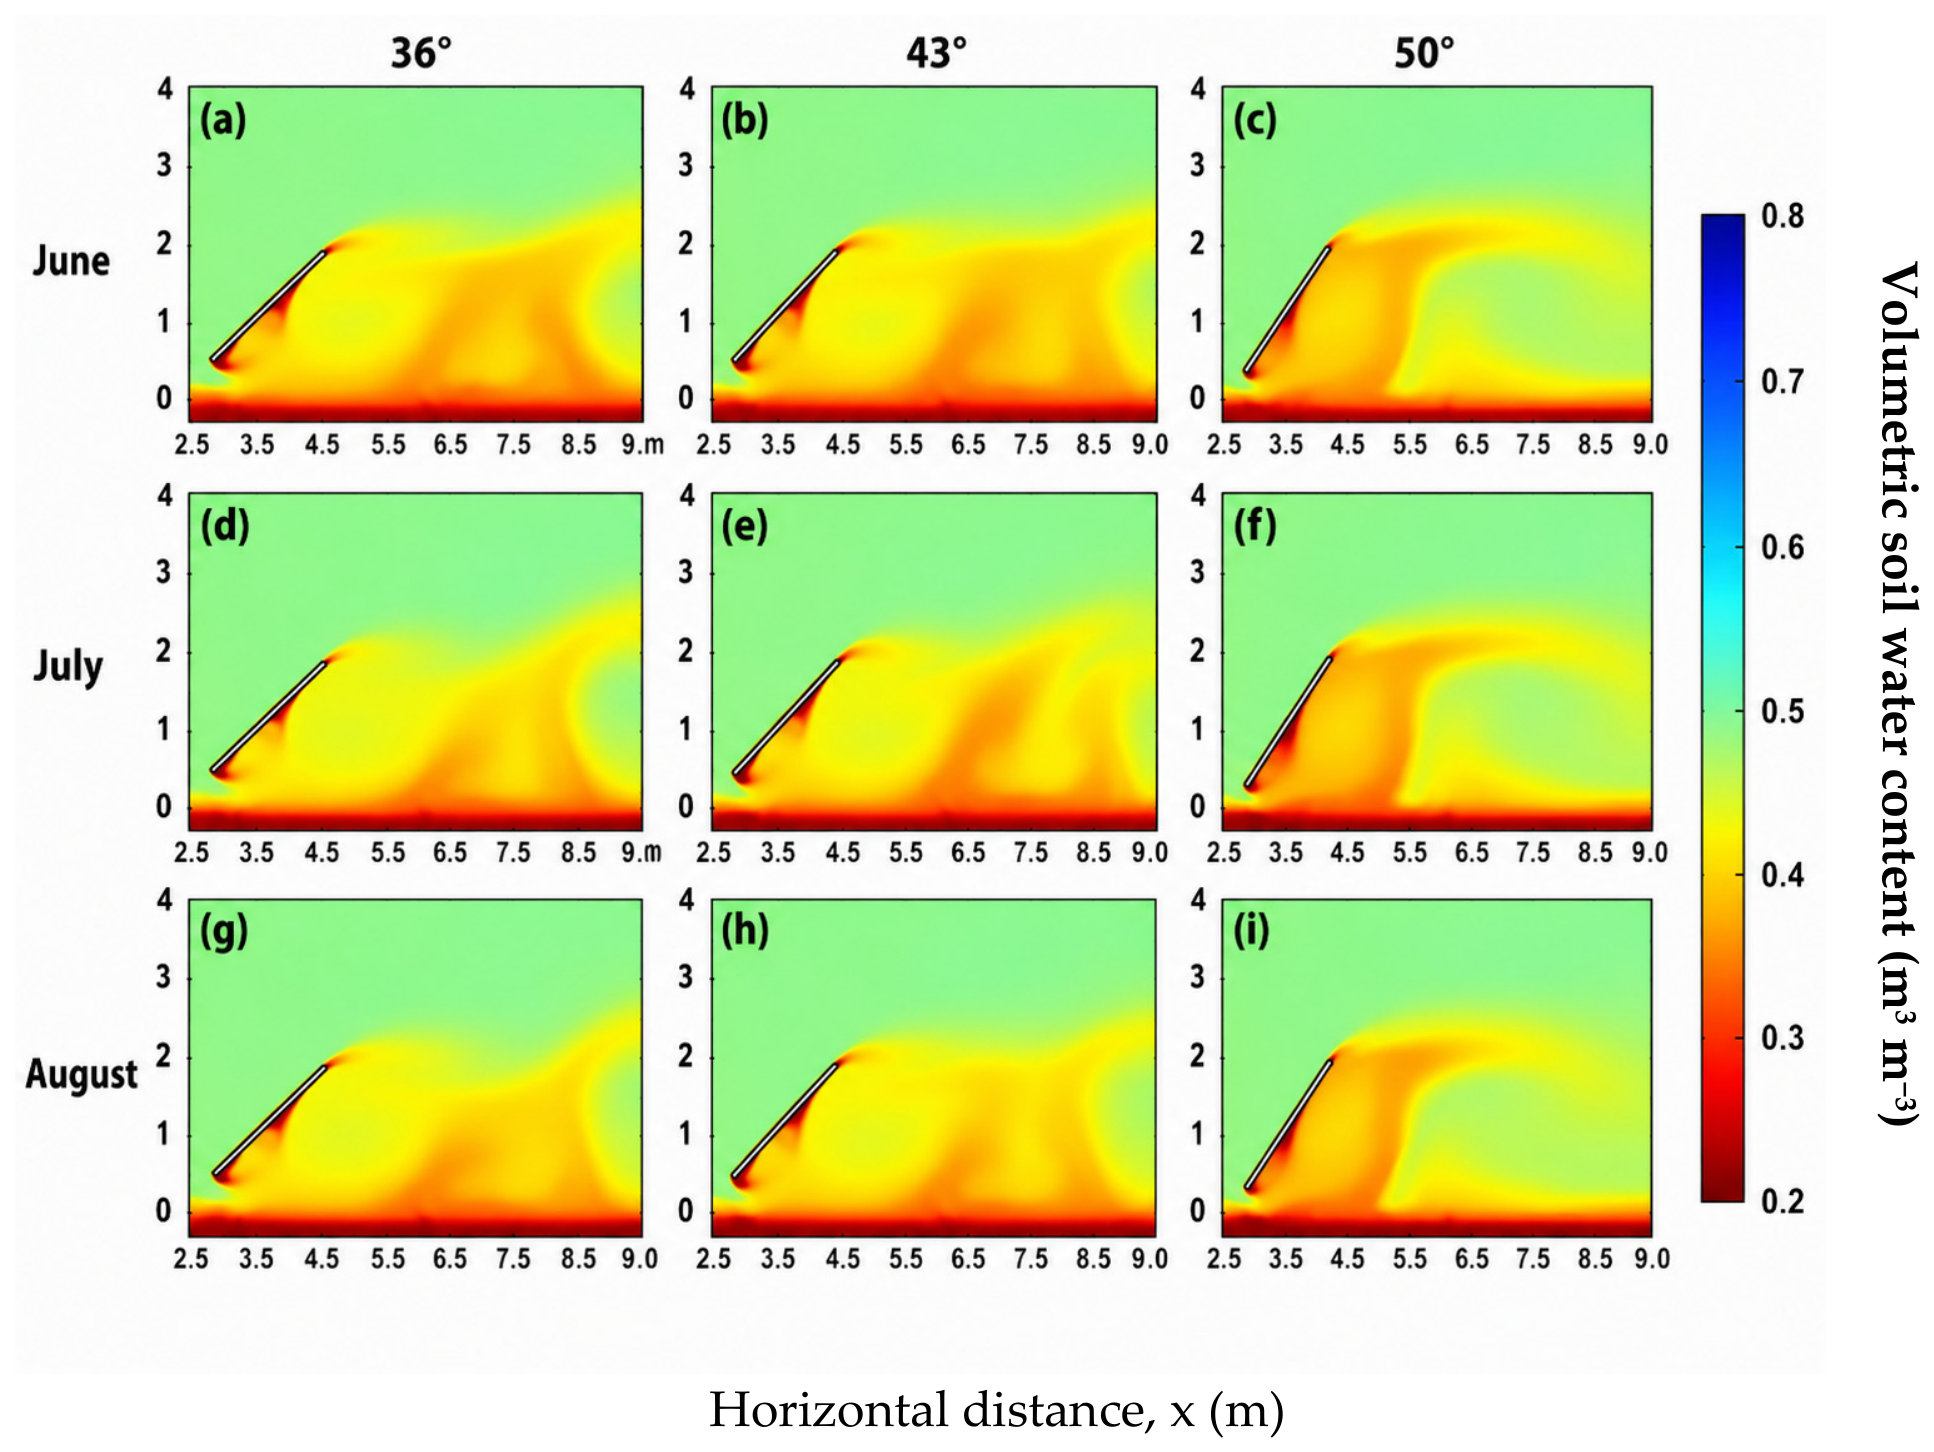
As shown in
Figure 4, the soil moisture field exhibited spatial variation characteristics corresponding to those of the temperature field. Under the 36° tilt angle, the high-moisture region extended from beneath the PV panel to adjacent areas, indicating a relatively continuous moisture-retention effect. Under the 43° tilt angle, the moisture-improvement range slightly contracted, but a certain horizontal extension was still maintained. Under the 50° tilt angle, the moisture-improvement region was relatively concentrated, and the continuity between the area beneath the panel and adjacent areas weakened. These results indicate that PV tilt angle not only affects the shading range but may also influence the spatial distribution of soil moisture through changes in near-surface air exchange and the associated potential for soil-moisture loss.
3.4. Model-Based Hydrothermal Suitability Evaluation Results
The CGI values calculated using the Gaussian suitability function and AHP-CRITIC coupled weights are presented in
Table 5. Among the three representative PV tilt-angle scenarios, the 36° configuration produced the highest CGI values for alfalfa and
Elymus nutans, reaching 0.7741 and 0.6875, respectively. The corresponding values under the 43° configuration were 0.7255 and 0.6298, whereas those under the 50° configuration were 0.5713 and 0.4221, respectively.
The differences between the 36° and 43° configurations were 0.0486 for alfalfa and 0.0577 for Elymus nutans, indicating that both scenarios provided relatively favorable hydrothermal suitability compared with the 50° configuration. Under the evaluation factors and weighting system adopted in this study, the soil temperature–moisture conditions at 36° were slightly closer to the species-specific suitable ranges. The CGI values are, therefore, interpreted as relative hydrothermal suitability among the three tested scenarios.
3.5. Field Responses of Soil Temperature and Moisture
As shown in
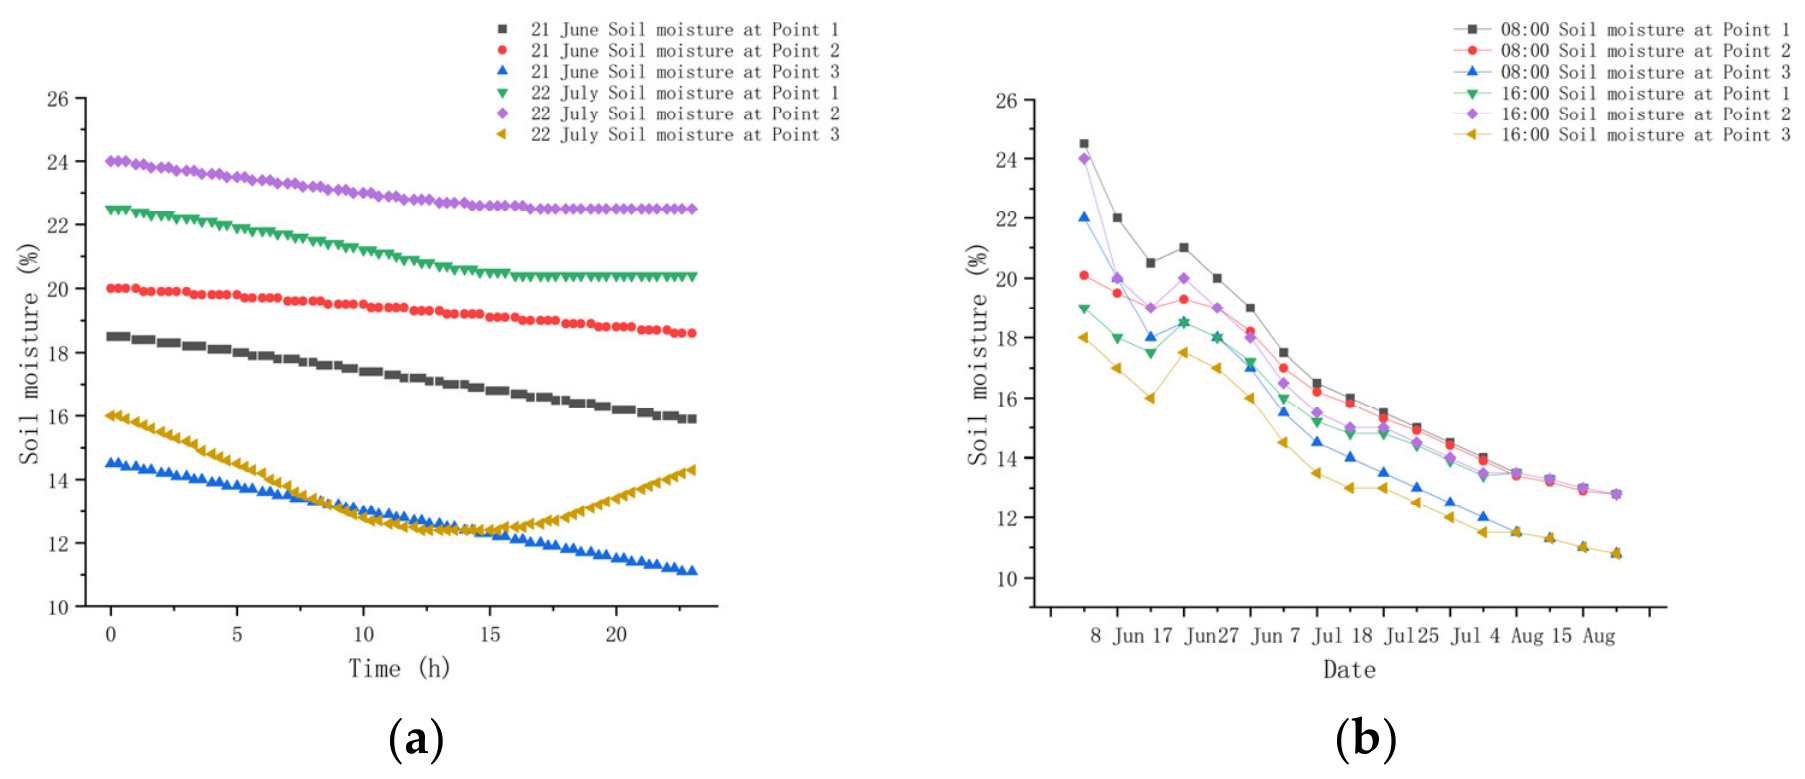
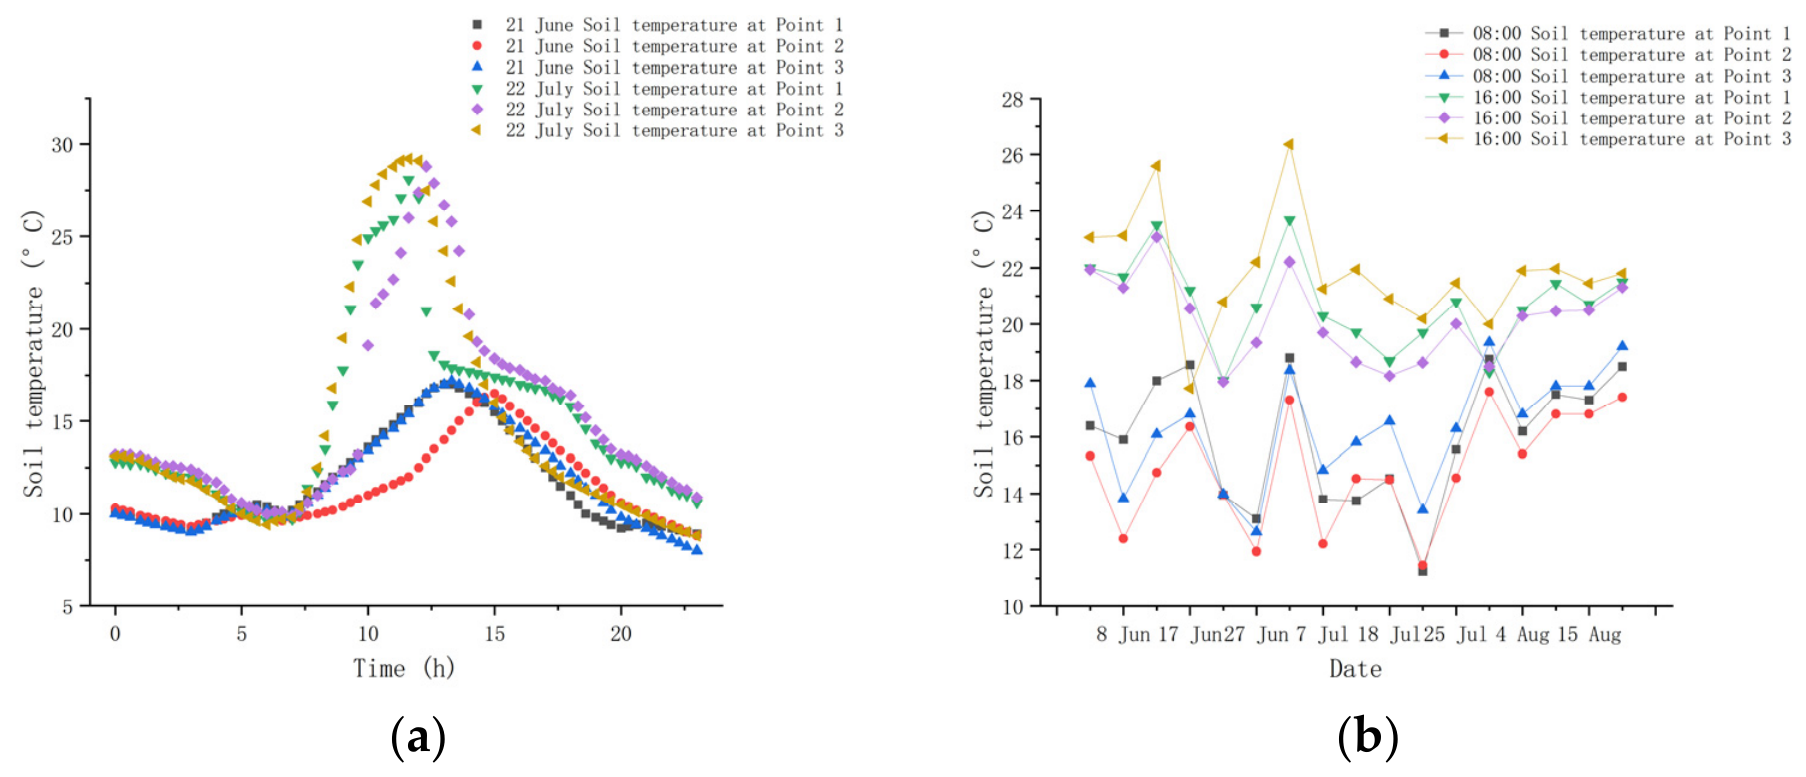
Figure 5a, the soil temperature at all three monitoring zones exhibited a clear diurnal cycle on both 21 June and 22 July. The soil temperature generally decreased slightly during the early morning, increased rapidly after sunrise, reached a maximum around midday or in the early afternoon, and subsequently declined. Although the overall temporal patterns were similar among the three zones, the magnitude and timing of the temperature responses differed. The outside reference area generally exhibited a more pronounced daytime temperature increase, whereas the rear PV area showed a smaller temperature fluctuation and a more moderate thermal response. The front PV area usually displayed an intermediate response between the rear PV area and the outside reference area.
The diurnal soil-temperature range in the rear PV area was 12.7 °C lower than that in the outside reference area, indicating that the rear area experienced a pronounced temperature-buffering effect.
As shown in
Figure 5b, the multi-date soil-temperature observations from June to August also revealed spatial differences among the three monitoring zones. Although the absolute temperature varied among the monitoring dates because of changes in ambient weather conditions, the rear PV area generally exhibited a smaller variation range than the outside reference area at both 08:00 and 16:00. The differences among the zones were more apparent at 16:00, when solar heating had accumulated for a longer period, and the thermal-regulation effect of PV shading was more evident. These multi-date observations were consistent with the diurnal results, indicating that the temperature-buffering effect in the rear PV area was not limited to a single monitoring day.
As shown in
Figure 6a, the volumetric soil water content generally decreased during the daytime in the three monitoring zones on both representative dates. However, the magnitude of the decline differed among the zones. The rear PV area generally maintained a higher soil water content and a smaller daytime reduction than the outside reference area. The outside reference area exhibited the lowest soil water content and a more pronounced decline during most of the monitoring period, whereas the front PV area showed an intermediate response. These results indicate that the microenvironment behind the PV panel was more favorable for short-term soil-moisture retention.
The multi-date observations in
Figure 6b showed that soil water content gradually decreased from June to August in all three monitoring zones, reflecting progressive moisture depletion during the growing season. Nevertheless, spatial differences among the monitoring zones remained evident. The rear PV area generally retained more soil moisture than the outside reference area, particularly during the later monitoring dates. The lower soil water content in the outside reference area indicates that soil exposed to stronger radiation and airflow was more susceptible to moisture loss. Although the relative positions of the front and rear PV areas varied slightly among individual monitoring dates, the PV-affected zones generally maintained a more favorable soil-moisture condition than the outside reference area.
3.6. Near-Surface Wind Speed and Plant-Height Responses
As shown in
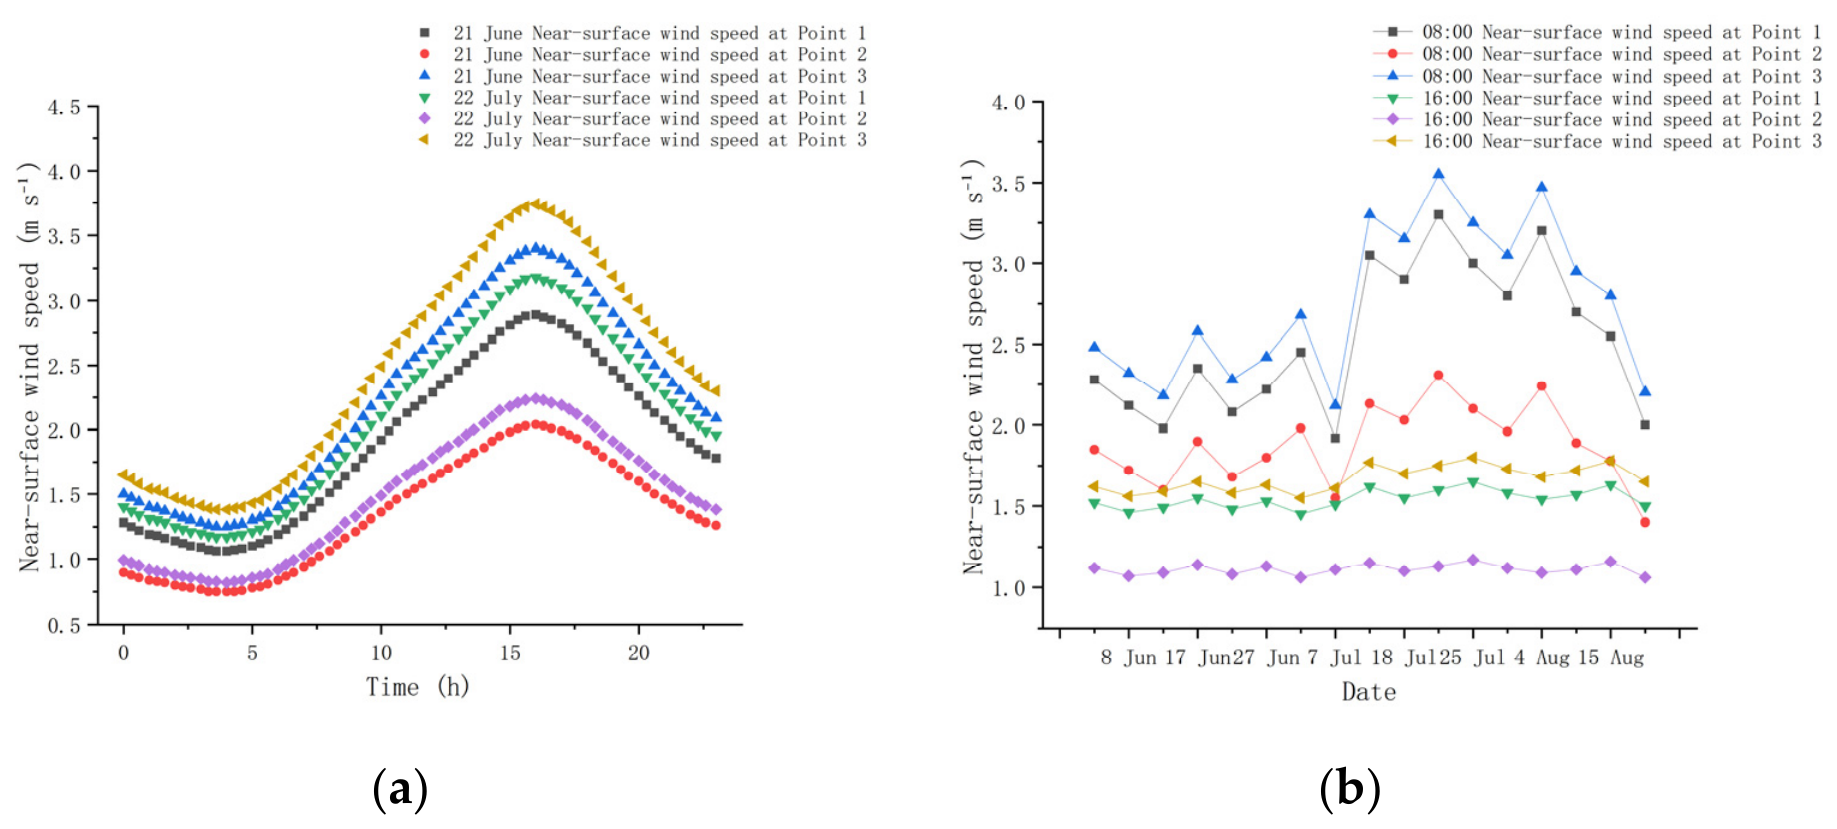
Figure 7a, the near-surface wind speed in all three monitoring zones exhibited a distinct diurnal pattern on 21 June and 22 July. The wind speed was relatively low during the nighttime and early morning, increased gradually after sunrise, reached a maximum in the afternoon, and subsequently declined. Despite the similar temporal patterns, clear spatial differences were observed among the monitoring zones. The outside reference area generally exhibited the highest wind speed, the rear PV area exhibited the lowest wind speed, and the front PV area showed an intermediate response. This spatial ordering remained generally consistent on both representative monitoring days.
The wind-speed reduction in the rear PV area was approximately 33–40%, relative to the outside reference area. This result demonstrates that the PV panel acted as a physical barrier that altered the near-surface airflow and created a sheltered zone behind the panel. The incoming airflow was partially blocked, redirected, and dissipated as it passed around the PV structure, resulting in lower airflow velocity in the rear area. The front PV area remained more directly exposed to incoming airflow and, therefore, experienced higher wind speed than the rear area, although its wind speed was generally lower than or close to that in the outside reference area.
The multi-date observations in
Figure 7b further confirmed the wind-weakening effect of the PV structure. At both 08:00 and 16:00, the near-surface wind speed in the rear PV area remained consistently lower than that in the outside reference area across the monitoring dates from June to August. The differences were particularly evident at 16:00, when the ambient wind speed was generally higher, and the airflow-blocking effect of the PV panel became more pronounced. Although the absolute wind speed varied among the monitoring dates because of changing meteorological conditions, the relative spatial pattern among the three zones remained comparatively stable.
As shown in
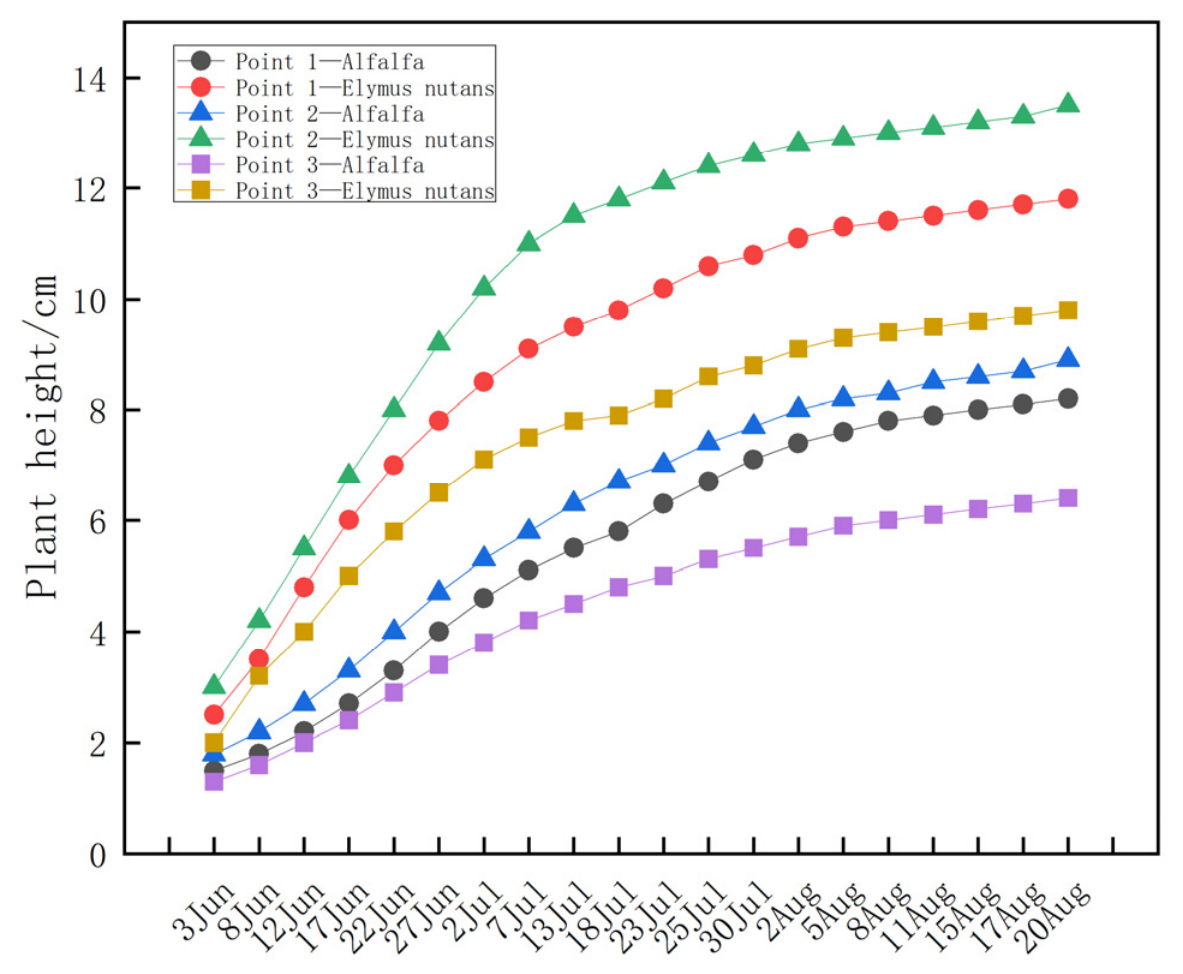
Figure 8, the plant heights of both alfalfa and
Elymus nutans increased progressively during the observation period in all three monitoring zones. However, the growth trajectories differed among the zones. Plants in the rear PV area generally exhibited a faster increase in height and reached higher final values than plants in the front PV area and the outside reference area. At the end of the observation period, the plant heights of alfalfa and
Elymus nutans in the rear PV area were 49.4% and 37.8% higher, respectively, than those in the outside reference area. The front PV area generally exhibited intermediate plant-height values.
The higher plant heights observed in the rear PV area were consistent with the more stable soil-temperature conditions, higher soil water content, and lower near-surface wind speed recorded in the same zone. These coincident responses suggest that the rear PV area provided relatively favorable conditions for early vegetation establishment. Nevertheless, the field observations demonstrate spatial association rather than strict causal attribution because the effects of all of the environmental variables were not independently controlled.
It should also be emphasized that the plant-height observations compared the front PV area, rear PV area, and outside reference area rather than the 36°, 43°, and 50° tilt-angle scenarios. Therefore, the plant-height data were not designed to statistically calibrate or validate the CGI ranking among the three tilt angles.
3.7. Quantitative Characterization of Hydrothermal and Airflow Responses
To supplement the spatial-distribution results, the mean soil temperature, short-term soil-temperature change, mean near-surface wind speed, initial and final volumetric soil water contents, and net soil-water-content change were quantitatively compared among the 36°, 43°, and 50° scenarios under the June, July, and August simulation conditions. The results are summarized in
Table 6.
As shown in
Table 6, the mean near-surface wind speed decreased monotonically as the PV tilt angle increased from 36° to 50° under all three monthly conditions. In June, the mean wind speeds at 36°, 43°, and 50° were 2.348, 2.060, and 1.760 m s
−1, respectively. The corresponding values were 2.548, 2.256, and 1.960 m s
−1 in July and 2.160, 1.960, and 1.660 m s
−1 in August. Relative to the 36° scenario, the 50° scenario reduced the mean near-surface wind speed by approximately 25.0% in June, 23.1% in July, and 23.1% in August. The consistent response across the three monthly conditions indicates that increasing the tilt angle altered the airflow passage beneath the PV panel and reduced the mean near-surface airflow velocity within the simulated domain.
Both the mean soil temperature and the short-term soil-temperature increase decreased consistently with increasing PV tilt angle. The mean soil temperatures at 36°, 43°, and 50° were 28.452, 28.393, and 28.329 °C in June; 29.110, 29.049, and 28.988 °C in July; and 28.780, 28.722, and 28.666 °C in August, respectively. Thus, increasing the tilt angle from 36° to 50° reduced the mean soil temperature by 0.123 °C in June, 0.122 °C in July, and 0.114 °C in August.
The short-term soil-temperature increases under the 36°, 43°, and 50° scenarios were 0.146, 0.140, and 0.123 °C in June; 0.150, 0.139, and 0.127 °C in July; and 0.146, 0.140, and 0.126 °C in August, respectively. Compared with the 36° scenario, the soil-temperature increase at 50° was reduced by approximately 15.8%, 15.3%, and 13.7% in June, July, and August, respectively. These results indicate that the higher tilt angle weakened the short-term soil-temperature response within the analyzed output interval, although the contour results showed that its spatially affected zone was more localized.
The net changes in volumetric soil water content were positive but small under all scenarios, ranging from +0.0015 to +0.0030 percentage points. In June, the net changes at 36°, 43°, and 50° were +0.0016, +0.0016, and +0.0015 percentage points, respectively. In July, the corresponding values were +0.0027, +0.0024, and +0.0022 percentage points, whereas in August they were +0.0029, +0.0030, and +0.0022 percentage points.
The July results showed a gradual decrease in the net soil-water-content change with an increasing tilt angle, whereas the June differences were negligible and the August value at 43° was slightly higher than that at 36°. Therefore, unlike the consistent wind-speed and temperature responses, the net soil-water-content change did not exhibit a uniform monotonic relationship with the tilt angle. The small positive changes indicate limited short-term variation in the simulated soil-moisture state during the selected output interval. Because validated evaporation and atmospheric water-vapor fluxes were not directly available, these results should not be interpreted as direct evidence of changes in soil evaporation.
Overall, the PV tilt angle produced consistent and monotonic effects on the simulated near-surface wind speed and short-term soil-temperature response, whereas its effect on the bulk soil-water-content change was smaller and non-monotonic. This difference suggests that airflow and thermal variables responded more sensitively to tilt-angle variation than the short-term soil-moisture state within the analyzed simulation interval.
4. Discussion
4.1. Mechanisms by Which PV Tilt Angle Regulates the Microenvironment of the Ash Storage Yard
The results of this study show that the influence of PV tilt angle on the near-surface microenvironment of the ash storage yard is not simply a matter of changing the shading area. Instead, the PV tilt angle further affects the root-zone soil temperature and moisture and early plant growth conditions by regulating the surface radiation input, near-surface air exchange, the potential for soil-moisture loss associated with evaporation and vapor removal, and hydrothermal migration processes. Related research in semi-arid PV systems has also emphasized the need to coordinate water, energy, and ecological functions rather than evaluating electricity generation alone [
26]. Among the three representative tilt angles, the 36° and 43° scenarios both showed relatively good soil hydrothermal regulation effects. The horizontal extension of the heat–moisture affected zone was relatively larger under the 36° tilt angle, whereas the hydrothermal improvement region under the 50° tilt angle was more concentrated and had weaker spatial continuity. These results indicate that tilt-angle selection in PV deployment for degraded industrial sites should not be judged only from the perspective of maximum power generation. Instead, shading continuity, rear-area air exchange, the potential for soil-moisture loss, and root-zone hydrothermal stability should also be considered.
From a physical mechanism perspective, a lower PV tilt angle can form a more continuous shading-affected zone on the ground surface, reducing direct solar shortwave radiation input and weakening rapid soil surface warming. At the same time, PV panels can block and disturb near-surface airflow. When the wind speed decreases in the rear area of the panel, atmospheric mixing and the removal of water vapor from the soil surface may be weakened, thereby reducing the potential for rapid soil-moisture loss. Together with reduced soil-temperature fluctuations, this effect may enhance moisture retention and contribute to the formation of a hydrothermal-buffering environment behind the PV panel [
27]. In contrast, local shading still exists under the higher tilt angle. But the hydrothermal-affected zone becomes more concentrated, and the continuity between the panel-covered area and adjacent areas is weaker. Therefore, its improvement range for plant root-zone environments is relatively limited.
The substrate of an ash storage yard differs substantially from ordinary farmland soil or natural grassland soil. The surface substrate of an ash storage yard is usually loose in structure and weak in water-retention capacity, and it is more susceptible to moisture loss and particle disturbance caused by wind-speed changes [
28]. Therefore, in such degraded industrial sites, the hydrothermal improvement effect produced by PV-panel wind-speed reduction and radiation regulation may be more obvious than in ordinary farmland environments. The field monitoring results of this study also showed that near-surface wind speed decreased, soil moisture was better maintained, and soil temperature fluctuations were weakened in the rear area of the PV panel. The field monitoring results support the general mechanism of PV-induced wind-speed reduction and hydrothermal buffering at the field scale, rather than providing a direct field comparison among the three tilt-angle scenarios.
The quantitative comparison further supported the coupled radiative–aerodynamic mechanism. Compared with the 36° scenario, the 50° scenario reduced the simulated mean near-surface wind speed by approximately 23.1–25.0% and reduced the short-term soil-temperature increase by approximately 13.7–15.8% under the three monthly conditions. However, the contour results showed that the heat–moisture-affected zone under the 36° scenario was wider and more spatially continuous, whereas the response under the 50° scenario was more localized. These results indicate that tilt-angle variation affects both the spatial coverage and local intensity of microenvironmental regulation. Therefore, the hydrothermal response resulted from the combined effects of shading-induced radiation modification and near-surface airflow redistribution rather than from either process alone.
A comparison among the three configurations further shows that the ecological response depends on both the spatial extent and the local intensity of regulation. The 36° configuration produced the widest and most spatially continuous heat–moisture-affected zone, allowing the shading and hydrothermal-buffering effects to extend from the panel-covered area toward the adjacent root-zone soil. The 43° configuration retained relatively continuous regulation but showed a moderately smaller affected range, representing a comparatively balanced response. In contrast, the 50° configuration produced a lower mean near-surface wind speed and a smaller short-term soil-temperature increase, indicating stronger local airflow suppression and thermal buffering. However, these effects were concentrated within a narrower region with weaker spatial continuity. This difference explains why the 36° configuration achieved higher CGI values than the 50° configuration. Its advantage was not the strongest local cooling or wind reduction, but the broader and more continuous improvement of the soil hydrothermal environment. Because the simulated soil-water-content changes were small and non-monotonic, this interpretation concerns the potential coupling pathway of soil-water loss rather than directly quantified evaporation flux.
4.2. Relationship Between Wind-Speed Reduction and Soil Hydrothermal Dynamics
Near-surface wind-speed variation is an important process connecting the structural effect of PV panels with soil hydrothermal responses. When wind speed decreases in the rear area of the panel, atmospheric mixing and the removal of water vapor from the soil surface may be weakened, thereby reducing the potential for rapid soil-moisture loss. Second, a lower wind speed can reduce surface particle disturbance and potential wind-erosion risk, helping to maintain the stability of the planting substrate. Third, wind-speed reduction may also decrease mechanical stress on seedlings and improve early vegetation-establishment conditions [
28].
Although the comprehensive growth index constructed in this study was mainly based on two direct hydrothermal factors, namely soil temperature and soil moisture, wind speed is not irrelevant to plant growth evaluation. Wind speed indirectly affects the plant-growth environment by influencing near-surface vapor removal, potential soil-moisture loss, surface-particle disturbance, and mechanical stress on seedlings. Therefore, in the framework of this study, wind speed was treated as an important mechanistic variable for explaining CGI results and field plant responses, but it was not directly included in the CGI calculation. This treatment maintained the direct correspondence between the CGI and plant root-zone hydrothermal suitability, but it also means that the current model does not fully express the comprehensive effect of wind speed on plant growth. Future studies may further incorporate wind speed, radiation intensity, soil salinity, and substrate chemical properties into a multi-factor evaluation model to establish a more complete microenvironment–vegetation response evaluation system [
29].
However, the net soil-water-content change did not vary monotonically with either the near-surface wind speed or the soil-temperature change. Although the 50° scenario produced the lowest mean wind speed and the smallest short-term soil-temperature increase, its positive net soil-water-content change was not consistently greater than those under the 36° and 43° scenarios. Across the nine angle–month combinations, the net changes ranged only from +0.0015 to +0.0030 percentage points. In August, for example, the 43° scenario exhibited a slightly greater positive change than the 36° scenario, whereas the 50° scenario showed the smallest change. This non-monotonic response indicates that short-term soil-moisture dynamics were jointly affected by shading-induced radiation changes, soil-temperature regulation, convective exchange, monthly differences in initial soil-moisture conditions, and internal water redistribution within the porous substrate. Therefore, wind-speed reduction should be regarded as one of several interacting controls on soil hydrothermal responses rather than as an independent determinant of soil-water-content change. Because validated evaporation and atmospheric water-vapor fluxes were not directly available, the reported soil-water-content changes represent differences in simulated moisture state rather than direct evidence of evaporation-flux variation.
4.3. Interpretation of CGI Results and the Difference Between 36° and 43°
The comprehensive growth index results showed that, among the three representative PV tilt angles set in this study, the CGI values of alfalfa and Elymus nutans were highest under the 36° tilt angle, followed by the 43° tilt angle, while the 50° tilt angle produced relatively low values. However, the difference between the 36° and 43° configurations was limited, indicating that both scenarios provided a relatively favorable hydrothermal suitability for early plant establishment. Combined with the soil-temperature and soil-moisture contour maps, the hydrothermal-affected zone under the 36° tilt angle had good horizontal extension, while the 43° tilt angle also maintained relatively continuous hydrothermal regulation. In contrast, the hydrothermal improvement region under the 50° tilt angle was more localized.
Accordingly, the CGI should be interpreted as a model-based hydrothermal suitability indicator rather than as a direct predictor of plant height, biomass, or long-term restoration performance. It represents the relative closeness of the simulated soil temperature–moisture combination to the species-specific suitable ranges.
From an engineering application perspective, the small difference between 36° and 43° still has practical significance. It suggests that, under similar latitude and climatic conditions, both a lower tilt angle and a tilt angle close to the local latitude may have ecological utilization potential. In actual PV deployment, tilt-angle selection should also consider power generation efficiency, support structure, dust-cleaning and maintenance, land use, wind load, and ecological benefits. Therefore, the 36° and 43° configurations should be regarded as priority scenarios for subsequent continuous-angle simulation and field validation rather than as a confirmed optimum or optimal tilt-angle interval.
4.4. Comparison with International PV Microenvironment Research and Conditions for Transferability
Previous studies on agrivoltaic systems, desert PV power stations, and large-scale PV arrays have shown that PV panels can reduce surface radiation input through shading, change near-surface wind speed, regulate soil temperature and moisture, and improve plant growth environments under certain conditions [
30,
31]. The results of this study are consistent with these studies in terms of the underlying mechanism: PV panels are not only power-generation facilities, but also surface-covering and aerodynamic structures that participate in local microenvironmental regulation. The difference is that the study object here is not ordinary farmland or natural grassland, but an ash storage yard of a coal-fired power plant, which has special characteristics in substrate water-retention capacity, surface stability, and wind-erosion sensitivity.
Therefore, the PV–soil hydrothermal–plant suitability evaluation framework proposed in this study has a certain degree of transferability, but it cannot be directly applied to all regions without adjustment. If this framework is applied to other arid or semi-arid degraded industrial sites, such as mine dumps, tailings ponds, coal-mining subsidence areas, or industrial solid-waste disposal sites, the model parameters should be reset according to local climate conditions, substrate type, soil hydraulic parameters, plant tolerance ranges, and PV-array structure. In humid or temperate regions, the soil water deficit may not be the main limiting factor. Instead, reduced light and lower soil temperature caused by shading may become the primary influencing factors [
32]. Therefore, when applying this framework in different climatic regions, evaluation factor weights should be recalibrated, and indicators such as light conditions, soil aeration, salinity, and drainage should be added.
In addition, the chemical properties of ash storage yard substrates may have important effects on plant growth. This study mainly focused on physical microenvironmental factors, including soil temperature, soil moisture, and near-surface wind speed, and did not systematically analyze the pH, electrical conductivity, heavy-metal content, salinity, organic matter, and nutrient status of the ash-yard substrate. Therefore, when applying this model to other solid-waste sites, plant growth suitability should not be judged only based on hydrothermal conditions. Substrate chemical risks and plant tolerance should also be considered in an integrated evaluation.
From a sustainable land-use perspective, the principal value of the proposed framework lies in treating degraded industrial land as a multifunctional system rather than as a single-purpose waste-disposal area. Its transferability, therefore, depends not only on reproducing hydrothermal responses but also on whether local PV deployment can maintain renewable-energy production while supporting site-appropriate vegetation establishment and avoiding additional ecological risks associated with the substrate.
4.5. Photovoltaic Performance and Ecological–Energy Trade-Off Under Different Tilt Angles
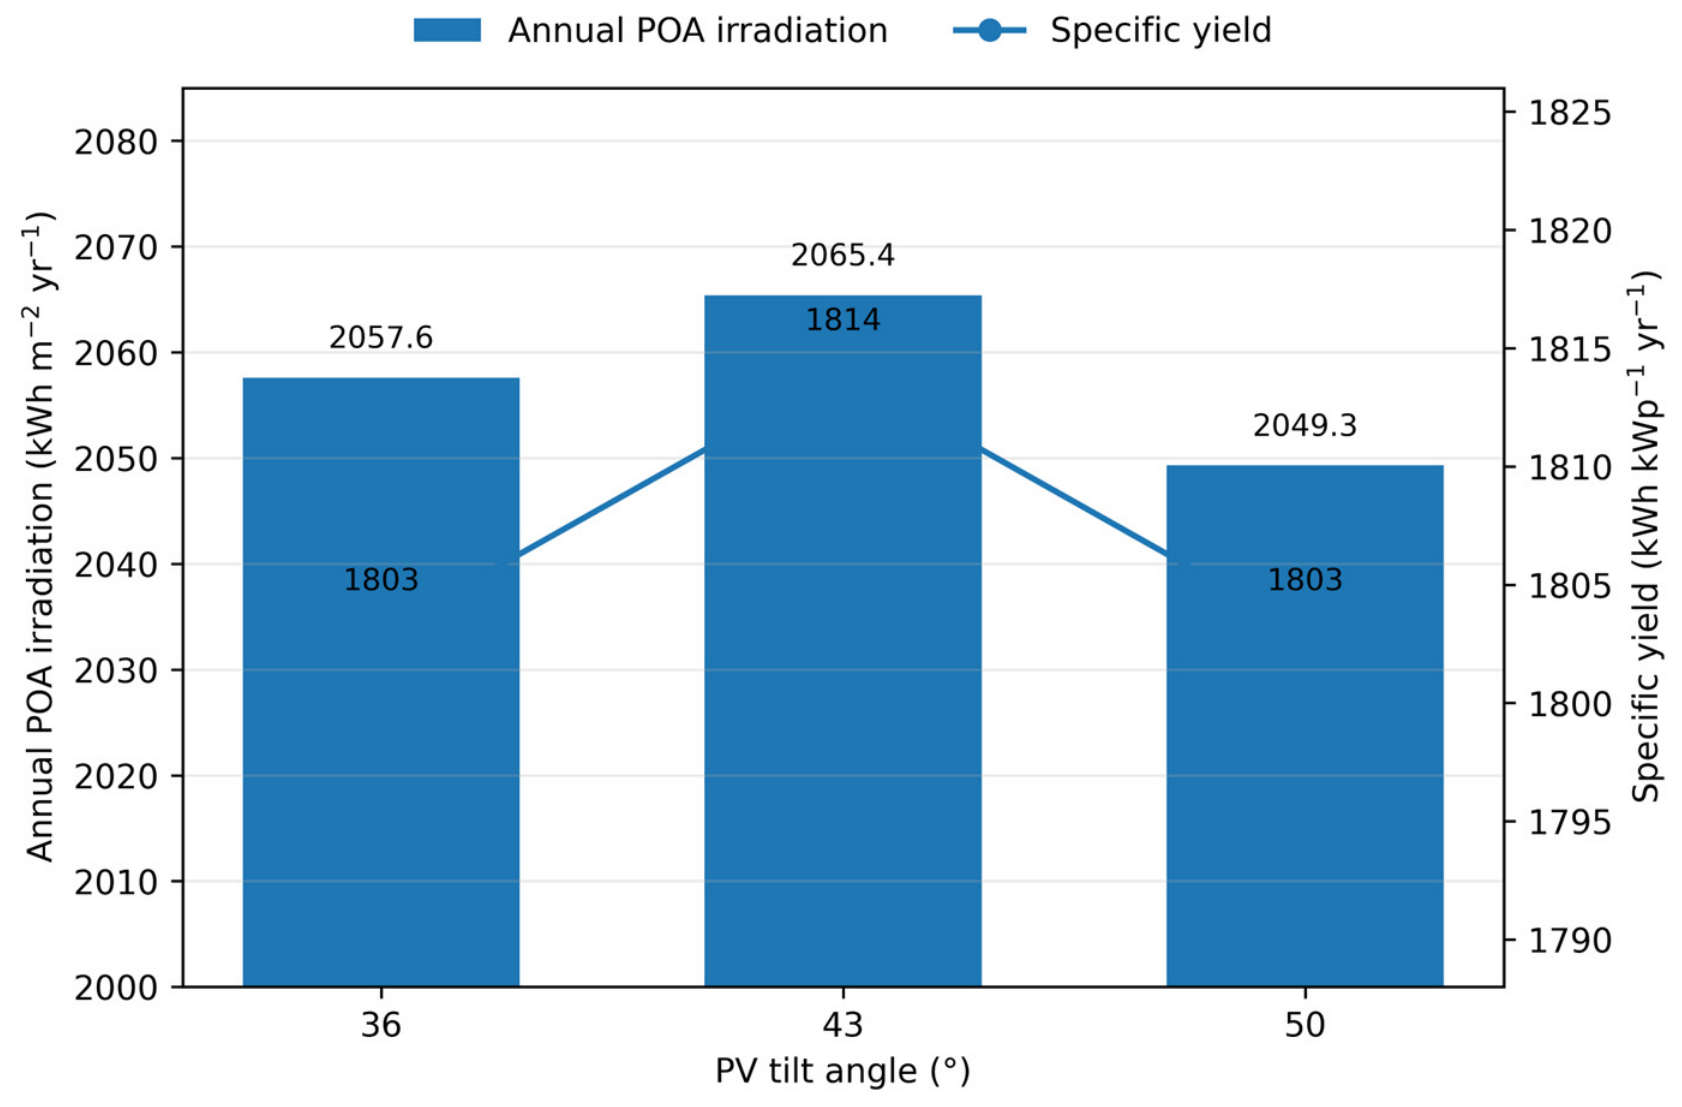
The PVsyst-based annual photovoltaic performance estimates for the three discrete tilt-angle configurations are presented in
Table 7 and
Figure 9. The 43° configuration exhibited the highest annual plane-of-array irradiation of 2065.4 kWh m
−2 year
−1, with an estimated annual grid-connected energy output of 5441.4 kWh year
−1 and a specific yield of 1814 kWh kWp
−1 year
−1. Therefore, within the three evaluated discrete configurations, 43° provided the highest annual solar-radiation interception and photovoltaic energy yield.
At 36°, the annual plane-of-array irradiation, grid-connected energy output, and specific energy yield were 2057.6 kWh m−2 year−1, 5409.2 kWh year−1, and 1803 kWh kWp−1 year−1, respectively. Compared with the 43° configuration, the annual grid-connected energy output decreased by only 32.2 kWh, corresponding to approximately 0.59%.
At 50°, the annual plane-of-array irradiation was 2049.3 kWh m−2 year−1, and the grid-connected energy output was 5410.1 kWh year−1, approximately 0.58% lower than that at 43°. The maximum difference in annual energy output among the three configurations was below 1%, indicating that the influence of tilt angle on annual electricity generation was relatively limited within the evaluated range.
The 50° configuration exhibited the highest PR of 88.00%, although it did not produce the highest absolute energy output. PR describes the system conversion performance relative to the available incident solar resource and should, therefore, not be interpreted independently as an indicator of maximum annual electricity generation.
When interpreted together with the CGI assessment, the PVsyst results indicate that 43° produced the highest annual photovoltaic energy yield, whereas 36° exhibited the highest hydrothermal suitability for early plant establishment among the three tested scenarios. Because the estimated annual grid-connected energy penalty at 36° relative to 43° was only 0.59%, the 36° configuration may be regarded as a favorable ecology–energy compromise under the present site conditions and within the evaluated discrete tilt-angle range. However, this conclusion should be interpreted as a scenario-based trade-off assessment rather than as a formal multi-objective optimum because only three discrete tilt-angle configurations were compared and tilt-dependent soiling, module-temperature differences, long-term operation and maintenance costs, and continuous-angle optimization were not explicitly evaluated.
From an economic perspective, the annual energy-output differences among the three tested configurations were relatively small. For the standardized 3.0 kWp system, the annual grid-connected outputs at 36° and 50° were only 32.2 and 31.3 kWh year−1 lower than that at 43°, respectively. Therefore, selecting the 36° configuration to obtain broader hydrothermal regulation and higher early-vegetation suitability would not involve a substantial annual energy-yield penalty within the evaluated scenarios. This result is important because the ecological function of PV deployment should be achieved while maintaining its primary electricity-generation role, rather than treating PV panels solely as shading structures. Nevertheless, the present comparison concerns the annual energy yield rather than instantaneous output power, and it does not constitute a complete economic assessment because electricity tariffs, capital costs, tilt-dependent soiling, module-temperature effects, and long-term operation and maintenance costs were not included.
Under the 2025 market-oriented electricity-pricing reform for the Western Inner Mongolia power grid, which includes Ordos, renewable electricity is generally traded through the electricity market rather than settled at a single fixed feed-in tariff [
33]. For an illustrative sensitivity analysis, the mechanism price of RMB 0.2829 kWh
−1, applicable to eligible mechanism electricity from certain existing projects, was used as a reference benchmark. At this benchmark, the annual electricity-value differences corresponding to the 32.2 and 31.3 kWh output gaps between the 43° configuration and the 36° and 50° configurations were approximately RMB 9.1 and RMB 8.9, respectively, for the standardized 3.0 kWp system. This first-order comparison further indicates that selecting the 36° configuration for broader hydrothermal regulation would involve only a limited potential loss in annual electricity revenue relative to the 43° configuration. However, actual project revenue would depend on market-clearing prices, settlement arrangements, electricity curtailment, green-certificate income, and operation and maintenance costs.
From a sustainability perspective, the PVsyst and indicative revenue comparisons show that the configuration with the highest ecological suitability does not necessarily coincide with the configuration with the highest photovoltaic energy yield, while the corresponding annual energy and revenue differences may remain limited. Such scenario-based evidence can support site-specific decisions that balance renewable-energy performance, degraded-land rehabilitation, and early vegetation establishment rather than maximizing a single indicator.
4.6. Research Limitations and Future Applications
First, field monitoring covered only one growing season. Therefore, the observations mainly represent short-term soil hydrothermal regulation and early vegetation-establishment responses and cannot be used to evaluate multi-year soil improvement, vegetation-community succession, or long-term ecosystem stability. Second, model validation was restricted to the period from 14:00 to 15:00 on three consecutive sunny days, with 12 paired simulated and measured values for each tilt-angle scenario. Although the relatively low errors support the model’s ability to reproduce short-term afternoon warming and moisture-depletion trends, they do not establish predictive capability across complete diurnal cycles, contrasting meteorological conditions, or seasonal periods. Third, only three representative fixed tilt angles of 36°, 43°, and 50° were evaluated. Consequently, the results provide a scenario-based comparison and cannot identify a mathematical optimum or an optimal tilt-angle interval.
Fourth, field vegetation responses were evaluated primarily using plant height, whereas aboveground and belowground biomass, root morphology, vegetation coverage, survival rate, leaf area index, and community diversity were not systematically measured. In addition, the CGI was derived only from soil-temperature and soil-moisture suitability and was not statistically calibrated against measured plant-performance variables. It should, therefore, be interpreted as an indicator of hydrothermal suitability for early plant establishment rather than as a measure of long-term vegetation restoration. Fifth, validated soil-surface evaporation and atmospheric water-vapor fluxes were not directly available from the present model outputs. Consequently, the reported net soil-water-content changes represent differences between selected simulated moisture states rather than measured evaporation rates or water-vapor fluxes.
Sixth, the PVsyst assessment provided a standardized first-order estimate of annual plane-of-array irradiation and photovoltaic energy yield rather than measured power-generation performance. Tilt-dependent module temperature, soiling accumulation, row-to-row shading, long-term module degradation, equipment downtime, grid curtailment, and operation and maintenance costs were not explicitly evaluated. Moreover, only three discrete tilt-angle scenarios were compared, and no calibrated weighting relationship was established between photovoltaic energy output and ecological suitability. Therefore, the present ecological–energy comparison should be regarded as a scenario-based trade-off assessment rather than as a formal continuous multi-objective or Pareto optimization. The present study should not be interpreted as a complete sustainability assessment because life-cycle environmental impacts, resource inputs during construction and maintenance, economic costs, land-use efficiency, and long-term ecological performance were not quantitatively evaluated. These dimensions should be incorporated into future multi-criteria assessments before recommendations for full-scale deployment are made.
Future research should be expanded in three aspects. First, multi-year, multi-site, and multi-plant continuous monitoring should be carried out to test the applicability of this evaluation framework in different climatic regions and different degraded industrial sites. Second, wind speed, radiation, soil salinity, substrate chemical properties, and plant biomass should be incorporated into the comprehensive evaluation system to improve the explanatory ability of the model for real ecological processes. Third, measured photovoltaic energy output, module temperature, tilt-dependent soiling, operation and maintenance costs, energy-storage configuration, and ecological benefits should be jointly incorporated into a calibrated multi-objective framework [
34]. Continuous-angle simulation and Pareto-based analysis would then help identify engineering configurations that more effectively balance power generation, land restoration, wind-erosion mitigation, and early plant establishment.
From an application perspective, the results of this study suggest that plants suitable for PV shading systems should have certain drought tolerance, barren-soil tolerance, and adaptability to semi-shaded environments. Alfalfa and Elymus nutans showed certain early growth responses in this study, but more native herbs, nitrogen-fixing plants, and drought-tolerant plants suitable for degraded industrial sites should be screened in the future. In terms of PV design, the focus should not be limited to maximizing shading or maximizing radiation reception. Instead, the tilt angle, panel spacing, ground clearance, and array orientation should be coordinately optimized according to the ecological limiting factors of the target site.
5. Conclusions
This study establishes an integrated and site-calibratable framework linking PV deployment geometry with near-surface airflow, soil hydrothermal regulation, hydrothermal suitability for early vegetation establishment, and photovoltaic energy performance in arid and semi-arid degraded industrial sites. By evaluating ecological and energy functions within the same framework, the approach enables PV configurations to be screened according to their capacity to support renewable-energy production and near-surface habitat improvement simultaneously, thereby providing a decision basis for the sustainability-oriented and multifunctional reuse of ash storage yard land.
The three-scenario assessment demonstrates that PV tilt angle acts as an engineering design variable controlling both the spatial extent and local intensity of microenvironmental regulation. Within the tested configurations, the 36° case provided the broadest and most continuous hydrothermal regulation while retaining an estimated annual photovoltaic energy yield within 1% of that obtained at 43°, the energy-maximizing configuration. This result shows that improved conditions for early vegetation establishment can be pursued without a substantial reduction in annual electricity generation. However, the conclusion represents a site-specific comparison among three discrete scenarios and does not define a universally optimal tilt angle or optimal tilt-angle interval.
The proposed framework can support coordinated decisions on PV deployment, degraded-land reuse, and early ecological rehabilitation in ash storage yards and similar industrial sites. Its transfer to other locations requires recalibration according to the local climate, substrate physicochemical and hydraulic properties, plant species, electricity-market conditions, and PV-array characteristics. Future development should integrate continuous-angle analysis, multi-year hydrothermal and vegetation monitoring, biomass- and root-related indicators, measured PV performance, module temperature, soiling losses, and project-level economic parameters to establish a calibrated multi-objective framework balancing the ecological benefits, energy production, and engineering costs.