


Abstract
Educational buildings account for approximately 17% of the building sector’s energy consumption, making them critical for zero-emission building (ZEB) strategies. With students spending over 50% of their time indoors, life-cycle carbon assessments and targeted retrofitting are essential for realizing UN sustainability goals on campuses. This study develops a comprehensive life-cycle carbon assessment framework using a Calibrated Building Energy Simulation to simultaneously evaluate embodied and operational carbon emissions in campus facilities. This research evaluates two distinct university buildings for analysis: a historical 1970 educational building in Cosenza, Italy (Mediterranean climate) and a modern 2009 building in Ankara, Türkiye (semi-arid/continental climate). To minimize the total carbon footprint, seven distinct retrofitting scenarios are systematically simulated and compared: adding photovoltaic (PV) panels, integrating solar films on windows, applying internal and external insulations, implementing green wall applications, applying psychological-adaptive HVAC control and decreasing the heating set-point temperature. Results indicate that psychological-adaptive HVAC control is the most effective, achieving approximately 19.3% operational carbon savings across both cases with a low embodied carbon penalty. Conversely, the green wall application was the least effective, with a carbon payback period of 53.55 years. Ultimately, this study provides actionable engineering pathways for transforming campus buildings into net-zero emission educational facilities.
1. Introduction
The escalating impacts of climate change have made the reduction in greenhouse gas (GHG) emissions a critical global priority. Currently, the building and construction sector is one of the primary contributors to this environmental crisis, accounting for nearly 40% of global energy consumption and approximately one-third of total carbon dioxide (CO2) emissions [1,2]. Consequently, transforming the built environment into zero-emission buildings (ZEBs) has become an essential strategy for achieving international climate targets, such as the Paris Agreement [3].
Within this global picture, regional dynamics and specific national challenges play a vital role. In developing and rapidly urbanizing countries like Türkiye, the building sector represents a massive portion of the national carbon footprint. Over the past few decades, Türkiye has experienced substantial population growth and urban expansion, leading to a sharp increase in energy demand and CO2 emissions [4,5,6]. To align with international sustainability efforts, Türkiye has established a net-zero emission target by 2053. Achieving this ambitious goal requires urgent and effective decarbonization policies, particularly focusing on the country’s expanding building stock [7].
Similarly, in the European context, countries like Italy face their own distinct challenges. While Türkiye must manage the energy demands of relatively modern and rapidly constructed buildings, European nations often struggle with historically old and energy-inefficient infrastructures. Guided by the European Green Deal [8], which aims for climate neutrality by 2050, countries must implement retrofitting strategies to modernize their old buildings by renovating in an energy- and resource-efficient way [9]. Therefore, understanding how different climates, construction eras, and regional policies affect carbon emissions is fundamental to developing global solutions [9].
Within the broader context of urban decarbonization, educational facilities, such as particularly university campuses, represent a unique and highly impactful sub-sector. Due to their complex infrastructures, diverse building typologies, and continuous operational schedules, university campuses are inherently energy-intensive environments [10,11]. Because these institutions function almost like small cities, they are critical targets for advancing ZEB strategies. Furthermore, higher education institutions have a fundamental responsibility to act as “living laboratories” [12]. By implementing cutting-edge energy policies and carbon assessment frameworks, universities not only reduce their substantial institutional carbon footprint but also play a pioneering role in driving the United Nations’ Sustainable Development Goals (SDGs) [13].
However, the transition toward net-zero campuses cannot be driven solely by energy and carbon reduction metrics; it must also prioritize the well-being and productivity of the occupants. Statistics highlight that students spend more than 50% of their time within university interior spaces, such as lecture halls, libraries, and laboratories [14]. Consequently, maintaining optimal thermal comfort is essential, as indoor environmental quality directly influences students’ cognitive performance, health, and overall learning efficiency [15,16]. Therefore, identifying and implementing targeted retrofitting technologies requires a multidimensional approach: institutional carbon footprints must be minimized without compromising the thermal comfort of the students.
Despite the growing emphasis on decarbonization, the majority of existing retrofitting strategies have predominantly focused on minimizing operational carbon such as the emissions associated with the daily energy consumption for heating, cooling, and lighting [17,18,19]. While reducing operational energy is crucial, this singular focus often overlooks a hidden but equally significant contributor to a building’s total footprint: embodied carbon. Embodied carbon encompasses the greenhouse gas emissions generated throughout the entire life-cycle of construction and retrofitting materials, including raw material extraction, manufacturing, transportation, and installation [20,21]. As building operations become more energy-efficient, the proportion of embodied carbon relative to total life-cycle emissions increases dramatically. This dynamic creates a complex and critical trade-off in the pursuit of zero-emission buildings. Implementing advanced retrofitting measures, such as adding photovoltaic (PV) panels, integrating solar films, or applying extensive internal and external insulation, can substantially decrease operational energy demand [22,23]. However, these technologies require significant upfront carbon investments [24]. If the embodied carbon of a retrofitting material outweighs its operational carbon savings over its lifespan, the intervention may inadvertently increase the building’s overall environmental impact [25,26,27]. While life-cycle carbon assessment (LCCA) is a widely used method [28,29], there is still a need for more studies that evaluate embodied and operational carbon together within the same framework. Moreover, this balance is not often compared across buildings from different time periods and different climate zones. Since a building’s age and its local climate play a major role in how well retrofitting works, exploring this area can provide very useful insights for future energy strategies.
To address these complex challenges, Building Energy Simulation (BES) technology has emerged as a highly effective tool [30,31]. The BES is essentially a virtual replica of a physical building. It allows researchers to simulate, monitor, and analyze a building’s performance under various conditions without making any physical changes [30,31]. In the context of the LCCA, dynamic Building Energy Simulation tools provide a great advantage since they make it possible to dynamically calculate both operational energy consumption and embodied carbon emissions at the same time [32].
Moreover, the BES allows for the systematic testing of multiple scenarios to find the best balance between carbon reduction and human comfort. By using virtual models, engineers can easily compare active systems, such as psychological-adaptive HVAC controls and decreasing heating set-points, with material-based passive strategies like adding insulation, solar films on windows, or green walls. This simulation-based approach is crucial for finding the most effective ways to lower a building’s total carbon footprint while keeping the indoor environment comfortable for students.
To address the gaps mentioned above, this paper aims to develop a comprehensive life-cycle carbon assessment framework driven by a calibrated BES approach. The primary goal is to simultaneously evaluate and balance embodied and operational carbon emissions in campus facilities without compromising students’ thermal comfort. To understand how a building’s age and its local climate dictate retrofitting priorities, two distinct university buildings are selected as case studies for a cross-generational and cross-climate comparative analysis: an older educational building constructed in 1970 at the University of Calabria in Cosenza, Italy (Mediterranean climate), and a modern educational building constructed in 2009 in Ankara, Türkiye (semi-arid/continental climate).
To minimize the total carbon footprint, seven distinct retrofitting scenarios are systematically simulated and compared using the calibrated BES models. These scenarios include adding PV panels, integrating solar films into windows, applying internal and external insulation, implementing green wall applications, using psychological-adaptive HVAC control, and decreasing the heating set-point temperature. By revealing the delicate trade-off between the embodied carbon invested in these materials and the resulting operational carbon savings, this study ultimately provides actionable engineering and policy pathways. The findings aim to guide decision-makers in successfully transforming both historical and modern university building stocks into net-zero emission educational facilities.
2. Materials and Methods
This study develops a calibrated BES-driven framework to systematically balance and evaluate both embodied and operational carbon emissions in university buildings across different chronological eras and climate zones. The proposed multi-stage methodology combines high-fidelity BES tools, continuous microclimate monitoring for calibration, and life-cycle assessment (LCA) data to navigate the trade-offs between material production carbon (embodied carbon emissions) and building use-phase carbon (operational carbon emissions).
Case Study Zones and Climate Characteristics
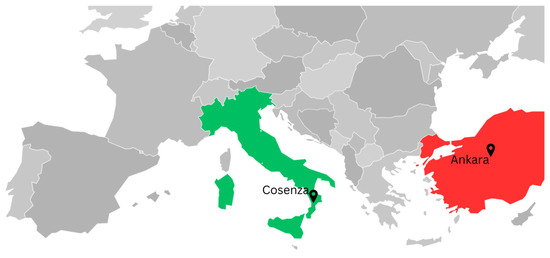
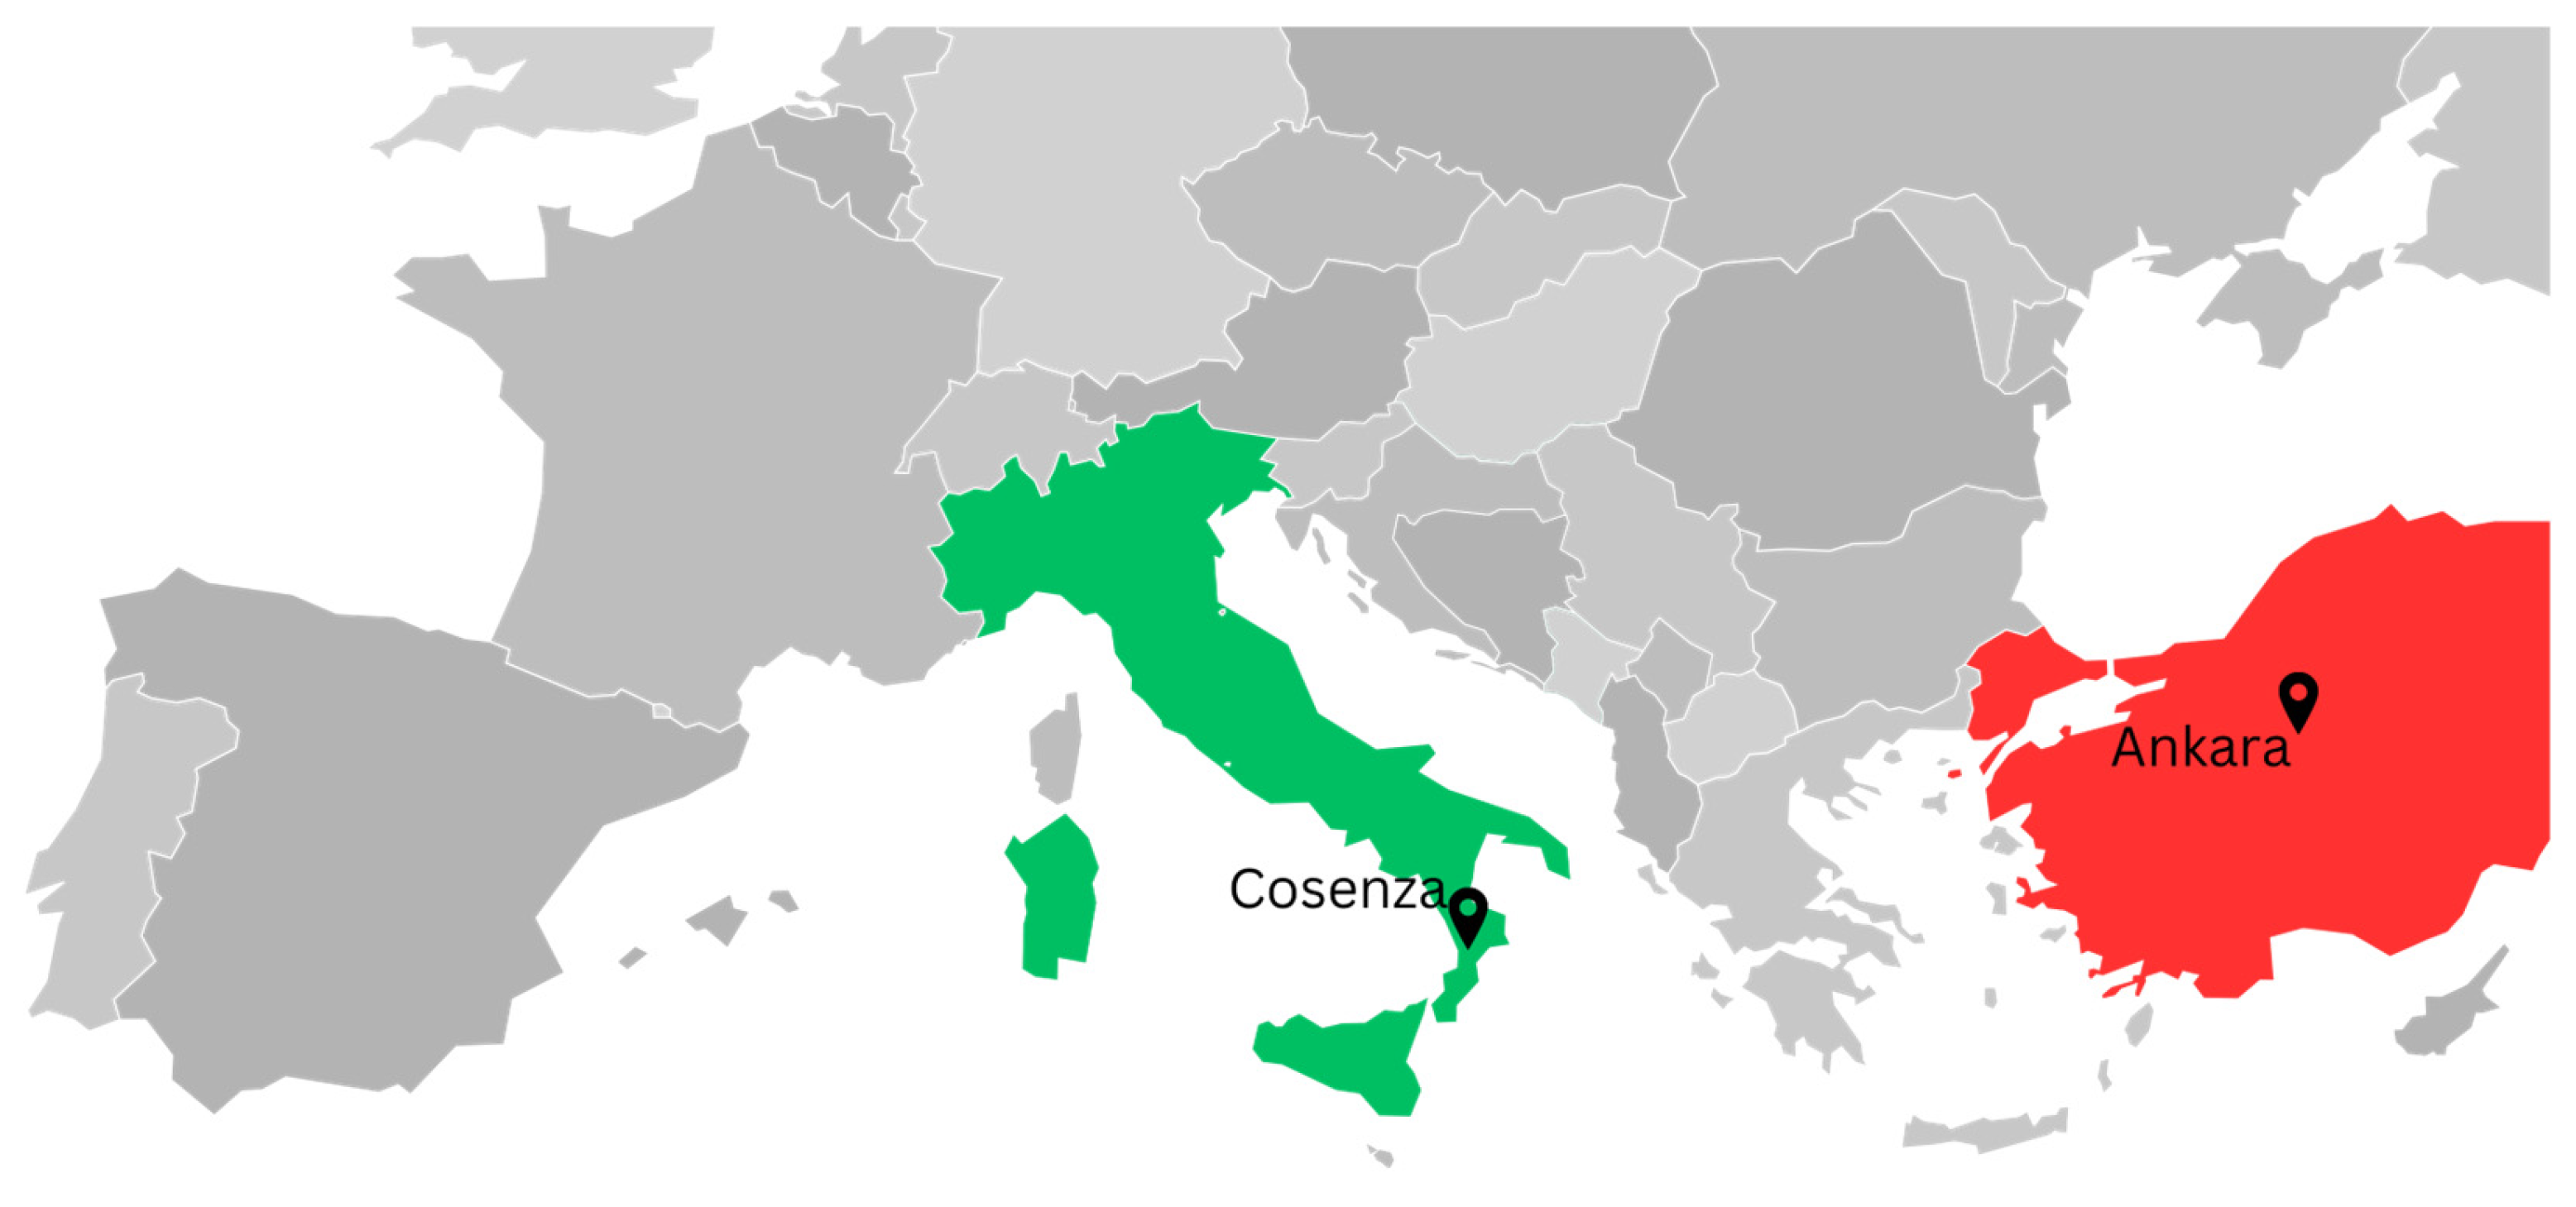
Two distinct university buildings from Italy and Türkiye were selected as case studies to investigate cross-generational and cross-climate carbon trade-offs. This dual-case approach allows for a comprehensive comparative analysis to understand how structural age, distinct construction eras, and regional climate zones dictate retrofitting priorities and balance embodied versus operational carbon emissions. The building in Türkiye (will be referred to as Case T in this study) is located in Ankara, Türkiye, while the building in Italy (will be referred to as Case I in this study) is located in Cosenza, Italy (Figure 1). Ankara is the capital city of Türkiye in a Dsa type climate zone (the university location), while Cosenza is located in the Calabria region with a Csa type climate zone according to Köppen–Geiger climate classification [33].
Figure 1.
Location of the case buildings, Case T (left) and Case I (right).
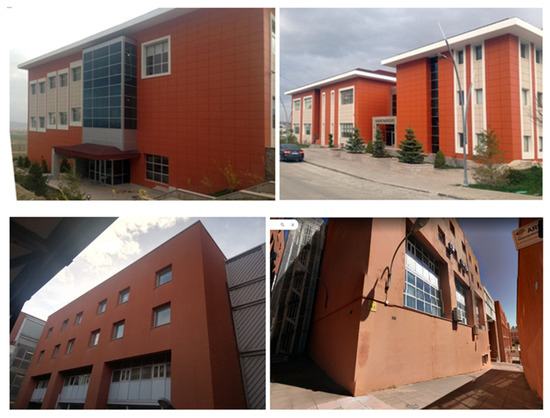
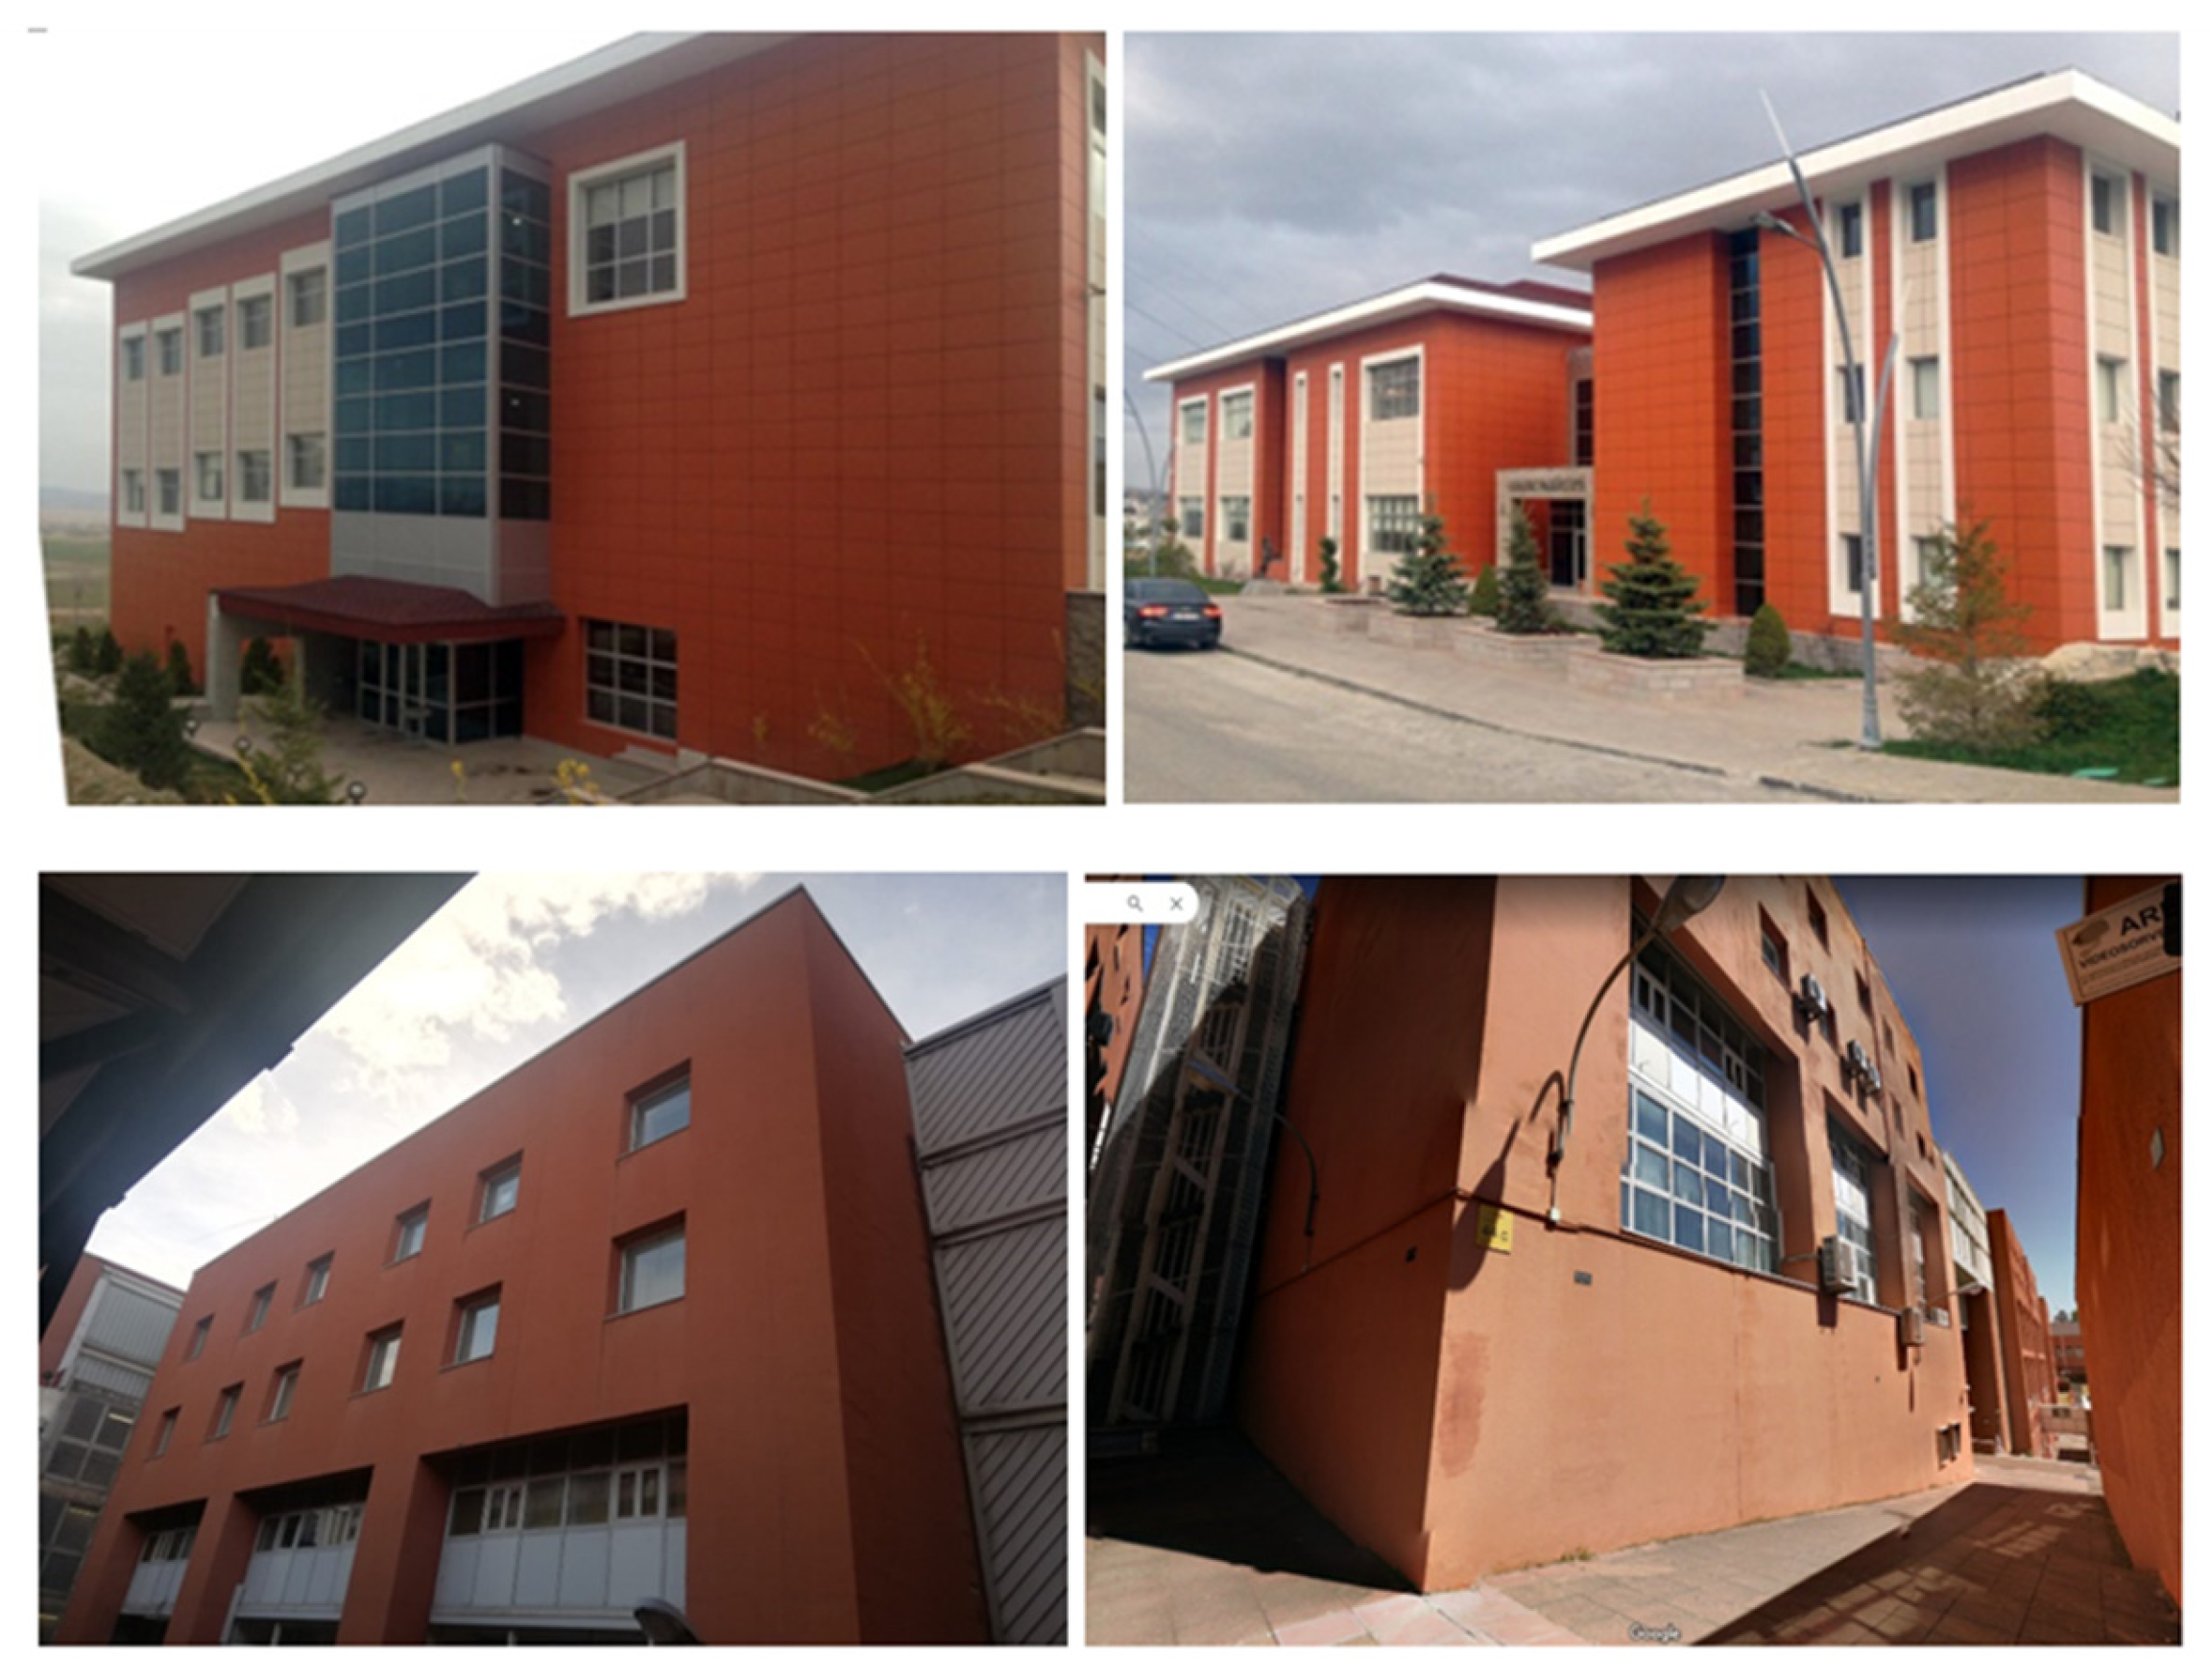
The annual average temperature is around 12 °C and 14.3 °C for Ankara and Cosenza, respectively [34,35]. Ankara has a temperate climate with cold and dry winters and hot and dry summers. On the other hand, Cosenza boasts a temperate climate with mild and quite rainy winters, while the city has hot and sunny summers. The heating period is selected from November to May, while the cooling period is from May to October for both cities. The Faculty of Law building at the University of Ankara, Türkiye, is selected as a case educational building for this study (Case T). The building was built in 2009 with a total area of the building of 13,572 m2, which hosts 1389 active students (Figure 2). The building not only has the expected academic functions involving classrooms and offices, but also a conference hall, a library with studio space, student clubs with workshops, and a cafeteria with a dining hall with seemingly erratic occupant schedules. The heating system is obtained via natural gas, which heats water in a boiler. The set-point temperature is constant during winter with a value of 22 °C. The cooling and ventilation are manual in the building, by opening doors and windows, since there is no mechanical cooling system in the university. Windows are double-glazed with a U value of 2.66 W/m2K, while the U value of the walls is 2.41 W/m2K. Walls include plaster, XPS insulation material, and concrete block and cement board with a thickness of 0.02, 0.05, 0.2 and 0.012 m, respectively. The building is occupied from 07:30 am to 18:00 p.m. during weekdays. However, the operation of the heating system is 24/7 since there is always security in the building. The air-tightness of the building is obtained as 0.7 ac/h from the architectural department of the university.
Figure 2.
Selected case buildings, Case T (upper) and Case I (lower).
A second case study is considered, consisting of the University of Calabria, in the city of Cosenza (Southern Italy). In particular, one of the buildings of the Department of Mechanical, Energy and Management Engineering (Case I) is selected for the analysis (Figure 2). The construction, built in the 1970s, has a cubic shape; it is made of load-bearing reinforced concrete walls and is developed on six levels. On the ground floor, there are storage rooms and laboratories. The first-floor houses three classrooms and a study space, with a capacity of 257 students. On the second floor, there is a meeting room, while the top three floors are intended for offices. The total area of the building is 2337.56 m2, and the surface area of the classrooms is 412.31 m2. Heating is provided via a centralized gas boiler, and the set-point temperature is 20 °C. There is no cooling system for the classrooms. A mechanical ventilation system with a flow rate of 0.011 m3/s per person is present. The infiltration rate is 0.5 ac/h. The windows are double-glazed with a thermal transmittance of 2.72 W/m2K. The external walls have a thickness of 0.516 m and a thermal transmittance of 0.374 W/m2K. The stratigraphy of the external walls includes the following layers from outside to inside: concrete (0.30 m), air gap (0.10 m), mineral fibers (0.09 m), and plasterboard sheets (0.026 m). The building is occupied from 9:00 a.m. to 05:00 p.m. during weekdays, and the heating system is operated during the same hours. Since the aim of this study is to determine the optimal approach for educational buildings, the authors simulate only classrooms of the buildings (2629 m2 and 412.31 m2 for Case T and I, respectively).
3. BES Modeling and Simulations
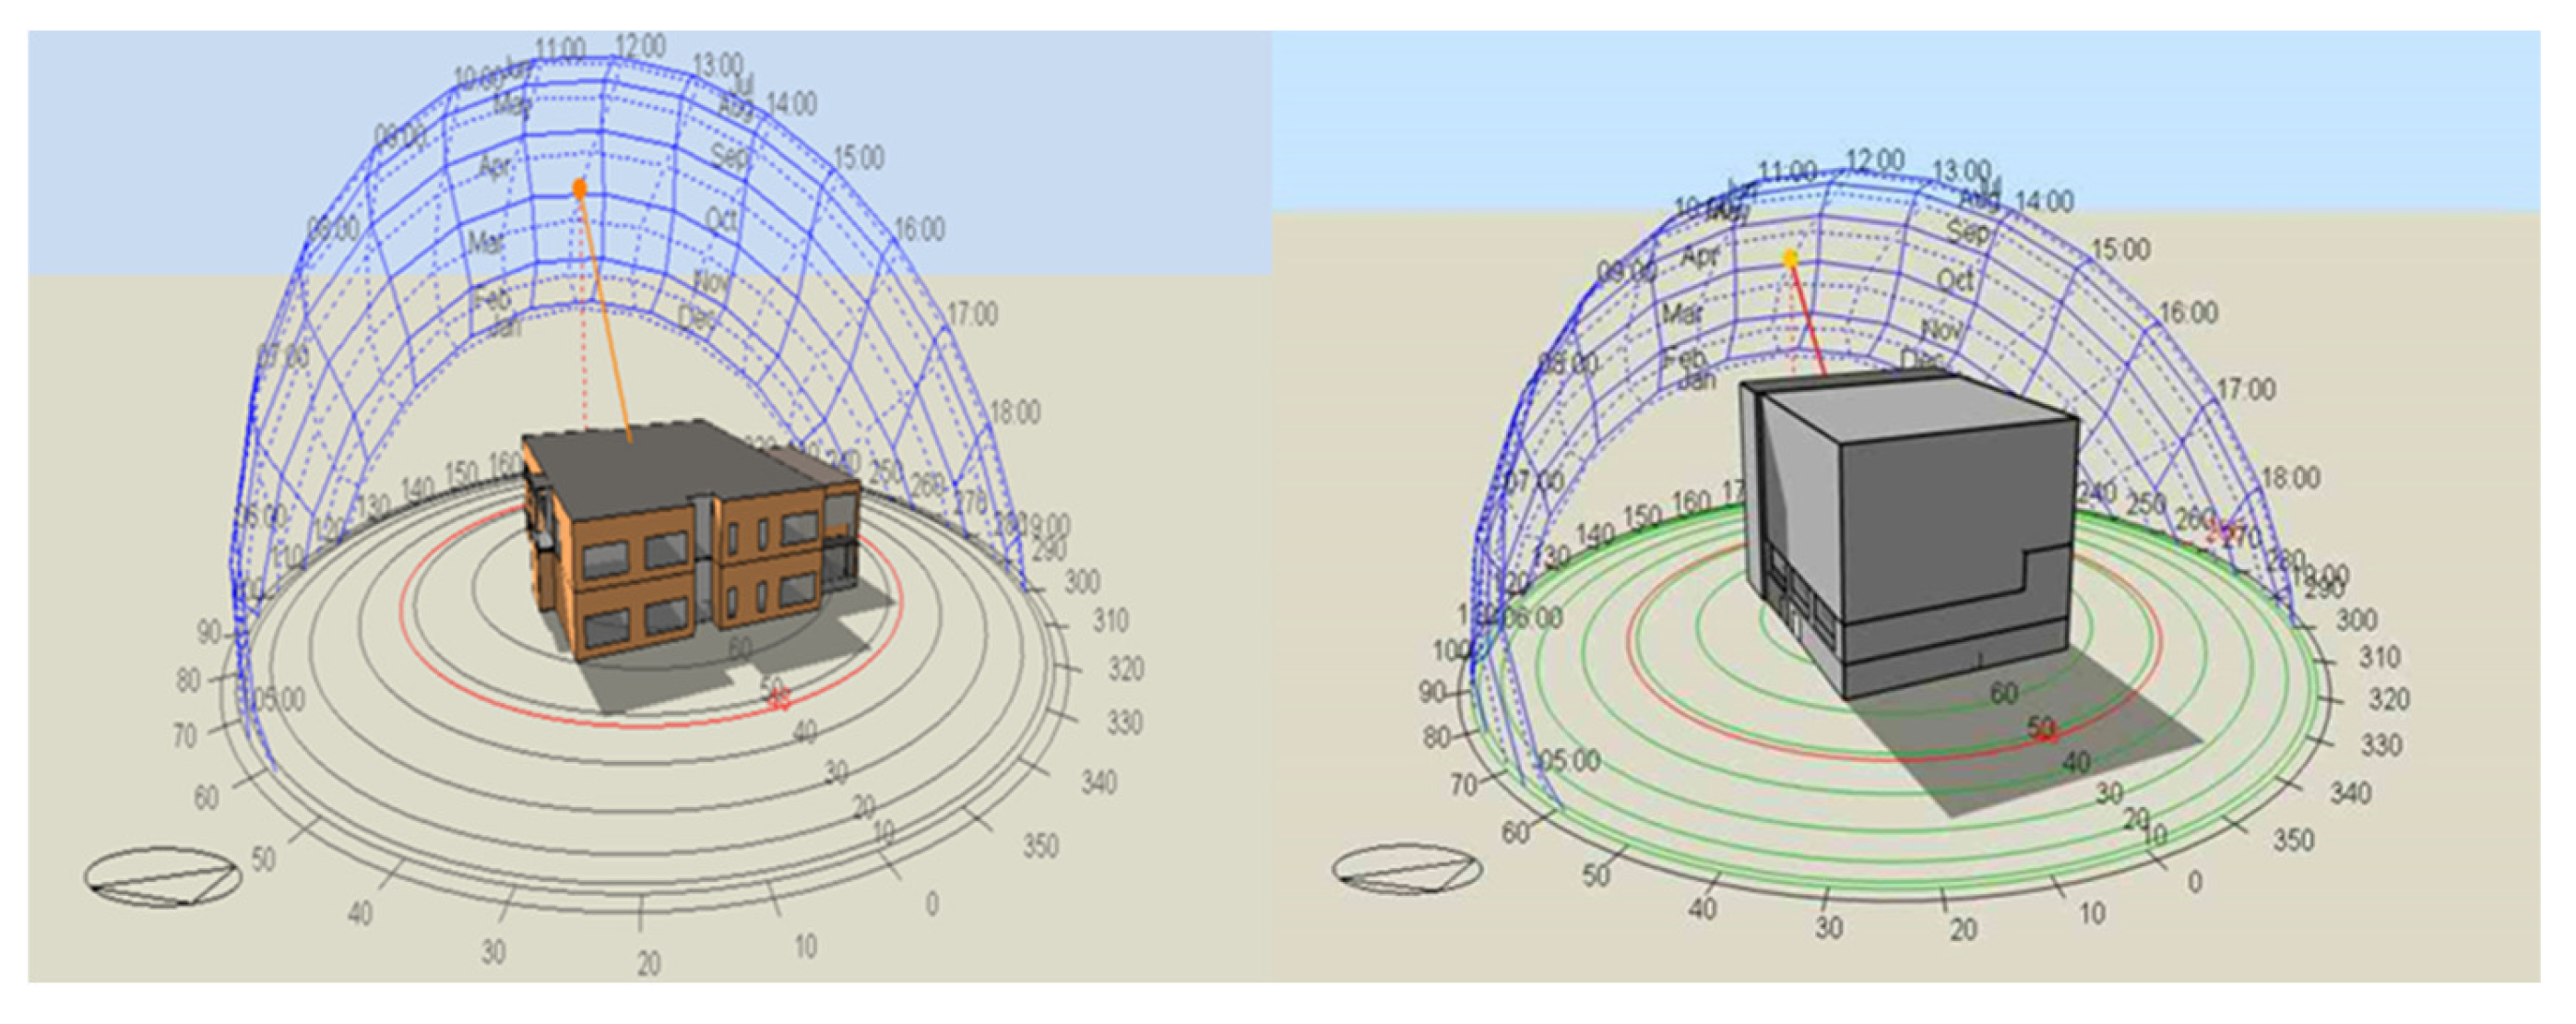
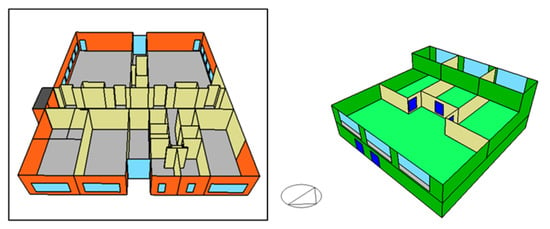
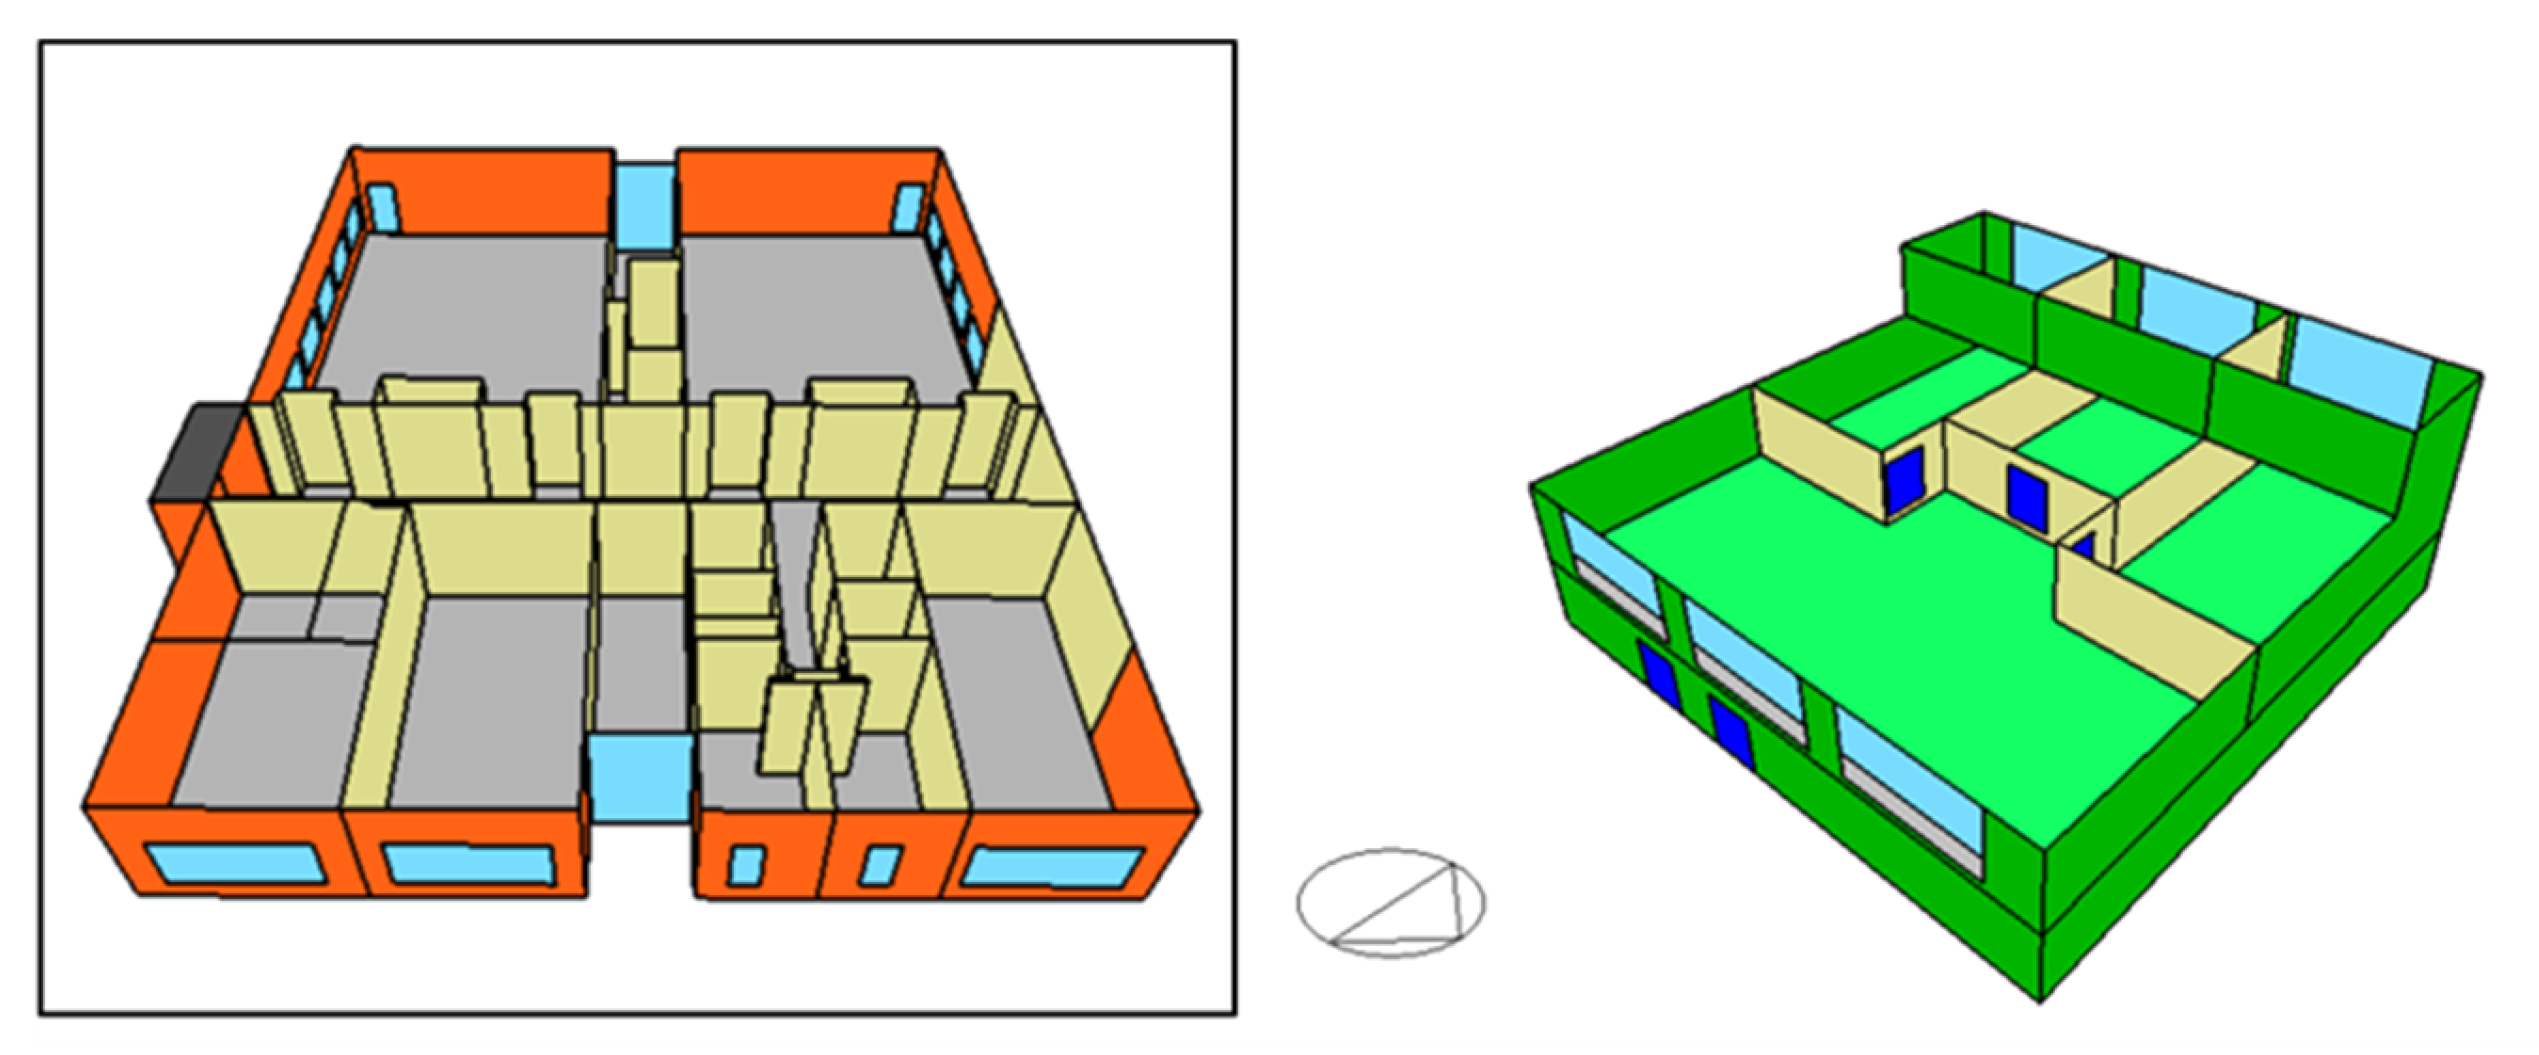
To create dynamic operational carbon profiles, the buildings are simulated in a BES tool called DesignBuilder (v7/v8, DesignBuilder Software Ltd, Stroud, UK) [36]. Input data for the models are obtained from architectural drawings of the case buildings. The existing situation of the building is called the baseline model (Figure 3).
Figure 3.
Energy simulation models of Case T (left) and Case I (right).
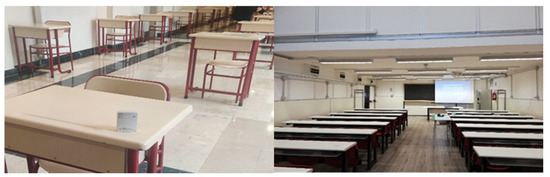
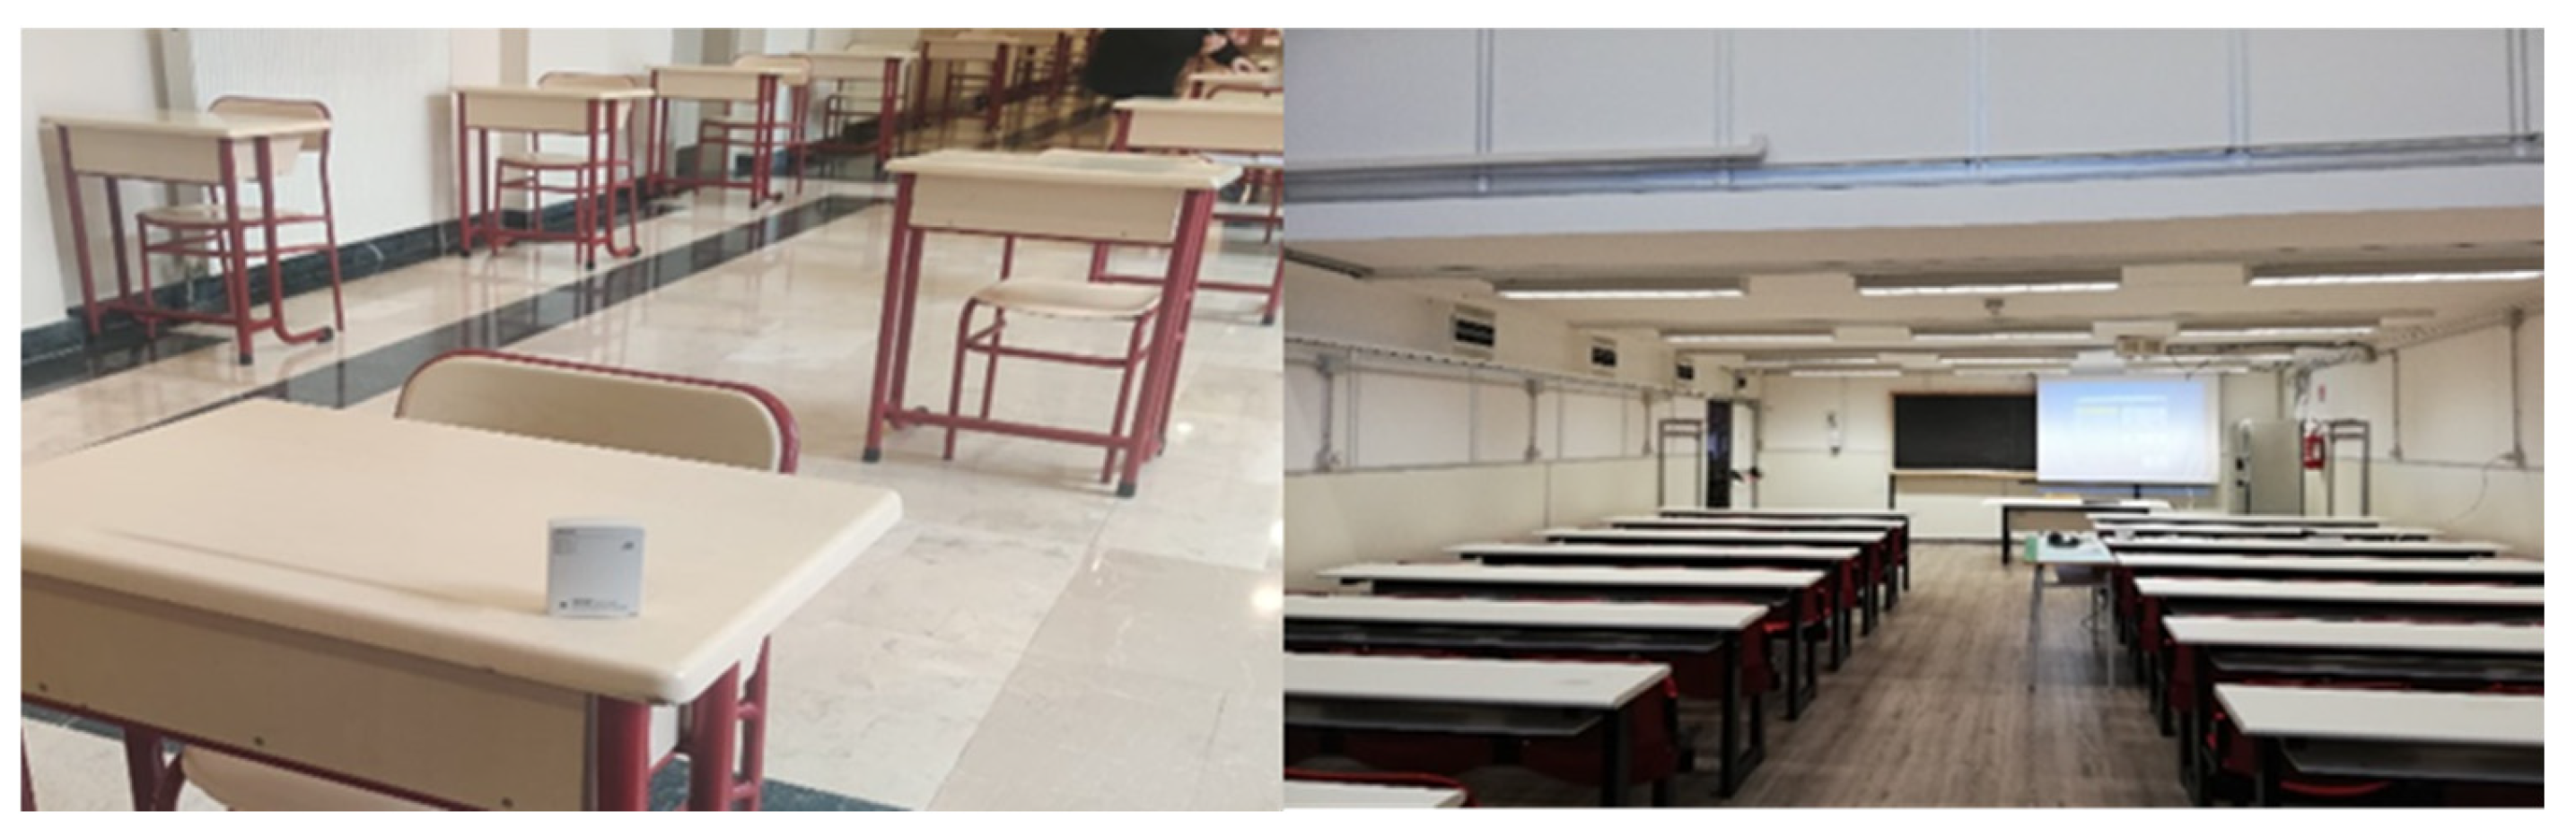
To validate the simulation models, a calibration process is required; thus, the models are calibrated using real measurements. To this end, HOBO sensors, which measure indoor air temperature and relative humidity, are used in the study (Figure 4). After the measurement campaign, the models are calibrated according to the ASHRAE Guideline 14 procedure [37]. Moreover, the outdoor environmental parameters are obtained from meteorological stations of the universities.
Figure 4.
Real measurements for Case T (left) and Case I (right).
4. Carbon-Reduction Retrofit Scenarios
Seven carbon-reduction retrofit scenarios are applied over the baseline model separately. The primary objective of simulating these retrofitting scenarios is to evaluate the resulting energy consumption and quantify the potential reduction in operational carbon emissions achieved under each strategy. These specific retrofit scenarios were selected from current literature to contrast material-heavy physical modifications against zero operational carbon algorithmic strategies across different building vintages and climates. It is vital to note that each retrofitting scenario is applied over the baseline model and simulated after re-modeling. All factors are kept the same in the simulations except the modifications. The general features of the retrofitting strategies are given below.
4.1. Adding PV Panels
In the study, photovoltaic (PV) panels are integrated into the buildings in order to decrease energy consumption, thus reducing CO2 emissions. On a surface of 72.5 m2 and 10.3 m2 for Case T and I, respectively, PV panels are placed on the upper surface of the buildings. The PV panel scheduled efficiency is selected as 0.15. Heat transfer integration mode is used as decoupled mode, where the cell temperature of modules in the array is computed based on an energy balance relative to nominal operating cell conditions method, which has irradiance on the cell surface, air temperature and wind velocity as 800 W/m2, 20 °C and 1 m/s, respectively.
4.2. Integrating Solar Films on Windows
Low emissivity glazing films are applied to all the windows of the buildings (Figure 5). Since the thickness of the solar film is small, its effect on the U value of the total combined glazing system can be omitted. The properties of the solar films are given in Table 1.
Figure 5.
Solar film integration for Case T (left) and Case I (right).
Table 1.
The inputs of the solar film for the energy simulation models.
4.3. Applying Internal and External Insulation
While thermal insulation is essential for reducing building energy consumption [38], evaluating the comparative effectiveness of internal versus external configurations, selecting appropriate insulation materials, and accurately quantifying their life-cycle CO2 emissions present highly complex design challenges. To this end, internal insulation is applied to the case buildings. Rock wool type insulation material, with a 20 cm thickness and density of 60 kg/m3, is applied to the wall surfaces; therefore, the U value of the wall is decreased by 2.2 W/m2K for both Case T and I. The same procedure with internal insulation is applied to the external surface of the case buildings.
4.4. Green Wall Application
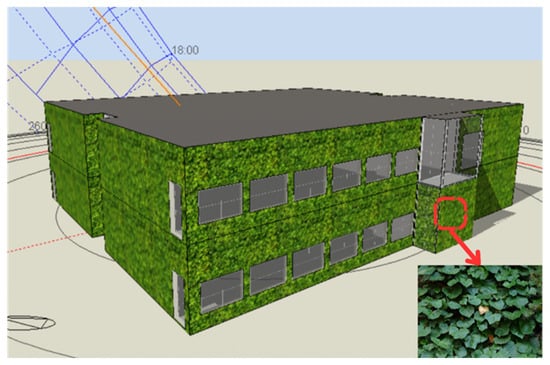
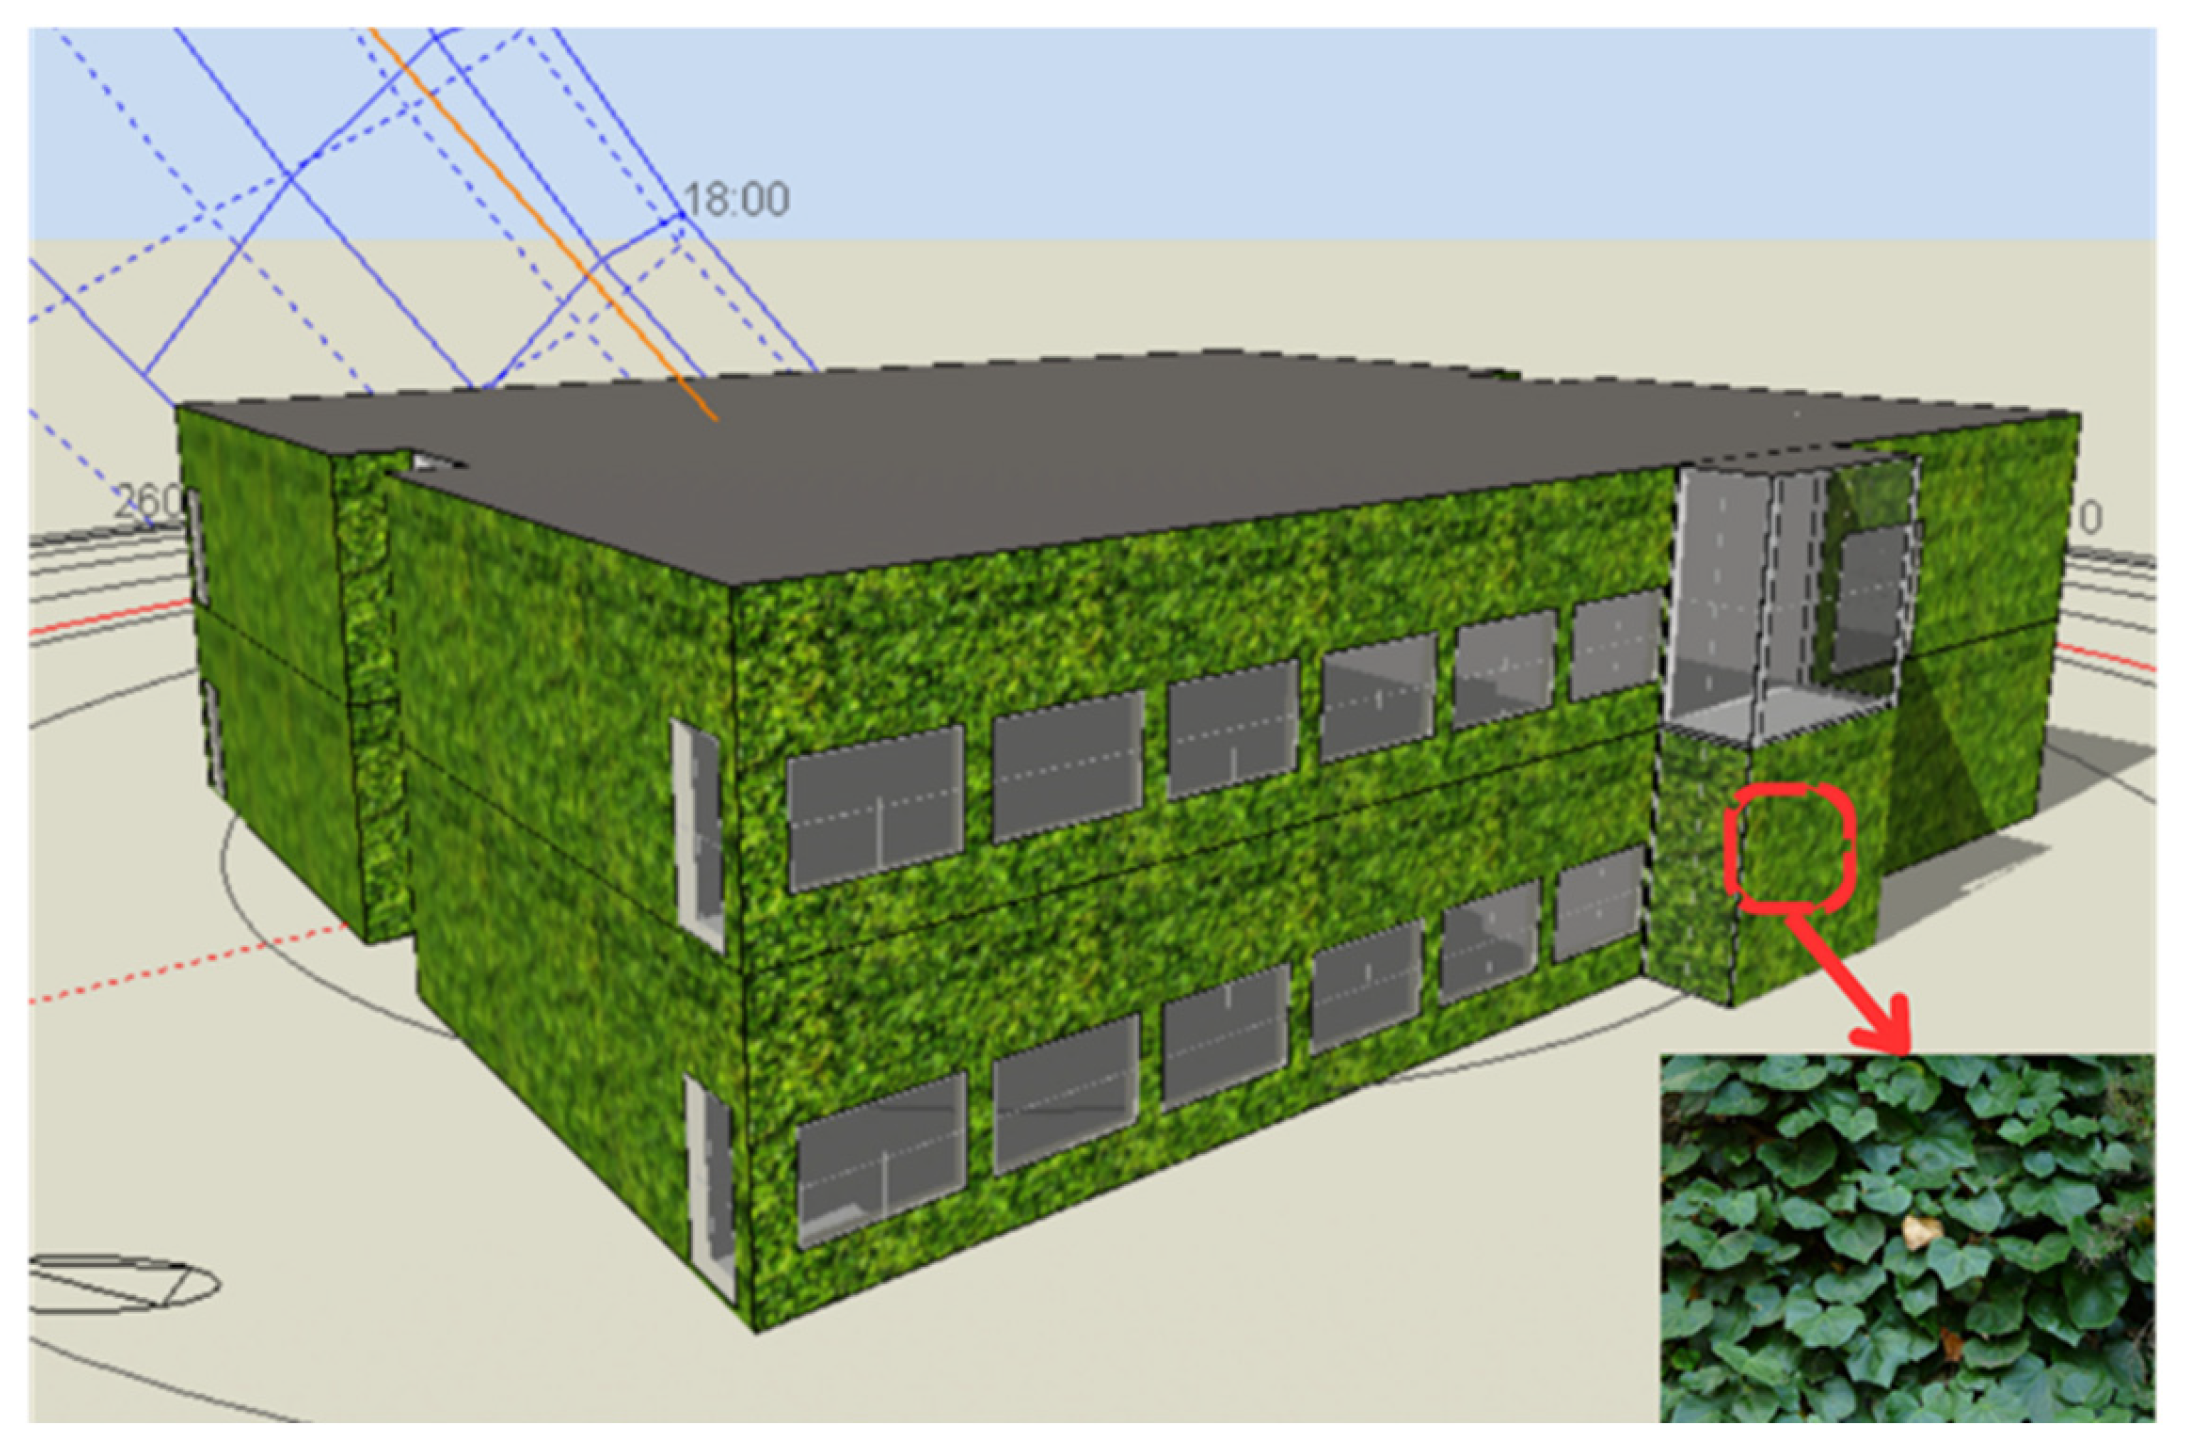
Herath et al. [39] and Turhan et al. [40] indicated that green walls could reduce the wall surface temperature by a maximum of 1.79 °C over a one-year period and reduce cooling energy consumption; therefore, this method can help to decrease heating loads of the buildings. To this aim, a green wall system is applied to the traditional wall system of the existing baseline models (Figure 6). An evergreen plant, Hedera canariensis Gomera, is selected as the plant and coated on all walls. The layers applied over the existing traditional wall and properties of the plant are given in Table 2 and Table 3, respectively.
Figure 6.
Green wall application for Case T as an example.
Table 2.
The extra layers of the green wall application.
Table 3.
Selected plant properties for the study [40].
4.5. Applying Psychological-Adaptive HVAC Control
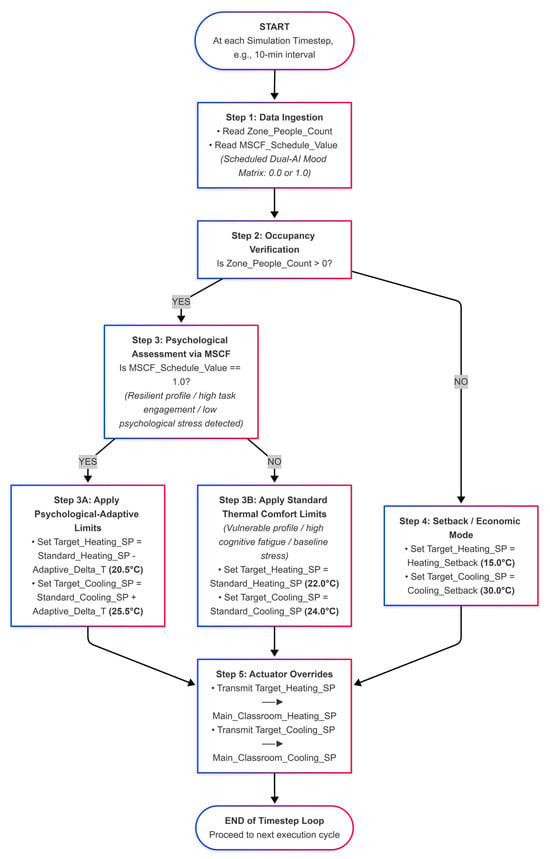
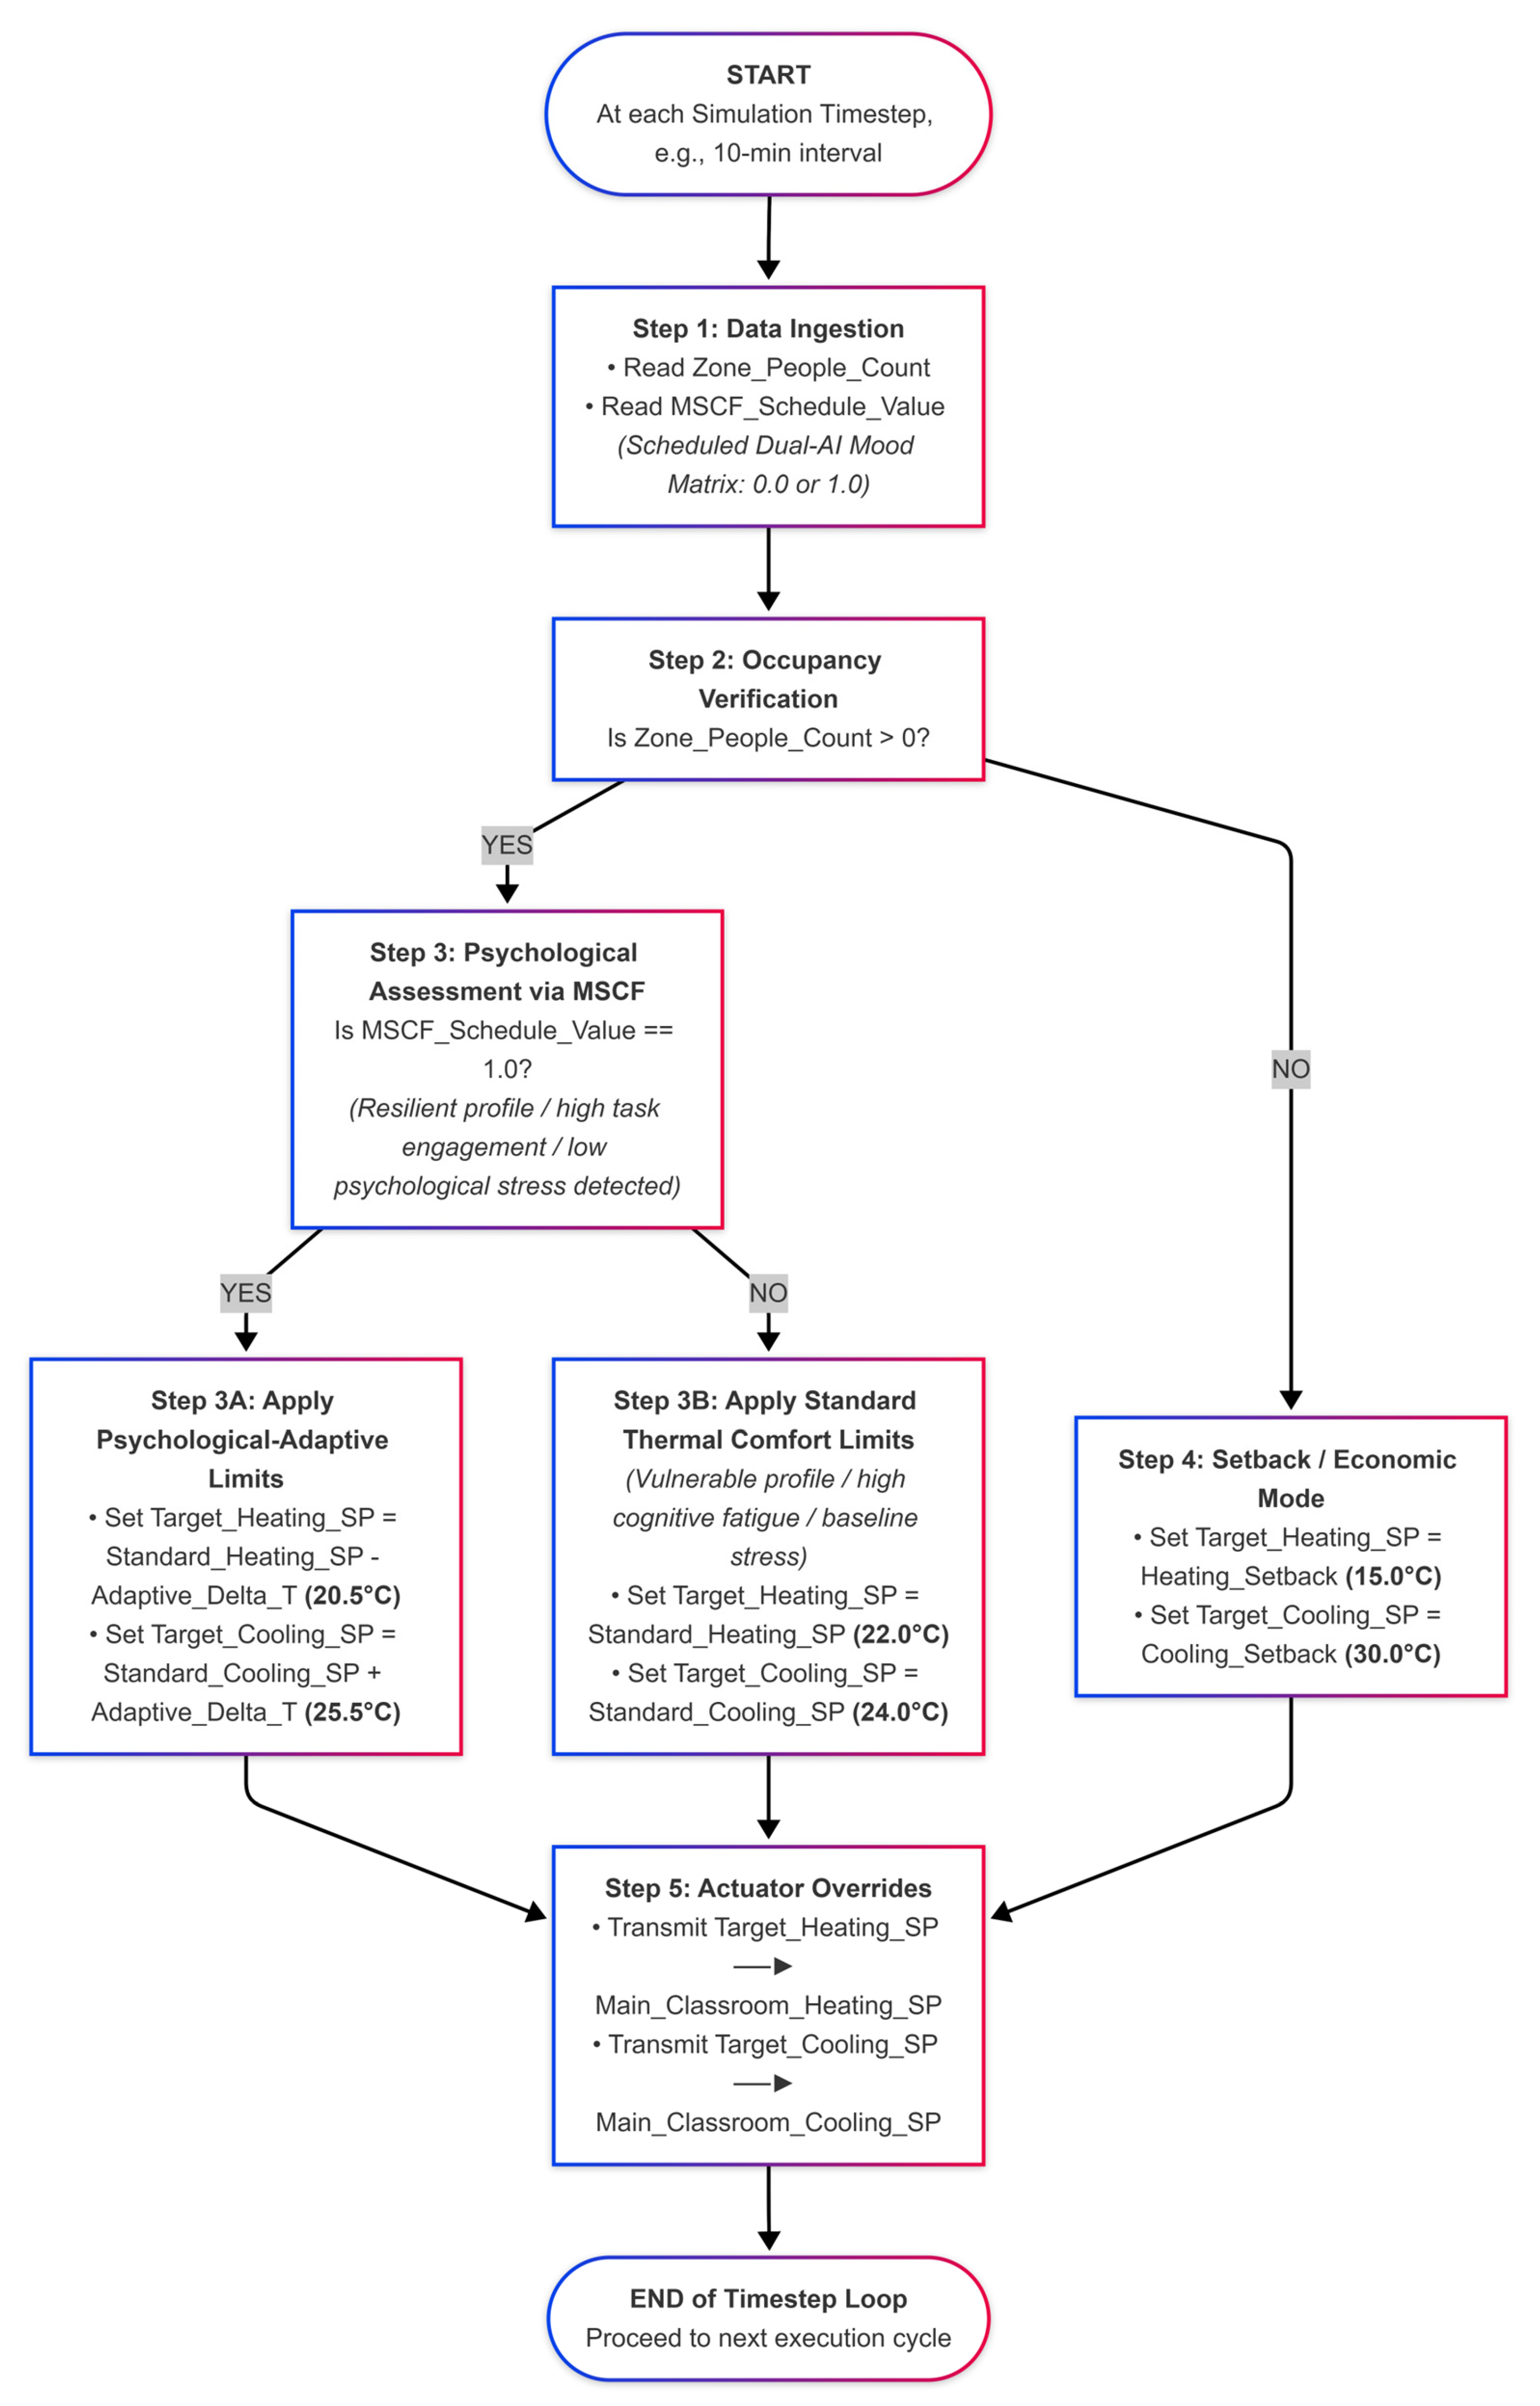
A novel, non-investment operational scenario driven by occupant psychology is used for this study. Unlike conventional setups that rely strictly on fixed physics-based thermal comfort models (such as Fanger’s Predicted Mean Vote/Predicted Percentage of Dissatisfied (PMV/PPD) model [41]), this scenario integrates user psychological profiles and cognitive loads to dynamically shift baseline temperatures as the effect of the state of mind was discussed in [42,43,44,45,46]. Utilizing the Turhan and Özbey coefficients (Mood State Correction Factor—MSCF) [47], the HVAC control loop targets psychological thermal comfort. The MSCF values are based on the reported level of concerns, and the values are categorized as follows: very pessimistic (−0.125), pessimistic (−0.075), neutral baseline (0), optimistic (−0.061), and very optimistic (−0.114). By assessing the occupants’ psychological state, the system adaptively optimizes indoor temperature profiles, leading to significant operational energy and carbon reductions during peak heating and cooling periods without sacrificing perceived human-centric comfort. For more details on the control loop, please see references [42,43]. This scenario embeds a multi-modal, dual-artificial intelligence (AI) framework directly into the BES control loop. The operational architecture utilizes an ensemble learning model consisting of a Convolutional Neural Network (CNN) for real-time facial expression mapping and an Artificial Neural Network (ANN) tasked with processing infrared facial thermography. By capturing both visual and physiological temperature shifts, this dual-AI engine detects the dynamic mood states, emotional stresses, and cognitive loads of the occupants, bypassing human-induced facial masking. The personalized psychophysiological data is transmitted seamlessly via a custom 3D-printed wearable necklace prototype to the HVAC management loop. Using the Turhan and Özbey coefficients, the system dynamically recalculates the indoor thermal comfort thresholds based on the ASHRAE-55 [48] standard. When the dual-AI model identifies states of low psychological vulnerability or high task engagement, the HVAC heating set-points are adaptively downscaled during the winter season (and conversely optimized during cooling periods) without provoking perceived thermal dissatisfaction. Since this operational strategy operates entirely via soft-sensing data feeds and algorithmic regulations rather than structural envelope interventions, it introduces zero material-based embodied carbon while achieving immediate, zero-cost reductions in operational energy and carbon footprints. In the BES environment, this is modeled by creating a dynamic schedule or lookup framework that alters the indoor heating/cooling set-points at each simulation time step (e.g., 10 min intervals). By using a Scheduled EMS Sensor, Equation (1) is used to determine the new set-point temperature according to the occupancy schedule (Figure 7).
Figure 7.
Algorithm of the psychological-adaptive HVAC control.
4.6. Decreasing Set-Point Temperature
Although this method seems to be very efficient since it has no capital cost, decreasing set-point temperatures could affect the thermal comfort of the students. The set-point temperature of the heating systems is decreased by 1 °C for the case buildings. However, it is sufficient to remind that Case T and I have different set-point temperatures due to the regulation of Türkiye (22 °C) and Italy (20 °C).
5. Life-Cycle Carbon Accounting Framework
To quantitatively evaluate the trade-offs between physical material investments and operational optimization strategies across the selected university buildings, a holistic life-cycle carbon accounting framework was developed. This framework isolates and couples two primary carbon streams over a projected building retrofitting study horizon (T = 30 years): embodied carbon (EC) representing the upfront footprint of structural interventions, and operational carbon (OC) representing the dynamic use-phase emissions derived from the calibrated Building Energy Simulation (BES) models.
5.1. Operational Carbon Calculation (OC)
The annual operational carbon emissions (OCannual, expressed in kgCO2e/year) for the uncalibrated baseline conditions and each of the seven proposed retrofitting/operational scenarios are dynamically computed. The hourly electricity and natural gas consumption data simulated at each timestep by EnergyPlus are integrated over the annual cycle (8760 h) and converted into carbon equivalents using local grid emission factors.
where
- Es,t is the hourly electricity consumption (kWh) for scenario s at hour t.
- NGs,t is the hourly natural gas consumption (m3) for scenario s at hour t.
- EFgrid is the regional grid electricity carbon intensity factor, reflecting the specific localized energy mix of the study zones (kg CO2e/kWh for the Ankara, Türkiye and Cosenza, Italy regional networks, respectively).
- EFng is the greenhouse gas emission factor for natural gas combustion (kg CO2e/m3).
The total operational carbon emissions over the designated life-cycle evaluation period (OCtotal,s) are calculated as
Consequently, the net operational carbon savings achieved by any given scenario (OCsaved,s) relative to the existing building baseline are quantified as
5.2. Embodied Carbon Calculation (EC)
The embodied carbon (ECs, expressed in kg CO2e) represents the sum of greenhouse gas emissions generated during the raw material extraction, transportation, and manufacturing stages (Cradle-to-Gate boundaries, life-cycle stages A1–A3) of the interventions. For material-intensive investment-based technologies (Scenarios 1 to 5), the total upfront carbon investment is calculated based on the quantitative material take-offs extracted from the architectural models:
where
Qi,s represents the quantity of material component i utilized in scenario s. Depending on the technology type, this is quantified as mass (kg), volume (m3), or surface area (m2) (e.g., total surface area of window solar films, total weight of rock wool insulation layers, or total nominal capacity of rooftop photovoltaic modules). EFmat,i is the material-specific embodied carbon emission factor (kg CO2e/functional unit) retrieved from established Life-Cycle Inventory (LCI) databases (such as the Inventory of Carbon and Energy—ICE, or product-specific Environmental Product Declarations—EPDs). M is the total number of distinct material variants introduced in the scenario.
For non-investment, purely algorithmic and operational scenarios—specifically, Scenario 6 (psychological-adaptive HVAC control) and Scenario 7 (Operational Set-Point Adaptation)—no additional physical materials or structural mass components are introduced into the facility boundaries. Accordingly, their material investment footprint is defined as
5.3. Net Life-Cycle Carbon Optimization and Payback Period
To navigate the carbon balance problem, the total life-cycle carbon footprint (LCCs) of each scenario is derived by summing its upfront material investment and its cumulative operational expenditures:
The primary objective of this framework is to identify the optimization boundary where the upfront carbon expenditure (ECs) is successfully offset by high operational savings (OCsaved,s). To establish the environmental feasibility and viability of each scenario, the carbon payback period (PPc, given in years) is introduced as the core evaluating metric:
Scenarios yielding a PPc significantly lower than the building’s operational study horizon (T = 30 years) indicate high efficiency in decarbonization. Conversely, strategies where PPc > T are classified as carbon-inefficient, as their material production footprint exceeds their use-phase savings. For the software-driven psychological-adaptive control, the formula yields an immediate PPc = 0, highlighting the zero-cost, net-positive carbon returns of human-centric automation.
6. Results and Discussions
This section presents the comprehensive findings obtained from the dynamic simulation models and balances the life-cycle carbon trade-offs of the proposed retrofitting scenarios, beginning with the calibration and validation of the developed BES models to ensure the reliability of the baseline energy data.
6.1. BES Calibration and Validation
To ensure the reliability and fidelity of the developed BES models prior to simulating the energy retrofitting scenarios, a rigorous calibration process was executed for both Case T (Türkiye) and Case I (Italy). The calibration period was carried out between 1 January 2023 and 30 November 2023. High-resolution indoor air temperature and relative humidity data gathered via HOBO microclimate sensors (Onset Computer Corporation: Bourne, MA, USA) during the measurement campaigns were utilized as the empirical baseline. In each classroom, five HOBO sensors (one in the center and four in the corners) were deployed to measure indoor air temperature and relative humidity. Moreover, the models were also calibrated according to the electricity and energy bills. Appendix A depicts the calibration results of the study. The simulation models developed in DesignBuilder were validated quantitatively against these real-world continuous measurements on an hourly time step, adhering strictly to the statistical criteria defined by the ASHRAE Guideline 14 protocol. Specifically, the Mean Bias Error (MBE) and the Coefficient of Variation in the Root Mean Square Error (CV (RMSE)) were employed as the primary calibration metrics to evaluate the accuracy of the models. Table 4 demonstrates that the BES models of the case buildings were successfully calibrated in accordance with the established thresholds since the MBE and CV (RMSE) values are under 10% and 30%, respectively.
Table 4.
Statistical metrics for the hourly calibration and validation of the BES models against ASHRAE Guideline 14 thresholds.
6.2. Scenario Results
This section presents the numerical results for seven retrofit scenarios (S1–S7) obtained using the life-cycle carbon accounting framework defined in Section 5. The results are evaluated comparatively through two case studies defined in Section 4: Case I (1970, Cosenza, Italy, Mediterranean climate) and Case T (2009, Ankara, Türkiye, semi-arid/continental climate). Table 5 summarizes the annual energy consumption per unit area, natural gas and electricity distribution, capital cost per unit area, embodied carbon, operating carbon generated over a 30-year operational life, total life-cycle carbon (LCC = EC + OC), and carbon payback period (PPc) for each scenario.
Table 5.
Comparative results of retrofit scenarios for Case I and Case T.
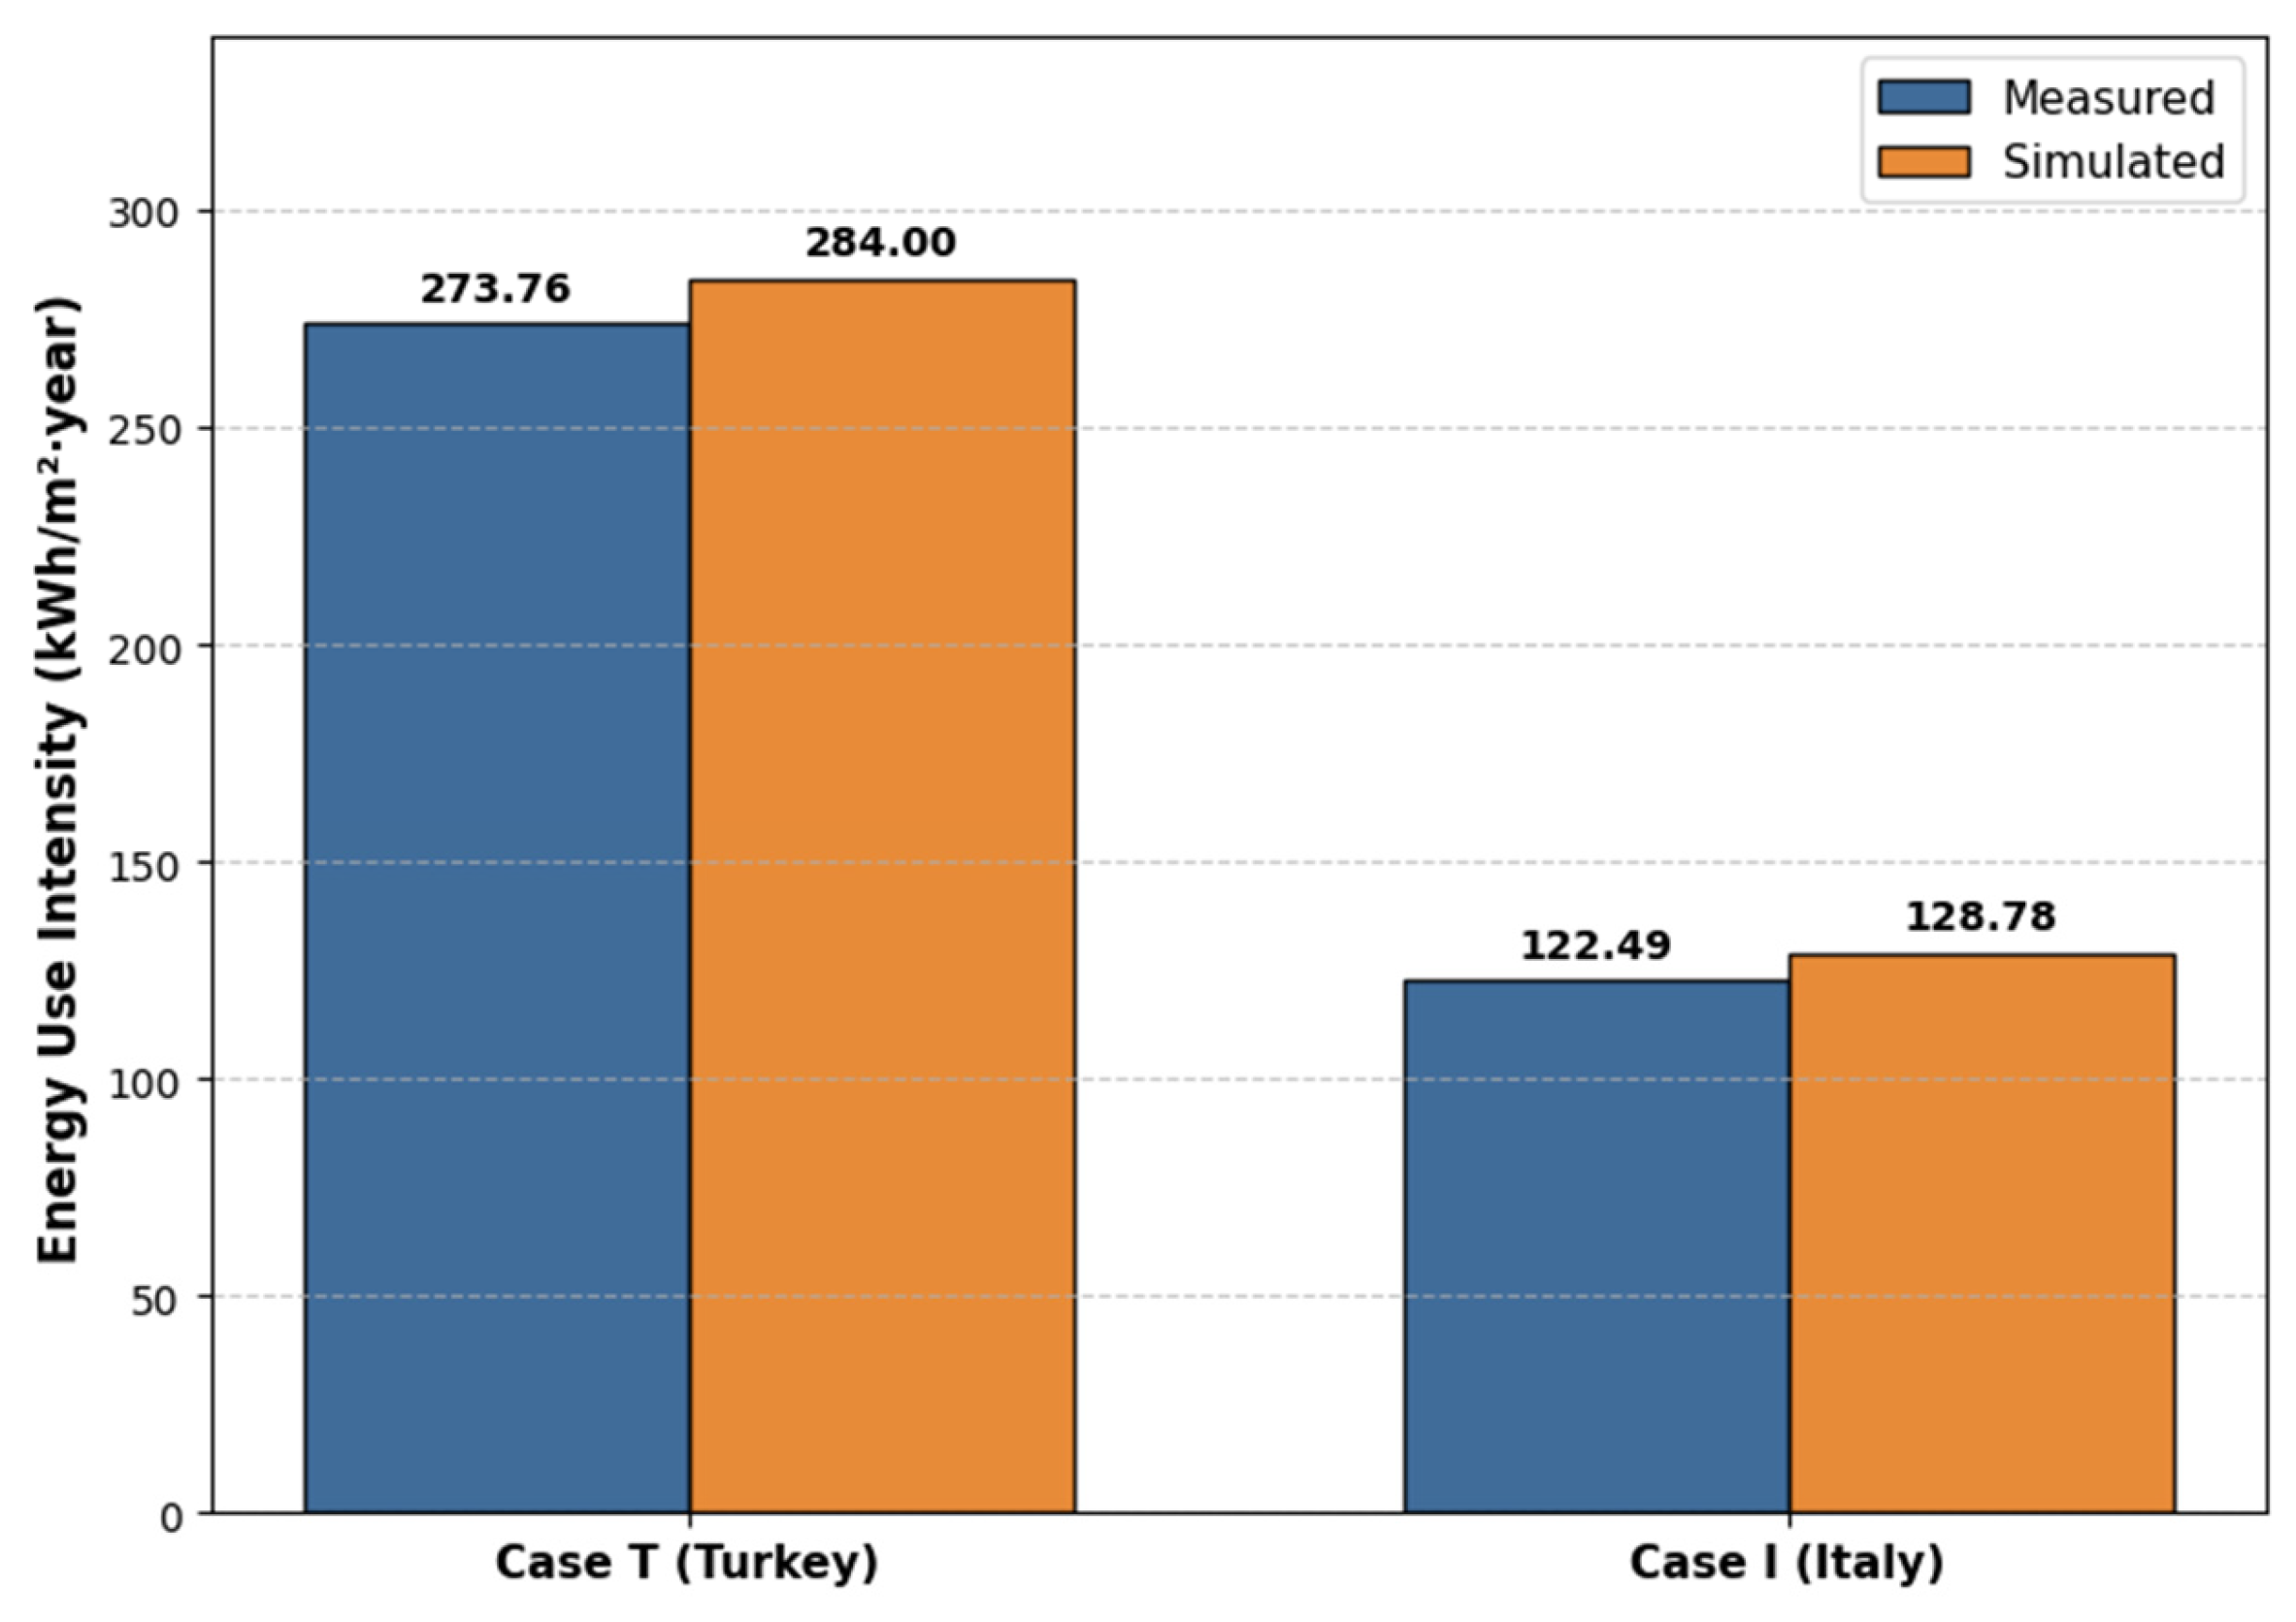
The simulation results obtained from the calibrated BES models indicate that the baseline condition without retrofitting exhibits significantly different energy signatures for the two cases. Case T has an energy consumption per unit area of 284.00 kWh/m2 year, approximately 2.2 times higher than Case I (128.78 kWh/m2 year). This difference is a consequence of the harsher winter conditions in Türkiye and the weaker thermal performance of the building envelope (Uwall = 2.41 W/m2K) compared to its Italian counterpart (Uwall = 0.374 W/m2K). Natural gas and electricity distributions are also asymmetrical across the cases: In Case I, both carrier energies have equal contributions (64.39 + 64.39 kWh/m2 year), while in Case T, the natural gas-weighted load continues (142.11 kWh/m2 year), which is consistent with the central gas boiler in Ankara. The 30-year OC for Case T is 7,209,930 kgCO2e, approximately 18 times that of Case I (391,860 kgCO2e). This large difference underscores that age and climate-dependent life-cycle carbon output in academic campus infrastructures is an important variable to consider in retrofit decision-making.
PV panel integration is a strategy that reduces OC in both cases; however, the capital cost and payback period differ dramatically between the cases. In Case T, with a capital cost of €24.50/m2, an investment of 17,406 kgCO2e of embodied carbon is made, while the 30-year OC is reduced to 4,725,570 kgCO2e, and the payback period is only 0.21 years. In Case I, due to the much smaller individual panel surface area, the capital cost increases to €150.00/m2, while the embodied carbon remains at only 2475 kgCO2e, and the OC is reduced to 340,260 kgCO2e; here, the payback period is 1.44 years. In both cases, since the PPc value is very low from the operating horizon (T = 30 years), PV retrofitting is a viable strategy in terms of life-cycle carbon optimization. However, it is observed that electricity consumption evolved from 64.39 to 73.05 in Case I and from 141.89 to 113.33 in Case T; this is a redistribution resulting from the offsetting account since direct solar energy production is consumed before it is needed on the grid.
The low-emissivity solar film application described in Section 4.2 was applied to all window surfaces with total transmittance of 9% and thermal transmittance of 5.7 W/m2K as specified in Table 1 of Section 4.2. For Case T, this application reduces OC to 5.899 million kgCO2e at a capital cost of €42.37/m2 and PPc is calculated to be technically close to zero (PPc < 0.01 years); this indicates the extremely rapid amortization of solar film in structures where photovoltaic generators are smaller and have lower capital density. In Case I, with a capital cost of €85.00/m2, there is only 39 kgCO2e of embedded carbon, OC is reduced to 389.670 kgCO2e and PPc is calculated as 0.53 years. In other words, in both cases, solar film retrofitting is technically highly carbon-efficient.
Insulation scenarios (S3 and S4) present the most critical case-specific comparison of the paper. In both cases, 20 cm thick, 60 kg/m3 density rock wool material was applied, reducing the wall U-value by 2.2 W/m2K. In Case T, interior wall insulation reduced total energy consumption from 284.00 to 109.92 kWh/m2 year (approximately a 61% decrease) and OC from 7,209,930 to 3,311,580 kgCO2e (approximately a 54% decrease). The embedded carbon investment is 39,750 kgCO2e, while PPc remains at 0.31 years; in exterior wall insulation, OC is further reduced to 3,308,490 kgCO2e, and PPc remains at the same 0.31 years. The total life-cycle carbon savings are 3,858,600 kgCO2e for the interior and 3,861,690 kgCO2e for the exterior. In Case I, however, the same insulation application paradoxically increases the OC to 414,300 kgCO2e (interior) and 411,300 kgCO2e (exterior), respectively; in other words, both scenarios exceed the baseline OC of 391,860 kgCO2e, and therefore PPc cannot be calculated and is classified as “Not Applicable”. This finding suggests that the insulation strategies fall into the “over-insulation” trap in Case I, depending on the thermal performance at the beginning of the building’s life, the presence of an interior mineral fiber layer, and the low Uwall (0.374 W/m2K) value; artificial interior heating during transitional periods increases electricity consumption. The success of insulation retrofits is tightly coupled to local climatic conditions, existing shell performance, and carbon grid density; this finding supports the necessity of multi-strand integrated retrofit frameworks.
The green wall scenario, where the Hedera Canariensis Gomera plant species is applied to all exterior wall surfaces, shows a sharp role reversal between the cases. In Case I, a capital cost of €400.00/m2 results in an embedded carbon investment of 22,116 kgCO2e, reducing OC to 379,470 kgCO2e; however, the PPc reaches 53.55 years, exceeding the 30-year operational horizon by approximately 23.55 years, and the strategy is classified as carbon-inefficient, with its material production footprint exceeding the 30-year use-phase savings. In Case T, the strategy completely backfires: with a capital cost of €301.54/m2, the embedded carbon investment of 141,020 kgCO2e results in OC rising to 7,398,750 kgCO2e, total life-cycle carbon reaching 7,539,770 kgCO2e, and PPc becoming incalculable. It is understood that latent cooling loads due to high soil moisture content may increase winter heating loads in the continental-Ankara climate, thus transforming the green wall from a beneficial passive strategy into a net negative intervention.
The psychological-adaptive HVAC scenario described in Section 4.5 is an algorithmic control strategy that requires no material investment and has zero capital cost and zero embodied carbon value. This scenario reduces OC from 391,860 to 316,200 kgCO2e (approximately a 19.3% reduction) in Case I and from 7,209,930 to 5,814,600 kgCO2e (approximately a 19.3% reduction) in Case T. Since EC is zero in both cases, the total life-cycle carbon equals OC, and PPc = 0 years is calculated. This result quantitatively supports that embedding human-centered cognitive computation into the BES model’s control loop eliminates the inevitable upstream environmental penalties of material-heavy interventions, and numerically supports the “zero-cost, net-positive carbon return” claim in Section 4.5.
Reducing the setpoint temperature from 22 °C to 21 °C for Case T and from 20 °C to 19 °C for Case I does not require any material investment in either case. This operational strategy reduces OC to 342,660 kgCO2e in Case I (approximately a 12.5% reduction) and OC to 4,383,400 kgCO2e in Case T (approximately a 39.2% reduction); the larger reduction observed in Case T is explained by the initial high OC as well as the already narrow thermal comfort bandwidth in Case I. Total life-cycle carbon is equal to OC (EC = 0) PPc = 0 years. S7 falls into the same category as S6, with a zero-cost and zero-carbon payback period, but it does not seem to have achieved the same carbon reduction as S6.
Scenario 6 proved to be the most advantageous strategy by introducing embodied carbon while simultaneously enhancing occupant comfort. When compared to the baseline, the thermal discomfort hours decreased from 657.85 to 621.12 h in Case I, and from 3147.14 to 3116.44 h in Case T. These findings demonstrate that the proposed strategy successfully maintains occupant thermal comfort while simultaneously achieving significant carbon reductions.
When evaluated in terms of economic feasibility, retrofit strategies show significant differences between the initial investment cost and the carbon reduction achieved. While the PV system achieved short carbon payback periods of 1.44 years (Case I) and 0.21 years (Case T) despite its high initial cost, insulation applications only provided a payback period of 0.31 years for Case T. In contrast, the psychological-adaptive HVAC system, with an initial cost of only €0.98/m2 and 3 kgCO2e of embedded carbon, reduced operational carbon emissions by approximately 19.3% in both scenarios. These results demonstrate that the proposed approach is economically viable due to its low initial investment and high operational gains. However, a detailed Life-Cycle Cost Analysis (LCCA), including maintenance costs, equipment replacements, and changes in energy prices, has been excluded from this study and is recommended for future evaluation.
It is worth noting that all material take-offs, LCI/EPD factors, regional electricity and natural gas carbon factors, assumed lifetimes, replacement assumptions, conversion equations, and sensitivity analysis are given in Appendix B, Appendix C and Appendix D, respectively.
6.3. Discussions and Limitations
The dynamic simulations executed across the dual-case BES models expose the intricate, climate-specific, and chronological trade-offs inherent in balancing embodied carbon investments against multi-decadal operational carbon mitigation. By evaluating both an uninsulated 1970s heavy-concrete Mediterranean structure (Case I) and a 2009 insulated continental facility (Case T), this study highlights that a singular, unyielding policy approach to zero-emission university infrastructure can lead to net-negative environmental outcomes.
A critical finding emerges from the insulation scenarios (Scenarios 3 and 4). For Case T, the installation of a 20 cm rock wool layer yields profound operational savings, dropping total emissions from 7.21 million kgCO2e to approximately 3.31 million kgCO2e. This intervention achieves a rapid carbon payback period of just 0.31 years, validating the extensive initial carbon investment of 39,750 kgCO2e. Conversely, applying the same insulation threshold to Case I induces a net increase in operational carbon (rising from 391,860 kgCO2e to over 414,300 kgCO2e), rendering the intervention entirely carbon-inefficient. This distinct divergence is driven by the unique Mediterranean boundary conditions of Cosenza, where the baseline building already features an internal mineral fiber layer and low thermal transmittance (0.374 W/m2K). Forcing supplementary mass onto Case I triggers severe thermal trapping during transition periods, shifting electricity consumption upwards due to artificial indoor overheating, thus echoing warnings in the literature regarding over-insulation in mild climates. Case I already possesses a highly insulated baseline envelope with a pre-existing mineral fiber layer. Adding an extra 20 cm of rock wool leads to an “over-insulation” effect. In Cosenza’s mild Mediterranean climate, classrooms experience high internal heat gains from dense occupancy, lighting, and equipment. Over-insulating the envelope traps these internal heat gains during transitional seasons (spring and autumn) and mild winter days, preventing natural heat dissipation through the building envelope. Consequently, the trapped thermal mass causes indoor overheating, triggering higher operation of mechanical ventilation and auxiliary systems.
A similar geographical discrepancy is noted in the Green Wall Application (Scenario 5). While coating Case I with Hedera Canariensis Gomera successfully lowers operational emissions to 379,470 kgCO2e, it demands 53.55 years to offset its steep upfront carbon footprint (22,116 kgCO2e), extending well past the 30-year structural study horizon. In Case T, the green wall backfires entirely, expanding operational carbon to 7.39 million kgCO2e. The intensive latent cooling, high soil moisture content, and modified boundary physics altered the heating dynamics of the continental climate, worsening winter thermal loads instead of alleviating them.
In stark contrast, active and algorithmic strategies present an immediate path to carbon mitigation without structural or material consequences. Simply decreasing the heating set-point by 1 °C (Scenario 7) provides instantaneous carbon payback, dropping 30-year operational footprints by roughly 12.5% for Case I and 39.2% for Case T. However, the most robust, well-rounded solution is the multi-modal, dual-AI psychological-adaptive HVAC system (Scenario 6). By utilizing real-time facial expression mapping and infrared thermography to modulate comfort thresholds through a dynamic lookup framework, this algorithmic soft-sensing model avoids physical material extraction. As a result, Scenario 6 injects exactly 0 kgCO2e of embodied carbon into the ecosystem while successfully decreasing 30-year operational burdens to 316,200 kgCO2e for Case I and 5.81 million kgCO2e for Case T. These results confirm that integrating human-centric cognitive computing into BES models avoids the significant embodied carbon penalties typically caused by material-intensive structural retrofits.
While this study offers a detailed framework for balancing whole-life carbon cycles in campus facilities, certain limitations must be acknowledged.
- The evaluation of embodied carbon emissions was bounded strictly within Cradle-to-Gate limits due to highly volatile local supply chains and regional waste management data. Transportation to the site, construction-installation impacts, and complex end-of-life deconstruction scenarios were omitted, which might underrepresent the total upfront life-cycle impacts of physical materials. While this study adopts a standardized Cradle-to-Gate (Modules A1–A3 according to EN 15978 [49]) system boundary to evaluate the embodied impacts of the proposed retrofit measures, this boundary selection presents certain methodological limitations. Specifically, active technologies such as photovoltaic (PV) systems and biologically active assemblies such as green walls incur non-negligible environmental burdens during their operational lifespan (Module B) and end-of-life phases (Module C).
- Operational carbon calculations were simulated assuming constant, stationary localized grid emission factors across the entire 30-year study horizon. In reality, the regional electricity networks of both Türkiye and Italy are projected to undergo rapid, dynamic decarbonization and renewable integration pathways, which will gradually reduce the operational carbon returns of energy-saving retrofits over time.
- To maintain high computational efficiency and strict fidelity during the algorithmic EMS sensing loops, simulations were isolated strictly to the classroom zones of both structures. Although classrooms constitute the core high-density thermal loads of higher education institutions, fully capturing campus-wide energy dynamics requires integrating auxiliary spaces with irregular occupancy schedules, such as laboratories, student clubs, libraries, and large conference halls.
- The simulation of the psychological-adaptive HVAC scenario relies on structured lookup schedules derived from empirical samples to modulate the comfort thresholds (MSCF). However, real-world student behavior, clothing adjustment patterns, window-opening habits, and metabolic rate fluctuations are highly stochastic and vary significantly across diverse demographics, which introduces unavoidable simplified assumptions into the dynamic thermal comfort models.
- While the framework successfully couples embodied and operational carbon metrics, it does not explicitly integrate an economic optimization matrix or Life-Cycle Cost Analysis (LCCA). Fluctuations in material market prices, local carbon taxation policies, inflation rates, and structural maintenance costs over the 30-year study horizon were not calculated, though they heavily influence real-world policy enforcement and executive institutional decision-making.
- The 30-year projection applies contemporary weather data and historical typical meteorological years (TMYs) provided by local university stations. This methodology does not account for long-term climate change trajectories, extreme weather events, or urban heat island (UHI) intensifications projected over the next three decades, which may distort heating and cooling load ratios as climate change progresses.
7. Conclusions
In this study, a comprehensive BES models-driven life-cycle carbon assessment framework was established to identify the optimum balance between the embodied carbon associated with retrofit interventions and the operational carbon reductions achieved throughout the service life of higher education buildings. The comparative evaluation of an aging university building located in a Mediterranean climate and a relatively modern campus building situated in a semi-arid continental climate demonstrates that a universal retrofitting strategy cannot be applied effectively across different building stocks. Instead, building age, climatic conditions, and the existing thermal characteristics of the envelope emerge as the primary determinants of the most appropriate decarbonization pathway. The analyses based on rigorously calibrated Building Energy Simulation models revealed several important findings. First, the baseline operational carbon emissions of the Ankara building were considerably higher than those of the Italian case study due to its colder climatic conditions, inferior insulation performance, and greater heating demand. This emphasizes the dominant influence of regional climate and building age on the long-term carbon performance of educational facilities. The application of high-performance rock wool insulation to the Ankara building significantly reduced heating energy demand and operational carbon emissions while exhibiting a remarkably short carbon payback period. In contrast, implementing the same insulation strategy in the Italian building, which already possesses an insulated wall assembly with relatively low thermal transmittance, resulted in excessive retention of internal heat gains. Consequently, additional electricity was required to maintain indoor thermal conditions during winter and transitional seasons, ultimately increasing operational carbon emissions. These findings clearly illustrate the risks associated with over-insulation in mild climatic regions. The green wall system produced moderate operational carbon reductions under Mediterranean climatic conditions by enhancing façade performance and mitigating solar heat gains. However, when applied to the continental climate, increased substrate moisture and localized microclimatic effects elevated winter heating demand, offsetting the environmental benefits and leading to an overall carbon penalty. This outcome highlights the climate-dependent effectiveness of nature-based façade technologies. Among all evaluated retrofit scenarios, the most promising results were obtained from the dual artificial intelligence-based building control system integrated with the Turhan and Özbey coefficients, which incorporates occupant psychology and cognitive workload into thermal comfort management. As a software-oriented solution, this approach introduces no additional embodied carbon while simultaneously achieving substantial reductions in operational carbon emissions in both buildings without compromising occupant comfort. These findings demonstrate that integrating human-centric intelligent control algorithms into BES platforms provides a highly effective pathway for reducing building emissions without the environmental burden associated with material-intensive retrofit measures. Overall, the findings indicate that buildings with already optimized envelopes in Mediterranean climates should prioritize renewable energy integration, intelligent energy management, and advanced solar control technologies rather than additional insulation layers. Conversely, in continental climates characterized by severe winters, envelope insulation remains a critical decarbonization measure. Nevertheless, intelligent BES model-based control strategies supported by psychological-adaptive automation represent the most rapid, cost-effective, and environmentally sustainable solution for accelerating the transition of higher education buildings toward net-zero carbon performance.
Author Contributions
Conceptualization, C.T., G.G.A. and C.C.; methodology, C.T.; software, M.F.Ö. and C.T.; validation, C.T., G.G.A. and C.C.; formal analysis, M.F.Ö. and G.N.B.D.; investigation, G.N.B.D.; resources, C.T. and C.C.; data curation, C.T.; writing—original draft preparation, C.T. and G.N.B.D.; writing—review and editing, C.T., G.G.A. and C.C.; visualization, M.F.Ö.; supervision, C.T., G.G.A. and C.C.; project administration, C.T.; funding acquisition, C.T. All authors have read and agreed to the published version of the manuscript.
Funding
This project was supported by the Scientific and Technological Research Council of Türkiye with a project number of 125M026.
Institutional Review Board Statement
Not applicable.
Informed Consent Statement
Not applicable.
Data Availability Statement
The data presented in this study are available on reasonable request from the corresponding author.
Conflicts of Interest
The authors declare no conflicts of interest.
Abbreviations
The following abbreviations are used in this manuscript:
| AI | Artificial Intelligence |
| ANN | Artificial Neural Network |
| ASHRAE | American Society of Heating, Refrigerating and Air-Conditioning Engineers |
| BES | Building Energy Simulation |
| CNN | Convolutional Neural Network |
| CO2 | Carbon Dioxide |
| E | Hourly Electricity Consumption (kWh) |
| EC | Embodied Carbon |
| ECC | Embodied Carbon Calculation |
| EFgrid | regional grid electricity carbon intensity factor (kg CO2e/kWh) |
| EFmat,i | Material-specific embodied carbon emission factor (kg CO2e/functional unit) |
| EFng | Greenhouse gas emission factor for natural gas combustion (kg CO2e/m3) |
| EMS | Energy Management System |
| GHG | Greenhouse Gas |
| HVAC | Heating, Ventilating and Air Conditioning |
| I | Italy |
| LCA | Life-Cycle Assessment |
| LCCA | Life-Cycle Carbon Assessment |
| LCI | Life-Cycle Inventory |
| MSCF | Mood State Correction Factor |
| NG | Hourly Natural Gas Consumption (m3) |
| OC | Operational Carbon |
| OCC | Operational Carbon Calculation |
| PMV | Predicted Mean Vote |
| PPc | Carbon Payback Period (years) |
| PPD | Predicted Percentage of Dissatisfied (%) |
| PV | Photovoltaic |
| Qi,s | Quantity of material component i utilized in scenario s |
| SDG | Sustainable Development Goals |
| T | Temperature (°C), Time (years), Türkiye |
| TMY | Typical Meteorological Years |
| U | Overall Heat Transfer Coefficient |
| UHI | Urban Heat Island |
| ZEB | Zero-Emission Buildings |
| ΔT | Temperature Difference (°C) |
Appendix A. Annual Energy Use Intensity (Measured vs. Simulated)
Figure A1.
Annual Energy Use Intensity (Measured vs. Simulated).
Appendix B. Service Life and Replacement Assumptions
For PV panels, a service life of 25–30 years has been assumed in accordance with the standard roof-type performance guarantee, and therefore embodied carbon has only been calculated once for the initial installation. For IR9010 solar control film, it is generally stated in the literature that a decrease in solar transmittance is observed within 10–15 years in DMD-based films. However, in the applications considered in this study, it was assumed that the film maintains its functional performance for 30 years thanks to the substrate recoat process. Therefore, to ensure methodological consistency, film replacement was not considered in the baseline analysis, as in the PV and insulation scenarios. For the interior and exterior rock wool insulation and green wall system (plant layer, felt substrate, and PVC waterproofing layer), no renewal was assumed during the 30-year analysis period. This is because the components comprising these systems have a service life of 30 years or more, or their performance is expected to be maintained under post-installation maintenance contracts. In psychological-adaptive HVAC and temperature set-point reduction scenarios, embodied carbon (EC) is considered zero because no new physical materials are used within the building boundaries.
Table A1.
Operational Lifespan and Replacement Criteria.
Appendix C. Sensitivity Analysis
A 30-year sensitivity analysis was conducted to test the assumption of constant grid emission factors over the analysis horizon. Based on net-zero targets of 2050 for Italy and 2053 for Türkiye, the electricity-grid emission factor was assumed to decrease linearly from its 2026 value to zero, while the natural gas combustion factor was held constant. The form of the linear interpolation is
where EF_{grid}\left(y\right) is the grid emission factor in year y (kgCO2e/kWh); EF_{grid,0} is the initial grid emission factor in 2026 (0.292 kgCO2e/kWh for Case I, 0.444 kgCO2e/kWh for Case T); and NZ is the net-zero target year (2050 for Italy, 2053 for Türkiye).
Operational-carbon values decrease under this assumption, but the overall performance ranking of the seven practices remains unchanged.
Table A2.
Comparison of Operational and Life-Cycle Carbon Emissions Across Energy Efficiency Scenarios.
Appendix D. Emission Factors and Regional Electricity and Natural Gas Conversion Factors
Table A3.
Emission factors.
Table A4.
Regional electricity and natural gas conversion factors.
References
- Ahmed Ali, K.; Ahmad, M.I.; Yusup, Y. Issues, impacts, and mitigations of carbon dioxide emissions in the building sector. Sustainability 2020, 12, 7427. [Google Scholar] [CrossRef] [Scilit]
- Li, D.; Huang, G.; Zhu, S.; Chen, L.; Wang, J. How to peak carbon emissions of provincial construction industry? Scenario analysis of Jiangsu Province. Renew. Sustain. Energy Rev. 2021, 144, 110953. [Google Scholar] [CrossRef] [Scilit]
- United Nations. Paris Agreement; UN: Paris, France, 2015; pp. 2–4. [Google Scholar]
- Raihan, A.; Tuspekova, A. Dynamic impacts of economic growth, renewable energy use, urbanization, industrialization, tourism, agriculture, and forests on carbon emissions in Turkey. Carbon Res. 2022, 1, 20. [Google Scholar] [CrossRef] [Scilit]
- Pata, U.K. The effect of urbanization and industrialization on carbon emissions in Turkey: Evidence from ARDL bounds testing procedure. Environ. Sci. Pollut. Res. 2018, 25, 7740–7747. [Google Scholar] [CrossRef] [Scilit] [PubMed]
- IEA. Turkey 2021: Energy Policy Review; International Energy Agency: Paris, France, 2021; Available online: https://iea.blob.core.windows.net/assets/cc499a7b-b72a-466c-88de-d792a9daff44/Turkey_2021_Energy_Policy_Review.pdf (accessed on 22 July 2026).
- Republic of Türkiye Ministry of Environment; Urbanization and Climate Change. 2053 Long Term Climate Strategy. 2024. Available online: https://iklim.gov.tr/db/turkce/icerikler/files/Türkiye-Long%20Term%20Climate%20Strategy.pdf (accessed on 22 July 2026).
- Council of the European Union. The European Green Deal. Available online: https://www.consilium.europa.eu/media/47573/st_15051_2019_init_en.pdf (accessed on 22 July 2026).
- European Commission. A Renovation Wave for Europe—Greening Our Buildings, Creating Jobs, Improving Lives, 662 final. 2020. Available online: https://eur-lex.europa.eu/legal-content/EN/TXT/HTML/?uri=CELEX:52020DC0662 (accessed on 22 July 2026).
- Zhang, W.; Yang, K.; Li, Z.; Zeng, X.; Guo, J.; Zou, R.; Zhang, Y. Enhancing energy efficiency and coordinated scheduling in university building clusters driven by student energy behavior. Energy 2026, 348, 140540. [Google Scholar] [CrossRef] [Scilit]
- Liu, Q.; Ren, J. Research on the building energy efficiency design strategy of Chinese universities based on green performance analysis. Energy Build. 2020, 224, 110242. [Google Scholar] [CrossRef] [Scilit]
- Migliari, L.; Anania, L.; Agnese, G.; Bettoni, L.; Cappelletti, G.M.; Cioffi, F.; Di Battista, D. Key Metrics for Energy Planning in Academic Institutions. Appl. Sci. 2025, 15, 9496. [Google Scholar] [CrossRef] [Scilit]
- da Silva, L.A.; de Aguiar Dutra, A.R.; de Andrade Guerra, J.B.S.O. Decarbonization in higher education institutions as a way to achieve a green campus: A literature review. Sustainability 2023, 15, 4043. [Google Scholar] [CrossRef] [Scilit]
- Yu, X.; Liu, L.; Wu, X.; Wu, X.; Wang, Z.; Liu, Q.; Shi, G. On a post-occupancy evaluation study of effects of occupant behavior on indoor environment quality in college buildings in Chongqing. Procedia Eng. 2017, 205, 623–627. [Google Scholar] [CrossRef] [Scilit]
- Pradhan, S.; Jang, Y.; Chauhan, H. Investigating effects of indoor temperature and lighting on university students’ learning performance considering sensation, comfort, and physiological responses. Build. Environ. 2024, 253, 111346. [Google Scholar] [CrossRef] [Scilit]
- Brink, H.W.; Loomans, M.G.; Mobach, M.P.; Kort, H.S. Classrooms’ indoor environmental conditions affecting the academic achievement of students and teachers in higher education: A systematic literature review. Indoor Air 2021, 31, 405–425. [Google Scholar] [CrossRef] [Scilit] [PubMed]
- Zhang, Y.; Hu, K.; Yang, Y.; Li, D.; Deng, T.; Hu, Z.; Xu, Y. Energy-saving and decarbonization design optimization for school canteen buildings: A case study in Nanjing. Buildings 2025, 15, 455. [Google Scholar] [CrossRef] [Scilit]
- Zou, P.X.; Li, H. Optimization of life-cycle carbon emission, global cost and thermal comfort of residential building envelops in cold regions in China. Energy Build. 2026, 358, 117062. [Google Scholar] [CrossRef] [Scilit]
- Arun, M.; Gopan, G. Effects of natural light on improving the lighting and energy efficiency of buildings: Toward low energy consumption and CO2 emission. Int. J. Low-Carbon Technol. 2025, 20, 1047–1056. [Google Scholar] [CrossRef] [Scilit]
- Gu, X.; Chen, C.; Fang, Y.; Mahabir, R.; Fan, L. CECA: An intelligent large-language-model-enabled method for accounting embodied carbon in buildings. Build. Environ. 2025, 272, 112694. [Google Scholar] [CrossRef] [Scilit]
- Santos, A.K.; Ferreira, V.M.; Dias, A.C. Promoting decarbonisation in the construction of new buildings: A strategy to calculate the Embodied Carbon Footprint. J. Build. Eng. 2025, 103, 112037. [Google Scholar] [CrossRef] [Scilit]
- Shahee, A.; Abdoos, M.; Aslani, A.; Zahedi, R. Reducing the energy consumption of buildings by implementing insulation scenarios and using renewable energies. Energy Inform. 2024, 7, 18. [Google Scholar] [CrossRef] [Scilit]
- Zhu, X.; Huang, D.; Niu, Y.; Liu, Y.; Yuan, Y.; Yang, L.; Liu, J. Energy saving and carbon reduction benefits of ventilated photovoltaic walls combined with non-balanced thermal insulation in Lhasa residential buildings. Energy Build. 2025, 341, 115769. [Google Scholar] [CrossRef] [Scilit]
- Cusenza, M.A.; Guarino, F.; Longo, S.; Cellura, M. An integrated energy simulation and life cycle assessment to measure the operational and embodied energy of a Mediterranean net zero energy building. Energy Build. 2022, 254, 111558. [Google Scholar] [CrossRef] [Scilit]
- Robati, M.; Daly, D.; Kokogiannakis, G. A method of uncertainty analysis for whole-life embodied carbon emissions (CO2-e) of building materials of a net-zero energy building in Australia. J. Clean. Prod. 2019, 225, 541–553. [Google Scholar] [CrossRef] [Scilit]
- Echenagucia, T.M.; Moroseos, T.; Meek, C. On the tradeoffs between embodied and operational carbon in building envelope design: The impact of local climates and energy grids. Energy Build. 2023, 278, 112589. [Google Scholar] [CrossRef] [Scilit]
- Luo, X.J. An integrated passive and active retrofitting approach toward minimum whole-life carbon footprint. Energy Build. 2023, 295, 113337. [Google Scholar] [CrossRef] [Scilit]
- Khan, S.A.; Alam, T.; Khan, M.S.; Blecich, P.; Kamal, M.A.; Gupta, N.K.; Yadav, A.S. Life cycle assessment of embodied carbon in buildings: Background, approaches and advancements. Buildings 2022, 12, 1944. [Google Scholar] [CrossRef] [Scilit]
- El Hafdaoui, H.; Khallaayoun, A.; Bouarfa, I.; Ouazzani, K. Machine learning for embodied carbon life cycle assessment of buildings. J. Umm Al-Qura Univ. Eng. Archit. 2023, 14, 188–200. [Google Scholar] [CrossRef] [Scilit]
- Mendes, V.F.; Cruz, A.S.; Gomes, A.P.; Mendes, J.C. A systematic review of methods for evaluating the thermal performance of buildings through energy simulations. Renew. Sustain. Energy Rev. 2024, 189, 113875. [Google Scholar] [CrossRef] [Scilit]
- Singh, M.; Sharston, R. A literature review of building energy simulation and computational fluid dynamics co-simulation strategies and its implications on the accuracy of energy predictions. Build. Serv. Eng. Res. Technol. 2022, 43, 113–138. [Google Scholar] [CrossRef] [Scilit]
- Angelakoglou, K.; Lampropoulos, I.; Chatzigeorgiou, E.; Giourka, P.; Martinopoulos, G.; Skembris, A.-S.; Seitaridis, A.; Kousovista, G.; Nikolopoulos, N. Advancing Energy-Efficient Renovation Through Dynamic Life Cycle Assessment and Costing: Insights and Experiences from VERIFY Tool Deployment. Energies 2025, 18, 3736. [Google Scholar] [CrossRef] [Scilit]
- Kottek, M.; Grieser, J.; Beck, C.; Rudolf, B.; Rubel, F. World map of the Köppen-Geiger climate classification updated. Meteorol. Z. 2006, 15, 259–263. [Google Scholar] [CrossRef] [Scilit] [PubMed]
- Turkish State Meteorological Service. Extreme Maximum, Minimum and Average Temperatures Measured in Long Period (°C). Available online: https://www.mgm.gov.tr/eng/forecast-cities.aspx (accessed on 22 July 2026).
- ARPACAL—Centro Funzionale Multirischi della Calabria, AGEIS Geo Data Interface. Available online: https://www.allertacal.it/frontoffice (accessed on 22 July 2026).
- DesignBuilder. DesignBuilder Software Ltd. Available online: https://designbuilder.co.uk (accessed on 22 July 2026).
- ASHRAE. ASHRAE Guideline 14-2023: Measurement of Energy, Demand, and Water Savings; American Society of Heating, Refrigerating and Air-Conditioning Engineers: Atlanta, GA, USA, 2023. [Google Scholar]
- Sadineni, S.B.; Madala, S.; Boehm, R.F. Passive building energy savings: A review of building envelope components. Renew. Sustain. Energy Rev. 2011, 15, 3617–3631. [Google Scholar] [CrossRef] [Scilit]
- Herath, H.M.P.I.K.; Halwatura, R.U.; Jayasinghe, G.Y. Evaluation of green infrastructure effects on tropical Sri Lankan urban context as an urban heat island adaptation strategy. Urban For. Urban Green. 2018, 29, 212–222. [Google Scholar] [CrossRef] [Scilit]
- Turhan, C.; Carpino, C.; Chen Austin, M.; Özbey, M.F.; Akkurt, G.G. Impact of green wall and roof applications on energy consumption and thermal comfort for climate resilient buildings. Urban Sci. 2025, 9, 105. [Google Scholar] [CrossRef] [Scilit]
- Fanger, P.O. Thermal Comfort. Analysis and Applications in Environmental Engineering, 1st ed.; Danish Technical Press: Copenhagen, Denmark, 1970. [Google Scholar]
- Saleh, Y.A.S.; Turhan, C.; Sümer, M.E.; Lotfi, B.; Özbey, M.F. From facial expressions to thermal sensation: POMS-validated AI-based mood estimation driving psychology-adaptive HVAC control. Energy Build. 2026, 360, 117402. [Google Scholar] [CrossRef] [Scilit]
- Turhan, C.; Doruk, Ö.R.; Alkan, N.; Özbey, M.F.; Chen Austin, M.; Thapa, S.; Yılmaz, V.S.; Erdogan, E.; Akpınar, B.E.; Pekcan, P. Next Generation Mood Adaptive Behavioral Modeling for Decarbonizing Office Buildings and Optimizing Thermal Comfort. Atmosphere 2026, 17, 377. [Google Scholar] [CrossRef] [Scilit]
- Özbey, M.F.; Khovalyg, D.; Alkan, N.; Turhan, C. Effect of Mood States on Thermal Sensation: Cultural and Gender Differences in Türkiye and Switzerland. E3S Web Conf. 2026, 716, 05017. [Google Scholar] [CrossRef] [Scilit]
- Özbey, M.F.; Turhan, C.; Alkan, N.; Akkurt, G.G. Latent Psychological Pathways in Thermal Comfort Perception: The Mediating Role of Cognitive Uncertainty on Depression and Vigour. Buildings 2025, 15, 2538. [Google Scholar] [CrossRef] [Scilit]
- Yerlikaya-Özkurt, F.; Özbey, M.F.; Turhan, C. Modeling the mood state on thermal sensation with a data mining algorithm and testing the accuracy of mood state correction factor. New Ideas Psychol. 2025, 76, 101124. [Google Scholar] [CrossRef] [Scilit]
- Turhan, C.; Özbey, M.F.; Çeter, A.E.; Akkurt, G.G. A novel data-driven model for the effect of mood state on thermal sensation. Buildings 2023, 13, 1662. [Google Scholar] [CrossRef] [Scilit]
- ASHRAE Standard 55-2020; Thermal Environmental Conditions for Human Occupancy. American Society of Heating, Refrigerating and Air-Conditioning Engineers: Atlanta, GA, USA, 2020.
- EN 15978:2026; A Harmonized Method to Assess the Environmental Performance of Buildings. European Committee for Standardization: Brussels, Belgium, 2026.
- Goldschmidt, J.C.; Wagner, L.; Pietzcker, R.; Friedrich, L. Technological learning for resource efficient terawatt scale photovoltaics. Energy Environ. Sci. 2021, 14, 5147–5160. [Google Scholar] [CrossRef] [Scilit]
- Virtuani, A.; Borja Block, A.; Wyrsch, N.; Ballif, C. The carbon intensity of integrated photovoltaics. Joule 2023, 7, 2511–2536. [Google Scholar] [CrossRef] [Scilit]
- Jelle, B.P.; Kalnæs, S.E.; Gao, T. Low-emissivity materials for building applications: A state-of-the-art review and future research perspectives. Energy Build. 2015, 96, 329–356. [Google Scholar] [CrossRef] [Scilit]
- Jelle, B.P.; Hynd, A.; Gustavsen, A.; Arasteh, D.; Goudey, H.; Hart, R. Fenestration of today and tomorrow: A state-of-the-art review and future research opportunities. Sol. Energy Mater. Sol. Cells 2012, 96, 1–28. [Google Scholar] [CrossRef] [Scilit]
- Oquendo-Di Cosola, V.; Olivieri, F.; Ruiz-García, L.; Bacenetti, J. An environmental Life Cycle Assessment of Living Wall Systems. J. Environ. Manag. 2020, 254, 109743. [Google Scholar] [CrossRef] [Scilit] [PubMed]
- Reyhani, M.; Santolini, E.; Tassinari, P.; Torreggiani, D. Environmental assessment of design choices of green walls based for materials combination and plants. Int. J. Life Cycle Assess. 2023, 28, 1078–1091. [Google Scholar] [CrossRef] [Scilit]
- Raja, J.; Dixon, N.; Fowmes, G.; Frost, M.; Assinder, P. Obtaining reliable embodied carbon values for geosynthetics. Geosynth. Int. 2015, 22, 393–401. [Google Scholar] [CrossRef] [Scilit]
- Salah, G.M.J.A.; Romanova, A. Life cycle assessment of felt system living green wall: Cradle to grave case study. Environ. Chall. 2021, 3, 100046. [Google Scholar] [CrossRef] [Scilit]
- Felicioni, L.; Jiránek, M.; Lupíšek, A. Environmental impacts of waterproof membranes with respect to their radon resistance. Sustain. Mater. Technol. 2023, 35, e00541. [Google Scholar] [CrossRef] [Scilit]
- Türkiye Elektrik Üretimi ve Elektrik Tüketim Noktası Emisyon Faktörleri. Enerji Verimliliği ve Çevre Dairesi Başkanlığı—Çevre ve İklim—T.C. Enerji ve Tabii Kaynaklar Bakanlığı. Available online: https://enerji.gov.tr/evced-cevre-ve-iklim-elektrik-uretim-tuketim-emisyon-faktorleri (accessed on 22 July 2026). (In Turkish)
- ISPRA Emission Factors. Climatiq. Available online: https://www.climatiq.io/data/source/ispra (accessed on 22 July 2026).
- Alagöz, I.; Coşkun, E.; Babaoğlu, S.; Kaykaç, R.; Cidacı, A. EÜAŞ Merkez Kampüs 2021 Yılı Karbon Ayak İzinin Hesaplanması [Calculation of the 2021 Carbon Footprint of EÜAŞ Central Campus]. İTÜ Derg.-E 2022, 23, 161–166. (In Turkish) [Google Scholar]

Disclaimer/Publisher’s Note: The statements, opinions and data contained in all publications are solely those of the individual author(s) and contributor(s) and not of MDPI and/or the editor(s). MDPI and/or the editor(s) disclaim responsibility for any injury to people or property resulting from any ideas, methods, instructions or products referred to in the content. |
© 2026 by the authors. Licensee MDPI, Basel, Switzerland. This article is an open access article distributed under the terms and conditions of the Creative Commons Attribution (CC BY) license.