


Abstract
The dual transition, green and digital, has become the strategic axis of the European Union, but quantitative evidence on the extent to which the adoption of digital technologies and artificial intelligence effectively supports the decoupling of economic growth from material consumption remains fragmented. Our study examines this relationship for the 27 Member States of the European Union over the period 2015–2024, using a balanced panel constructed entirely from verifiable official secondary data, without any interpolated values. The dependent variable is resource productivity, expressed as the ratio between gross domestic product and domestic material consumption. The results of the panel data analysis show that the variables are first-order integrated and cointegrated. The fixed-effects model indicates a positive and significant effect of digital adoption on resource productivity, with human capital being the most robust determinant, and research intensity also exerting a positive effect. An analysis of the recent series of AI adoption (2021, 2023, 2024) highlights a positive and significant association with resource productivity. The findings support the idea that digitalization and AI can be complementary to sustainability objectives, but not a substitute for investment in human capital and institutional quality. The study features a two-component architecture: a balanced panel (2015–2024) for digital adoption and an exploratory, repeated cross-sectional analysis for the recent series on artificial intelligence adoption.
Keywords:
artificial intelligence; digital adoption; resource productivity; sustainable economic performance; European Union JEL Classification:
O33; Q56; O44; C23
1. Introduction
The question of whether technological progress can reconcile economic growth with the ecological limits of the planet is now at the heart of the European Union’s economic policy agenda. In contrast to the productivist paradigm of the last century, in which increasing gross domestic product was a sufficient objective in itself, the contemporary framework of sustainability imposes an additional and much more demanding condition, that prosperity be achieved with decreasing material pressure. This desire, formalized in the environmental economics literature by the concept of decoupling, has been institutionally incorporated into a succession of strategic frameworks, from the Europe 2020 Strategy to the European Green Deal and the Digital Decade program, all built on the hypothesis, still insufficiently empirically tested, that the digital and green transitions can reinforce each other, instead of competing for resources and political attention. The mechanism by which digital technologies could improve the material efficiency of the economy is, at a theoretical level, plausible and multiple. Digitalization allows for the optimization of production processes, the reduction in waste, the finer coordination of supply chains and the substitution of part of physical flows with information flows, a process called dematerialization in the literature. E-commerce reorganizes distribution, production management information systems reduce inventories and energy consumption, and sensors and data platforms allow for real-time monitoring of material flows. Artificial intelligence takes this logic further, since, as a general-purpose technology, it is not limited to the automation of tasks, but reconfigures the very process of optimizing economic decisions, from production scheduling to the management of energy and material consumption. This is precisely why, in the European institutional discourse, artificial intelligence is increasingly presented not only as a driver of competitiveness, but also as an instrument of the green transition.
The economic history of information technologies, however, urges us to be cautious. The so-called productivity paradox, formulated as early as the 1980s and nuanced by a whole generation of subsequent studies, has shown that the effects of technology on economic performance are neither automatic nor instantaneous, but depend on complementary investments in skills, organizational capital, and the reorganization of work processes. This lesson is fully relevant to our topic, because it suggests that the simple adoption of a technology, measured by a usage indicator, does not mechanically translate into efficiency gains if it is not accompanied by the economy’s capacity to capitalize on it. Therefore, any serious analysis of the relationship between digitalization and sustainability must also take into account the role of the structural factors that condition this capitalization, such as human capital, research effort, and the quality of governance.
Another aspect that must be emphasized is data availability, which directly shaped the design of this study. Although artificial intelligence dominates the public debate, its statistical measurement at the enterprise level is very recent: Eurostat only started the harmonised collection of AI adoption indicators in 2021, and the available series are short and unbalanced. This means that a long panel, capable of supporting a full series of unit root and cointegration tests, cannot be built directly on the AI variable. The solution adopted here is to build the core panel on a robust proxy of digital transformation, covering the entire decade, and to analyse the actual AI adoption series in a dedicated section, as a repeated cross-sectional structure.
The analysis comprises two complementary components with distinct epistemic roles. The primary component utilizes a balanced panel covering the 2015–2024 decade and employs a proxy for digital adoption with complete temporal coverage (the only strategy enabling the rigorous application of unit root and cointegration tests). The secondary component, focusing on artificial intelligence, is explicitly exploratory: the Eurostat AI adoption series covers only the years 2021, 2023, and 2024 (79 observations); consequently, its results should be interpreted as early associative evidence, noteworthy precisely for its novelty, rather than as the study’s inferential core. The contribution of the AI-focused analysis lies in providing some of the first EU-27-level estimates of the link between AI diffusion in enterprises and resource productivity, while the contribution of the decade-long component lies in the long-run equilibrium framework within which this link can be interpreted.
Against this background, our paper aims to answer a precise question: to what extent is the adoption of digital technologies and artificial intelligence associated with sustainable economic performance, measured by resource productivity, at the level of the European Union Member States? The contribution of the study is twofold. First, it builds a balanced and fully verifiable panel for the 27 Member States over a decade, using exclusively official secondary data from Eurostat and the World Bank, with transparent marking of cells unavailable at the source and without any value estimated by the authors. Second, it applies a classical econometric sequence, widely recognized and easily replicated, which allows for independent verification of the results by any reader who has a standard econometric program, which is why the entire data set is made available. Compared to previous panel studies on digitalization and sustainability in Europe, which predominantly employ composite indices like DESI and environmental variables such as CO2 emissions or energy intensity, we address a twofold gap: (i) we use resource productivity, a core circular economy indicator rarely utilized as a dependent variable in this literature, and (ii) we link, within the same empirical framework, the decade-long proxy for digital adoption with the newly emerging series on artificial intelligence adoption.
The rest of the paper is organized as follows. Section 2 reviews the relevant literature and formulates the working hypotheses. Section 3 describes the data, variables and econometric methodology. Section 4 presents and discusses the empirical results in detail, accompanying each table with a detailed economic interpretation. Section 5 reports the analysis dedicated to artificial intelligence. Section 6 discusses the results in relation to the literature, while Section 7 presents the conclusions, public policy implications, limitations, and future research directions.
2. Literature Review
2.1. Digitalization, Productivity and Complementarities
Ever since Solow [1] formulated the famous productivity paradox, the relationship between digital technologies and productivity has been characterized by a persistent tension between optimistic expectations and ambiguous empirical evidence. Subsequent research has shown that the effects of information technologies on productivity are neither automatic nor instantaneous: Brynjolfsson and Hitt [2] demonstrated, using firm-level data, that such gains materialize only when investment in equipment is accompanied by complementary investments in organizational capital, skills, and the redesign of work processes. This same logic appears at the aggregate level in the literature regarding the US productivity resurgence of the 1990s, where Jorgenson [3], Oliner and Sichel [4], and Stiroh [5] attributed the acceleration in growth precisely to the diffusion of information and communication technologies. The perspective of complementarities remains highly relevant to our topic, as it suggests that the mere adoption of a digital technology does not mechanically translate into efficiency gains unless accompanied by an adequate level of human capital and a favorable institutional framework.
The placement of digital technologies, and subsequently artificial intelligence, in the category of general-purpose technologies proposed by Bresnahan and Trajtenberg [6] provides the conceptual framework that explains why their effects diffuse slowly and unevenly: a generic technology becomes a growth engine only as complementary innovations accumulate downstream, in the user sectors. Empirical syntheses on the relationship between ICT and productivity, such as that carried out by Cardona, Kretschmer and Strobel [7], confirm that the impact of digitalization is highly heterogeneous across sectors and countries, being more pronounced in economies with a high level of human capital and strong institutions; convergently, Czernich et al. [8] have identified a positive causal effect of broadband infrastructure on economic growth. This heterogeneity has a direct methodological consequence, which structures our entire empirical analysis: it justifies the use of panel models with individual effects, capable of absorbing unobserved structural differences between countries, which would otherwise contaminate the estimates and lead to misleading conclusions. An economy with a materials-intensive industrial tradition and a service-oriented economy cannot be naively compared without controlling for these background features.
2.2. Resource Efficiency and the Decoupling Hypothesis
The concept of decoupling, systematized by the United Nations Environment Programme [9], distinguishes between relative decoupling, in which resource consumption grows more slowly than economic output, and absolute decoupling, in which resource consumption falls in absolute terms while the economy continues to grow. Long-term documentation of material flows by Krausmann et al. [10], as well as accounting for the material footprint of nations proposed by Wiedmann et al. [11], has shown that absolute decoupling remains rare and fragile when materials incorporated in international trade are taken into account. At a theoretical level, the relationship between the level of development and environmental pressure has been described by the environmental Kuznets curve proposed by Grossman and Krueger [12], which postulates a nonlinear relationship between income and environmental degradation. Resource productivity, as an aggregate indicator, captures the direction and scale of this process and has been adopted as a key benchmark in the European Union’s circular economy dashboard, being preferred precisely because it summarizes in a single figure the ratio between the economic value generated and the material pressure exerted.
The literature has also highlighted that Member States exhibit widely varying resource productivity trajectories, reflecting differences in both economic structures and levels of technological maturity, which makes the European Union a particularly suitable setting for comparative analysis. A growing body of this literature has directly explored the role of digitalization as a driver of resource efficiency, hypothesizing that digital technologies can reduce the material intensity of production through dematerialization and by facilitating circular business models. This perspective aligns with the Porter hypothesis [13], which posits that well-designed environmental constraints can trigger innovations that simultaneously reduce material pressure and costs. However, findings remain mixed: some studies identify a net efficiency gain, while others highlight the “rebound effects” analyzed by Sorrell [14], whereby efficiency gains are partially offset by increased consumption driven by lower costs, as well as the material and energy footprint inherent to digital infrastructure itself. This ambiguity renders the net direction of the relationship a purely empirical question, which the present study aims to resolve for the European context.
2.3. Artificial Intelligence, Human Capital and Governance
The recent literature on the economic effects of artificial intelligence, building upon the framework of general-purpose technologies [6], treats it as an innovation with transformative potential comparable to that of electricity or the internal combustion engine. Growth models incorporating artificial intelligence, such as the one proposed by Aghion, Jones, and Jones [15], demonstrate that task automation can sustainably boost growth rates; meanwhile, Acemoglu and Restrepo [16] emphasize that the net impact on productivity and employment depends on the balance between automated tasks and newly created ones. For their part, Cockburn, Henderson, and Stern [17] document artificial intelligence’s capacity to act as a general-purpose technology for invention, thereby accelerating the research process itself. From a sustainability perspective, Vinuesa et al. [18] show that artificial intelligence can support the majority of the Sustainable Development Goals by helping to optimize energy and material consumption, enabling predictive maintenance that extends asset lifespans, and facilitating the design of more efficient products, although these same technologies raise concerns regarding the energy consumption of the computing infrastructure required to train the models.
A common and particularly significant theme in this literature is the emphasis on “absorptive capacity”, a concept introduced by Cohen and Levinthal [19], which posits that an organization can only capitalize on a new technology if it possesses a pre-existing stock of knowledge.
Transposed to the macroeconomic level by Nelson and Phelps [20] and confirmed empirically by Benhabib and Spiegel [21], the same idea links the capacity to adopt and diffuse technology to the stock of human capital, following the endogenous growth theories of Lucas [22] and Romer [23]. That is why Brynjolfsson, Rock and Syverson [24] explain the gap between high expectations related to artificial intelligence and still modest productivity gains through a new productivity paradox, attributed to the time needed to accumulate intangible complementary investments. This literature has a direct consequence on the specification of our model: it explains why we include, alongside the digital variable, tertiary education as a proxy for human capital, R&D intensity as a measure of innovative effort, and government effectiveness as an indicator of institutional quality, conditions that mediate the transformation of technology into sustainable economic performance and whose omission would generate distorted estimates through omitted variables.
Based on this body of literature, the study formulates three working hypotheses, which will be systematically confronted with the data. The first hypothesis claims that digital adoption is positively associated with resource productivity. The second hypothesis claims that structural determinants, in particular human capital and research intensity, have a positive and robust effect on material efficiency. The third hypothesis claims that the degree of adoption of artificial intelligence is positively associated with resource productivity at the level of European economies.
2.4. Recent Empirical Evidence and the Research Gap
Beyond the foundational literature cited above, a body of empirical research has begun to directly examine the link between digitalization and environmental pressure. Regarding energy consumption, Lange, Pohl, and Santarius [25] show that the efficiency gains from ICT can be partially offset by rebound effects and the footprint of digital infrastructure itself, meaning the net direction of the relationship remains an empirical question. At the European regional level, Bianchini, Damioli, and Ghisetti [26] document that the “twin transition”, green and digital, yields heterogeneous environmental effects depending on local economic structures. However, recent empirical studies based on European data focus almost exclusively on CO2 emissions, energy intensity, or composite digitalization indicators; resource productivity, the official indicator in the EU circular economy monitoring framework, is very rarely used as a dependent variable. Furthermore, the harmonized Eurostat series on AI adoption in enterprises, available only since 2021, has not yet been econometrically linked to the material performance of European economies. This is precisely the gap addressed by the present study: (i) using resource productivity as a dependent variable within a fully verifiable ten-year EU-27 panel, and (ii) relating actual AI adoption data to material efficiency at this level. Consequently, the working hypotheses should be viewed not as novel claims in themselves, but as vehicles for testing these relationships within an as-yet undocumented empirical context.
3. Data and Methodology
3.1. Data, Variables and Sample
The study uses a balanced panel of the 27 Member States of the European Union, observed annually between 2015 and 2024, resulting in 270 observations for the variables with full decennial coverage. All data come from official secondary sources and are fully reproducible. The dependent variable and most of the regressors are extracted from the Eurostat database, by directly querying the dissemination interface, and the governance quality indicator comes from the World Bank’s Worldwide Governance Indicators database. No gaps were filled by interpolation or estimation; cells unavailable at the source were marked as missing and treated by slightly unbalanced panel estimation methods, which use all available information without imposing artificial values. Table 1 presents the operational definitions, theoretical role and source of each variable.
Table 1.
Variable definitions, theoretical role, and data sources.
The choice of the digital proxy deserves a separate justification. Instead of a composite index like DESI, whose publication has been discontinued and whose methodology has changed, we preferred an individual indicator, transparent and comparable over time: the share of manufacturing companies that sell via e-commerce. The manufacturing sector is, in theory, the most relevant to our topic, since it is here that the flow of materials and the digitalization of production processes intersect most directly, in the logic of the Industry 4.0 paradigm. This proxy does not claim to capture the full complexity of digital transformation, but it offers a consistent and verifiable measure of the penetration of digital practices into real economic activity.
We selected e-commerce sales by manufacturing enterprises for three reasons: (i) it is the only enterprise digitalization indicator with complete annual coverage and a consistent methodology throughout the 2015–2024 decade, a prerequisite for unit root and cointegration tests; (ii) in the manufacturing sector, e-commerce adoption is not merely a marketing channel but typically entails the integration of production, inventory, and supply chain management systems, thereby serving as an observable marker of a broader digital transformation aligned with Industry 4.0 principles; (iii) the indicator is directly verifiable at the source, requiring no processing by the authors. However, we acknowledge that this proxy captures only one dimension of digitalization and may also partially reflect the growth of the platform economy. Alternative indicators, such as the share of enterprises using cloud computing or big data analytics, would be conceptually closer to deep digital transformation; however, the corresponding Eurostat series contain breaks and methodological changes that preclude the construction of a balanced ten-year panel. Their use remains a logical avenue for robustness checks as the data series mature, and this limitation is explicitly addressed in the conclusions.
Clarifications regarding the control variables are also warranted. The share of the 25–34 age group with tertiary education is used as a proxy for human capital, not because it captures the quality of educational systems, but because it measures the skill stock of the cohort that actually adopts and operates new digital technologies; furthermore, it is the official harmonized indicator (sdg_04_20) used in European monitoring, ensuring comparability across Member States. Regarding R&D intensity, Gross Domestic Expenditure on R&D (GERD) includes both the public and business enterprise components (BERD), with the latter predominating in many Member States; this variable is introduced not as a measure of firm-level digitalization, but as a measure of the overall innovation effort that determines technology absorption capacity. We acknowledge, however, that both proxies operate at a high level of aggregation, a limitation discussed in the final section.
The dependent variable also entails a structural limitation that we acknowledge: Domestic Material Consumption (DMC) does not account for materials embodied in imports of intermediate goods; consequently, part of the apparent decoupling may reflect the outsourcing of resource-intensive production. A natural robustness test would involve replacing DMC with the Material Footprint, derived from multi-regional input–output databases such as EXIOBASE; however, since these series are not officially available in a complete annual format covering the entire decade and all Member States, we identify this extension as a priority for future research, and the current results should be interpreted as referring to territorial material efficiency rather than consumption-based efficiency.
3.2. Specification of the Econometric Model
Since the dependent variable is strictly positive and has a right-skewed distribution, it is entered into the model in logarithmic form, which allows the coefficients to be interpreted as semi-elasticities and attenuates the influence of extreme values. The basic specification links the logarithm of resource productivity to the digital variable and the set of structural determinants, according to Equation (1).
where the index *i* denotes the country, the index *t* denotes the year, *μᵢ* represents the unobserved individual effect specific to each country, assumed to be constant over time, and *εᵢₜ* is the idiosyncratic error term. The coefficients *β* capture the partial association between each determinant and the logarithm of resource productivity, after isolating the effects of the other factors.
ln(RESPRODit) = α + β1DIGIit + β2RDit + β3HCit + β4GOVit + β5GFCFit + μi + εit
The estimation strategy follows a standard sequence widely used in applied panel economics and easily replicated in any econometric software. First, the statistical properties of the variables are examined using descriptive statistics and a correlation matrix, supplemented by the calculation of variance inflation factors to detect potential multicollinearity issues. Second, given that the time span is long enough for stationarity properties to become relevant, three widely recognized panel unit root tests are applied: the Levin–Lin–Chu test [27], which assumes an autoregressive parameter common to all units, and the Im–Pesaran–Shin [28] and ADF–Fisher [29] tests, which allow for dynamic heterogeneity across countries and are, therefore, more suitable for a panel of diverse economies.
Third, if the variables prove to be first-order integrated, the existence of a cointegration relationship is tested by the Pedroni test [30], the most widely used in the panel literature for its ability to allow for heterogeneity of relationships between units, complemented by the Kao test [31]. Fourth, the fixed-effects and random-effects models are estimated, separated by the Hausman test [32], whose null hypothesis postulates that the individual effects are not correlated with the regressors. Rejection of this hypothesis recommends the fixed-effects estimator, and non-rejection of it recommends the more efficient random-effects estimator. This procedure, although classical, is fully adequate for the nature of our data and has the decisive advantage of transparency and integral reproducibility.
An additional methodological clarification regarding the time dimension is necessary. Panel unit root and cointegration tests possess asymptotic properties, and with T = 10, their power is limited; consequently, their results should be interpreted as consistency checks, serving as a safeguard against spurious regressions, rather than as definitive evidence regarding the series’ integration properties. For this reason, the study’s inferential core remains the fixed/random effects framework, which is robust to this criticism, and the substantive conclusions do not rely on the results of the asymptotic tests.
4. Results
Table 2 presents the descriptive statistics of the variables used in the analysis. Resource productivity averages around €1.90 per kilogram, but with considerable dispersion, ranging from around €0.30 per kilogram in Bulgaria to over €6.0 per kilogram in the Netherlands. This amplitude reflects a substantive economic difference: economies with structures oriented towards services and high-value-added industries extract almost twenty times more value from each kilogram of materials than economies still in resource-intensive phases of development. Digital adoption averages around 21 percent, but varies from very low thresholds to values above 50 percent, signaling significant digital divides within the Union.
Table 2.
Descriptive statistics (EU27, 2015–2024).
Human capital, measured by the share of young people with tertiary education, has an average of almost 43 percent and a wide dispersion, from about 22 percent to over 65 percent, reflecting historical differences in the development of higher education systems. Research and development intensity has an average of 1.68 percent of gross domestic product, still below the European target of three percent, and gross fixed capital formation presents the most pronounced asymmetry, largely attributable to the atypical values recorded by Ireland, whose national accounting is influenced by the activity of large multinational corporations. The overall picture is that of a deeply heterogeneous Union, which confirms, even at this preliminary stage, the need for a model that controls for unobserved structural differences between countries.
The correlation matrix in Table 3 provides a first glimpse of the bilateral associations between the variables, before any statistical control. Resource productivity correlates most strongly with governance quality, with a coefficient of 0.56, followed by human capital with 0.41, R&D intensity with 0.33, and digital adoption with 0.32. These positive correlations are in line with theoretical expectations and suggest, at a descriptive level, that economies with more effective institutions, a better educated workforce, a stronger research effort, and a higher degree of digitalization tend to use materials more efficiently.
Table 3.
Pearson correlation matrix.
It should be emphasized, however, that these simple correlations say nothing about causality or partial effects, because the explanatory variables are themselves correlated with each other, as shown by the high correlation between research and governance of 0.70. It is precisely in order to isolate the specific contribution of each factor, after eliminating the influence of the others, that multivariate regression analysis is necessary. The slightly negative correlation between capital formation and resource productivity of minus 0.08 deserves special attention, as it anticipates a result that will be confirmed in the regression and which reflects the fact that episodes of intense investment in physical capital are accompanied by increased consumption of materials. To check for multicollinearity, variance inflation factors were calculated, the maximum value of which, at around 3.5, is well below the warning threshold of 10, indicating that all variables can be maintained simultaneously in the model.
Since the time interval covers ten years, checking the stationarity of the variables becomes necessary to avoid the risk of spurious regressions, in which apparently strong relationships between non-stationary series are, in fact, simple statistical artifacts devoid of economic significance. Table 4 reports the results of three unit root tests on the panel. The Im–Pesaran–Shin and ADF–Fisher tests, which allow for heterogeneity of dynamics between countries and are therefore the most appropriate for a panel of diverse economies such as the European ones, do not reject the null hypothesis of a unit root for any of the variables when they are expressed in level, the probability values being, without exception, large. The Levin–Lin–Chu test, which assumes a common autoregressive parameter and is, consequently, more restrictive, provides a mixed verdict, in favor of stationarity only for some of the variables; this divergence is, however, common in empirical practice and is interpreted, in a standard way, in favor of the conclusion suggested by the heterogeneous tests, which are more realistic for our data.
Table 4.
Panel unit root tests (statistics; p-values in parentheses).
However, the decisive factor is the behavior of the variables in the first difference, where all three tests converge unequivocally: the null hypothesis of a unit root is categorically rejected for each variable, with practically zero probability values. This result suggests, subject to the caution necessitated by the short time dimension of the panel (T = 10), where tests have limited power, that the variables can be treated as integrated of order one, that is, non-stationary in levels but stationary in first differences.
The finding has a double methodological consequence: on the one hand, it excludes naive estimation in level without prior verification of cointegration; on the other hand, it paves the way for testing the existence of a long-term equilibrium relationship between the variables, the subject of the next subsection.
The finding that all variables are first-order integrated naturally raises the question of whether there is a long-term equilibrium relationship between them, that is, whether a certain linear combination of them is stationary, in which case the level estimation is not only legitimate, but even recovers the parameters of the equilibrium relationship. To answer this question, we applied the Pedroni cointegration test [30], the most widely used in the panel literature due to its ability to allow for heterogeneity of relationships between units, complemented by the Kao test [31], which imposes homogeneity of coefficients. The results are summarized in Table 5. Of the seven Pedroni statistics, those built on the Phillips–Perron principle and Augmented Dickey–Fuller (the panel PP statistic, the group PP statistic, and the group ADF statistic) reject the null hypothesis of no cointegration at the one percent threshold, while the variance and rho statistics, known for their lower power in finite samples, do not reject it. The Kao test, in turn, confirms the existence of cointegration at the ten percent threshold (p = 0.059).
Table 5.
Panel cointegration tests.
This pattern, in which the Pedroni statistics with the highest power in finite samples, together with the Kao test, indicate the presence of cointegration, is frequently encountered in the empirical panel literature and is standardly interpreted as evidence of a long-run equilibrium relationship between resource productivity and its determinants. From an economic point of view, this result is significant: it shows that the link between material efficiency, on the one hand, and digitalization, human capital, research, governance and investment, on the other, is not a fleeting or cyclical one, but a stable one, to which economies tend to return over time. The existence of a cointegration relationship also legitimizes the level estimates reported in the following subsection, with the caveat that these should be seen as capturing a long-term equilibrium association, rather than a strictly causal relationship. It should be noted, however, that at T = 10, these tests exhibit imperfect asymptotic properties; consequently, the evidence of cointegration should be viewed as indicative, and the study’s substantive interpretation relies on fixed-effects estimators rather than on the cointegration tests themselves.
Table 6 presents the results of the three estimated specifications: the pooled model, which completely ignores heterogeneity across countries, the fixed-effects model, and the random-effects model. The comparison of the estimators is, in itself, instructive and deserves comment before interpreting the coefficients. The pooled model produces unstable and sometimes counterintuitive coefficients, such as the strong positive governance effect of 0.63, which reflects differences in level between countries, that is, the fact that well-governed countries are also rich and materially efficient, rather than a genuine relationship within each country. It is precisely these unobserved structural differences that are absorbed by the individual-effects models, which explains why their estimates are considerably more credible. The poolability test categorically rejects the homogeneity hypothesis, confirming that the individual country-specific effects are significant and that the pooled model is inadequate.
Table 6.
Panel estimates (dependent variable: ln RESPROD).
The separation between the fixed-effects and random-effects models was achieved by the Hausman test, whose null hypothesis postulates that individual effects are not correlated with the explanatory variables, in which case the random-effects estimator would be both consistent and efficient. The test statistic, 11.97, distributed as a chi-square with five degrees of freedom, has a probability value of 0.035, which leads to the rejection of the null hypothesis. Therefore, the fixed-effects model is the statistically preferred one and forms the basis of our interpretation, as it consistently controls for any country-specific characteristic that is constant over time, such as natural resource endowment, inherited industrial structure, or administrative culture.
The results of the fixed-effects model largely confirm theoretical expectations and provide a coherent picture of the determinants of material efficiency. Digital adoption shows a positive and statistically significant association at the one percent level, a result consistent with the study’s first hypothesis: even within the same country, years in which the digitalization of the manufacturing sector advanced were, on average, years with higher resource productivity. The magnitude of the effect is modest but economically relevant, consistent with the idea that digitalization contributes to material efficiency gradually, through countless incremental adjustments to production processes, rather than through a spectacular leap.
Human capital stands out as the most robust and stable determinant, with a significant coefficient at the one percent threshold in both the fixed-effects and random-effects models: a one percentage point increase in the share of young people with tertiary education is associated with an approximately 1.4 percent increase in resource productivity, confirming the central role of education in decoupling growth from material consumption. Research and development intensity, in turn, has a positive and significant coefficient, consistent with the hypothesis that innovation effort generates resource-saving technologies and processes. Gross fixed capital formation presents a negative and significant coefficient, a result that, although it may seem counterintuitive at first glance, is fully consistent with the intuition developed previously: episodes of intense investment in physical capital are accompanied by increased material consumption, which temporarily reduces the ratio between value added and materials consumed. Finally, the governance coefficient, although positive and highly significant in the pooled model, becomes small and marginal in the fixed-effects model, suggesting that the apparent role of institutional quality largely reflects structural differences between countries, rather than a relationship that manifests itself within each country from one year to the next.
The two seemingly counterintuitive results warrant a more careful economic interpretation that goes beyond merely reporting the coefficients. The negative coefficient for gross fixed capital formation is explained by the physical nature of the investment cycle: investments—particularly in construction and infrastructure, which account for a significant share of capital formation in many member states—drive immediate and massive consumption of materials (cement, steel, aggregates), whereas the efficiency gains embodied in new capacities materialize only in subsequent years. Within a given country, a year of intensive investment is thus, almost mechanically, a year of lower resource productivity; this short-term composition effect does not contradict the positive long-term role of capital but rather demonstrates that the relationship between investment and material efficiency depends on the time horizon. Regarding government efficiency, the weakening of the coefficient under fixed effects has a precise econometric explanation: the indicator shows very little variation over time within each country, meaning that almost all its variation is absorbed by the fixed effects, leaving only the limited and noisy within-country component to be identified. The correct interpretation is not that institutions do not matter, but rather that they act as a structural background condition, a foundation differentiating efficiency levels across countries, rather than as a lever for annual adjustment. This implies that fixed-effects estimates isolate short- and medium-term within-country associations, whereas institutional factors exert their influence primarily through the cross-national dimension of the data.
5. Adoption of Artificial Intelligence
The main model was built, for reasons of temporal coverage, on a comparable digital proxy over the entire decade. However, to directly address the question formulated in the title of the paper, this section capitalizes on the actual series of adoption of artificial intelligence collected by Eurostat. Since this series is only available for the years 2021, 2023 and 2024 at the level of all Member States, it does not allow for the construction of a long panel and is therefore analyzed as a repeated cross-sectional structure, with 79 usable observations. This methodological choice is stated explicitly rather than concealed: using such a recent series without interpolation or imputed values preserves the verifiability that the study prioritizes. Although the limited time span necessitates a modest methodology, the actual AI adoption series offers new evidence of specific interest to readers in a field where harmonized statistical measurement has only just begun.
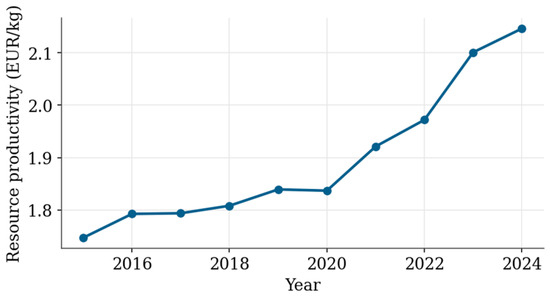
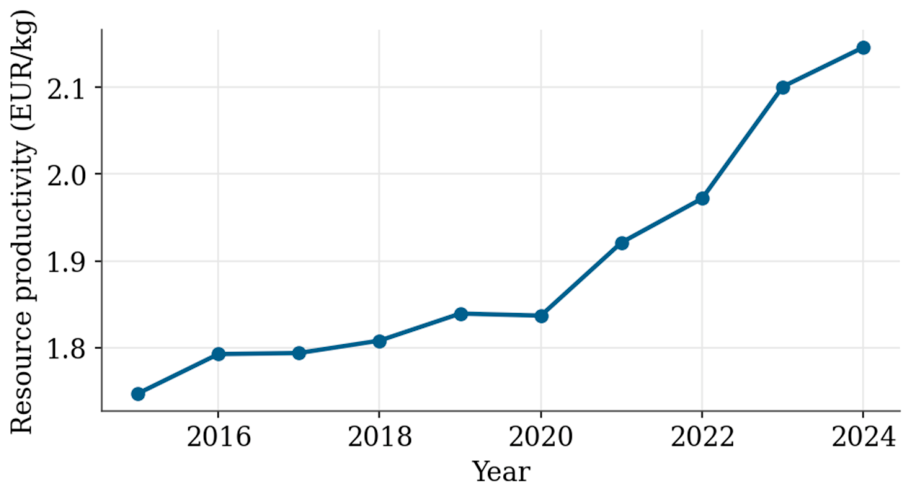
Figure 1 illustrates the upward trajectory of average resource productivity in the European Union over the entire analyzed interval, highlighting the constant, albeit gradual, progress of material efficiency. Against this backdrop of structural improvement in efficiency, the acceleration of the adoption of artificial intelligence in recent years overlaps, which raises the natural question of whether the two phenomena are related.
Figure 1.
Evolution of mean resource productivity in the EU27, 2015–2024. Source: Compiled by the authors based on Eurostat data (env_ac_rp).
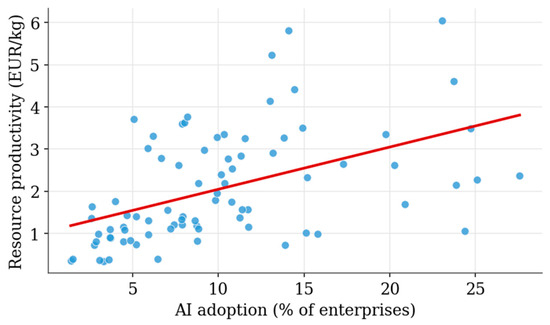
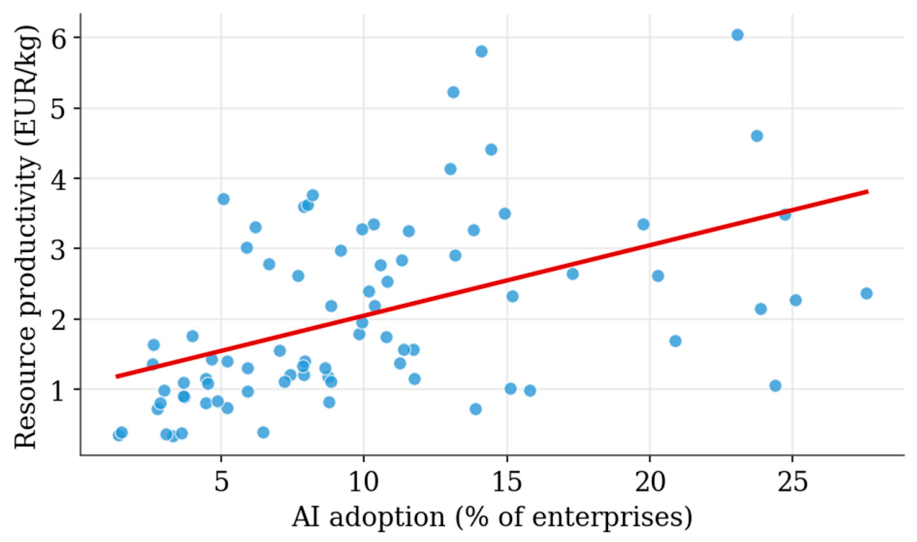
The statistical analysis provides a relatively robust and affirmative answer. The correlation coefficient between the degree of adoption of artificial intelligence and resource productivity is 0.51 over the logarithmic form of the dependent variable, indicating a moderate to strong positive association, as graphically represented in Figure 2, where each point corresponds to a country–year pair, and the regression line has a clear positive slope. When the relationship is estimated in a random-effects regression framework, controlling for research intensity, human capital, capital formation, and governance quality, the coefficient on artificial intelligence adoption remains positive and significant at the one percent level, with a value of approximately 0.007. The economic interpretation is straightforward: a one percentage point increase in the share of enterprises using artificial intelligence technologies is associated with an approximately 0.7 percent increase in resource productivity.
Figure 2.
Relationship between AI adoption and resource productivity (2021–2024). Source: Compiled by the authors based on Eurostat data (isoc_eb_ai, env_ac_rp).
The econometric results of this section are summarized in Table 7, which reports three specifications: the pooled model with controls, the random effects model, and a bivariate specification. The coefficient on AI adoption is positive in all three, significant at the one percent threshold in the random effects and bivariate specifications, which supports the third hypothesis of the study. It should be emphasized, in the spirit of transparency that governs the entire approach, that this analysis, due to the reduced temporal dimension, cannot support causality claims, nor does it allow for the application of the battery of unit root and cointegration tests reserved for the main model.
Table 7.
Dedicated analysis of AI adoption (dependent variable: ln RESPROD).
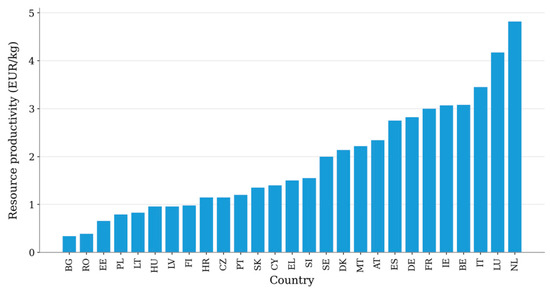
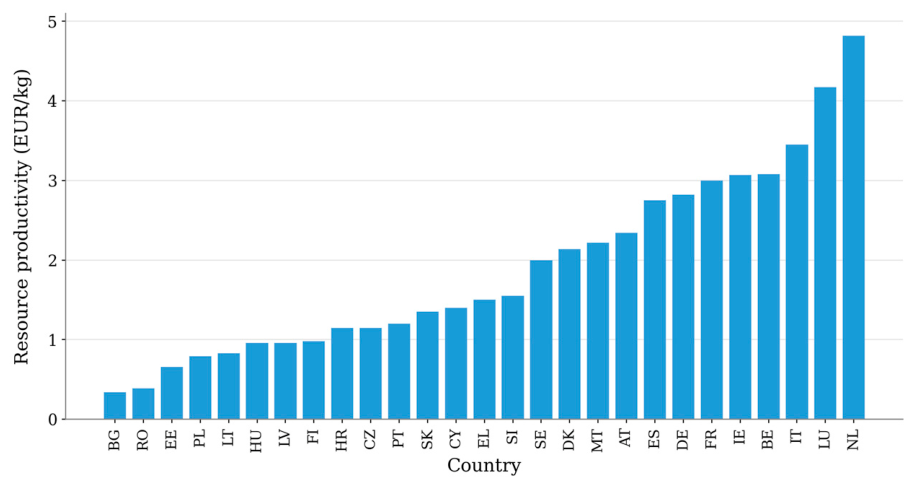
These results should be read as robust correlational evidence, showing that in European countries where AI adoption has advanced more rapidly, resource productivity has been, on average, higher. Taken together with the results of the decennial model, where digital adoption, human capital and research are confirmed as significant determinants, this finding suggests that AI most likely acts in complementarity with these factors, as a natural extension of the broader digital transformation process, rather than as a substitute for investment in education and research capacity. Figure 3 places the results in a comparative context, highlighting the considerable difference between the economies with the highest material efficiency, such as the Netherlands and Luxembourg, and those with the lowest resource productivity, such as Bulgaria and Romania, which reconfirms the structural heterogeneity of the Union.
Figure 3.
Mean resource productivity by country (EU27, 2015–2024 average). Source: Compiled by the authors based on Eurostat data (env_ac_rp).
The pronounced heterogeneity visible in Figure 3 is not merely a descriptive artifact but can be explained by the theoretical mechanisms discussed in Section 2. Economies with high resource productivity and advanced AI adoption (the Netherlands, Luxembourg, Denmark, and Finland) combine service-oriented economic structures and high-value-added industries with substantial human capital stocks and high-performing research systems; these are precisely the complementarities that, according to the absorptive capacity thesis, transform technology into efficiency. At the opposite end of the spectrum, Central and Eastern European economies, characterized by continued resource-intensive specialization and AI adoption rates below the EU average, illustrate a scenario where a lack of complementarities limits the effective utilization of technology. Consequently, the association between AI and material efficiency is not uniform across these groups; it appears to be contingent upon the stage of digital transformation and sectoral structure. This suggests the presence of moderating effects that the current dataset size does not allow us to estimate formally; interactions such as AI×human capital or AI×digitalization stage would consume degrees of freedom that the 79 observations do not provide. Formally testing these non-linearities and moderating effects across country groups will become feasible as the Eurostat time series extends, representing the natural next step for this analysis.
6. Discussions
We specify at the outset the interpretive framework for this section: all results discussed below are conditional equilibrium associations, and the term “effect” is used exclusively in a statistical, not a causal, sense.
The empirical results presented above can now be interpreted in the light of the three theoretical pillars set out in the literature review. The positive and significant effect of digital adoption on resource productivity, obtained in the fixed effects model (β = 0.004, p < 0.01), confirms the first hypothesis and is in line with the complementarity perspective formulated by Brynjolfsson and Hitt [2]: the modest magnitude of the coefficient is fully consistent with the idea that general-purpose technologies [6] produce their effects slowly and incrementally, as complementary investments accumulate in the user sectors [7]. The fact that the digital effect, insignificant in the pooled specification, becomes significant only after the introduction of individual fixed effects empirically illustrates exactly the structural heterogeneity highlighted by the European literature [7,8] and validates the methodological choice of an estimator that absorbs unobserved differences between countries.
The most robust result of the study—the dominant role of human capital, with a stable coefficient around 0.014, significant at the one percent threshold in both specifications—provides direct empirical support for the absorptive capacity thesis [19,20] and endogenous growth theories [21,22,23]. It confirms the second hypothesis and shows that, in the European space, the decoupling of growth from material consumption [9] is driven more by the stock of skills and the R&D effort than by digitalization per se. The positive coefficient of R&D intensity reinforces this interpretation and resonates with Porter’s hypothesis [13], according to which innovation is the lever that reconciles economic and environmental performance. In contrast, the negative sign of gross fixed capital formation, far from contradicting theory, reflects the high material content of investment episodes and is consistent with the material flow literature [10,11], which links physical accumulation to increased material pressure in the short term.
The behavior of the governance coefficient deserves a separate discussion, because it illustrates the added value of the panel approach. Strongly positive and significant in the pooled specification, but small and marginal under fixed effects, it indicates that the apparent role of institutional quality largely reflects stable structural differences across countries, captured by the high correlation between governance and resource productivity in Table 3, rather than a relationship that manifests itself within each country from one year to the next. This nuance, which would have remained invisible in a simple cross-sectional analysis, reinforces the methodological warning of the literature on heterogeneity [7] and argues for caution in the causal interpretation of aggregate institutional indicators. The analysis dedicated to the AI adoption series provides the evidence closest to the central theme of the paper. The positive and significant association between the degree of adoption of artificial intelligence and resource productivity, found in both the simple correlation (r = 0.51) and the random effects model with controls (β = 0.007, p < 0.01), provides empirical support for the third hypothesis and for the thesis, supported by Vinuesa et al. [18], that artificial intelligence can be put to the service of sustainability goals. At the same time, the fact that the effect loses its strength in the pooled specification without individual effects is fully compatible with the modern productivity paradox described by Brynjolfsson, Rock and Syverson [24]: only a few years after the widespread diffusion of these technologies, aggregate gains are still incipient and dependent on the accumulation of complementary capital. The result should therefore be read as robust correlational evidence, and not as an established causal relationship.
The study’s originality stems from three choices we consider distinctive relative to the existing literature. First, unlike research that addresses digitalization and sustainability separately, this paper integrates them into a single-panel econometric framework that explicitly links technological adoption to resource productivity, a sustainability indicator rarely used as a dependent variable in the digitalization literature. Second, the analysis combines a digital proxy comparable across the entire 2015–2024 decade with the recently available series on artificial intelligence adoption; this avoids both the anachronism of discussing artificial intelligence using generic indicators and the loss of the temporal depth required for cointegration tests. Third, the entire empirical framework relies exclusively on official secondary data, with no interpolated values, thereby guaranteeing the full reproducibility of every reported statistic. Through these features, the study complements the European literature on the twin transition by providing rigorous quantitative evidence regarding a relationship that has hitherto been insufficiently documented. The study’s novelty is not methodological (the econometric approach employed is deliberately standard, precisely to ensure replicability), but rather empirical and related to its positioning: the use of a rarely utilized dependent variable (resource productivity), the linking of a harmonized AI adoption series to this indicator across the EU-27, and the fully verifiable nature of the dataset. In other words, the paper does not propose a new estimation tool; instead, it contributes a rigorously documented empirical result to the literature in an area where evidence was previously lacking.
One avenue opened, though not exhausted, by this analysis concerns non-linearities and heterogeneity across country groups. It is plausible that the returns on digitalization regarding material efficiency depend on the stage of digital transformation, showing increasing returns initially, as critical skill thresholds are reached, and diminishing returns thereafter, as well as on moderating factors such as human capital or governance quality, which can act as complements to technology. However, formally estimating these specifications (using quadratic terms, interaction effects, or sub-panels by country group) on the current dataset would fragment an already limited sample and risk overfitting the results; we therefore designate these as an explicit agenda for future research, alongside re-estimating the model using alternative digitalization proxies (e.g., cloud computing, big data) and the material footprint derived from EXIOBASE, as these data series become available for the full panel.
7. Conclusions and Economic Policy Implications
Our study investigated the relationship between the adoption of digital technologies and artificial intelligence, on the one hand, and sustainable economic performance measured by resource productivity, on the other hand, using a balanced and fully verifiable panel of the 27 European Union Member States over the period 2015–2024, complemented by a dedicated analysis of the recent series of artificial intelligence adoption. By construction, the entire empirical apparatus relied exclusively on official secondary data from Eurostat and the World Bank, without any interpolated or estimated values by the authors, precisely to guarantee the full reproducibility of the results in any standard econometric program.
Three conclusions emerge from the analysis. First, the economic and environmental variables used prove to be integrated of the first order and form a cointegration relationship, which confirms the existence of a stable long-term equilibrium link between resource productivity and its structural determinants. Second, in the fixed-effects model, preferred by the Hausman test, digital adoption shows a positive and significant association with material efficiency, but the strongest determinants remain human capital and R&D intensity, while capital formation has a negative short-term effect, attributable to material consumption associated with investment. Third, when using the actual AI adoption series, a positive and significant association with resource productivity is found, which provides direct, albeit cautious, empirical support for the central thesis of the paper.
These results provide several policy implications that we consider relevant for European policymakers. The fact that tertiary education and research emerge as the strongest determinants of material efficiency clearly indicates that investment in human capital and innovation remains the fundamental lever for sustainable growth, and that digitalization and AI policies only reach their full potential when they are accompanied by a well-trained workforce and a high-performance research system. Treating these policies as separate silos would miss the very synergies that make technology ecologically productive. The positive association between AI adoption and resource productivity provides an argument for supporting the diffusion of these technologies, in line with the policy recommendations formulated by Agrawal, Gans and Goldfarb [33], but the underlying message remains that of complementarity, not substitution. The study naturally also has limitations that must be openly acknowledged. The most important one concerns the short time span of the AI adoption series, which required its treatment as a repeated cross-sectional structure and prevented the formulation of firm causal conclusions. Also, the digital proxy used in the decennial model captures only one dimension of the digital transformation, and resource productivity, although a valuable synthetic indicator, does not exhaust the broad spectrum of sustainability, which also includes social and environmental quality dimensions insufficiently reflected in a single aggregate report. Future research could overcome these limitations as AI adoption series become longer, allowing for dynamic panel estimations and identification strategies closer to a causal interpretation, and could enrich the analysis with additional sustainability indicators and sectoral breakdown.
However, public policy implications can be differentiated beyond general recommendations based on the specific conditions of different country groups. For economies at the frontier of material efficiency (the Netherlands, Luxembourg, and the Nordic countries), the scope for progress lies less in the basic diffusion of technologies and more in integrating AI into advanced circular loops, such as predictive maintenance, industrial symbiosis, and design aimed at reducing embodied material. For catching-up economies in Central and Eastern Europe, where digital and AI adoption rates fall below the EU average, the priority is to build foundational complementarities: digital skills programs, support for SMEs via European Digital Innovation Hubs, and making cohesion funds conditional on resource-efficiency criteria. Differentiating the instruments, rather than the objectives, is the key operational conclusion drawn from the structural heterogeneity documented in the analysis.
We reiterate and reinforce the study’s limitations here to ensure the scope of the conclusions is accurately defined. First, digitalization is measured using a single proxy (e-commerce in the manufacturing sector), which does not capture the full extent of the digital transformation; verification using alternative proxies (such as cloud computing or big data) remains to be conducted as data series become complete. Second, the dependent variable, based on domestic material consumption, does not account for materials embodied in imports; consequently, some of the observed decoupling may reflect the relocation of resource-intensive production. An EXIOBASE-style material footprint analysis would serve as the appropriate robustness test.
Thirdly, although fixed effects absorb time-invariant national characteristics, time-varying country-level factors, such as changing sectoral structures, energy prices, and specific national policies, can simultaneously influence digitalization and resource productivity, thereby reinforcing the associative, rather than causal, nature of the findings. Furthermore, unit root and cointegration tests, being asymptotic in nature, have limited power at T = 10, while the proxies used for human capital and research effort operate at a high level of aggregation. These limitations do not invalidate the conclusions but rather define their scope: the study documents robust equilibrium associations at the aggregate level, not causal mechanisms at the firm level.
Author Contributions
Conceptualization, R.V.P. and G.H.; methodology, L.N.-G. and R.M.B.; software, G.H. and R.M.C.; validation, R.V.P. and R.M.C.; formal analysis, L.N.-G. and R.M.B.; investigation, C.A.L.P. and R.M.C.; resources, G.H. and R.V.P.; data curation, C.A.L.P. and R.M.C.; writing—original draft preparation, L.N.-G. and R.V.P.; writing—review and editing, G.H. and R.V.P.; visualization, G.H. and R.M.B.; supervision, R.V.P.; project administration, C.A.L.P. and R.M.B. All authors have read and agreed to the published version of the manuscript.
Funding
This research received no external funding.
Institutional Review Board Statement
Not applicable.
Informed Consent Statement
Not applicable.
Data Availability Statement
The data presented in this study are available from publicly accessible official sources (Eurostat and the World Bank). Further inquiries can be directed to the corresponding author.
Conflicts of Interest
The authors declare no conflicts of interest.
References
- Solow, R.M. We’d Better Watch Out. N. Y. Times Book Rev. 1987, 36, 36. [Google Scholar]
- Brynjolfsson, E.; Hitt, L.M. Beyond Computation: Information Technology, Organizational Transformation and Business Performance. J. Econ. Perspect. 2000, 14, 23–48. [Google Scholar] [CrossRef] [Scilit]
- Jorgenson, D.W. Information Technology and the U.S. Economy. Am. Econ. Rev. 2001, 91, 1–32. [Google Scholar] [CrossRef] [Scilit]
- Oliner, S.D.; Sichel, D.E. The Resurgence of Growth in the Late 1990s: Is Information Technology the Story? J. Econ. Perspect. 2000, 14, 3–22. [Google Scholar] [CrossRef] [Scilit]
- Stiroh, K.J. Information Technology and the U.S. Productivity Revival: What Do the Industry Data Say? Am. Econ. Rev. 2002, 92, 1559–1576. [Google Scholar] [CrossRef] [Scilit]
- Bresnahan, T.F.; Trajtenberg, M. General Purpose Technologies: ’Engines of Growth’? J. Econom. 1995, 65, 83–108. [Google Scholar] [CrossRef] [Scilit]
- Cardona, M.; Kretschmer, T.; Strobel, T. ICT and Productivity: Conclusions from the Empirical Literature. Inf. Econ. Policy 2013, 25, 109–125. [Google Scholar] [CrossRef] [Scilit]
- Czernich, N.; Falck, O.; Kretschmer, T.; Woessmann, L. Broadband Infrastructure and Economic Growth. Econ. J. 2011, 121, 505–532. [Google Scholar] [CrossRef] [Scilit]
- UNEP International Resource Panel. Decoupling Natural Resource Use and Environmental Impacts from Economic Growth; United Nations Environment Programme: Nairobi, Kenya, 2011. [Google Scholar]
- Krausmann, F.; Gingrich, S.; Eisenmenger, N.; Erb, K.-H.; Haberl, H.; Fischer-Kowalski, M. Growth in Global Materials Use, GDP and Population During the 20th Century. Ecol. Econ. 2009, 68, 2696–2705. [Google Scholar] [CrossRef] [Scilit]
- Wiedmann, T.O.; Schandl, H.; Lenzen, M.; Moran, D.; Suh, S.; West, J.; Kanemoto, K. The Material Footprint of Nations. Proc. Natl. Acad. Sci. USA 2015, 112, 6271–6276. [Google Scholar] [CrossRef] [Scilit] [PubMed]
- Grossman, G.M.; Krueger, A.B. Economic Growth and the Environment. Q. J. Econ. 1995, 110, 353–377. [Google Scholar] [CrossRef] [Scilit]
- Porter, M.E.; van der Linde, C. Toward a New Conception of the Environment–Competitiveness Relationship. J. Econ. Perspect. 1995, 9, 97–118. [Google Scholar] [CrossRef] [Scilit]
- Sorrell, S. Jevons’ Paradox Revisited: The Evidence for Backfire from Improved Energy Efficiency. Energy Policy 2009, 37, 1456–1469. [Google Scholar] [CrossRef] [Scilit]
- Aghion, P.; Jones, B.F.; Jones, C.I. Artificial Intelligence and Economic Growth. In The Economics of Artificial Intelligence: An Agenda; University of Chicago Press: Chicago, IL, USA, 2019; pp. 237–282. [Google Scholar]
- Acemoglu, D.; Restrepo, P. Artificial Intelligence, Automation, and Work. In The Economics of Artificial Intelligence: An Agenda; Agrawal, A., Gans, J., Goldfarb, A., Eds.; University of Chicago Press: Chicago, IL, USA, 2019; pp. 197–236. [Google Scholar]
- Cockburn, I.M.; Henderson, R.; Stern, S. The Impact of Artificial Intelligence on Innovation: An Exploratory Analysis. In The Economics of Artificial Intelligence: An Agenda; University of Chicago Press: Chicago, IL, USA, 2019; pp. 115–146. [Google Scholar]
- Vinuesa, R.; Azizpour, H.; Leite, I.; Balaam, M.; Dignum, V.; Domisch, S.; Felländer, A.; Langhans, S.D.; Tegmark, M.; Fuso Nerini, F. The Role of Artificial Intelligence in Achieving the Sustainable Development Goals. Nat. Commun. 2020, 11, 233. [Google Scholar] [CrossRef] [Scilit] [PubMed]
- Cohen, W.M.; Levinthal, D.A. Absorptive Capacity: A New Perspective on Learning and Innovation. Adm. Sci. Q. 1990, 35, 128–152. [Google Scholar] [CrossRef] [Scilit]
- Nelson, R.R.; Phelps, E.S. Investment in Humans, Technological Diffusion, and Economic Growth. Am. Econ. Rev. 1966, 56, 69–75. [Google Scholar]
- Benhabib, J.; Spiegel, M.M. The Role of Human Capital in Economic Development: Evidence from Aggregate Cross-Country Data. J. Monet. Econ. 1994, 34, 143–173. [Google Scholar] [CrossRef] [Scilit]
- Lucas, R.E. On the Mechanics of Economic Development. J. Monet. Econ. 1988, 22, 3–42. [Google Scholar] [CrossRef] [Scilit]
- Romer, P.M. Endogenous Technological Change. J. Polit. Econ. 1990, 98, S71–S102. [Google Scholar] [CrossRef] [Scilit] [PubMed]
- Brynjolfsson, E.; Rock, D.; Syverson, C. Artificial Intelligence and the Modern Productivity Paradox: A Clash of Expectations and Statistics. In The Economics of Artificial Intelligence: An Agenda; University of Chicago Press: Chicago, IL, USA, 2019; pp. 23–57. [Google Scholar]
- Lange, S.; Pohl, J.; Santarius, T. Digitalization and energy consumption. Does ICT reduce energy demand? Ecol. Econ. 2020, 176, 106760. [Google Scholar] [CrossRef] [Scilit]
- Bianchini, S.; Damioli, G.; Ghisetti, C. The environmental effects of the “twin” green and digital transition in European regions. Environ. Resour. Econ. 2023, 84, 877–918. [Google Scholar] [CrossRef] [Scilit] [PubMed]
- Levin, A.; Lin, C.-F.; Chu, C.-S.J. Unit Root Tests in Panel Data: Asymptotic and Finite-Sample Properties. J. Econom. 2002, 108, 1–24. [Google Scholar] [CrossRef] [Scilit]
- Im, K.S.; Pesaran, M.H.; Shin, Y. Testing for Unit Roots in Heterogeneous Panels. J. Econom. 2003, 115, 53–74. [Google Scholar] [CrossRef] [Scilit]
- Maddala, G.S.; Wu, S. A Comparative Study of Unit Root Tests with Panel Data and a New Simple Test. Oxf. Bull. Econ. Stat. 1999, 61, 631–652. [Google Scholar] [CrossRef] [Scilit]
- Pedroni, P. Panel Cointegration: Asymptotic and Finite Sample Properties of Pooled Time Series Tests with an Application to the PPP Hypothesis. Econom. Theory 2004, 20, 597–625. [Google Scholar] [CrossRef] [Scilit]
- Kao, C. Spurious Regression and Residual-Based Tests for Cointegration in Panel Data. J. Econom. 1999, 90, 1–44. [Google Scholar] [CrossRef] [Scilit]
- Hausman, J.A. Specification Tests in Econometrics. Econometrica 1978, 46, 1251–1271. [Google Scholar] [CrossRef] [Scilit]
- Agrawal, A.; Gans, J.; Goldfarb, A. Economic Policy for Artificial Intelligence. Innov. Policy Econ. 2019, 19, 139–159. [Google Scholar] [CrossRef] [Scilit]

Disclaimer/Publisher’s Note: The statements, opinions and data contained in all publications are solely those of the individual author(s) and contributor(s) and not of MDPI and/or the editor(s). MDPI and/or the editor(s) disclaim responsibility for any injury to people or property resulting from any ideas, methods, instructions or products referred to in the content. |
© 2026 by the authors. Licensee MDPI, Basel, Switzerland. This article is an open access article distributed under the terms and conditions of the Creative Commons Attribution (CC BY) license.