


Abstract
This research investigates peri-urban transformation dynamics in Pathum Thani, Thailand, using a spatio-temporal analytical framework integrating urbanization and environmental indicators derived from Google Earth Engine (GEE). The analysis incorporates Normalized Difference Built-up Index (NDBI), Normalized Difference Vegetation Index (NDVI), Night-Time Light (NTL), Land Surface Temperature (LST) and atmospheric pollutants (CO, NO2, SO2 and CH4) between 2018 and 2025. Statistical analysis and K-means clustering approaches were applied to identify urban transformation patterns and environmental impacts. The results reveal fragmented and uneven peri-urban development strongly influenced by Bangkok’s metropolitan expansion. NDBI and NTL indicate continuous built-up expansion and intensifying socio-economic activity, particularly along transportation corridors and sub-urban growth fronts. Environmental indicators revealed increasing urban heat intensity and deteriorating air quality over the study period. Temporal NDVI and NDBI analysis further reveals alternating cycles of vegetation loss, built-up expansion and environmental recovery. Overall, the findings highlight the complex and multidimensional nature of peri-urban transformation and demonstrate the applicability of integrated spatio-temporal approaches for urban and environmental analysis.
1. Introduction
Urban development has experienced increasingly dynamic transformations driven by complex and interrelated social, economic, environmental and physical processes [1,2]. These interconnected dimensions collectively shape the trajectory of urban growth and spatial transformation. While urban development can generate substantial benefits, including economic growth, improved quality of life and enhanced public health and well-being, uncontrolled or poorly managed urbanization may also produce significant adverse impacts [2]. Importantly, the nature and intensity of these impacts vary considerably across spatial contexts as urban development patterns are strongly influenced by local socio-economic structures, environmental conditions and governance arrangements. In the contemporary era, accelerated global urbanization has substantially expanded urban areas worldwide [3]. Therefore, peri-urban landscapes have emerged increasingly across many regions [4]. One of the most significant manifestations of this process is the expansion of urban development beyond traditional city boundaries, resulting in transitional zones situated between urban and rural systems. These peri-urban areas are commonly characterized by rapid land-use conversion, fragmented spatial structures, and increasing pressure on infrastructure, public services and environmental systems. The hybrid and transitional nature of peri-urban landscapes make them particularly vulnerable to environmental degradation and urbanization-related pressures associated with metropolitan expansion [5,6].
In Thailand, rapid urbanization over recent decades has intensified these transformation processes, particularly within peri-urban regions surrounding major metropolitan areas. Urban expansion has contributed to a range of urban and transportation-related challenges, including traffic congestion, environmental pollution and limited access to sustainable mobility systems. Consequently, examining urban expansion within peri-urban contexts is essential for understanding the spatial dynamics of urban growth and its associated environmental and socio-economic implications. Nevertheless, peri-urban expansion patterns are highly heterogeneous, and their spatial characteristics are interpreted differently across studies depending on the indicators and analytical frameworks employed, including built-up expansion, population dynamics, accessibility to transport infrastructure, and landscape transformation [7,8]. More recently, urbanization has increasingly been conceptualized not as a rigid rural–urban polarization, but rather as a range of settlement systems differentiated by varying degrees of density, connectivity and infrastructure development [9]. As a result, research on urban expansion has become a central focus within contemporary urbanization studies and provides critical insights for spatial planning and sustainable urban development [10].
Building upon this perspective, the present study seeks to advance understanding of peri-urban transformation by integrating urban dynamics with environmental pressure indicators to reveal key patterns and interrelationships across space and time. Specifically, the research aims to investigate urban dynamic clustering within peri-urban areas and examine how these clusters relate to spatio-temporal transformation processes. To achieve this objective, an integrated spatio-temporal analytical framework is employed to incorporate multidimensional datasets while preserving inherent spatial and temporal relationships. Unlike conventional analytical approaches, this framework enables the simultaneous examination of spatial, temporal and environmental dimensions, thereby facilitating the identification of complex interactions and underlying patterns embedded within the data. The findings of this research contribute to a deeper understanding of urban transformation and its associated environmental and pollution impacts within peri-urban contexts by providing a data-driven perspective on urban dynamics across space and time. The research further demonstrates the effectiveness of integrated spatio-temporal analytical approaches for examining complex urban systems, thereby supporting more advanced urban analysis and future research on sustainable urban development.
2. Literature Review
2.1. Data-Driven in Urban Dynamics Evaluation
Normalized Difference Vegetation Index (NDVI) and Normalized Difference Built-up Index (NDBI) are widely applied in urban studies due to their complementary ability to capture ecological and built-environment dynamics [11]. NDVI measures vegetation density through the spectral contrast between near-infrared (NIR) and red (Red) reflectance, making it effective for detecting changes in vegetation cover. The index is calculated as . In contrast, NDBI identifies built-up areas using the contrast between shortwave infrared (SWIR) and near-infrared (NIR) reflectance and is expressed as . The combined application of NDVI and NDBI has been widely recommended for distinguishing built-up surfaces from vegetation because the two indices exploit complementary spectral responses in the SWIR, NIR and Red bands, thereby reducing misclassification between urban and vegetated land covers [12]. Their complementary use has consequently become a standard approach in urban remote sensing and land-use change analysis. Furthermore, the NDBI has been widely applied to automatically and reliably map built-up areas from Landsat TM imagery through arithmetic manipulation of re-coded NDVI and NDBI values [12]. Given its demonstrated mapping accuracy and superior performance compared with conventional maximum-likelihood classification, this research employs NDBI in conjunction with NDVI to distinguish built-up expansion from vegetation dynamics by exploiting their complementary spectral responses in the SWIR-NIR and NIR-Red domains, respectively. By simultaneously capturing changes in ecological conditions and built-up development, these indices improve the analysis of spatio-temporal urban dynamics and support the identification of transitional landscapes where urban and ecological characteristics coexist.
In parallel, Night-Time Light (NTL) data serves as an effective proxy for urbanization by capturing the spatial distribution of human activity and economic intensity. NTL data facilitate the distinction between urban, peri-urban and rural areas and are particularly valuable for detecting gradual functional transformations that may not be fully observable through conventional land-cover indicators alone. As such, NTL complements traditional remote-sensing approaches in the analysis of urban dynamics and functional urbanization processes [13]. Building upon these datasets, Wilson et al. demonstrate that Google Earth Engine (GEE) provides a powerful cloud-based platform for large-scale environmental monitoring and greenhouse gas analysis [14]. By integrating multi-source satellite datasets with machine-learning techniques, GEE enhances the efficiency and accuracy of emission detection, spatial mapping and temporal trend analysis. The platform also supports the identification of emission hotspots and the monitoring of spatio-temporal environmental changes, although challenges related to data interoperability, algorithm optimization and measurement uncertainty remain.
2.2. Urban Dynamic and Environmental Impact
Peri-urban areas represent transitional zones between rural and urban systems, where agricultural landscapes are progressively integrated with urban functions and built forms. This transformation is commonly characterized by outward and often weakly regulated expansion driven by infrastructure development and emerging economic opportunities [7]. Such dynamics reshape the provision and utilization of built space, influencing land values, redevelopment patterns and the spatial distribution of activities. As residential and employment structures evolve, new mobility demands emerge, affecting vehicle ownership, travel behavior and overall trip generation patterns. At the same time, peri-urban transformation generates significant environmental pressures. Pouri et al. demonstrate that environmental impacts associated with pollution and environmental risks are frequently concentrated among vulnerable populations [15]. These environmental risks are unevenly distributed across urban areas and are strongly shaped by rapid urbanization, industrial activities and socioeconomic conditions. These processes are closely associated with increasing greenhouse gas (GHG) emissions, including carbon dioxide (CO2), methane (CH4) and fluorinated gases generated from energy consumption, transportation, agriculture, waste management and industrial activities [16]. In this context, urban planning plays a crucial role in mitigating environmental impacts through the regulation of land-use patterns, transport systems and urban form. Strategies such as compact urban development, mixed land use and sustainable transportation systems can reduce travel demand, improve energy efficiency and substantially lower emissions from transport and buildings compared with business-as-usual development trajectories.
2.3. Tensor-Based Approaches in Spatio-Temporal Urban Analysis
Tensor representation refers to a multidimensional array structure that extends vectors and matrices into higher dimensions, enabling the simultaneous modeling of spatial, temporal and thematic variables within complex urban systems [17,18,19,20]. Compared with conventional two-dimensional analytical approaches, tensor-based methods provide a more comprehensive framework for capturing latent interactions and dependencies across multiple dimensions of urban data. Previous studies have increasingly applied tensor-based approaches to analyze complex urban and mobility systems. Han et al., for example, employed tensor decomposition to identify temporal activity patterns and dynamic urban functional structures, thereby overcoming limitations associated with subjective spatio-temporal classifications commonly used in conventional studies [21]. Similarly, Almquist et al. proposed a spatio-temporal tensor co-clustering framework for migration system analysis, demonstrating how tensor models can capture cross-domain spatial and temporal dependencies within migration flows [22]. Cai et al. constructed and decomposed tensors using Tencent location-based data to identify daily, hourly and spatial activity patterns within Beijing’s Fifth Ring Road, revealing substantial variations across time and location [19]. Zhao et al. further applied tensor-based methods to identify urban spatial clusters through mobility-flow dynamics by constructing spatio-temporal feature tensors capable of capturing intrinsic correlations among multiple urban features [23]. More recently, integrated geospatial analytical frameworks have been increasingly adopted to characterize urban dynamics and support evidence-based planning by combining multiple spatial datasets rather than relying on individual indicators [24]. These studies demonstrate the growing applicability of multidimensional analytical frameworks for organizing and interpreting complex urban systems. Building upon this body of research, the present research integrates land-cover, urban activity and atmospheric indicators within a tensor-based spatio-temporal framework to identify latent peri-urban transformation trajectories, thereby extending previous studies that primarily focused on urban delineation or individual environmental indicators. As a result, tensor-based approaches have become increasingly important in machine learning, computer vision, urban analytics and transportation studies, particularly for investigating dynamic urban transformation processes across multiple dimensions simultaneously.
3. Methodology
3.1. Study Area
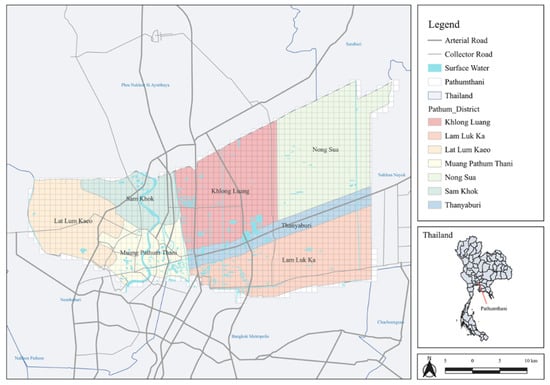
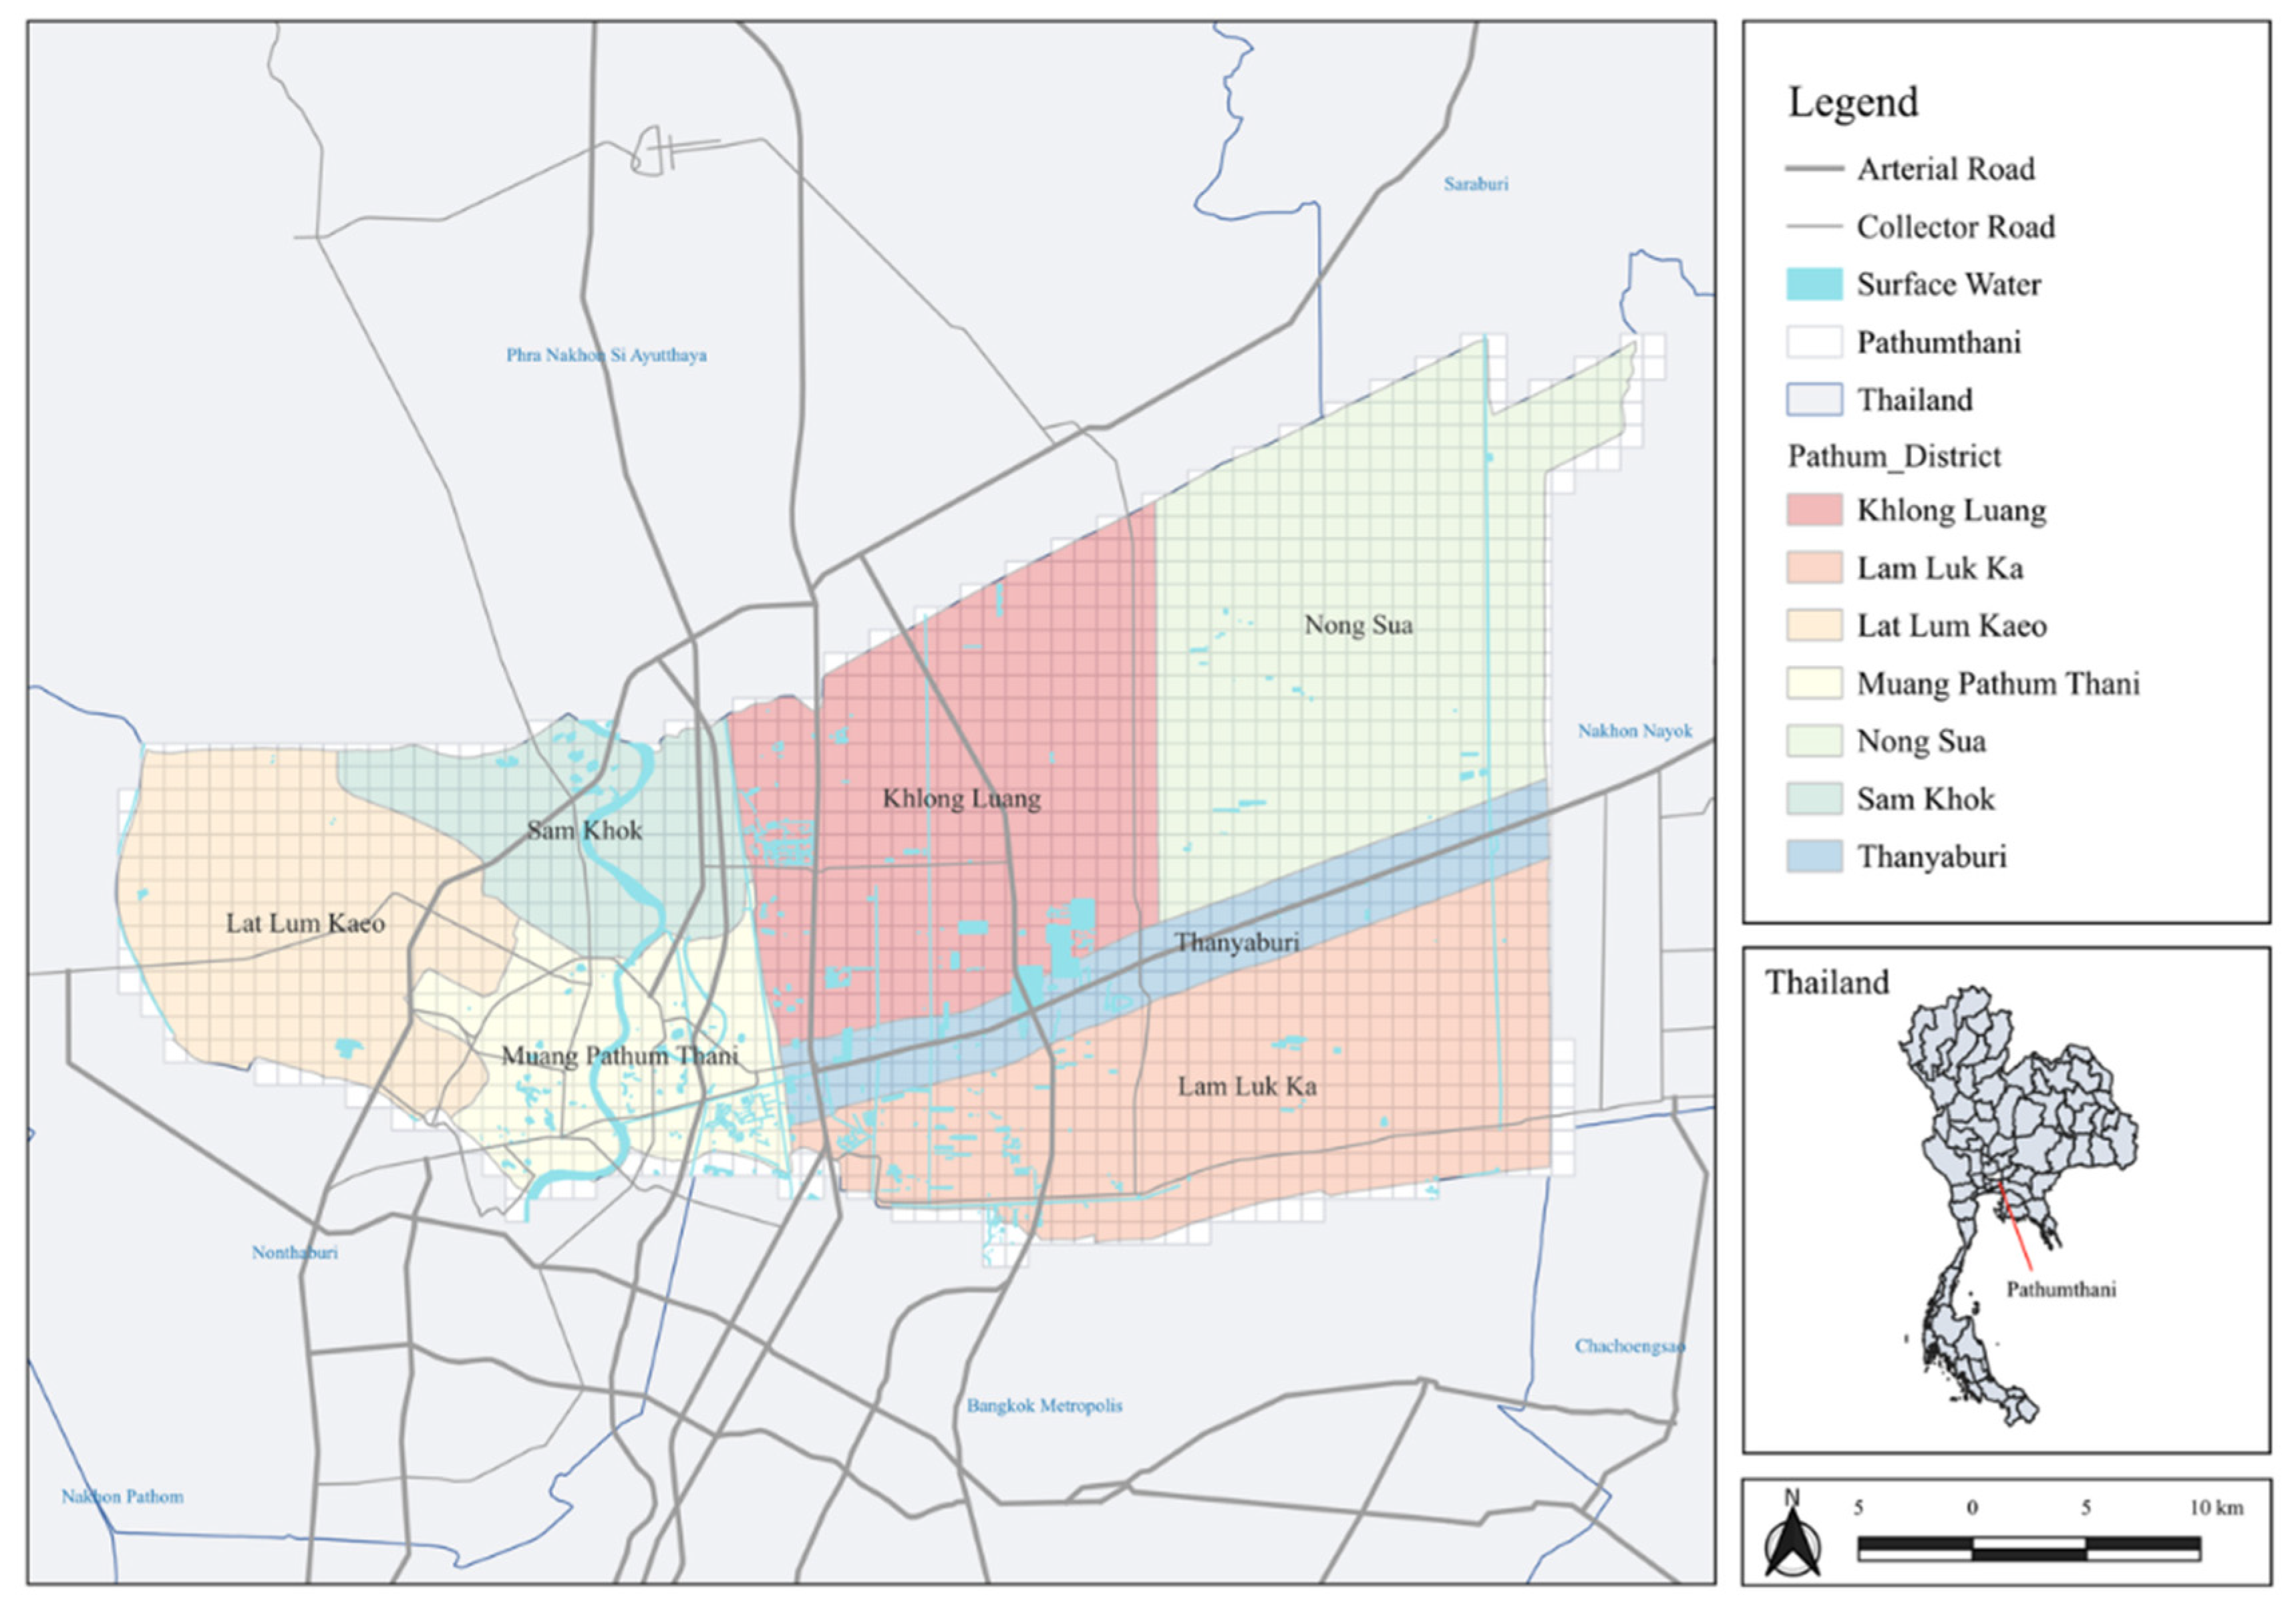
Pathum Thani, Thailand is located immediately north of Bangkok and forms part of the Bangkok Metropolitan Region. The province functions as a peri-metropolitan growth zone shaped by large-scale residential development, industrial estates and higher-education campuses distributed along major radial corridors connecting to the capital city (see Figure 1). Peri-urban areas are commonly defined as transitional zones emerging from rapid urban expansion at the interface between rural and urban environments, functioning as buffer spaces that connect metropolitan cores with surrounding regional and rural landscapes [25,26,27,28,29,30,31,32,33,34,35,36,37].
Figure 1.
Study area: Pathum Thani, Thailand (Source: Authors).
3.2. Data Collection
The research extracted data from Google Earth Engine (GEE) to analyze urbanization and environmental impact indicators within the study area. For urbanization analysis, the research utilized the NDBI and data from 2018 to 2025 to examine the spatial and temporal dynamics of urban expansion. To assess environmental impacts, the research extracted multiple environmental indicators, including the NDVI, Land Surface Temperature (LST), sulfur dioxide (SO2), carbon monoxide (CO), nitrogen dioxide (NO2) and methane (CH4). Most environmental datasets covered the period from 2018 to 2025, while CH4 data were available from 2019 to 2025. Overall, these datasets provide a comprehensive understanding of the relationship between urbanization processes and environmental changes in the study area (see Table 1).
Table 1.
Selected indicators and data availability.
All variables were aggregated using a grid-based framework for analysis by dividing the urban area into uniform grid cells. This grid-based approach helps eliminate biases arising from administrative boundaries and ensures spatial consistency across the study area. Previous studies have also highlighted the advantages of grid-based methods in capturing spatial heterogeneity and identifying micro-level urban hotspots. A fishnet grid, in particular, has been widely used for this purpose. Moreover, grid cell size varies across studies depending on research objectives [28,29]. Several studies have compared analytical outcomes across different spatial grid resolutions, typically ranging from 200 to 800 m [30]. In the present study, a grid resolution of 1 km × 1 km was adopted to provide a straightforward and consistent spatial unit for analysis and calculation. The analysis covered the period from 2018 to 2025, reflecting the timeframe for which complete and comparable datasets were available across all variables.
3.3. Tensor-Based Approaches for Spatio-Temporal Data Analysis
This research adopts a tensor-structured analytical framework to investigate peri-urban dynamics at the mesoscopic level. The analysis began with data exploration and statistical preprocessing, including descriptive statistics, outlier detection and z-score standardization to ensure comparability across variables. Following preprocessing, a tensor-based representation was developed to integrate multidimensional urban datasets by organizing spatial grids (location), temporal observations (year) and urban indicators (features) into a three-dimensional structure. This framework enables the simultaneous analysis of spatial, temporal and inter-variable relationships while preserving spatio-temporal dependencies. The approach improves the ability to identify complex urban transformation patterns, including urban expansion, transitional processes and environmental pressure. K-means clustering was subsequently applied to classify spatial observations into distinct urban transformation groups by minimizing intra-cluster variance and maximizing inter-cluster separation. The resulting patterns were then interpreted qualitatively to provide further insights into peri-urban transformation dynamics.
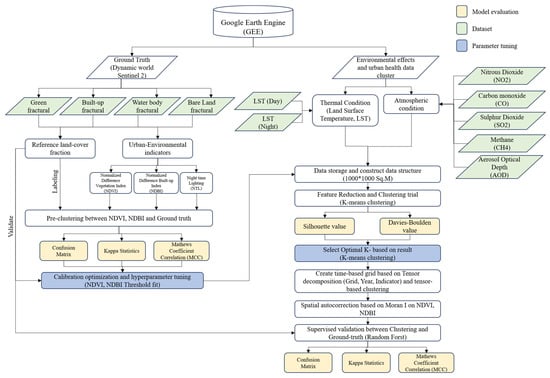
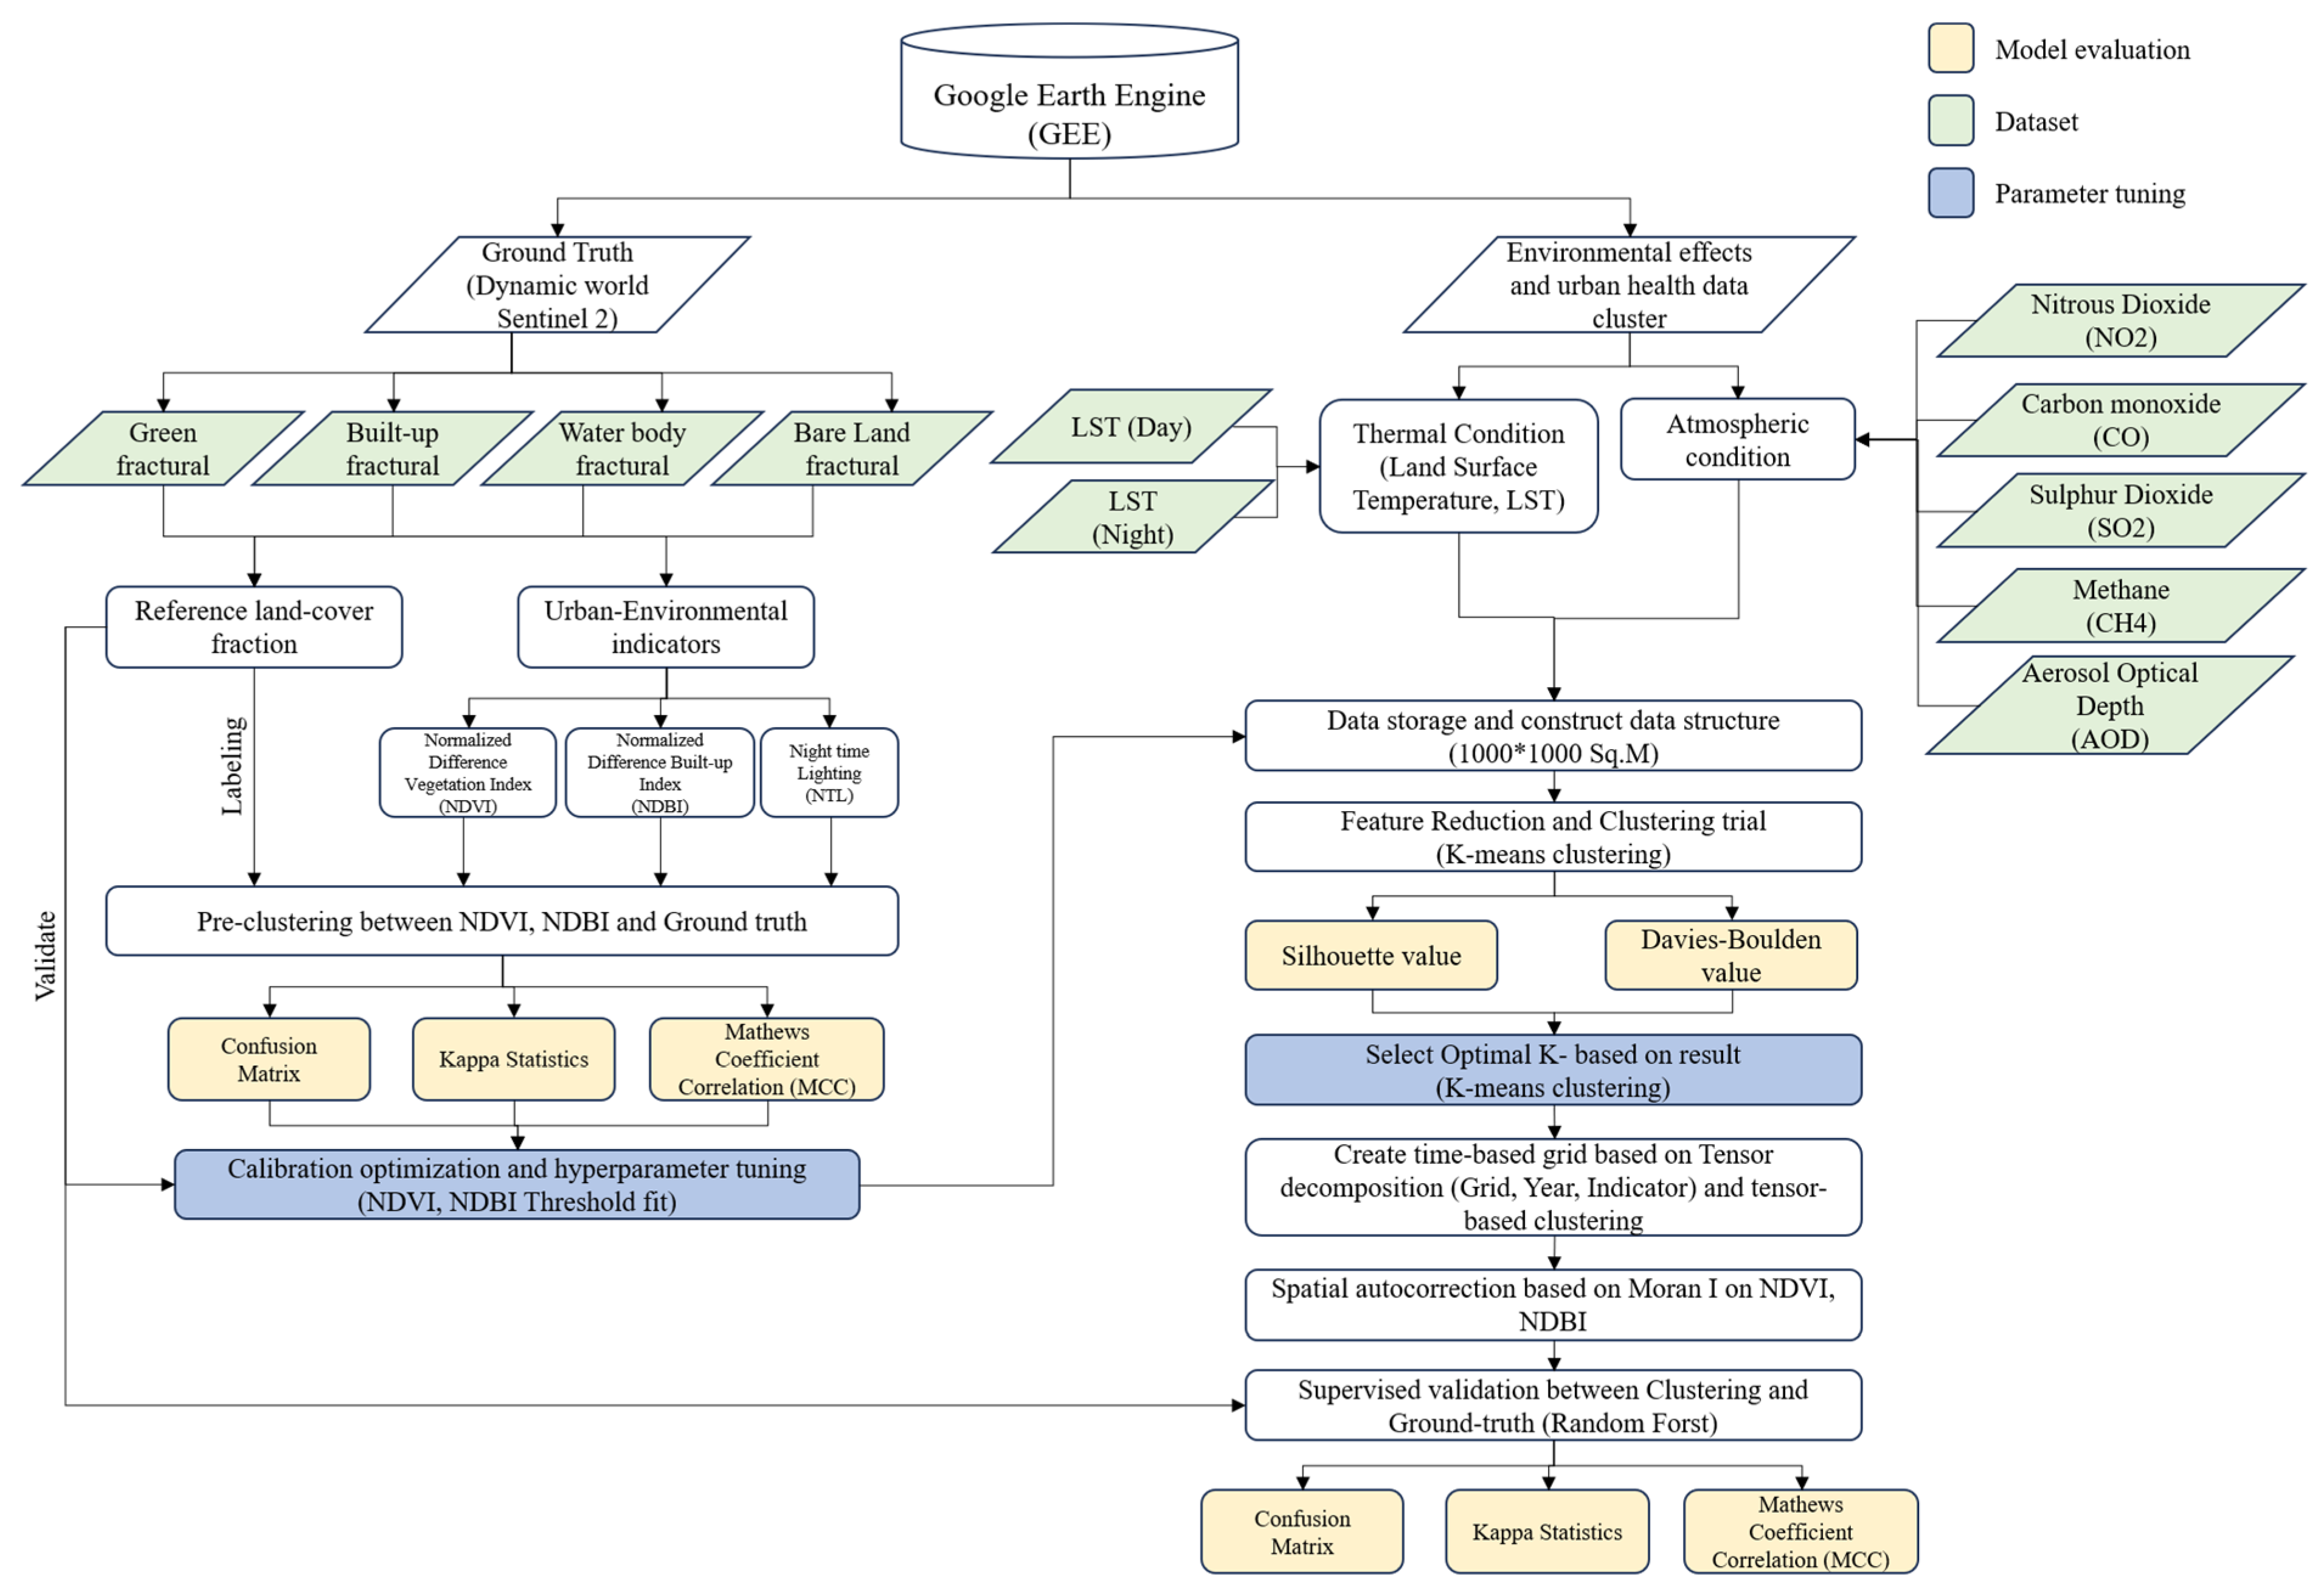
The analytical workflow was implemented in Python 3.12.0 using Google Colab and followed the sequence of stages illustrated in the analytical framework (see Figure 2). First, annual indicator layers exported from GEE were imported and integrated into a unified grid-level dataset. Subsequently, the data were subjected to a cleaning and harmonization process, whereby grid cells with insufficient clear observations or lacking ground-truth land-cover labels were excluded.
Figure 2.
Study framework (Source: Authors).
Residual missing values were imputed using median values, and all indicators were standardized using z-score normalization to ensure comparability across variables. A pre-clustering quality-control procedure was conducted to compare remote-sensing indices with ground-truth land-cover data and calibrate the NDVI and NDBI detection thresholds (NDVI 0.50; NDBI −0.17) through hyperparameter tuning. The standardized features were then evaluated using four alternative representations of raw variables, correlation-filtered variables, principal component analysis (PCA) and factor analysis (FA). The representation with the highest silhouette score was selected for subsequent analysis. Two complementary clustering approaches were employed, which are a static typology using K-means clustering and a temporal-dynamics approach based on year-to-year trajectories using dynamic time warping (DTW). The standardized dataset was subsequently restructured into a third-order tensor and decomposed to extract latent spatio-temporal patterns with the resulting spatial loadings serving as inputs for the final K-means clustering. Finally, spatial autocorrelation was assessed using Moran’s I, and cluster robustness was validated by using a Random Forest classifier with spatial cross-validation. The pipeline also generated long-format, wide-format and annual datasets for further analysis and visualization.
The data are organized as a third-order tensor, X ∈ RG×Y×F, with three modes corresponding to approximately G ≈ 1599 spatial grid cells, Y annual time steps spanning 2018–2025, and F urban environmental indicators (NDVI, NDBI, NTL, NO2, CO, SO2 and CH4). Monthly observations are first aggregated into annual means for each grid cell. Residual gaps were addressed through temporal imputation within each indicator series, and any persistent missing values were subsequently substituted with the respective global indicator mean. Finally, each indicator is standardized using z-scores across the combined spatial and temporal dimensions, enabling variables expressed in different units to contribute comparably. The standardized tensor is factorized using the CANDECOMP/PARAFAC (CP) decomposition with rank R = 3 as implemented in TensorLy. This process generates spatial (A), temporal (B) and indicator (C) factor matrices, together with a relative reconstruction error that quantifies the accuracy of the low-rank approximation. The spatial factor matrix A is subsequently used as the feature space for K-means clustering. Consequently, the resulting peri-urban transformation clusters reflect the joint spatio-temporal co-variation of all indicators rather than the influence of any single year or variable.
4. Results
4.1. The Land-Use Dynamics of Pathum Thani from 1984 to 2020
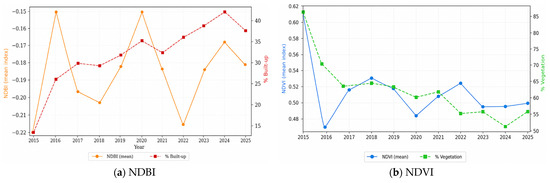
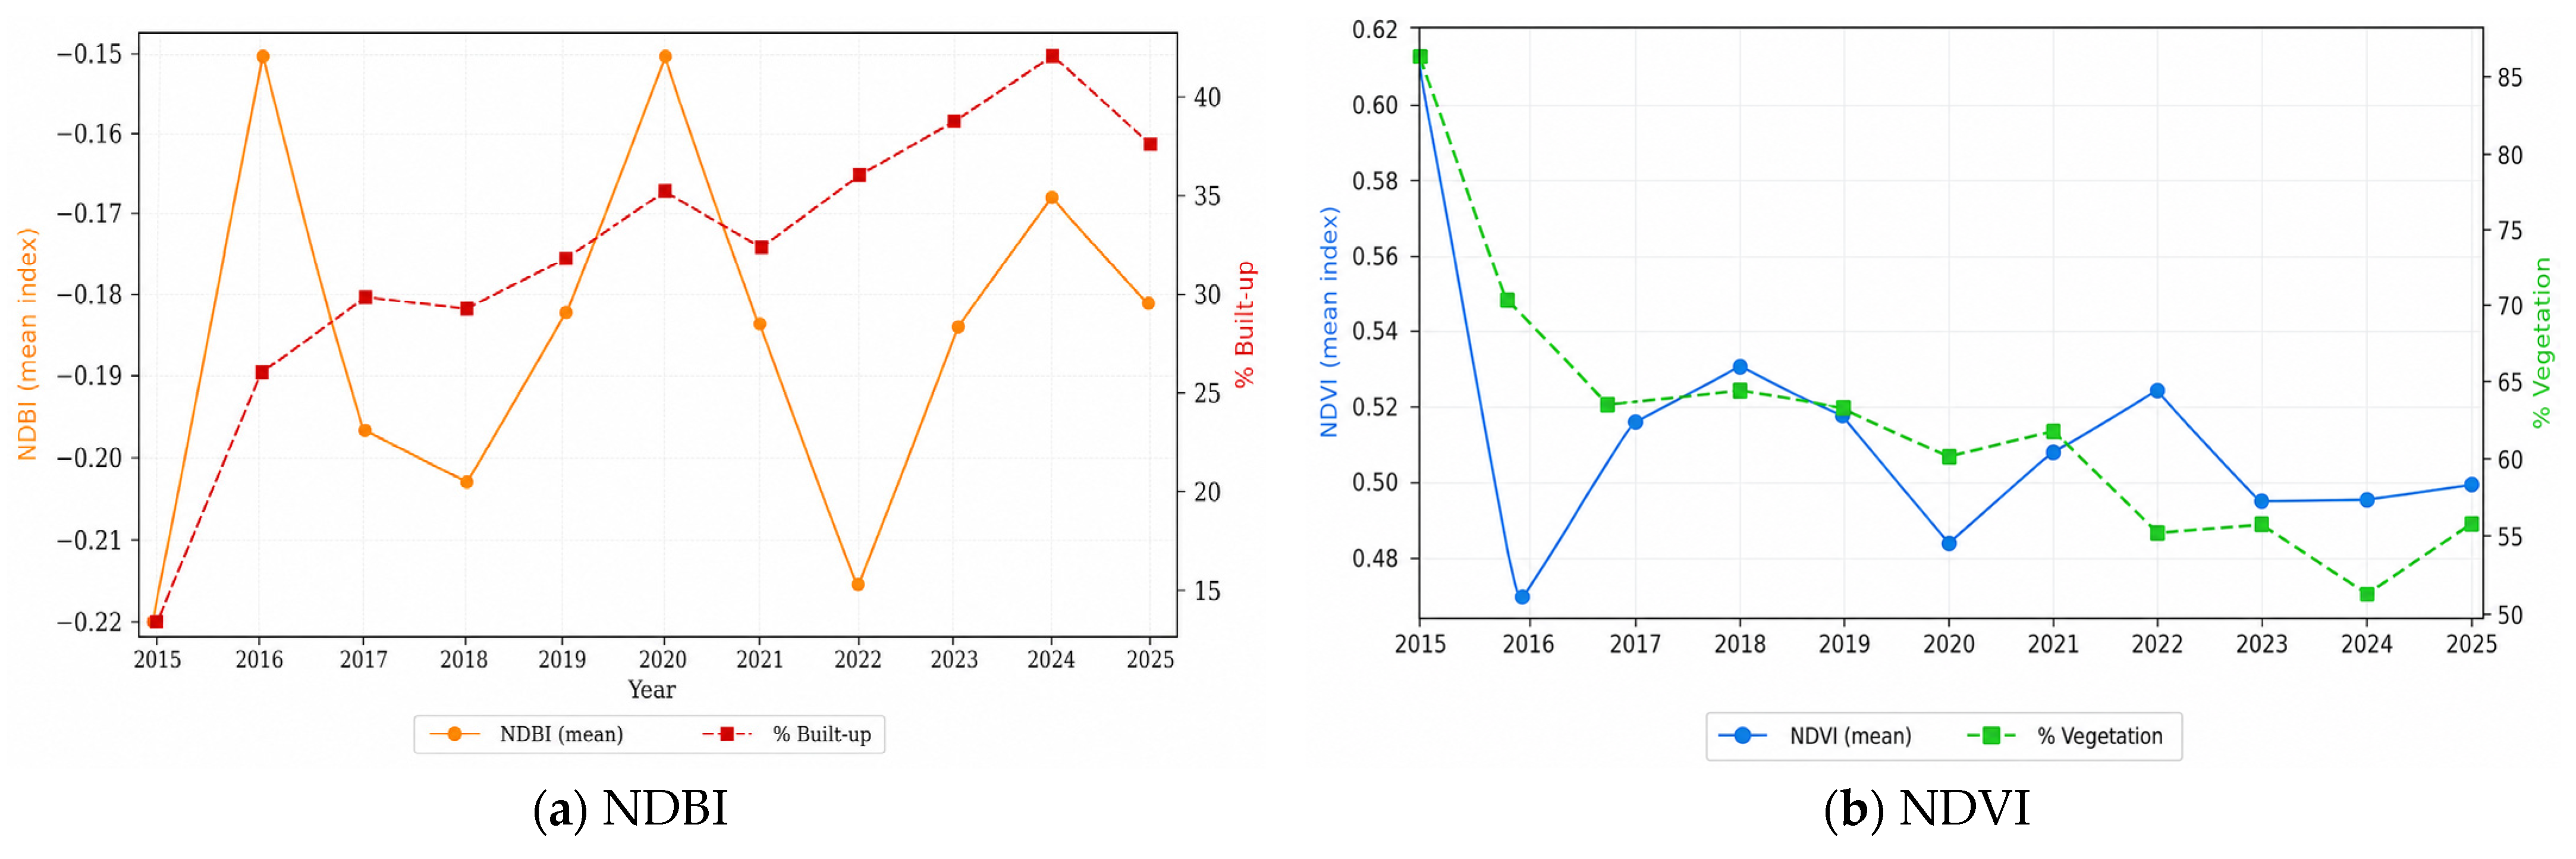
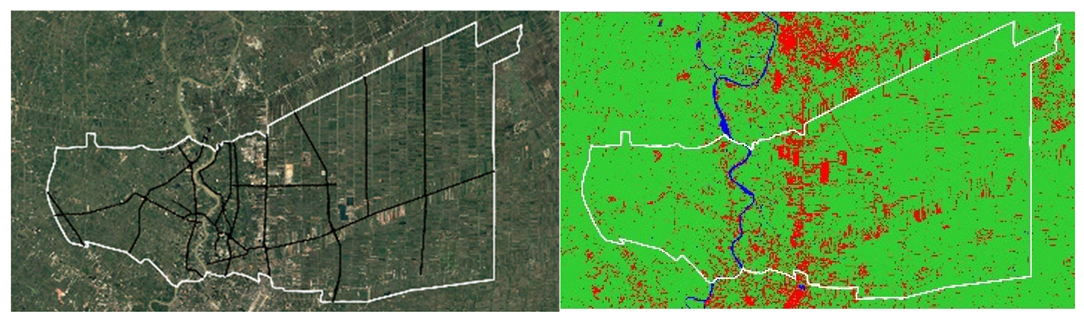
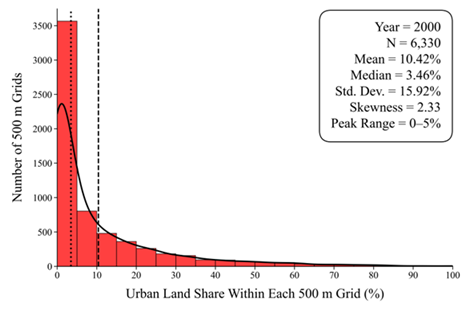
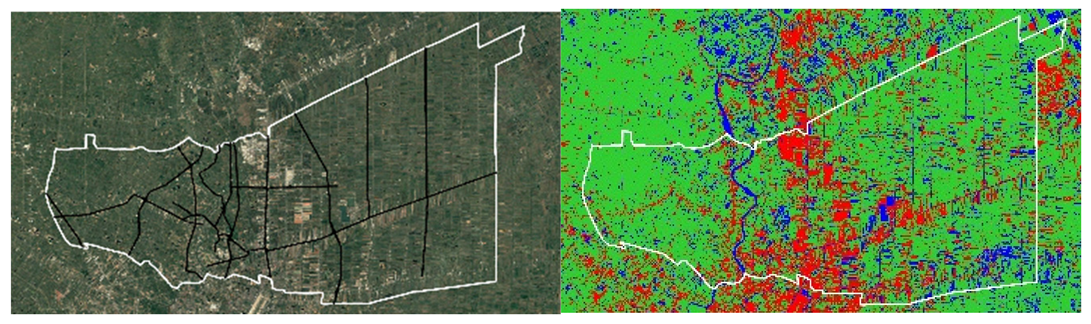
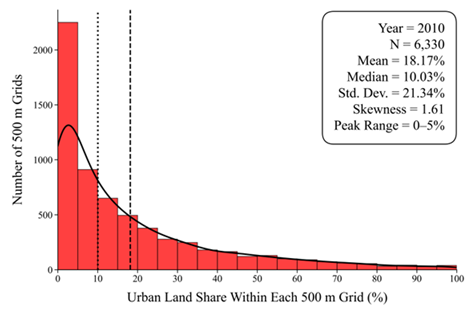
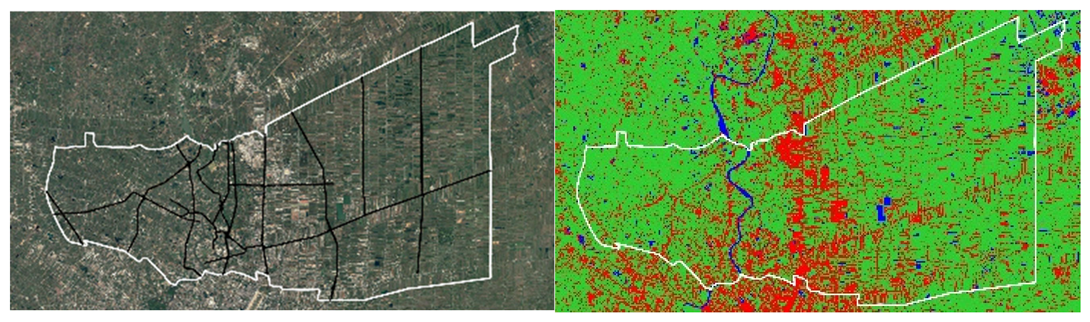
The land-use dynamics of Pathum Thani between 1984 and 2020 reveal a complex and non-linear transformation process shaped by metropolitan expansion, hydrological variability and evolving water-management interventions. Although agricultural land remained the dominant land-use category throughout the study period, urban areas expanded substantially during 2000–2010, corresponding to accelerated residential, industrial, and transport-infrastructure development associated with the outward expansion of Bangkok. In contrast, the relatively high proportions of water bodies observed in 1990 and 2020 reflect the province’s strong sensitivity to flooding dynamics, irrigation-system modifications, and satellite-classification uncertainties, particularly those associated with reflective surfaces and post-2011 floodwater-retention strategies. Overall, the temporal patterns emphasize the role of Pathum Thani as a dynamic peri-urban landscape in which urbanization processes are closely interconnected with environmental and hydrological systems, thereby highlighting the importance of careful interpretation of multi-temporal remote-sensing analyses (see Table 2). The data used in this analysis were derived from GEE. A comparison with ground-truth observations indicates that NDVI corresponds well with the observed proportion of vegetation, whereas NDBI exhibits greater variability relative to the ground-truth built-up area. Although the overall extent of built-up land has increased and green space has gradually declined across the study area, the annual NDVI and NDBI values display considerable temporal fluctuations rather than consistent monotonic trends (see Figure 3).
Table 2.
Land classification change based on spatial clustering analysis (Source: Authors).
Figure 3.
Comparison of GEE-derived NDVI/NDBI with ground truth (Source: Authors).
To evaluate the reliability of the remote-sensing indices, the NDVI and NDBI derived classifications were validated against ground-truth data prior to subsequent analyses. This validation assessed the agreement between observed land-cover conditions and the corresponding NDVI and NDBI classifications by calculating prediction errors between the ground-truth observations and the remotely sensed estimates. The preliminary analysis revealed substantially lower prediction errors for NDVI than for NDBI, indicating that vegetation was classified more accurately than built-up areas. To improve classification performance, hyperparameter tuning was conducted to determine the optimal detection thresholds for both indices. The calibrated NDVI and NDBI thresholds were subsequently incorporated into a machine learning classification model and validated using the ground-truth dataset. The optimized NDVI threshold (≥0.50) demonstrates superior classification performance, correctly identifying vegetation (True Positive, TP = 75.59%) and non-vegetation (True Negative, TN = 76.85%) with a Balanced Accuracy of 0.762, Cohen’s Kappa of 0.509 and a Matthews Correlation Coefficient (MCC) of 0.513. In comparison, the optimized NDBI threshold (≥−0.17) achieved slightly lower performance, correctly classifying built-up areas (TP = 72.84%) and non-built-up areas (TN = 74.52%), resulting in a Balanced Accuracy of 0.737, Cohen’s Kappa of 0.453 and an MCC of 0.458. Both indices demonstrated moderate agreement beyond chance as reflected by consistent Kappa and MCC values. Nevertheless, NDVI proved to be the more reliable index across all evaluation metrics, supporting its application for land-cover classification and peri-urban transformation analysis.
4.2. Spatio-Temporal Urbanization Dynamics
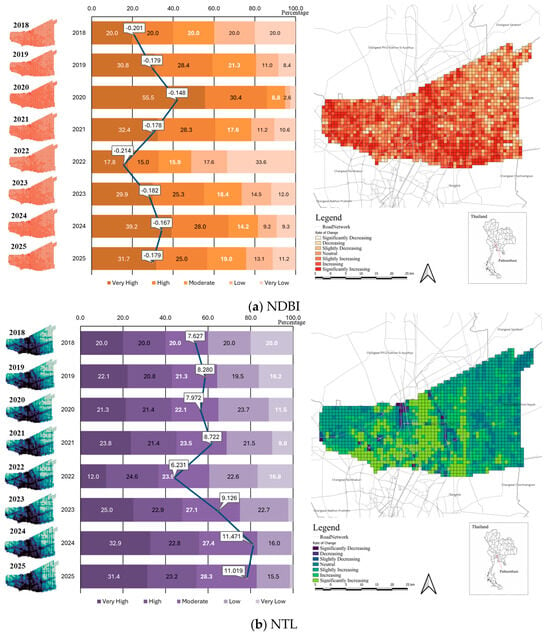
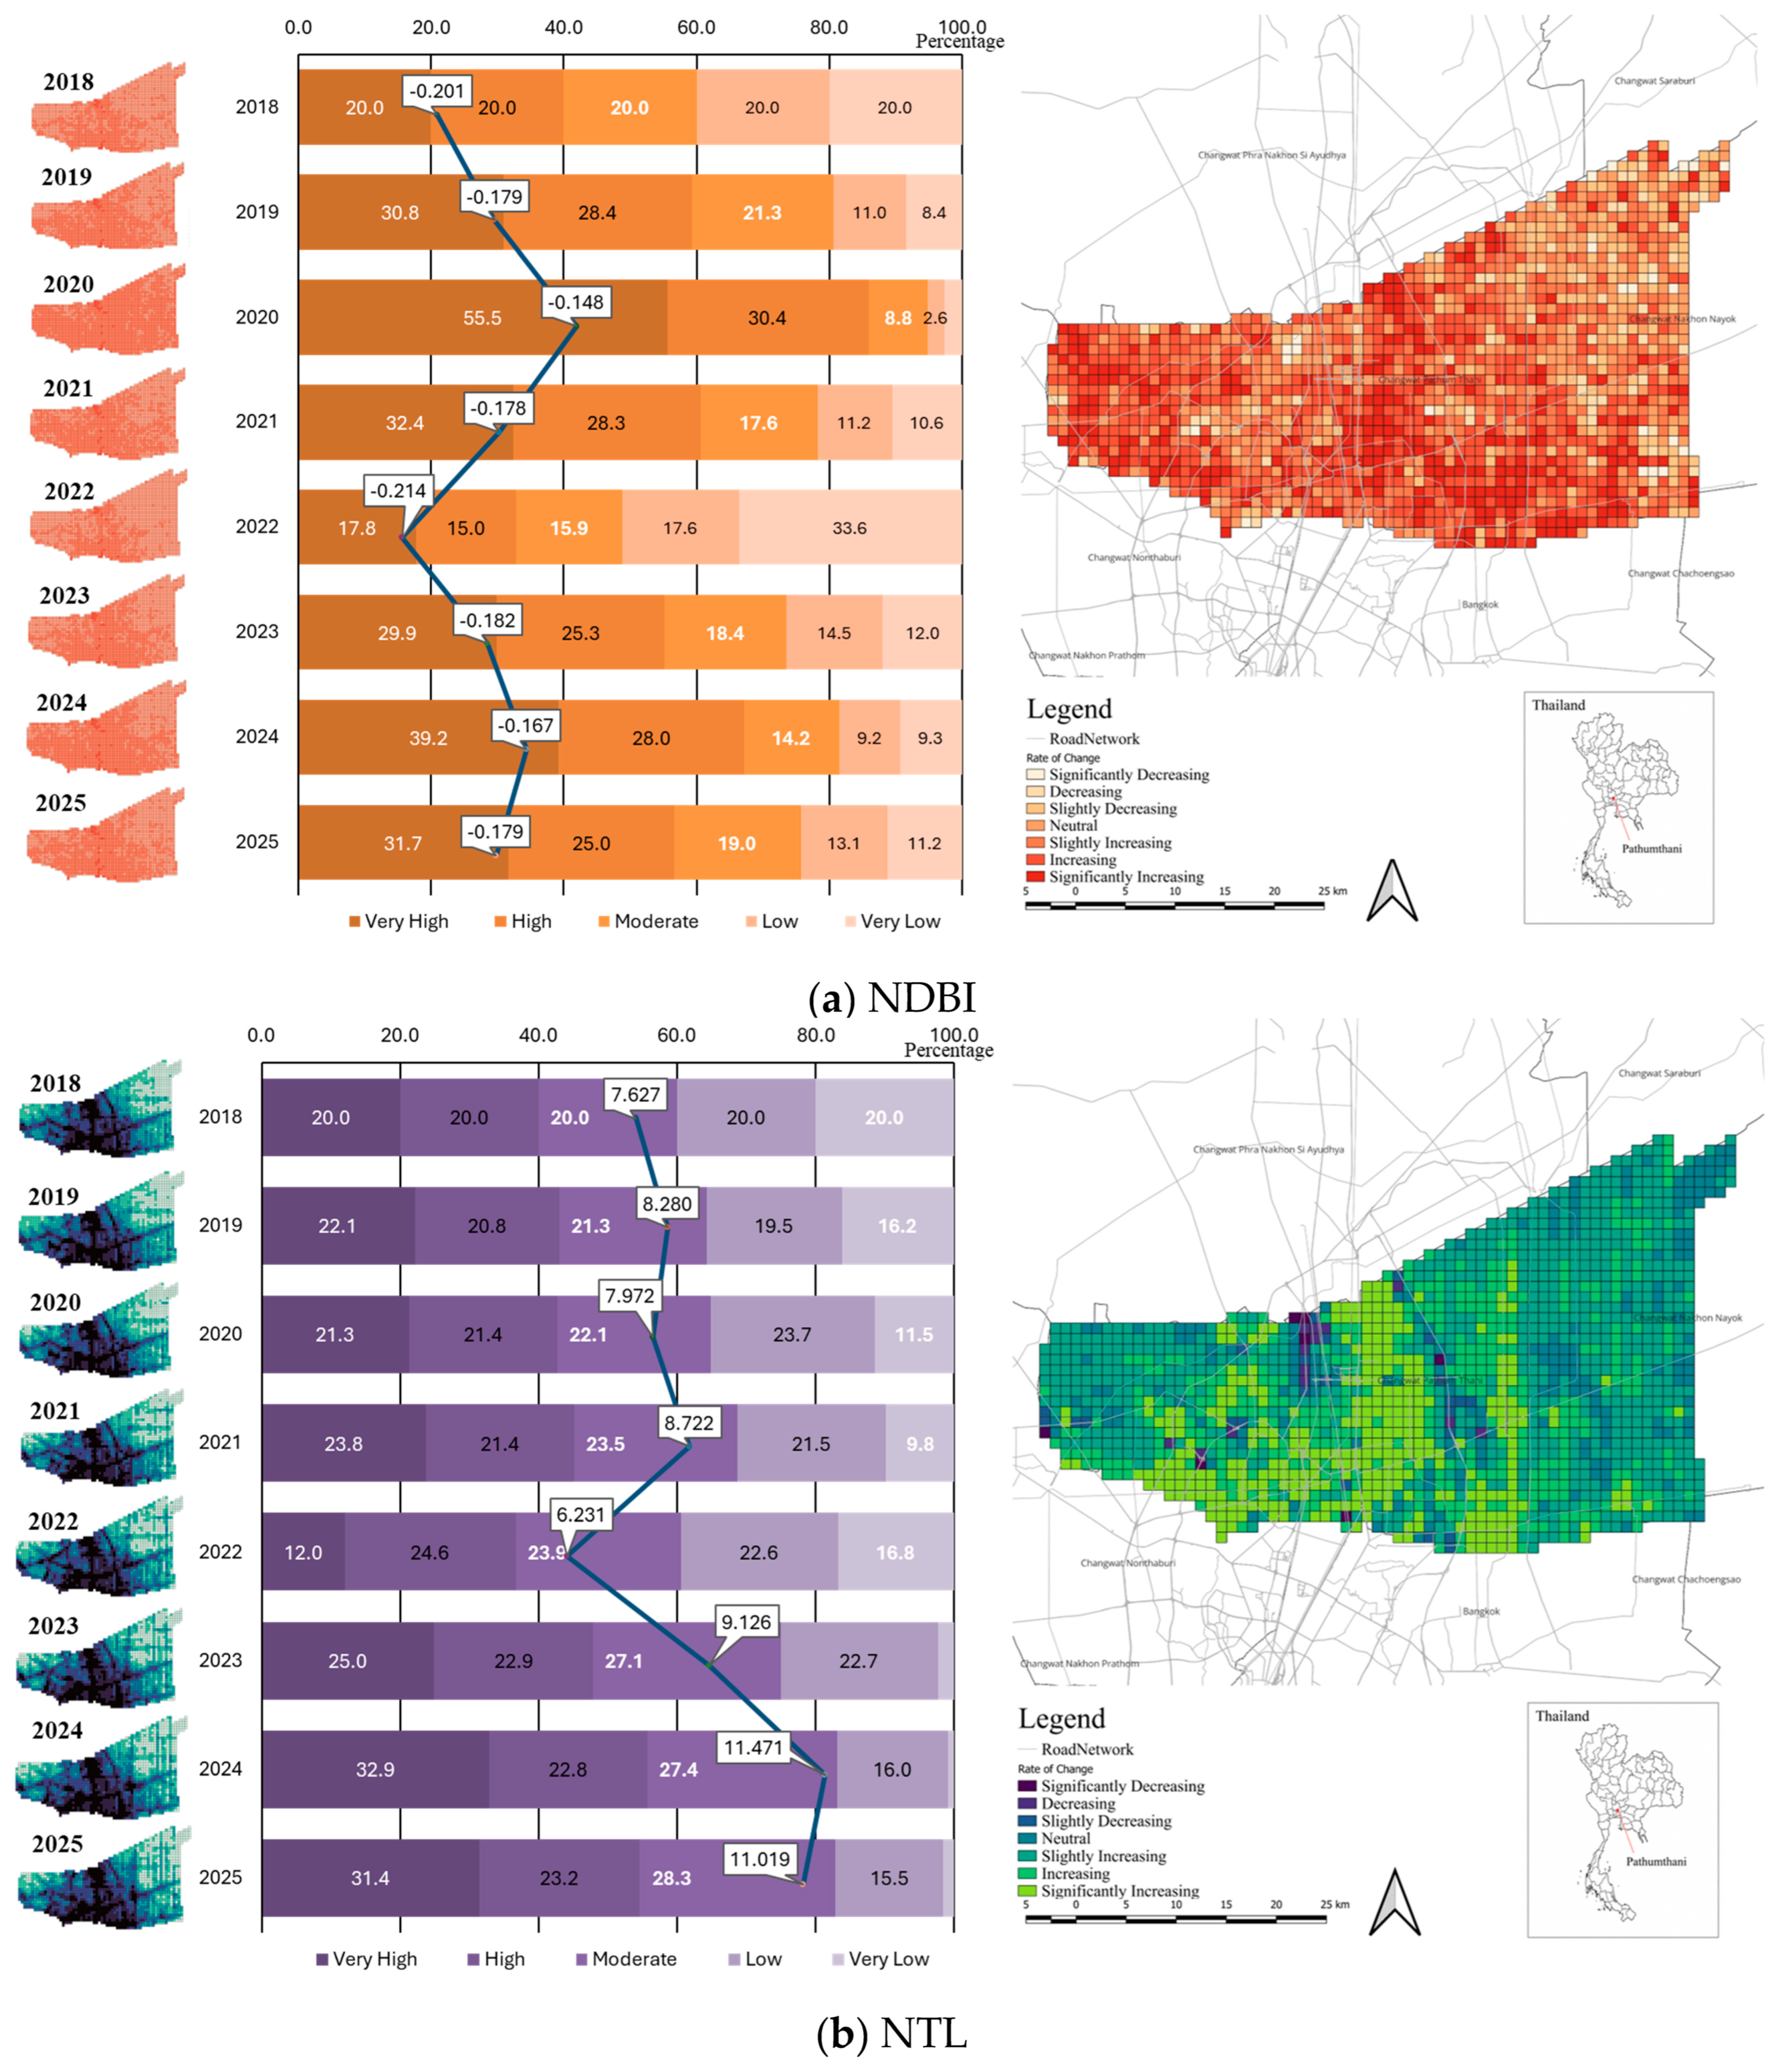
The NDBI results also indicate a gradual increase in built-up intensity within the study area between 2018 and 2025. Although the average NDBI values remained negative throughout the study period, the index became progressively less negative, increasing from −0.201 in 2018 to −0.197 in 2025 with an average annual change of 0.323%. This pattern suggests a continuous expansion of urban and built-up surfaces over time. NTL analysis further reinforces the urbanization trend identified through NDBI. The average NTL intensity increased substantially from 5.856 nW/sr/cm2 in 2018 to 11.527 nW/sr/cm2 in 2025, representing a high annual growth rate of 13.832%. Spatially, the increase in NDBI appears to concentrate around major transport corridors and areas connected to the Bangkok Metropolitan Region, reflecting the outward expansion of peri-urban development. The temporal distribution also shows a stronger concentration of moderate-to-high NDBI clusters during 2020–2021, indicating accelerated urban growth during this period. The increasing brightness observed in the spatial distribution reflects the expansion of human activities, infrastructure development, commercial concentration and urban economic intensity across the study area. Compared with NDBI, NTL demonstrates a much stronger growth trend, suggesting that economic and human activity intensified more rapidly than physical built-up expansion alone. The spatial pattern of increasing NTL values is particularly visible along urban corridors and emerging sub-urban zones, confirming the transformation of the study area into a more active peri-urban system linked to metropolitan expansion (see Figure 4). Overall, the combined interpretation of NDBI and NTL reveals a consistent urbanization process characterized by both physical expansion and increasing socio-economic activity. While NDBI captures the gradual transformation of land surfaces toward built-up environments, NTL highlights the intensification of human activities and urban functions. Together, these indicators confirm that the study area has undergone significant peri-urban transition during 2018–2025, driven by metropolitan spillover, infrastructure development and expanding urban-economic interactions.
Figure 4.
Spatio-temporal dynamic of NDBI and NTL (2018–2025) (Source: Authors).
4.3. Environmental Impacts Associated with Urbanization
The atmospheric pollution indicators (CO, NO2, SO2 and CH4) were derived from Sentinel-5P satellite observations processed in Google Earth Engine (GEE). As such, the reported values represent satellite-derived atmospheric column measurements rather than ground-based monitoring observations. The results are presented below.
4.3.1. Atmospheric Pollution Dynamics
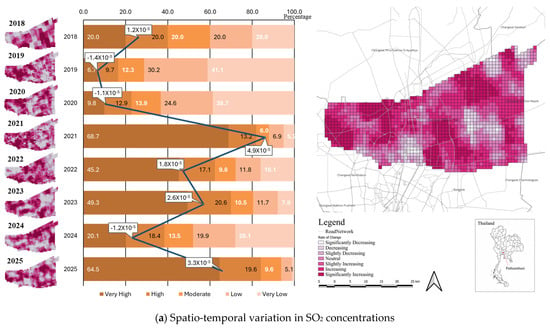
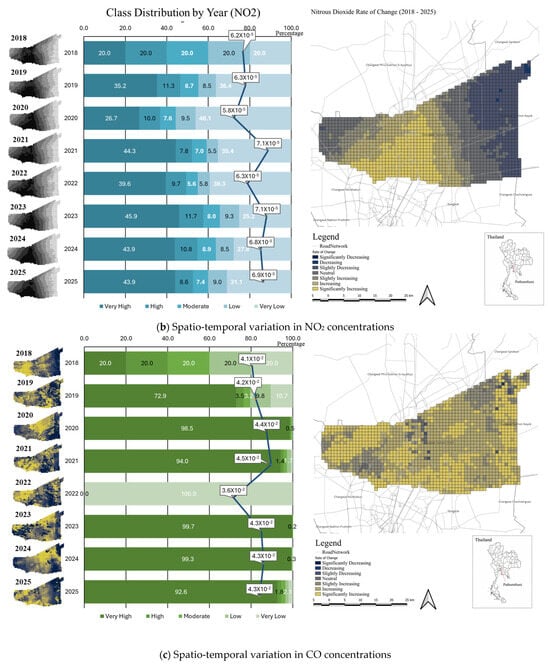
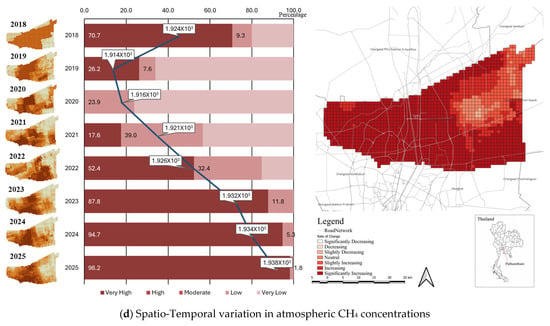
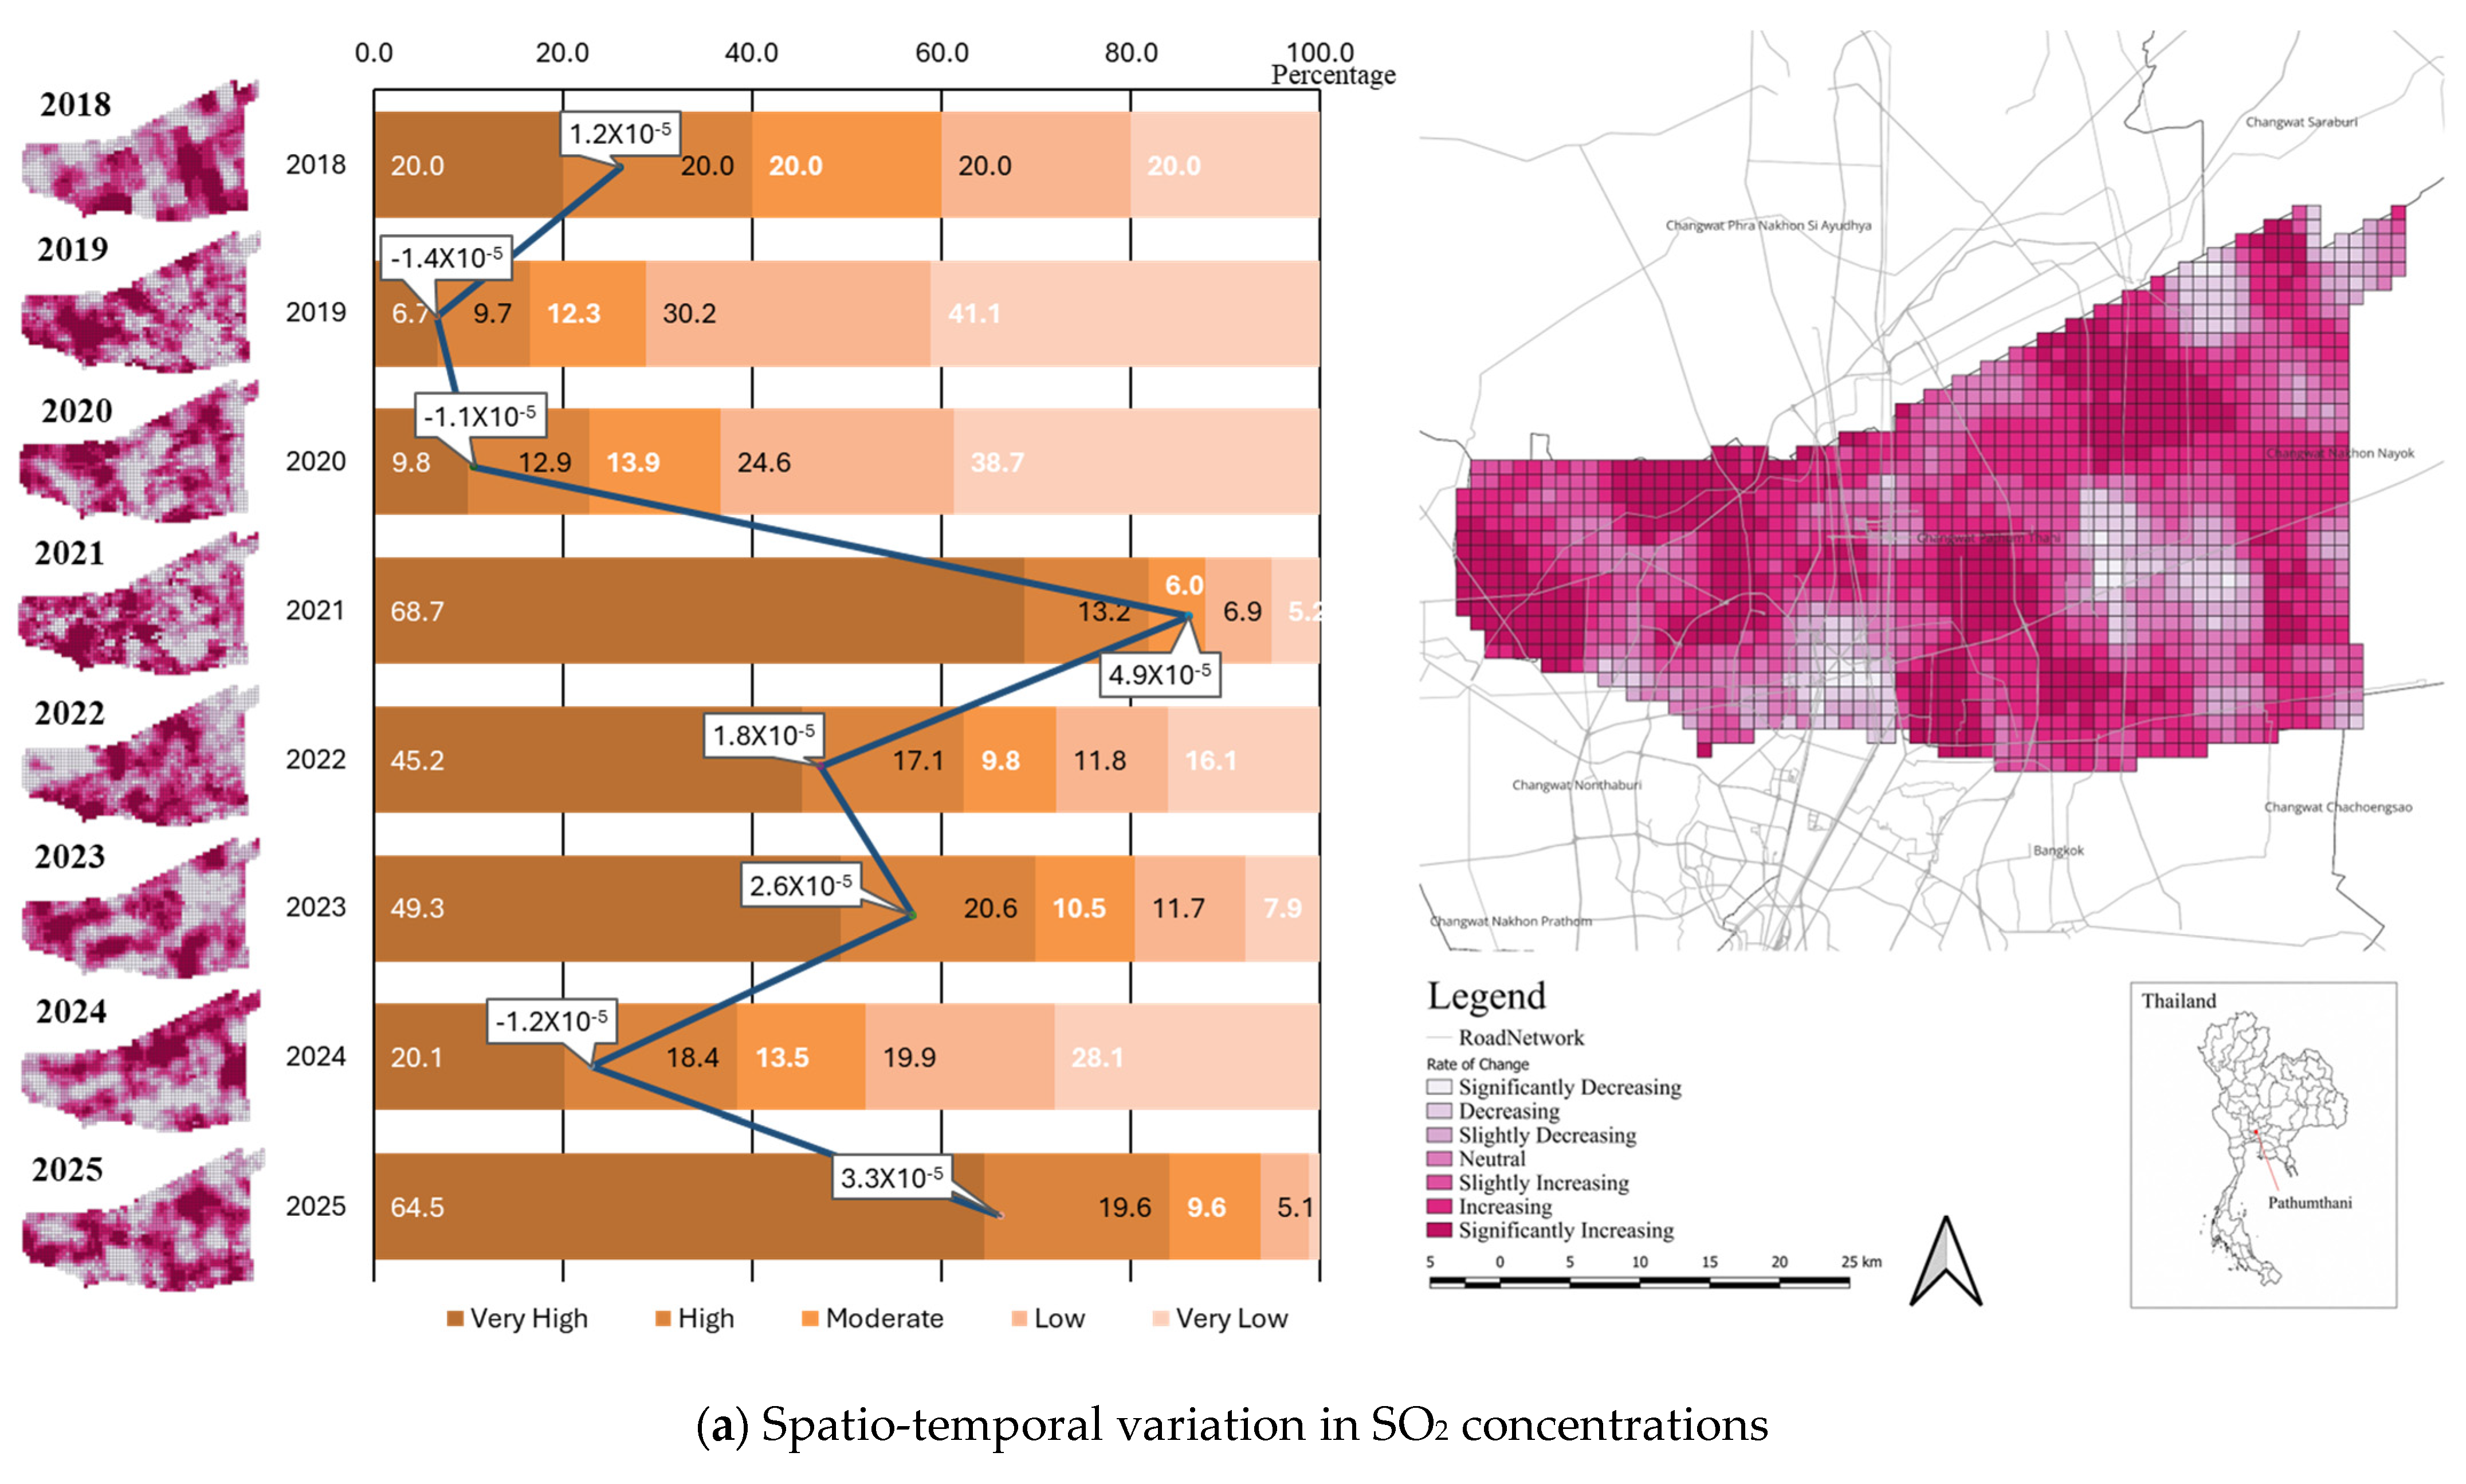
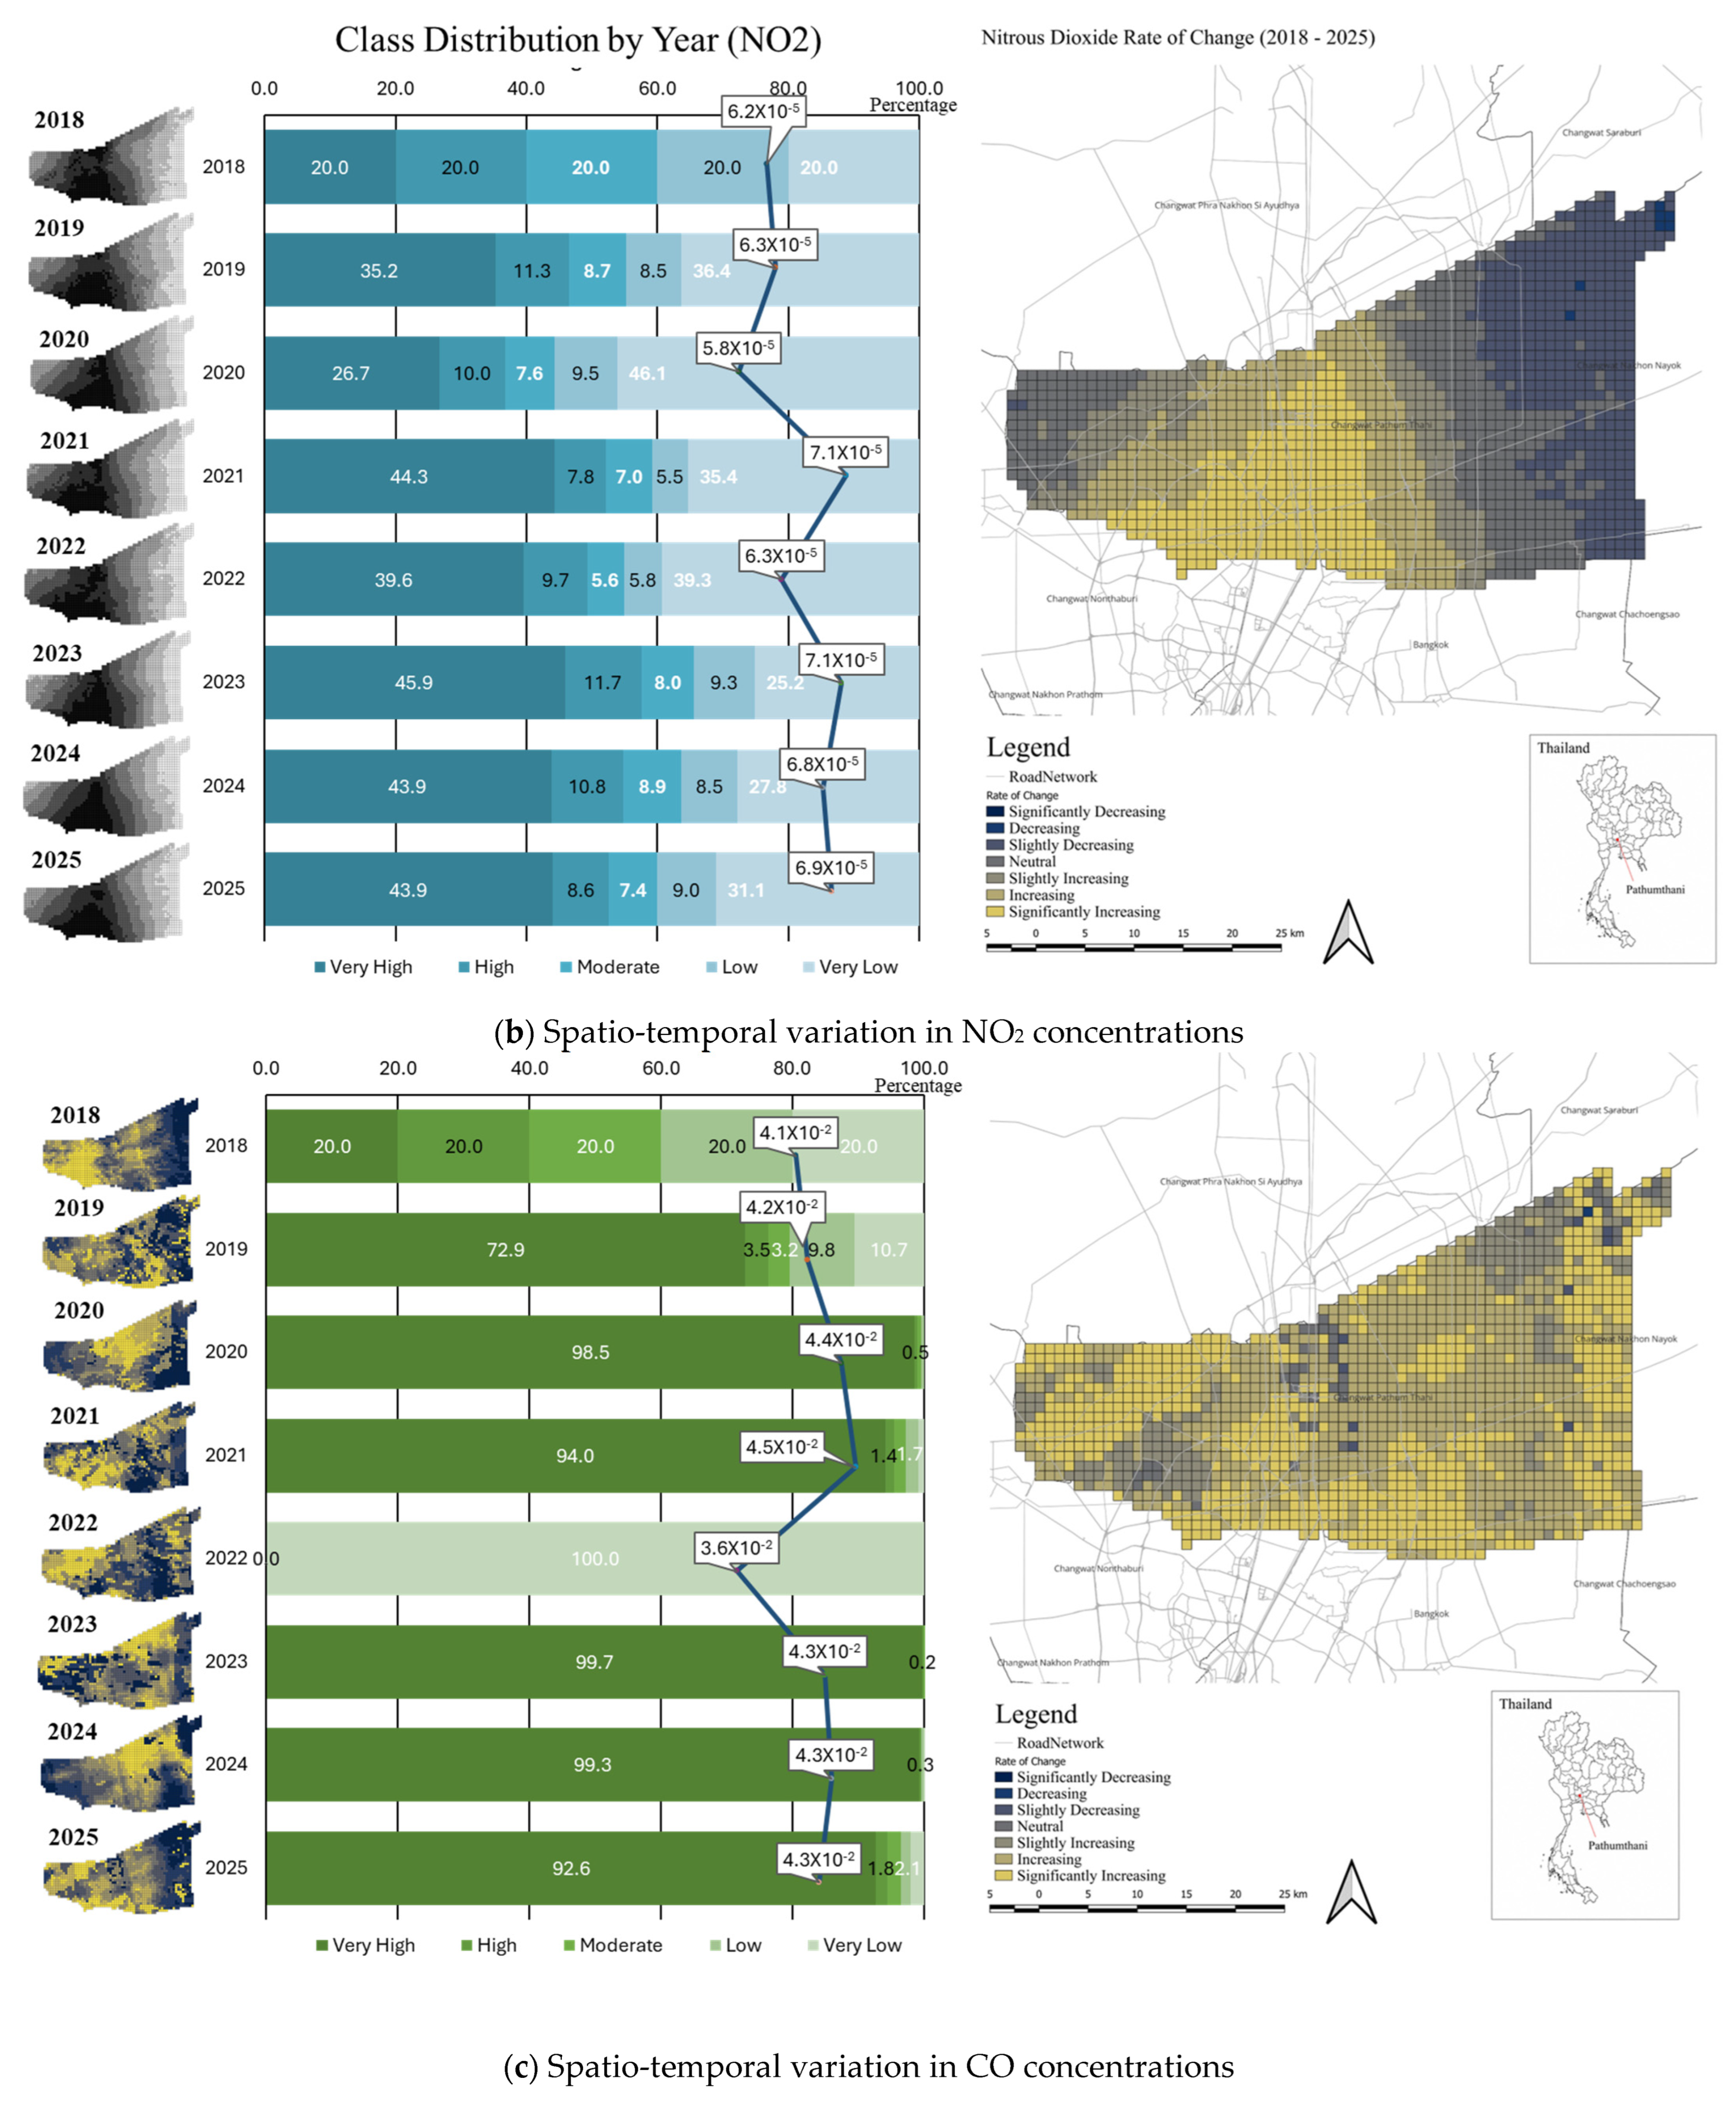
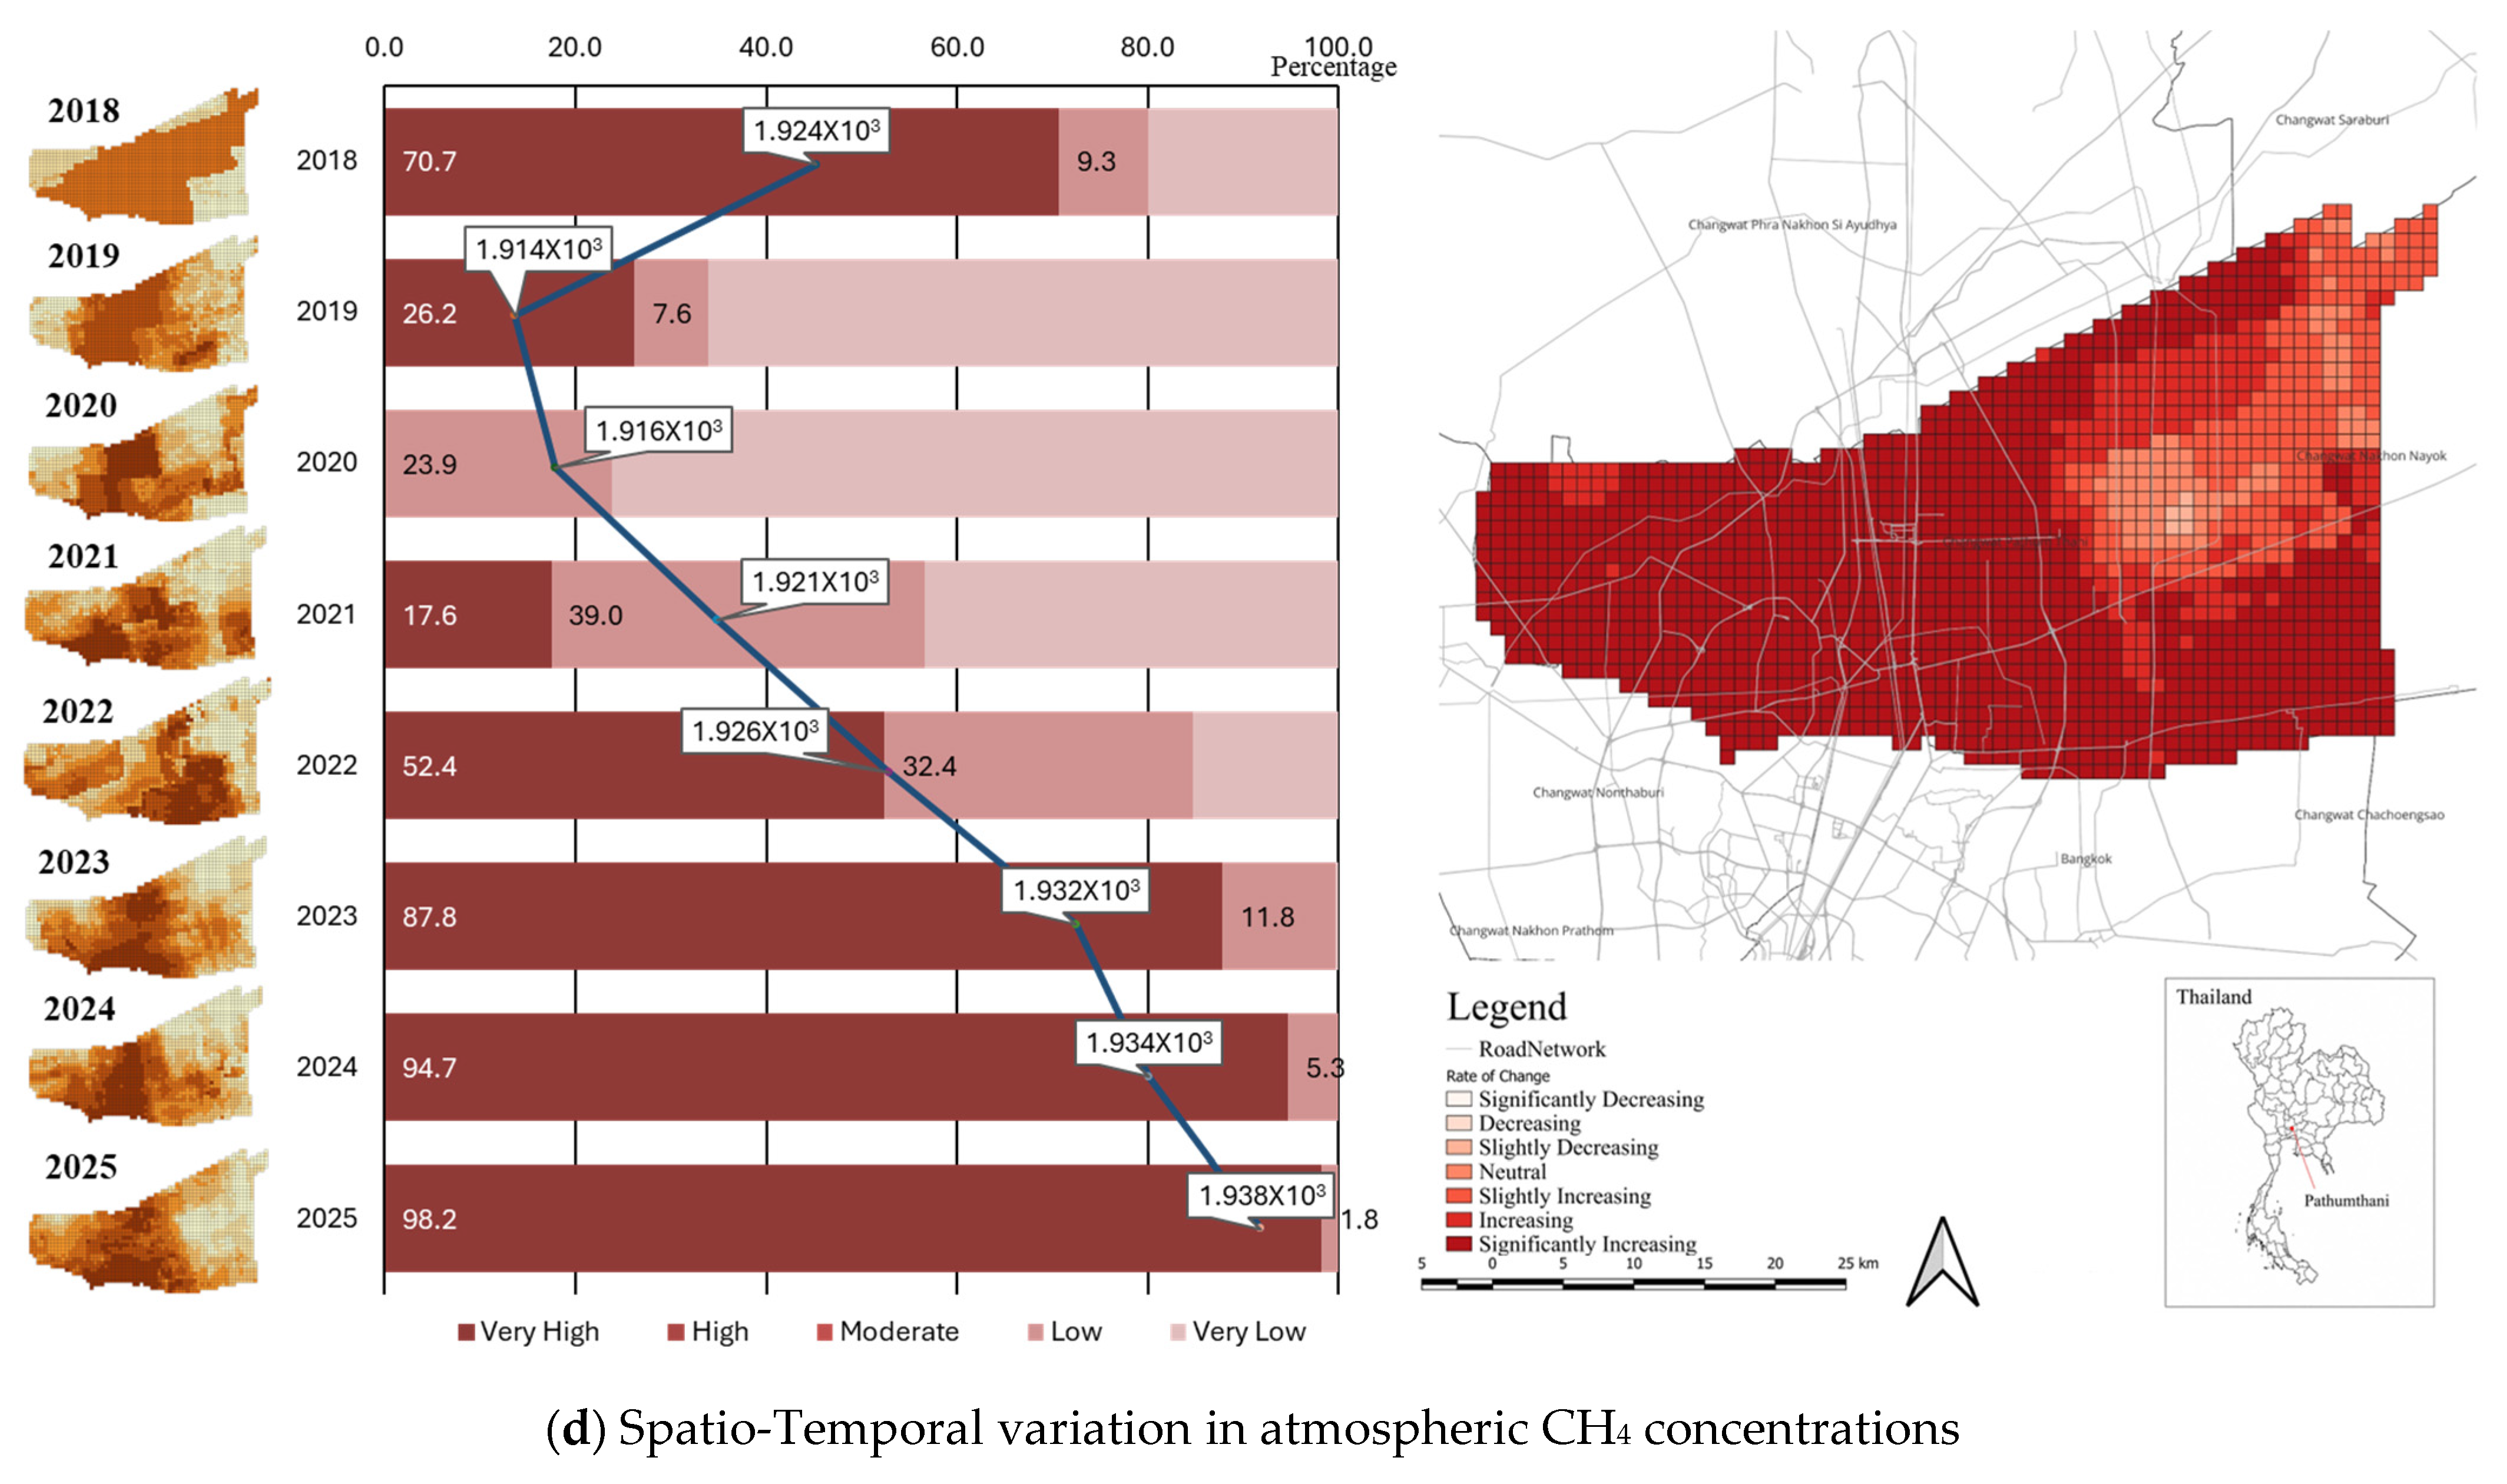
The descriptive statistics indicate an overall increase in environmental pressure within the study area between 2018 and 2025. CH4 concentrations also increased from 1882.479 ppb in 2019 to 1941.114 ppb in 2025, reflecting growing greenhouse gas emissions linked to urban and human activities. Similarly, CO and NO2 showed increasing trends with annual growth rates of 0.716% and 1.004%, respectively. The rise in these pollutants suggests increasing transport and combustion-related emissions within the study area. In contrast, SO2 decreased annually by −1.924%, from 0.000030 to 0.000026 mol/m2. Overall, the results indicate that higher levels of urbanization were associated with greater environmental pressure, particularly higher land surface temperature and atmospheric pollutant concentrations (see Table 3).
Table 3.
Temporal change of environmental indicators. (Source: Authors).
The spatial analysis demonstrates that environmental impacts are strongly associated with urbanization and metropolitan expansion within the study area. Higher concentrations of environmental indicators are generally clustered around the central, southern and southwestern parts of the province, particularly along major transportation corridors connected to the Bangkok Metropolitan Region, while lower concentrations are more common in peripheral agricultural areas. SO2 and NO2 concentrations show stronger hotspots in urbanized and road-oriented areas, indicating the influence of traffic emissions and combustion-related activities (see Figure 5a,b). NO2 exhibits clear concentration patterns along dense urban corridors, suggesting an association with transportation and urban activities. Similarly, CO concentrations are widely distributed across developed areas, suggesting continuous emissions from urban energy use and vehicle operations (see Figure 5c). Meanwhile, CH4 concentrations show broader high-value clusters, particularly in the western and southwestern areas, suggesting the combined influence of urban activities, waste systems and peri-urban land-use interactions (see Figure 5d). Overall, the spatial patterns confirm that environmental pressure has become increasingly concentrated in rapidly urbanizing peri-urban zones and along major transportation corridors.
Figure 5.
Spatio-temporal dynamics of pollutant values (Source: Authors).
4.3.2. Land Surface Temperature (LST) Change
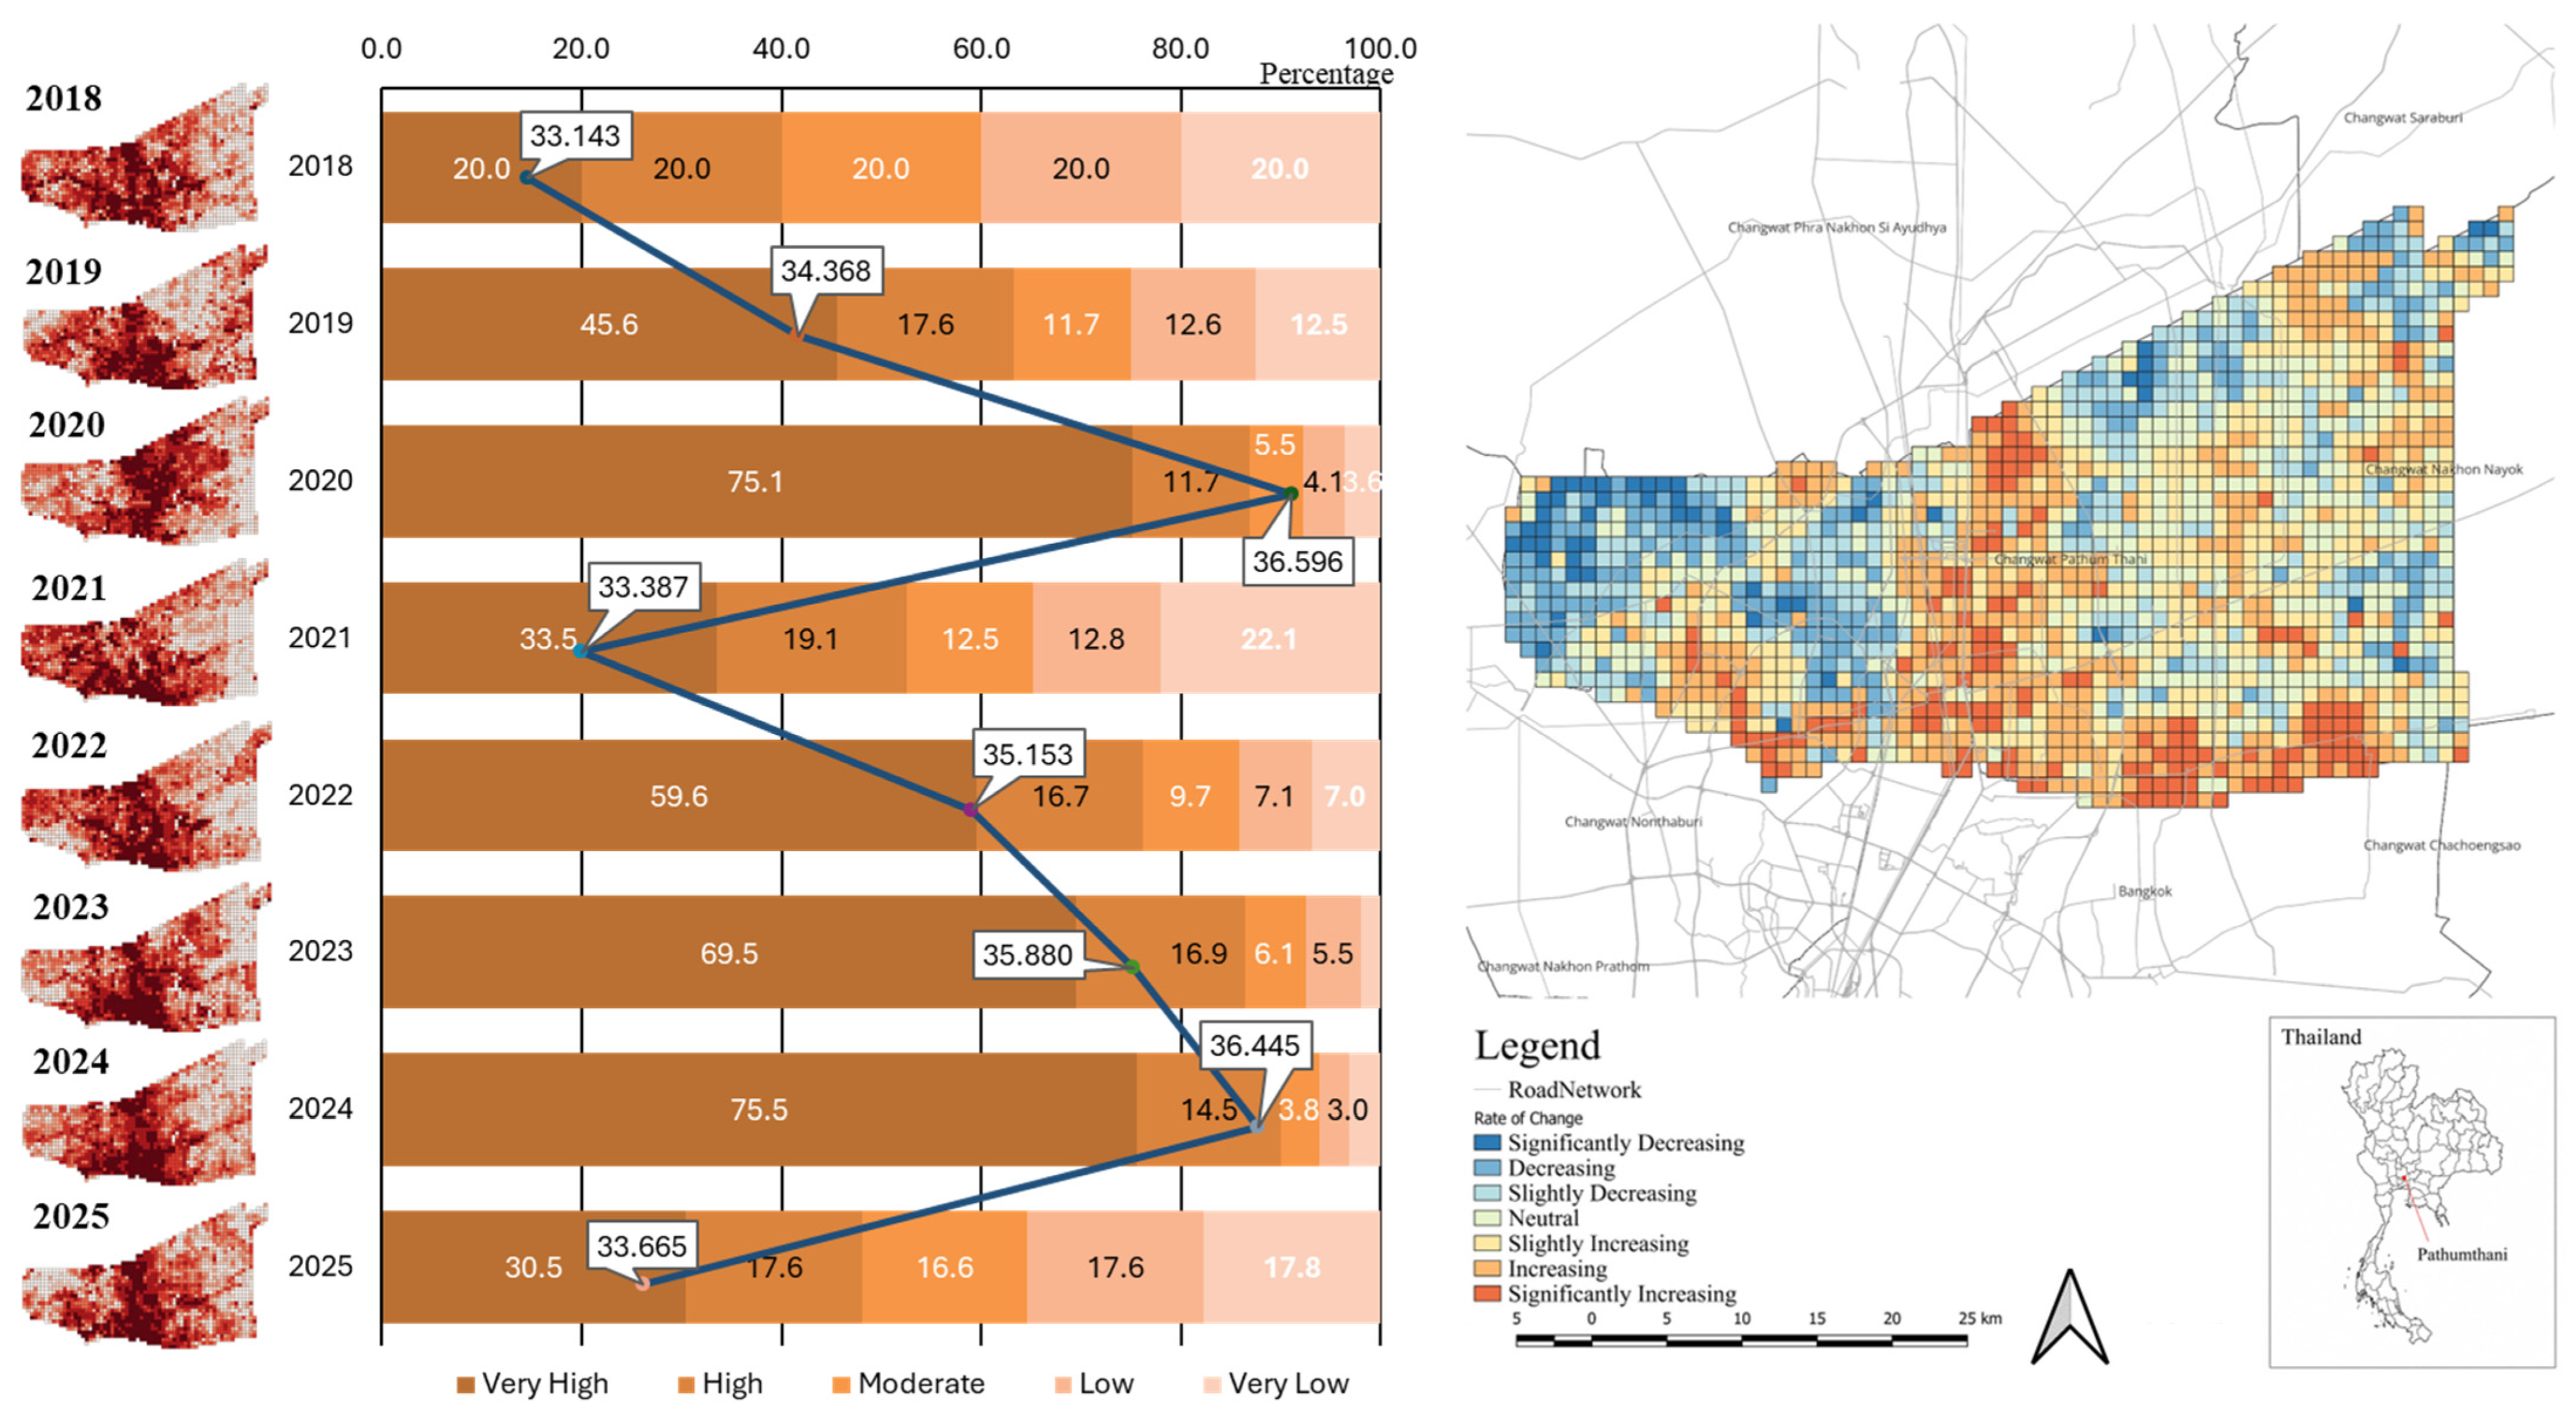
Land Surface Temperature (LST) increased slightly from 34.3 °C to 34.8 °C with an annual growth rate of 0.181% or about 0.1 degree Celsius per year, suggesting gradual urban heat accumulation associated with urban expansion and reduced vegetation cover. LST displays higher values in built-up zones and lower values in less developed and agricultural areas, indicating the emergence of urban heat island characteristics associated with expanding impervious surfaces and declining vegetation cover (see Figure 6).
Figure 6.
Spatio-temporal dynamics of LST (Source: Authors).
4.3.3. Spatio-Temporal Transition Patterns of Urbanization and Vegetation Dynamics
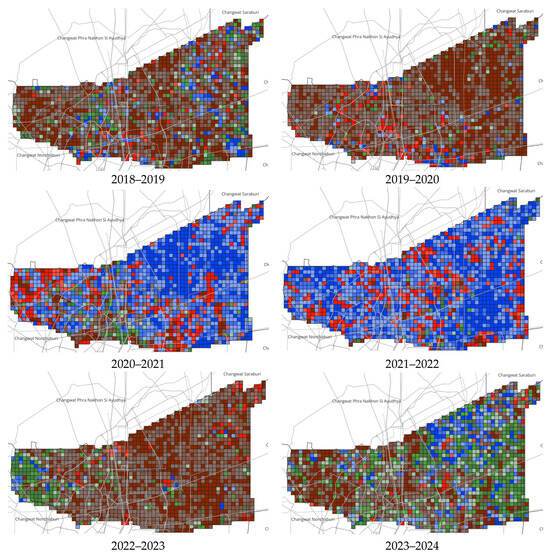
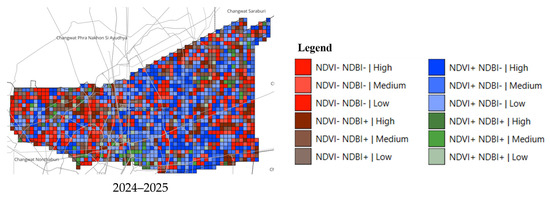
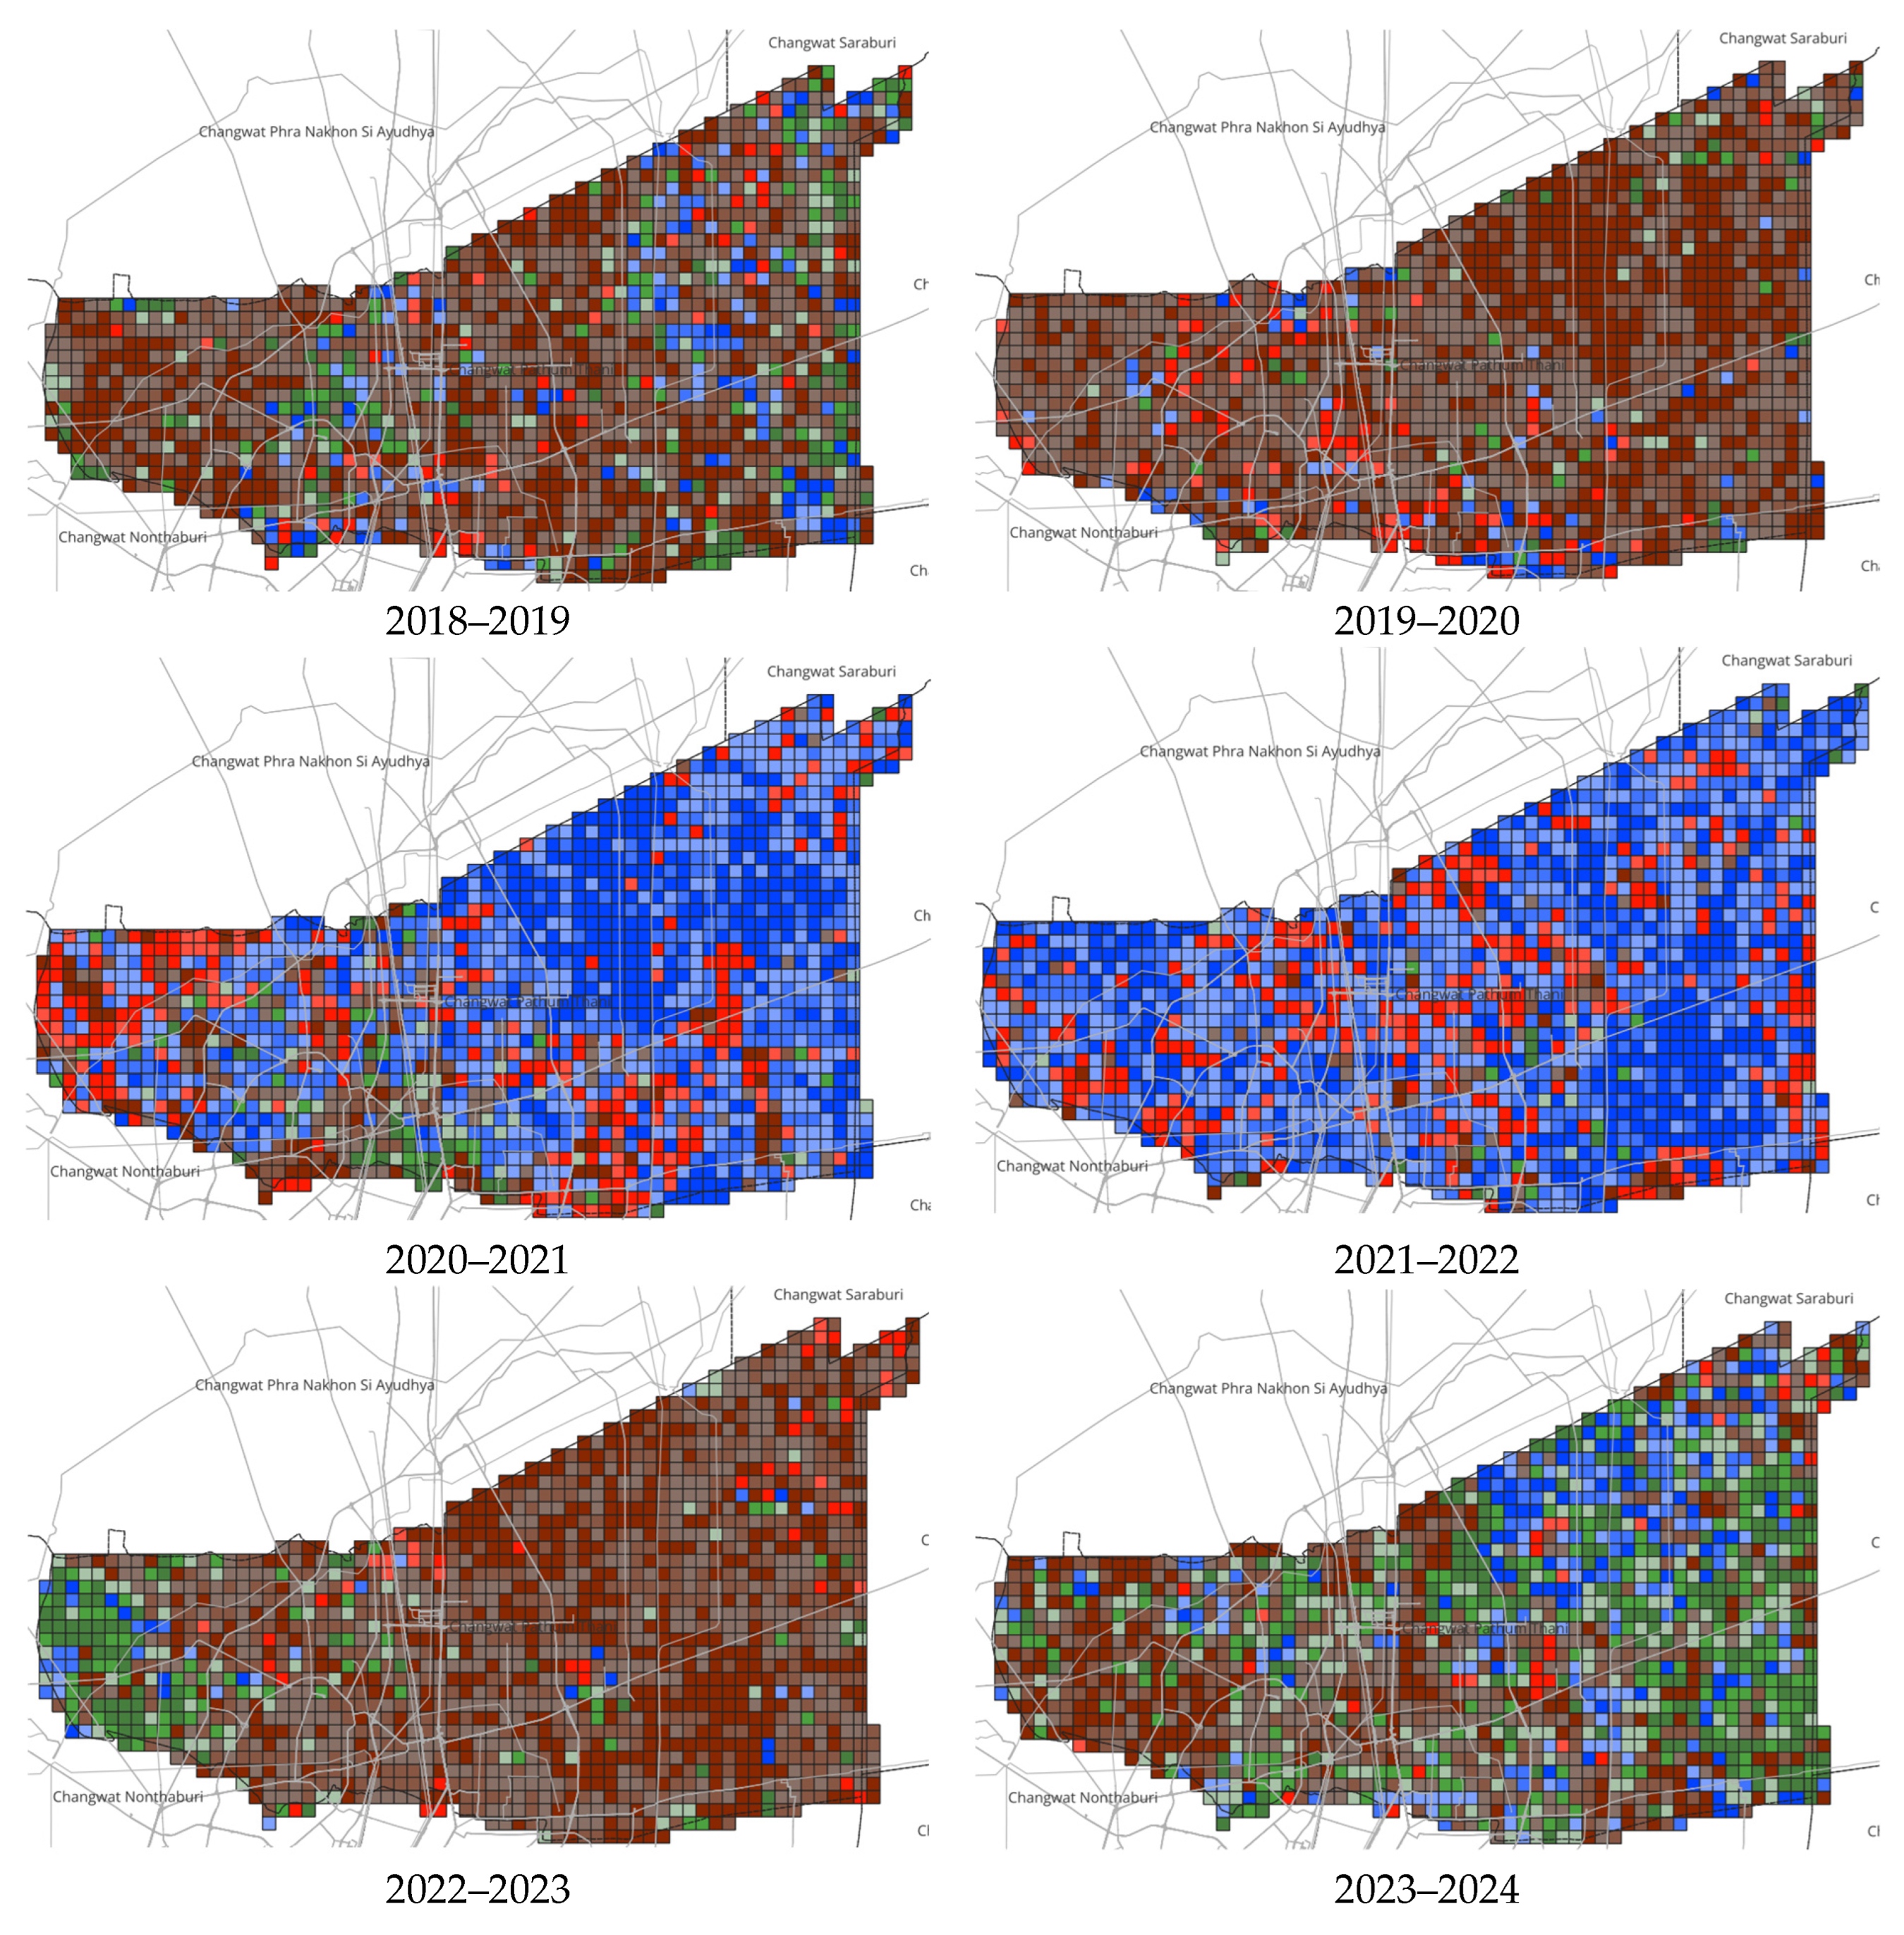
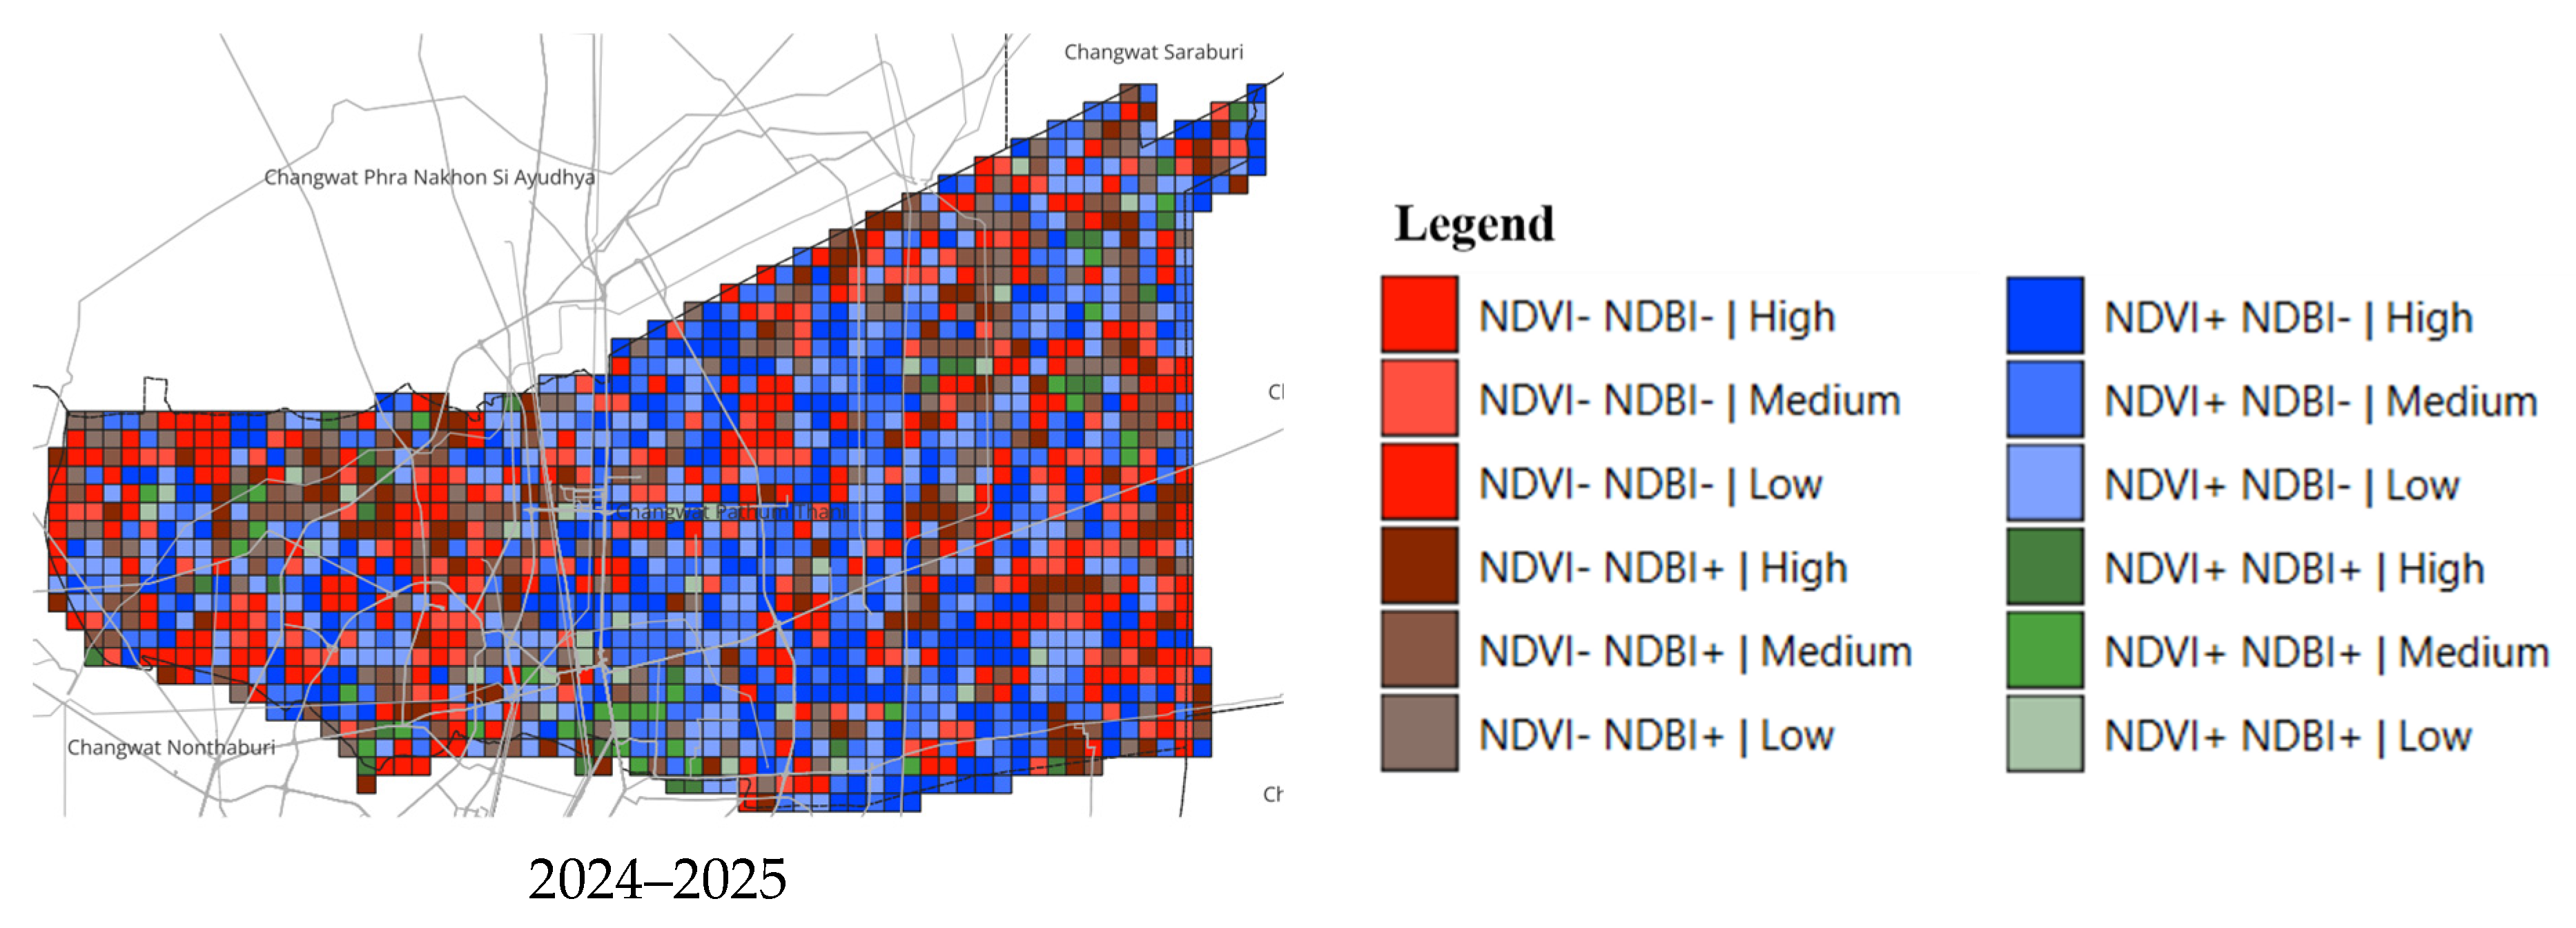
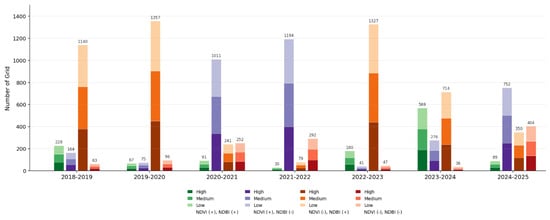
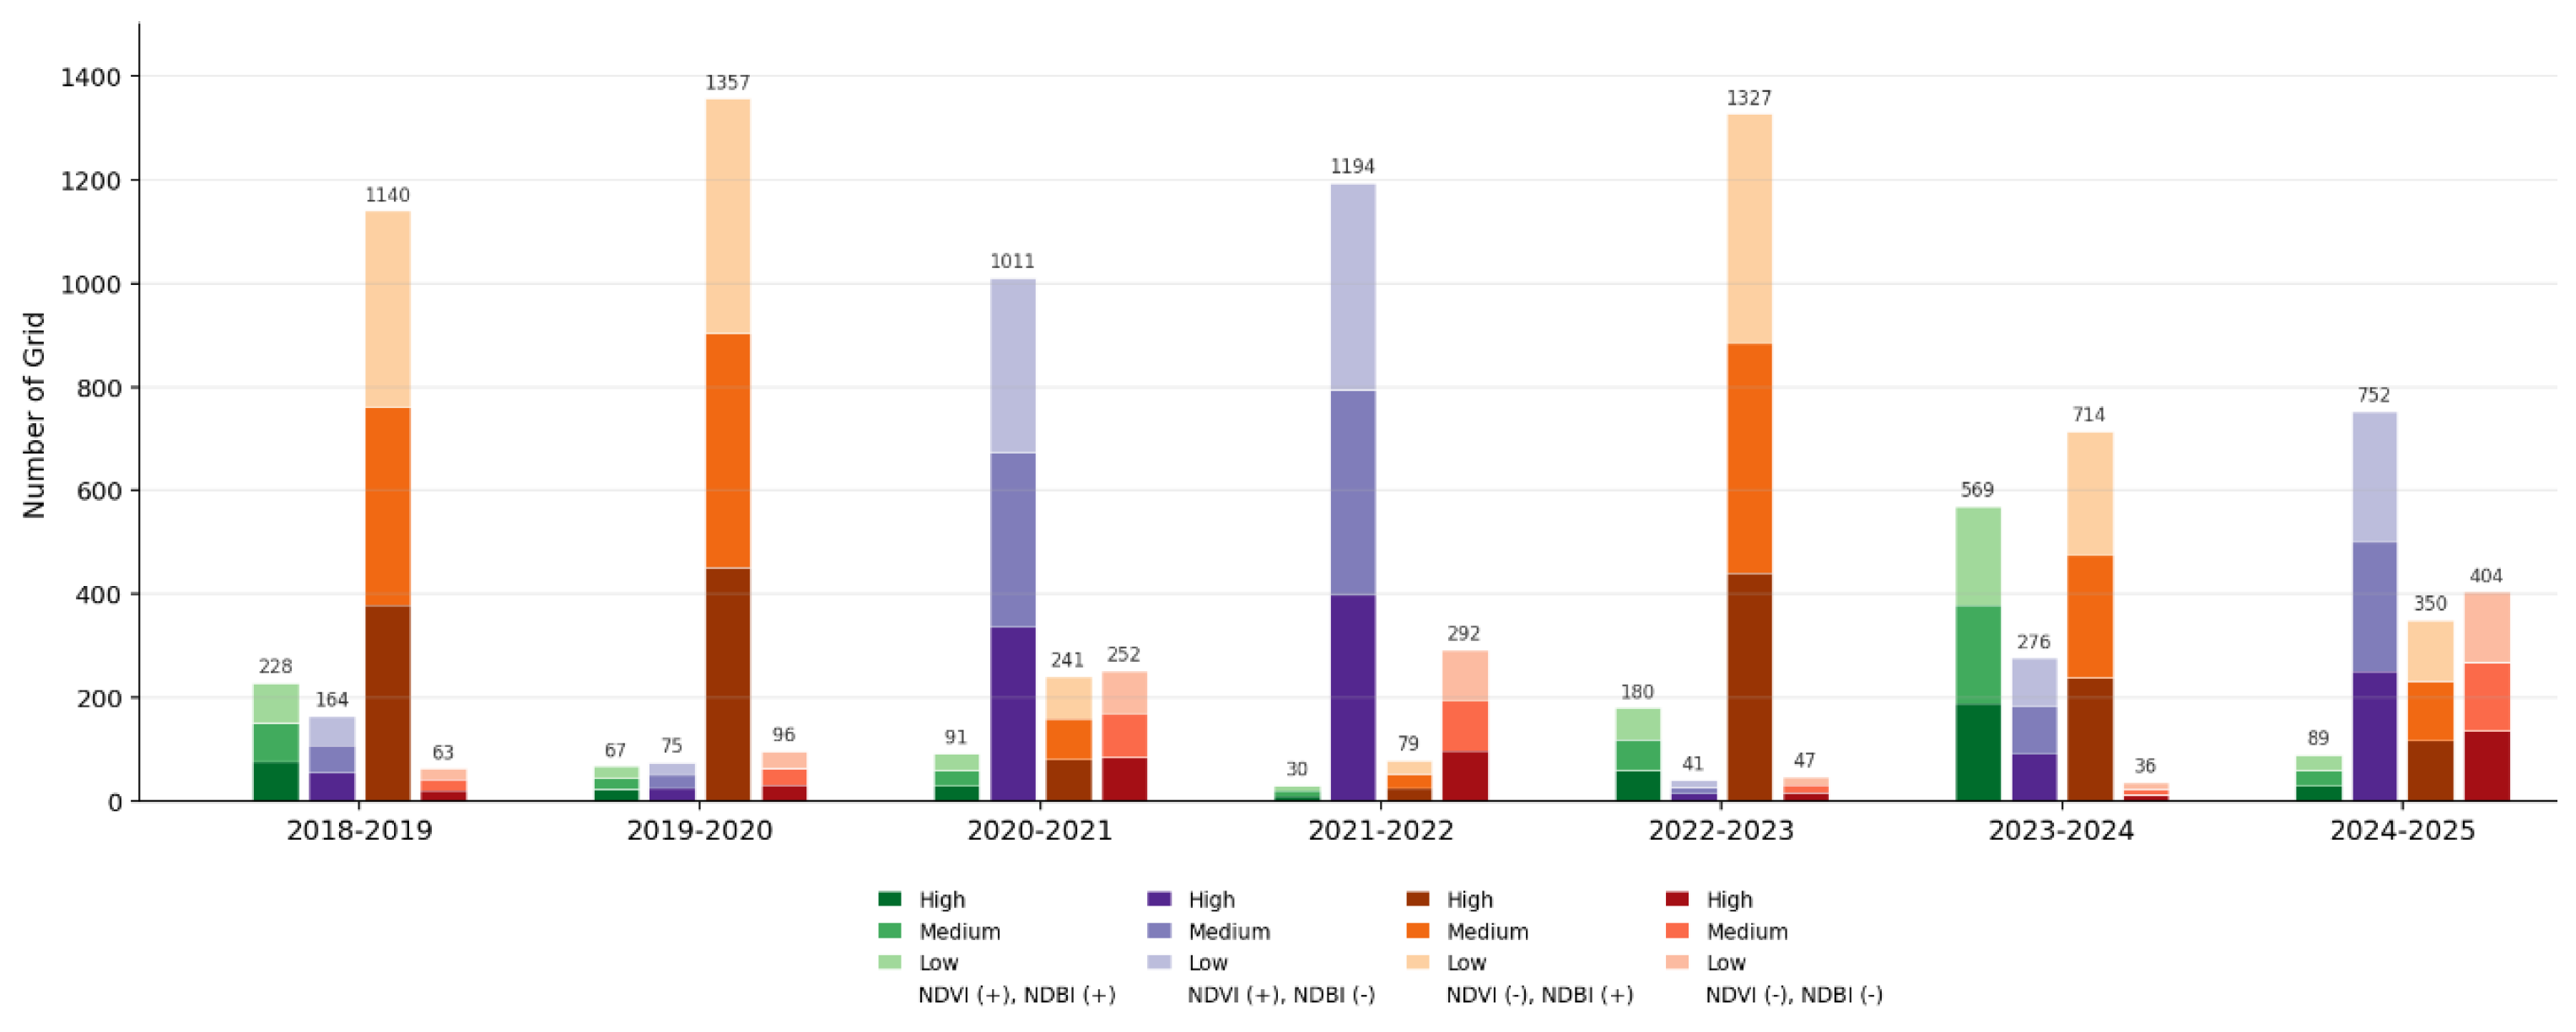
The NDVI-NDBI transition analysis reveals fluctuating peri-urban transformation dynamics in Pathum Thani between 2018 and 2025. Several periods, particularly 2018–2019, 2019–2020, 2022–2023 and 2024–2025, were characterized by decreasing NDVI and increasing NDBI, indicating vegetation loss and built-up expansion associated with urbanization and land conversion. In contrast, 2020–2021, 2021–2022 and 2023–2024 showed increasing NDVI and decreasing NDBI, suggesting periods of vegetation recovery and reduced built-up intensity. Simultaneous increases or decreases in both NDVI and NDBI remained relatively limited throughout the study period. Notably, the 2024–2025 period again shows a stronger concentration of grids under decreasing NDVI and increasing NDBI conditions, suggesting that recent peri-urban dynamics have shifted back toward urban expansion and land-conversion processes. Overall, the findings indicate alternating cycles of urban expansion and environmental recovery, reflecting the dynamic and transitional nature of peri-urban development in Pathum Thani (see Figure 7 and Figure 8).
Figure 7.
Spatio-temporal transition patterns of NDVI and NDBI (Source: Authors).
Figure 8.
Annual trends in NDVI and NDBI (Source: Authors).
4.4. Spatio-Temporal Urban Transformation Clusters and Peri-Urban Dynamics
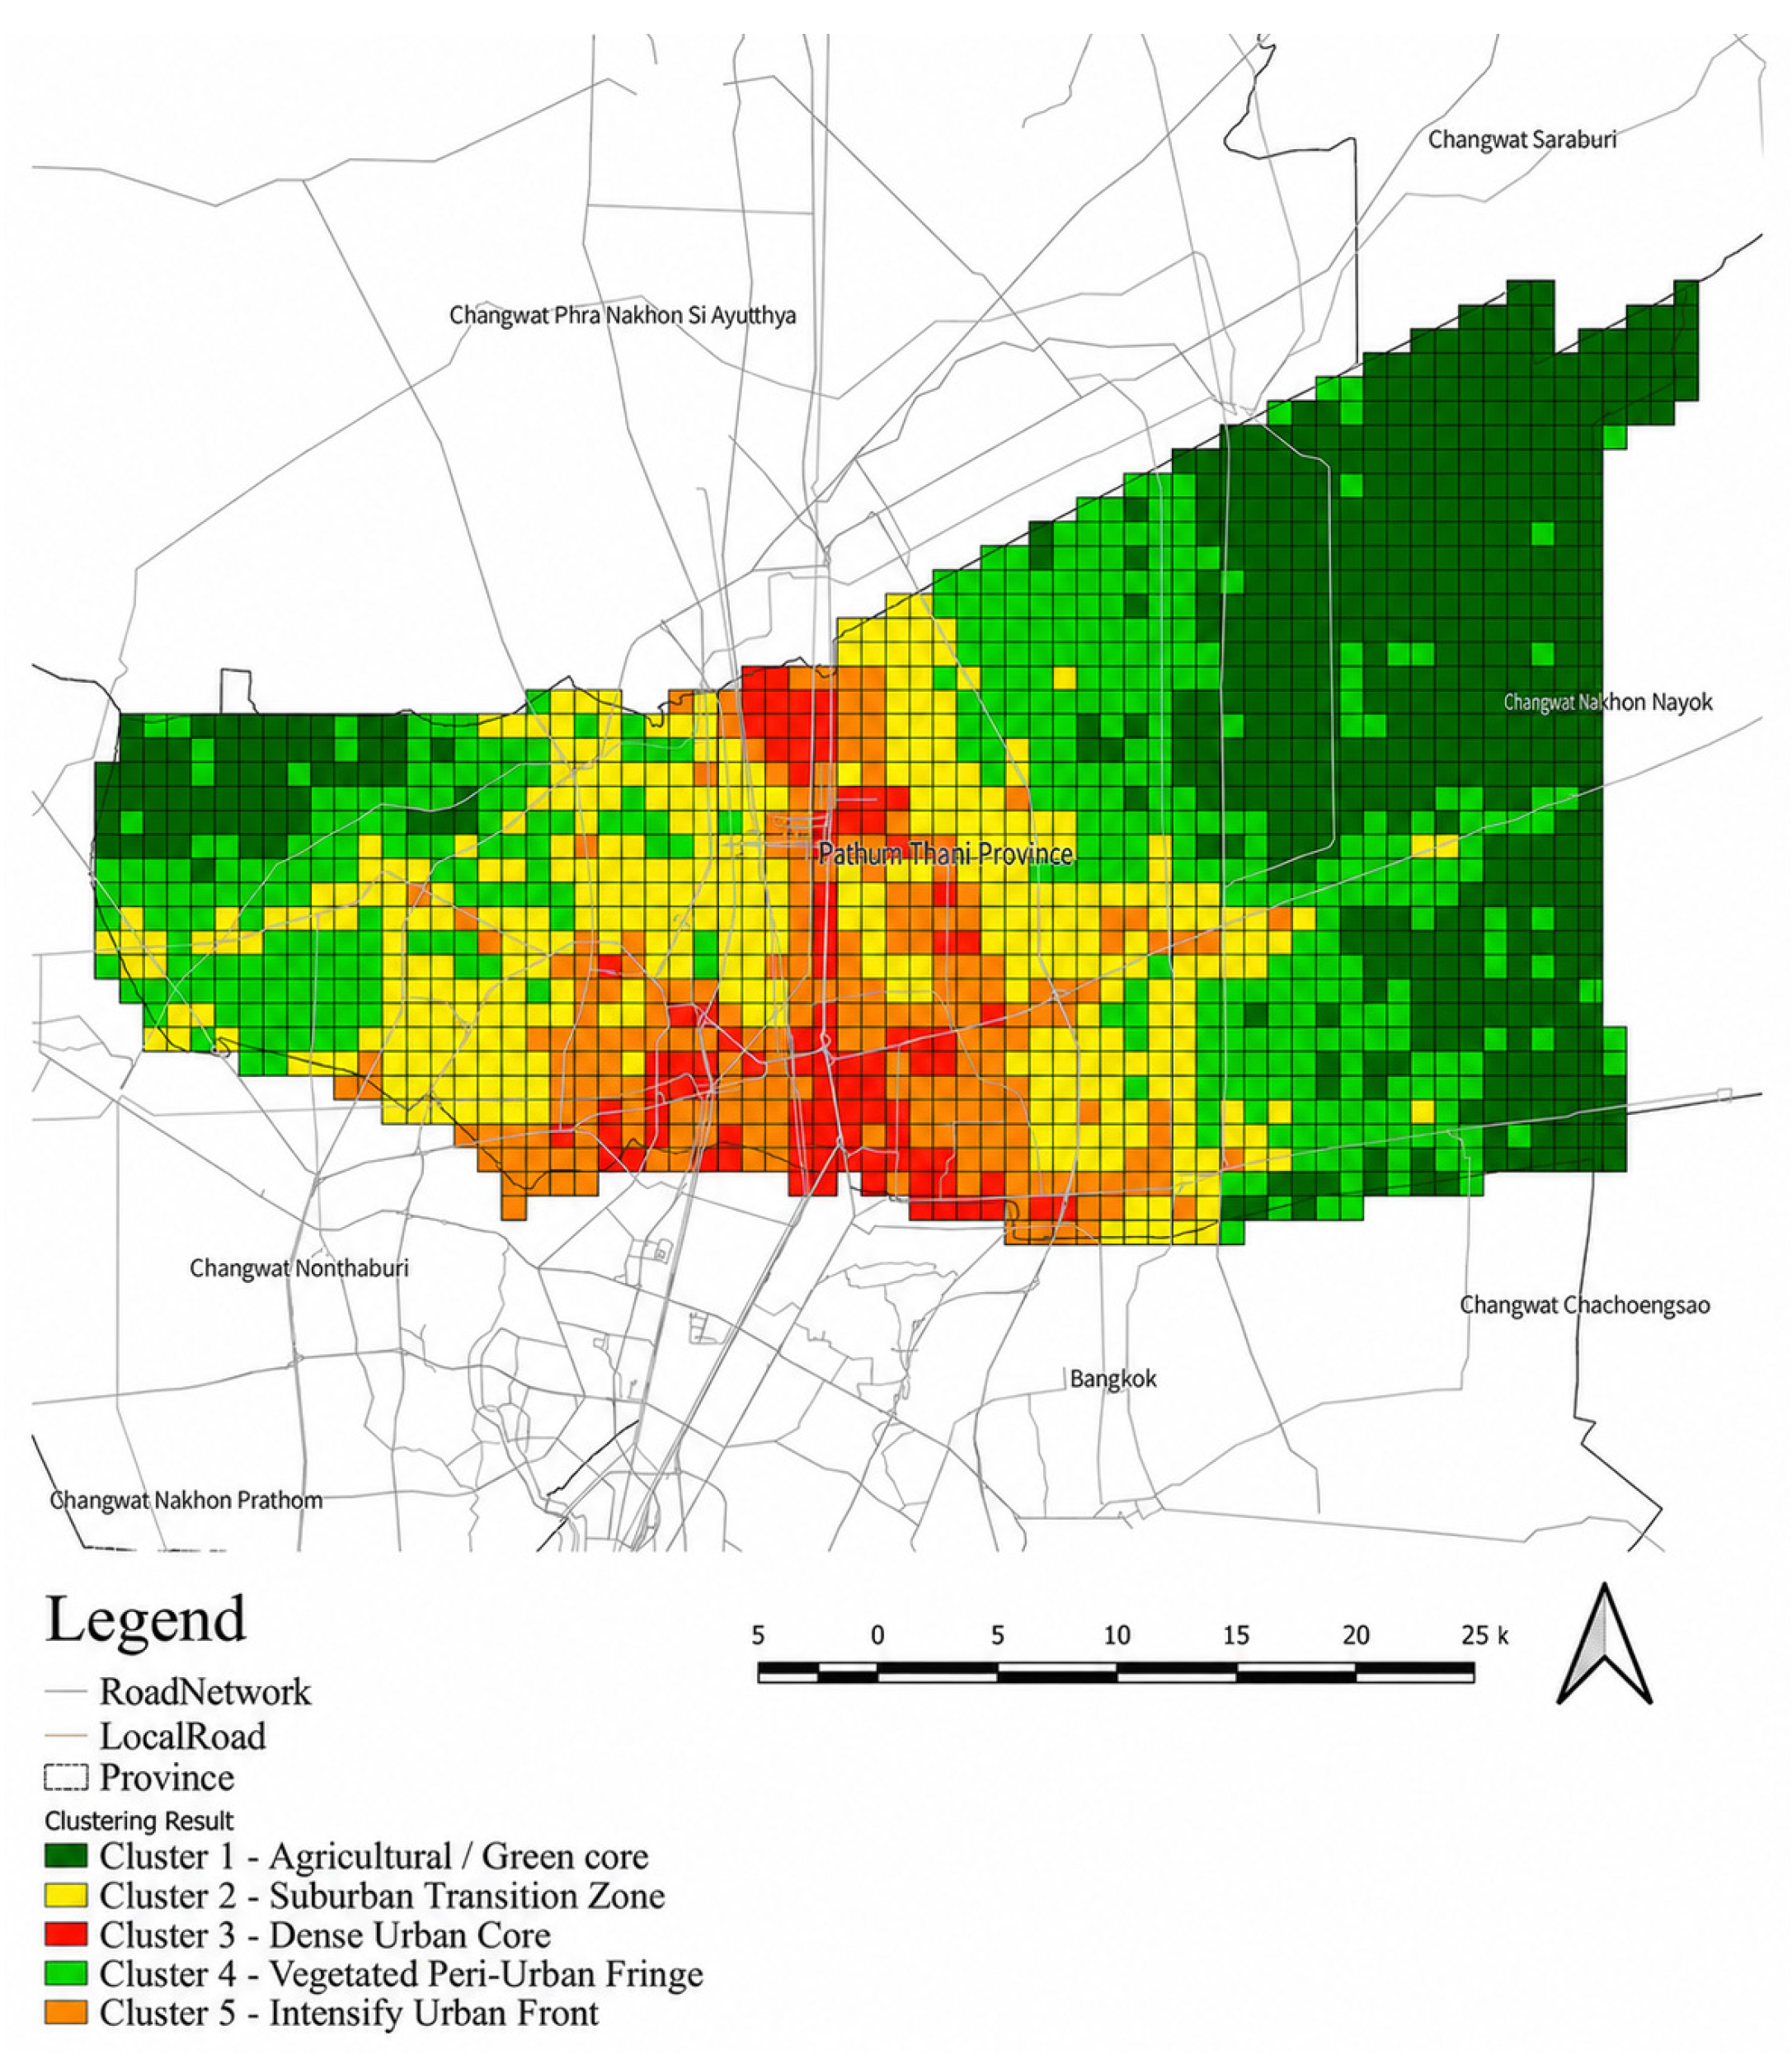
K-means cluster analysis conducted in SPSS Version 31 identified three dominant temporal transition patterns of NDVI and NDBI across the 1599 spatial grids in Pathum Thani between 2018 and 2025. Prior to clustering, year-on-year NDVI and NDBI changes were standardized using z-scores to ensure comparability between variables. The results reveal five distinct spatio-temporal peri-urban transformation dynamics. When combined with environmental indicators including CH4, CO, SO2, NO2, NTL and LST, the findings demonstrate that peri-urbanization in Pathum Thani involves not only physical land conversion, but also environmental and socio-economic transformation processes. To determine the optimal clustering configuration, K-means clustering was applied and evaluated across a range of cluster numbers (k = 2 to 10). The silhouette analysis indicated that k = 5 yielded the highest silhouette score among the tested solutions. Furthermore, the combined assessment of the silhouette coefficient and the Davies-Bouldin index confirmed that a five-cluster solution provided the optimal partitioning of the data.
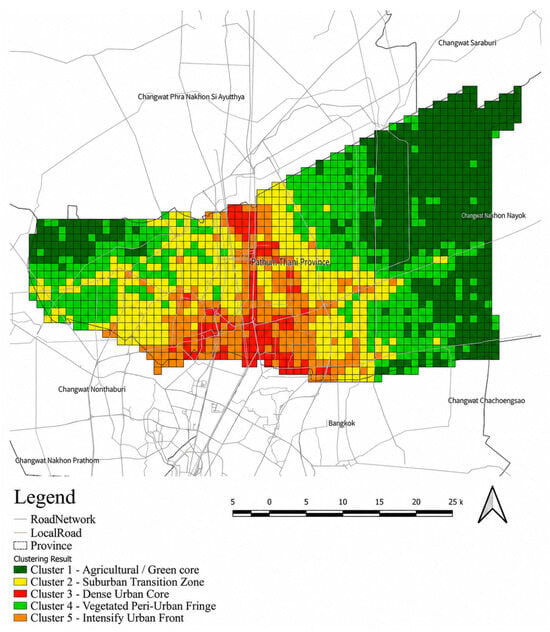
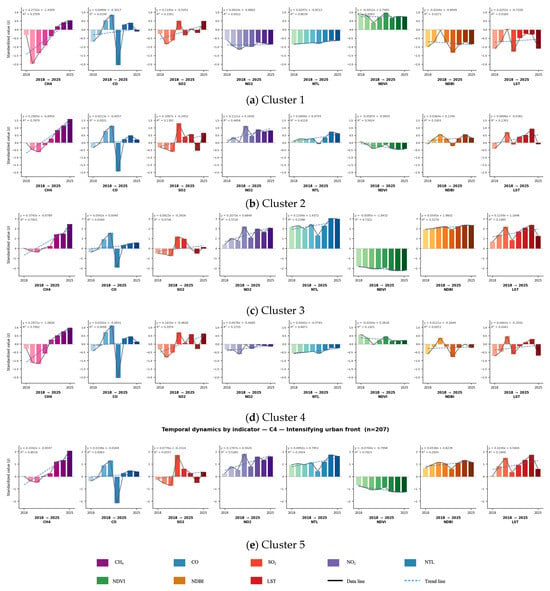
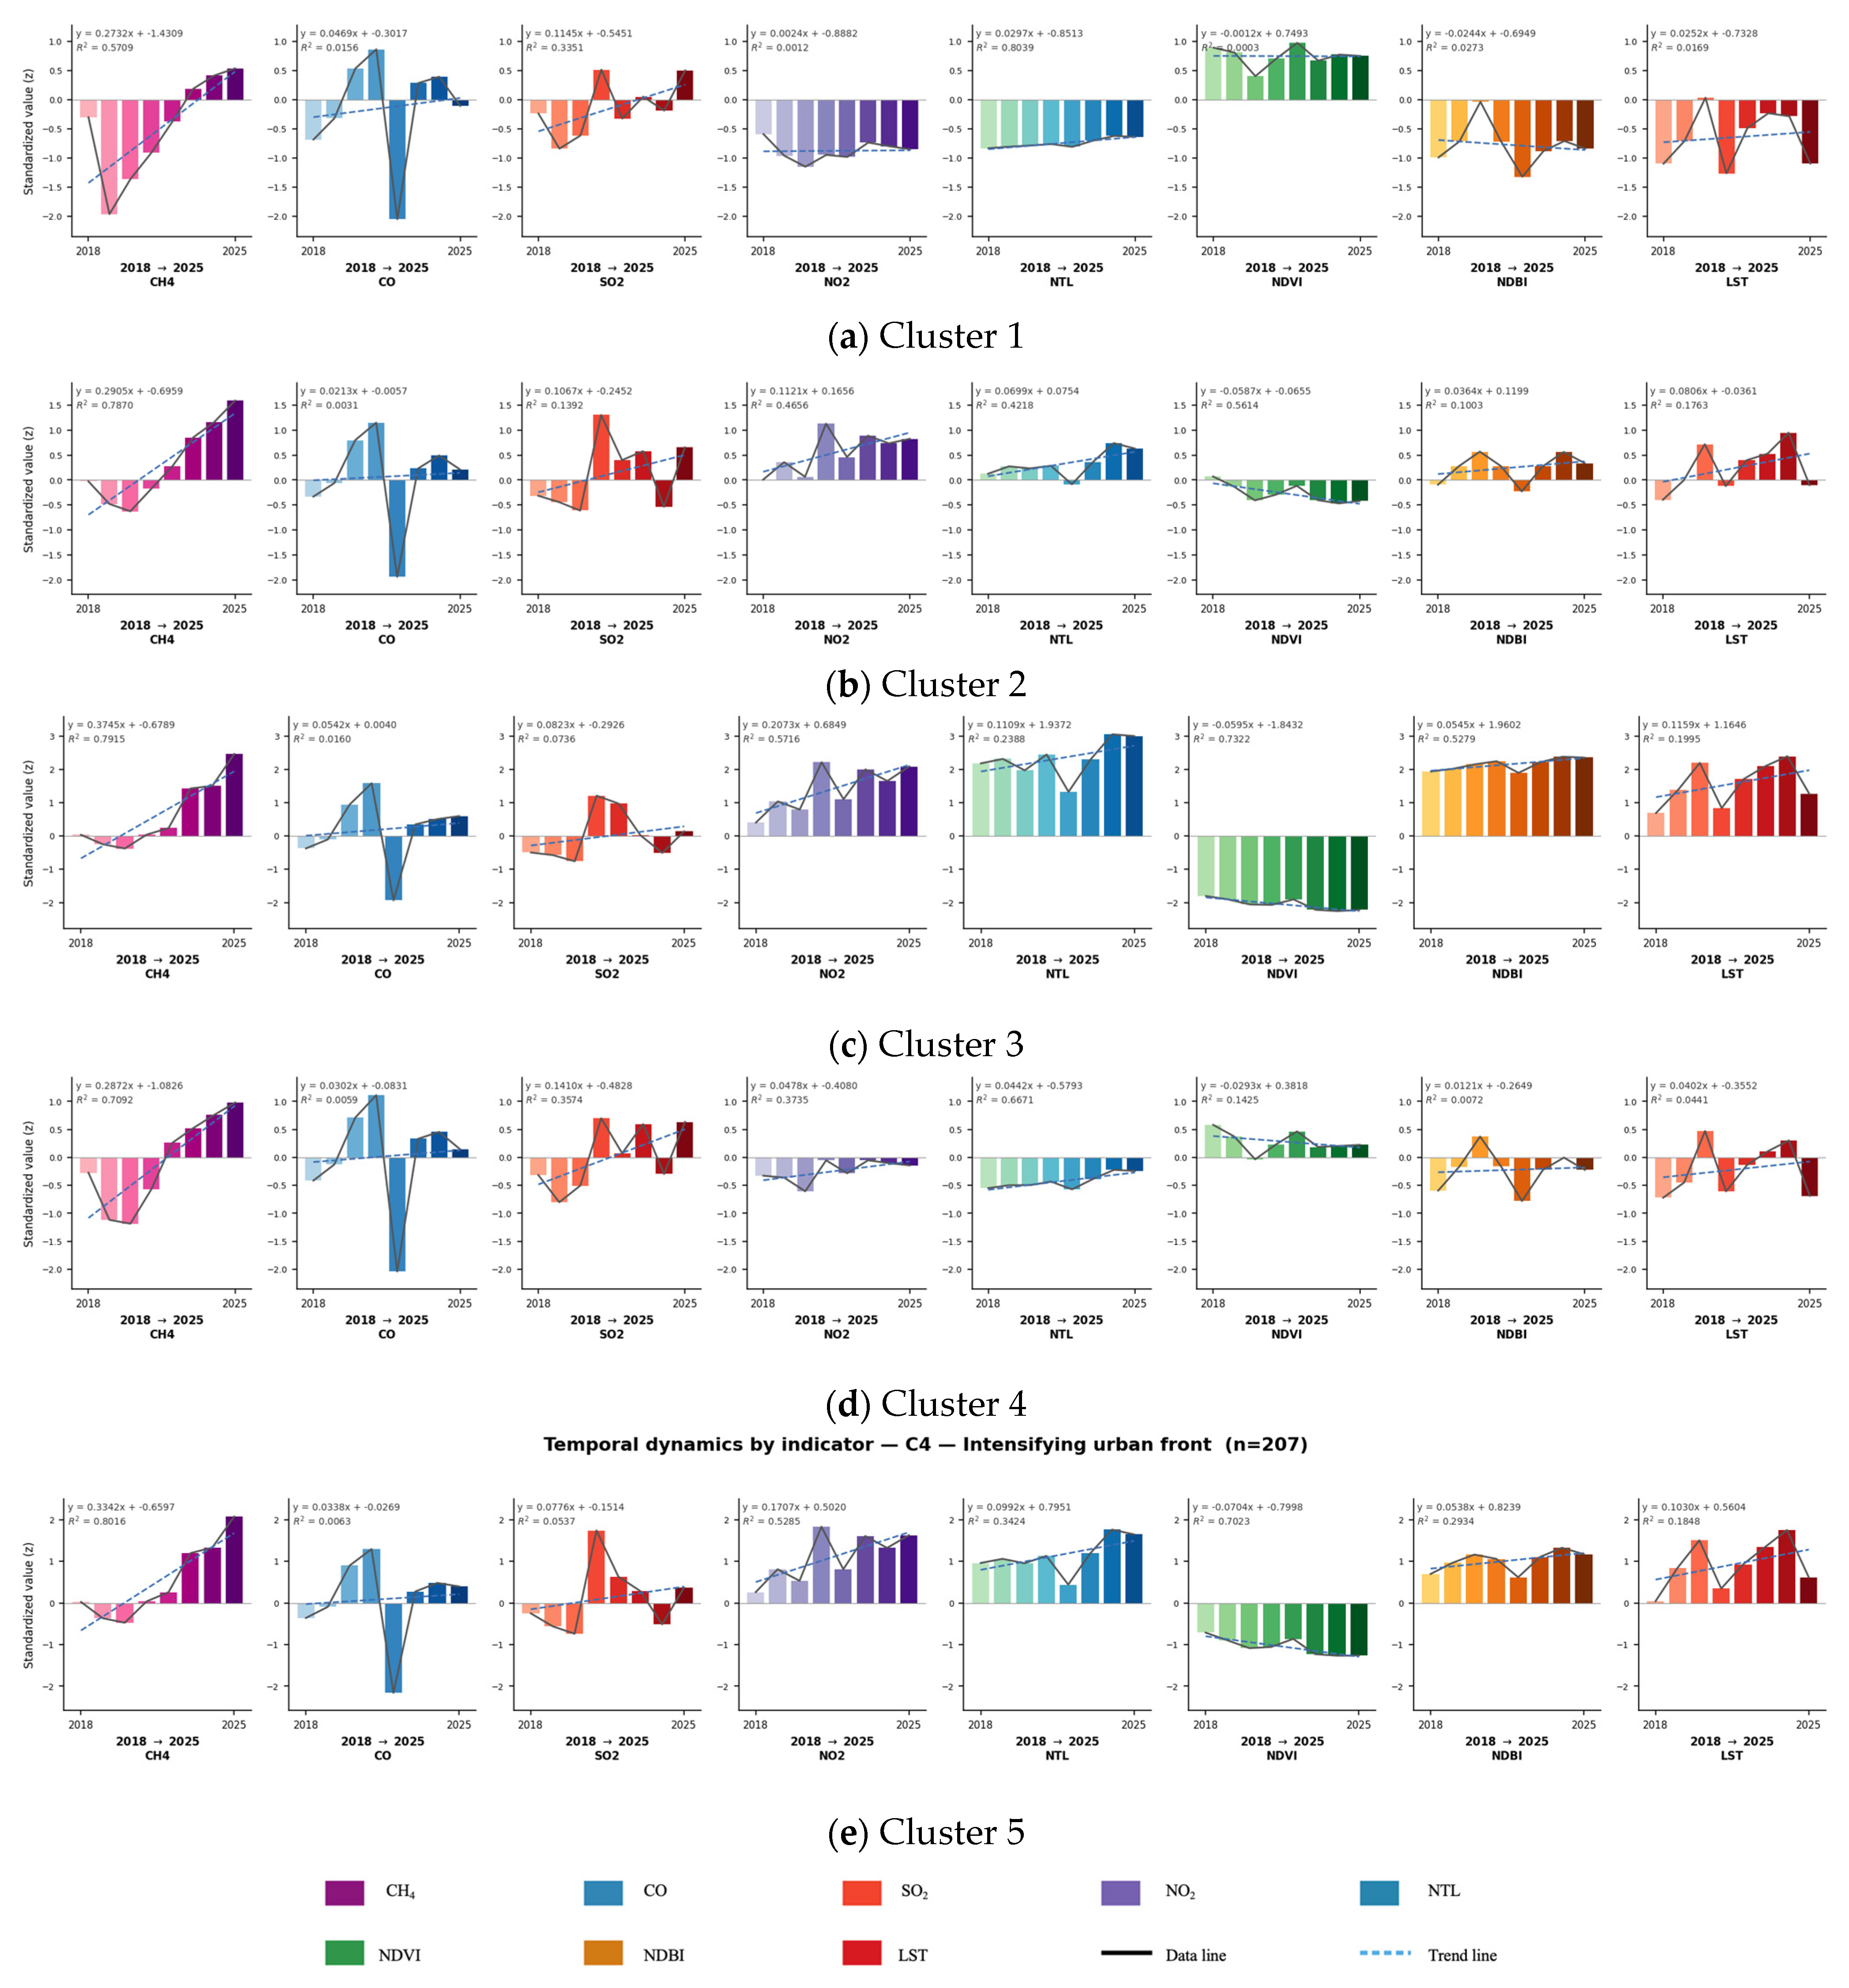
Integrated spatio-temporal characterization of peri-urban transformation in Pathum Thani Province derived from tensor decomposition coupled with K-means clustering on a 1 km analysis grid. The spatial partitioning identifies five clusters representing a rural-to-urban gradient: Cluster 1 (agricultural and green core), Cluster 2 (sub-urban transition zone), Cluster 3 (dense urban core), Cluster 4 (vegetated peri-urban fringe) and Cluster 5 (intensifying urban front). The clustering results are overlaid on the provincial road network and administrative boundaries to illustrate the spatial configuration of peri-urban transformation. The vegetated clusters predominantly occupy the northern and eastern sectors of the province, whereas densely built-up clusters are concentrated along the southern boundary adjacent to the Bangkok Metropolitan Region, reflecting metropolitan-driven urban expansion. Cluster-specific temporal dynamics are presented as small multiples with each row representing a cluster and comprising eight indicator panels (CH4, CO, NO2, SO2, NTL, NDVI, NDBI and LST). Each panel illustrates standardized annual values for the period 2018–2025, together with yearly observations, fitted linear trends and the corresponding regression equations and coefficients of determination (R2). The results indicate that highly urbanized clusters exhibit pronounced increases in night-time light intensity, built-up extent, land surface temperature and atmospheric pollutants, accompanied by declining vegetation cover (NDVI). In contrast, agricultural and peri-urban fringe clusters remain relatively stable over time. Collectively, these findings integrate the spatial distribution of clusters with their temporal trajectories, demonstrating that each peri-urban transformation regime exhibits distinct environmental and temporal characteristics (see Figure 9).
Figure 9.
Temporal urban transformation clusters and peri-urban dynamics (Source: Authors).
Cluster 1 (agricultural and green core) (see Figure 10a) shows no clear land-conversion trend with a slight increase in NDVI (Δ ≈ +0.005) and marginally negative changes in NDBI, indicating the persistence of vegetated and open-land surfaces. Annual averages confirm its predominantly rural character, characterized by the highest vegetation cover (NDVI ≈ 0.57), lowest built-up intensity (NDBI ≈ −0.23), coolest land surface temperature (LST ≈ 32.9 °C) and lowest night-time light intensity (NTL ≈ 2.2). Comprising 516 grid cells (approximately 32% of the study area), Cluster 1 represents the dominant non-urban landscape in the province. Modest increases in LST (Δ ≈ +1.1 °C) and CH4, coupled with stable or declining NO2 levels indicate limited anthropogenic pressure consistent with agricultural land use.
Figure 10.
Temporal dynamics of five clusters (Source: Authors).
Cluster 2 (sub-urban transition zone) (see Figure 10b) exhibits the greatest interannual variability among all clusters, particularly during 2019–2021, when substantial vegetation loss coincided with rapid built-up expansion before partially reversing in subsequent years. Despite these fluctuations, annual averages indicate relatively high NDVI and consistently negative NDBI values, suggesting that vegetated and open-land surfaces remain predominant. Elevated CO concentrations, together with persistently low NO2, NTL and LST values, indicate fragmented and incomplete peri-urban transformation characterized by intermittent construction activities and partially developed sub-urban landscapes rather than consolidated urban development. Spatially, Cluster 2 is scattered across the central and northeastern parts of Pathum Thani, representing fragmented peri-urban transition zones.
Cluster 3 (dense urban core) (see Figure 10c) exhibits the most intense and persistent urban transformation, characterized by the largest increases in NDBI and night-time light (ΔNTL ≈ +7.1) and the greatest decline in NDVI, reflecting mature urban consolidation. Annual averages indicate the most urbanized profile with the lowest vegetation cover (NDVI ≈ 0.32), highest built-up intensity (NDBI ≈ −0.04), highest land surface temperature (LST ≈ 39 °C) and highest night-time light intensity (NTL ≈ 28). Although comprising only 93 grid cells (approximately 6% of the study area), Cluster 3 experiences the greatest environmental pressure, evidenced by the highest NO2 and CH4 concentrations and the steepest warming trend (ΔLST ≈ +2.6 °C). Spatially, it forms a compact urban core in southern Pathum Thani, encompassing Mueang Pathum Thani and the densely developed Rangsit corridor.
Cluster 4 (vegetated peri-urban fringe) (see Figure 10d) demonstrates the weakest transformation dynamics, with minimal year-to-year changes in NDVI and NDBI, indicating a relatively stable peri-urban buffer. Annual averages remain vegetation-dominated (NDVI ≈ 0.53; NDBI ≈ −0.19; 83% vegetated land cover), accompanied by low night-time light intensity (NTL ≈ 4.8) and the smallest warming trend (ΔLST ≈ +0.7 °C). Comprising 425 grid cells (approximately 27% of the study area), it represents the second-largest cluster and, together with Cluster 1, forms the predominantly rural landscape of the province. Limited increases in CH4 and otherwise stable pollutant levels suggest only modest environmental pressure. Spatially, Cluster 4 is concentrated in the western and north-central districts, particularly within the agricultural areas of Sam Khok and Lat Lum Kaeo bordering Ayutthaya and Nonthaburi.
Cluster 5 (Intensified urban front) (see Figure 10e) shows the second-most intense transformation dynamics, characterized by declining vegetation (ΔNDVI ≈ −0.028), increasing built-up intensity (ΔNDBI ≈ +0.024) and rapid growth in night-time light intensity (ΔNTL ≈ +6.3), indicating sustained urban expansion. Annual averages reflect a highly urbanized landscape (NDVI ≈ 0.41; NDBI ≈ −0.11; 95% built-up) with elevated land surface temperature (LST ≈ 37.4 °C). Comprising 207 grid cells (approximately 13% of the study area), Cluster 5 represents the actively expanding urban fringe. Significant surface warming (ΔLST ≈ +1.9 °C), increasing CH4 and NO2 concentrations, further indicate substantial anthropogenic and thermal pressures. Spatially, Cluster 5 forms a continuous belt across the southern districts bordering Bangkok, corresponding to the Khlong Luang, Thanyaburi and Rangsit growth corridor.
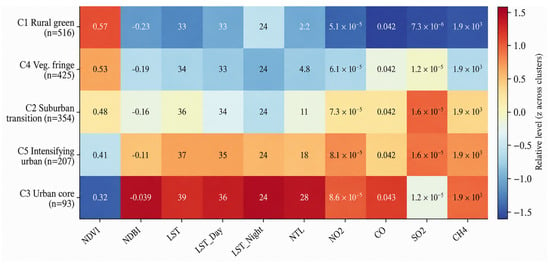
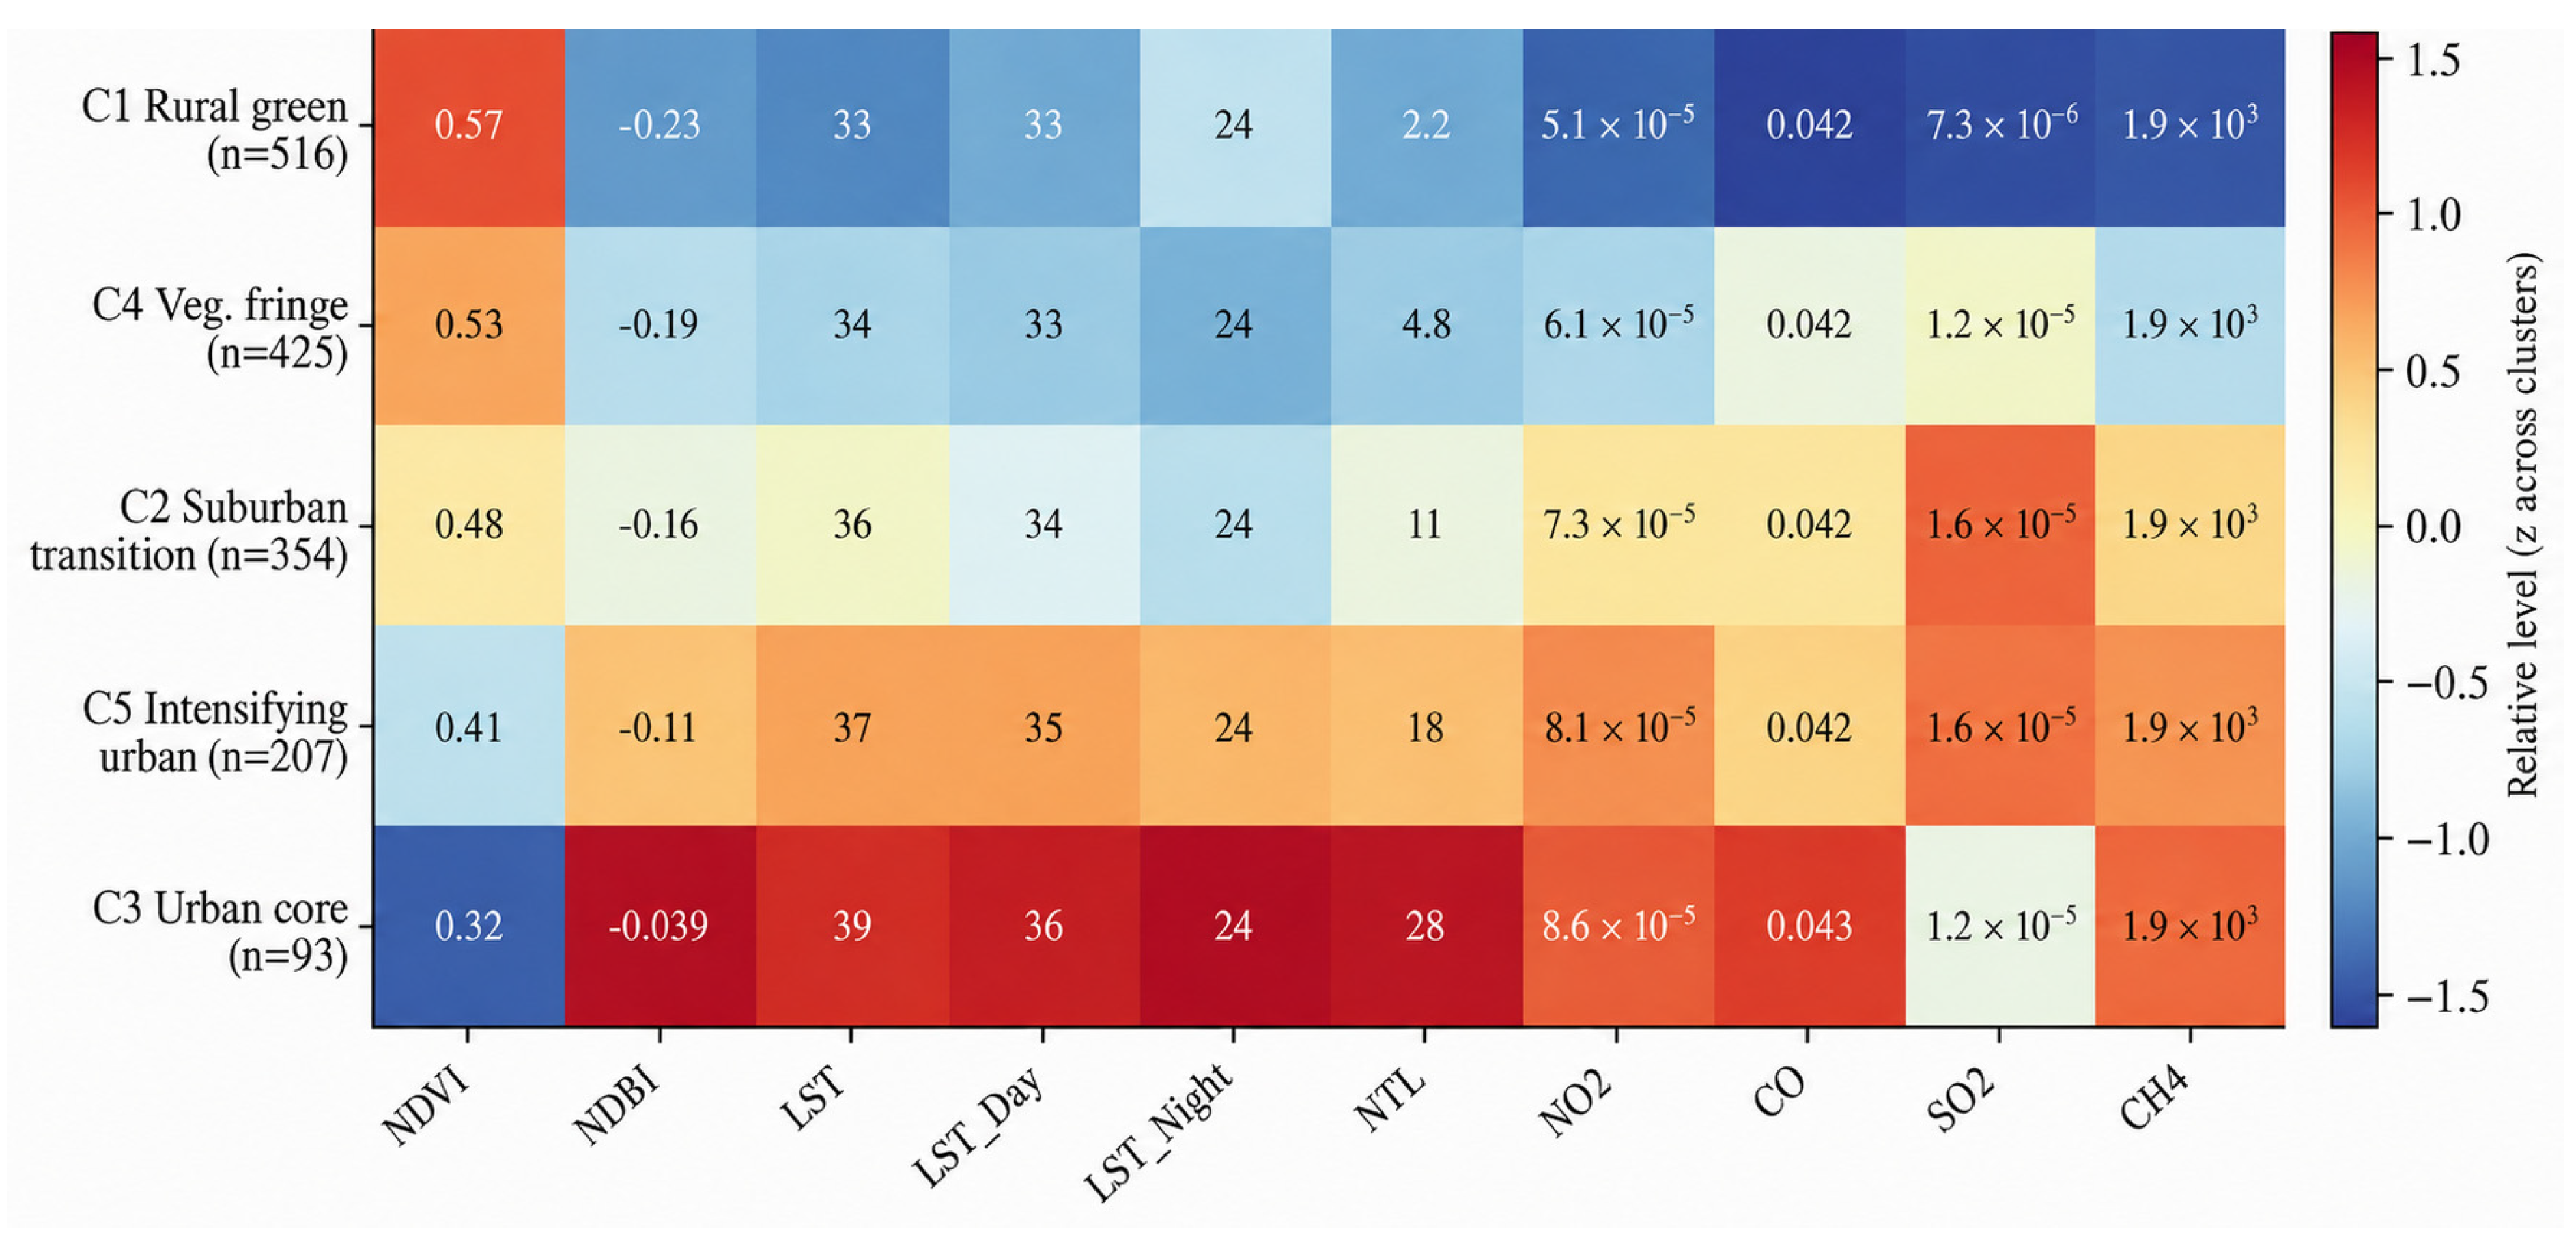
The heatmap summarizes the mean values (2016–2025) of each indicator across the five tensor-derived clusters (clusterT). To facilitate comparison, each indicator was standardized by column (z-score across clusters), with color gradients representing relative magnitudes and cell annotations reporting the original, unstandardized mean values. The clusters resolve into a monotonic rural-to-urban continuum (C1 > C4 > C2 > C5 > C3) whose color structure is mutually consistent across all twelve indicators. At the vegetated extremum, C1 (n = 516) maximizes NDVI (0.57) while minimizing NDBI (−0.23), land surface temperature (≈33 °C) and night-time light (2.2). At the most urbanized end of the gradient, C3 (n = 93) represents the most urbanized profile, characterized by sparse vegetation (NDVI = 0.32) and the highest levels of built-up intensity, land surface temperature (39 °C) and nighttime light intensity (NTL = 28) and atmospheric trace-gas concentrations. Spatially invariant indicators (notably CO and CH4) contribute negligible discriminatory power, confirming that the partition is governed chiefly by vegetation, built-up, thermal, luminosity and NO2/SO2 gradients. The decomposition therefore recovers a physically interpretable urbanization gradient along which peri-urban intensification is accompanied by a systematic escalation of environmental pressure (see Figure 11).
Figure 11.
Tensor clustering results and its correlation (Source: Authors).
5. Discussions
This research is the integration of multi-source remote sensing and atmospheric pollution data within a machine learning framework to characterize peri-urban transformation. Unlike previous studies that have relied on map overlays or variable-specific time-series analyses of indicators such as NDVI, NDBI and night-time light (NTL), this research organizes standardized indicators into a third-order tensor (grid cells × years × indicators), thereby preserving spatial, temporal and inter-indicator dependencies within a unified low-rank structure [31,32]. The resulting spatial factor loadings are subsequently used for clustering, enabling the identification of peri-urban typologies based on latent patterns of joint spatio-temporal variation rather than on individual indicators or single temporal snapshots. By integrating atmospheric pollutants with conventional land surface indicators, the proposed framework provides a more comprehensive understanding of urban-environment interactions in transitional peri-urban landscapes.
5.1. Peri-Urban Transformation of Pathum Thani
The findings indicate that Pathum Thani has undergone rapid peri-urban transformation driven largely by the metropolitan expansion of Bangkok. However, this process is spatially uneven, fragmented and highly dynamic rather than systematically planned. Annual NDVI-NDBI transitions reveal recurrent cycles of vegetation loss, urban expansion and re-greening, suggesting that peri-urban transformation is inherently non-linear. Although vegetation decline accompanied by increasing built-up intensity represents the dominant long-term trend, re-greening processes observed during 2020–2022 highlight the influence of agricultural cycles and the limitations of interpreting change from a single temporal snapshot. Spatially, urban intensification is concentrated along the southern fringe adjoining Bangkok, whereas transitional and recovery dynamics remain widespread in areas where urban, agricultural and ecological systems coexist. These spatial patterns are consistent with metropolitan spillover, transport accessibility and market-driven development. However, because this research is based on observational remote-sensing data, these findings should be interpreted as spatial associations rather than evidence of direct causal relationships. Similar fragmented patterns of peri-urban development have been widely documented across rapidly urbanizing regions in the Global South, where urban expansion often occurs alongside evolving or fragmented planning systems [6,7,33].
5.2. Urbanization Beyond Physical Expansion
Recent urban studies increasingly emphasize that the interpretation of Night-Time Light (NTL) data should be contextualized within regional development conditions, particularly in developing regions where infrastructure, economic activity, and settlement characteristics are highly heterogeneous. The findings support this perspective, as interpreting NTL dynamics in Pathum Thani required consideration of its transitional peri-urban character. Nevertheless, time-series NTL data proved effective in capturing long-term urban transformation and human activity dynamics. The more rapid increase in NTL relative to NDBI suggests that peri-urban transformation in Pathum Thani extends beyond physical land conversion to encompass intensifying economic activity, mobility interactions and socio-economic concentration. These findings reinforce the view that peri-urbanization is a complex process that extends beyond morphological expansion, generating diverse spatial configurations shaped by built-up development, accessibility, population dynamics and landscape change [7,8,34].
5.3. Spatial Typology of Peri-Urban Transformation
Tensor-based clustering partitioned Pathum Thani into five spatially structured classes distributed along a rural-to-urban gradient with the optimal number of clusters determined using the silhouette coefficient and Davies-Bouldin index. At the rural end, the agricultural/green cluster is characterized by high NDVI and evapotranspiration together with low built-up intensity, land surface temperature (LST), night-time light (NTL) and atmospheric pollutant levels, while the vegetated fringe cluster exhibits the weakest temporal dynamics. In contrast, sub-urban transition and intensifying urban clusters display progressively lower vegetation cover and higher NDBI, NTL, LST and pollutant concentrations, culminating in a compact urban-core cluster representing the most developed urban environment. The identified gradient is consistent with independent ground-truth land-cover data, ranging from predominantly vegetated landscapes in the rural cluster to highly built-up areas in the urban-core cluster, indicating that the multidimensional analysis captures meaningful patterns of peri-urban transformation rather than an arbitrary classification. Nevertheless, these clusters should be interpreted as diverse patterns of peri-urban transformation rather than discrete spatial entities because transitional areas often exhibit overlapping and heterogeneous characteristics.
Beyond representing differences in land-cover characteristics, the identified clusters reflect successive stages of peri-urban transformation associated with metropolitan expansion. The agricultural and vegetated fringe clusters represent landscapes where ecological and agricultural functions remain dominant but are increasingly influenced by nearby urban development. The sub-urban transition and intensifying urban clusters correspond to areas undergoing active land conversion, increasing accessibility and growing economic activity, reflecting the outward diffusion of metropolitan functions into formerly rural environments. In contrast, the compact urban-core cluster represents locations where urbanization has become more established, characterized by concentrated human activity, extensive built-up surfaces and comparatively higher environmental pressure. Collectively, these clusters illustrate that peri-urban transformation is neither spatially uniform nor temporally synchronized but progresses through multiple transitional stages shaped by accessibility, development intensity and environmental change. Consistent with recent integrated geospatial studies [25], these findings demonstrate the value of combining multiple spatial indicators to characterize urban dynamics. Previous studies primarily focused on urban delineation or individual indicators. In contrast, the proposed tensor-based framework integrates land-cover, urban activity and atmospheric environmental data. This approach identifies latent peri-urban transformation trajectories and supports differentiated planning and environmental management.
5.4. Environmental Pressure and Urban Growth
The indicators suggest that higher levels of urbanization are associated with greater environmental pressure. Along the rural-to-urban gradient, more urbanized clusters exhibit higher land surface temperature, night-time light intensity and atmospheric pollutant concentrations together with lower vegetation cover and evapotranspiration. This pattern is consistent with previous studies reporting associations between urban expansion, activity intensification and higher temperatures, vegetation loss and atmospheric pollution [11,35,36,37]. However, the present research identifies spatial co-occurrence rather than causal relationships. The concentration of environmental pressure along major transport corridors may be associated with automobile-oriented mobility patterns, although this relationship was not directly tested. Similarly, declining SO2 levels alongside increasing NO2, CH4 and aerosol concentrations may reflect broader technological, regulatory and emission trends, but attributing these changes to specific governance interventions is beyond the scope of this research. Overall, the findings reinforce the heterogeneous nature of urbanization, suggesting that environmental mitigation strategies should be tailored to different urban transformation patterns rather than relying on uniform policy approaches. This interpretation aligns with recent synthesis studies [38]. These studies highlight that climate-neutral urban planning depends on integrated strategies across land use, transportation, energy systems and greenhouse gas emissions. Such an approach is more effective than sector-specific interventions. The present findings further suggest that peri-urban transformation should be understood as a multidimensional process involving concurrent changes in urban form, human activity and environmental conditions, thereby supporting more integrated planning and environmental management approaches.
5.5. Limitation and Further Study
Several limitations should be acknowledged. First, the analysis relies primarily on remotely sensed and secondary datasets, which are subject to uncertainties related to spatial resolution, seasonal variability, sensor calibration and classification accuracy. Although the atmospheric pollutant datasets were obtained from operationally validated Sentinel-5P products, this research did not perform independent validation against ground-based monitoring observations because comparable measurements covering the study area and study period were unavailable. Previous studies have demonstrated that comparisons with surface observations are essential for evaluating retrieval uncertainty and systematic bias in satellite-derived atmospheric products [39]. Consequently, the atmospheric indicators used in this research should be interpreted as satellite-derived estimates of relative spatial and temporal variation rather than direct measurements of atmospheric pollutant concentrations. Second, although the tensor-based framework effectively captures spatio-temporal and environmental relationships, it does not explicitly account for socio-political and institutional drivers such as governance arrangements, land speculation and informal development processes. Third, the focus on Pathum Thani may limit the transferability of the findings to other peri-urban contexts, while important dimensions such as social inequality, accessibility and governance were not comprehensively examined. Future research should integrate quantitative and qualitative approaches, examine causal mechanisms and spatial spillover effects, and incorporate additional environmental indicators, particularly PM2.5. Although PM2.5 was not included because this research relied on the Sentinel-5P gaseous products (NO2, CO, SO2 and CH4) available in Google Earth Engine, it remains a major urban air pollutant with well-established impacts on environmental quality and public health. Future studies should therefore integrate PM2.5 from ground monitoring or validated satellite-derived products, together with greenhouse gas emissions and other air quality indicators, to provide a more comprehensive assessment of peri-urban transformation.
6. Conclusions
This research proposed an integrated framework combining multi-source remote-sensing indicators, atmospheric pollutant data, and tensor-based spatio-temporal analysis to examine peri-urban transformation in Pathum Thani province. The findings reveal that peri-urbanization is a heterogeneous and dynamic process characterized by fragmented urban expansion, persistent agricultural landscapes and non-linear land-cover transitions. The multidimensional spatio-temporal analysis, coupled with K-means clustering, classified these dynamics into five distinct spatial regimes along a rural-to-urban gradient (an agricultural/green class, a vegetated fringe, a sub-urban transition class, an intensifying urban class and a dense urban core). This classification is consistent with the independent ground-truth land-cover data. Environmental indicators generally increased with the level of urbanization, suggesting that different peri-urban typologies are associated with different environmental conditions. Overall, the findings reveal that integrating multi-source data with multidimensional analytical techniques provides an effective approach for characterizing the complex spatio-temporal dynamics of peri-urban transformation. As the findings indicate associations rather than causal relationships, future research should incorporate causal inference, spatial spillover analyses and additional environmental indicators, including PM2.5 and greenhouse gas emissions, to support planning strategies tailored to different peri-urban typologies and promote sustainable peri-urban management.
Author Contributions
Conceptualization, P.I.; methodology, P.I.; validation, S.C.; formal analysis, P.I., I.-S.R. and S.C.; investigation, S.C.; data curation, S.C.; writing—original draft, P.I., I.-S.R. and S.C.; writing—review and editing, P.I., S.C., W.G. and J.Z.; visualization, S.C.; supervision, P.I., W.G. and J.Z.; project administration, P.I.; funding acquisition, P.I. All authors have read and agreed to the published version of the manuscript.
Funding
This research received funding from Faculty of Architecture and Planning, Thammasat University Research Fund under Contract No. TDS 10/2567.
Institutional Review Board Statement
Not applicable.
Informed Consent Statement
Not applicable.
Data Availability Statement
No new data were created or analyzed in this study. Data sharing is not applicable to this article.
Conflicts of Interest
The authors declare no conflicts of interest.
References
- Etemadi, K.; Dadashpoor, H.; Novotný, J. Driving Factors of Urban Growth: A Systematic Review. Growth Change 2025, 56, e70090. [Google Scholar] [CrossRef] [Scilit]
- Li, M.; Cao, Y.; Dai, J.; Song, J.; Liang, M. A Comprehensive Review of Urban Expansion and Its Driving Factors. Land 2025, 14, 1534. [Google Scholar] [CrossRef] [Scilit]
- Almulhim, A.I. Emergence and evolution of urbanization research: A 50-year scientometric analysis. Geogr. Sustain. 2026, 7, 100456. [Google Scholar] [CrossRef] [Scilit]
- Lebrasseur, R. From green fingers and green ring to green mitten: Helsinki’s polycentric urbanization and its impact on green structure. Environ. Dev. Sustain. 2025, 22, 16717–16738. [Google Scholar] [CrossRef] [Scilit]
- Aguilar, A.G.; Flores, M.A.; Lara, L.F. Peri-Urbanization and Land Use Fragmentation in Mexico City: Informality, Environmental Deterioration, and Ineffective Urban Policy. Front. Sustain. Cities 2022, 4, 790474. [Google Scholar] [CrossRef] [Scilit]
- Salem, M.; Tsurusaki, N. Impacts of Rapid Urban Expansion on Peri-Urban Landscapes in the Global South: Insights from Landscape Metrics in Greater Cairo. Sustainability 2024, 16, 2316. [Google Scholar] [CrossRef] [Scilit]
- Haldar, S.; Chatterjee, U.; Bhattacharya, S.; Paul, S.; Bindajam, A.A.; Mallick, J.; Abdo, H.G. Peri-urban dynamics: Assessing expansion patterns and influencing factors. Ecol. Processes 2024, 13, 58. [Google Scholar] [CrossRef] [Scilit]
- Rizkiya, P.; Haikal, N.; Hasan, Z.; Aulia, F.; Gunawan, A.; Fuady, Z. The Urban Sprawl Typology and the Urban Growth Pattern of Peri-Urban Area in Aceh Besar Regency, Aceh. IOP Conf. Ser. Earth Environ. Sci. 2023, 1276, 012041. [Google Scholar] [CrossRef] [Scilit]
- United Nations. World Urbanization Prospects 2025: Summary of Results; UN DESA/POP/2025/TR/NO. 12; United Nations: New York, NY, USA, 2025.
- Colsaet, A. What Drives Land Take and Urban Land Expansion? A Systematic Review. Land Use Policy 2018, 79, 339–349. [Google Scholar] [CrossRef] [Scilit]
- Iamtrakul, P.; Padon, A.; Chayphong, S. Quantifying the Impact of Urban Growth on Urban Surface Heat Islands in the Bangkok Metropolitan Region, Thailand. Atmosphere 2024, 15, 100. [Google Scholar] [CrossRef] [Scilit]
- Zha, Y.; Gao, J.; Ni, S. Use of normalized difference built-up index in automatically mapping urban areas from TM imagery. Int. J. Remote Sens. 2003, 24, 583–594. [Google Scholar] [CrossRef] [Scilit]
- Singh, S.; Jain, K.; Shukla, A. GIS Integration of Land Cover with Night-Time Lights for Spatiotemporal Evaluation of Urban Expansion. Int. Arch. Photogramm. Remote Sens. Spat. Inf. Sci. 2023, 48, 1561–1568. [Google Scholar] [CrossRef] [Scilit]
- Wilson, D.D.; Tefera, G.W.; Ray, R.L. Application of Google Earth Engine to Monitor Greenhouse Gases: A Review. Data 2025, 10, 8. [Google Scholar] [CrossRef] [Scilit]
- Pouri, N.; Karimi, B.; Kolivand, A.; Mirhoseini, S.H. Ambient dust pollution with all-cause, cardiovascular and respiratory mortality: A systematic review and meta-analysis. Sci. Total Environ. 2024, 912, 168945. [Google Scholar] [CrossRef] [Scilit] [PubMed]
- World Bank. Climate Change Knowledge Portal: Greenhouse Gas Emissions Overview; World Bank Group: Washington, DC, USA, 2021. [Google Scholar]
- Lv, Y.; Yang, J.; Xu, J.; Guan, X.; Zhang, J. High-dimensional Urban Dynamic Patterns Perception under the Perspective of Human Activity Semantics and Spatiotemporal Coupling. Sustain. Cities Soc. 2025, 121, 106192. [Google Scholar] [CrossRef] [Scilit]
- Shi, S.; Wang, L.; Wang, X. Uncovering the Spatiotemporal Motif Patterns in Urban Mobility Networks by Non-negative Tensor Decomposition. Phys. A Stat. Mech. Its Appl. 2022, 606, 128142. [Google Scholar] [CrossRef] [Scilit]
- Cai, L.; Xu, J.; Liu, J.; Ma, T.; Pei, T.; Zhou, C. Sensing Multiple Semantics of Urban Space from Crowdsourcing Positioning Data. Cities 2019, 93, 31–42. [Google Scholar] [CrossRef] [Scilit]
- Tang, J.; Wang, X.; Zong, F.; Hu, Z. Uncovering Spatio-temporal Travel Patterns Using a Tensor-based Model from Metro Smart Card Data in Shenzhen, China. Sustainability 2020, 12, 1475. [Google Scholar] [CrossRef] [Scilit]
- Han, D.; Fan, D.; Zhang, J.; Zhao, X.; Wang, H. Investigating the Spatiotemporal Response of Urban Functions to Fine-Grained Resident Activities with a Novel Analytical Framework and Baidu Heatmap. Land 2025, 14, 2235. [Google Scholar] [CrossRef] [Scilit]
- Almquist, Z.W.; Nguyen, T.D.; Sorensen, M.; Fu, X.; Sidiropoulos, N.D. Uncovering migration systems through spatio-temporal tensor co-clustering. Sci. Rep. 2024, 14, 26861. [Google Scholar] [CrossRef] [Scilit] [PubMed]
- Zhao, Z.; Kan, Z.; Kwan, M.P.; Tang, L. Identifying urban spatial clusters via flow dynamics: A coupled tensor-based method. Int. J. Digit. Earth 2025, 18, 2525382. [Google Scholar] [CrossRef] [Scilit]
- Woltjer, J. A global review on peri-urban development and planning. J. Reg. City Plan. 2014, 25, 1–16. [Google Scholar]
- Fang, C.; Zhou, L.; Gu, X.; Liu, X.; Werner, M. A data driven approach to urban area delineation using multi source geospatial data. Sci. Rep. 2025, 15, 8708. [Google Scholar] [CrossRef] [Scilit] [PubMed]
- Ramachandra, T.V.; Bharath, S.; Bharath, H.A. Peri-urban to urban landscape patterns elucidation through spatial metrics. Int. J. Eng. Res. Dev. 2012, 2, 58–81. [Google Scholar]
- Shaw, A. Peri-urban interface of Indian cities: Growth, governance and local initiatives. Econ. Political Wkly. 2005, 40, 129–136. [Google Scholar]
- Hong, T.; Huang, X.; Lv, Q.; Zhao, S.; Wang, Z.; Yang, Y. Thermal Mitigation in Coastal Cities: Marine and Urban Morphology Effects on Land Surface Temperature in Xiamen. Buildings 2025, 15, 1170. [Google Scholar] [CrossRef] [Scilit]
- Kikon, N.; Kumar, D.; Ahmed, S.A. Quantitative assessment of land surface temperature and vegetation indices on a kilometer grid scale. Environ. Sci. Pollut. Res. 2023, 30, 107236–107258. [Google Scholar] [CrossRef] [Scilit] [PubMed]
- Kremer, P.; Weaver, D.; Stewart, J.D. Sensitivity of urban structure–temperature relationships to grid parameterization. Ecol. Inform. 2026, 93, 103587. [Google Scholar] [CrossRef] [Scilit]
- Kolda, T.G.; Bader, B.W. Tensor Decompositions and Applications. SIAM Rev. 2009, 51, 455–500. [Google Scholar] [CrossRef] [Scilit]
- Sun, L.; Axhausen, K.W. Understanding urban mobility patterns with a probabilistic tensor factorization framework. Transp. Res. Part B Methodol. 2016, 91, 511–524. [Google Scholar] [CrossRef] [Scilit]
- Gupta, A.K.; Singh, S.; Wajih, S.A.; Mani, N.; Singh, A.K. Urban Resilience and Sustainability Through Peri-Urban Ecosystems: Integrating Climate Change Adaptation and Disaster Risk Reduction; Gorakhpur Environmental Action Group (GEAG): Gorakhpur, India; ICLEI South Asia: New Delhi, India; ACCCRN.NET: Dhaka, Bangladesh; UNICEF: New York, NY, USA; School of Planning and Architecture New Delhi: New Delhi, India; Rockefeller Foundation: New York, NY, USA, 2017. [Google Scholar]
- Wu, B.; Huang, H.; Wang, Y.; Shi, S.; Wu, J.; Yu, B. Global spatial patterns between nighttime light intensity and urban building morphology. Int. J. Appl. Earth Obs. Geoinf. 2023, 124, 103495. [Google Scholar] [CrossRef] [Scilit]
- Güneralp, B.; Reba, M.; Hales, B.U.; Wentz, E.A.; Seto, K.C. Trends in urban land expansion, density, and land transitions from 1970 to 2010: A global synthesis. Environ. Res. Lett. 2020, 15, 044015. [Google Scholar] [CrossRef] [Scilit]
- Wang, W.; Luan, W.; Jing, H.; Zhu, J.; Zhang, K.; Ma, Q.; Zhang, S.; Liang, X. Quantitative Assessment of Urban Expansion Impact on Vegetation in the Lanzhou–Xining Urban Agglomeration. Appl. Sci. 2024, 14, 8615. [Google Scholar] [CrossRef] [Scilit]
- Anande, D.M.; Park, M.-S. Impacts of projected urban expansion on rainfall and temperature during rainy season in the Middle-Eastern Region in Tanzania. Atmosphere 2021, 12, 1234. [Google Scholar] [CrossRef] [Scilit]
- Giacomelli, M.; Görgün, E.K.; Salata, S.; Ronchi, S.; Bernardini, C.; Máñez Costa, M.; Arcidiacono, A.; Concilio, G. Climate neutrality and urban planning: A state of the art from literature and the European cities. Sustain. Cities Soc. 2025, 130, 106570. [Google Scholar] [CrossRef] [Scilit]
- Constantin, D.-E.; Merlaud, A.; Van Roozendael, M.; Voiculescu, M.; Fayt, C.; Hendrick, F.; Pinardi, G.; Georgescu, L. Measurements of tropospheric NO2 in Romania using a zenith-sky mobile DOAS system and comparisons with satellite observations. Sensors 2013, 13, 3922–3940. [Google Scholar] [CrossRef] [Scilit] [PubMed]


Disclaimer/Publisher’s Note: The statements, opinions and data contained in all publications are solely those of the individual author(s) and contributor(s) and not of MDPI and/or the editor(s). MDPI and/or the editor(s) disclaim responsibility for any injury to people or property resulting from any ideas, methods, instructions or products referred to in the content. |
© 2026 by the authors. Licensee MDPI, Basel, Switzerland. This article is an open access article distributed under the terms and conditions of the Creative Commons Attribution (CC BY) license.