


Abstract
The rapid expansion of high-speed railway networks has increased the operational energy demand and indoor overheating risk of large-scale, high-volume railway station buildings. Natural ventilation is a climate-responsive passive strategy that can improve indoor environmental quality and reduce reliance on mechanical cooling. However, its contribution to the operational sustainability of large transportation buildings remains insufficiently quantified, particularly in hot-summer and cold-winter regions. This study investigates a seasonally adaptive window-opening strategy for Chengdu Station, with particular attention to major functional spaces such as waiting halls and commercial areas. A DesignBuilder model was used to simulate six ventilation scenarios, ranging from doors-only operation to fully open doors and windows. The effects of different window-opening ratios on hourly indoor temperature, relative humidity, adaptive thermal comfort, and annual building energy use were systematically evaluated. The simulation approach was further assessed against field measurements obtained from a comparable large railway station. The results reveal a pronounced nonlinear and seasonal response to the window-opening ratio. In winter, maintaining a very low opening ratio or keeping only the entrance doors open limits unnecessary heat loss. During the transitional seasons, opening ratios of 40–60% are sufficient to remove residual indoor heat while maintaining acceptable thermal conditions. In summer, the marginal improvement in ventilation performance becomes limited when the side-window opening ratio exceeds approximately 80%; therefore, an opening ratio of 80% was selected as a practical operating threshold rather than an absolute thermal optimum. Based on these seasonal characteristics, a month-by-month window-opening strategy was developed. Compared with the doors-only baseline, the proposed strategy reduced the annual high-temperature-hour ratio from 33.4% to 16.36%, corresponding to a decrease of 17.04 percentage points and a relative reduction of approximately 51.0%. Total annual building energy use decreased from 32,238.8 MWh to 25,923.8 MWh, representing an energy saving of 19.6%. These findings demonstrate that seasonally adaptive natural ventilation can simultaneously reduce overheating risk and operational energy demand while maintaining acceptable indoor thermal conditions. The proposed strategy provides a quantitative basis for the sustainable, energy-efficient, and intelligently managed operation of large-space railway stations in hot-summer and cold-winter regions.
1. Introduction
1.1. Research Background
With the continuous advancement of China’s high-speed railway technology and the deepening implementation of the Belt and Road Initiative, railways, particularly high-speed railways, have become a prominent component of the national comprehensive transportation system. Railway transport, characterized by safety, comfort, and convenience, has gradually become the primary mode of travel for residents.
According to the Medium- and Long-Term Railway Network Plan issued by relevant national authorities in 2016 [1], the total railway network length in China is expected to reach 150,000 km by 2020, including approximately 38,000 km of high-speed rail, covering more than 80% of major cities. By 2025, the railway network is projected to expand to about 175,000 km, while the high-speed railway length remains around 38,000 km, with a progressively optimized network structure. Looking toward 2030, the railway network will achieve broader coverage, essentially realizing national interconnectivity, multi-corridor regional accessibility, and service coverage for most counties.
The rapid expansion of total railway mileage inevitably requires a corresponding increase in railway station infrastructure [2]. Based on this context, this study takes Chengdu Station as the research object to investigate the effects of different window-opening strategies under natural ventilation conditions on indoor thermal environment and building energy consumption, and to reveal the thermal response mechanism and energy-saving potential of large-space buildings under natural ventilation.
From the perspective of sustainable transportation infrastructure, the environmental performance of railway stations should not be assessed solely on the basis of maximum ventilation capacity. A sustainable operational strategy should reduce dependence on mechanical conditioning, avoid unnecessary heating and cooling losses, and maintain acceptable indoor thermal conditions for passengers. Therefore, this study evaluates seasonal window control as a climate-responsive operational measure integrating energy efficiency, thermal comfort, and practical operational adaptability.
1.2. Research Status
Natural ventilation, as a fundamental and comfortable approach for regulating indoor thermal and humidity conditions, has been widely applied in residential spaces since ancient times over two thousand years ago to improve indoor environmental quality. This airflow-based environmental regulation method represents the most basic and intuitive form of natural ventilation. With the continuous advancement of modern building environmental research, related theories and methods have gradually developed worldwide, leading to a substantial body of literature.
In the field of natural ventilation potential assessment, Wang Yi proposed the concept of effective ventilation hours to characterize the applicability of natural ventilation under specific climatic conditions and conducted comparative analyses for Dalian, Beijing, and Xi’an [3]. Wei Jingshu performed dynamic simulations of indoor environments under combined wind and thermal pressure using EnergyPlus and its COMIS module, and introduced two evaluation indices: natural temperature comfort hours and natural comfort hours [4]. Yang Yulan et al. proposed the relative natural ventilation cooling potential (RNVCP) based on indoor baseline temperature under different ventilation strategies, and conducted case studies on office buildings using Fluent and DeST [5]. Zhu Xiaoqing et al. proposed a natural ventilation potential assessment and optimization framework for the schematic design stage, based on the NVCE-AFN model and genetic algorithm optimization, systematically evaluating regional differences and key influencing factors of natural ventilation performance [6]. Aziz et al. investigated the effects of increasing the opening ratio from 10% to 60% combined with traditional passive design elements, such as lattice screens and ventilation blocks, on the natural ventilation performance of the Old Lingji Mosque in Malaysia. The results demonstrated that increasing the opening ratio and integrating these passive ventilation components could significantly improve ventilation performance and enhance occupants’ thermal comfort [7].
Regarding natural ventilation and thermal comfort, particularly in railway station buildings, related studies have become increasingly extensive. Yang Jingzhu conducted field questionnaire surveys in the spring at Chengdu North Railway Station waiting hall, analyzing passengers’ thermal sensation under natural ventilation conditions and establishing a thermal adaptation model for waiting spaces [8]. Xu Zilong conducted field measurements at Xi’an Railway Station and determined summer neutral temperature and an 80% acceptable comfort range, which was found to be wider than that specified in the ASHRAE standard [9]. Zhang Menglong used FLUENT simulations combined with the PMV-PPD thermal comfort model to analyze the effects of different temperature and wind speed conditions on indoor temperature fields and human thermal comfort, indicating that wind speed has a stronger influence than temperature within a certain range [10]. Cao Jinyuan et al. applied the PMV-PPD index together with CFD simulations and field measurements to investigate indoor thermal environment characteristics and spatial non-uniformity in a typical classroom in southern Xinjiang, providing a reference for thermal comfort evaluation and optimization in cold and arid regions [11]. Ragab et al. investigated the impacts of window design parameters and ventilation strategies on indoor environmental conditions in educational buildings located in arid climates. By combining field measurements with Design Builder-based simulations, they evaluated the effects of different window-to-wall ratios, window configurations, and ventilation modes on indoor air quality and thermal comfort, providing valuable insights into passive ventilation design for buildings in arid regions [12]. Rabani et al. studied hybrid ventilation systems in nearly zero-energy buildings under cold climate conditions. Using dynamic simulation approaches, they assessed the impacts of different ventilation control strategies on building energy efficiency, thermal comfort, and future climate adaptability [13].
In terms of ventilation cooling and energy-saving applications, Ma Jiangyan and Qiao Xuanming conducted climate zoning of northern China based on thermal comfort requirements and simulated natural ventilation potential of different railway station types using EnergyPlus, proposing region-specific energy-saving cooling strategies and comparing them with conventional all-air conditioning systems [14,15]. Wang Xinlin et al. used Visual ESP-r to simulate annual indoor temperature variations in major functional spaces of a railway station in Nanjing under natural ventilation, revealing the influence of the building envelope on ventilation utilization potential [16]. Chen Yu applied CFD methods to optimize natural ventilation strategies in Lijiang Railway Station and proposed an electric window control strategy to improve outdoor climate utilization and reduce air-conditioning loads [17]. Xin et al. conducted a comprehensive review of predictive control strategies for HVAC systems, systematically comparing the recent developments and applications of model predictive control (MPC) and model-free predictive control (MFPC) approaches in building energy optimization, thermal comfort regulation, and dynamic operational control [18]. Ho et al. proposed an innovative sustainable roof system integrating lightweight foam concrete, hollow concrete slabs, cooling coatings, and solar-driven active reflective insulation technologies. The impacts of this system on building thermal performance and cooling energy consumption were evaluated through experimental investigations and simulation analyses [19]. Hernandez et al. investigated the natural ventilation performance of wind catchers using computational fluid dynamics (CFD) methods. The results indicated that optimizing the arrangement of air inlets and outlets could improve ventilation efficiency and enhance thermal comfort [20].
However, most existing studies have focused on residential buildings and conventional public buildings, while the natural ventilation characteristics of large-scale railway stations with high occupant density and complex spatial configurations remain insufficiently investigated.
1.3. Research Content
This study focuses on Chengdu Station, a representative large-scale railway passenger hub located in a hot-summer and cold-winter climate region. It investigates indoor thermal environment regulation and building energy optimization under natural ventilation conditions. The research methodology consists of the following five steps:
- (1) Building model development and basic parameter settings.
Based on the actual engineering data of Chengdu Station, a three-dimensional building model was established using the DesignBuilder platform. In accordance with relevant standards such as the Design Standard for Energy Efficiency of Public Buildings, the thermal properties of building envelopes, occupant activity loads, lighting loads, and operational boundary conditions were reasonably defined to provide a reliable basis for subsequent simulations.
- (2) Natural ventilation scenario design and simulation analysis.
Six representative window-opening scenarios were designed to simulate the variation in indoor airflow characteristics and ventilation performance under different ventilation intensities. The influence mechanism of window-opening ratios on natural ventilation capacity was analyzed.
- (3) Indoor thermal environment and thermal comfort assessment.
Based on adaptive thermal comfort theory, hourly temperature and humidity data were used to evaluate indoor thermal conditions under different scenarios. The distribution characteristics of overheating hours and comfort hours were statistically analyzed to assess the improvement effect of natural ventilation on indoor thermal comfort and its seasonal variability.
- (4) Building energy consumption response analysis.
Under unified operational boundary conditions, annual building energy consumption under different window-opening scenarios and optimization strategies was calculated and compared. The influence of natural ventilation on air-conditioning loads and overall building energy use was investigated.
- (5) Development of natural ventilation optimization strategy.
By integrating ventilation performance, thermal comfort level, and energy consumption, a multi-objective evaluation framework was established. A monthly dynamic window-opening optimization strategy suitable for large-scale railway stations in Chengdu was proposed, providing a reference for passive energy-saving design and operational optimization of similar transportation buildings.
2. Theoretical Background
2.1. Wind-Driven Natural Ventilation
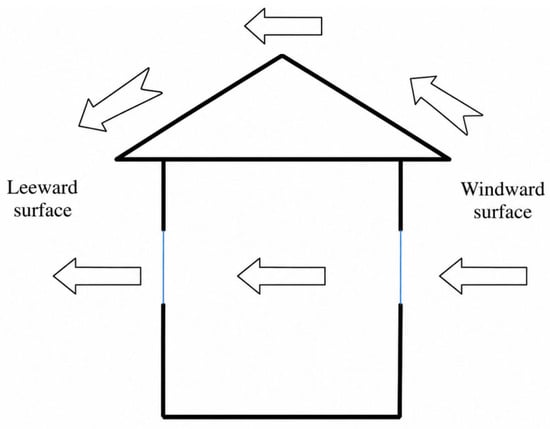
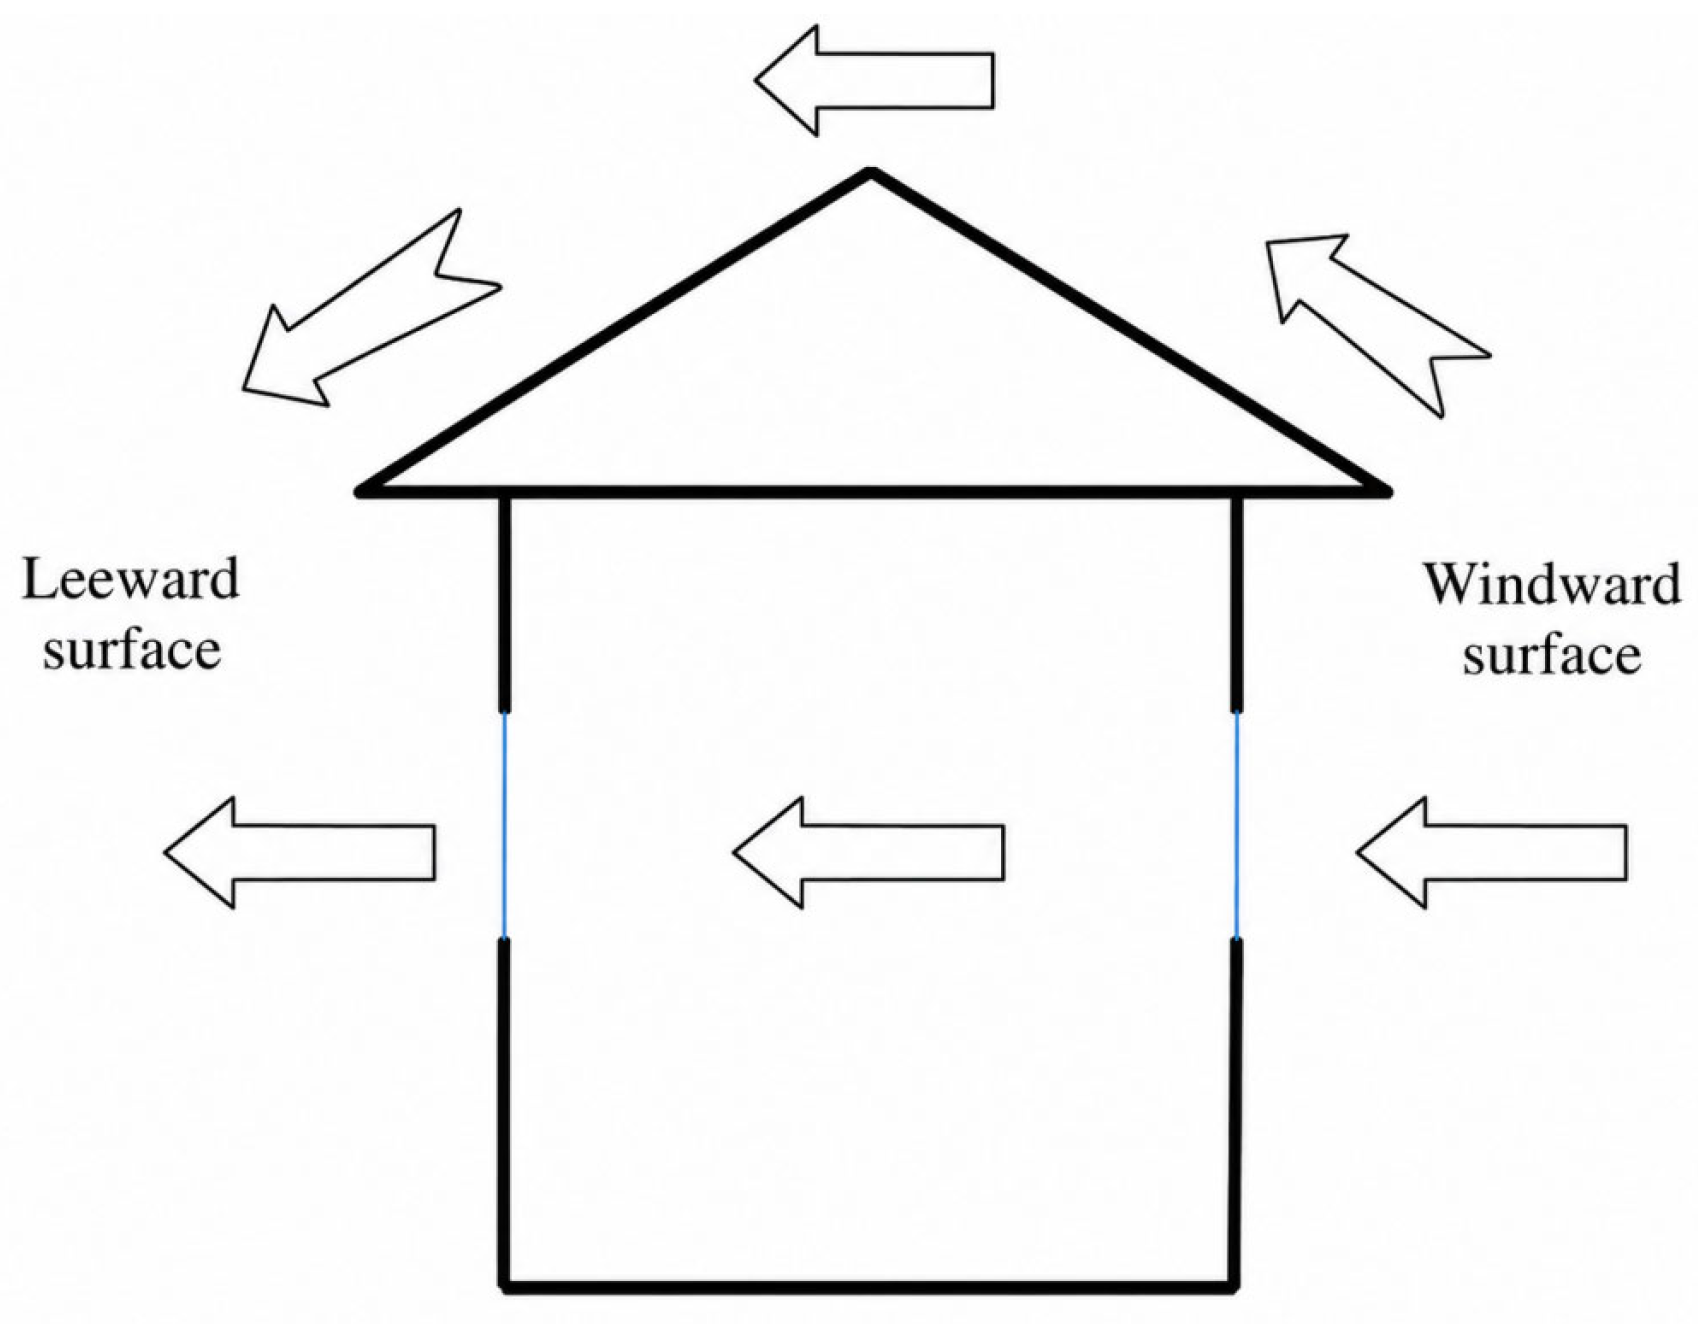
Wind pressure refers to the variation in static pressure distribution around a building caused by airflow obstruction, resulting in changes in surface pressure on the building envelope. When incident wind encounters a building, flow separation occurs at the windward side, while airflow is redirected around the structure, forming local turbulence zones on the lateral and leeward sides. Consequently, pressure differences are generated across different building façades.
When openings exist in the building envelope, these pressure differences drive air exchange between the indoor and outdoor environments, as illustrated in Figure 1. This process is defined as wind-driven natural ventilation.
Figure 1.
Schematic representation of windward and leeward surfaces of a building under external wind conditions. The arrows indicate the approaching wind direction, while the blue lines denote ventilation openings through which airflow enters or exits the building.
The pressure difference under wind-driven conditions can be expressed as [21]
where and represent the wind pressure coefficients at the inlet and outlet, respectively, is the wind speed, and is the outdoor air density.
Wind-driven natural ventilation mainly relies on pressure differences across the building envelope to achieve air exchange. A favorable natural ventilation performance typically requires appropriate building layout, form control, orientation design, and optimized opening location and size to enhance airflow organization capability. In terms of application conditions, a certain outdoor wind environment is generally required, with an average wind speed not lower than approximately 3 m/s.
At the urban planning scale, building layouts should be designed according to local climatic characteristics and prevailing summer wind directions, so as to achieve the strategy of “capturing summer winds while blocking winter winds.” At the building design scale, spatial dimensions should be properly controlled, and operable window areas should be appropriately increased to promote cross-ventilation. For complex spatial configurations, airflow paths can be optimized by aligning ventilation openings and reducing internal flow resistance, thereby enhancing convective air exchange efficiency. In addition, different opening configurations can guide airflow direction, further improving indoor ventilation distribution patterns. Natural ventilation may generally be induced by both wind pressure and indoor–outdoor air-density differences. However, the present study does not separately investigate a dedicated thermal-buoyancy-driven ventilation mode. Roof skylights remained closed in all simulation scenarios, and the analysis focuses on the integrated airflow response associated with different side-window opening ratios. Therefore, the detailed theoretical formulation of buoyancy-driven ventilation is not presented.
2.2. Thermal Comfort Evaluation Theory
At present, the most widely accepted thermal comfort evaluation indices are the PMV–PPD model proposed by Fanger. However, previous studies have shown that the PMV–PPD model exhibits significant deviations and limited accuracy when applied to thermal comfort assessment in naturally ventilated buildings [22]. Therefore, the commonly referenced thermal comfort standards for natural ventilation conditions mainly include the ASHRAE Standard and European standards [23,24].
(1) ASHRAE Standard
ASHRAE Standard 55-2004 [25] recommends the adaptive comfort standard for evaluating thermal comfort under naturally ventilated conditions. This standard is derived from the research of Richard et al. and subsequently optimized. The standard indicates that, within a certain range of outdoor temperature, the indoor comfort temperature is linearly correlated with the outdoor temperature (as shown in Figure 2), and the calculation formula is as follows:
t0—the operative temperature at thermal neutrality;
ta,out—the monthly mean outdoor temperature.
Figure 2.
ASHRAE Standard 55-2004: acceptable range of comfort temperature for non-air-conditioned spaces.
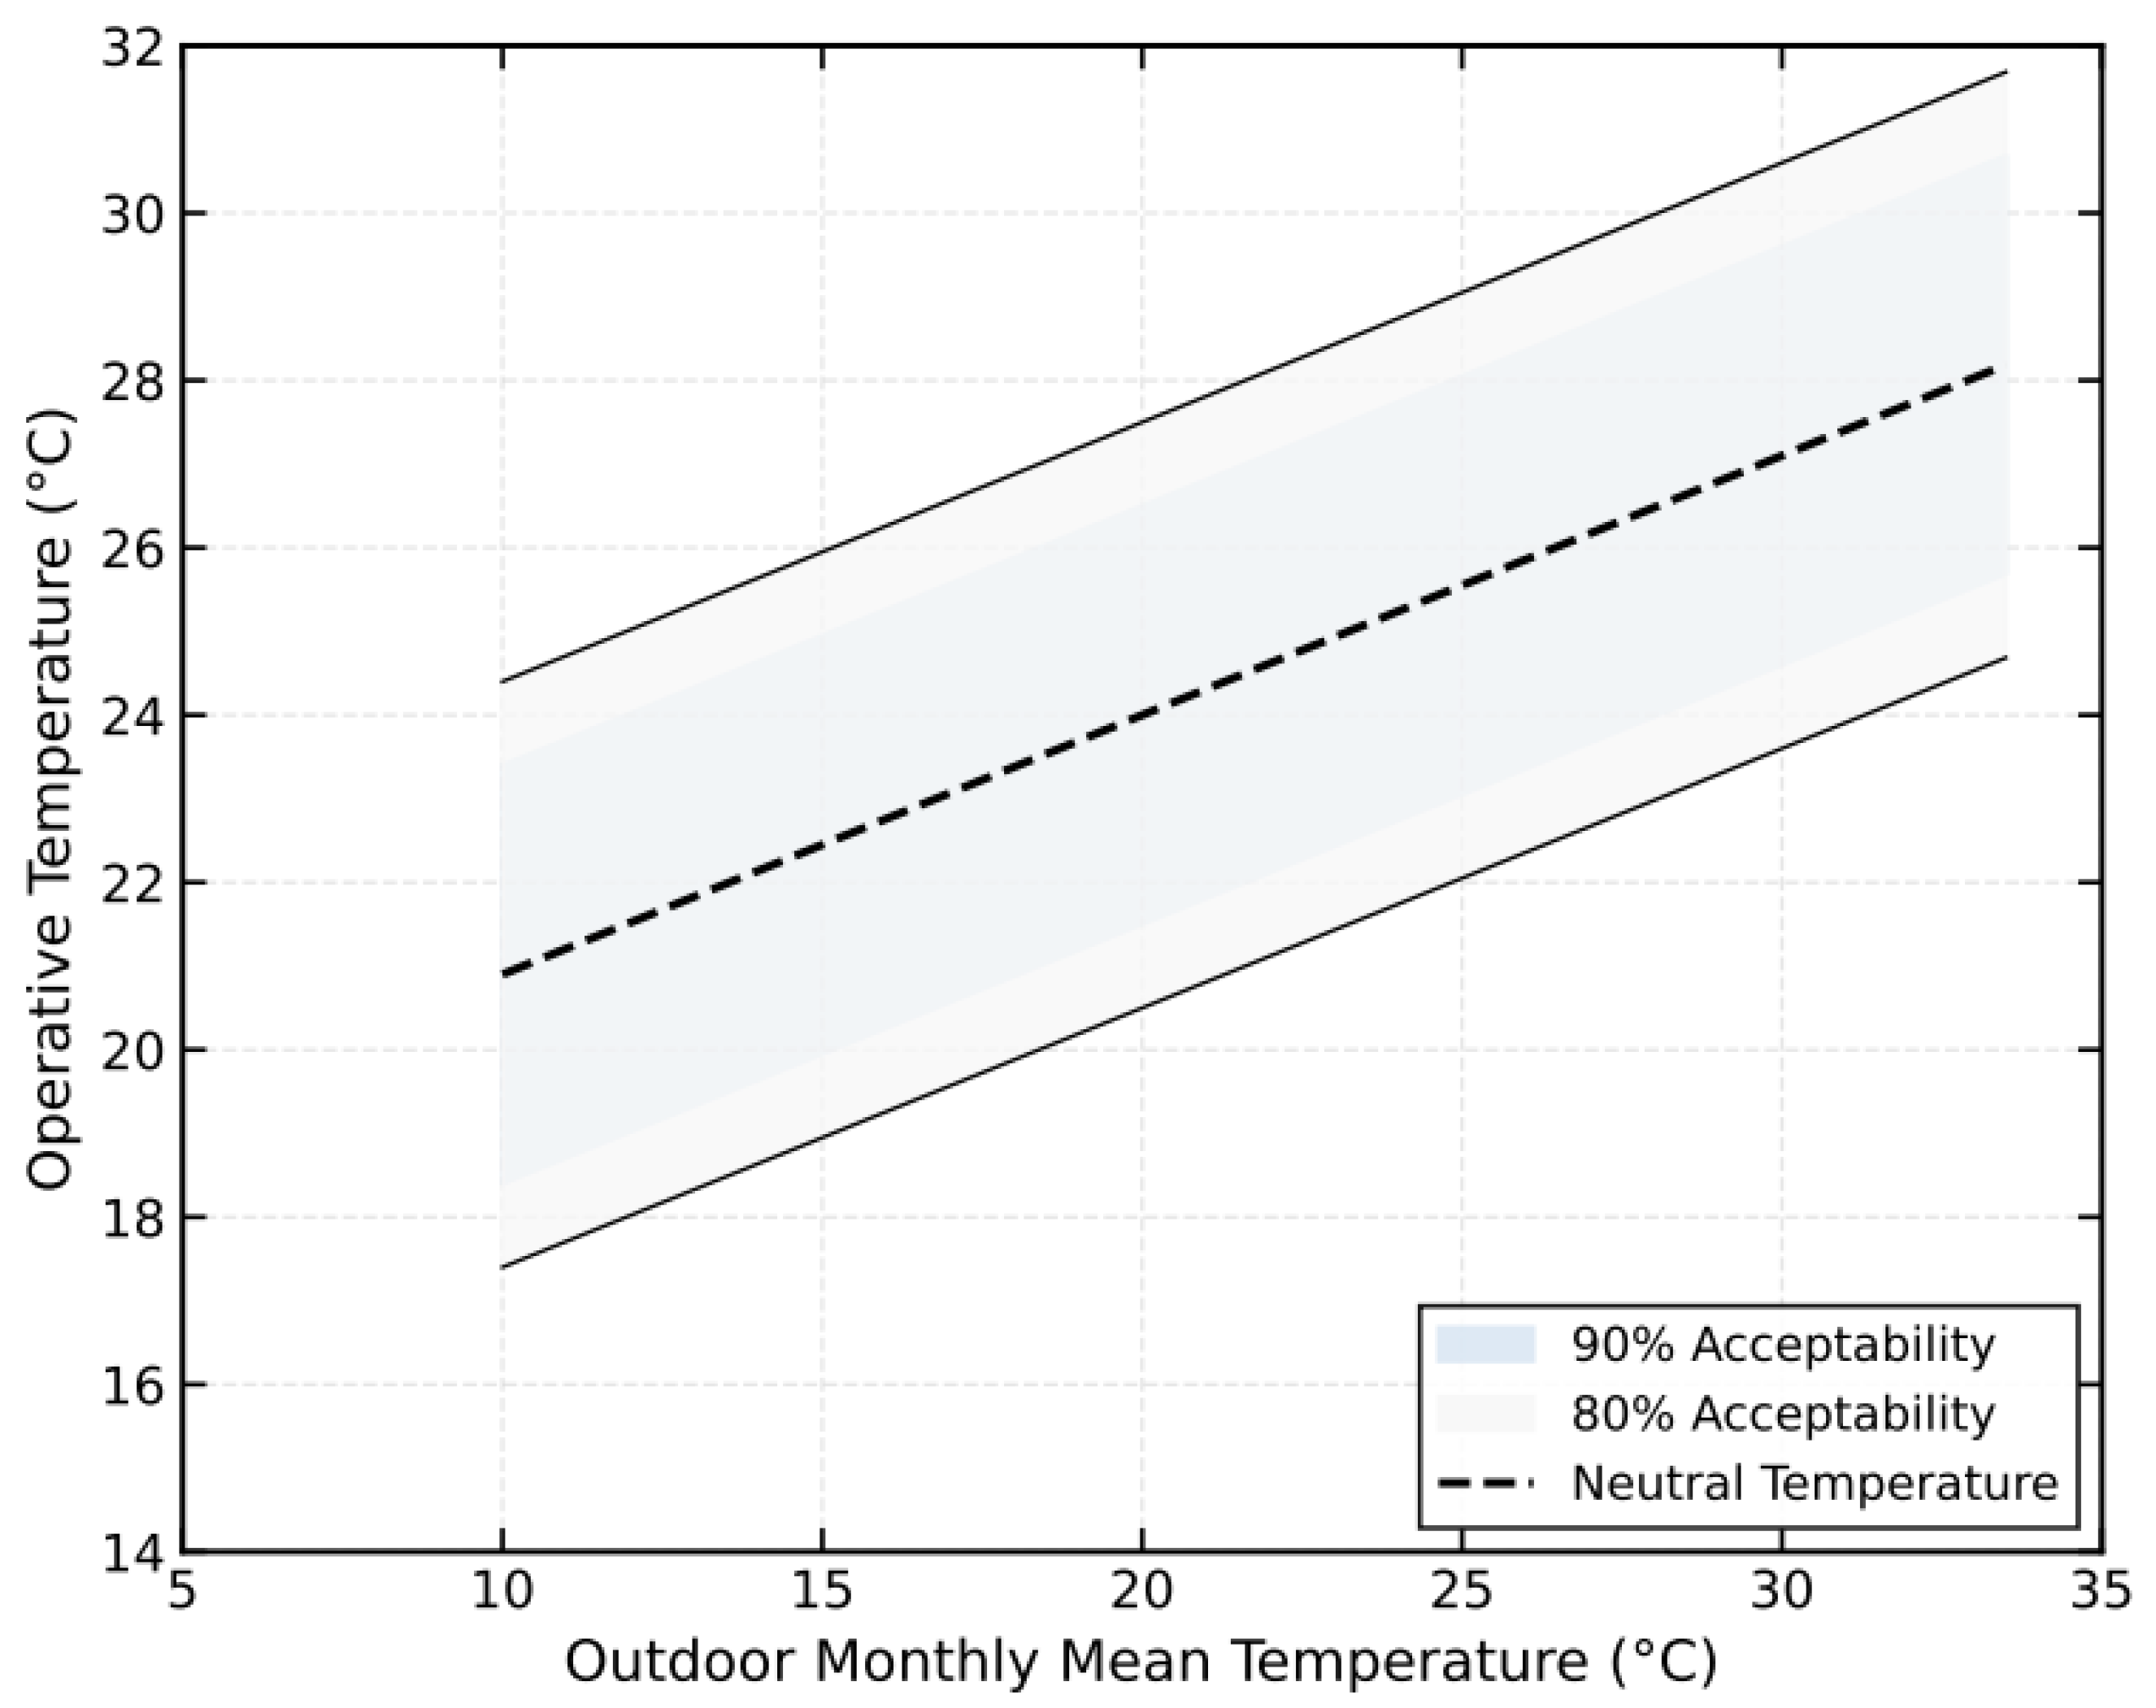
The comfort zone corresponding to 90% acceptability is , and that corresponding to 80% acceptability is .
(2) European Standard
The standard EN 15251:2007(E) [26], established by the European Committee for Standardization (CEN), proposes corresponding comfort criteria for non-air-conditioned buildings. In this standard, the indoor comfort temperature is linearly correlated with the outdoor temperature, which is similar to the ASHRAE Standard. The calculation formula is as follows:
Upper and lower limits of Category I comfort:
Upper and lower limits of Category II comfort:
Upper and lower limits of Category III comfort:
T0—the limit of indoor operative temperature (varying on a daily basis);
Ta,out—the daily running mean outdoor temperature.
In this standard, Category I corresponds to 90% acceptability, Category II to 80% acceptability, and Category III to 65% acceptability.
It should be noted that EN 15251:2007 is also based on the adaptive thermal comfort model and is applicable to mixed-mode buildings with natural ventilation and mechanical ventilation.
(3) Determination of thermal comfort criteria
Considering the influence of the outdoor environment on occupants’ perception under natural ventilation conditions for railway passenger stations located in different climate zones, and given that the European Standard is more aligned with actual domestic conditions, this study adopts the upper limit of comfort temperature from the European Standard as the indoor comfort temperature upper limit for railway passenger stations under natural ventilation. Furthermore, considering that occupants in railway passenger stations—the object of this study—are short-stay, it is considered appropriate to relax the European Standard appropriately. Accordingly, the indoor comfort temperature upper limits under natural ventilation for large railway passenger stations and for small- and medium-sized railway passenger stations refer to the criteria corresponding to 80% and 65% acceptability, respectively, for non-air-conditioned conditions in the European Standard EN 15251:2007(E).
The lower limits of comfort temperature under non-air-conditioned conditions, calculated based on the ASHRAE Standard and the European Standard, are considerably higher than the lower limit of winter air-conditioning comfort temperature for short-stay areas specified in GB 50276-2012. Considering practical operability and energy saving, this study adopts 16 °C—the lower limit of winter air-conditioning comfort temperature for short-stay areas in this code—as the lower limit of indoor thermal comfort temperature under non-air-conditioned conditions.
In addition to temperature, humidity is also an important factor affecting human thermal comfort. The European standard mainly investigates the thermal comfort range from the perspective of temperature. In order to improve the predictive accuracy of adaptive thermal comfort models, it is necessary to consider the influence of humidity on human thermal comfort.
Jiyun Zhe et al. from Tianjin University conducted an experimental study involving 200 subjects from northern and southern China. The results indicated that when indoor temperature exceeds 28 °C and relative humidity exceeds 70%, occupants begin to feel discomfort, and this discomfort becomes more pronounced with increasing humidity. When relative humidity exceeds 80%, the discomfort is significantly evident. In addition, people from southern China show higher tolerance to hot and humid environments compared to those from northern China [27].
Similarly, Chen Huimei et al. from South China University of Technology carried out experiments on 501 students in Guangzhou and obtained comparable results, suggesting that the upper limit of acceptable humidity in humid-hot regions is approximately 78% [28]. To avoid additional dehumidification load caused by natural ventilation, Zhang Mingrui from Tsinghua University set the upper limit for natural ventilation conditions at an outdoor air state of 26 °C and 80% relative humidity [29].
Based on the above studies, this paper considers that when indoor thermal-humidity conditions reach or exceed a temperature of 28 °C and relative humidity of 80%, the indoor environment is in a state of discomfort, and under such conditions, outdoor air is no longer suitable for natural ventilation cooling potential.
3. Verification Method and Simulation Experiment
3.1. Project Overview
Chengdu Station is located in the core railway corridor of Chengdu, adjacent to the urban central area, and is well connected to major urban arterial roads and the rail transit system, providing superior transportation accessibility.
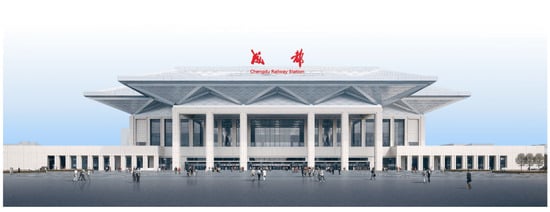
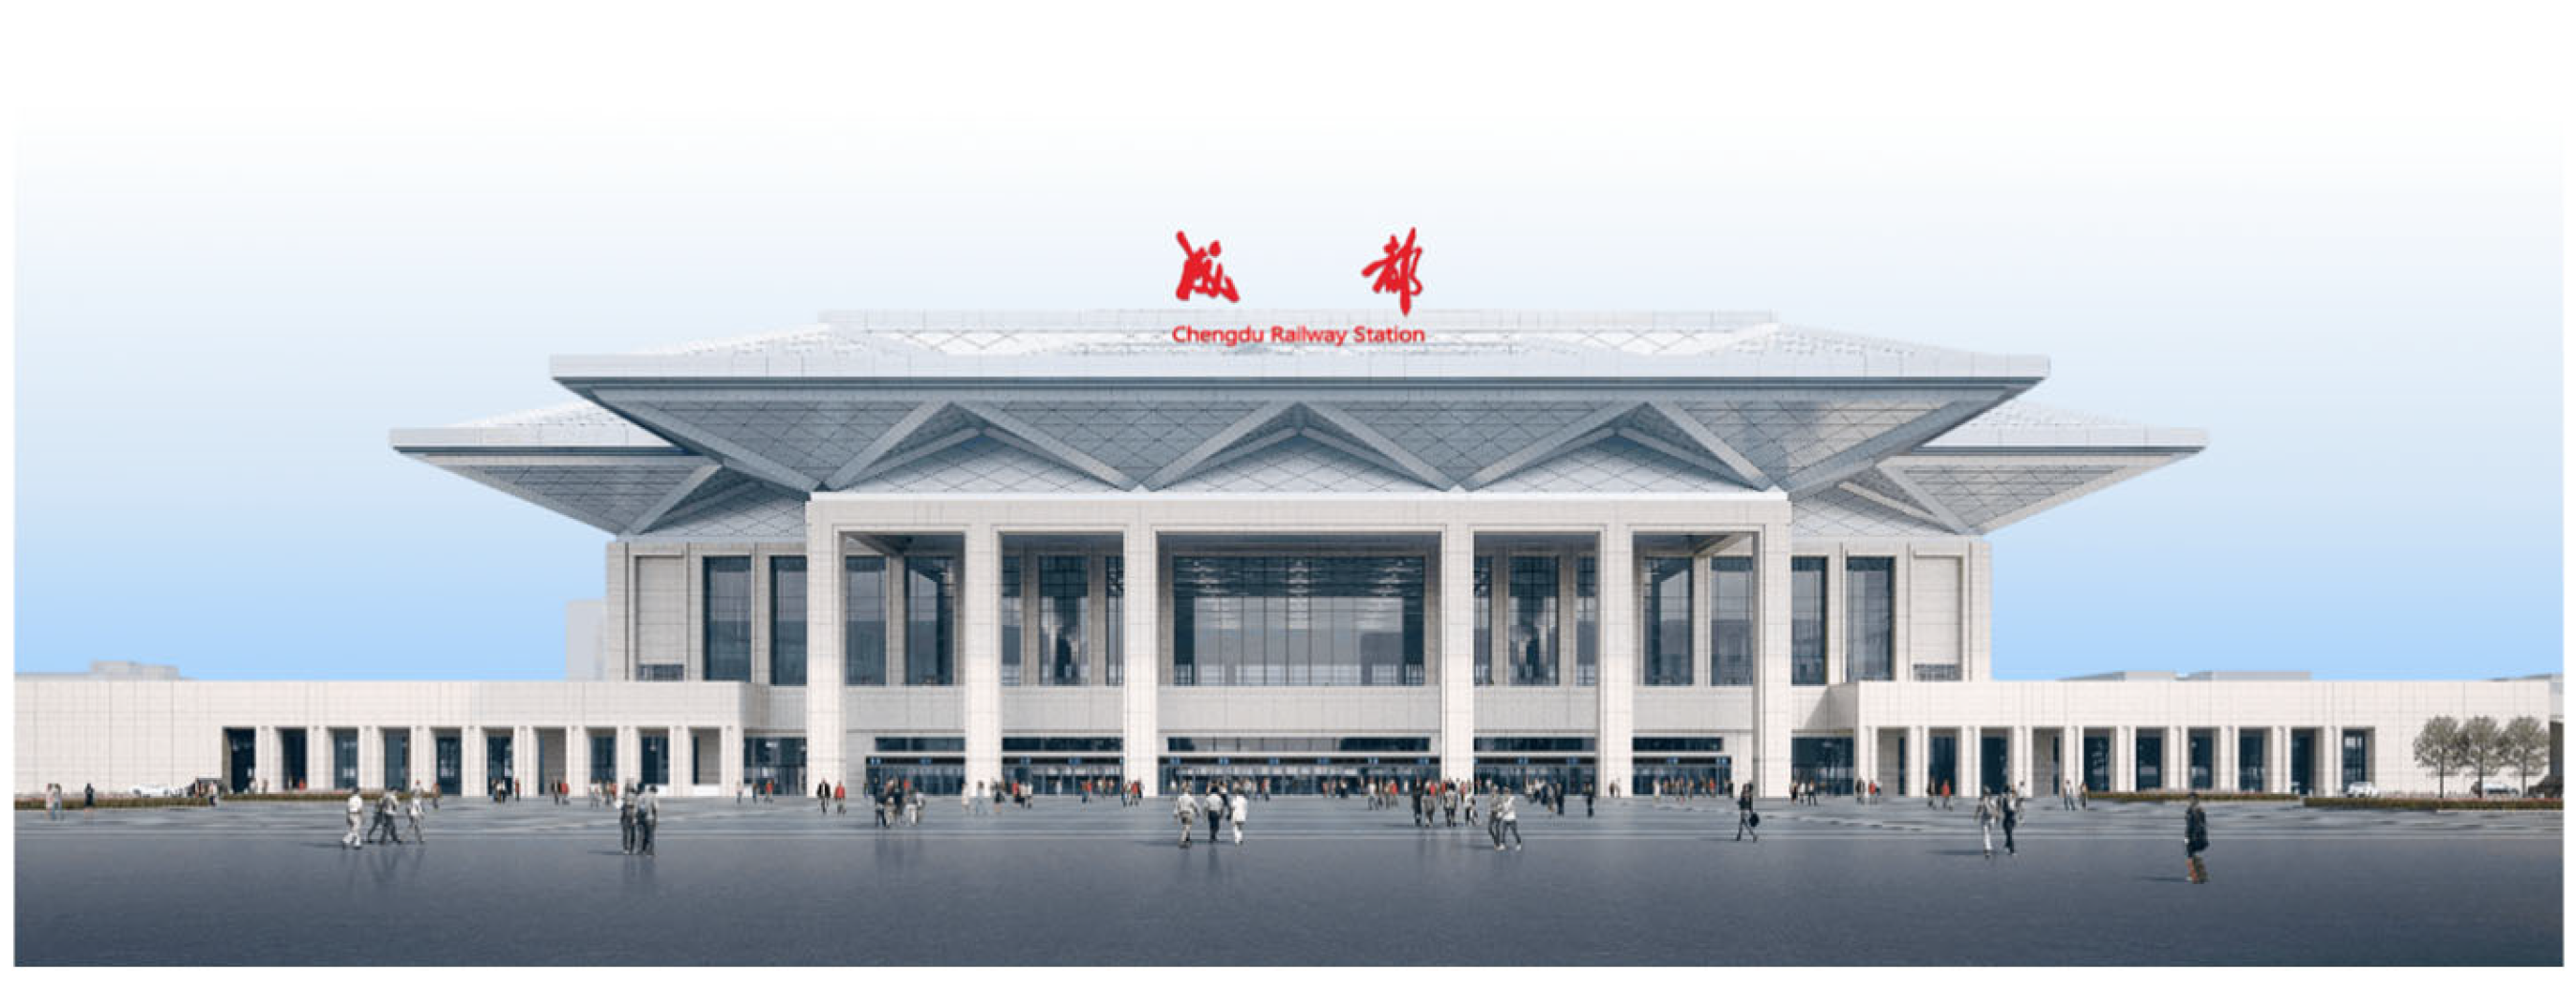
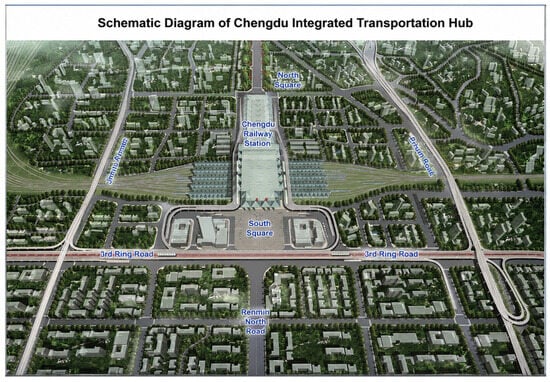
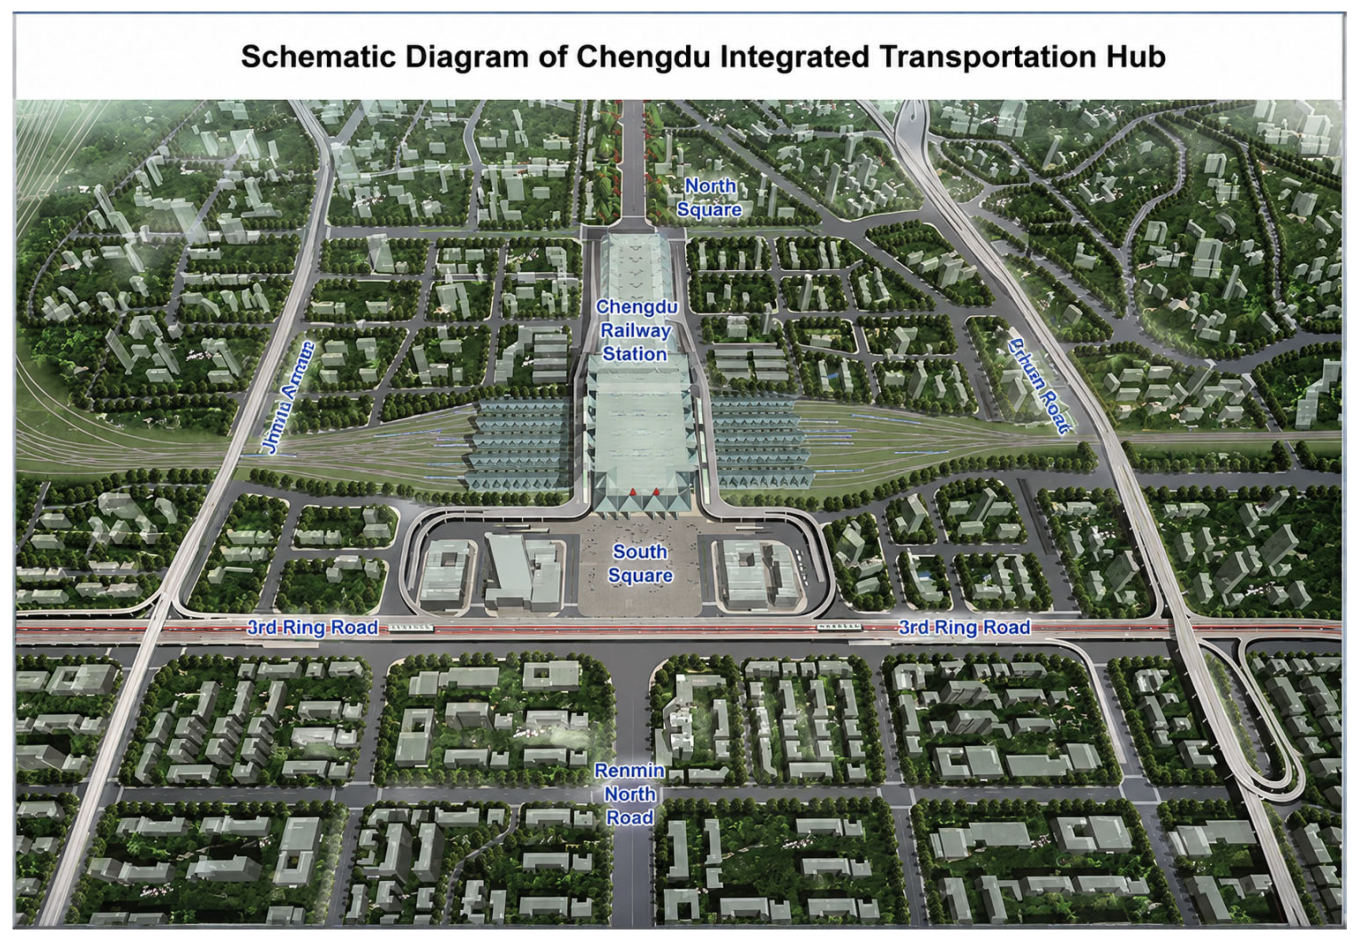
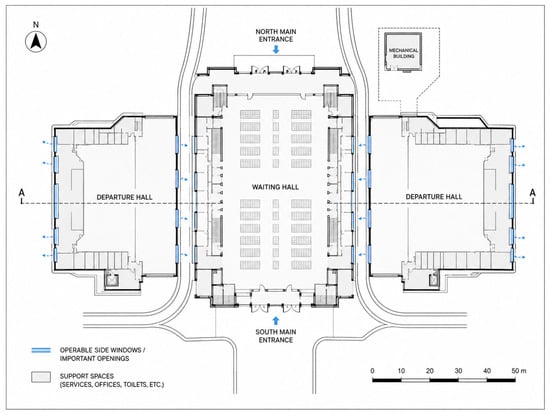
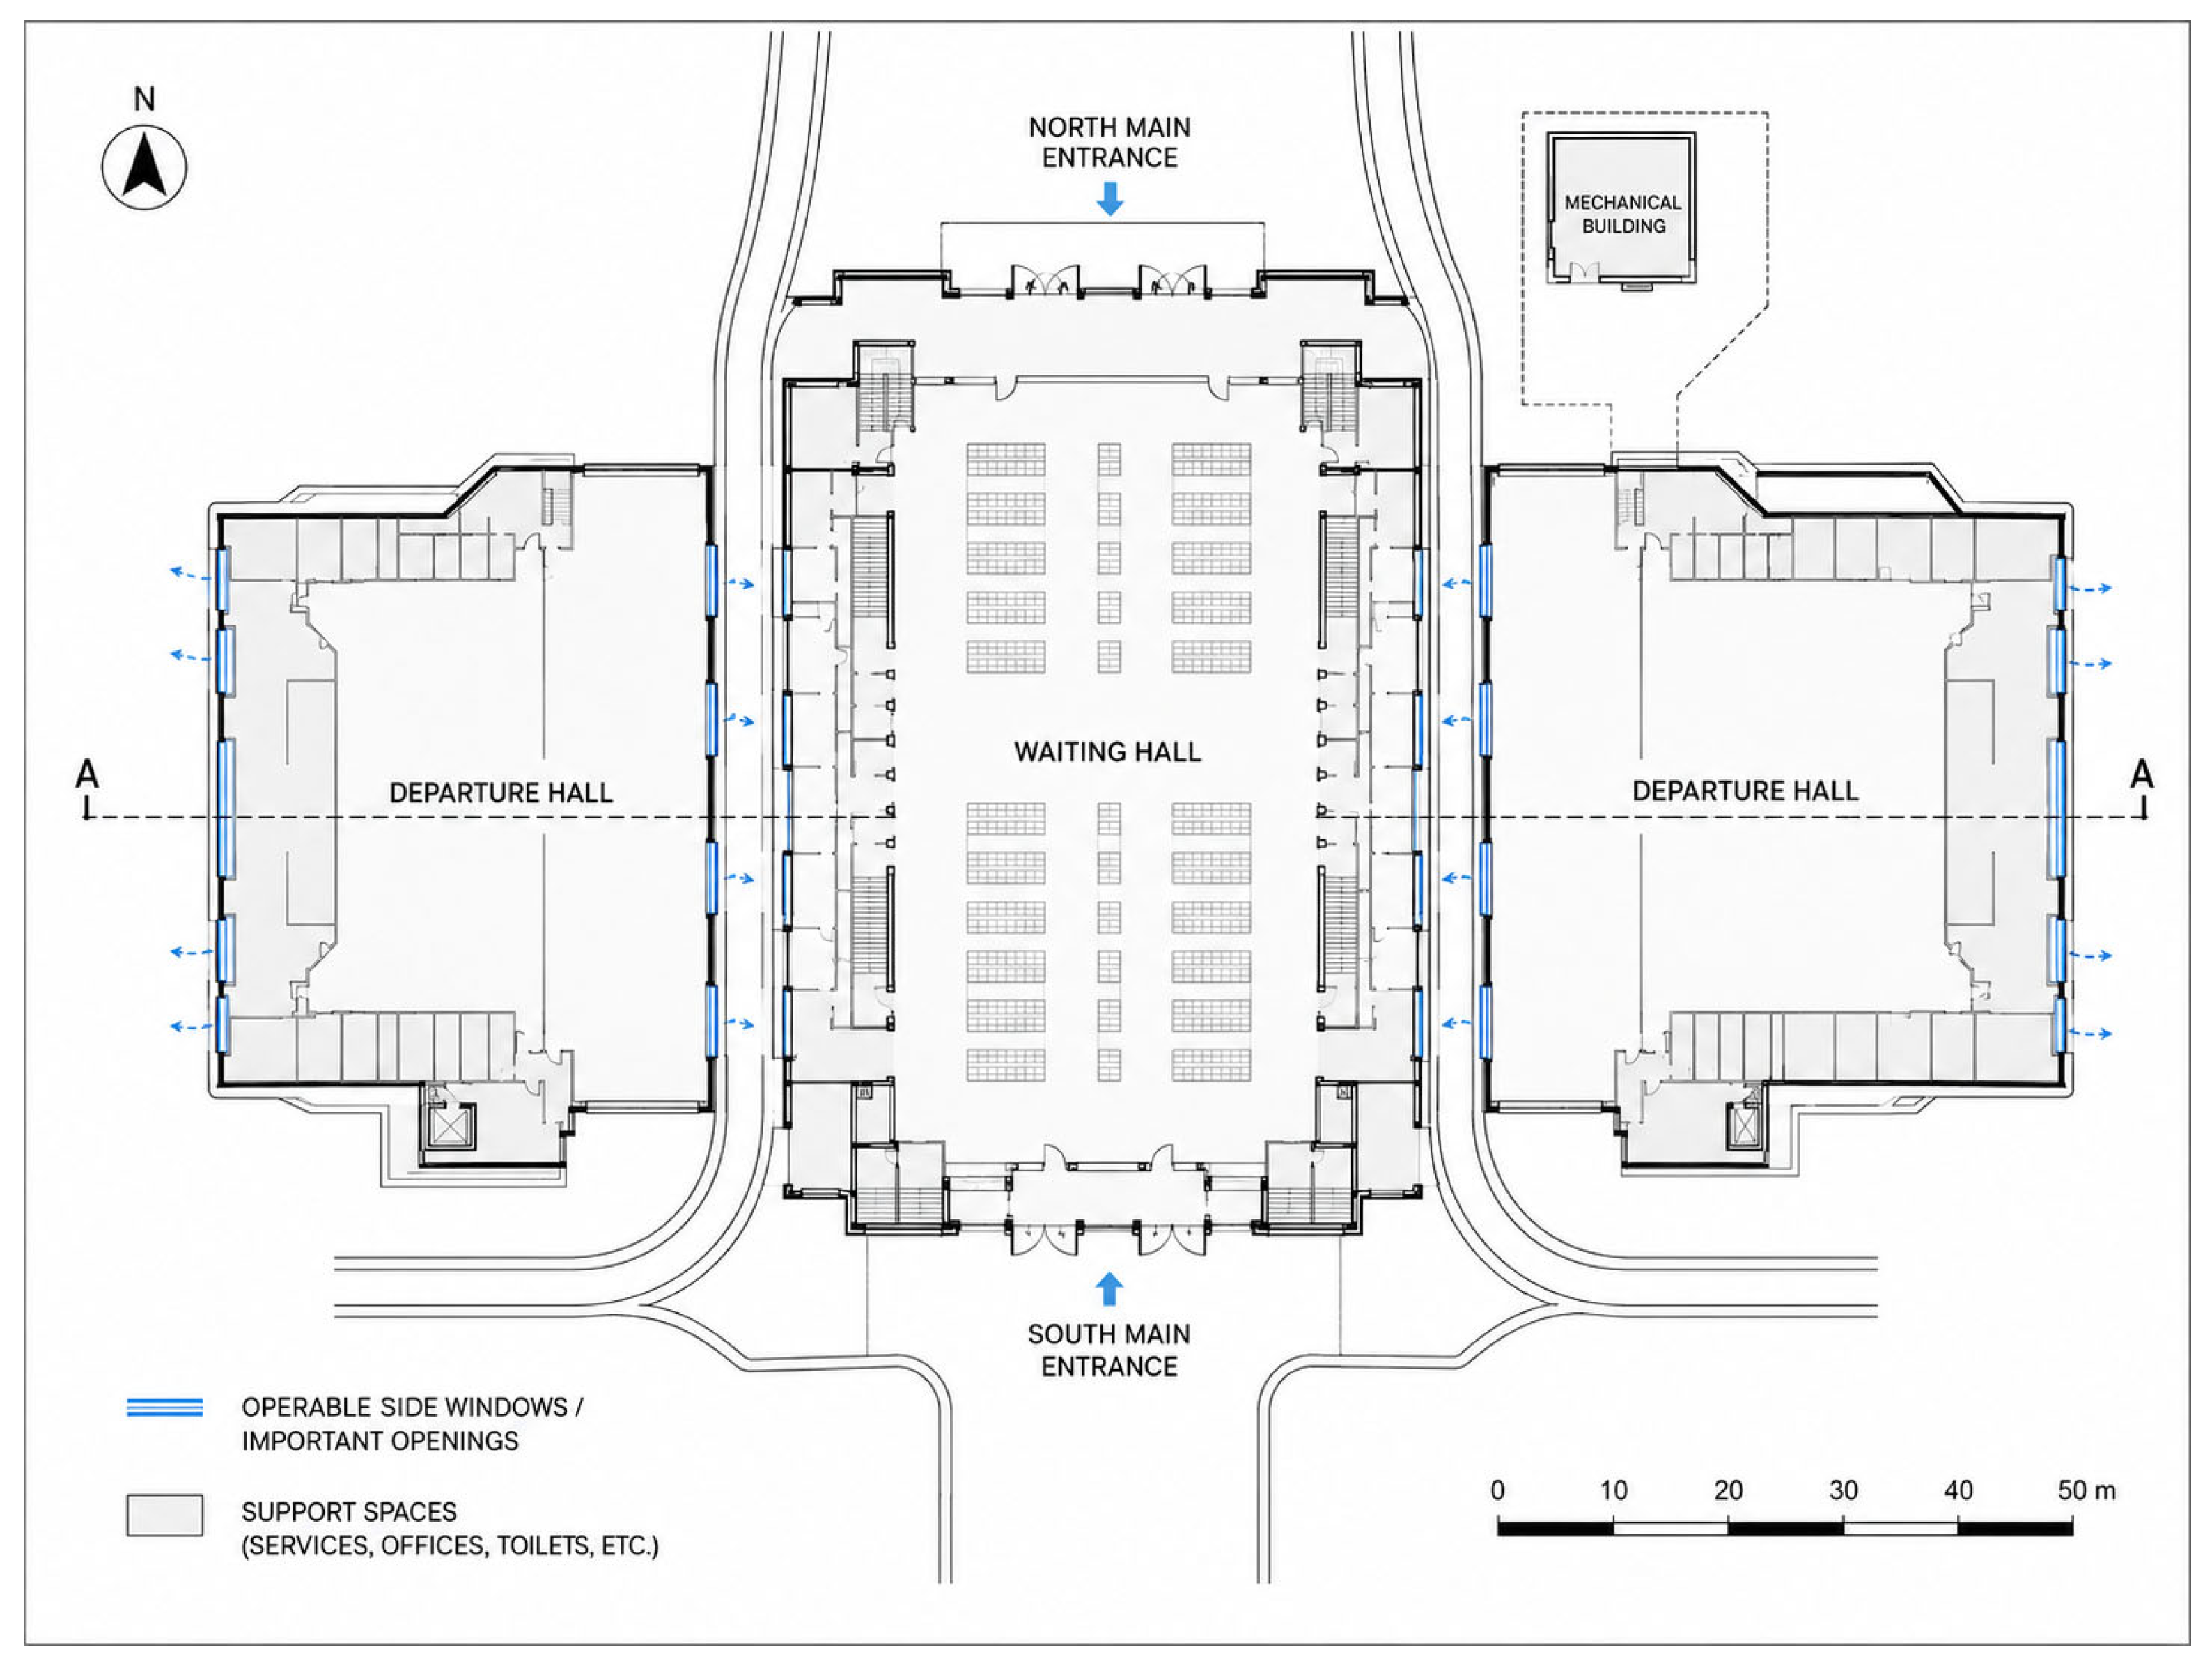
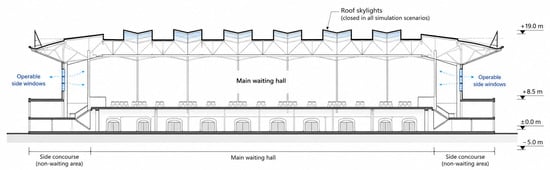
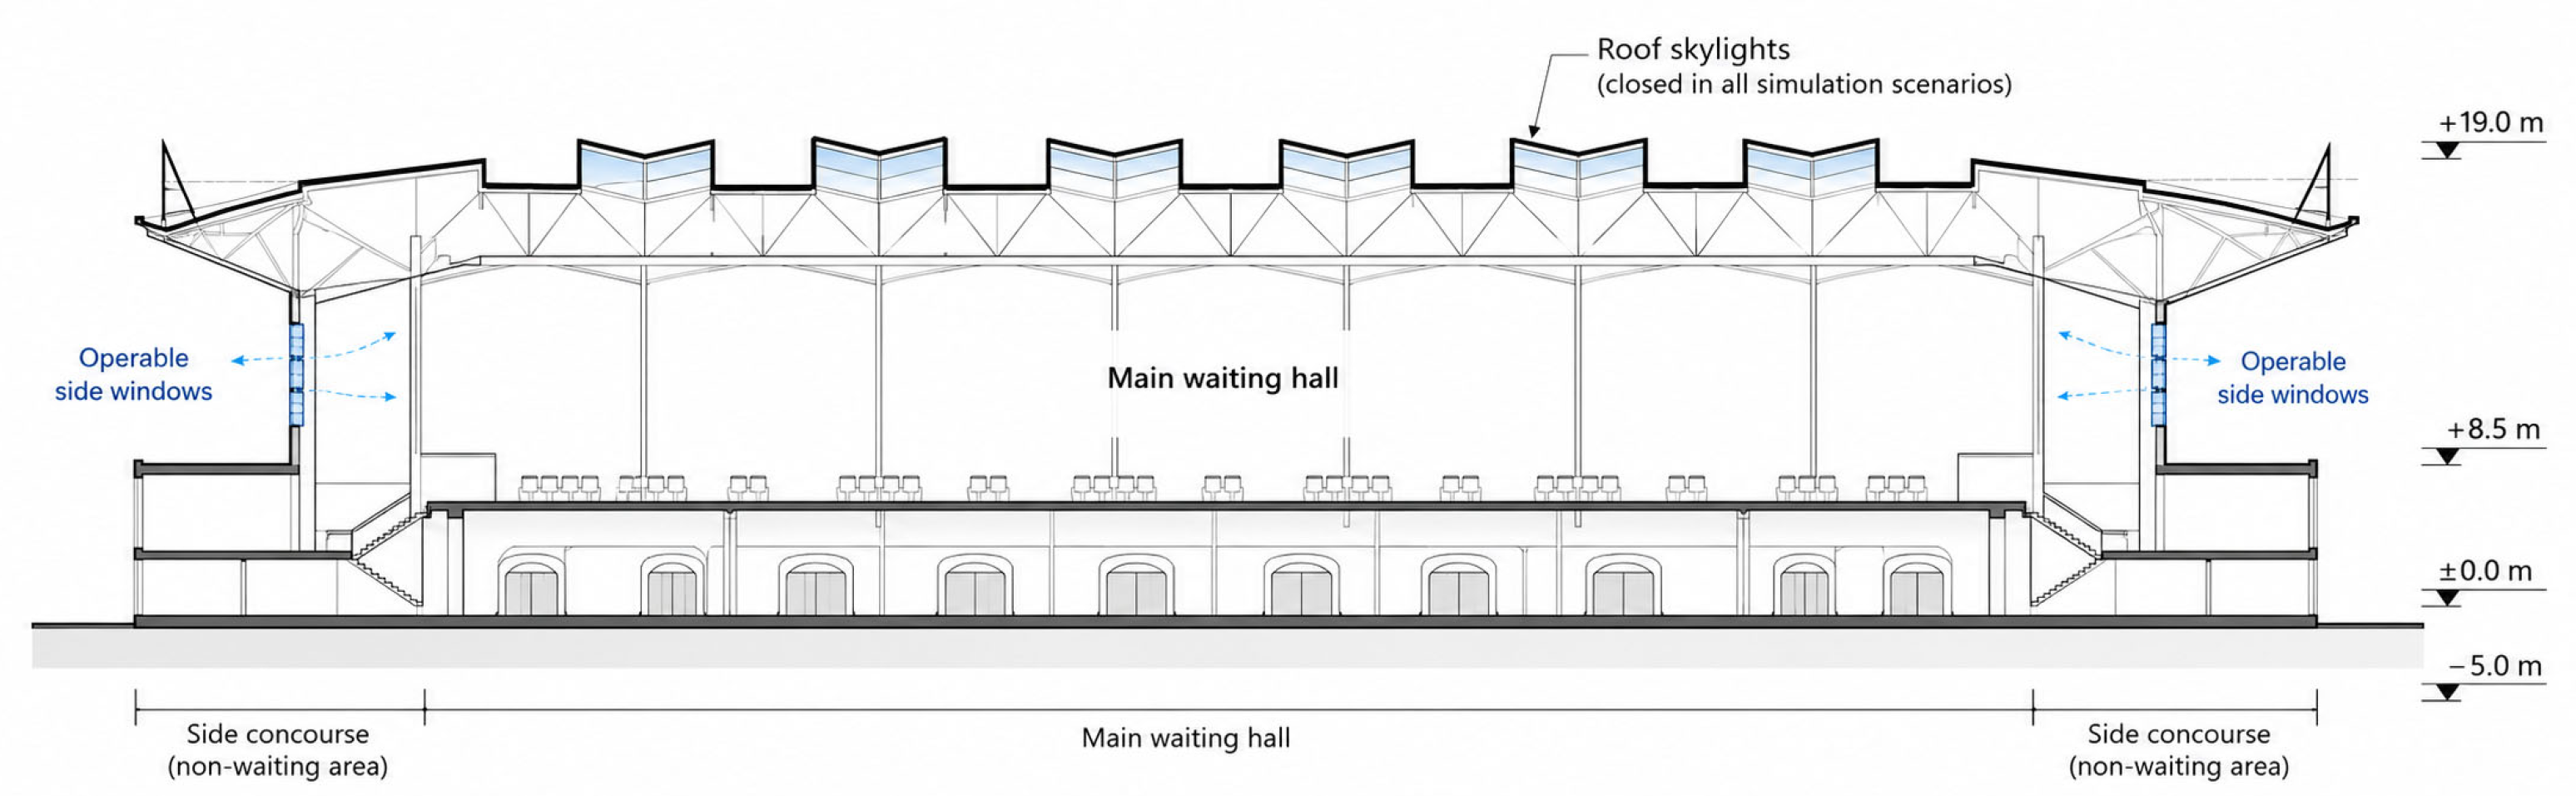
The total building area of the project is approximately 248,325 m2, with a station building area of 79,992.5 m2. The station building has a north–south length of approximately 244 m and an east–west width of approximately 152 m, with a total building height of about 48 m. The station adopts an elevated platform-based layout, consisting of an elevated waiting hall level, platform level, and underground arrival and departure levels. The rendering of Chengdu Station, the spatial relationship between the station and the urban transport system, the architectural floor plan, and the sectional view are presented in Figure 3, Figure 4, Figure 5 and Figure 6.
Figure 3.
Rendering of Chengdu Station.
Figure 4.
Schematic diagram of the spatial relationship between Chengdu Station and the urban transport system.
Figure 5.
Architectural floor plan of the waiting hall level of Chengdu Railway Station. The blue dashed arrows indicate the assumed airflow paths through the operable side windows and ventilation openings.
Figure 6.
Sectional view of Chengdu Station. The blue dashed arrows indicate the assumed airflow paths through the operable side windows.
The basic parameters of the waiting hall are shown in Table 1:
Table 1.
Basic parameters of the waiting hall.
3.2. Building Model Development
The natural ventilation performance of high-speed railway stations is affected by multiple factors, including building geometry, window-opening strategies, weather conditions, envelope thermal inertia, and occupant activity patterns. Therefore, an annual dynamic simulation approach is required to capture the temporal variations in indoor environmental conditions rather than relying on simplified steady-state methods. Design Builder was adopted as the simulation platform developed based on Energy Plus, which enables coupled simulations of building energy consumption, indoor thermal environment, and natural ventilation processes. Design Builder was selected because it integrates the Energy Plus simulation engine and enables coupled assessments of building energy performance, indoor thermal environment, and natural ventilation under dynamic weather conditions. Previous validation studies have demonstrated the reliability of Energy Plus-based simulations for predicting building energy use and indoor environmental performance [22,30,31].
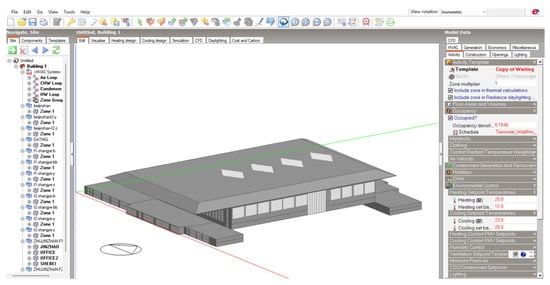
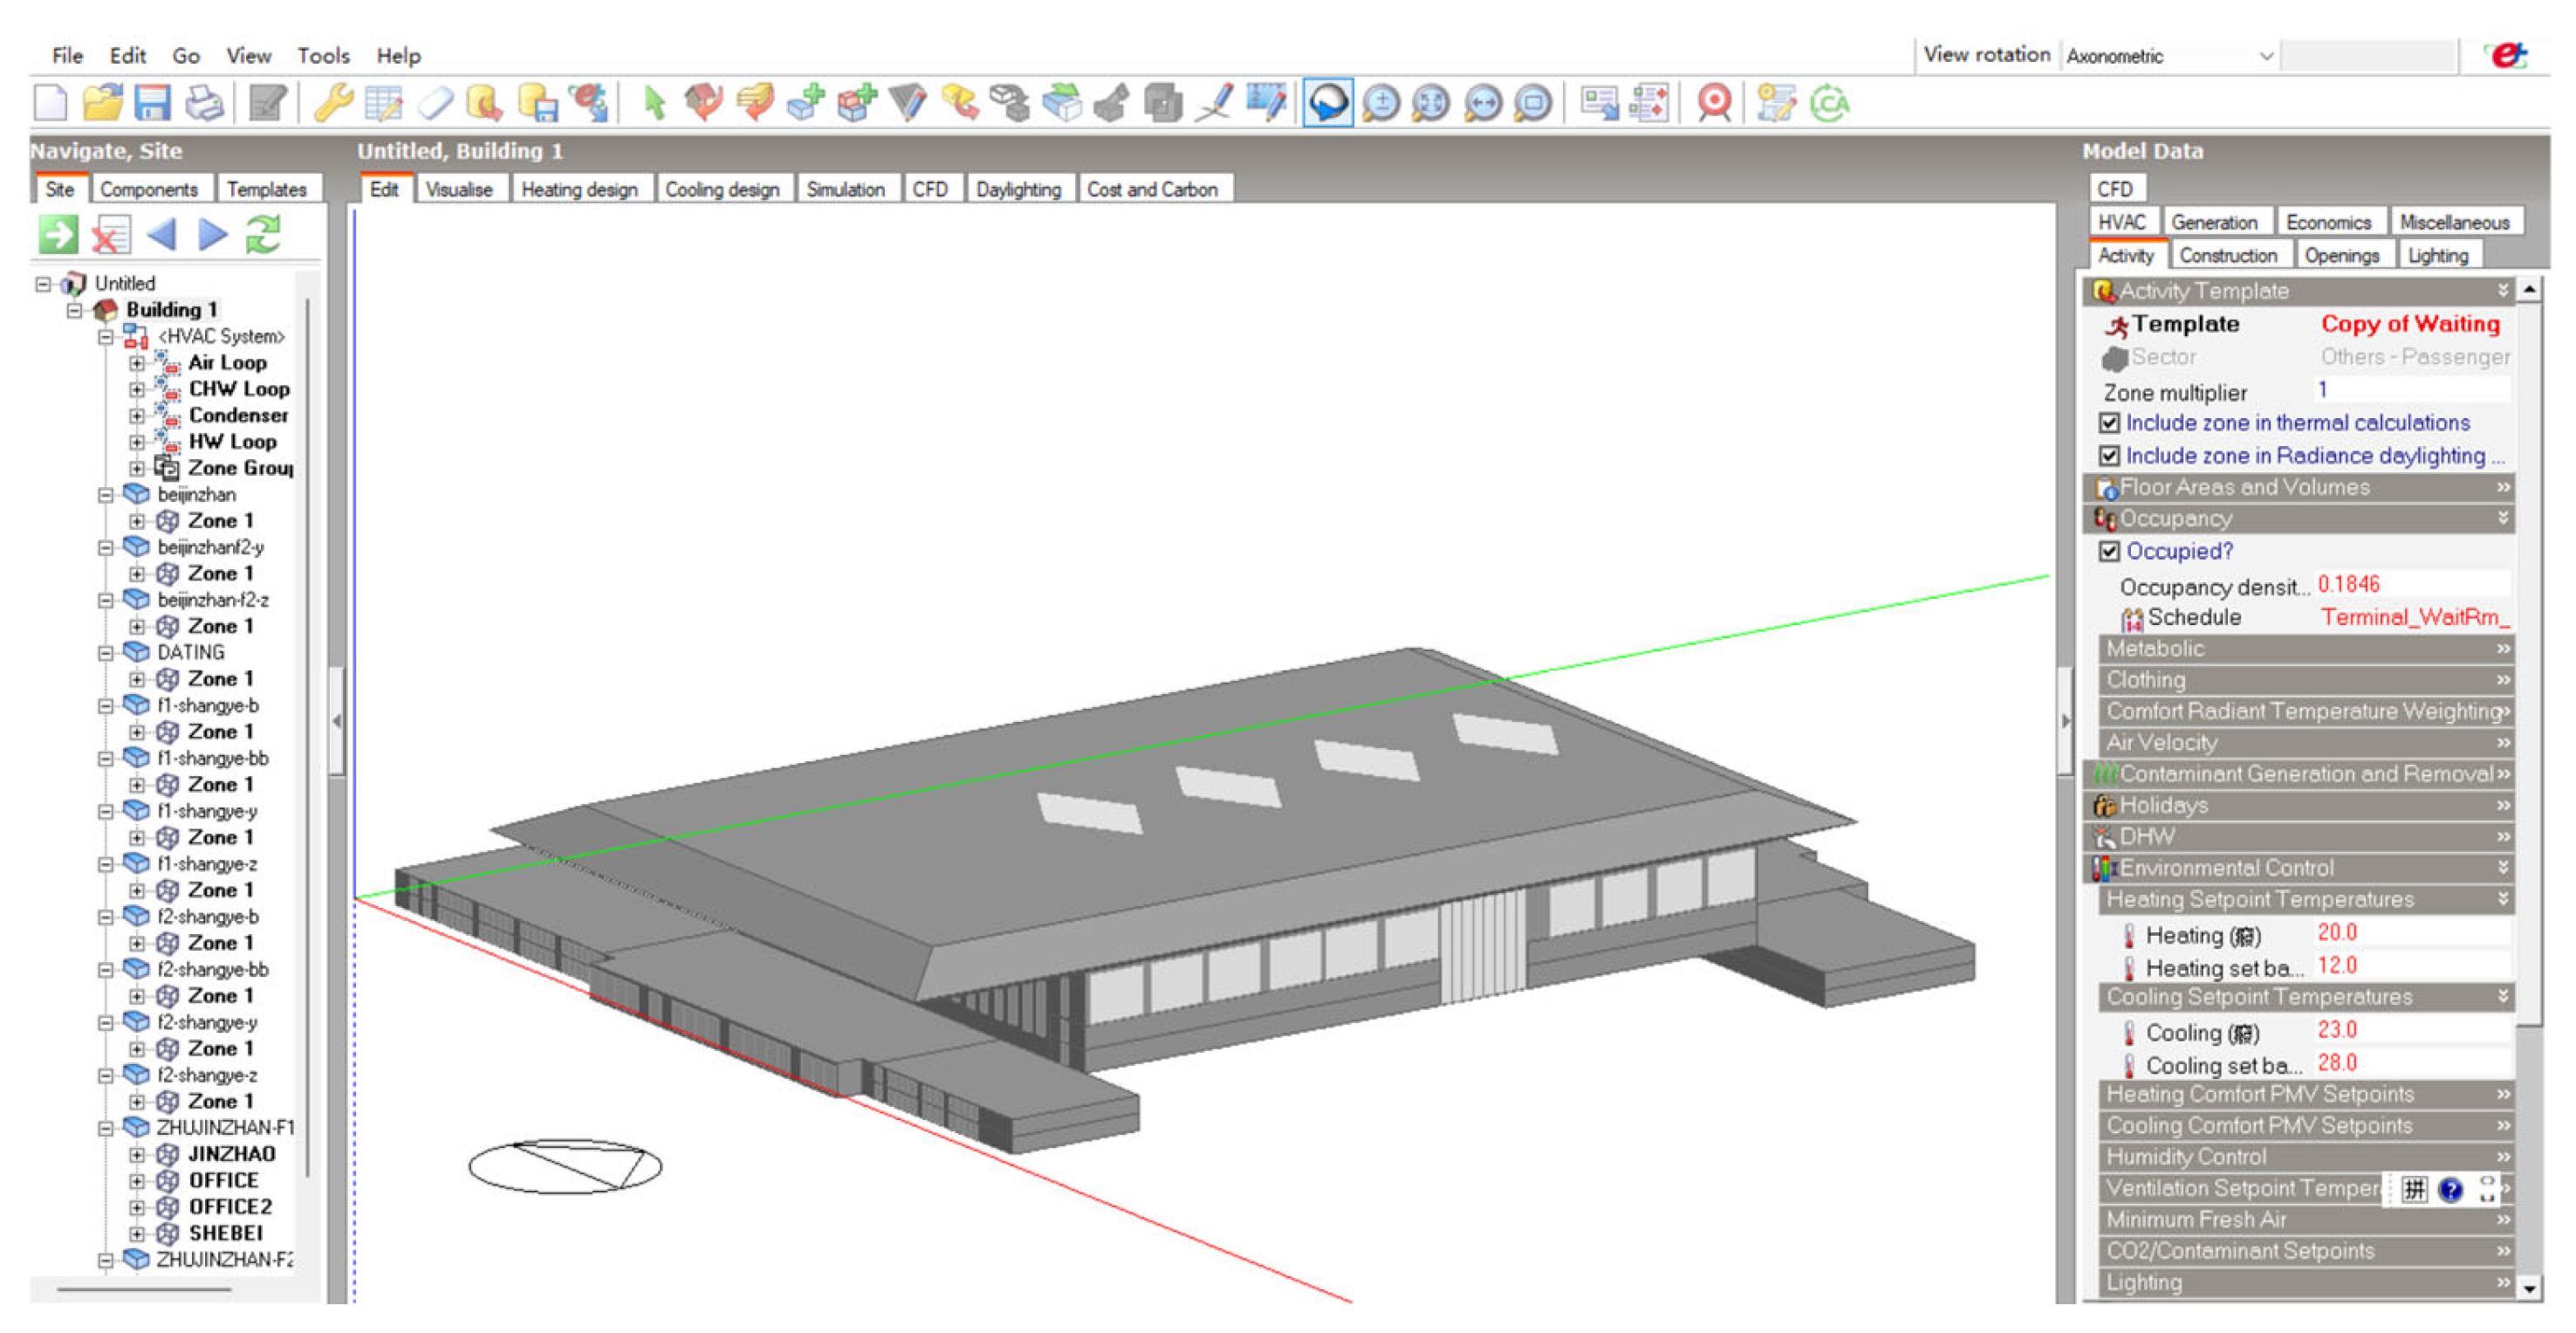
Based on the basic parameters of the waiting hall, a building model was developed using DesignBuilder (Version 7.0, DesignBuilder Software Ltd., Stroud, UK), as shown in Figure 7.
Figure 7.
Chengdu Station model in Design Builder.
3.3. Boundary Conditions and Simulation Parameter Settings
- (1)
- Thermal Properties of Building Envelope
To improve the reliability and engineering applicability of the simulation results, the thermal parameters of the building envelope were determined based on the design drawings of Chengdu Station. Meanwhile, the parameter settings were constrained in accordance with the thermal performance limit requirements for Class A public buildings specified in the Design Standard for Energy Efficiency of Public Buildings. Under the premise of meeting code requirements, relevant parameters were further adjusted and optimized according to the actual thermal properties of building materials. The detailed parameter settings are summarized in Table 2 and Table 3.
Table 2.
Thermal Parameters for Chengdu Region.
Table 3.
Materials of building envelope components.
Due to the large-span spatial characteristics, diverse envelope configurations, and complex structural junctions of railway station buildings, thermal bridges exhibit significant spatial heterogeneity, with considerable variations in linear thermal transmittance among different construction details. Therefore, instead of implementing independent parameterization for individual thermal bridge types, this study adopted the built-in thermal bridge calculation module in Design Builder to automatically process the junctions of building envelope components. This approach identifies potential thermal bridge regions based on the geometric and material connections between building components and incorporates the additional heat transfer losses associated with these junctions into the overall heat transfer calculation of the envelope, thereby achieving an equivalent representation of the actual thermal bridge effects. Compared with conventional correction methods based on empirical parameters, this approach reduces uncertainties caused by subjective assumptions while maintaining a balance between simulation accuracy and computational efficiency. It is therefore suitable for annual thermal environment and energy performance evaluations of large-scale public buildings.
- (2)
- Indoor Load Parameters
Regarding occupant activity loads, the passenger flow intensity, waiting hall occupancy density, and daily activity schedules were determined based on field survey data. The peak passenger departure volume was set at 8000 passengers per hour, from which the occupancy density of the waiting hall was estimated to be approximately 0.24 persons/m2.
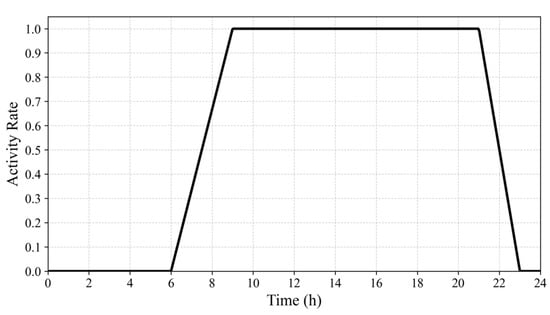
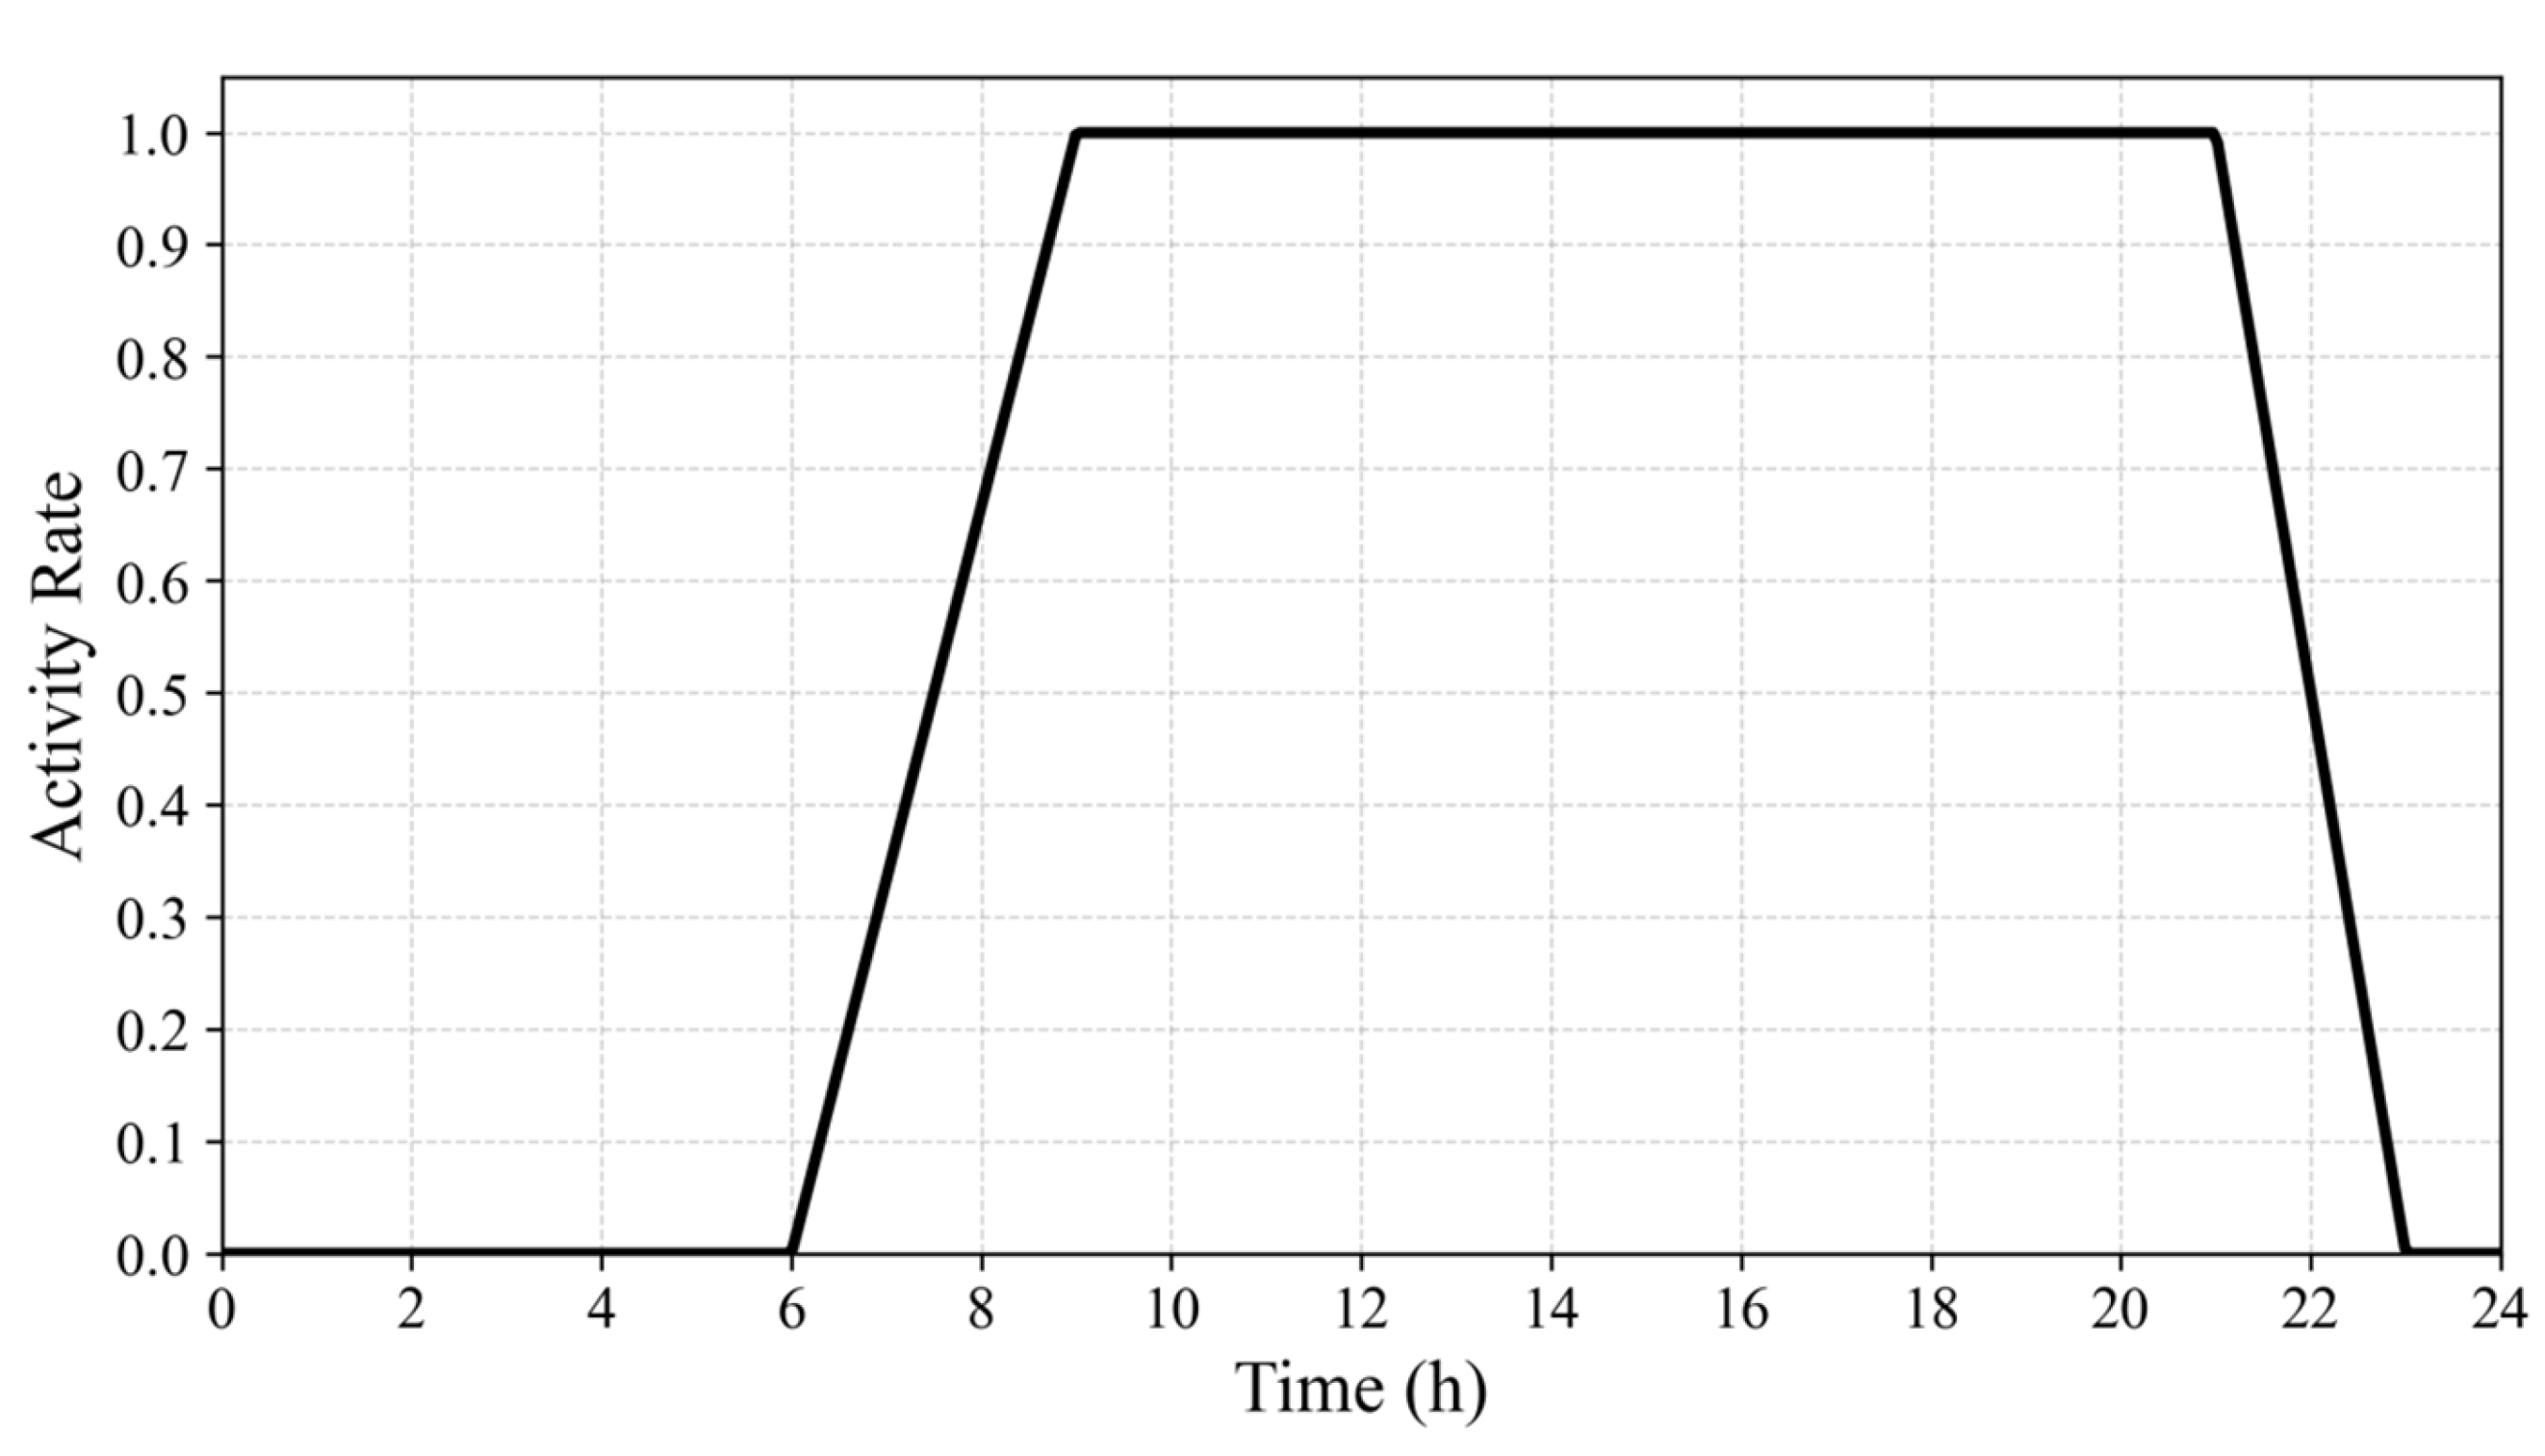
The temporal distribution of occupant activities is closely related to the train operation schedule of the high-speed railway system. The period from 9:00 to 21:00 is defined as the daytime peak operation stage with concentrated train arrivals and departures. The periods from 6:00 to 9:00 and from 21:00 to 24:00 are considered low-demand periods, during which occupant intensity is reduced to 25% of the peak condition, thereby forming a full-day occupant activity profile (as shown in Figure 8).
Figure 8.
Temporal distribution curve of occupant activity.
The air-conditioning cooling and heating loads, as well as HVAC system settings, were determined based on the mechanical and electrical design specifications of Chengdu Station and used as boundary conditions for simulation. Under all scenarios, HVAC system parameters remained consistent. The indoor design temperature of the waiting hall and commercial areas was set to 26 °C in summer and 18 °C in winter. During operation, the fresh air supply rate was set to 16 m3/h per person for the waiting hall and 20 m3/h per person for commercial areas. In addition, the underground departure level was excluded from HVAC load calculations. The cooling and heating loads of different functional zones used in the simulation are summarized in Table 4.
Table 4.
Cooling and heating loads of different functional zones in Chengdu Station.
In terms of lighting loads, the lighting power density was set to 8 W/m2, corresponding to a design illuminance level of 200 lx, and was assumed to operate continuously throughout the year.
3.4. Simulation Cases
To investigate the applicability of natural ventilation cooling strategies in Chengdu and determine a reasonable operable window opening ratio, six ventilation scenarios were defined based on the operational characteristics of railway passenger stations. These scenarios were distinguished by varying the proportion of operable door and window areas.
Considering that station entrances are typically kept open during operation, the case with only doors open and windows closed is defined as the baseline ventilation condition, representing the minimum ventilation rate. In contrast, the case with all doors and windows fully open represents the maximum ventilation condition.
The detailed configurations of each case are presented in Table 5.
Table 5.
Natural ventilation simulation cases.
3.5. Field Measurement and Model Validation
To improve the reliability of the Chengdu Railway Station model developed in this study, field measurements were conducted in a large-scale railway station located in Chengdu, and the measured data were compared with the simulation results. Since Chengdu Railway Station is currently undergoing renovation and construction activities, long-term on-site monitoring cannot be performed under stable operating conditions. Therefore, another railway station with high similarity to Chengdu Railway Station in terms of building scale, spatial configuration, and operational characteristics was selected as the validation case.
Considering that railway stations are large-scale transportation hub buildings, their architectural drawings and operational data are generally subject to confidentiality restrictions, making it difficult to obtain complete design documents and operational parameters from public sources. Therefore, based on the available field investigation conditions, the spatial dimensions, envelope configurations, opening arrangements, and indoor environmental parameters of the waiting hall in the validation station were measured on site. A corresponding simulation model was subsequently developed based on the measured information and actual operating conditions. The applicability of the proposed simulation method was evaluated through error analysis between the measured and simulated results.
(1) Experimental method
Field measurements were continuously conducted for five consecutive days, from 13 to 17 July 2026, in the waiting hall of the selected railway station. During the measurement period, all operable windows remained closed, and the air-conditioning system followed the actual operation strategy. Specifically, cooling was activated when the indoor temperature exceeded 28 °C, with a cooling setpoint temperature of 23 °C. During other periods, the indoor thermal environment was mainly influenced by the building envelope, internal heat gains, and natural ventilation conditions.
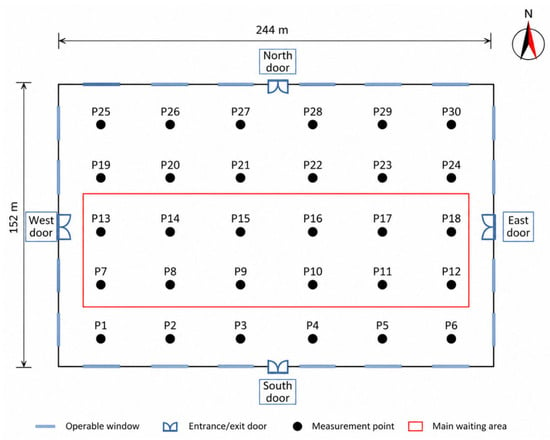
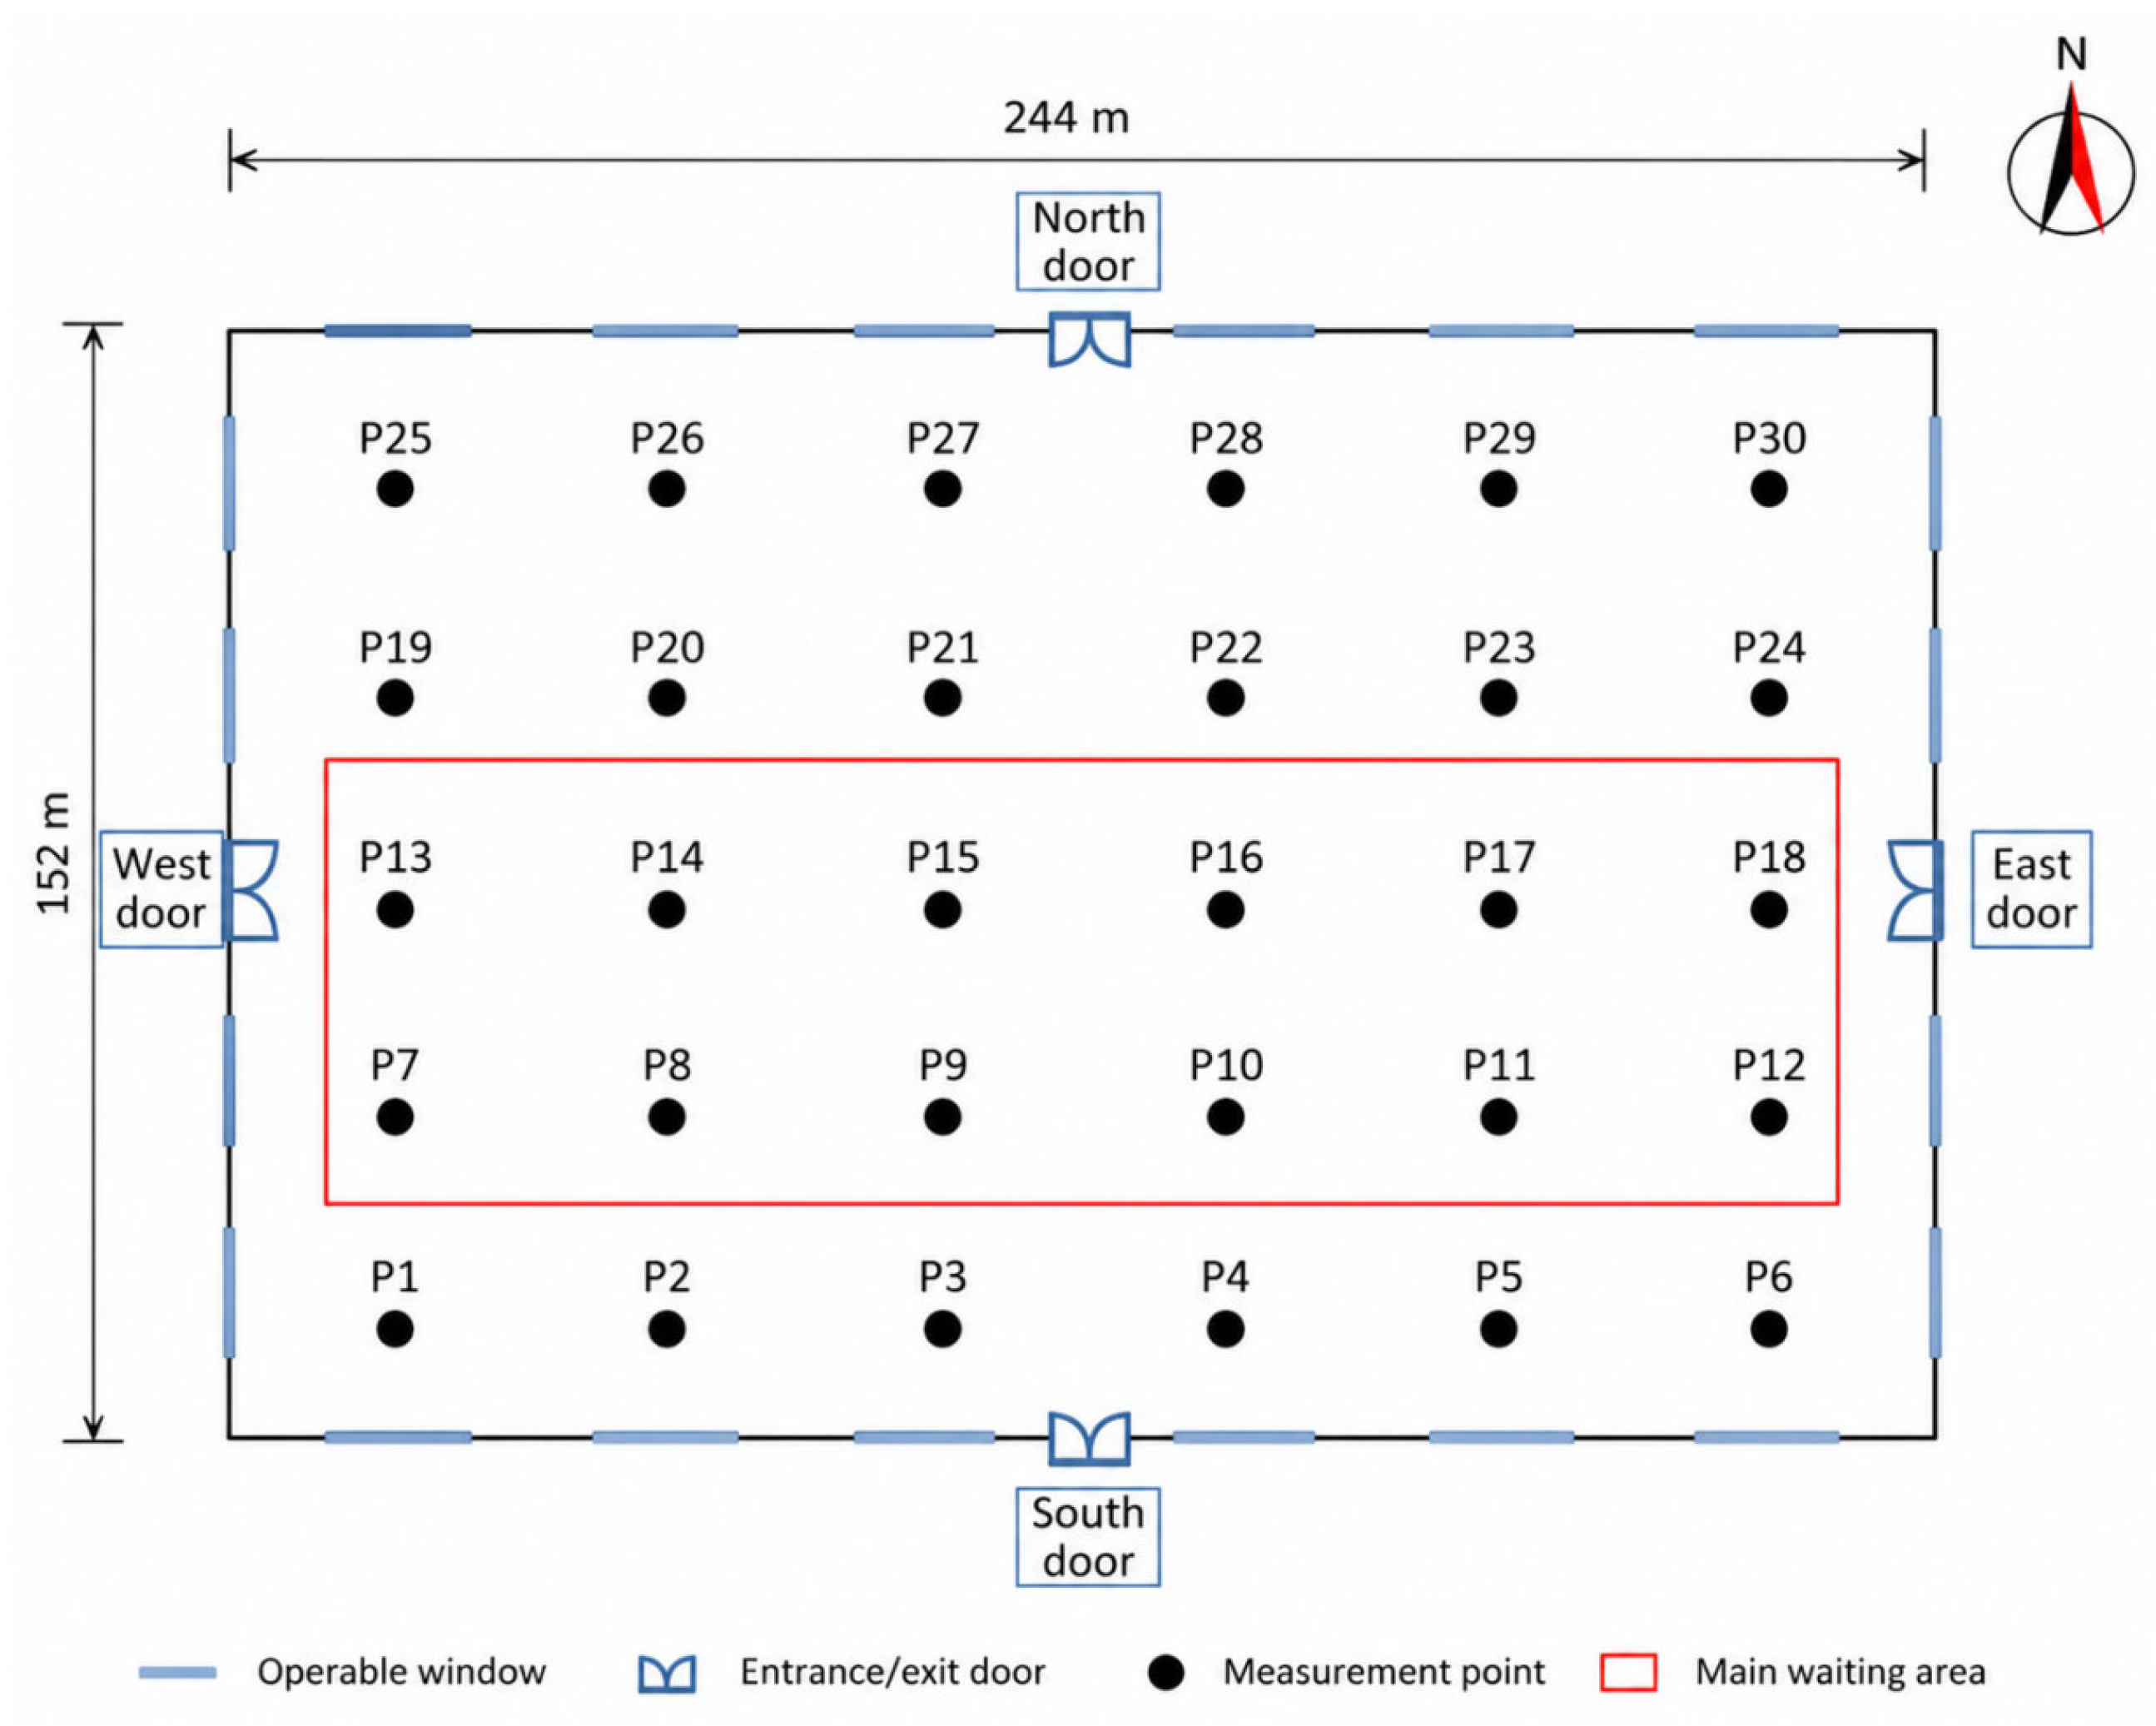
The waiting hall has approximate dimensions of 152 m in the east–west direction and 244 m in the north–south direction, representing a typical large-space railway station environment. According to the spatial characteristics and occupant activity areas, 30 measurement points were evenly distributed throughout the main waiting area. The measurement height was set at 1.2 m above the floor level to represent the thermal environment experienced by occupants.
Indoor air temperature, relative humidity, and air velocity were continuously monitored from 13 to 17 July 2026. The five-day monitoring data at each measurement point were temporally averaged, and the spatially averaged values of the 30 measurement points were subsequently calculated to characterize the overall environmental conditions of the waiting hall. These results were then compared with the corresponding simulation results for model validation. The layout and spatial distribution of the measurement points in the waiting hall are presented in Figure 9.
Figure 9.
Layout of measurement points in the waiting hall of the validation railway station.
(2) Analysis of measured results
Statistical analysis of the field measurement data was conducted to obtain the indoor environmental parameters under typical operating conditions of the validation station. The measured results were subsequently compared with the simulation outputs to evaluate the reliability and applicability of the developed model and simulation approach for predicting the thermal environment of large-scale railway stations. The detailed measurement results are presented in Table 6.
Table 6.
Measured air temperature, relative humidity, and air velocity at monitoring points.
As shown in Table 6, spatial variations in indoor temperature, humidity, and air velocity were observed in the waiting hall. Air velocity exhibited relatively significant spatial differences due to the influence of building scale and local airflow distribution. Higher air velocities were observed near entrances, while lower values occurred in areas farther away from openings. The indoor temperature distribution was relatively stable, with an average temperature of approximately 28.5 °C. Since all windows remained closed during the measurement period, the indoor thermal environment was mainly affected by air-conditioning operation, occupant heat gains, and heat transfer through the building envelope. Overall, the measured environmental conditions were consistent with the characteristics of large-scale railway station operation.
(3) Analysis of simulation results
Since Design Builder performs building performance simulations based on Energy Plus, the simulation outputs are calculated using thermal zones as the fundamental computational units. Therefore, environmental parameters such as temperature, relative humidity, and air velocity are obtained at the zone level rather than at individual measurement locations.
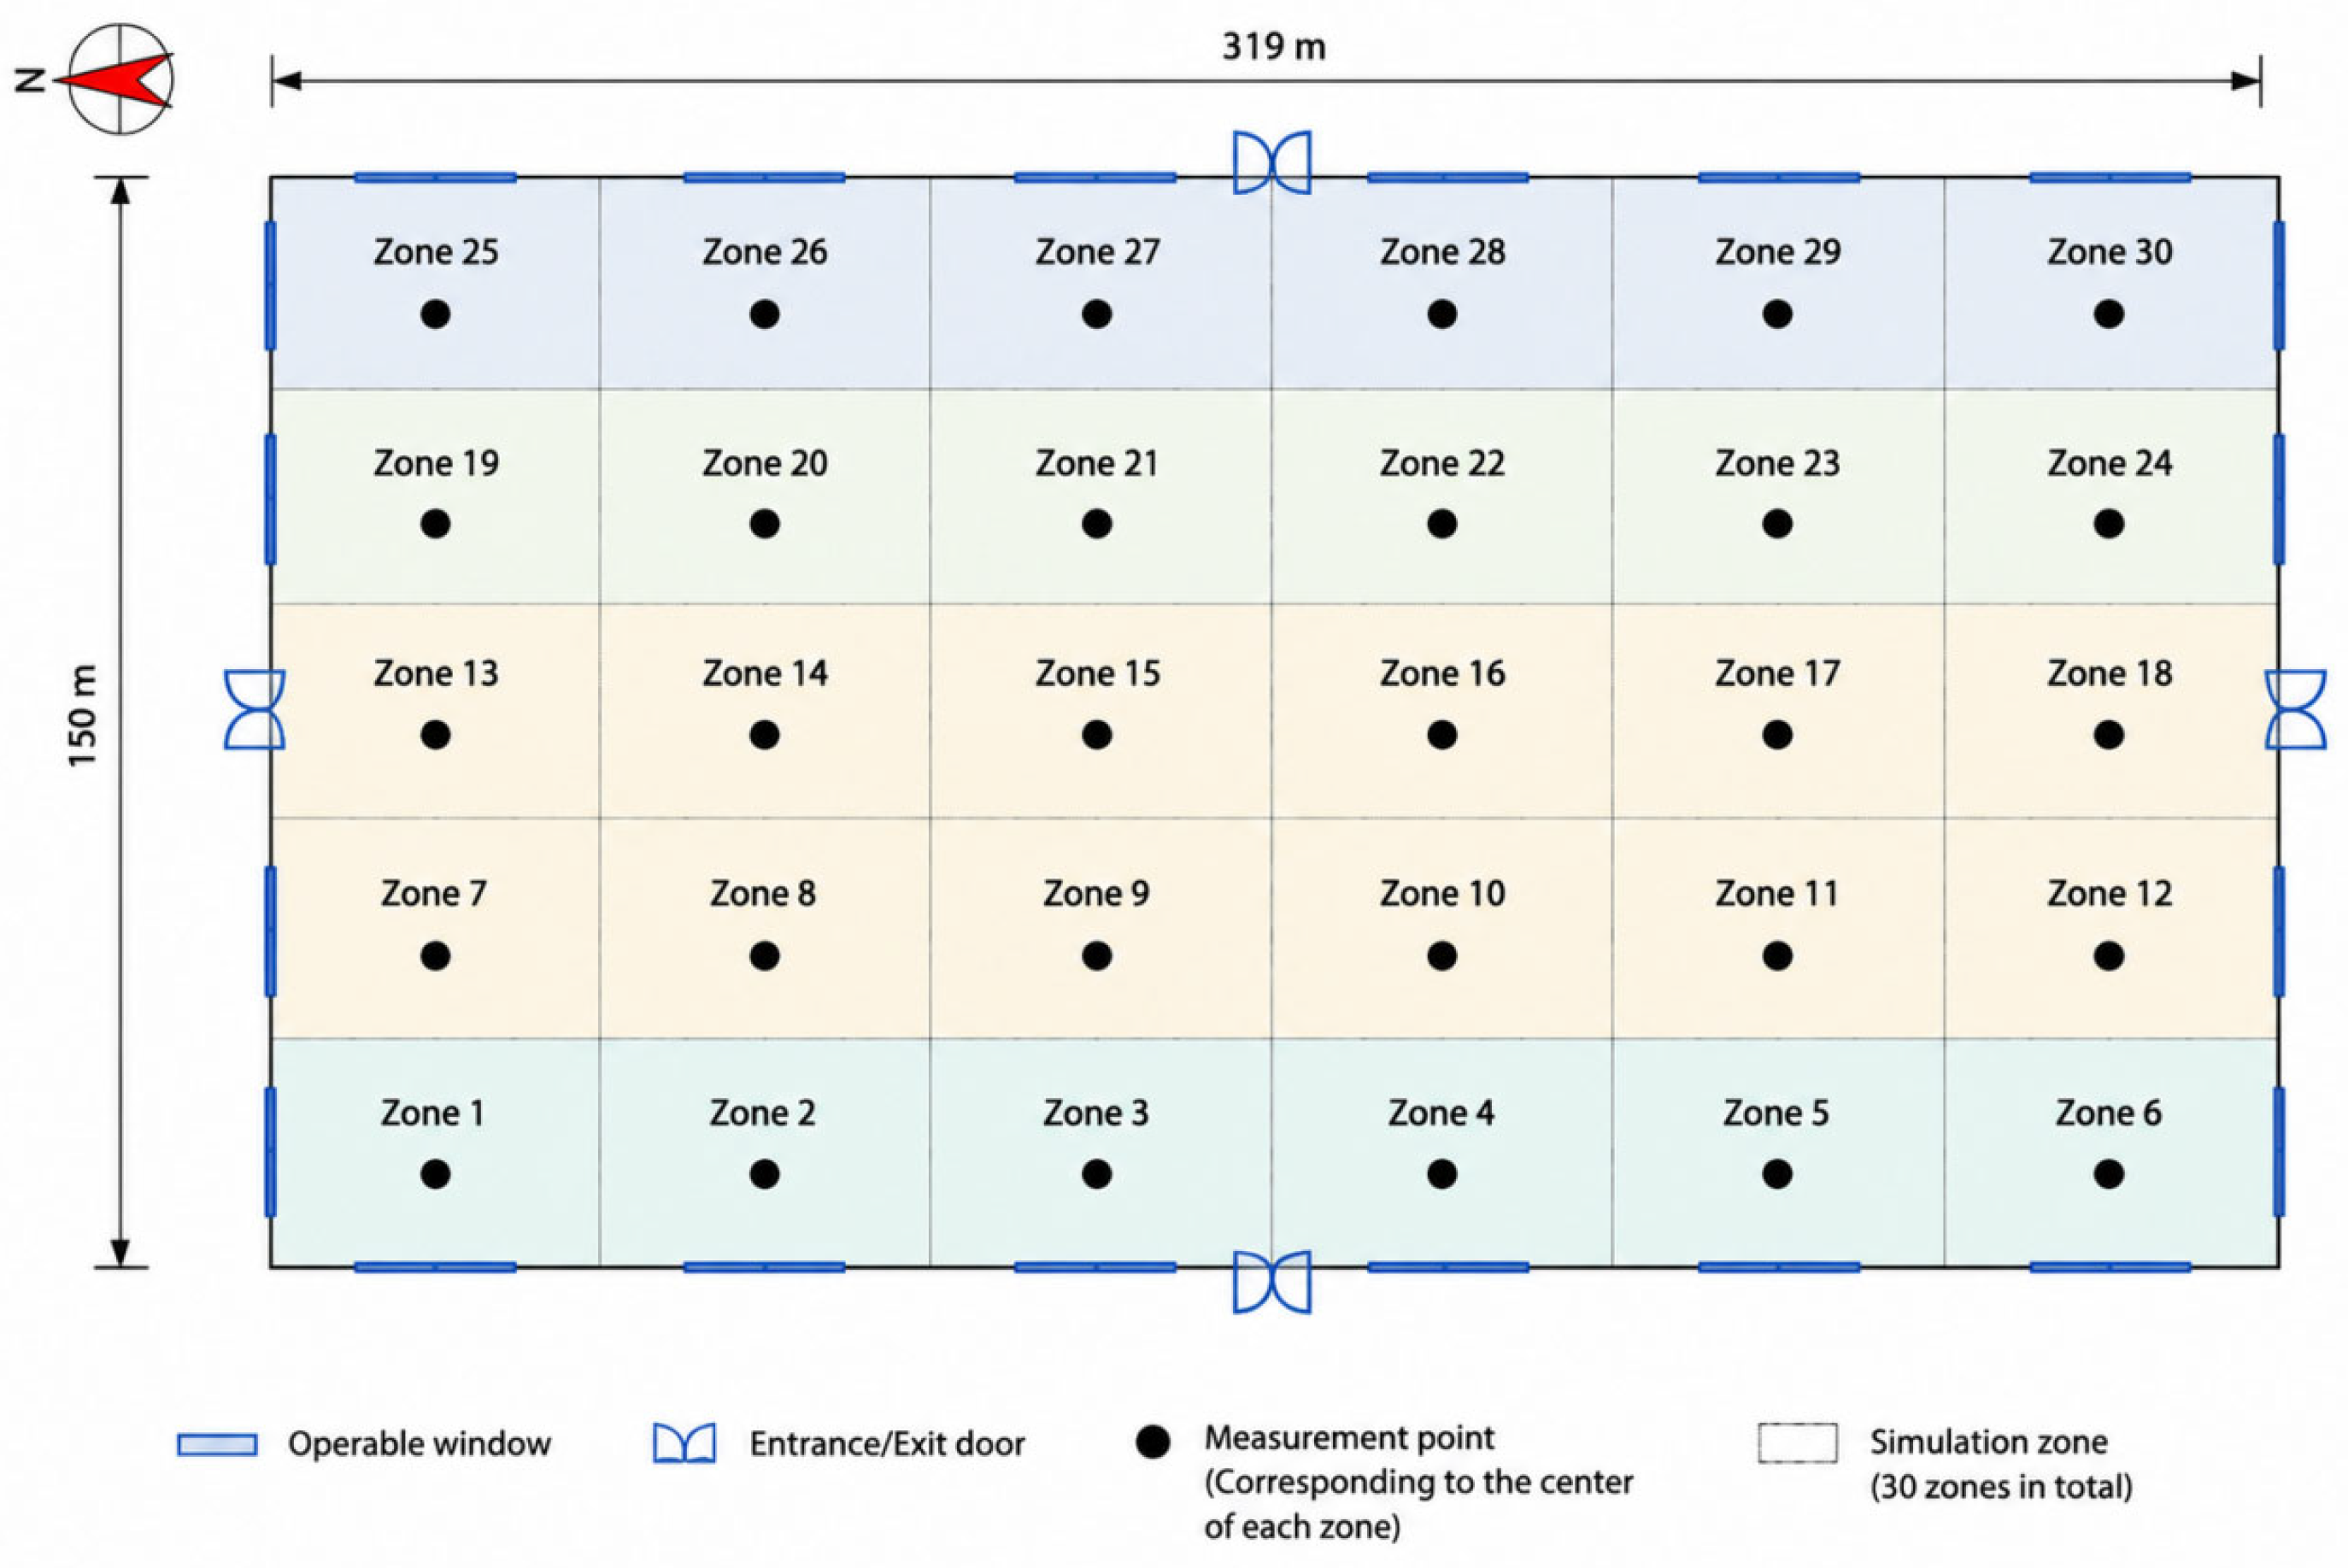
To ensure consistency between the measured and simulated data, the 30 measurement points were individually represented by 30 independent simulation zones in the developed model. The environmental parameters of each corresponding zone were extracted and compared with the measured values at the corresponding locations for model validation. The spatial zoning configuration is illustrated in Figure 10, and the zone numbers correspond directly to the measurement point numbers.
Figure 10.
Spatial zoning layout of the waiting hall model.
(4) Comparison between measured and simulated results
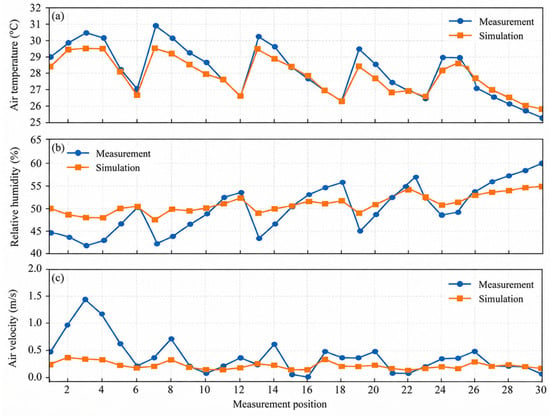
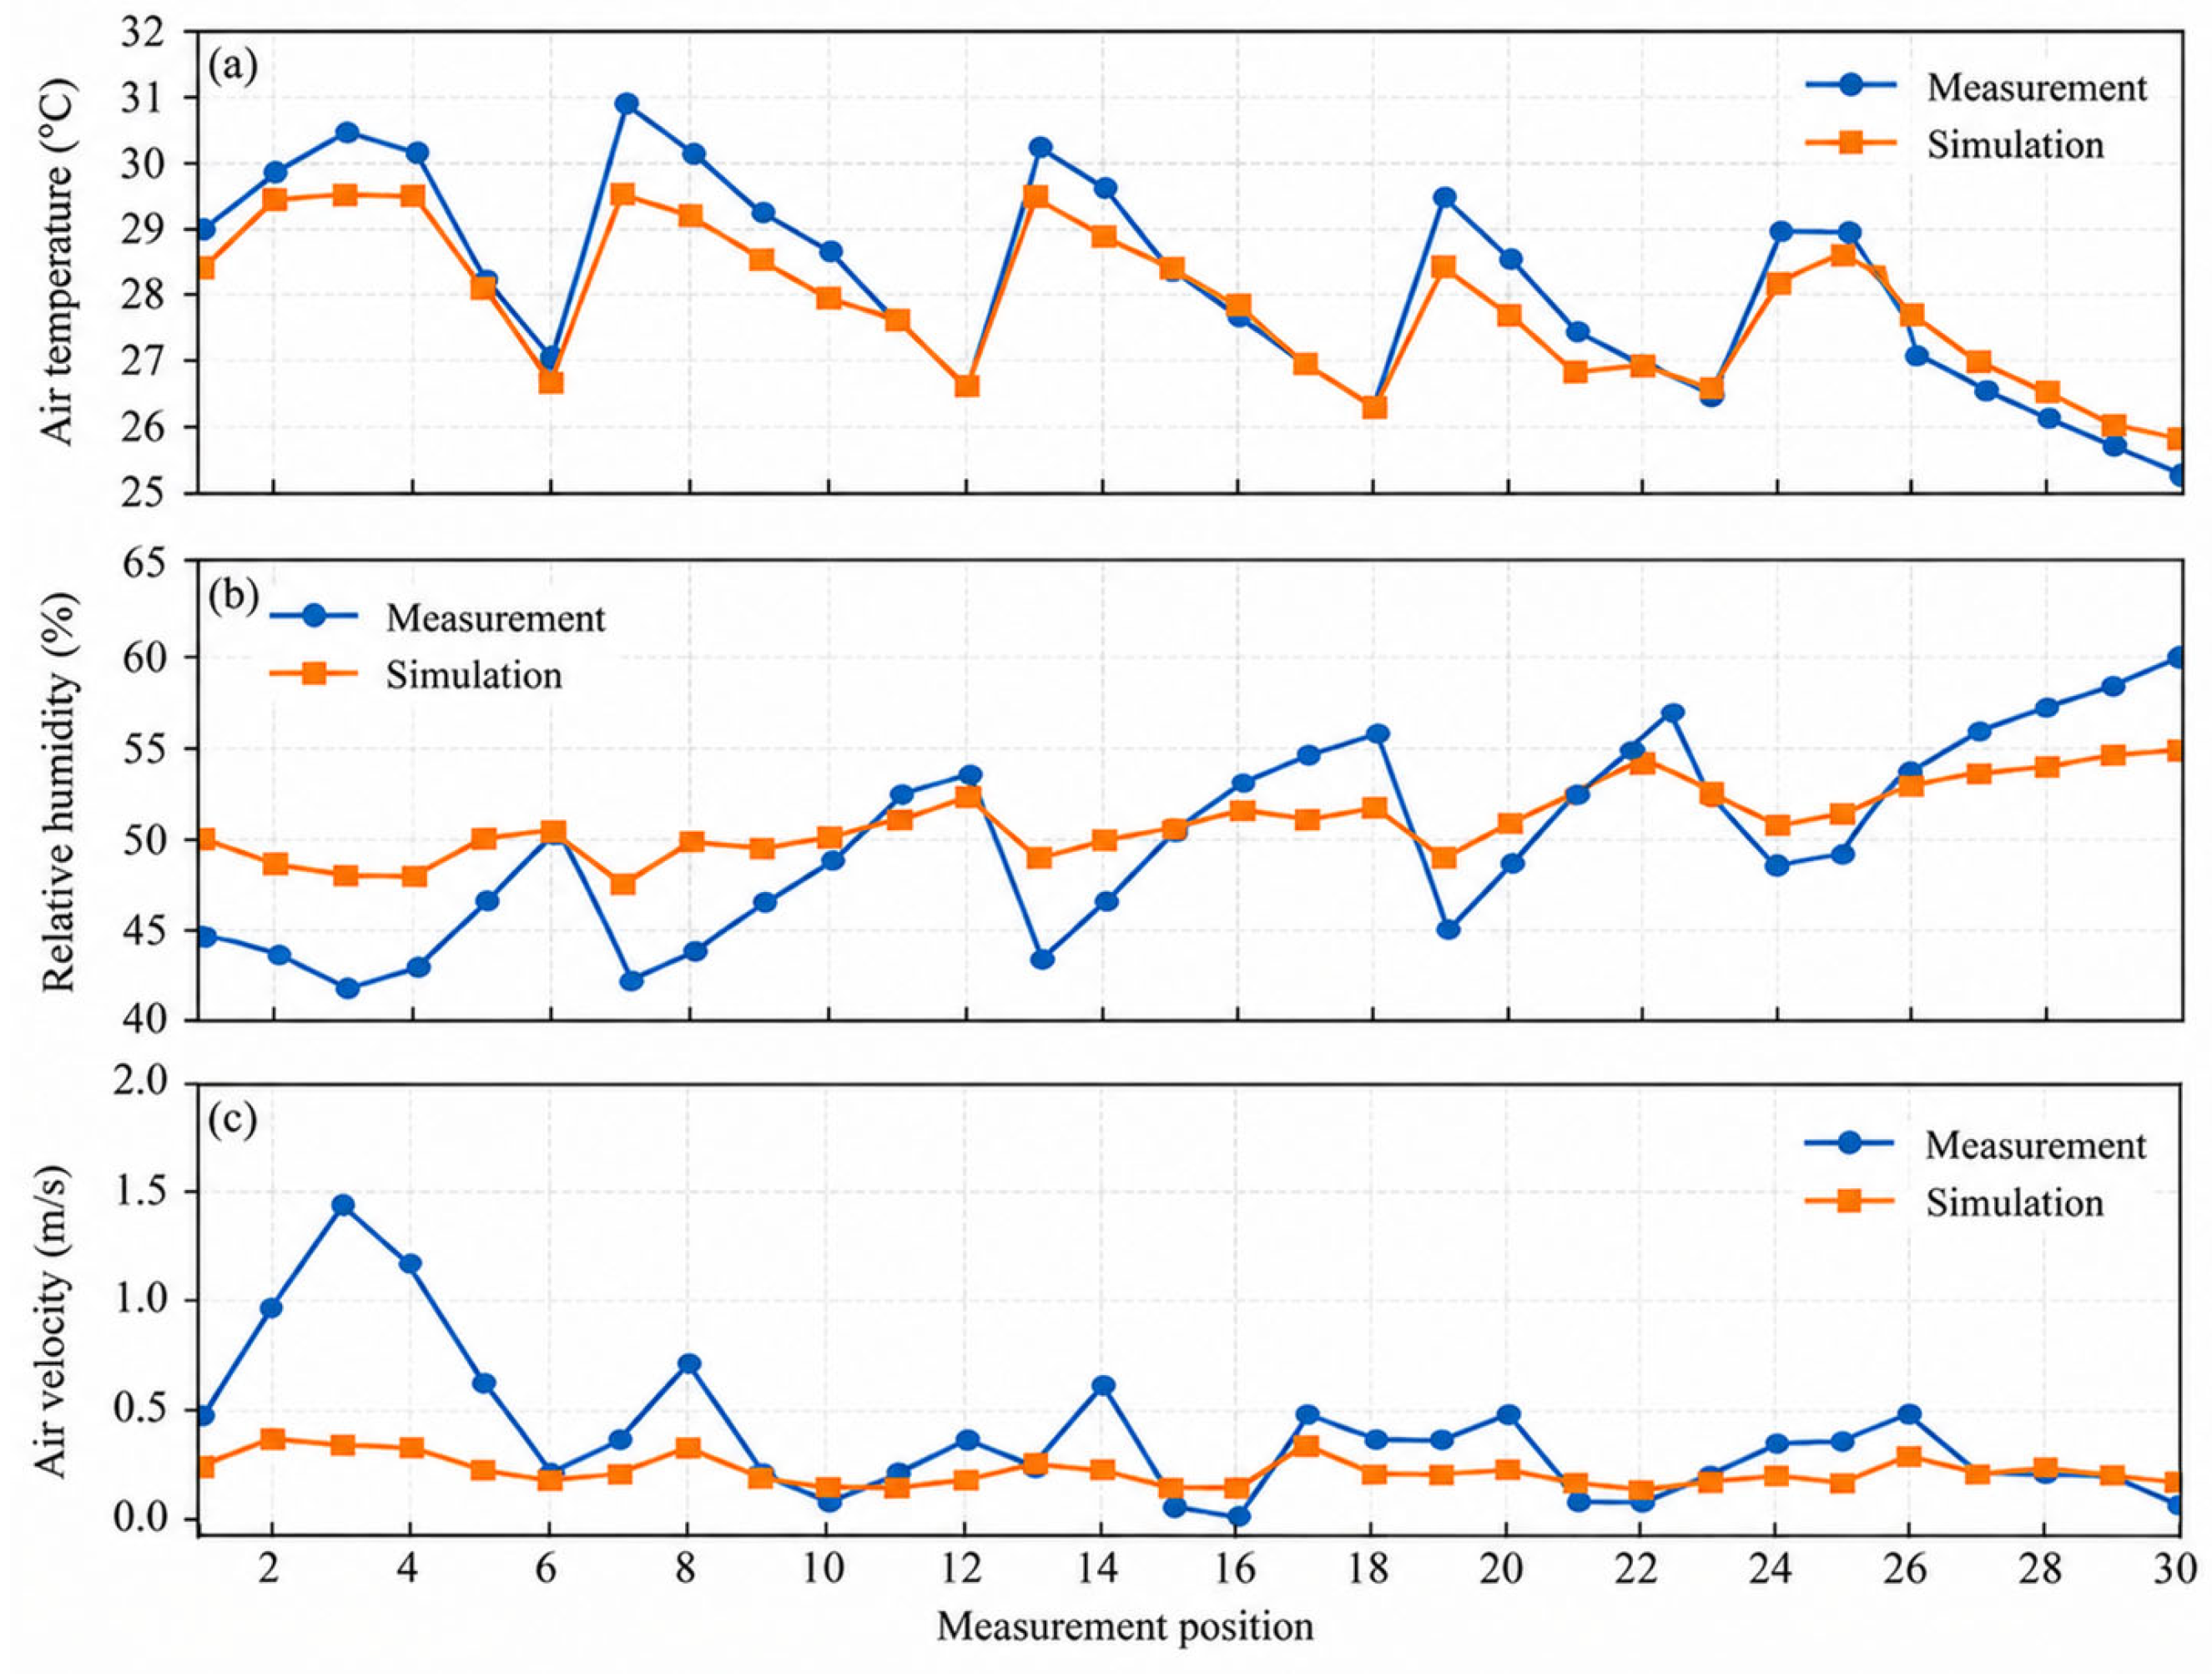
To verify the reliability of the developed model and simulation method, the measured indoor air temperature, relative humidity, and air velocity were compared with the corresponding simulation results obtained from Design Builder, as shown in Figure 11. Since Design Builder calculates environmental parameters based on thermal zones, the simulation results represent the average environmental conditions within each zone, whereas field measurements represent discrete point measurements. Therefore, the five-day averaged values at each measurement point were compared with the simulation results of the corresponding zones.
Figure 11.
Comparison between measured data and simulation results of the railway station.
As shown in Figure 11, the simulation results exhibited good agreement with the measured data. Figure 11a shows that the simulated air temperature reproduced the spatial variation characteristics of the waiting hall. The measured temperature ranged from 25.6 to 30.8 °C, while the simulated temperature ranged from 26.0 to 30.0 °C, indicating that the deviations remained within an acceptable range. Figure 11b shows a similar trend to the measurements, with measured values ranging from 42% to 60% and simulated values ranging from 41% to 56%. The errors at most measurement points were controlled within 5%, demonstrating that the model can effectively predict indoor thermal and humidity conditions.
As shown in Figure 11c, larger differences were observed, mainly because Design Builder adopts a zone-average calculation approach and therefore cannot fully capture localized airflow acceleration near entrances. In addition, actual air velocity is strongly influenced by occupant movement, door opening behavior, and transient airflow fluctuations, which are difficult to reproduce in the simulation model.
Overall, the model reproduced the measured indoor temperature and relative humidity with reasonable accuracy under the monitored closed-window operating condition. The agreement supports its use for the subsequent comparative scenario analysis. However, the short-term validation does not constitute direct field validation of the airflow distribution under all side-window opening scenarios.
4. Results and Analysis
4.1. Ventilation Performance Analysis
The Chengdu Railway Station building incorporates two potential natural ventilation configurations, including lateral window openings and roof skylights. However, under actual operating conditions, the skylights primarily serve daylighting functions and remain inactive during the natural ventilation process. Therefore, the “window opening ratio” considered in this study specifically refers to the opening ratio of the side windows integrated into the building envelope. By varying the effective opening area of the side windows, the indoor–outdoor air exchange capacity can be regulated, while all skylights were assumed to remain closed under all simulation scenarios. Based on this definition, Design Builder was employed to simulate and evaluate the indoor natural ventilation characteristics under six different side-window opening ratio scenarios. Accordingly, the present study does not investigate a separate stack-effect ventilation mode. The term “window-opening ratio” refers exclusively to the opening ratio of the operable side windows, and the results are interpreted based on the integrated airflow response predicted by the simulation model. Box plots, violin plots, and empirical cumulative distribution functions (ECDFs) were subsequently applied to characterize the variation patterns of natural ventilation rates under different window-opening strategies from multiple perspectives, including statistical distribution, probability characteristics, and overall trends.
The simulated natural ventilation rate was affected by the outdoor meteorological conditions, the pressure difference across the building envelope, and the effective opening area of the side windows. Because the present study does not separately quantify the individual contributions of wind-induced and temperature-induced pressure, the following analysis focuses on the integrated airflow response predicted under different side-window opening ratios.
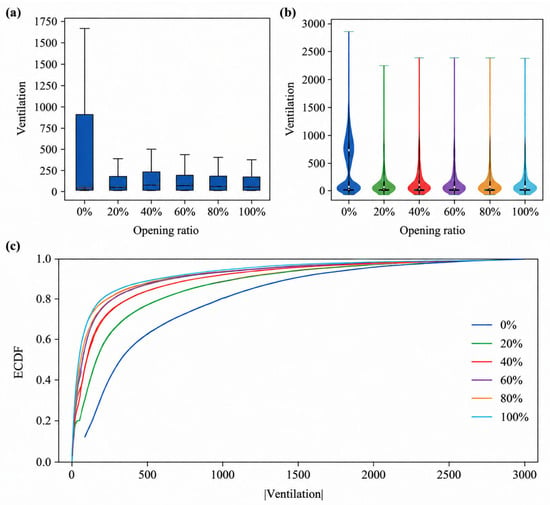
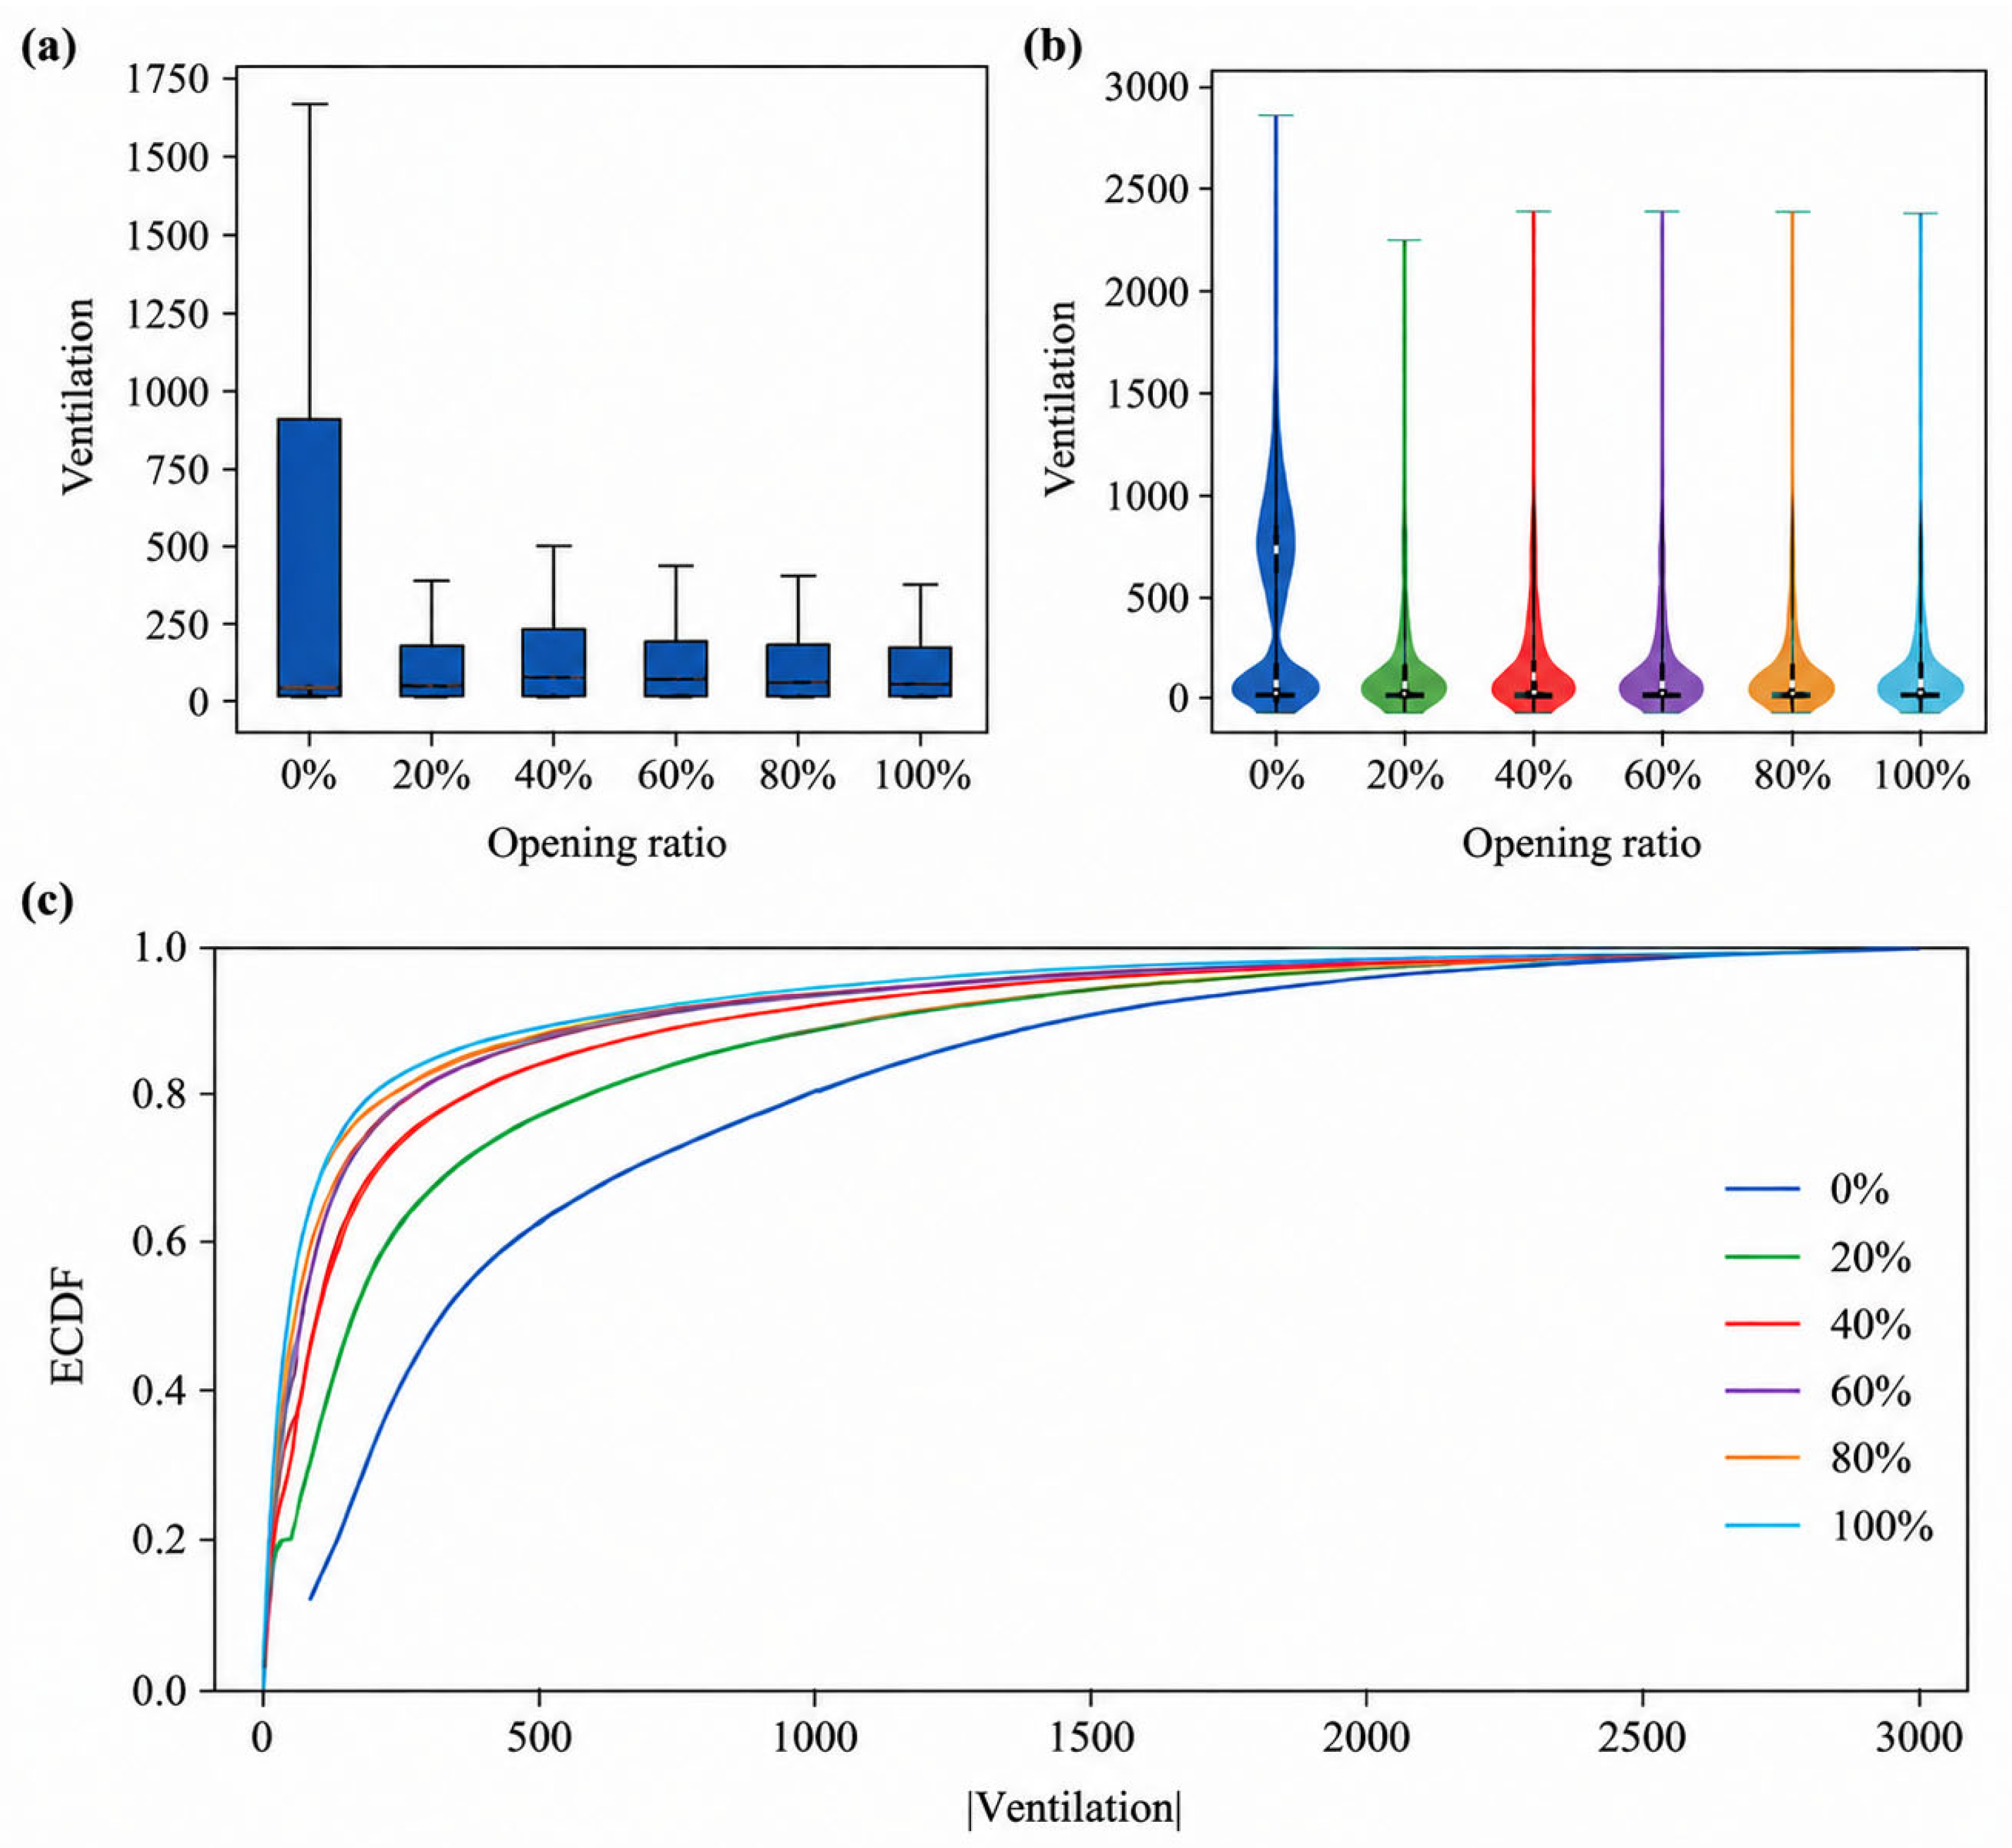
From the box plot results (Figure 12a), it can be observed that under the “doors-only” condition, the overall ventilation rate remains at a relatively low level; however, a small number of extremely high values still occur, indicating that short-term enhanced ventilation may arise under specific meteorological conditions or transient pressure differences. As the window opening ratio increases, the ventilation distribution changes, whereas the median ventilation rate does not exhibit a proportional increase. The interquartile ranges remain relatively stable across the window-opening scenarios, suggesting that the system predominantly operates at low-to-moderate ventilation levels, with high ventilation rates occurring only intermittently.
Figure 12.
Statistical characteristics of simulated natural ventilation rates under different side-window opening ratios: (a) box plots; (b) violin plots; (c) empirical cumulative distribution functions (ECDFs).
The violin plot (Figure 12b) further reveals the probabilistic distribution characteristics of ventilation rates. All cases exhibit a clear right-skewed distribution, where low ventilation rates dominate the probability density, while high ventilation rates form a long-tailed distribution. This pattern reflects the inherent stochastic nature of natural ventilation: the dominant state is governed by weak wind conditions or low pressure differences, whereas high ventilation events are generally associated with favorable outdoor meteorological conditions and temporarily increased pressure differences across the building envelope. With the opening of the side windows, the probability distributions change noticeably, whereas the differences among the 20–100% opening scenarios remain relatively limited. This indicates that increasing the window opening ratio does not necessarily produce a proportional enhancement in ventilation performance, while substantial temporal variability is maintained under all scenarios.
The ECDF curves (Figure 12c) further confirm the differences in the ventilation distributions from a cumulative probability perspective. The 0% side-window opening scenario exhibits a distinctly broader distribution and a slower increase in cumulative probability, consistent with the pronounced high-value tail observed in Figure 12a,b. In contrast, once the side windows are opened, the ECDF curves rise more rapidly in the low-value range and become more closely grouped, indicating that most ventilation events are concentrated within a comparatively narrower range. In particular, under the 80% and 100% scenarios, the curves tend to converge, indicating that once the window opening ratio exceeds a certain threshold, improvements in ventilation performance exhibit diminishing marginal returns.
Therefore, under the modeled climatic and operational conditions, fully opening all side windows was not necessary to obtain most of the ventilation benefit. Opening ratios of 60–80% captured the majority of the predicted ventilation improvement, while the difference between the 80% and 100% scenarios was limited. An opening ratio of approximately 80% can therefore be regarded as a practical upper operating threshold for this station configuration.
4.2. Thermal Comfort Analysis
In this study, annual natural ventilation simulations of Chengdu Station were conducted using Design Builder, and hourly indoor temperature data under different ventilation scenarios were obtained. To quantitatively evaluate the cooling performance of natural ventilation, an hourly based statistical method was adopted. When the simulated indoor temperature exceeds the upper threshold of the thermal comfort range, the condition is defined as overheating, and the corresponding hours are classified as high-temperature hours. When the indoor temperature falls within the acceptable thermal comfort range, the condition is defined as comfortable, and the corresponding hours are classified as comfortable hours. In addition, when the temperature is ≥28 °C and relative humidity is ≥80%, discomfort is also assumed due to high humidity, even if the temperature does not exceed the upper limit; such conditions are likewise included in the high-temperature hour statistics. Based on these indicators, the number and monthly proportion of high-temperature and comfortable hours under different ventilation scenarios are analyzed to comprehensively evaluate the cooling effectiveness of natural ventilation.
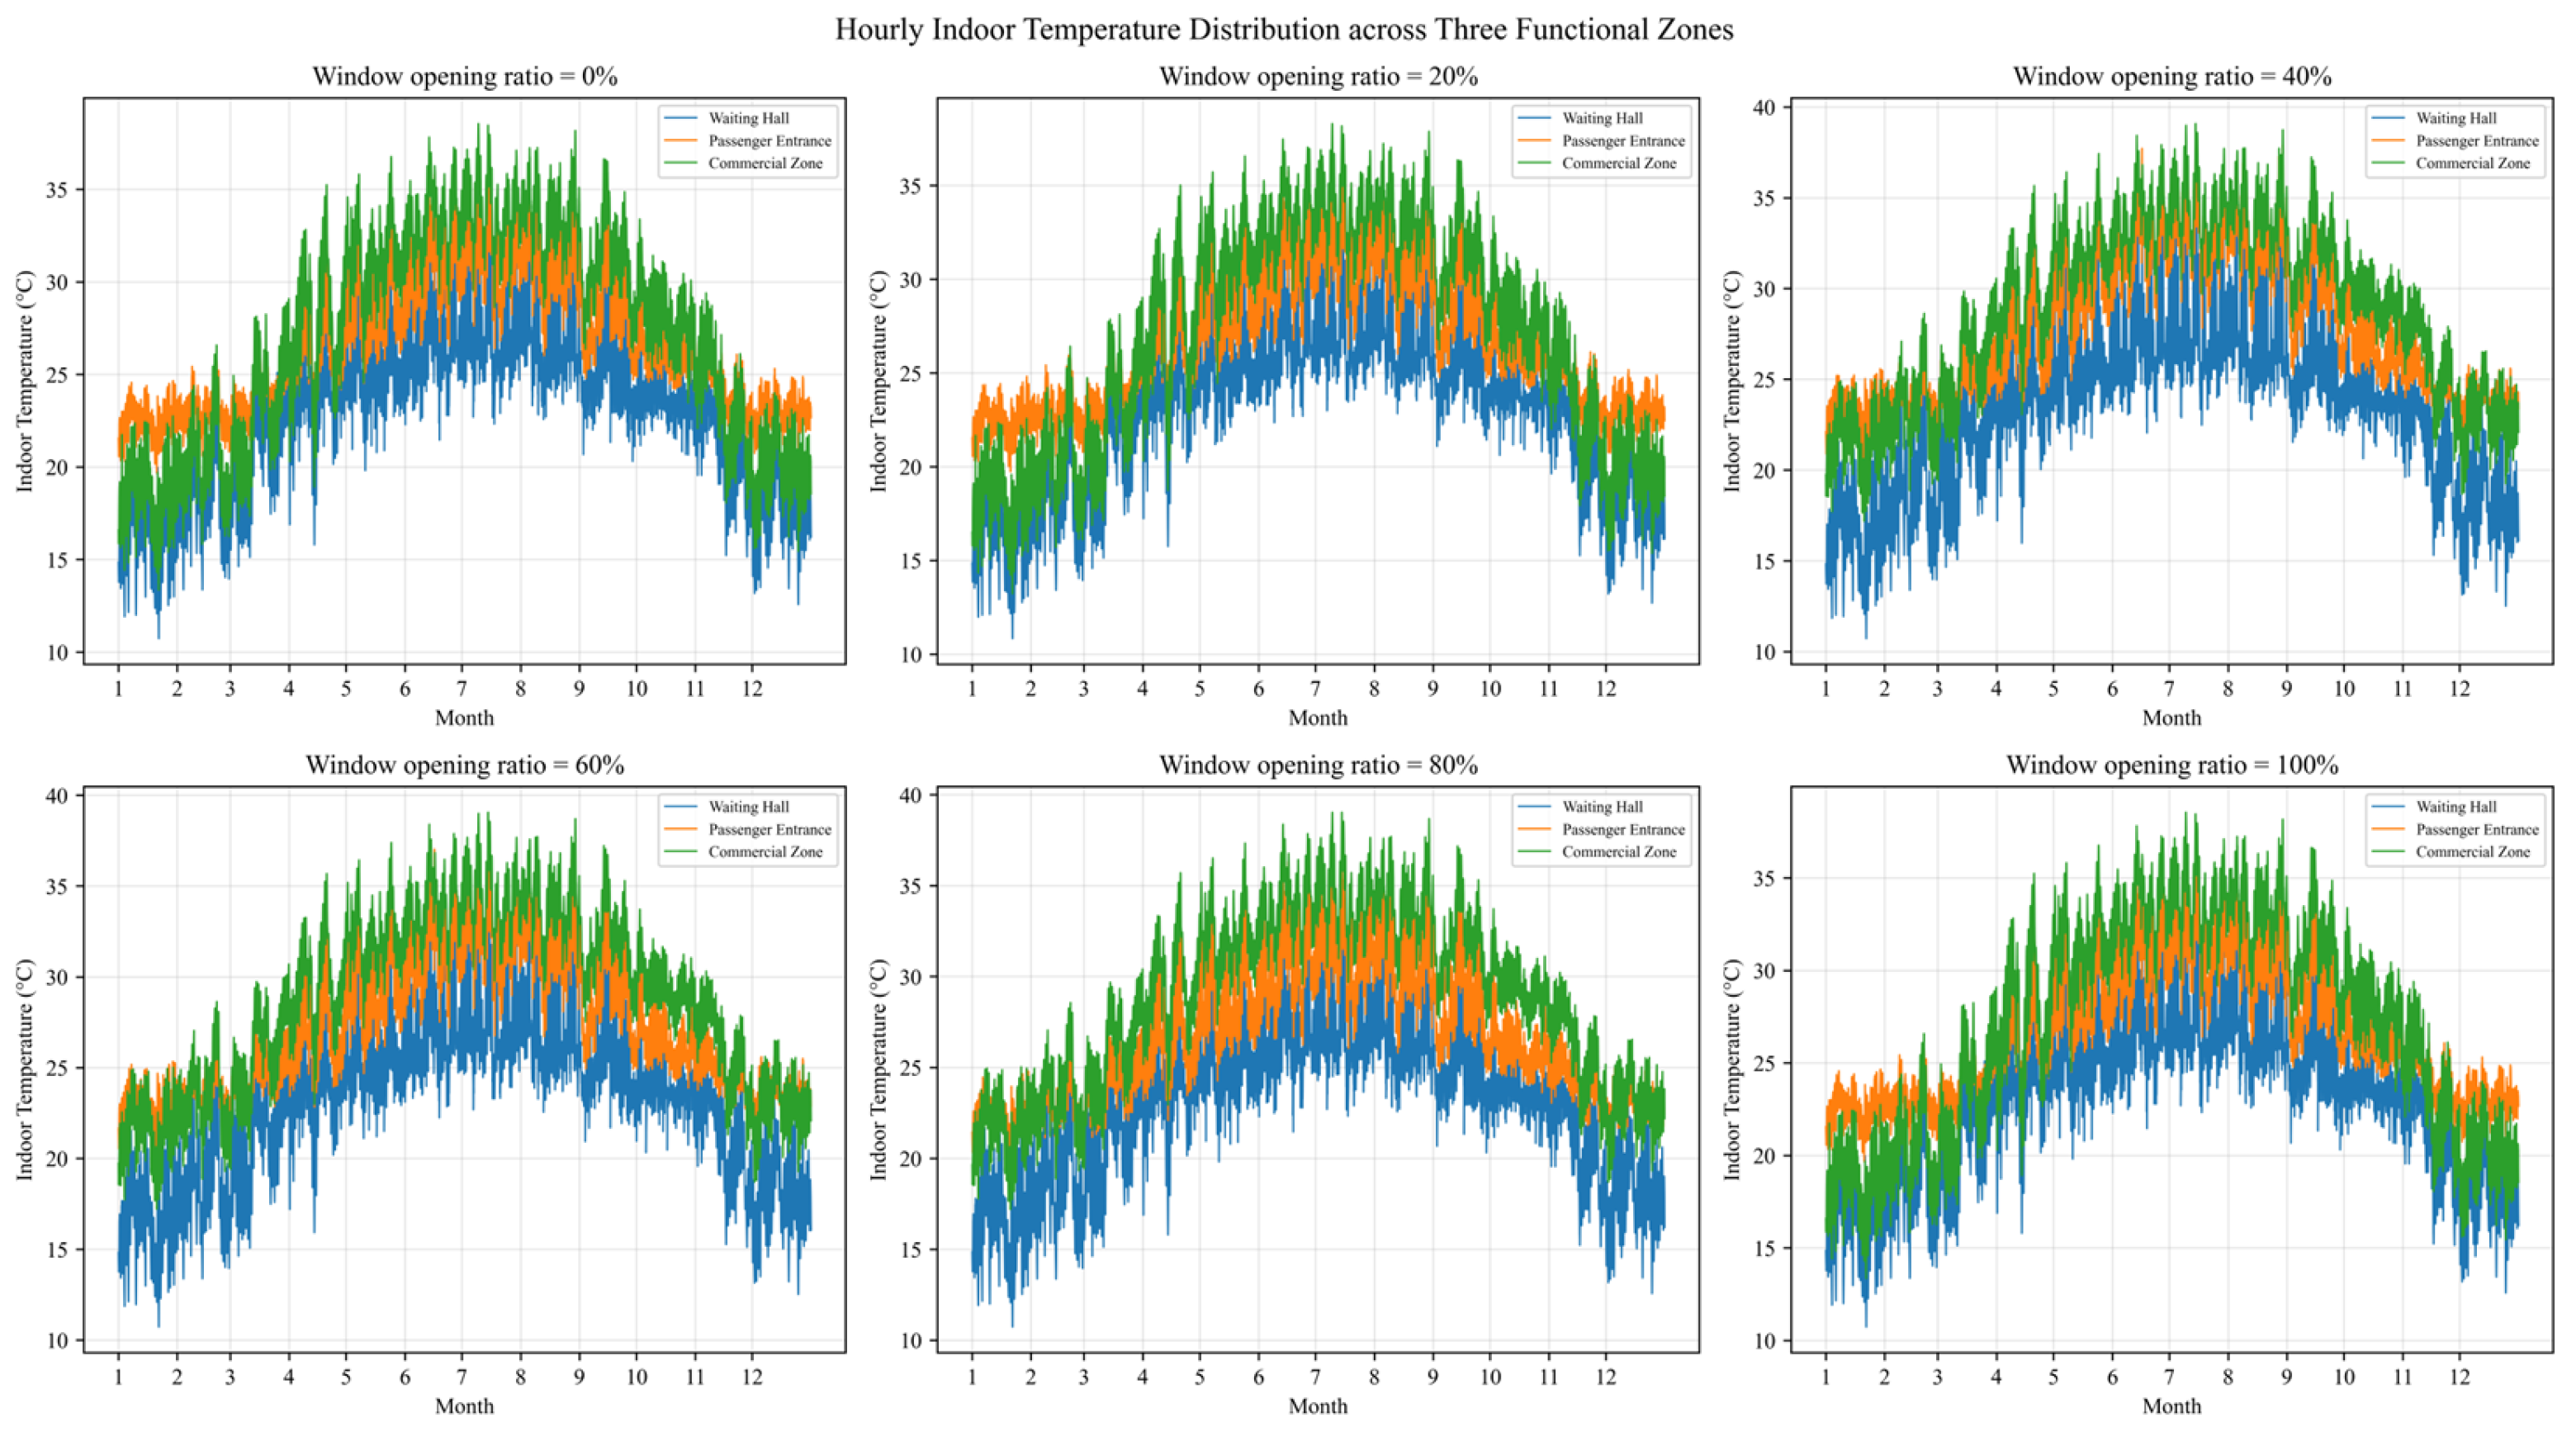
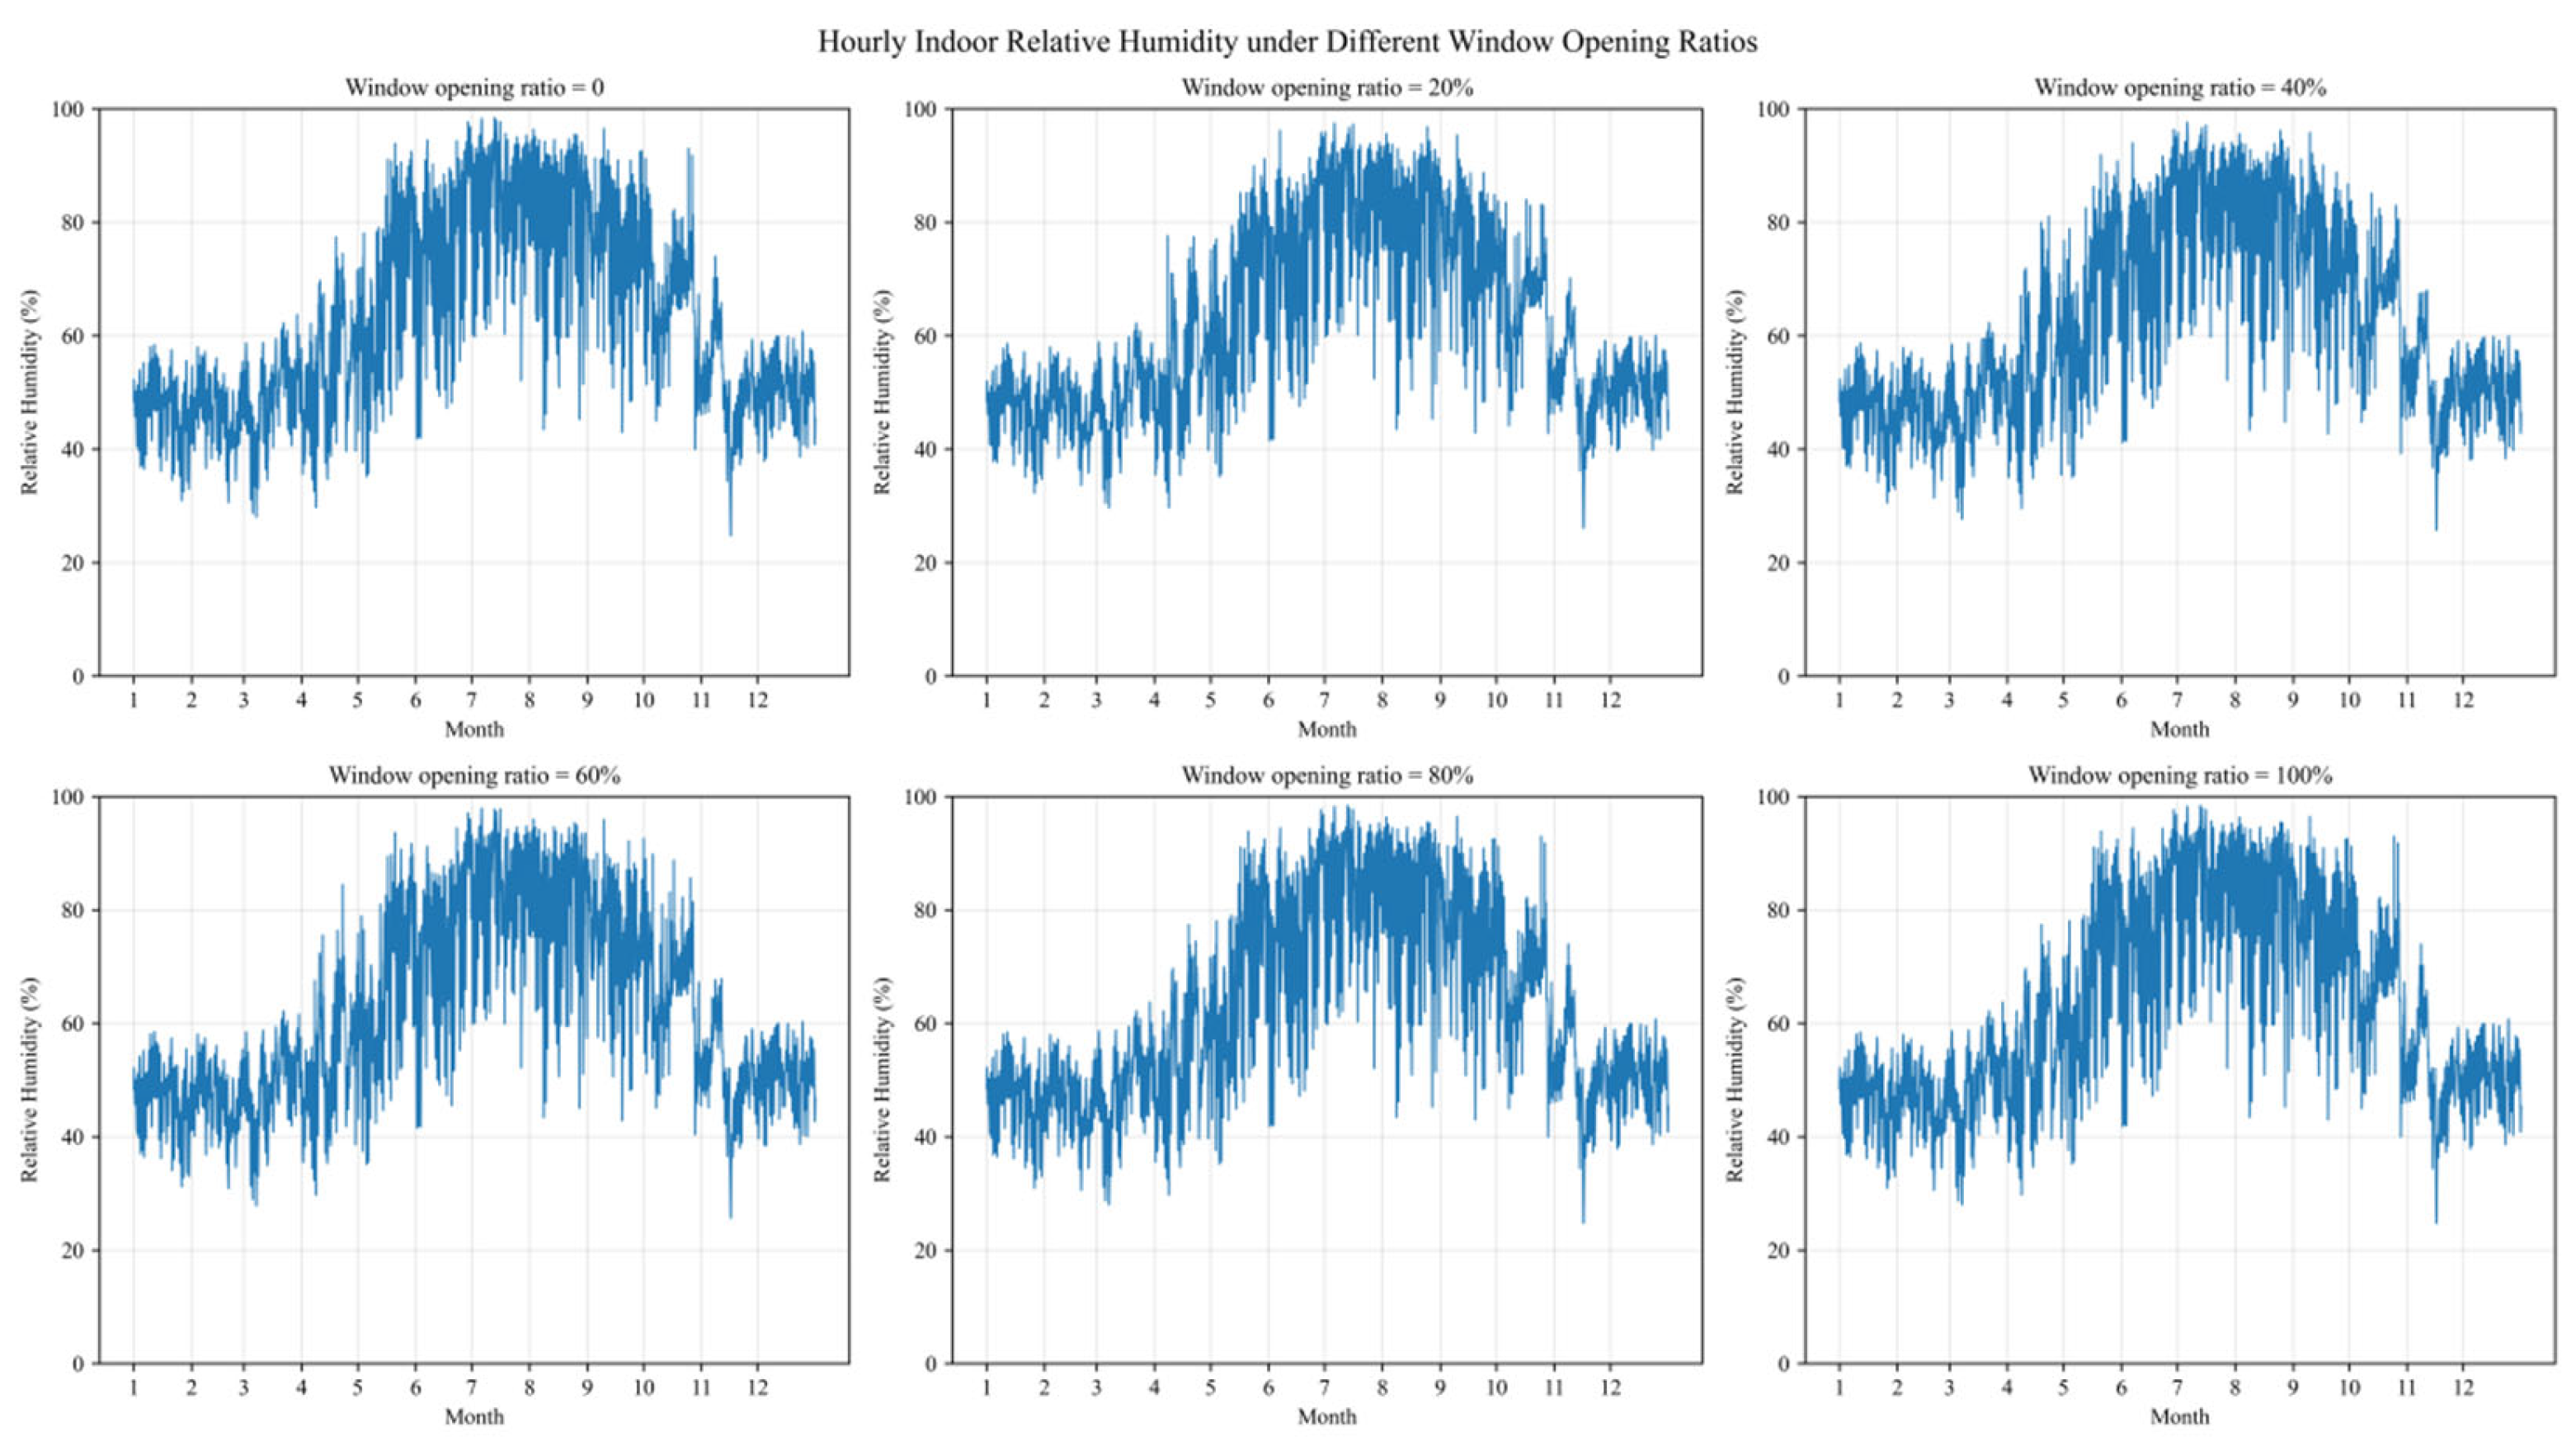
To capture the annual variation characteristics of the indoor thermal environment in the waiting hall, hourly temperature and humidity data were first extracted for the main functional zones, including the central waiting hall, departure hall, and commercial area. Based on these data, the overall average indoor temperature of the waiting hall was calculated and used as the basis for subsequent analysis, as shown in Figure 13 and Figure 14.
Figure 13.
Monthly average temperature statistics of the waiting hall (including central waiting hall, departure hall, and commercial area) under different scenarios.
Figure 14.
Monthly average humidity statistics of the waiting hall under different scenarios.
A full-year simulation of natural ventilation in the large-scale railway station was conducted for Chengdu Station. Over the 8760 h of a year, the proportion of high-temperature hours in the central waiting hall, departure hall, and commercial area was calculated under different scenarios. The average proportion of high-temperature hours in the waiting hall was then obtained, as shown in Table 7.
Table 7.
High-temperature hour ratio under different natural ventilation scenarios.
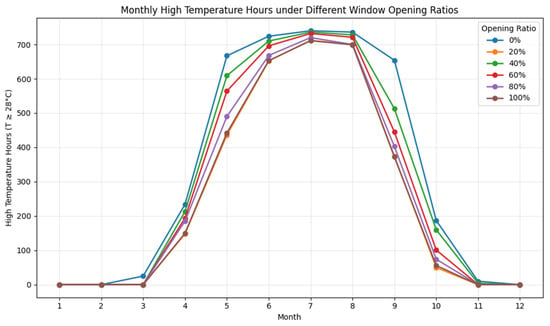
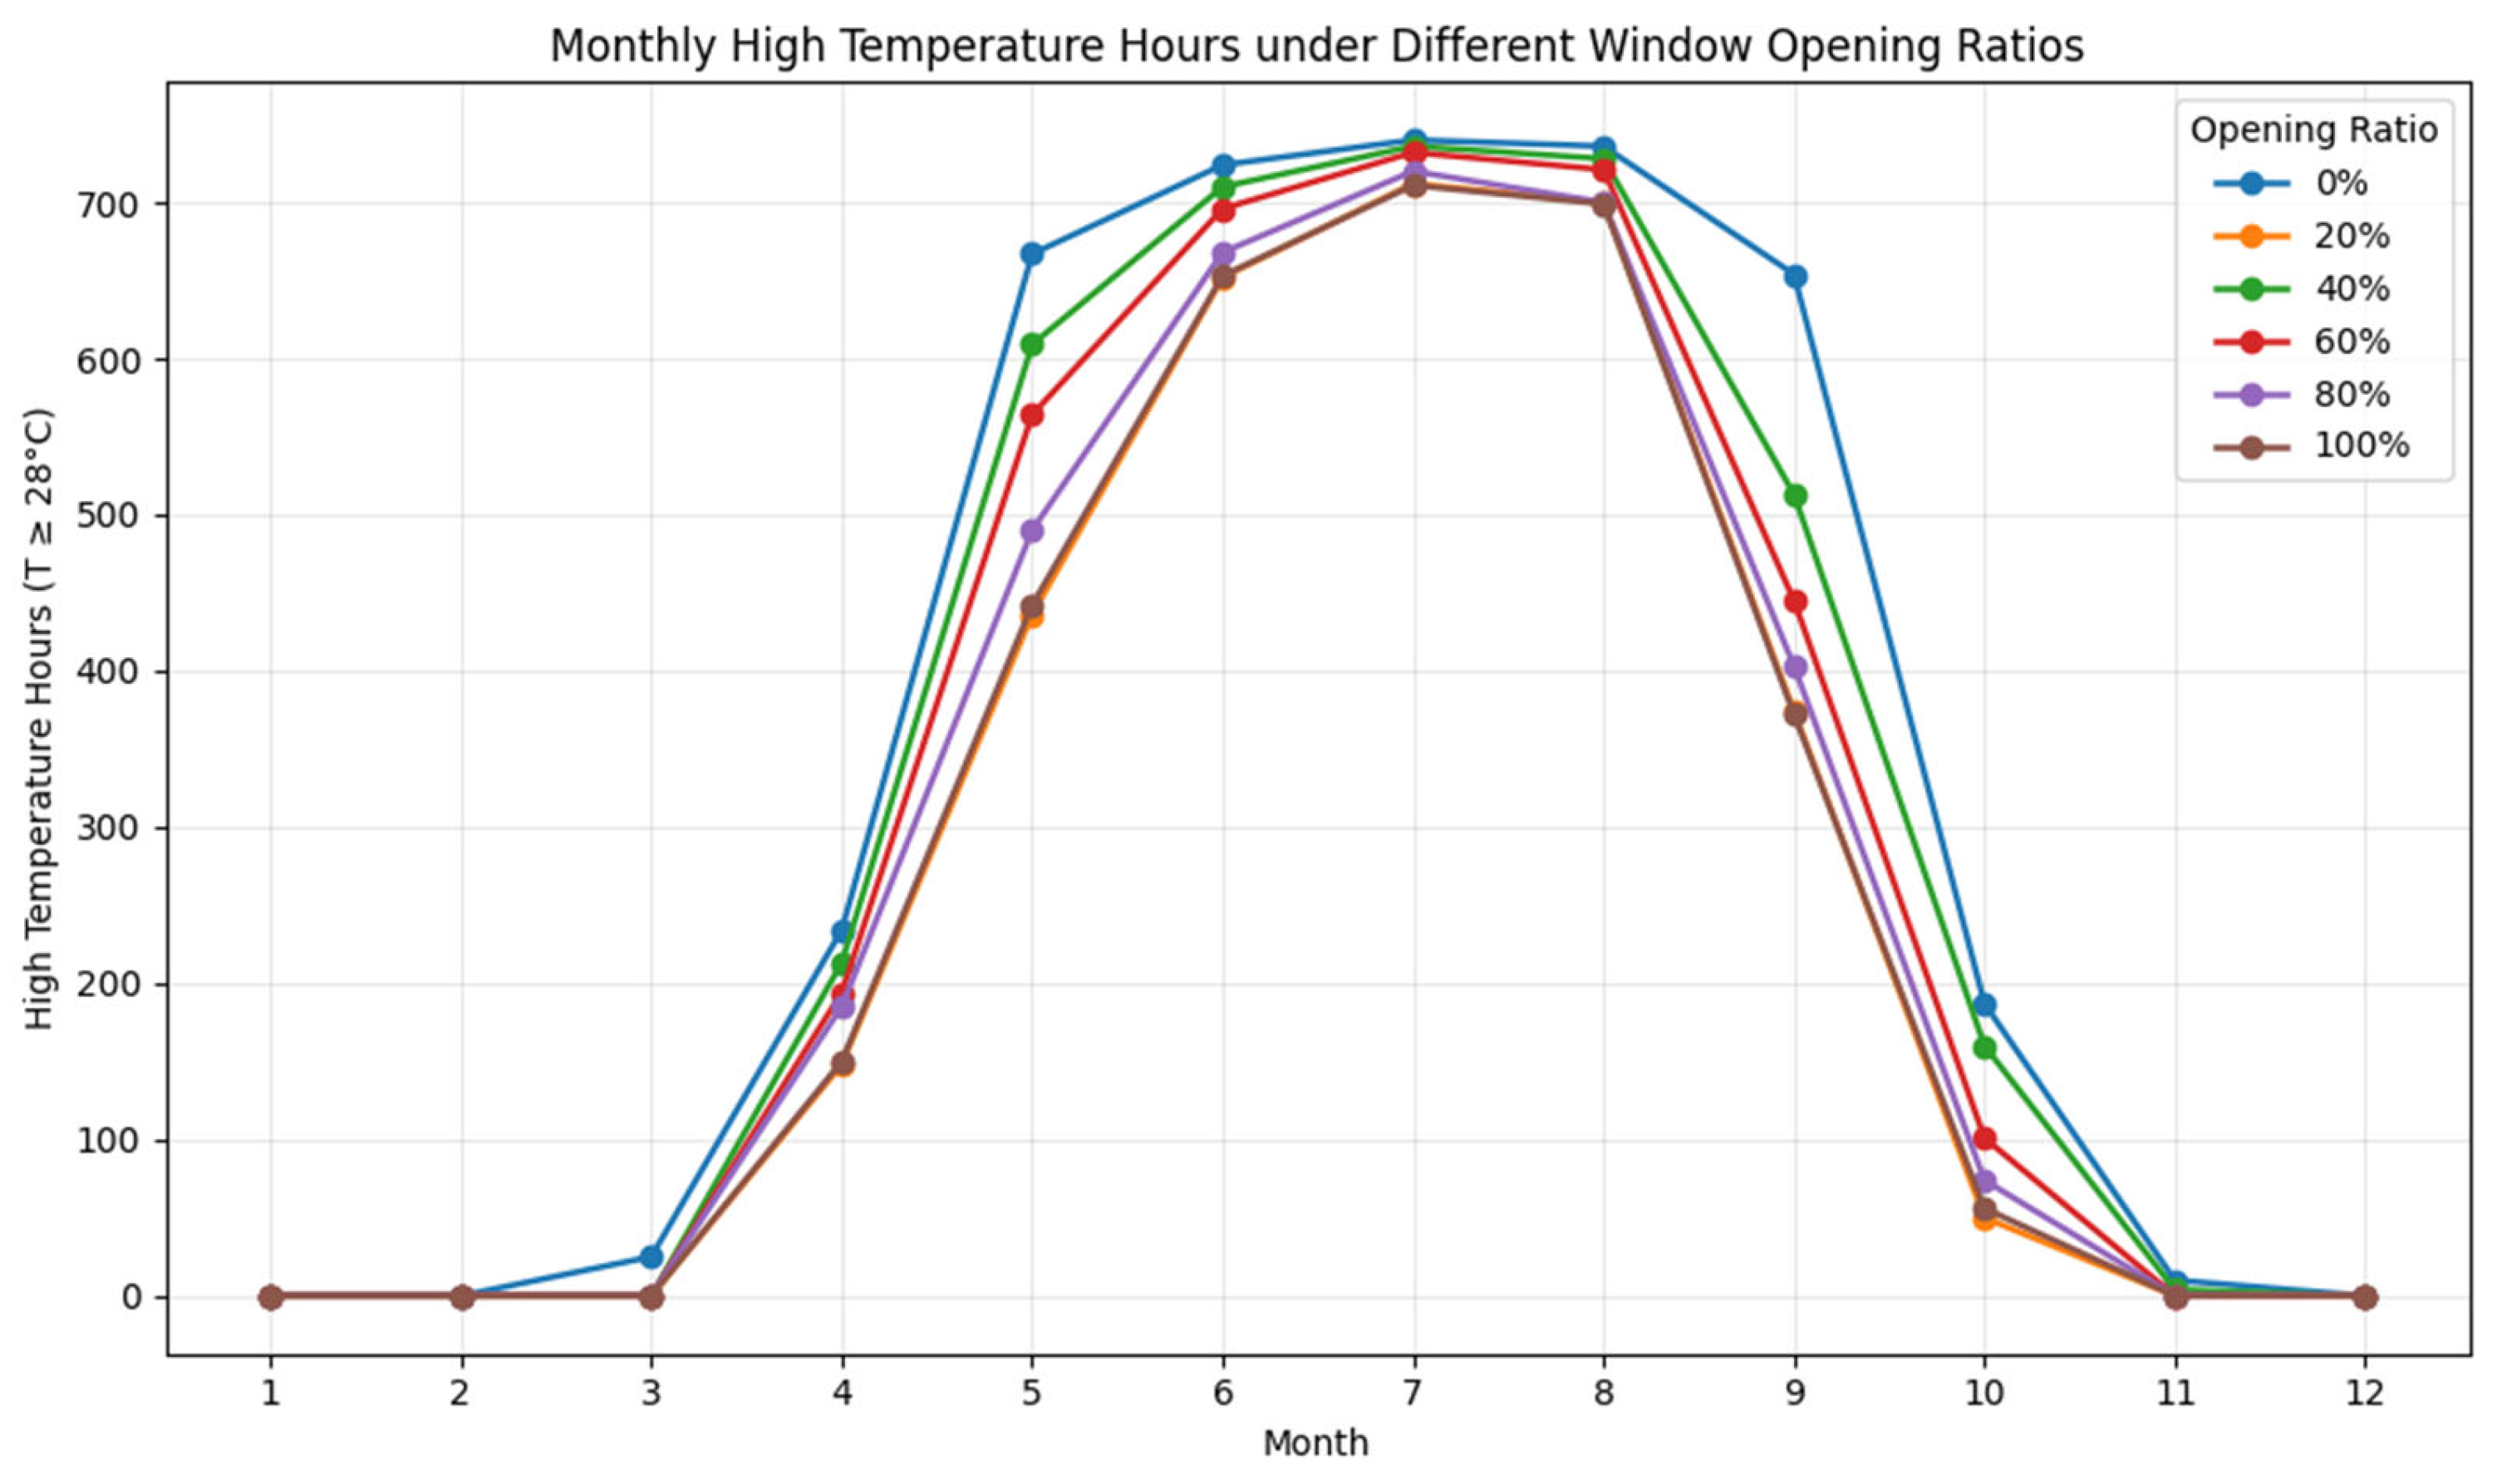
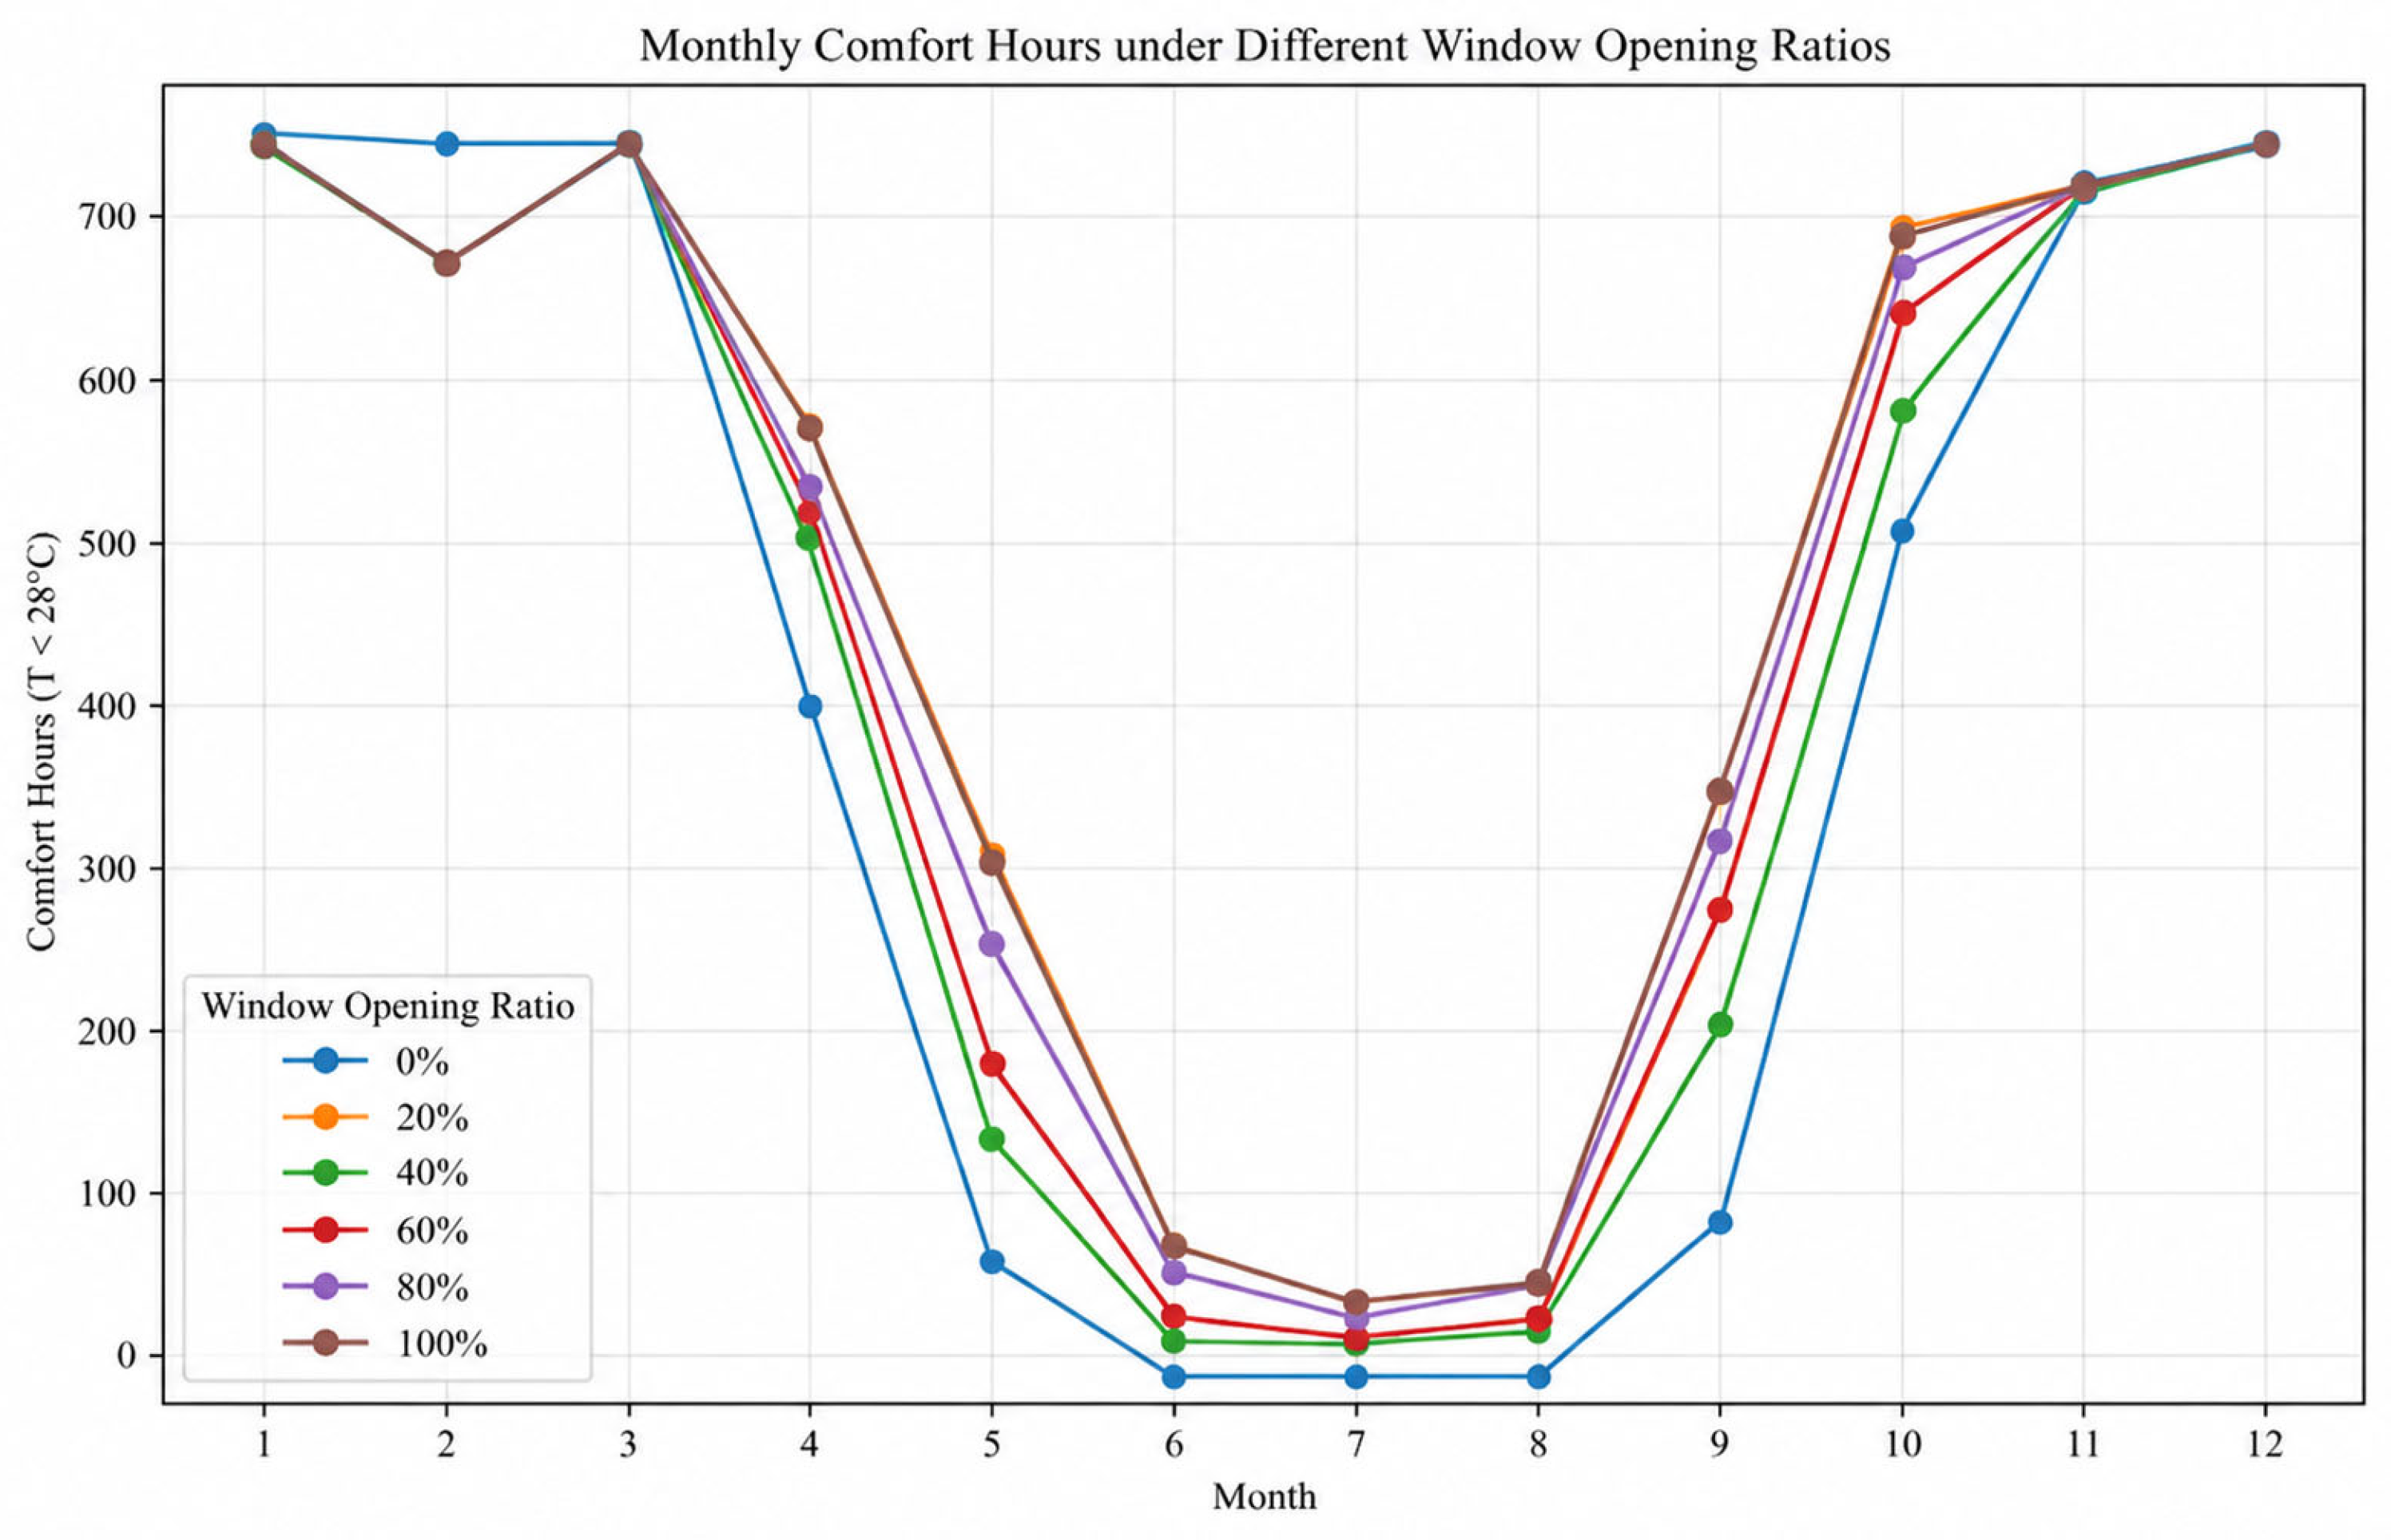
The annual numbers of high-temperature hours and comfortable hours under different scenarios are shown in Figure 15 and Figure 16.
Figure 15.
Annual variation in high-temperature hours under different scenarios.
Figure 16.
Annual variation in comfortable hours under different scenarios.
Overall, the results indicate that the indoor thermal environment of Chengdu Station is highly sensitive to the window opening ratio, while the response relationship exhibits strong nonlinearity and clear interval dependency. During summer high-temperature periods, the variation in high-temperature hours with increasing opening ratio shows a “first increase and then decrease” trend. The range of 40–60% opening ratio corresponds to the highest thermal exposure level, indicating that under moderate opening conditions, the combined effect of external thermal disturbance and indoor heat accumulation is most pronounced. When the opening ratio further increases to 80% and above, the number of high-temperature hours decreases, although the improvement becomes limited, suggesting that the system gradually reaches a balanced state between enhanced ventilation and external heat gain.
Meanwhile, comfortable hours exhibit a complementary trend to high-temperature hours, reaching a minimum in the medium opening range and partially recovering under higher opening conditions. This reflects that strengthened ventilation contributes positively to heat dissipation and thermal stability; however, its effectiveness also exhibits diminishing marginal returns. Overall, the system demonstrates a typical three-stage response mechanism of “insufficient ventilation–amplified thermal disturbance–rebalanced enhanced ventilation”. The 40–60% range represents an unfavorable thermal condition zone, while opening ratios of 80% and above are more effective in reducing extreme overheating risk and improving annual thermal comfort. However, the 100% opening scenario provided only limited additional ventilation benefits compared with the 80% opening scenario. Therefore, a high but controlled opening ratio should be prioritized in the development of a practical operating strategy, rather than automatically adopting the fully open condition.
4.3. Natural Ventilation Optimization Strategy
For each month, the six opening scenarios were compared in terms of high-temperature hours, comfortable hours, and ventilation performance. By integrating the dual objectives of ventilation performance and thermal comfort, a monthly window opening strategy for natural ventilation in large-scale high-speed railway stations in Chengdu is proposed. In winter, a window opening ratio of 0.2 is maintained to minimize heating losses. In March, the opening ratio is increased to 0.4 to balance mild ventilation and thermal insulation. From April to May, the ratio is further increased to 0.6, which significantly reduces high-temperature hours while maintaining a high number of comfortable hours. From June to August, a window opening ratio of 0.8 is adopted, which effectively reduces summer overheating hours and demonstrates better marginal benefits compared to full opening conditions. In September, the ratio is reduced to 0.6 as cooling demand decreases. In October, a ratio of 0.4 is used, corresponding to a notable increase in comfortable hours. From November to December, the opening ratio is reduced again to 0.2. The optimized monthly window opening ratio strategy is summarized in Table 8. This dynamic strategy maximizes the energy-saving potential of natural ventilation while ensuring acceptable indoor ventilation and thermal comfort, providing a quantitative reference for the design of transportation buildings in Chengdu.
Table 8.
Monthly window opening ratio strategy for natural ventilation optimization in Chengdu.
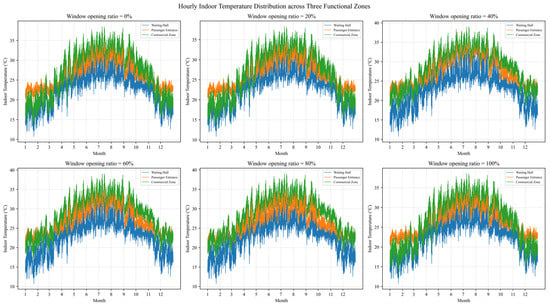
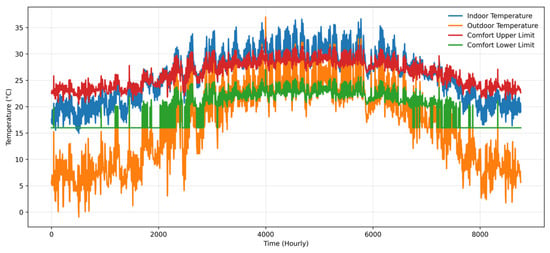
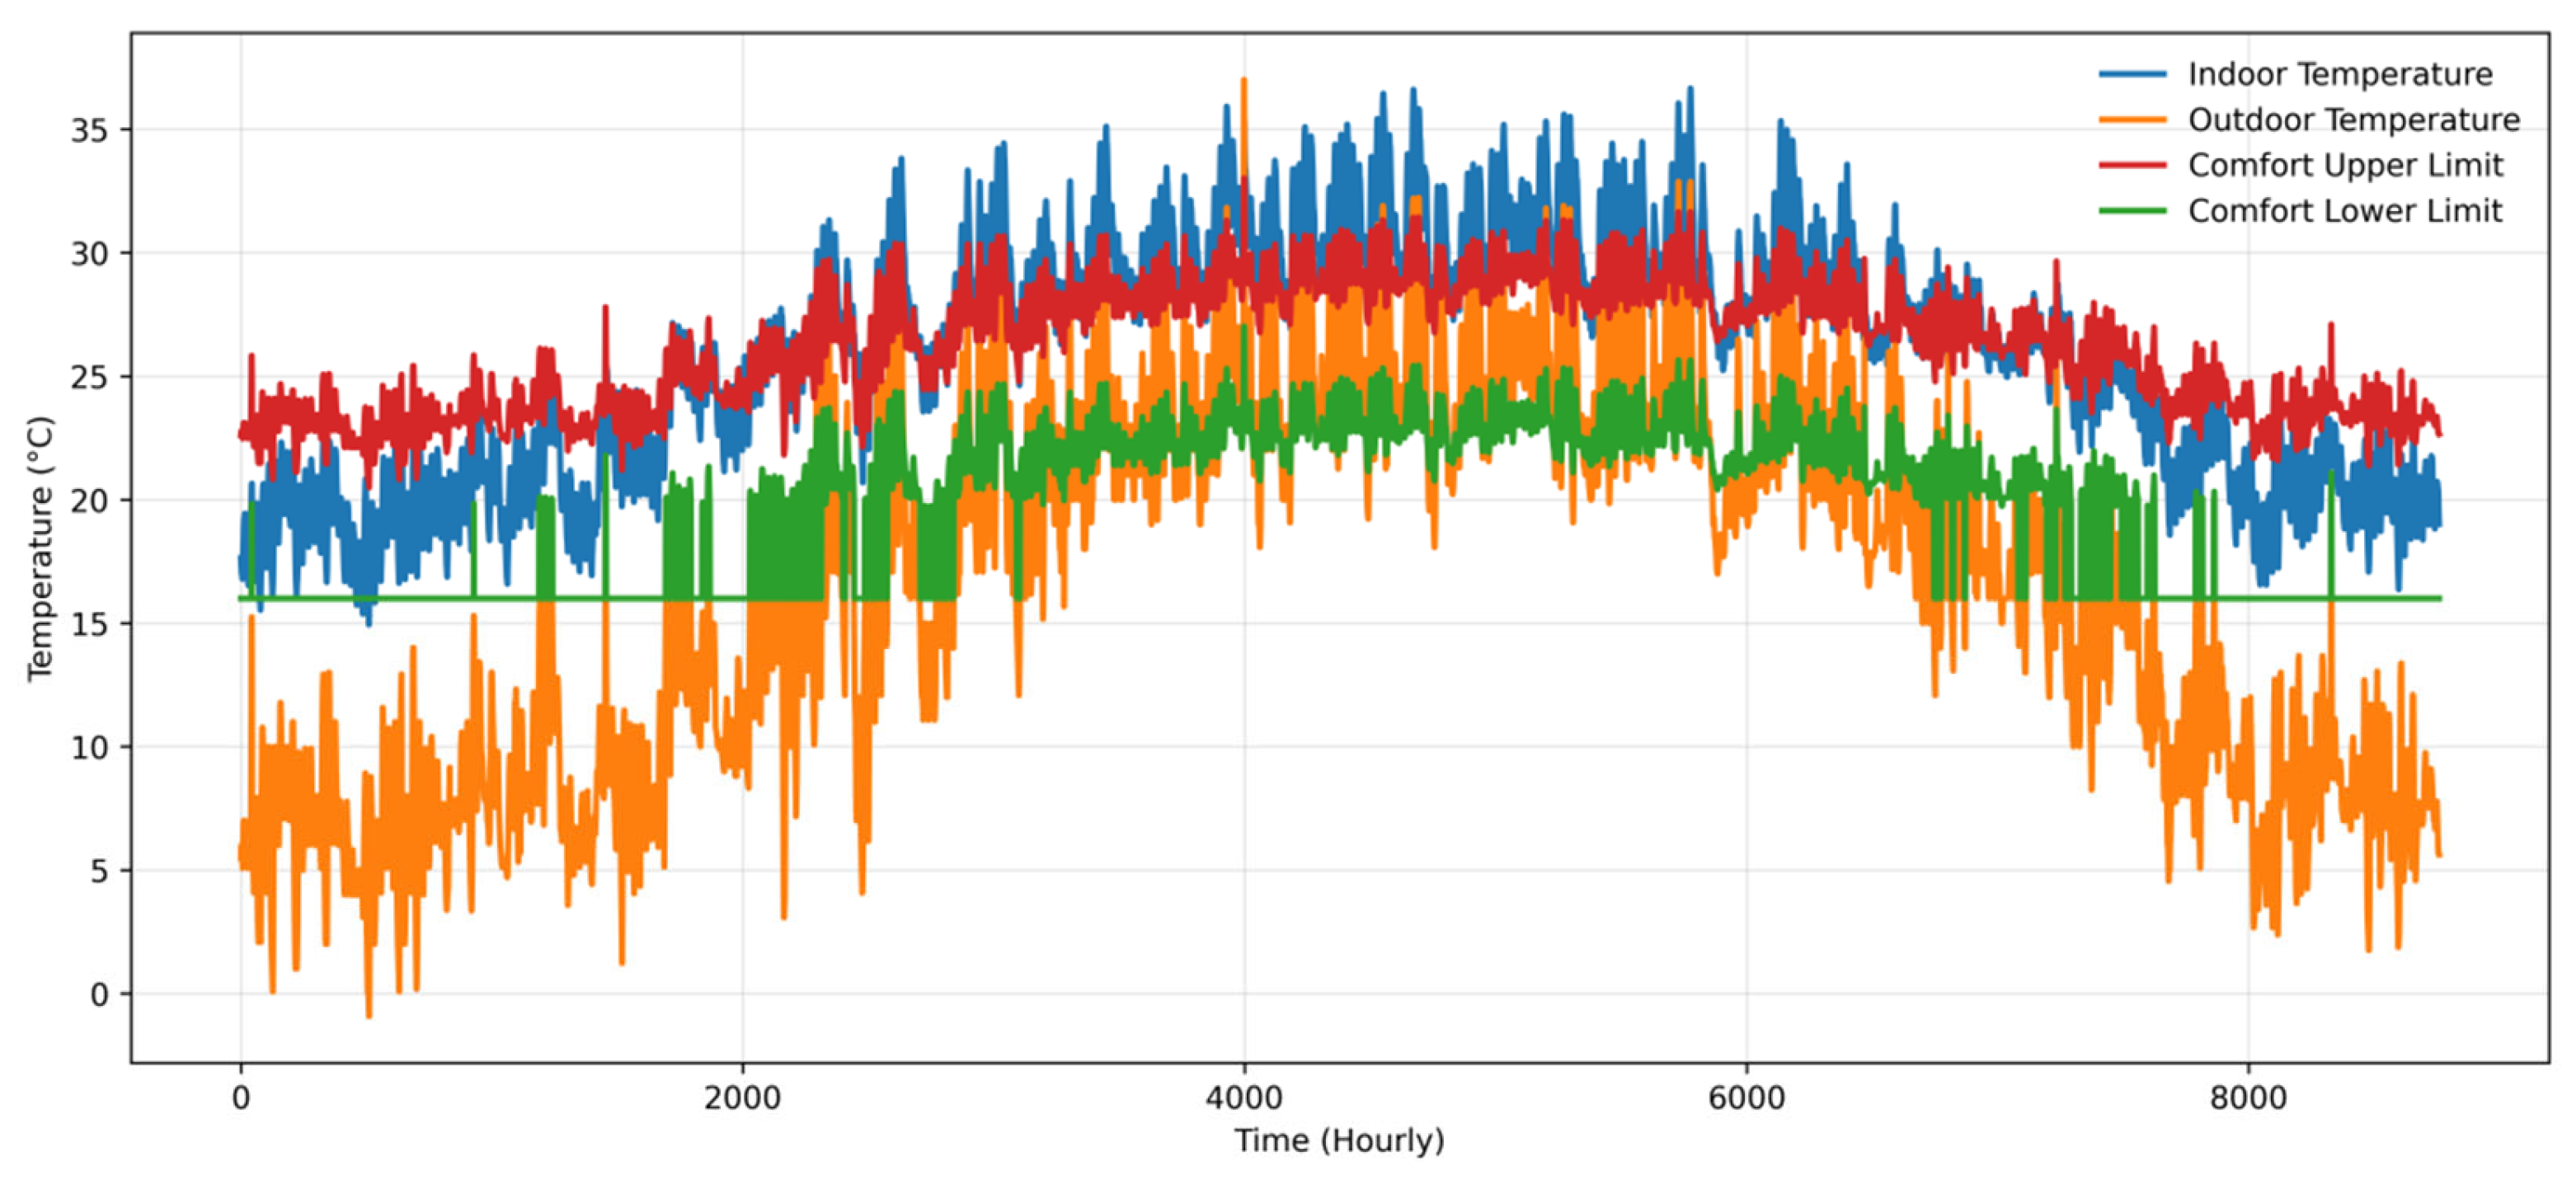
Under the proposed optimized window opening strategy, the relationship between indoor temperature and the upper and lower thermal comfort limits in Chengdu Station is shown in Figure 17. Overall, the indoor temperature remains close to the thermal comfort boundaries for most of the year and exhibits clear seasonal variations. During winter, indoor temperatures are generally above the lower comfort limit and mostly remain within the comfort range, indicating that the optimized ventilation strategy effectively maintains thermal stability and avoids excessive cooling. During the transition seasons, indoor temperatures remain largely within the comfort range, demonstrating good thermal regulation performance of natural ventilation. However, during summer high-temperature periods, indoor temperatures still exceed the upper comfort limit multiple times and may remain above the threshold for extended periods, indicating that even under the optimized ventilation strategy, the ability of natural ventilation to mitigate extreme heat remains limited and is strongly constrained by outdoor climatic conditions.
Figure 17.
Relationship between indoor hourly temperature and thermal comfort range under the optimized natural ventilation strategy.
By calculating the annual proportion of high-temperature hours under the optimized natural ventilation strategy, as shown in Table 9, it is observed that the optimized window opening strategy significantly reduces the proportion of high-temperature hours compared with all conventional scenarios, demonstrating clear advantages and effectively improving overall annual thermal risk levels.
Table 9.
Annual high-temperature-hour ratios under the fixed-opening scenarios and the proposed monthly strategy.
Compared with the doors-only baseline, the proposed monthly strategy reduced the annual high-temperature-hour ratio by 17.04 percentage points, from 33.4% to 16.36%. This corresponds to a relative reduction of approximately 51.0%.
4.4. Energy Consumption Analysis
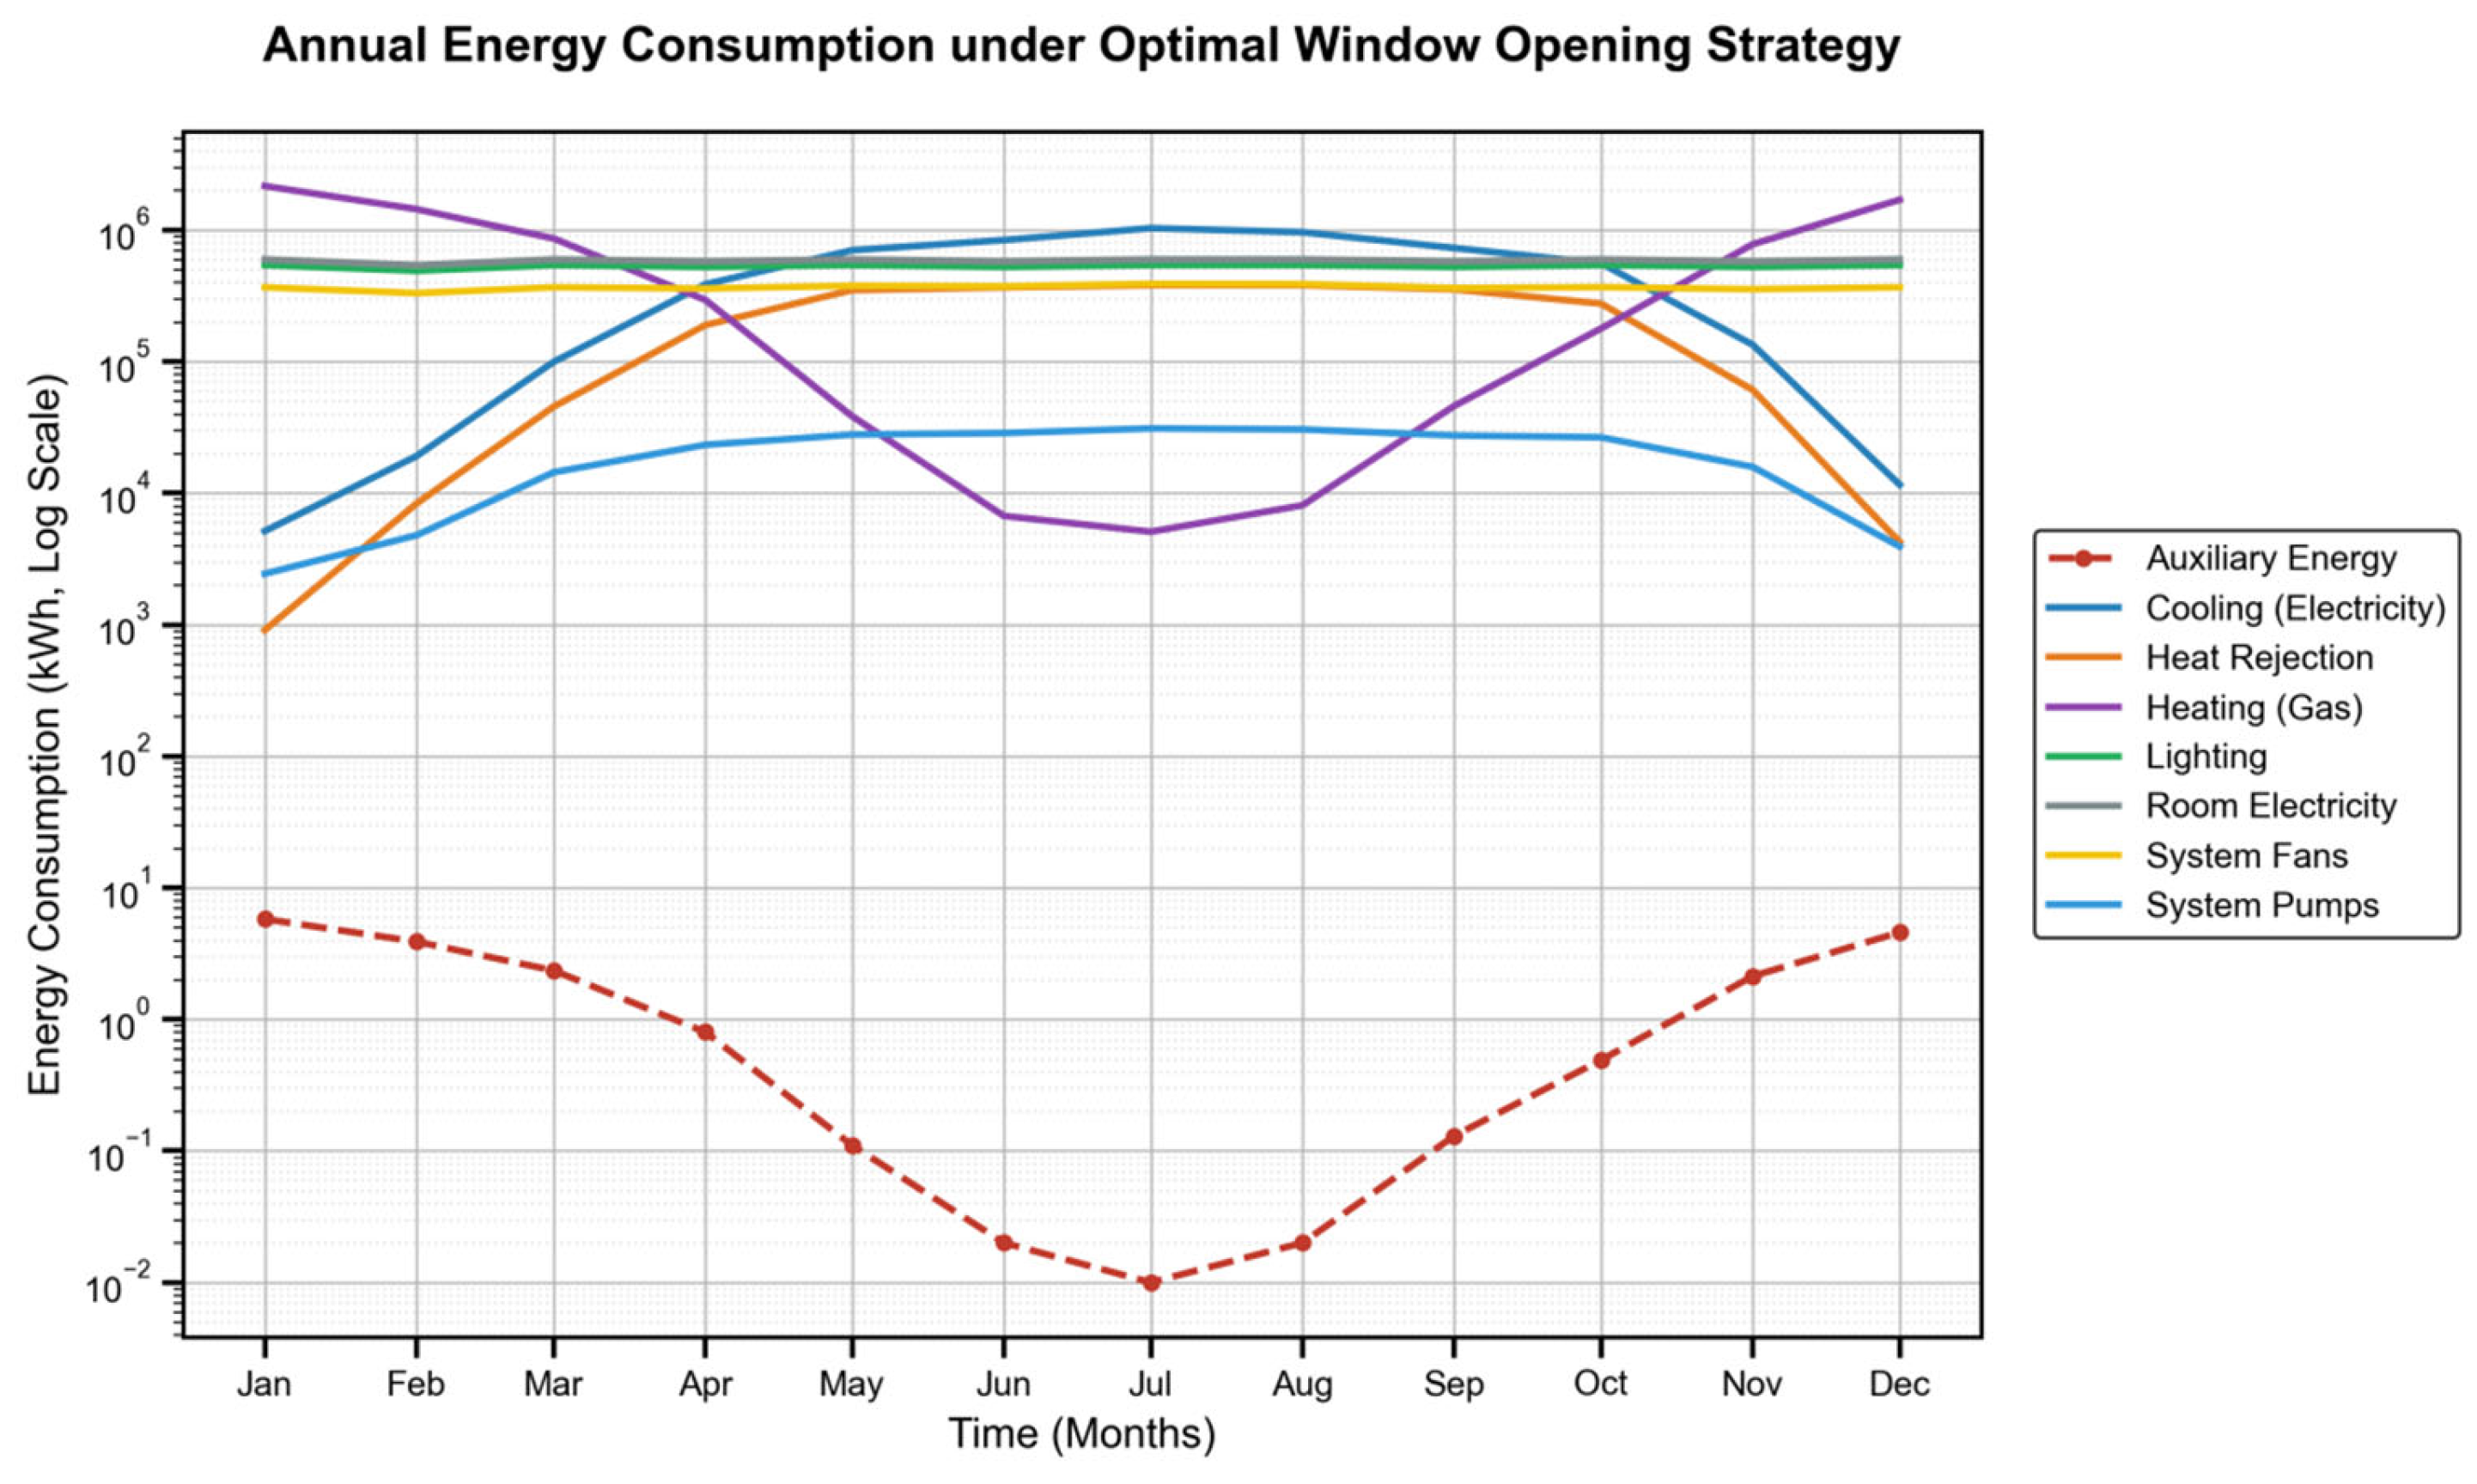
In Design Builder, the indoor design temperature of the waiting hall was set to 26 °C in summer and 18 °C in winter. Based on these boundary conditions, the monthly energy consumption throughout the year was calculated, as shown in Figure 18.
Figure 18.
Monthly variation in different energy consumption types over the year.
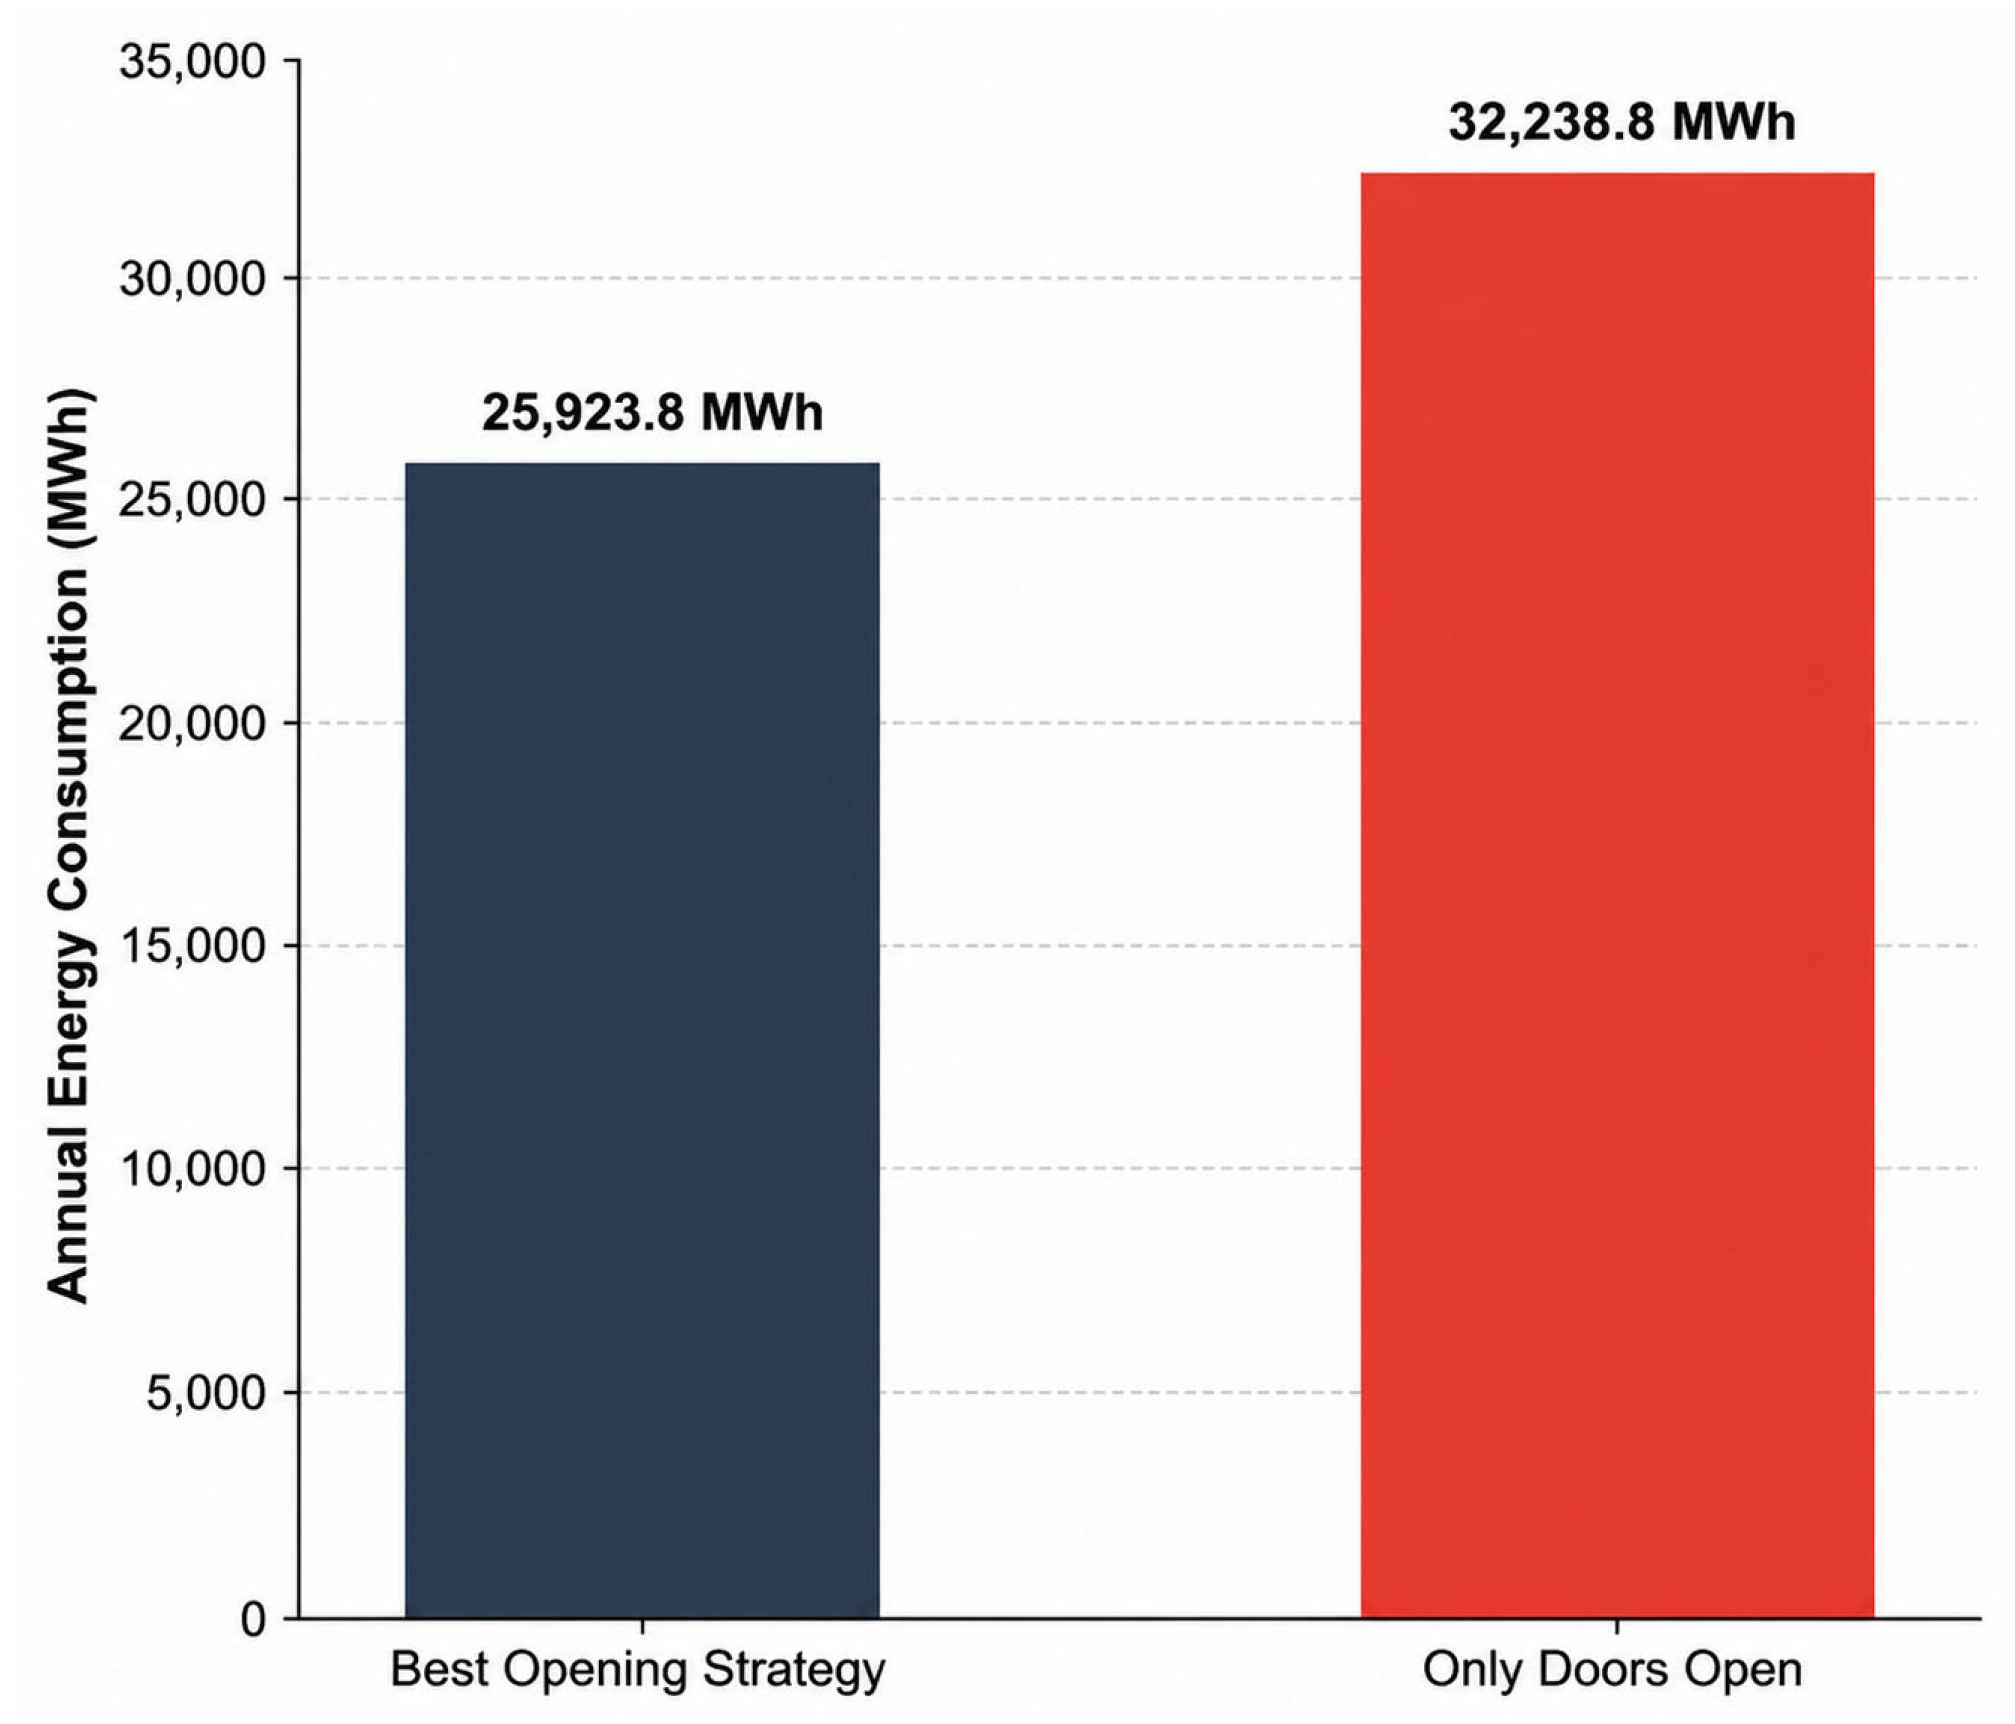
By comparing the annual building energy consumption between the optimized natural ventilation strategy and the baseline “doors-only” condition, the annual energy consumption comparison is presented in Figure 19. The total annual energy consumption under the optimized window opening strategy is 25,923.8 MWh, while that of the doors-only condition is 32,238.8 MWh. Accordingly, the overall energy consumption is reduced by approximately 19.6%.
Figure 19.
Annual energy consumption comparison between the optimal window opening strategy and the baseline scenario.
This result indicates that optimizing the window opening strategy and enhancing the participation of natural ventilation can effectively reduce the building’s reliance on mechanical cooling and auxiliary systems, thereby lowering peak summer energy demand and improving system operational efficiency. Meanwhile, although heating loads are still primarily governed by climatic conditions, the overall system demonstrates a more optimized annual energy consumption structure and improved operational stability. These simulation results indicate that a properly designed window-opening strategy may achieve substantial operational energy savings without requiring major modifications to the existing HVAC system. The actual implementation cost and operational feasibility should nevertheless be evaluated in future field applications.
5. Discussion
This study systematically reveals the seasonal and nonlinear response relationship between natural ventilation performance and indoor thermal environment in large-scale railway passenger stations located in hot-summer and cold-winter regions. The simulation results identify recommended window-opening ranges across different seasons under the modeled conditions of Chengdu Station. In particular, the findings challenge the conventional assumption that “fully opening doors and windows in summer yields the best cooling performance,” demonstrating that diminishing marginal returns occur once the window opening ratio exceeds 80%. Previous studies have generally reported that increasing effective opening area can enhance natural ventilation and thermal comfort [7,12]. The present results are consistent with this tendency at relatively low opening ratios, but further show that the marginal ventilation benefit becomes limited at high opening ratios. This finding also supports the use of dynamically controlled windows in railway station buildings rather than a fixed fully open or fully closed operating mode [21,25].
The proposed monthly window-opening strategy was derived from the simulation framework whose thermal predictions were evaluated against short-term field measurements. The strategy reduced the predicted annual high-temperature-hour ratio and total building energy consumption compared with the doors-only baseline. These findings demonstrate its potential engineering applicability, although long-term field implementation is still required to verify its actual thermal and energy performance.
From a sustainability perspective, the proposed strategy provides benefits in three interconnected aspects. First, it improves operational energy efficiency by reducing annual building energy use without requiring major modifications to the building envelope or HVAC system. Second, it improves the indoor environmental performance of short-stay public spaces by substantially reducing the annual proportion of high-temperature hours. Third, the monthly control framework replaces fixed fully open or fully closed operation with a climate-responsive strategy that can be incorporated into motorized window-control systems. These characteristics demonstrate that natural ventilation can function not only as a passive cooling measure, but also as a practical operational management approach for improving the sustainability of large transportation buildings.
However, several limitations remain in this study. First, the research is highly dependent on the specific spatial configuration of Chengdu Station and the climatic characteristics of the hot-summer and cold-winter region; its applicability to other climate zones or building typologies has not yet been fully validated. Second, the study primarily relies on software-based hourly dynamic simulations. Due to operational constraints of continuously operating elevated railway stations, long-term field measurements across multiple seasons were not conducted to further validate the simulation results. As a result, the model’s predictive accuracy under extreme weather conditions and rapidly changing wind directions still requires improvement.
Future work will focus on two main directions. On the one hand, long-term multi-point distributed environmental monitoring systems will be deployed in cooperation with station operation departments at Chengdu Station to collect field data on temperature, humidity, and wind speed, enabling dynamic calibration and parameter refinement of the existing simulation model. On the other hand, based on multi-region representative meteorological datasets, the proposed monthly dynamic regulation framework will be extended to typical transportation hubs in different climate zones. Furthermore, by integrating intelligent motorized window control algorithms, future research will explore a transition from manual monthly adjustment toward automated demand-driven control, thereby advancing an active-passive hybrid energy-saving strategy.
6. Conclusions
6.1. Research Process Summary
This study was conducted against the backdrop of the rapid expansion of China’s high-speed railway network and the increasing demand for sustainable and energy-efficient transportation infrastructure. It focuses on the high operational energy demand and the insufficient quantification of passive energy-saving potential in the large-volume spaces of railway stations located in hot-summer and cold-winter regions.
First, by integrating adaptive thermal comfort theory with current national design standards, acceptable indoor temperature and humidity thresholds for short-stay large spaces were defined, providing a scientific evaluation basis. Subsequently, Chengdu Railway Station was selected as a case study, and a three-dimensional simulation model was established using a numerical simulation platform. Based on peak passenger flow patterns and code requirements, envelope parameters and lighting loads were refined. Six ventilation scenarios, ranging from door-only opening to fully open windows and doors, were designed to conduct year-round dynamic simulations. The overall research logic ensures consistency between modeling decisions and the objective of quantifying ventilation potential and identifying optimal energy-saving pathways.
6.2. Key Findings
The results clearly reveal a nonlinear seasonal response of indoor thermal conditions to natural ventilation intensity. The influence of window-opening ratio exhibits strong seasonal variability. In winter, excessive ventilation leads to significant heating energy losses, and maintaining a low side-window opening ratio or using the doors-only condition helped limit excessive winter heat loss under the modeled operating conditions. During spring and autumn, an opening ratio of 40–60% efficiently removes residual indoor heat, keeping indoor conditions within the comfort range.
In summer, however, fully opening windows and doors does not continuously improve cooling performance. When the side-window opening ratio reached approximately 80%, the marginal ventilation benefit began to diminish, and the predicted ventilation performance under the 80% and 100% scenarios became increasingly similar. Based on these findings, a monthly dynamic window-opening strategy was developed; compared with the doors-only baseline, the proposed monthly strategy reduced the annual high-temperature-hour ratio from 33.4% to 16.36%, corresponding to a decrease of 17.04 percentage points, or approximately 51.0% relative to the baseline. Total annual building energy consumption decreased from 32,238.8 MWh to 25,923.8 MWh, corresponding to a reduction of 19.6%. These simulation results demonstrate the potential of fine-grained window control for reducing overheating risk and operational energy use in large transport buildings.
6.3. Theoretical and Practical Implications
This study provides both theoretical and practical contributions. Theoretically, it offers new insights into microclimate regulation in large-space buildings and extends passive design theory from climate adaptation at the design stage to climate responsiveness during operation. It provides simulation-based evidence of the nonlinear relationship among side-window opening ratio, indoor thermal conditions, and building energy consumption in a large-space railway station.
From a practical perspective, the proposed monthly window-opening strategy provides a potentially low-cost operational reference for railway station designers and facility management teams. It challenges the conventional “fully open or fully closed” operation paradigm and provides a basis for developing control logic for motorized window systems. Its transferability to other public transport buildings should be evaluated considering differences in climate, spatial configuration, window-to-floor ratio, and operating schedules.
Overall, the main sustainability contribution of this study lies in demonstrating that climate-responsive passive operation can reduce annual energy demand and overheating exposure while maintaining acceptable indoor thermal conditions in large transportation buildings. The proposed monthly window-opening framework further provides a practical basis for intelligent, seasonally adaptive, and energy-efficient station operation.
6.4. Limitations
Despite its contributions, this study has several limitations. First, the applicability of the results is constrained by the specific spatial configuration of Chengdu Railway Station and its 4.3% window-to-floor ratio. Therefore, quantitative conclusions such as the optimal summer opening ratio of 0.8 may not be directly transferable to other station typologies with different spatial forms.
Second, the study primarily relies on numerical simulation data. Due to the continuous 24 h operation of railway stations, long-term multi-point field measurements across seasons were not conducted. As a result, the model may exhibit deviations when representing extreme weather conditions or localized thermal stratification, introducing a degree of idealization into the results. In addition, because the short-term measurements were conducted with the operable windows closed, the airflow performance under the proposed side-window opening scenarios has not yet been directly validated through field measurements.
6.5. Future Research Directions
Future work can be extended in three main directions.
(1) Data enhancement: Collaboration with station operation teams to deploy IoT-based distributed monitoring systems in key spaces such as waiting halls and commercial areas, collecting long-term multi-height temperature and airflow data to support digital twin calibration.
(2) Control strategy improvement: Transition from static monthly adjustment to intelligent adaptive control by integrating machine learning or model predictive control (MPC), using short-term weather forecasts as inputs to enable hourly dynamic window operation.
(3) Framework expansion: Extend the proposed framework to railway stations in different climatic zones (e.g., severe cold and dry-hot regions), and incorporate indoor air quality as an additional optimization objective, evolving from a dual-objective system (thermal comfort–energy efficiency) to a tri-objective coupled optimization framework (energy efficiency–thermal comfort–air health).
Author Contributions
Conceptualization, M.L. and R.W.; methodology, M.L. and R.W.; software, M.L.; validation, M.L., R.W. and G.Y.; formal analysis, M.L. and G.Y.; investigation, M.L. and Y.Z.; resources, R.W. and J.L.; data curation, M.L. and Y.Z.; writing—original draft preparation, M.L.; writing—review and editing, M.L., R.W., J.S. and J.L.; visualization, M.L. and J.S.; supervision, R.W. and J.L.; project administration, R.W.; funding acquisition, R.W. and J.L. All authors have read and agreed to the published version of the manuscript.
Funding
This research was supported by the Open Fund of Sichuan Province Cyclic Economy Research Center (No. XHJJ-2310), Science and Technology Research and Development Program Project of China railway group limited (No. 2023-Major-06).
Institutional Review Board Statement
Not Applicable.
Informed Consent Statement
Not Applicable.
Data Availability Statement
The data presented in this study are available from the corresponding author upon reasonable request. Due to privacy and confidentiality restrictions related to the railway station project, the complete dataset cannot be publicly shared.
Conflicts of Interest
Author Min Li, Gui Yu, Yue Zhang, Jiazhen Sun and Jie Liu was employed by the company China Railway Academy Group Co., Ltd. The remaining authors declare that the research was conducted in the absence of any commercial or financial relationships that could be construed as a potential conflict of interest.
References
- NDRC. Publication of the Medium- and Long-Term Railway Network Plan. Railw. Tech. Superv. 2016, 44, 23. [Google Scholar]
- Xie, L.R. Natural Ventilation Optimization of Underground Public Spaces. Master’s Thesis, China University of Mining and Technology, Xvzhou, China, 2025. [Google Scholar] [CrossRef]
- Wang, Y.; Liu, J.P.; Xiao, Y.Q. Analysis of effective hours of natural ventilation under regional climatic conditions. J. Xi’an Univ. Archit. Technol. Nat. Sci. Ed. 2007, 39, 541–546. [Google Scholar]
- Wei, J.S. Analysis of Natural Ventilation Potential of Exhibition Buildings. Master’s Thesis, Harbin Institute of Technology, Harbin, China, 2006. [Google Scholar]
- Yang, Y.L.; Zhang, S.; Zhang, X.W.; Hao, J.T. Evaluation of cooling potential of building natural ventilation. Build. Therm. Energy Vent. Air Cond. 2015, 4, 26–30. [Google Scholar]
- Zhu, X.Q.; Sun, Z.Y.; Li, W.J.; Xv, Z.Y. Optimization framework for natural ventilation potential assessment in schematic design stage based on NVCE-AFN model. J. Xi’an Univ. Archit. Technol. Nat. Sci. Ed. 2026, 58, 62–70. [Google Scholar] [CrossRef]
- Aziz, N.S.A.; Mohamed, M.F.; Abd Razak, B. Natural ventilation vernacular mosque architecture design: Case study of Masjid Lama Linggi, Negeri Sembilan. J. Kejuruter. 2025, 37, 2983–2993. [Google Scholar] [CrossRef] [Scilit] [PubMed]
- Yang, J.Z. Study on Natural Ventilation, Thermal Comfort and Energy Saving of Railway Station Waiting Halls. Master’s Thesis, Southwest Jiaotong University, Chengdu, China, 2012. [Google Scholar]
- Xu, Z.L.; Di, Y.H.; Jiang, C.Y.; Liu, Y. Study on summer thermal comfort in railway station waiting halls. Refrigeration 2014, 1, 28–32. [Google Scholar]
- Zhang, M.L. Simulation study on influence of natural ventilation on indoor human thermal comfort. Refrigeration 2025, 44, 51–55. [Google Scholar]
- Cao, J.Y.; Zhang, H.Z.; Zhou, D. Study on winter indoor thermal comfort in southern Xinjiang based on PMV-PPD model. J. Tarim Univ. 2026, 38, 89–96. [Google Scholar]
- Ragab, A.; Hassieb, M.M.; Mohamed, A.F. Exploring the impact of window design and ventilation strategies on air quality and thermal comfort in arid educational buildings. Sci. Rep. 2025, 15, 19596. [Google Scholar] [CrossRef] [Scilit] [PubMed]
- Rabani, M.; Sonderland, S.; Rabani, M. Exploring hybrid ventilation in cold climates: Energy efficiency, thermal comfort, and future climate adaptation in a nZEB case study in Norway. Front. Built Environ. 2025, 11, 1606399. [Google Scholar] [CrossRef] [Scilit]
- Ma, J.Y. Ventilation cooling strategies and energy saving analysis for waiting halls of northern railway station. HVAC 2016, 1, 79–84. [Google Scholar]
- Qiao, X.M. Study on Summer Ventilation Cooling and Energy Saving of Northern Railway Stations. Master’s Thesis, Southwest Jiaotong University, Chengdu, China, 2014. [Google Scholar]
- Wang, X.L.; Zhao, Y.; Mao, H.W.; Liu, D.; Zhang, W.L. Applicability study of natural ventilation in a large railway station in hot summer and cold winter region. Heat. Vent. Air Cond. 2012, 42, 95–100. [Google Scholar]
- Chen, Y. Application and Optimization of Natural Ventilation in Lijiang Railway Station. Master’s Thesis, Southwest Jiaotong University, Chengdu, China, 2011. [Google Scholar]
- Xin, X.; Zhang, Z.H.; Zhou, Y.; Liu, Y.F.; Wang, D.J.; Nan, S. A comprehensive review of predictive control strategies in heating, ventilation, and air-conditioning (HVAC): Model-free VS model. J. Build. Eng. 2024, 94, 110013. [Google Scholar] [CrossRef] [Scilit]
- Ho, M.L.; Yew, M.C.; Yew, M.K.; Saw, L.H.; Tan, W.C.; Yuen, R.K.K. Novel cool roofing technology system with sustainable design for attic temperature reduction. Ain Shams Eng. J. 2024, 15, 102706. [Google Scholar] [CrossRef] [Scilit]
- Hernandez, L.G.C.; García, W.G.B.; Merino, J.A.G.; Hernández, A.D.C.; Parra, A.Y.G.; Sánchez, P.R. Study on thermal comfort and ventilation performance of a wind catcher in hot-dry climate of Mexico: A sustainable energy-saving strategy. Build. Serv. Eng. Res. Technol. 2026, 47, 559–578. [Google Scholar] [CrossRef] [Scilit]
- Gong, B.; Yu, N.Y.; Wang, L. Strategy forms and simulation analysis of natural ventilation. Refrig. Air Cond. 2004, 8–12. [Google Scholar]
- Zhang, M.Y.; Xing, T.; Sun, Y. Application of Energy Plus in building energy saving and consumption reduction. Constr. Econ. 2022, 43, 574–578. [Google Scholar] [CrossRef]
- Guenther, J.; Sawodny, O. Machine learning-based thermal comfort prediction. Build. Environ. 2019, 148, 448–458. [Google Scholar] [CrossRef] [Scilit]
- Ngarambe, J.; Yun, G.Y.; Santamouris, M. AI-based thermal comfort prediction. Energy Build. 2020, 211, 109807. [Google Scholar] [CrossRef] [Scilit]
- ANSI/ASHRAE Standard 55-2004; Thermal Environmental Conditions for Human Occupancy. American Society of Heating, Refrigerating and Air-Conditioning Engineers: Atlanta, GA, USA, 2004.
- EN 15251:2007; Indoor Environmental Input Parameters for Design and Assessment of Energy Performance of Buildings Addressing Indoor Air Quality, Thermal Environment, Lighting and Acoustics. European Committee for Standardization: Brussels, Belgium, 2007.
- Ji, Y.Z.; Gao, Y.; Wang, X.J. Study on influence of air velocity on human thermal comfort. J. Lanzhou Univ. 2003. [Google Scholar]
- Chen, H.M.; Zhang, Y.F.; Wang, J.Y.; Meng, Q.L. Summer thermal comfort of naturally ventilated buildings in hot-humid regions: A case study of Guangzhou. Heat. Vent. Air Cond. 2010, 40, 96–101. [Google Scholar]
- Zhang, M.R. Coupled Simulation and Design Guideline of Natural Ventilation. Master’s Thesis, Tsinghua University, Beijing, China, 2011. [Google Scholar]
- Zhang, J.X.; Xiao, S.J. Ventilation study of university dormitories using DesignBuilder. Urban Dev. 2025, 10, 15–17. [Google Scholar]
- Li, Q.; Liu, L.G.; Zheng, X.D. Energy-saving factors in cold-region residential buildings based on DesignBuilder. Urban Archit. 2025, 22, 142–145. [Google Scholar]

Disclaimer/Publisher’s Note: The statements, opinions and data contained in all publications are solely those of the individual author(s) and contributor(s) and not of MDPI and/or the editor(s). MDPI and/or the editor(s) disclaim responsibility for any injury to people or property resulting from any ideas, methods, instructions or products referred to in the content. |
© 2026 by the authors. Licensee MDPI, Basel, Switzerland. This article is an open access article distributed under the terms and conditions of the Creative Commons Attribution (CC BY) license.