


Abstract
Assessing the impacts of large-scale photovoltaic plants on soil properties is critical for sustainable land management in arid regions. This study examined a 50 MWp utility-scale PV facility in Siziwangqi, Inner Mongolia, northern China, a cold semi-arid desert steppe where renewable-energy development overlaps with fragile wind-eroded ecosystems. A spatially resolved sampling design contrasted soils at key micro-positions relative to the panels, namely Front, Under, and Behind, with adjacent natural Controls. By integrating laser diffraction analysis, multifractal modeling, and the EPIC erodibility equation, we evaluated soil particle-size probability redistribution and EPIC-estimated intrinsic erodibility. Compared with the silt-dominated surface soil of the natural steppe, soils within the photovoltaic plant exhibited fine-particle retention and lower information and correlation dimensions (D1 and D2), indicating stronger local clustering and a less even particle-size probability distribution. The EPIC-estimated erodibility factor decreased from 0.452 in the Control to approximately 0.361 in the PV micro-locations. These associations should be interpreted as texture- and SOC-based model estimates rather than direct measurements of wind erosion. Overall, multifractal parameters provide complementary proxy descriptors for detecting PV-induced particle sorting and potential changes in intrinsic soil erodibility, underscoring the need for field validation and adaptive management in dryland PV landscapes. These findings provide physical soil evidence for evaluating the environmental sustainability of dryland PV development and for supporting adaptive land management in solar farms.
1. Introduction
Utility-scale photovoltaic (PV) plants are rapidly expanding across arid and semi-arid regions globally because of abundant solar radiation and the availability of large areas of marginal land. In northern China’s desert steppes, this expansion represents an emerging form of land-use change superimposed on fragile ecosystems that are already highly vulnerable to wind erosion, vegetation degradation, and soil structural instability [1]. Although PV development contributes to low-carbon energy production, its ecological consequences at the land surface remain insufficiently understood, particularly with respect to surface soil restructuring and erosion susceptibility.
To evaluate such physical alterations, the soil particle-size distribution (PSD) serves as a critical indicator of soil health and physical quality in areas undergoing rapid land-use transition [2,3]. PSD fundamentally governs a variety of essential soil processes, including water retention, nutrient cycling, and susceptibility to erosion [4,5,6]. Traditionally, PSD has been characterized using standard statistical parameters or textural classes; however, these conventional feature functions often fail to capture the intricate, non-linear heterogeneity of soil particles, especially in highly disturbed environments. In recent years, fractal dimension theory, progressing from single fractal dimensions to advanced multifractal analysis, has emerged as a robust mathematical tool [7,8,9,10]. While single fractals describe overall structural complexity, multifractal feature functions, such as the generalized dimension spectrum and singularity spectrum, can precisely quantify the local scaling properties and uneven distribution of different particle-size fractions. By providing a quantitative measure of soil structural complexity, multifractal analysis of PSD offers profound insights into how land-use changes alter soil physical properties [11]. In arid and semi-arid regions, where soils are inherently vulnerable to degradation, the multifractal characteristics of PSD can reveal critical information regarding soil erosion potential and the capacity of the landscape to maintain ecosystem services [4,12].
Fractal analysis has been applied across different ecological contexts, including urban-to-rural gradients and desertification fronts, where changes in fractal dimensions are closely linked to vegetation type and soil structural evolution [13,14]. In severely eroded desert steppes, however, long-term aeolian sorting can generate a silt-dominated surface layer in which particle-size probabilities are concentrated within a relatively narrow range. The introduction of PV plants into these environments creates a specific disturbance regime. PV panels redistribute precipitation, create artificial shading, and alter near-surface wind aerodynamics. We hypothesize that panel edges may generate local wind compression and enhanced shear, Under-panel zones may promote moisture retention and fine-particle preservation, drip lines may induce localized splash and deposition, and wake turbulence behind panels may generate spatially heterogeneous resuspension and deposition. Multifractal analysis offers a way to examine this interaction between PV infrastructure and soil particle sorting, but these micro-structural dynamics still require further quantitative investigation.
From a sustainability perspective, dryland PV development involves a trade-off between renewable-energy production and the conservation of fragile land resources. While PV plants contribute to low-carbon energy supply, their deployment in desert steppes may alter near-surface wind–sand processes, soil particle organization, organic carbon distribution, and erosion susceptibility. Evaluating these soil responses is therefore essential for balancing clean-energy expansion with land degradation control and ecosystem conservation in arid regions.
This study evaluates the localized impacts of utility-scale PV plants on soil particle-size organization and model-estimated intrinsic erodibility in a desert steppe. The objectives were to: (1) quantify changes in soil PSD and multifractal characteristics across micro-topographical positions relative to PV panels (Front, Under, and Behind) compared with natural steppes, and (2) examine whether PV-induced particle sorting and multifractal PSD descriptors covary with SOC- and texture-based EPIC-estimated erodibility. By integrating laser diffraction PSD analysis, multifractal modeling, and the EPIC erodibility equation, we hypothesize that the physical restructuring induced by PV panels differentiates local PSD organization and intrinsic erodibility. This work develops a proxy framework for detecting PV-induced particle sorting and potential changes in soil erodibility in fragile desert steppes.
2. Materials and Methods
2.1. Study Area
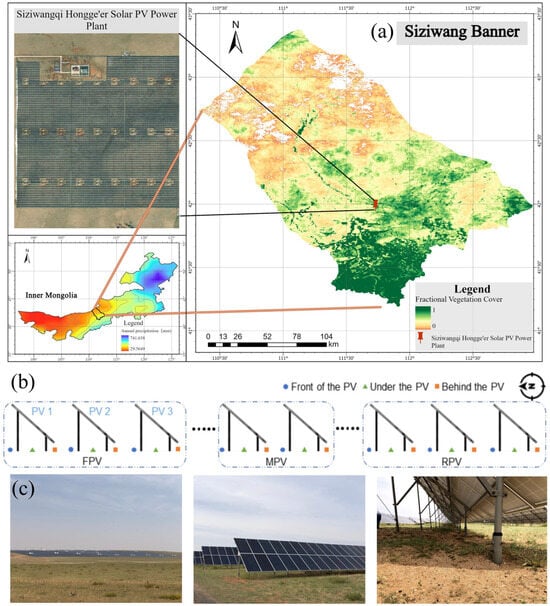
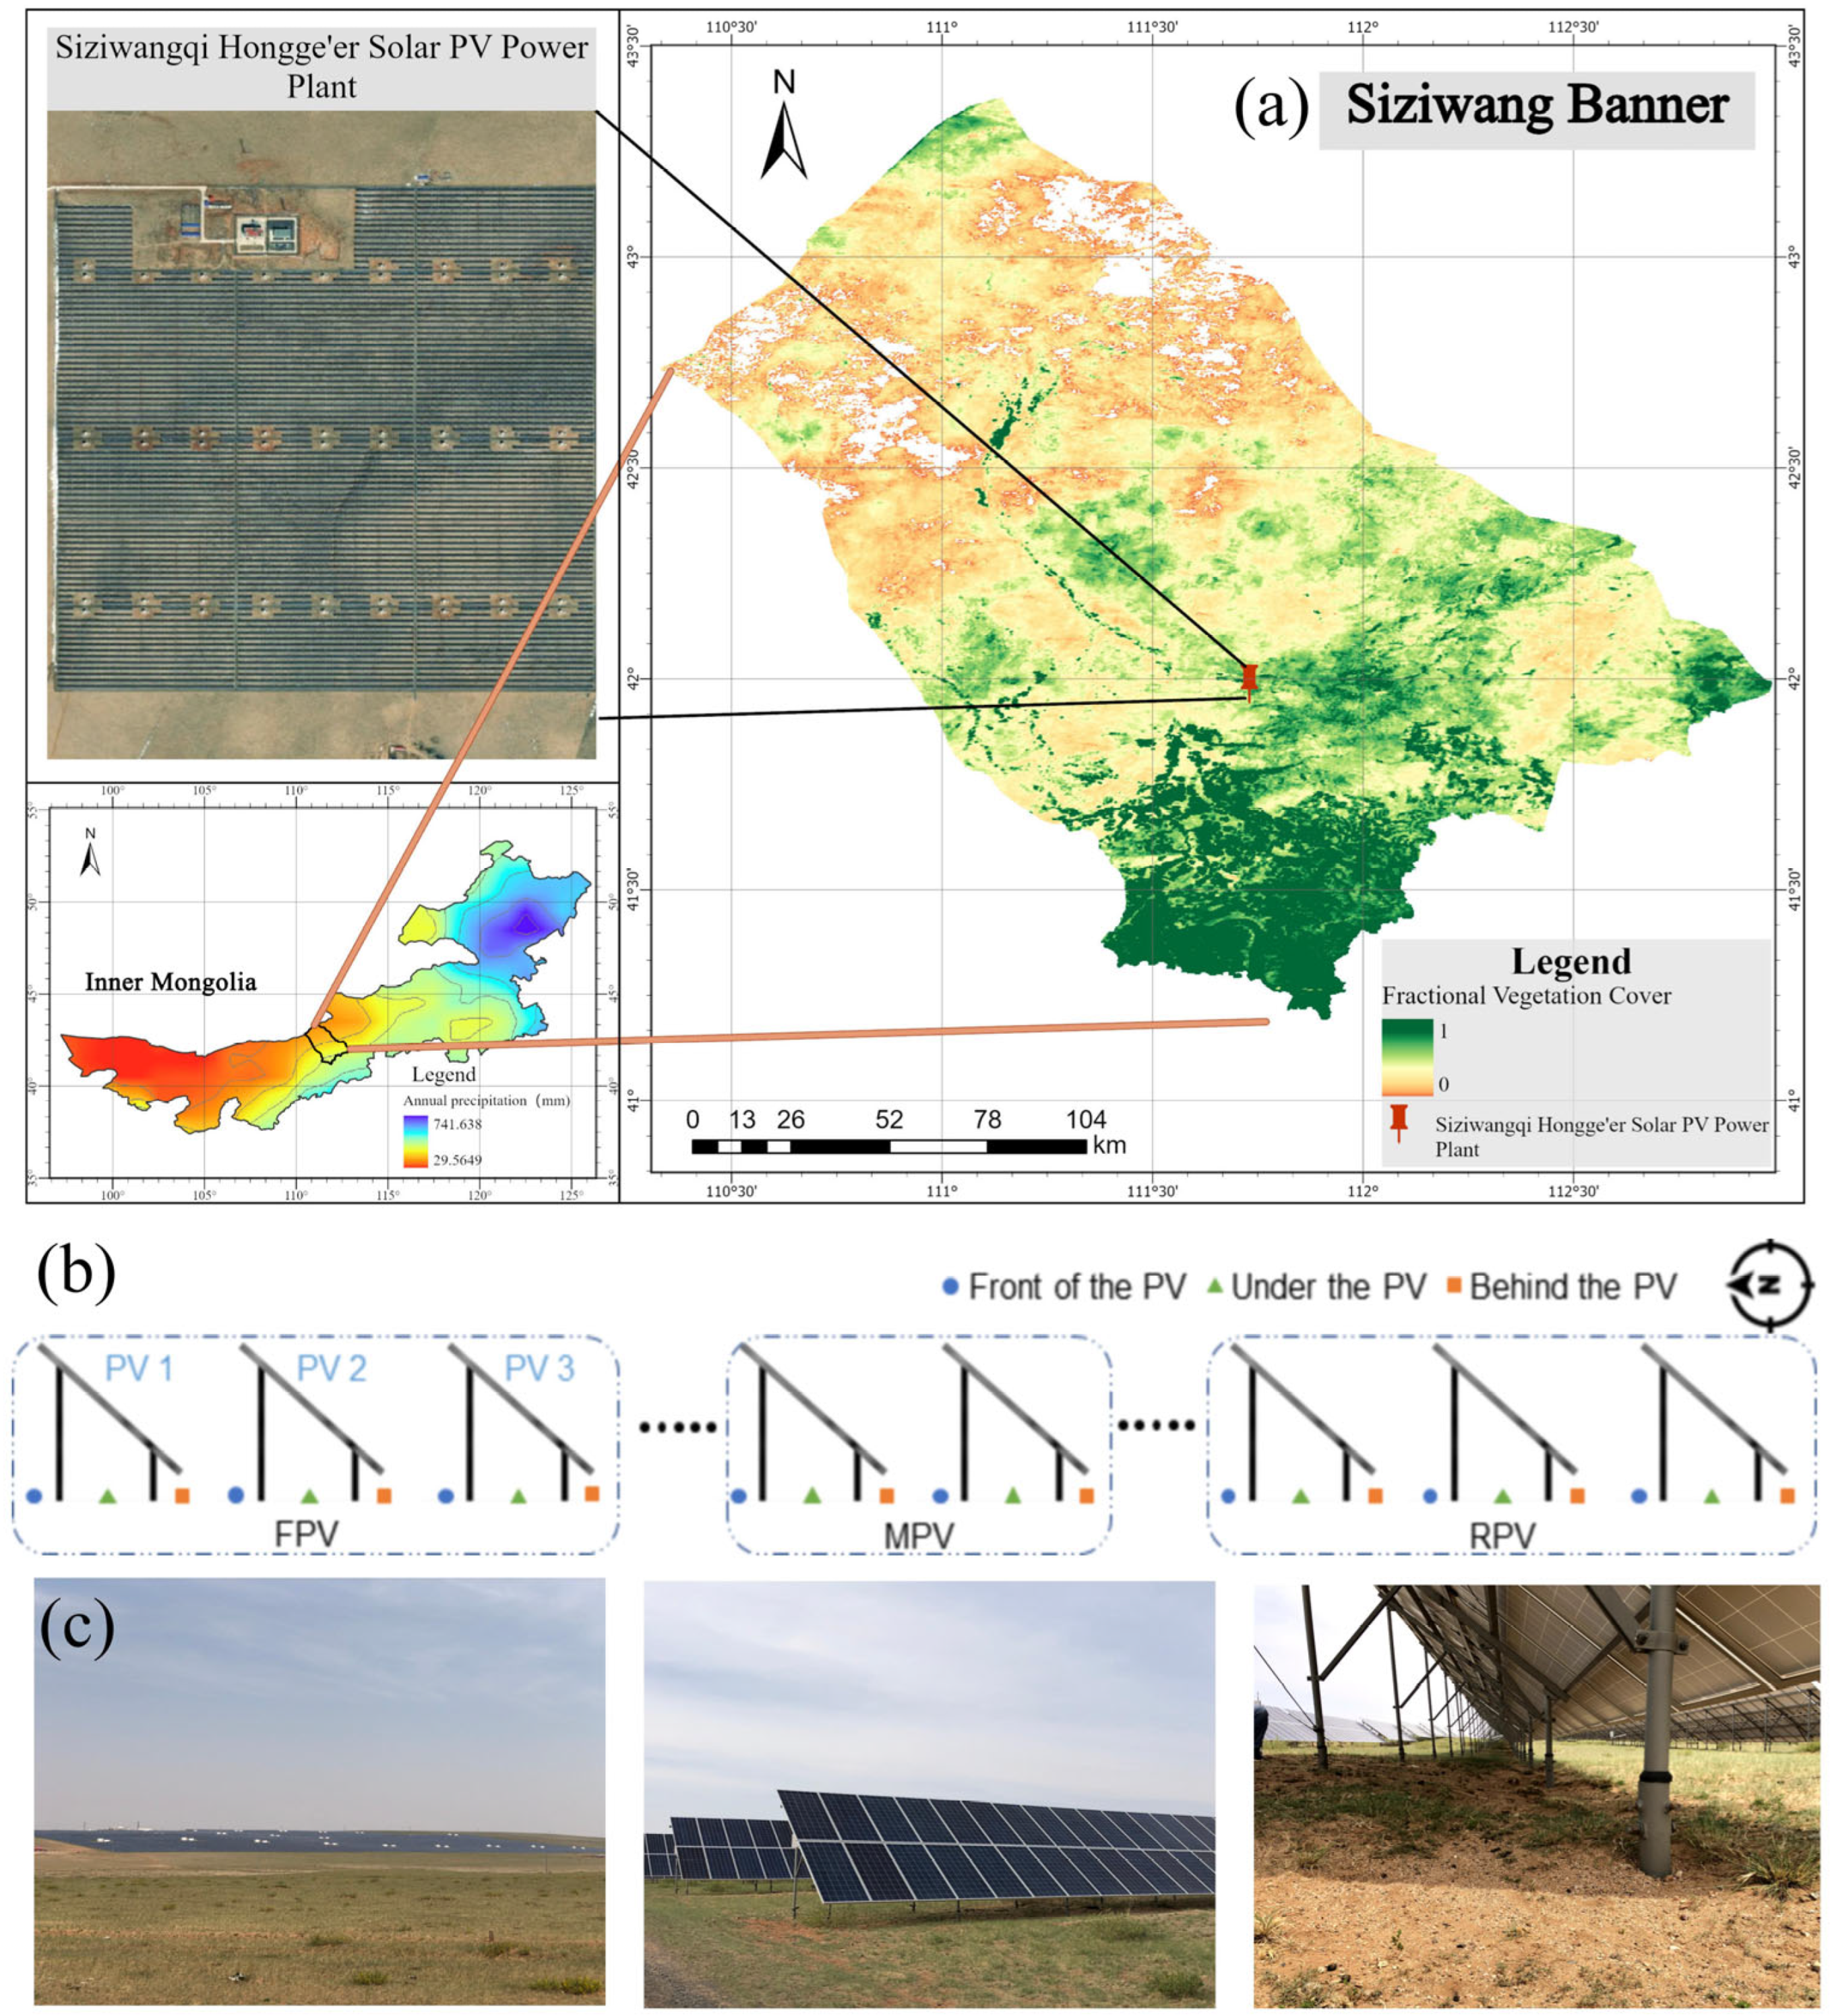
This study was conducted at a 50 MWp utility-scale PV power plant situated in Siziwangqi, Inner Mongolia, China (111.73° E, 41.94° N; elevation ~1510 m) (Figure 1). According to the Köppen–Geiger climate classification, the region experiences a cold semi-arid climate (BSk). The mean annual temperature is 3.6 °C, and the average annual precipitation is approximately 200 mm. The PV plant covers approximately 2.67 km2 and is located on a flat plateau with sparse surface vegetation. The PV arrays consist of panels measuring 1961 mm × 1000 mm, installed at a tilt angle of 40°. Each mounting unit comprises 32 panels arranged in 2 rows by 16 columns. The lower and upper edges of the panels are 0.5 m and approximately 3.03 m above the ground, respectively, with a north–south spacing of 13 m between adjacent arrays. The landscape represents a typical vast, semi-arid desert steppe, with Kastanozems as the dominant soil type. In this fragile environment, severe wind erosion predominantly occurs during the dry spring months, driven by prevailing northwest (NW) and north (N) winds frequently exceeding 12 m/s. Vegetation in the study area is visually sparse and discontinuous. The adjacent Control steppe retained the natural vegetation background, whereas vegetation within the PV plant may be locally affected by panel shading, precipitation redistribution, and maintenance-related disturbance. Because quantitative vegetation-cover measurements were not conducted, vegetation conditions are described qualitatively in this study.
Figure 1.
Location of the study area and experimental design. (a) Regional location and satellite image of the PV power plant; (b) sampling layout; (c) field photographs of the sampling locations.
2.2. Soil Sampling and Analysis
To rigorously assess the impacts of PV panels on PSD, a spatially resolved sampling campaign was designed (Figure 1b). At the macro-scale, the PV plant was divided into three functional zones along the prevailing wind direction: the front section (FPV), the middle section (MPV), and the rear section (RPV). At the micro-scale, intensive sampling focused on the first three windward rows (Row 1, Row 2, and Row 3), which collectively represent the overall FPV zone, to capture localized edge effects. Within each row, specific micro-positions relative to individual panels were identified: in front of the panel (Front), directly beneath the panel (Under), and behind the panel (Behind). Specifically, the Front and Behind sampling points were located exactly at the vertical ground projections of the panel’s upper and lower edges, respectively, while the Under points were situated directly beneath the geometric center of the panel.
Simultaneously, an adjacent natural desert steppe area located immediately to the west of the PV arrays served as the Control group, as its crosswind position relative to the prevailing NW and N winds ensured it remained unaffected by the aerodynamic wake of the PV plant. The Control site shares the same topography, original vegetation type, and soil background as the PV area prior to its construction, ensuring that differences primarily reflect PV-induced effects rather than pre-existing heterogeneity.
A standardized sampling protocol was applied across all PV micro-positions, macro-zones, and the Control site. Soil samples were collected from the 0–10 cm surface layer, which represents the most active interface for aeolian processes, including wind erosion, dust deposition, raindrop impact, crust formation, and near-surface microclimatic changes induced by PV arrays. This surface layer is highly sensitive to wind–sand transport and deposition processes in arid and semi-arid regions, as demonstrated by previous studies on wind-eroded dryland soils [15]. To ensure statistical robustness, three independent spatial replicates were established for each specific location. At each replicate point, a standard five-point sampling method was employed.
Consequently, every single composite sample analyzed for PSD was derived from the thorough homogenization of five independent subsamples. This comprehensive design yielded a substantial dataset, including 27 composite samples for the micro-scale analysis alone, which were derived from 135 individual subsamples. This rigorous multi-point composite approach effectively smooths out random micro-scale noise and ensures that the subsequent multifractal calculations are based on highly representative average conditions of each micro-environment. Furthermore, to support the subsequent erodibility modeling, soil organic carbon (SOC) content was determined using the standard Walkley–Black potassium dichromate oxidation method [16].
2.3. Multifractal Dimensional Modeling
Soil PSD was determined using a FRITSCH A22 NeXT Nano laser diffraction particle-size analyzer (FRITSCH GmbH—Milling and Sizing, Idar-Oberstein, Germany). Before measurement, soil samples were pretreated to remove organic matter and carbonates and to minimize particle aggregation. Briefly, 0.5 g of soil was placed into a 500 mL beaker, treated with 10 mL of 30% H2O2 to remove organic matter, and then treated with 5 mL of 10% HCl to remove calcium carbonate. Residual H2O2 and HCl were removed by repeated rinsing with ultrapure water. The suspension was brought to 500 mL and allowed to stand for 12 h, and the supernatant was discarded repeatedly until the pH reached 7. Immediately before laser particle-size measurement with the FRITSCH instrument, the suspension was ultrasonically dispersed for 120 s using a Hydro-2000 unit (Malvern Instruments Ltd., Malvern, Worcestershire, UK). Particles were classified into clay (<0.002 mm), silt (0.002–0.05 mm), and sand (0.05–2.0 mm) fractions based on the USDA system [17].
For multifractal analysis, which requires high-resolution, continuous data to accurately capture scale-dependent particle-size organization, the measurement range I(μm) = [0.01, 2000] was divided into 100 subintervals with a constant logarithmic scale. A dimensionless interval J = [0, 5] was constructed and subjected to binary division to create subintervals Ji with a uniform scale ε = 5 × 2−k (k = 1 to 6) [3,18]. Consequently, the corresponding subinterval sizes (ε) were 2.627, 1.314, 0.657, 0.328, 0.164, and 0.082. The volume fraction in the i-th interval was converted to a normalized probability measure pi(ε), and the q-order probability weight was defined as μi(q,ε) = pi(ε)^q/Σpi(ε)^q. The generalized dimension spectrum, D(q), was calculated for −10 ≤ q ≤ 10 with an increment of 1 using Equations (1) and (2) [19,20]:
The parameters D0 (capacity dimension, q = 0), D1 (information dimension, q = 1), and D2 (correlation dimension, q = 2) were extracted to describe the finite-scale spatial support, information evenness, and correlation structure of the soil PSD, respectively. Additionally, the singularity index(α(q)) and the singularity spectrum f(α(q)) were calculated using Equations (3) and (4) to describe local features and density fluctuations [21]:
To quantify the heterogeneity and organization of the soil PSD, specific multifractal parameters derived from the generalized dimension spectrum D(q) and the singularity spectrum f(α) were calculated. The capacity dimension (D0) reflects spatial filling over the finite transformed particle-size interval, while the information dimension (D1) and correlation dimension (D2) describe the evenness, concentration, and correlation structure of particle-size probabilities. Lower D1 and D2 values indicate stronger local probability concentration or clustering, whereas higher values indicate a more even distribution across the considered particle-size intervals.
To further capture scale-dependent variations and asymmetry, four key parameters were defined. Specifically, Dv(D − 10 − D0) and Ds(D0 − D10) represent the variations in the low-probability and high-probability measurement intervals, respectively, reflecting the scale-dependent variability of these particle-size subsets. Additionally, the asymmetry index Av = (αmax − α0)/(α0 − αmin) indicates the skewness of the PSD, revealing whether high- or low-probability subsets dominate the soil texture, while Fv = f(αmin) − f(αmax) measures the fluctuation and clustering degree of the particle distribution.
2.4. Estimation of Soil Erodibility Factor (KEPIC)
The EPIC (Erosion Productivity Impact Calculator) erodibility equation was used to estimate intrinsic soil erodibility because it relies on fundamental soil properties, specifically particle-size fractions and soil organic carbon (SOC), which are sensitive to PV-induced surface changes [22]. In this study, KEPIC was used as an empirical, texture- and SOC-based erodibility index rather than a direct measurement or complete model of wind erosion [23]. Actual wind erosion also depends on dynamic aerodynamic and surface variables, including wind shear velocity, surface roughness, soil crusting, vegetation, and biological soil crusts, which were not directly measured in this study.
In this study, the soil erodibility factor (KEPIC) derived from the EPIC equation was used as a model-estimated indicator of intrinsic erosion susceptibility. The KEPIC value is calculated using Equation (5) [20,21]:
where Sa, Si, and Ci represent the sand, silt, and clay contents (%), respectively; Sn = 1 − Sa/100; and C represents the soil organic carbon content (%).
2.5. Statistical Analysis
All statistical analyses were performed to evaluate differences in soil particle-size fractions, SOC, multifractal parameters, and EPIC-estimated erodibility among sampling locations. Data are presented as mean values with standard deviations where appropriate. Before analysis, the normality and homogeneity of variance of the data were checked. One-way analysis of variance (ANOVA) was used to test for significant differences among the PV micro-locations and the Control site, as well as among the macro-scale PV zones where appropriate. When significant differences were detected, multiple comparisons were conducted using Tukey’s honestly significant difference test. Pearson correlation analysis was used to explore associations among PSD fractions, SOC, multifractal parameters, and EPIC-estimated erodibility. Linear regression analysis was further applied to examine the relationship between selected multifractal parameters and EPIC-estimated erodibility. Statistical significance was determined at p < 0.05.
For this reason, the correlation analyses involving EPIC-estimated erodibility were interpreted as exploratory associations rather than evidence of independent causal relationships, because the KEPIC factor was calculated from soil texture and SOC.
3. Results
3.1. Soil Characteristics
At the micro-location level (Table 1), soil particle-size distribution exhibited distinct variations among the different positions relative to the PV panels. Clay content was lowest directly Under and Behind the panels in the third row (8.65%), while sand content generally showed higher values Under the panels (reaching 2.19% in Row 3) compared to the Front and Behind positions. Silt content remained relatively stable across all micro-locations.
Table 1.
Soil PSD at different micro-locations within the PV plant.
Soil organic carbon (SOC), an input variable for the EPIC erodibility equation, also varied among the sampling locations. The mean SOC content was 0.966% in the Control area and ranged from 3.248% to 7.659% within the PV plant. In Table 2, the mean SOC values for the Front, Under, and Behind micro-locations were 4.452%, 5.030%, and 4.434%, respectively. These SOC data were used together with soil texture fractions to calculate the EPIC-estimated K-factor, and the corresponding values are reported in Table 2.
Table 2.
Multifractal characterization parameters, SOC, and EPIC-estimated soil erodibility across different micro-locations within the PV plant and the Control area.
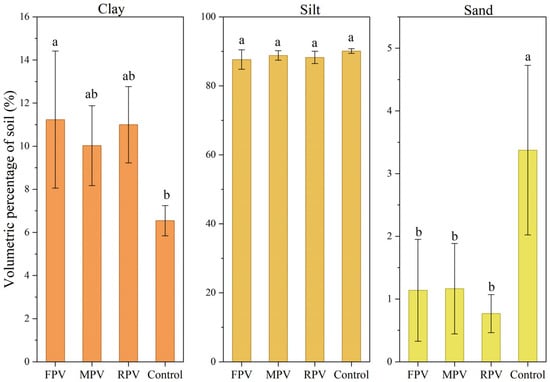
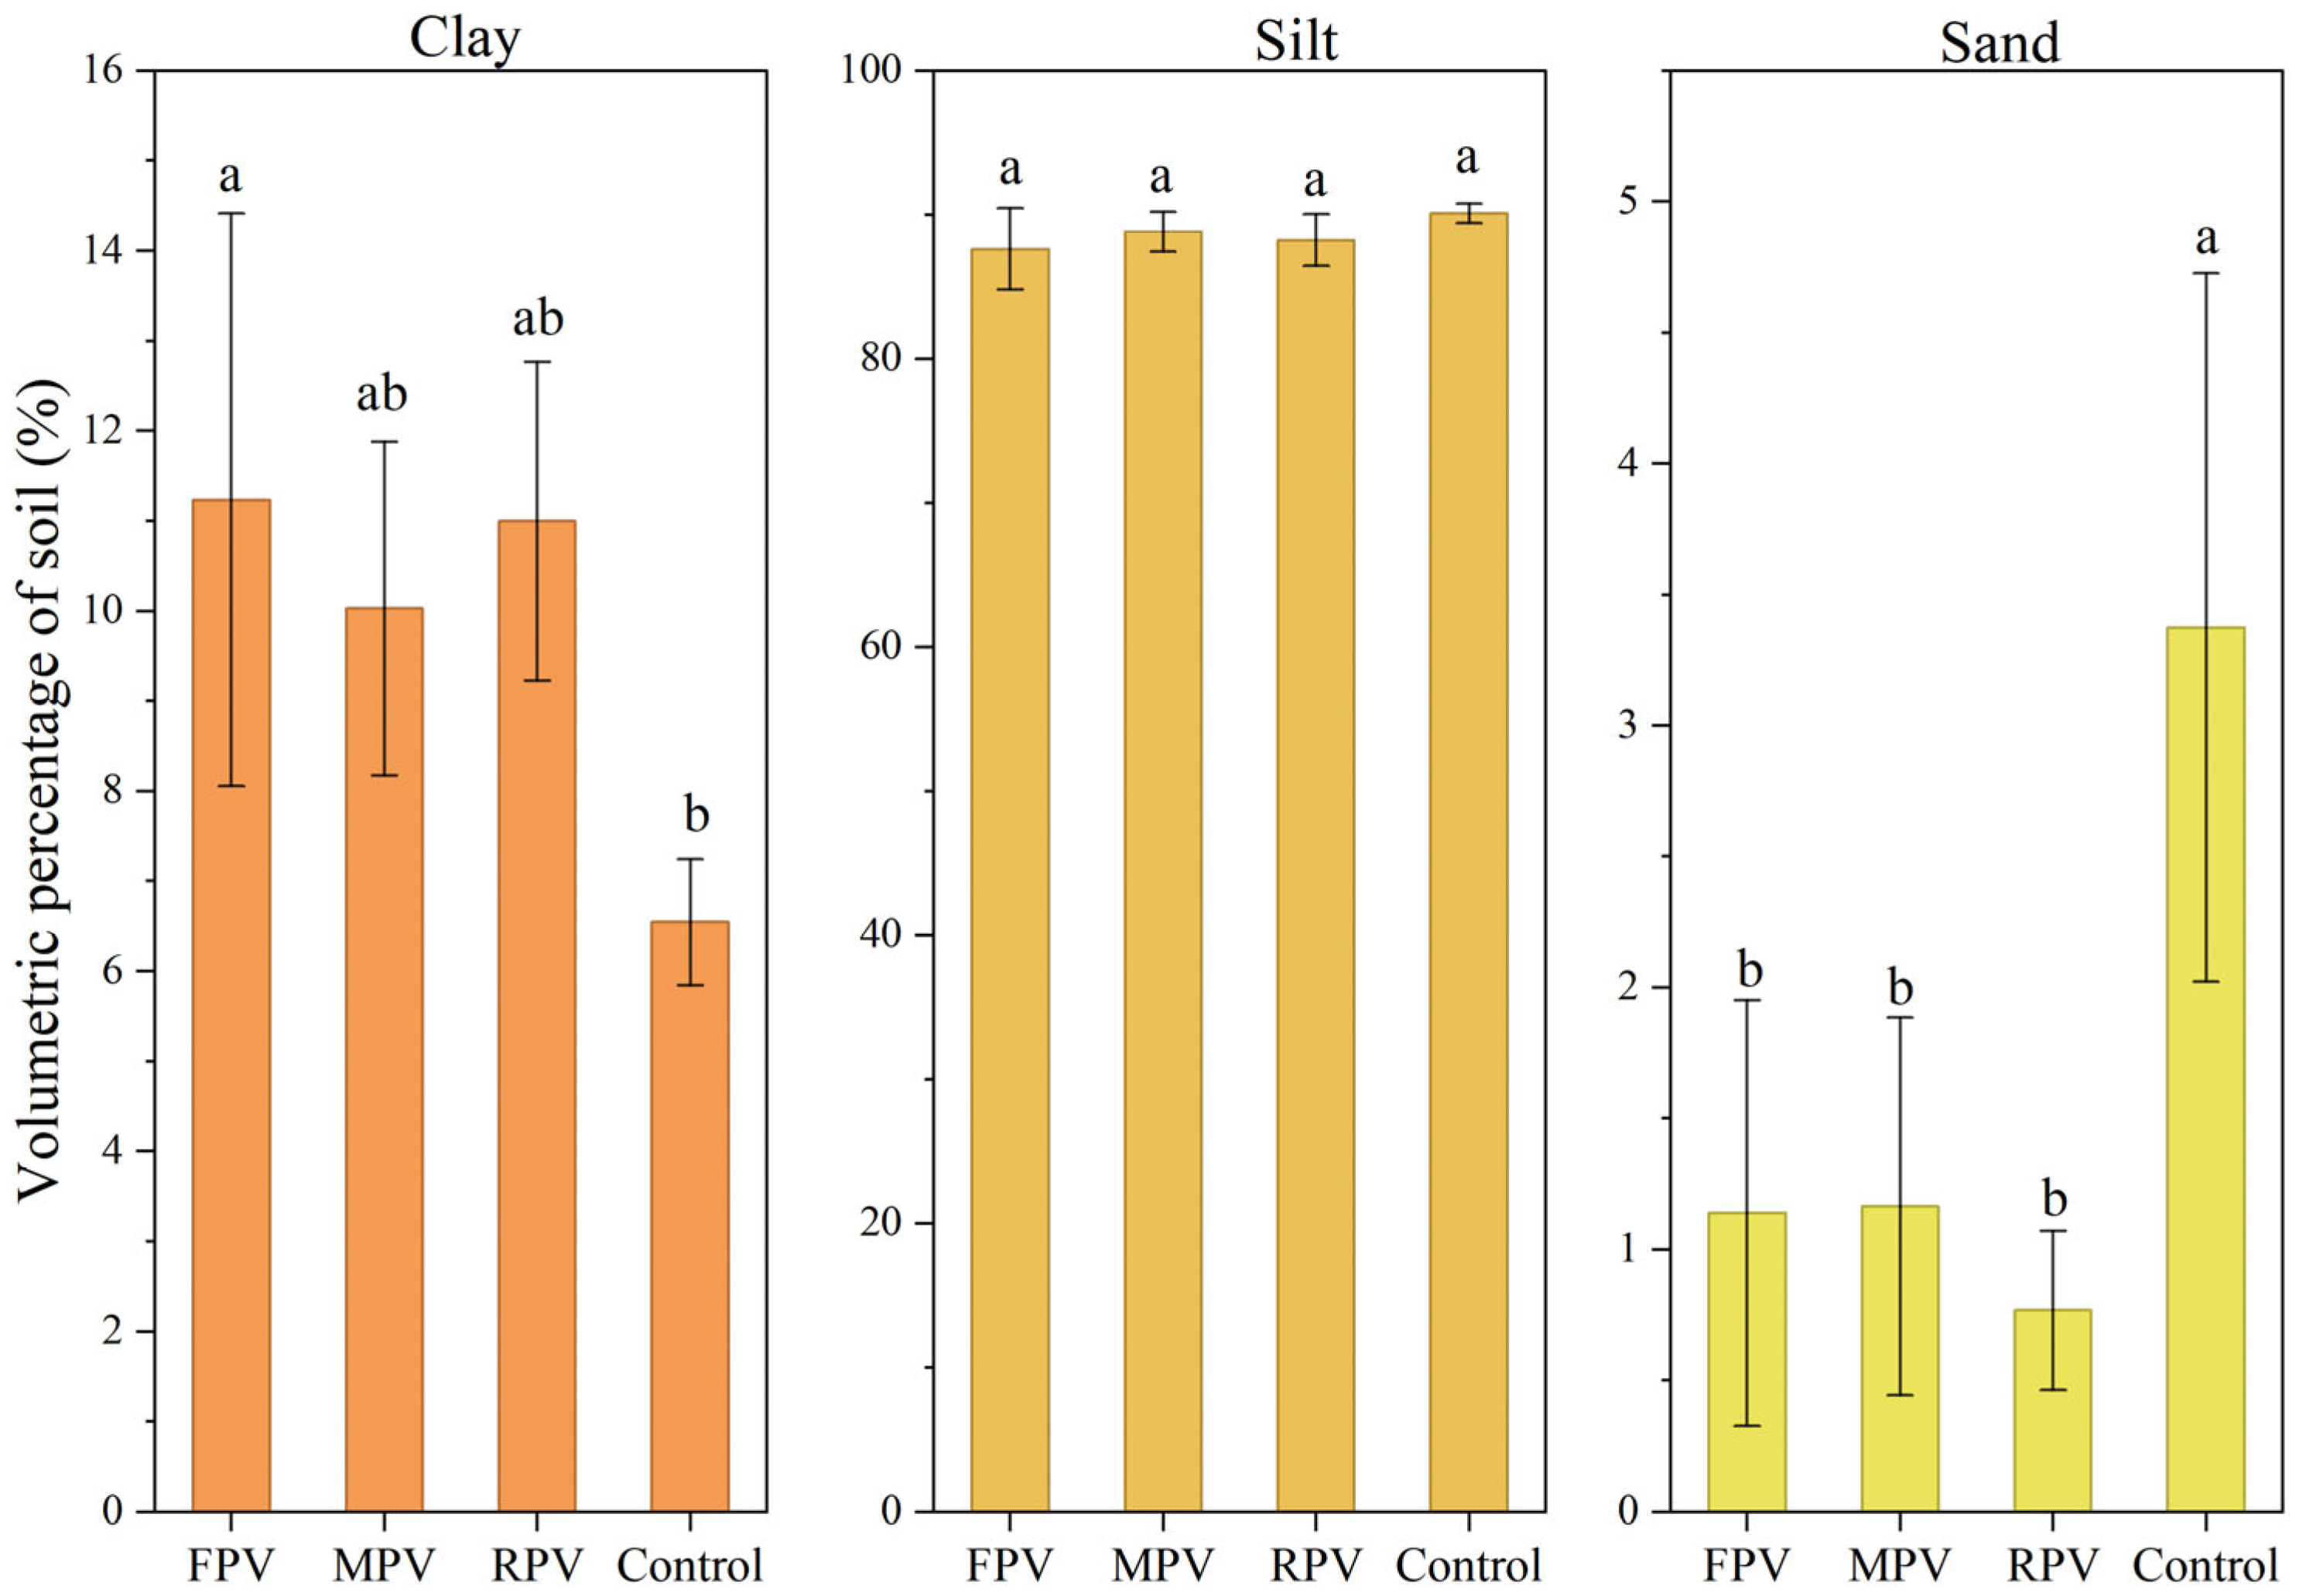
At the macro-scale (Figure 2), the construction of the PV plant significantly altered the overall soil PSD. Compared to the Control group (6.54%), the clay content significantly increased in the FPV section (11.86%, p < 0.05). Conversely, the sand volume percentages in the FPV, MPV, and RPV sections significantly decreased by an average of 76.16% compared to the Control (p < 0.05). The notably large error bars observed in the PV sections indicate substantial intra-site variation, which is primarily driven by the distinct micro-environments (Front, Under, and Behind) created by the panel arrays.
Figure 2.
Soil particle-size fractions in different functional zones of the PV plant and the Control area. FPV, MPV, and RPV denote the front, middle, and rear sections of the PV plant, respectively. Error bars indicate standard deviations, and different lowercase letters indicate significant differences at p < 0.05.
Conversely, the silt and sand contents exhibited different macro-trends. For silt, the order was Control (90.08%) > MPV (90.03%) > RPV (88.39%) > FPV (87.85%). Compared to the Control group, the silt volume percentages in the PV sections decreased slightly, but these minor fluctuations were not statistically significant. For sand particles, the order was Control (3.37%) > MPV (1.18%) > RPV (0.95%) > FPV (0.28%). The sand volume percentages in the FPV, MPV, and RPV sections significantly decreased by 91.69%, 64.99%, and 71.81%, respectively (p < 0.05), with an average decrease of 76.16%. Although the soil PSD in the MPV section was relatively similar to that in the Control group, the FPV and RPV sections showed more noticeable changes, characterized by higher clay and significantly lower sand contents. This suggests that the large-scale PV area promotes clay retention and restricts sand accumulation in the surface soil, particularly at the windward and leeward boundaries of the plant.
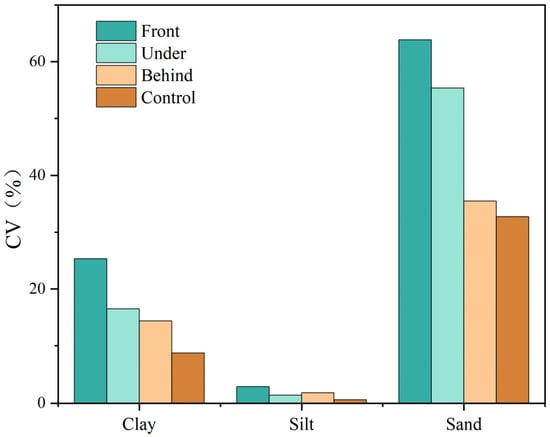
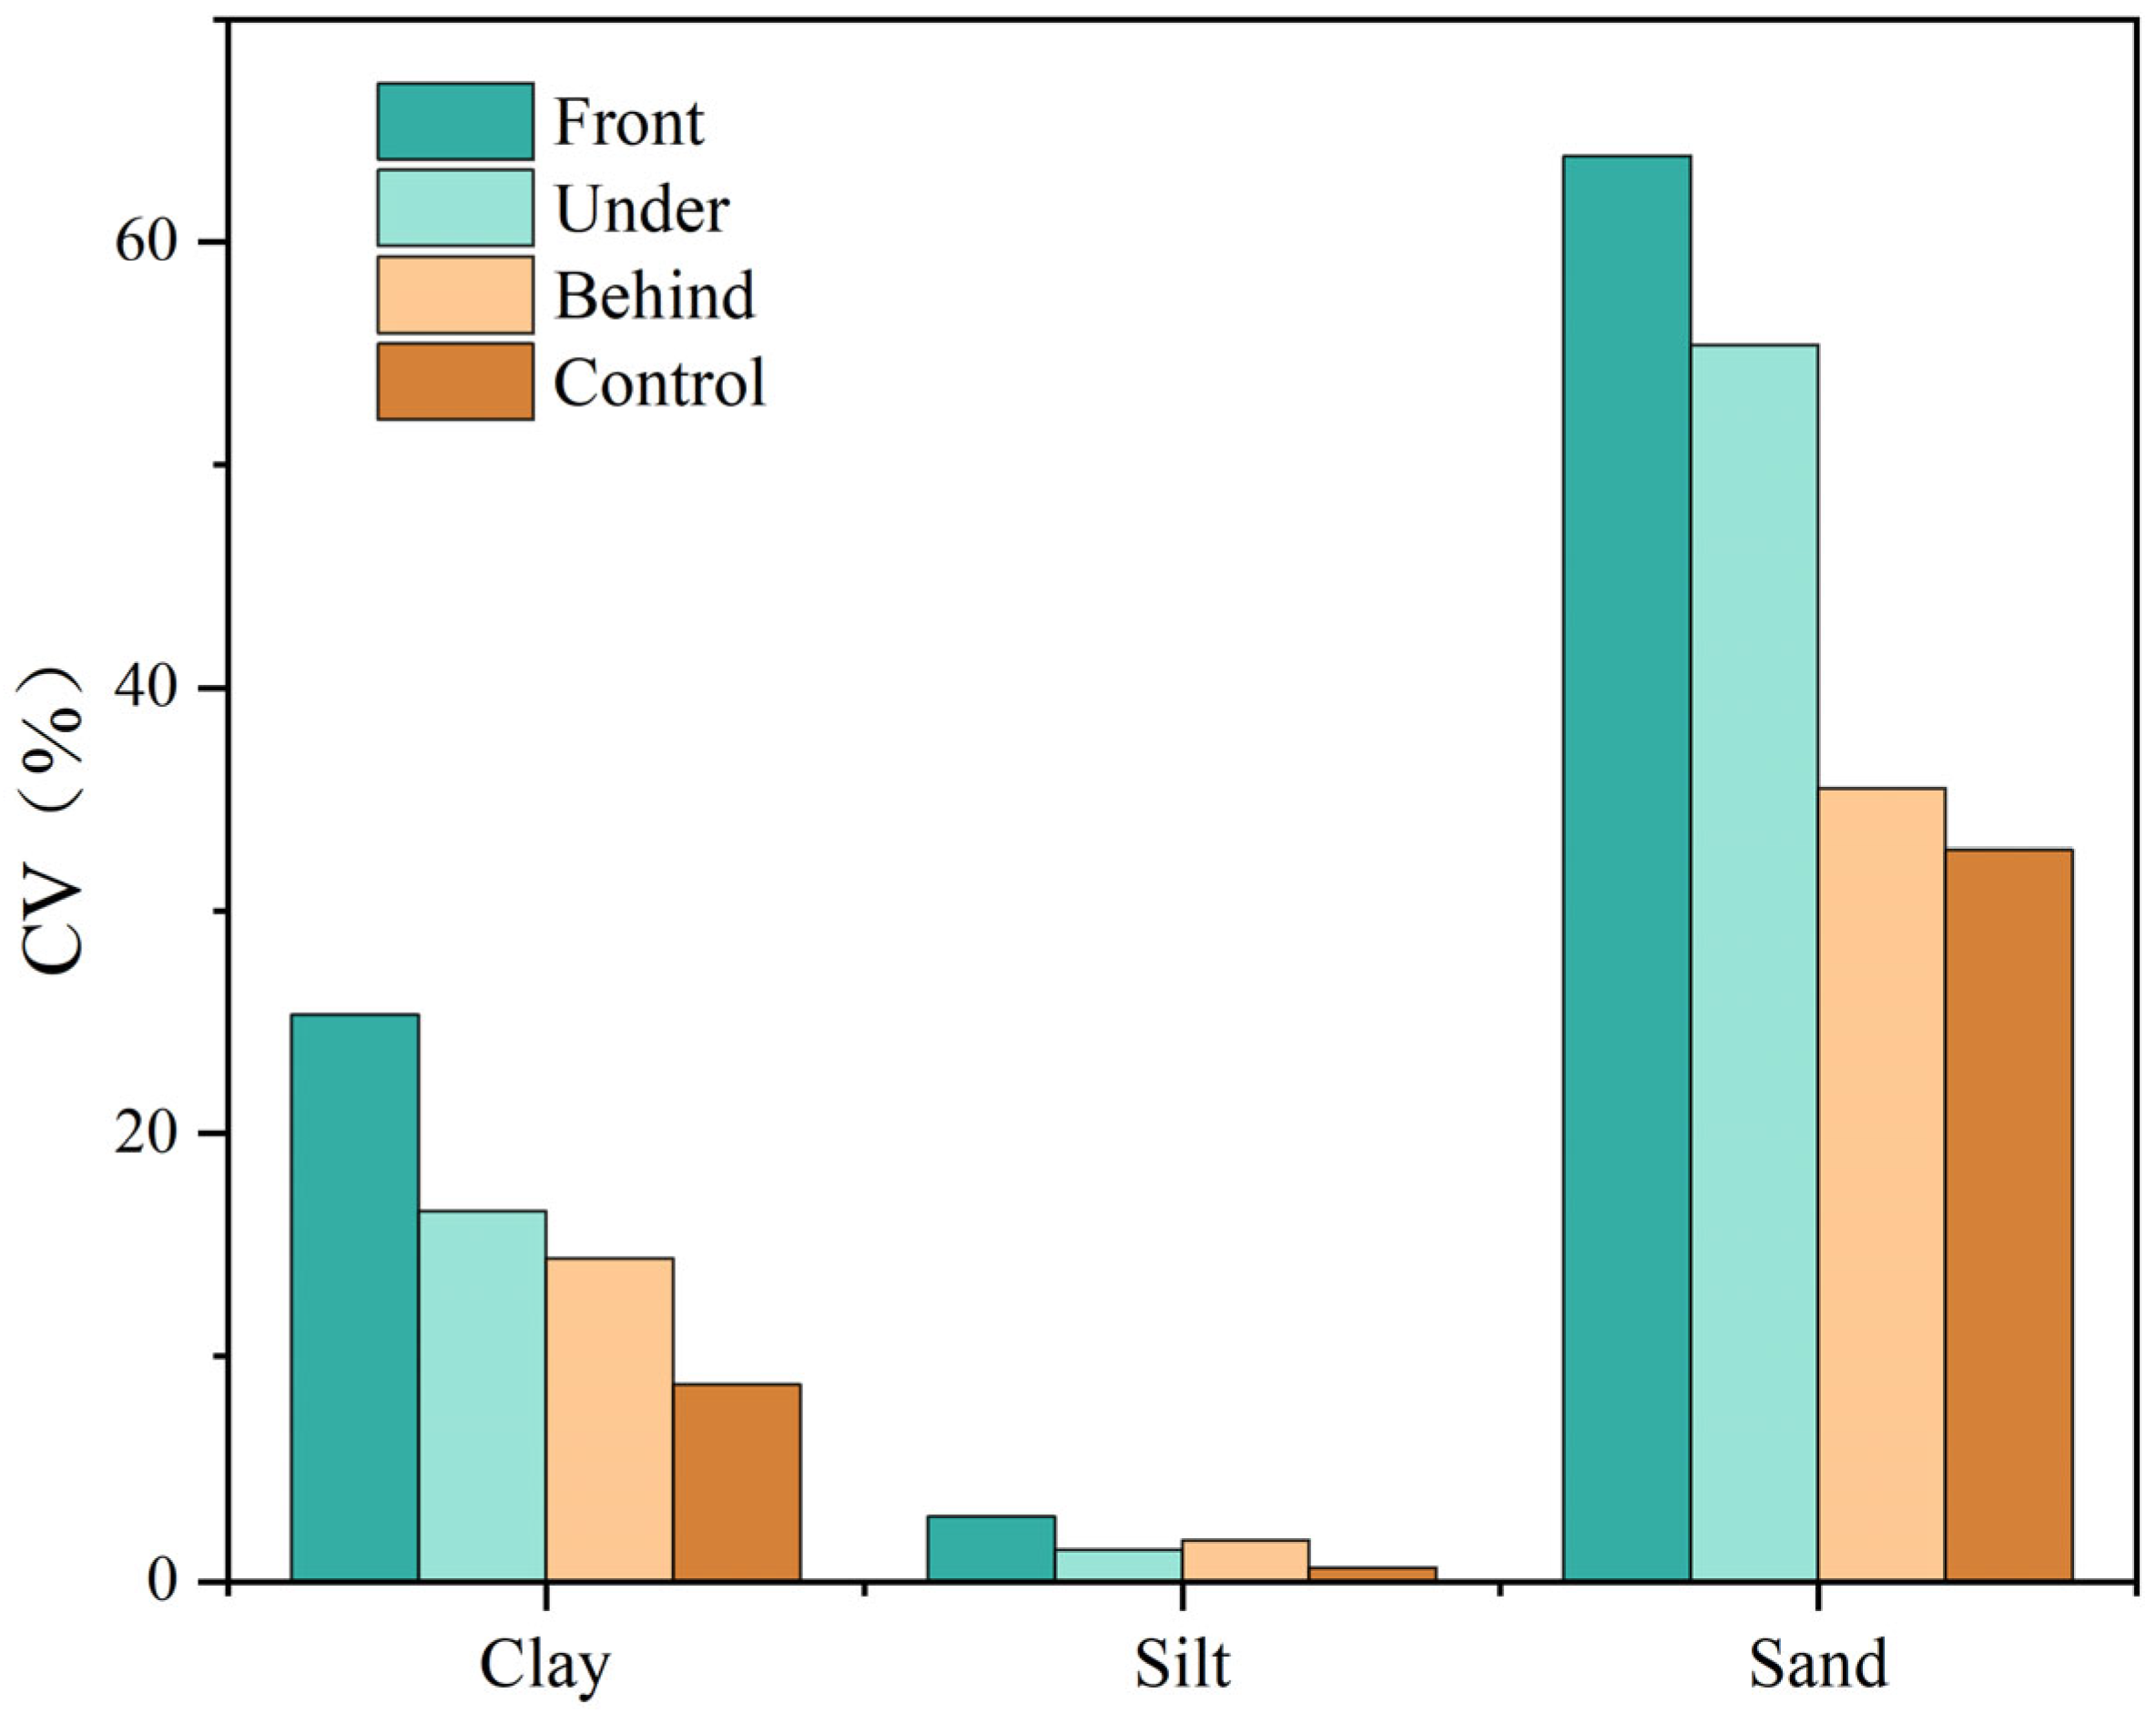
The spatial coefficient of variation (CV) of soil particles further highlighted the localized variability induced by the PV panels (Figure 3). Notably, the spatial variation in sand and clay exhibited a distinct decreasing gradient at the micro-scale: Front > Under > Behind > Control. The most pronounced alteration occurred at the Front edge of the panels, where the CV of sand reached its peak (64%), nearly double that of the undisturbed Control area (33%). Similarly, the CV of clay at the Front location (25%) was substantially higher than that in the Control area (9%). Underneath the panels, this variability was slightly mitigated but remained elevated, while the area Behind the panels showed the lowest variation among the PV micro-habitats, gradually approaching baseline Control levels. In contrast, the spatial distribution of silt remained highly stable across all micro-locations, consistently showing weak variation (CV < 5%) throughout.
Figure 3.
Spatial coefficient of variation (CV) of soil particle-size fractions across different micro-locations relative to the PV panels and the Control area.
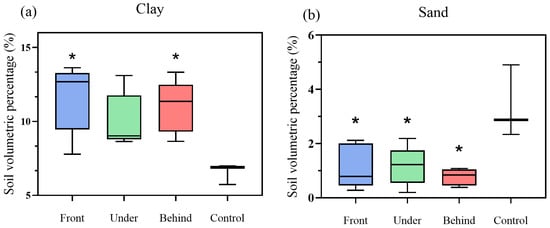
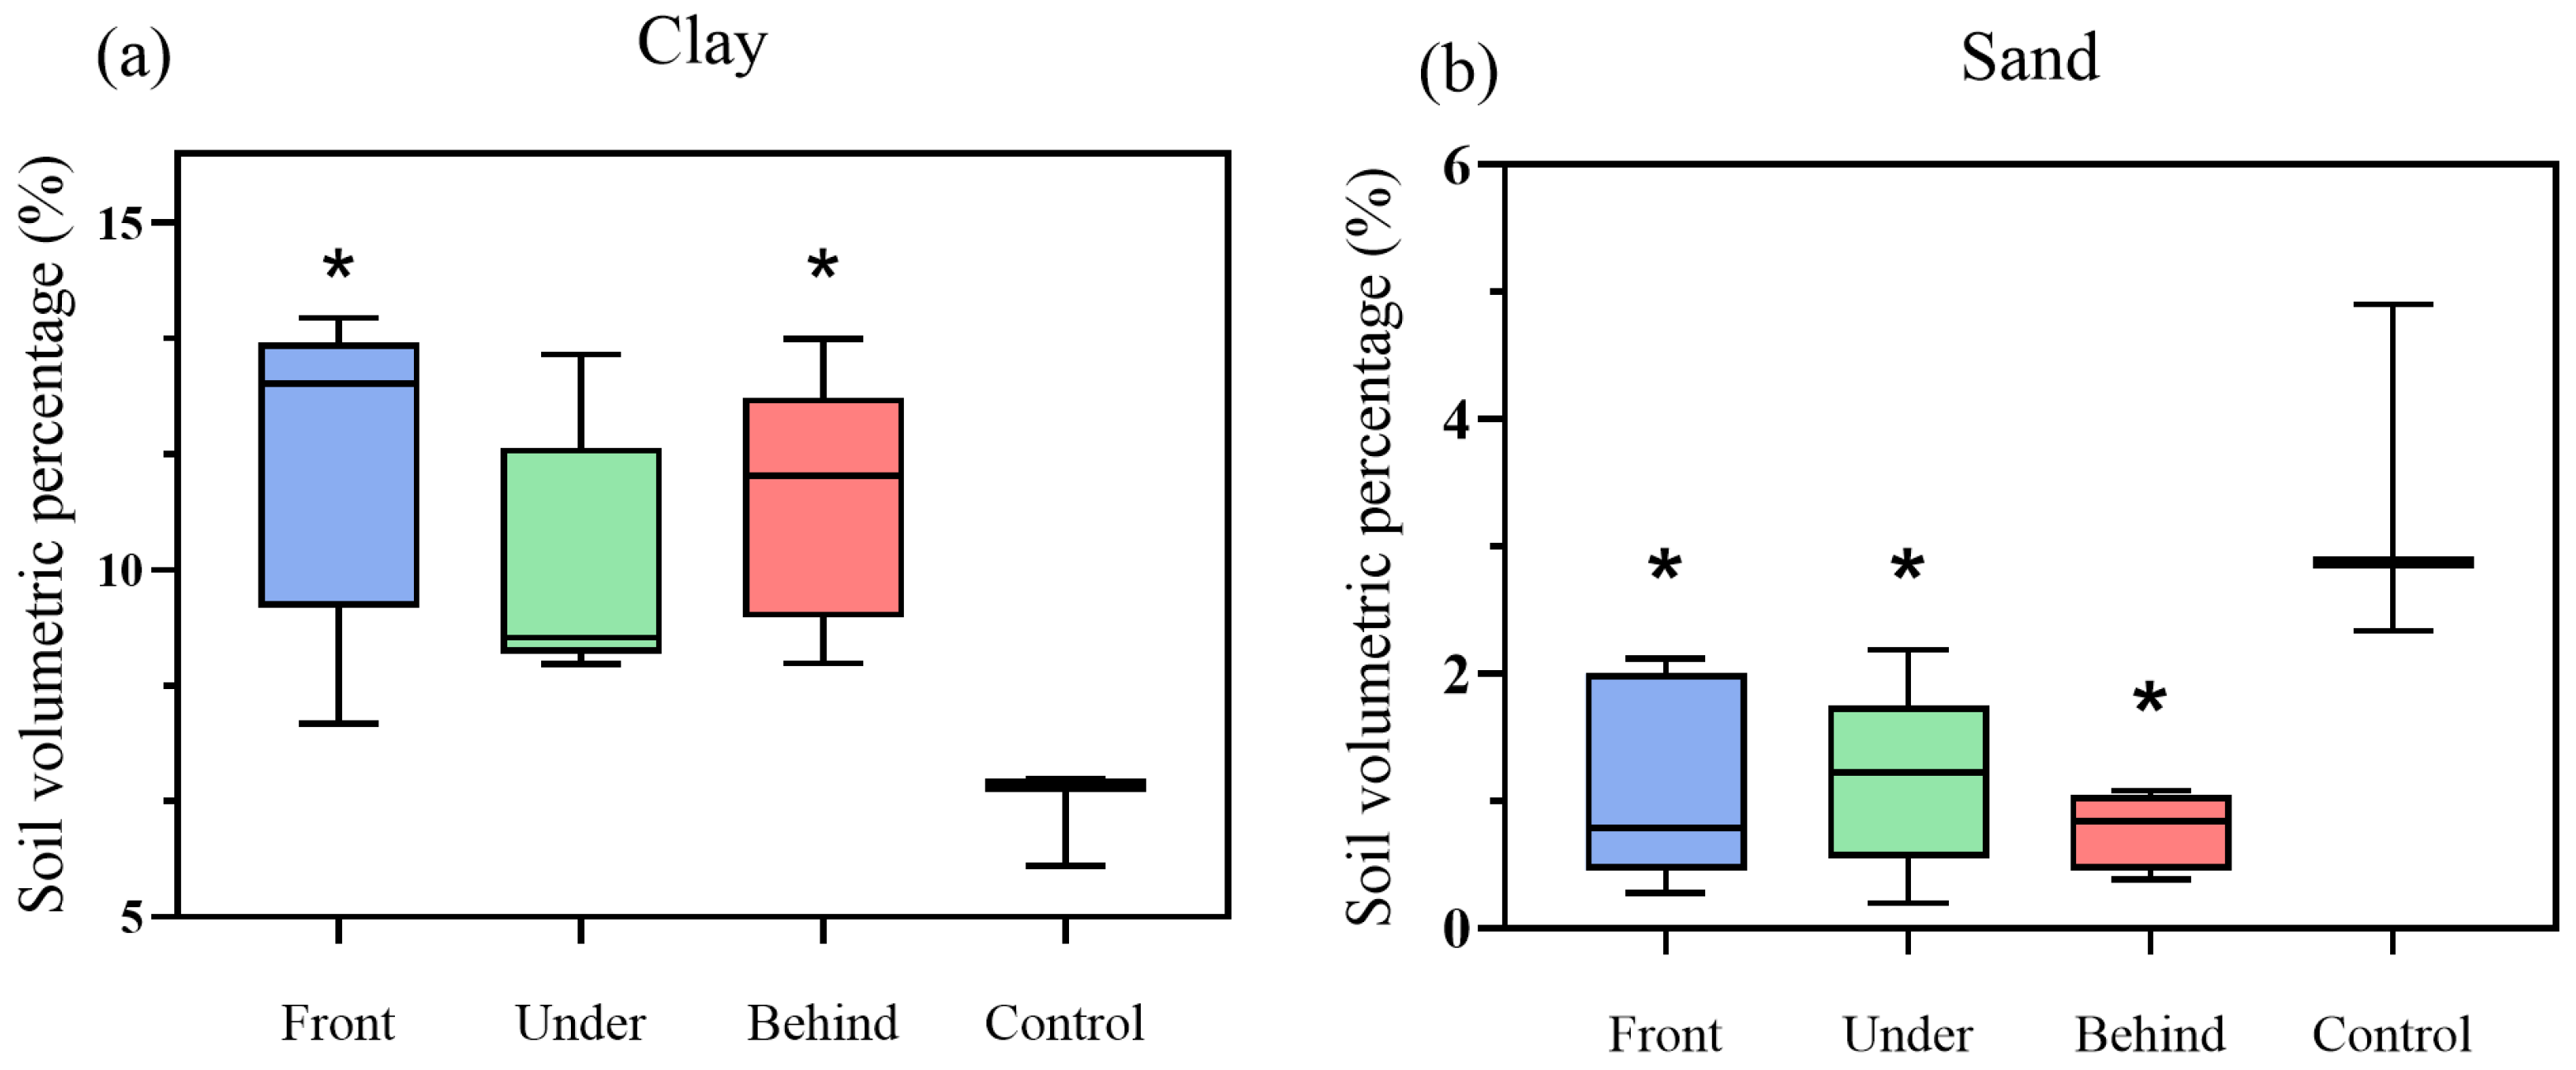
One-way ANOVA (Figure 4) confirmed that the mean volume percentage of clay was significantly higher at the Front and Behind locations compared to the Control (p < 0.05). Additionally, sand content was significantly lower across all PV micro-locations compared to the Control area (p < 0.05).
Figure 4.
Soil volumetric percentages of (a) clay and (b) sand across different micro-locations (* indicates p < 0.05).
3.2. Multifractal Characteristics of Soil PSD at Different Locations of the PV Plant
The multifractal parameters of the soil PSD, SOC, and EPIC-estimated erodibility are summarized in Table 2. The capacity dimension (D0) remained constant at 0.913 across all sites, reflecting a consistent finite-scale estimate under the selected transformed particle-size interval and partitioning procedure. However, the information dimension (D1) and the correlation dimension (D2) exhibited spatial variations among the treatments. Specifically, the D1 value and the D1/D0 ratio were highest in the Control area (0.731 and 0.801, respectively), which were greater than those in the PV micro-locations. Within the PV array, the multifractal dimensions showed subtle variations among the Front, Under, and Behind positions, though they remained consistently lower than the natural steppe baseline. Furthermore, the EPIC-estimated K-factor followed a similar statistical trend, being higher in the Control group (0.452) compared to the PV micro-locations (ranging from 0.358 to 0.365).
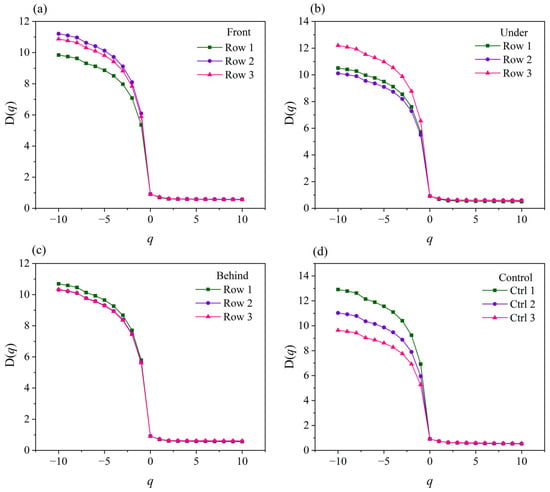
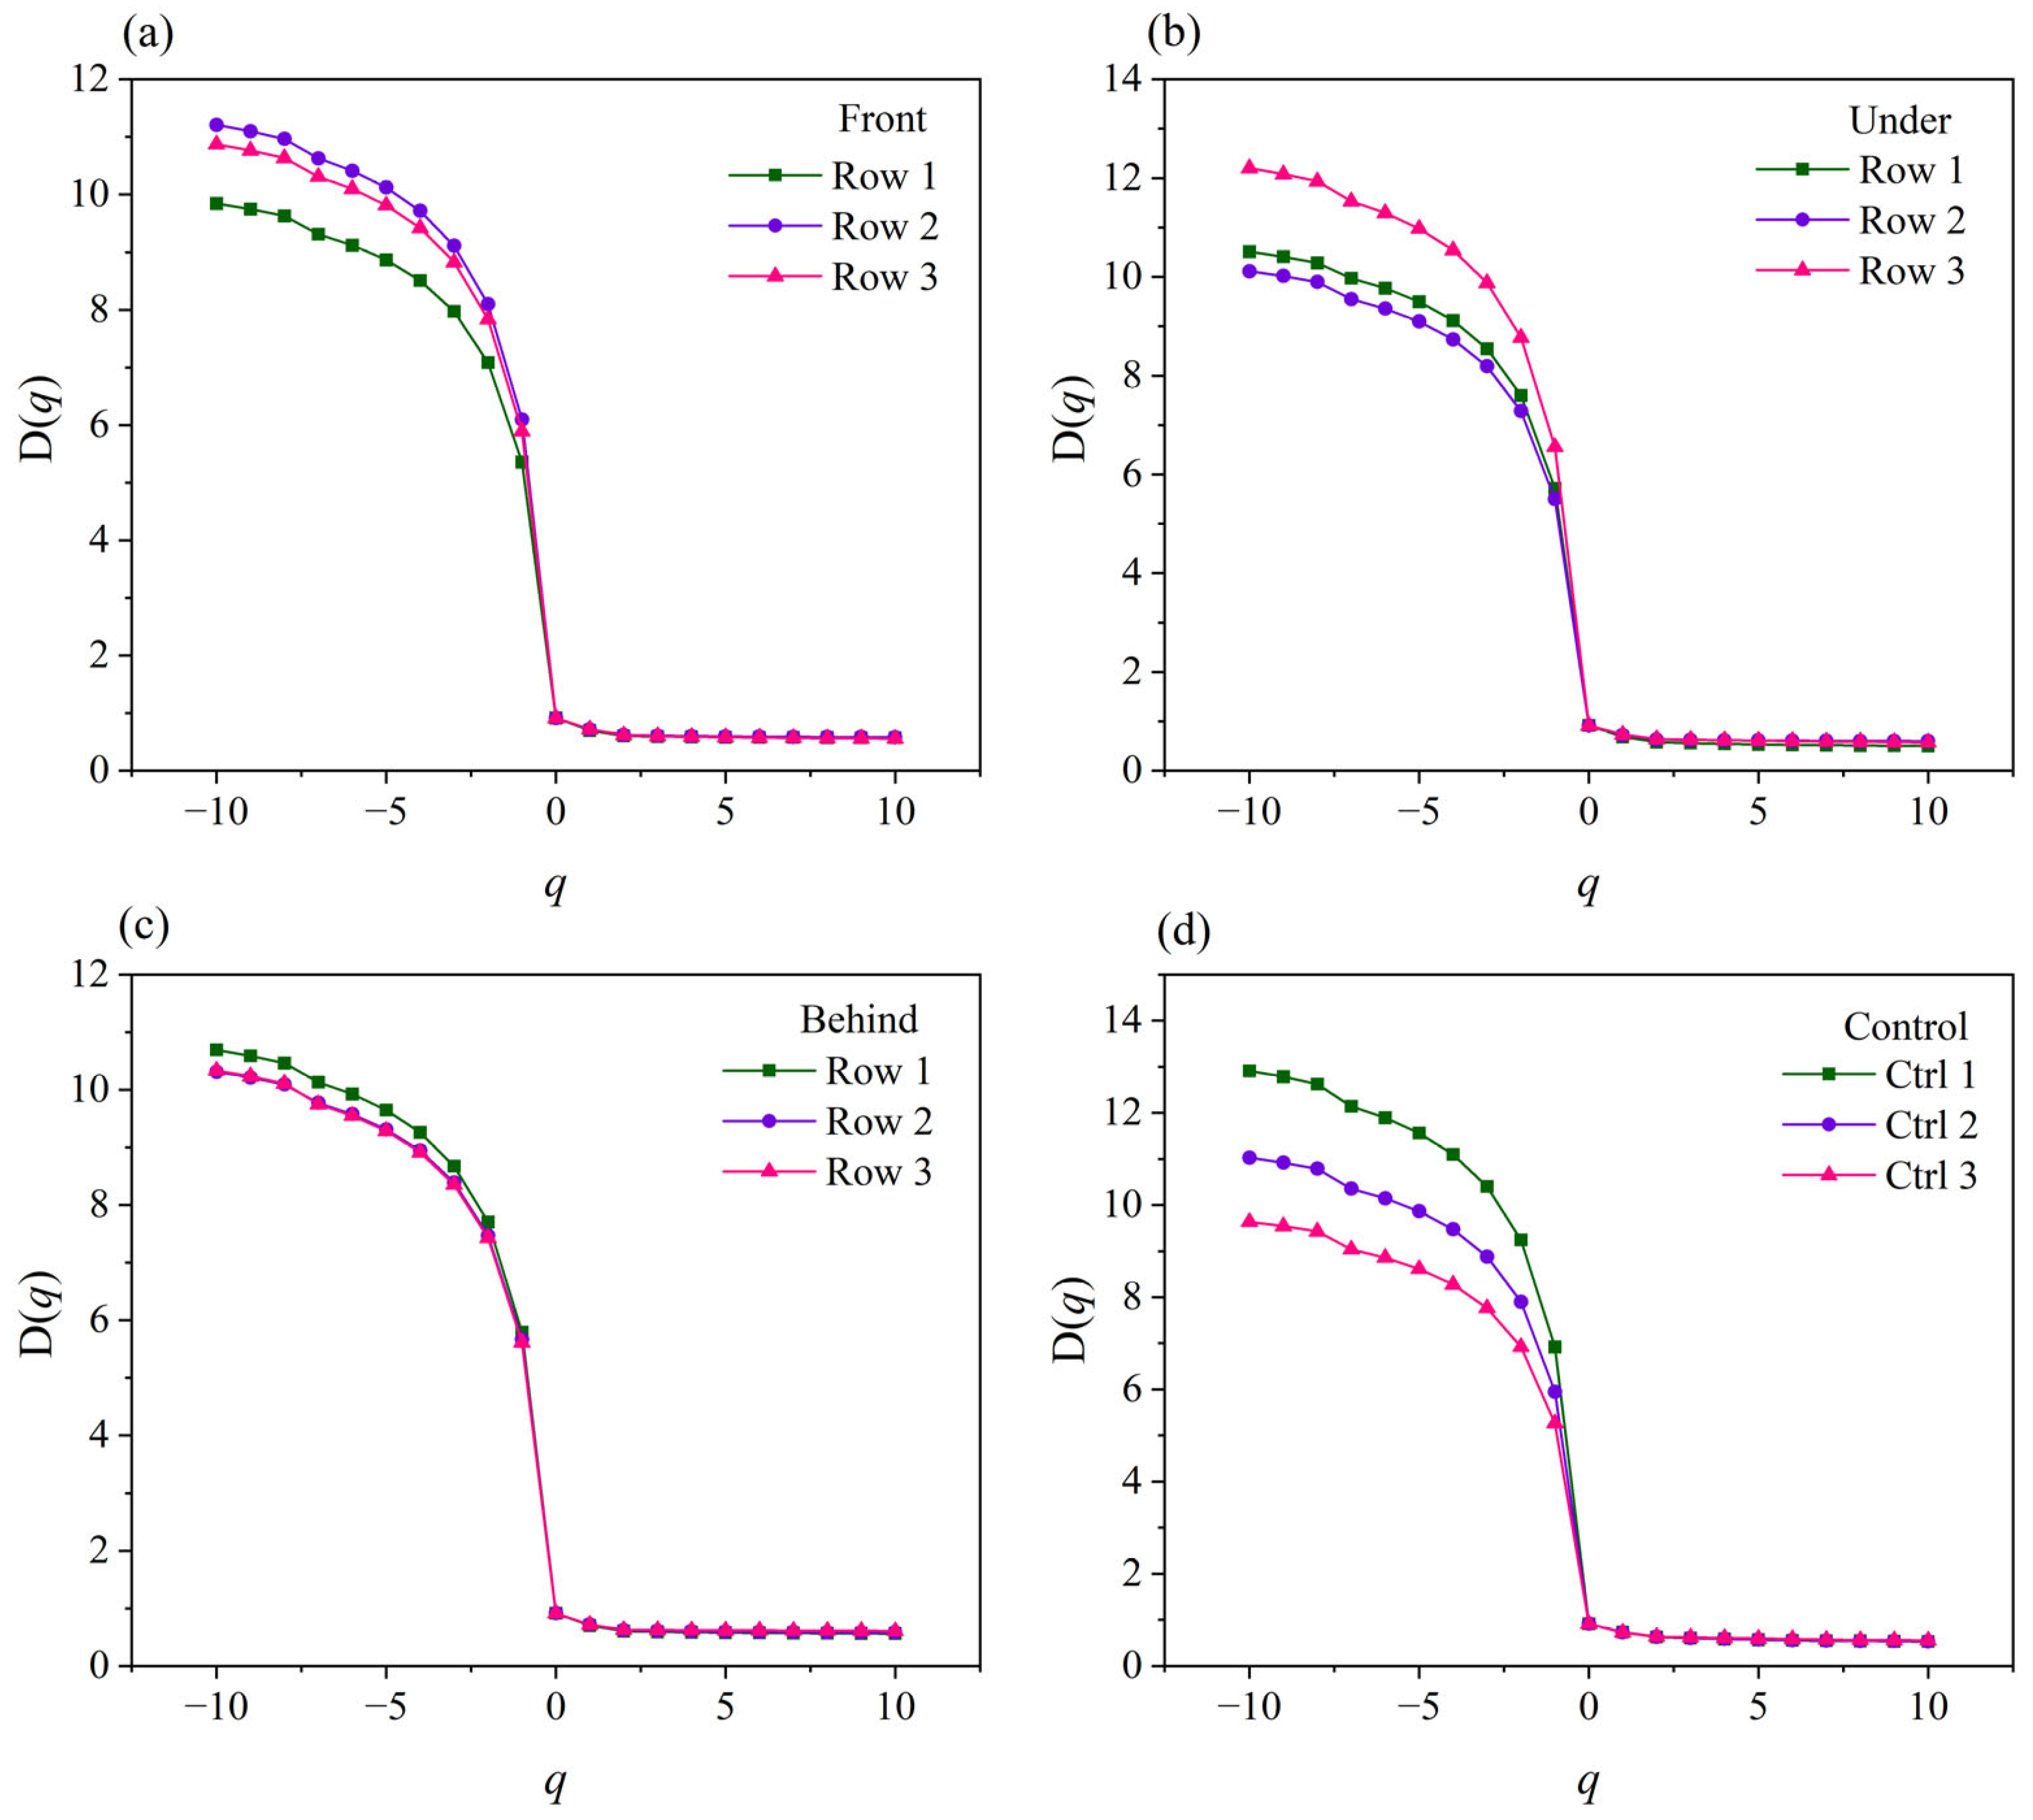
The generalized dimension spectrum curves (D(q)) for all soil samples exhibited a typical monotonically decreasing, inverse S-shape across the moment order q from −10 to 10 (Figure 5). In the dense particle distribution regions (q > 0), the curves converged tightly, showing minimal discrepancy among the different micro-locations. Conversely, in the sparse regions (q < 0), the D(q) curves diverged noticeably, highlighting distinct local variations. The Control area exhibited the highest maximum D(q) values (reaching approximately 13 at q = −10) and the widest curve dispersion. In contrast, the D(q) values for the PV micro-locations were more constrained, generally fluctuating between 10 and 12 at q = −10.
Figure 5.
Average D(q)-q curves of soil samples at each location (a) In front of the panel (Front); (b) beneath the panel (Under); (c) behind the panel (Behind); (d) control area.
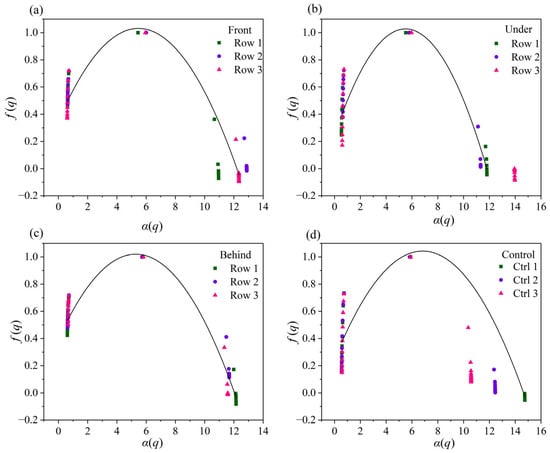
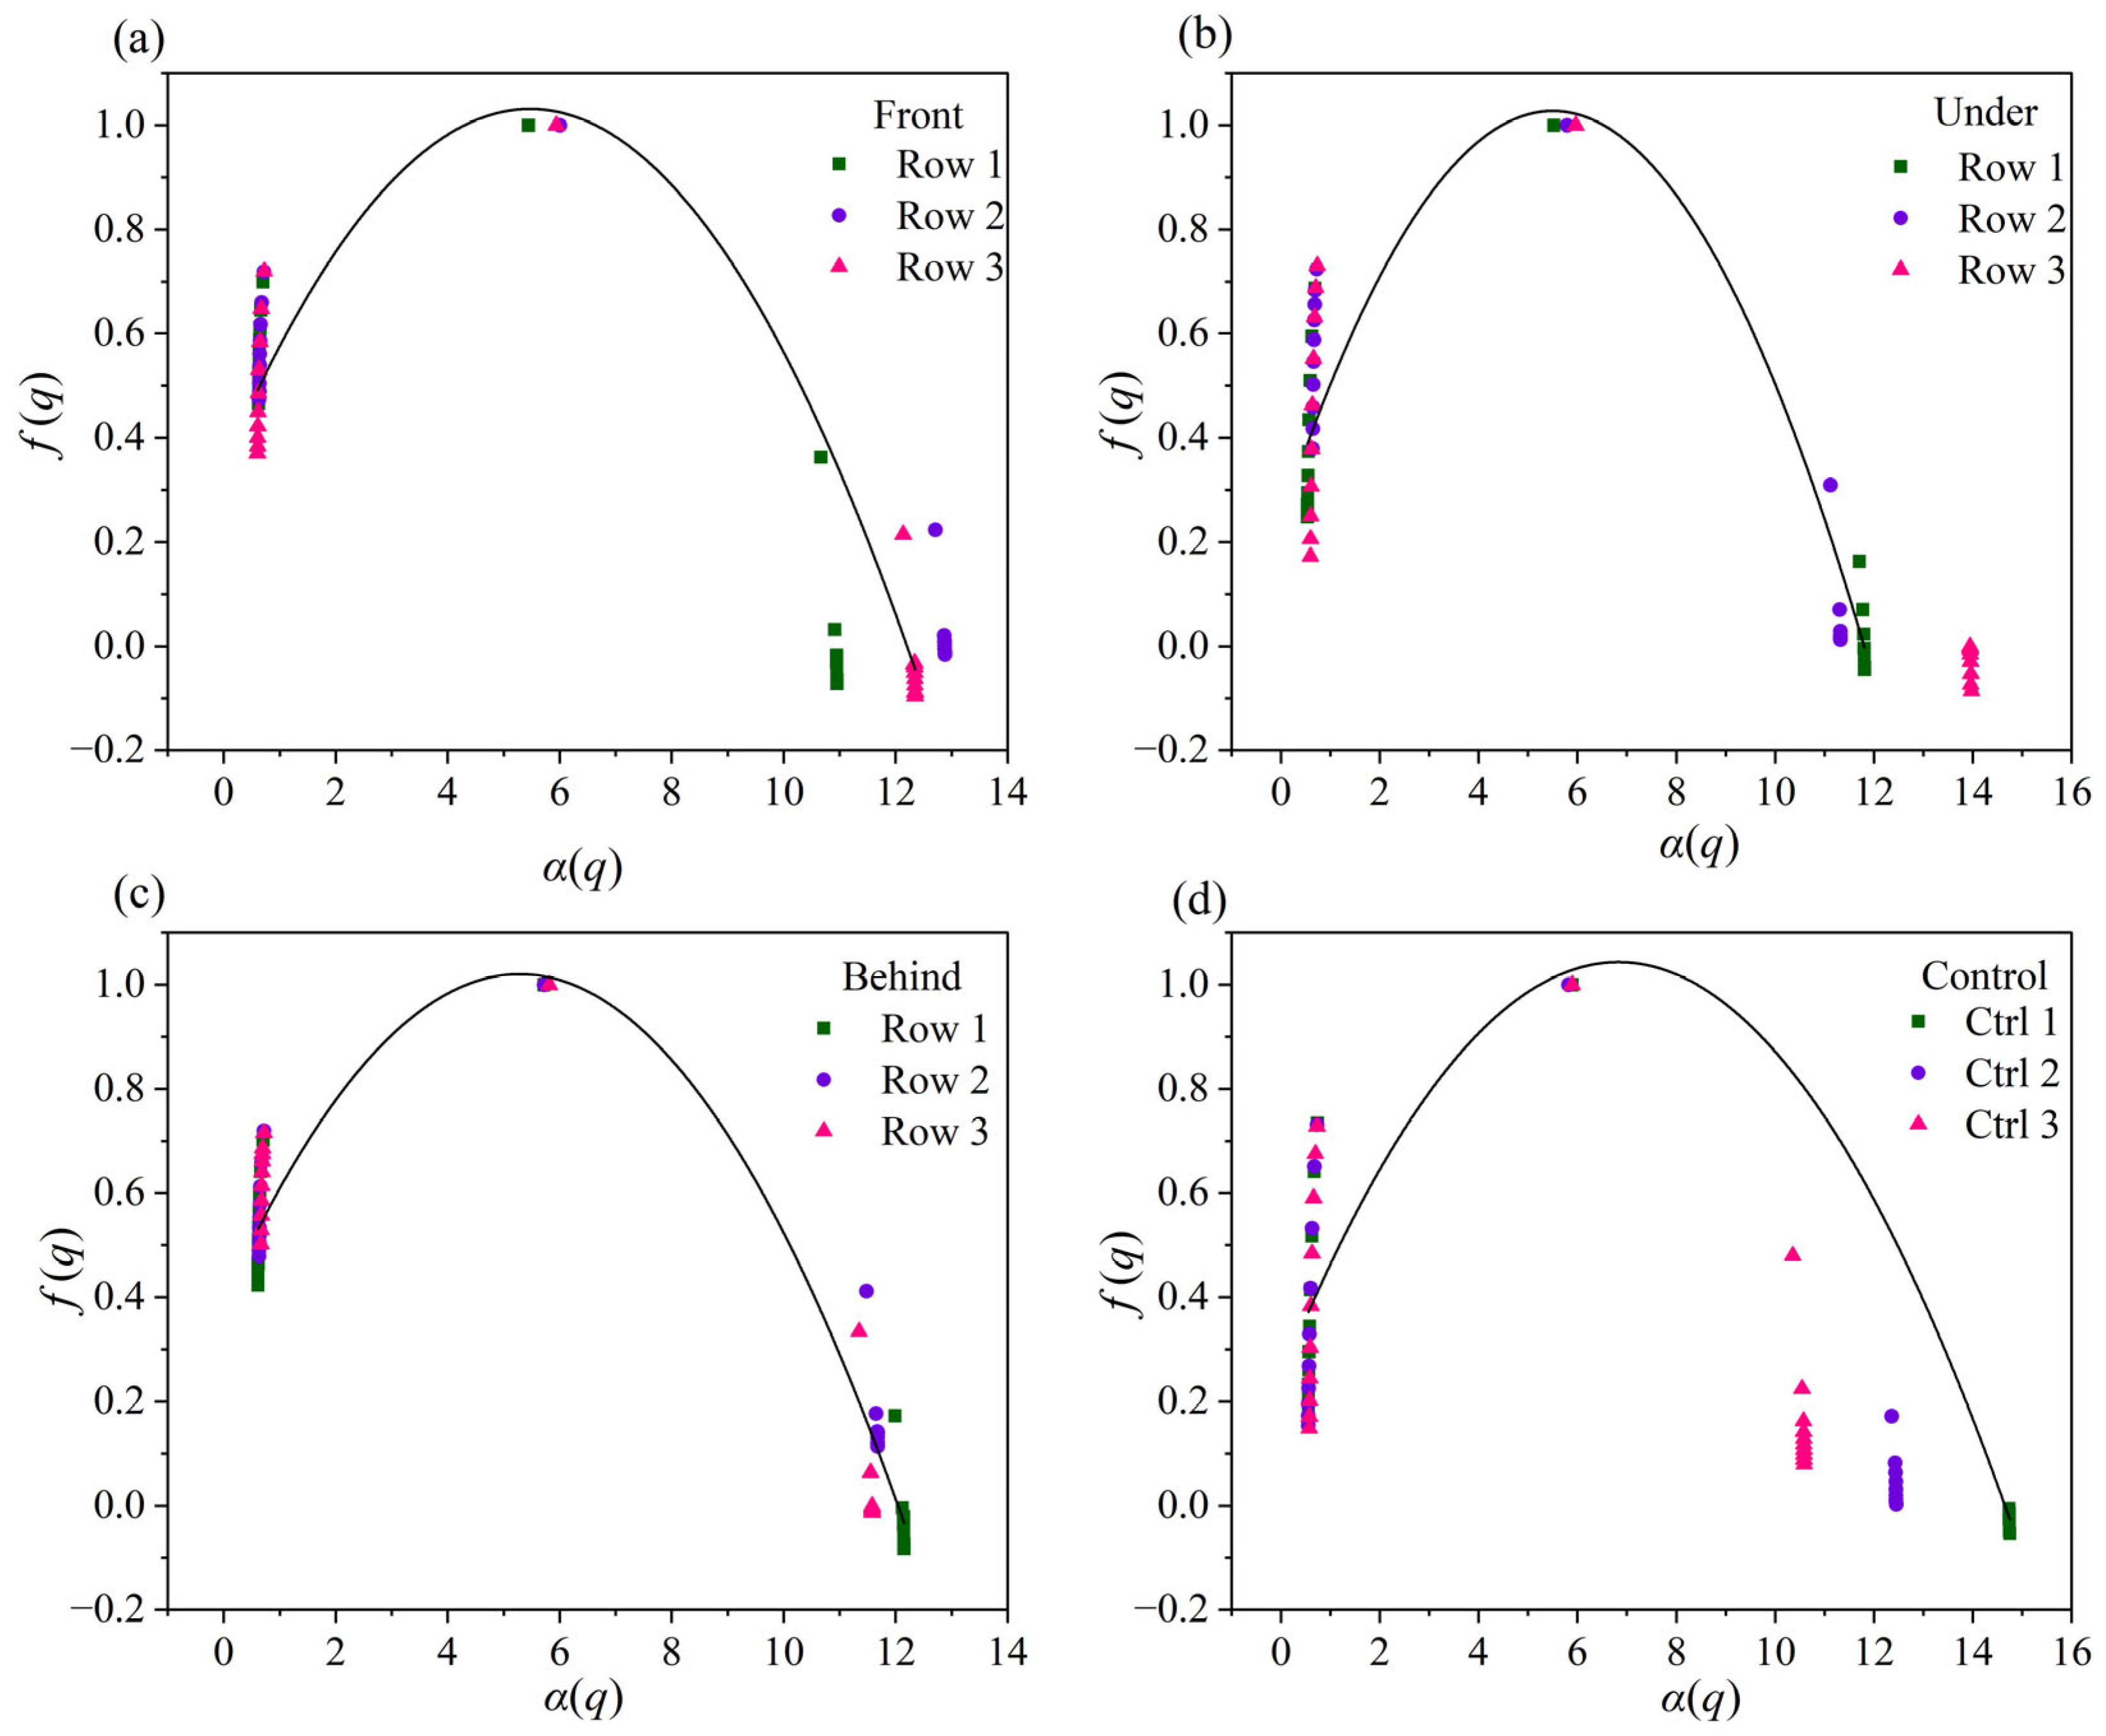
The singularity spectra (f(α)) further revealed the local density fluctuations of soil particles across the different micro-environments (Figure 6). To transparently report the singularity spectrum metrics discussed here, average values are provided in the Results section. The symmetry of the spectrum (Fv or Δf) reflects the shape characteristics and dominant probability subsets. All samples exhibited a left-skewed asymmetry (Fv > 0), with average values of 1.075, 1.041, 1.025, and 0.991 for the Front, Under, Behind, and Control areas, respectively. This asymmetric characteristic indicates that large-probability subsets dominated the soil PSD. The degree of asymmetry (Δf) was slightly higher in the PV micro-locations compared to the Control area. The spectral width (Av or Δα = αmax − αmin) varied spatially, reaching its maximum directly Under the panels (12.446) and its minimum at the Front edge (11.749). Additionally, the mean singularity index (α0) displayed a distinct decreasing sequence: Front (5.885) > Control (5.869) > Under (5.802) > Behind (5.757).
Figure 6.
Multifractal singularity spectra (f(α) versus α) of soil PSD across different micro-locations (a) In front of the panel (Front); (b) beneath the panel (Under); (c) behind the panel (Behind); (d) control area.
3.3. Correlation Analysis of Soil PSD and Multifractal Dimensions at Different Locations of PV Panels
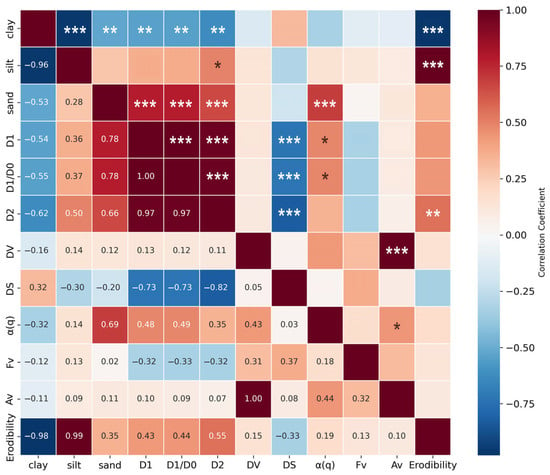
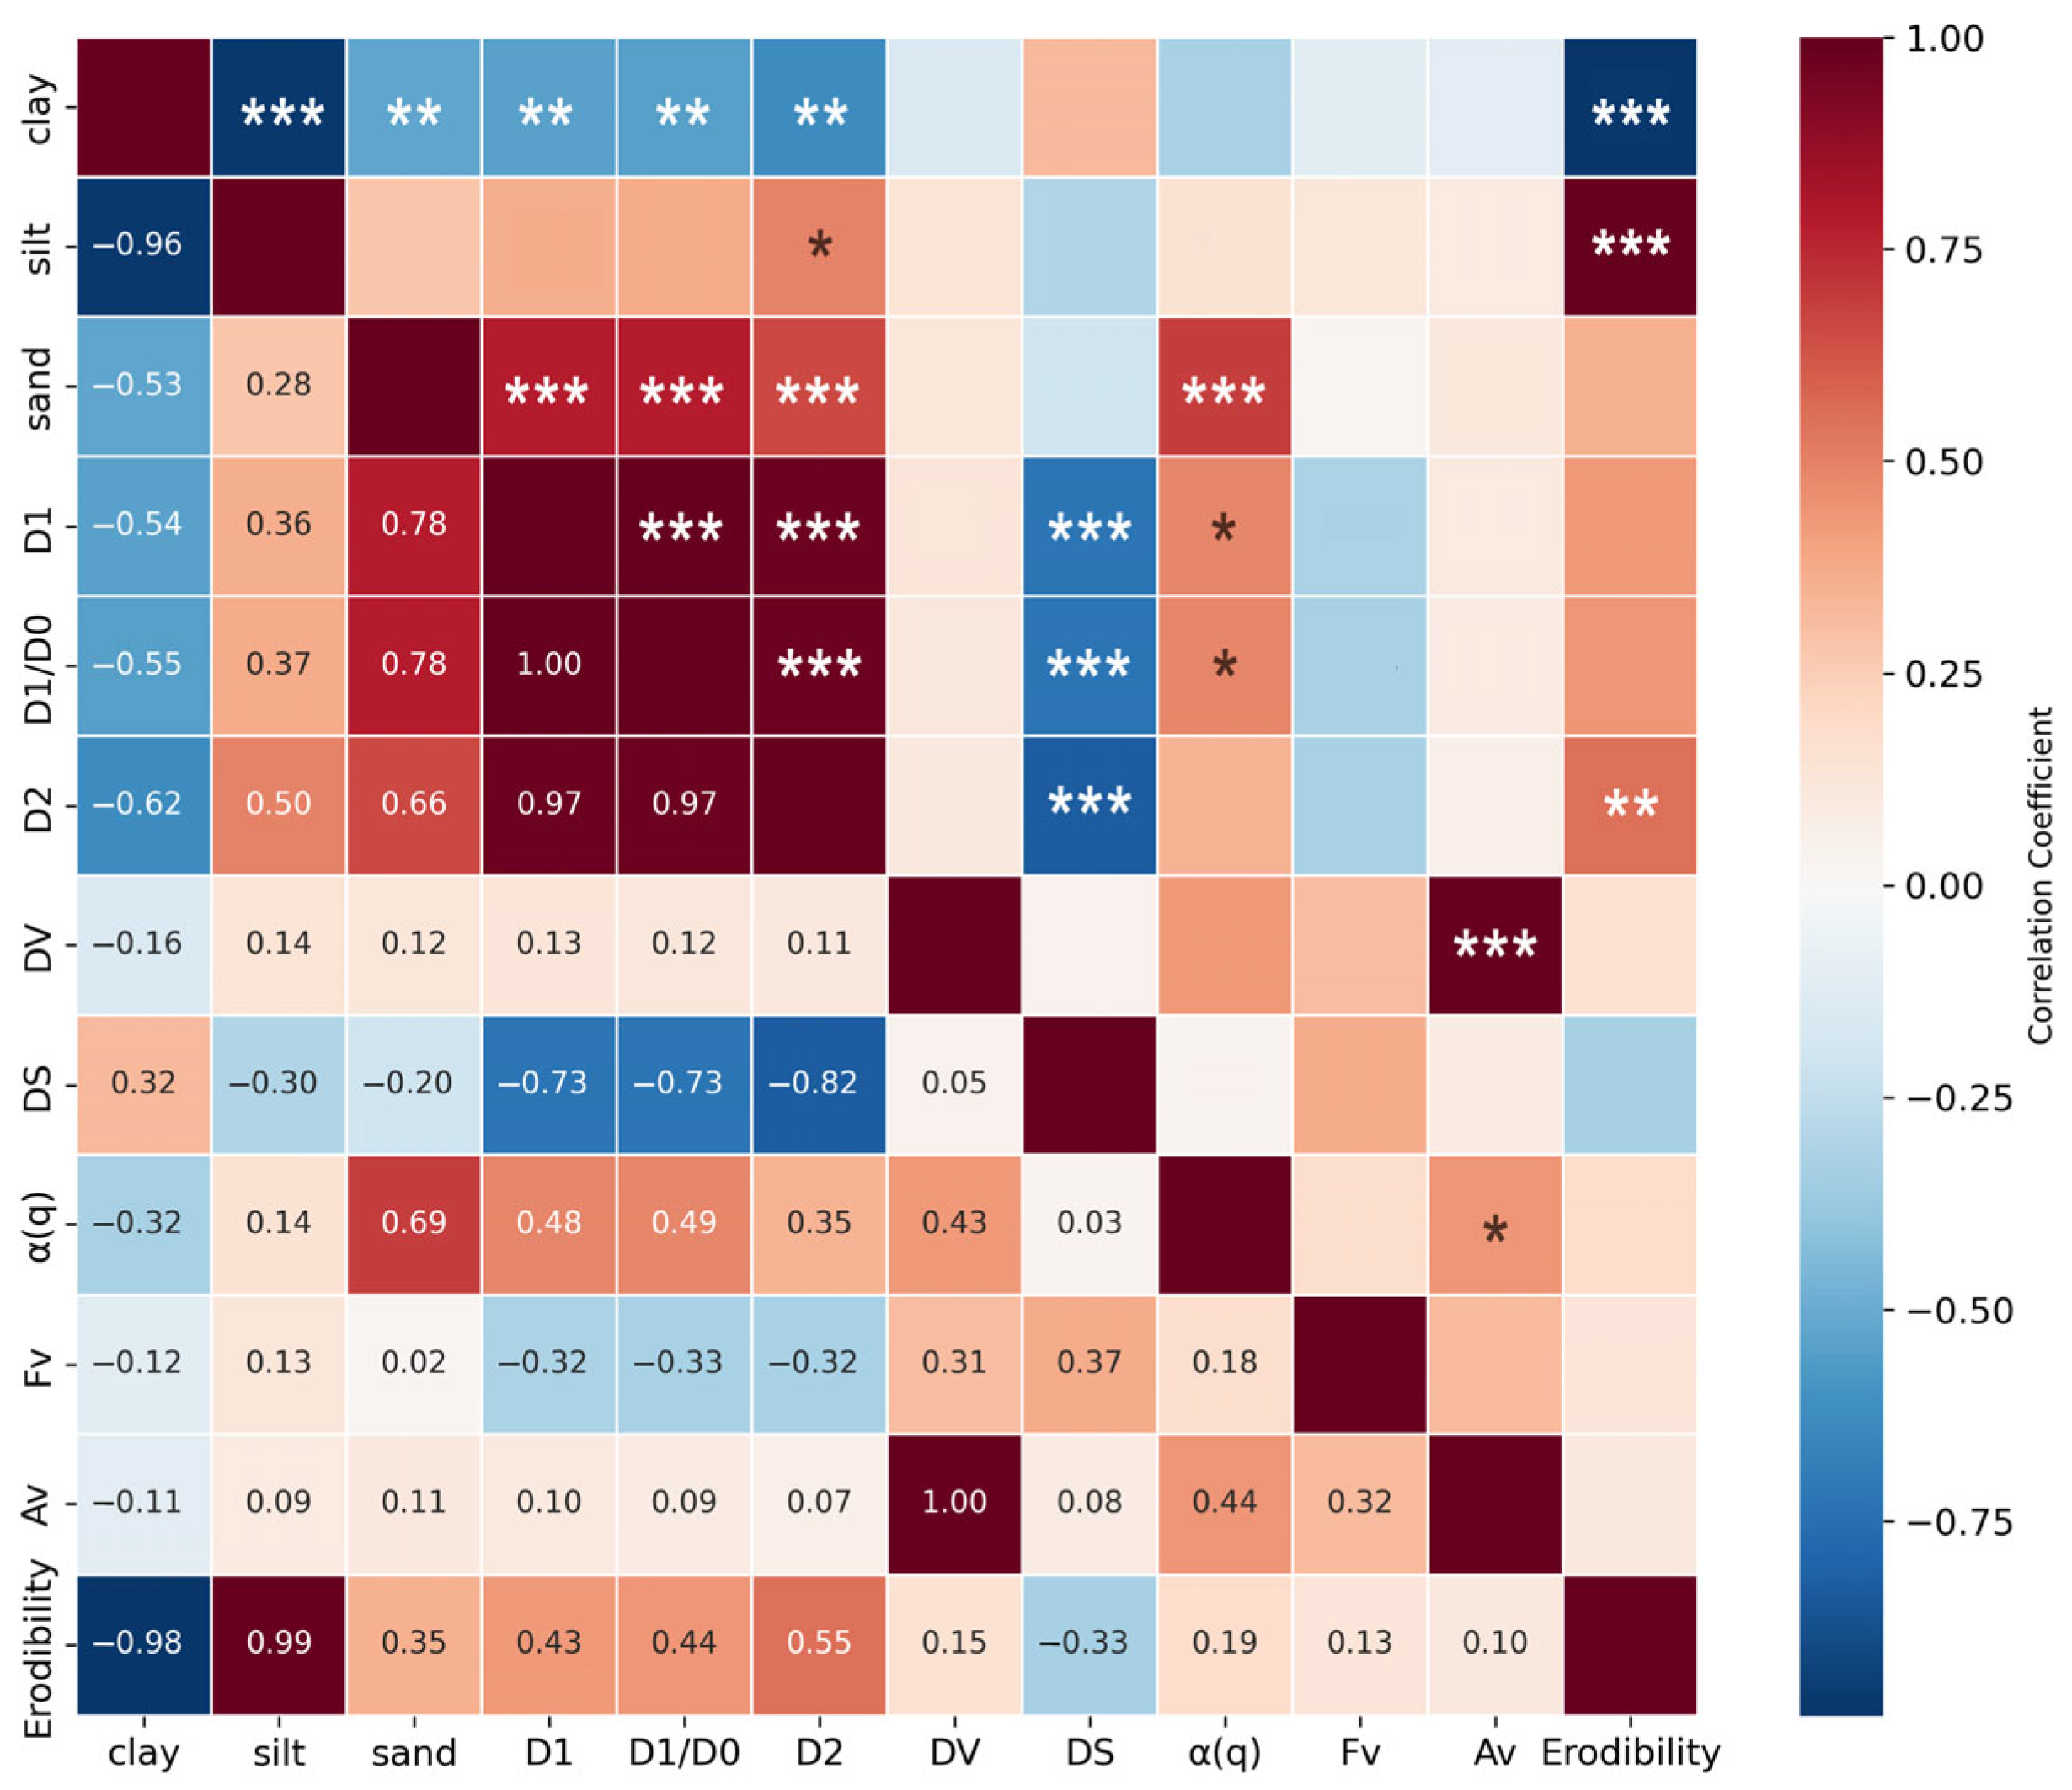
Pearson correlation analysis (Figure 7) was conducted to evaluate exploratory associations among soil particle fractions, SOC, multifractal parameters, and EPIC-estimated erodibility. The analysis revealed a bipartite covariation pattern between particle redistribution and multifractal dimensions. Specifically, sand content exhibited a highly significant positive correlation with D1, D1/D0, and D2 (p < 0.001). Conversely, clay content was significantly negatively correlated with these multifractal parameters (p < 0.01). Silt content, consistent with its low spatial variation, showed no significant correlation with the multifractal dimensions.
Figure 7.
Pearson correlation matrix among soil erodibility, multifractal parameters, and soil PSD. (*, **, and *** indicate significance at p < 0.05, p < 0.01, and p < 0.001, respectively).
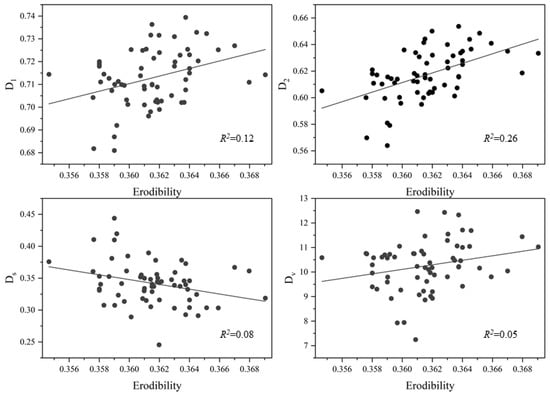
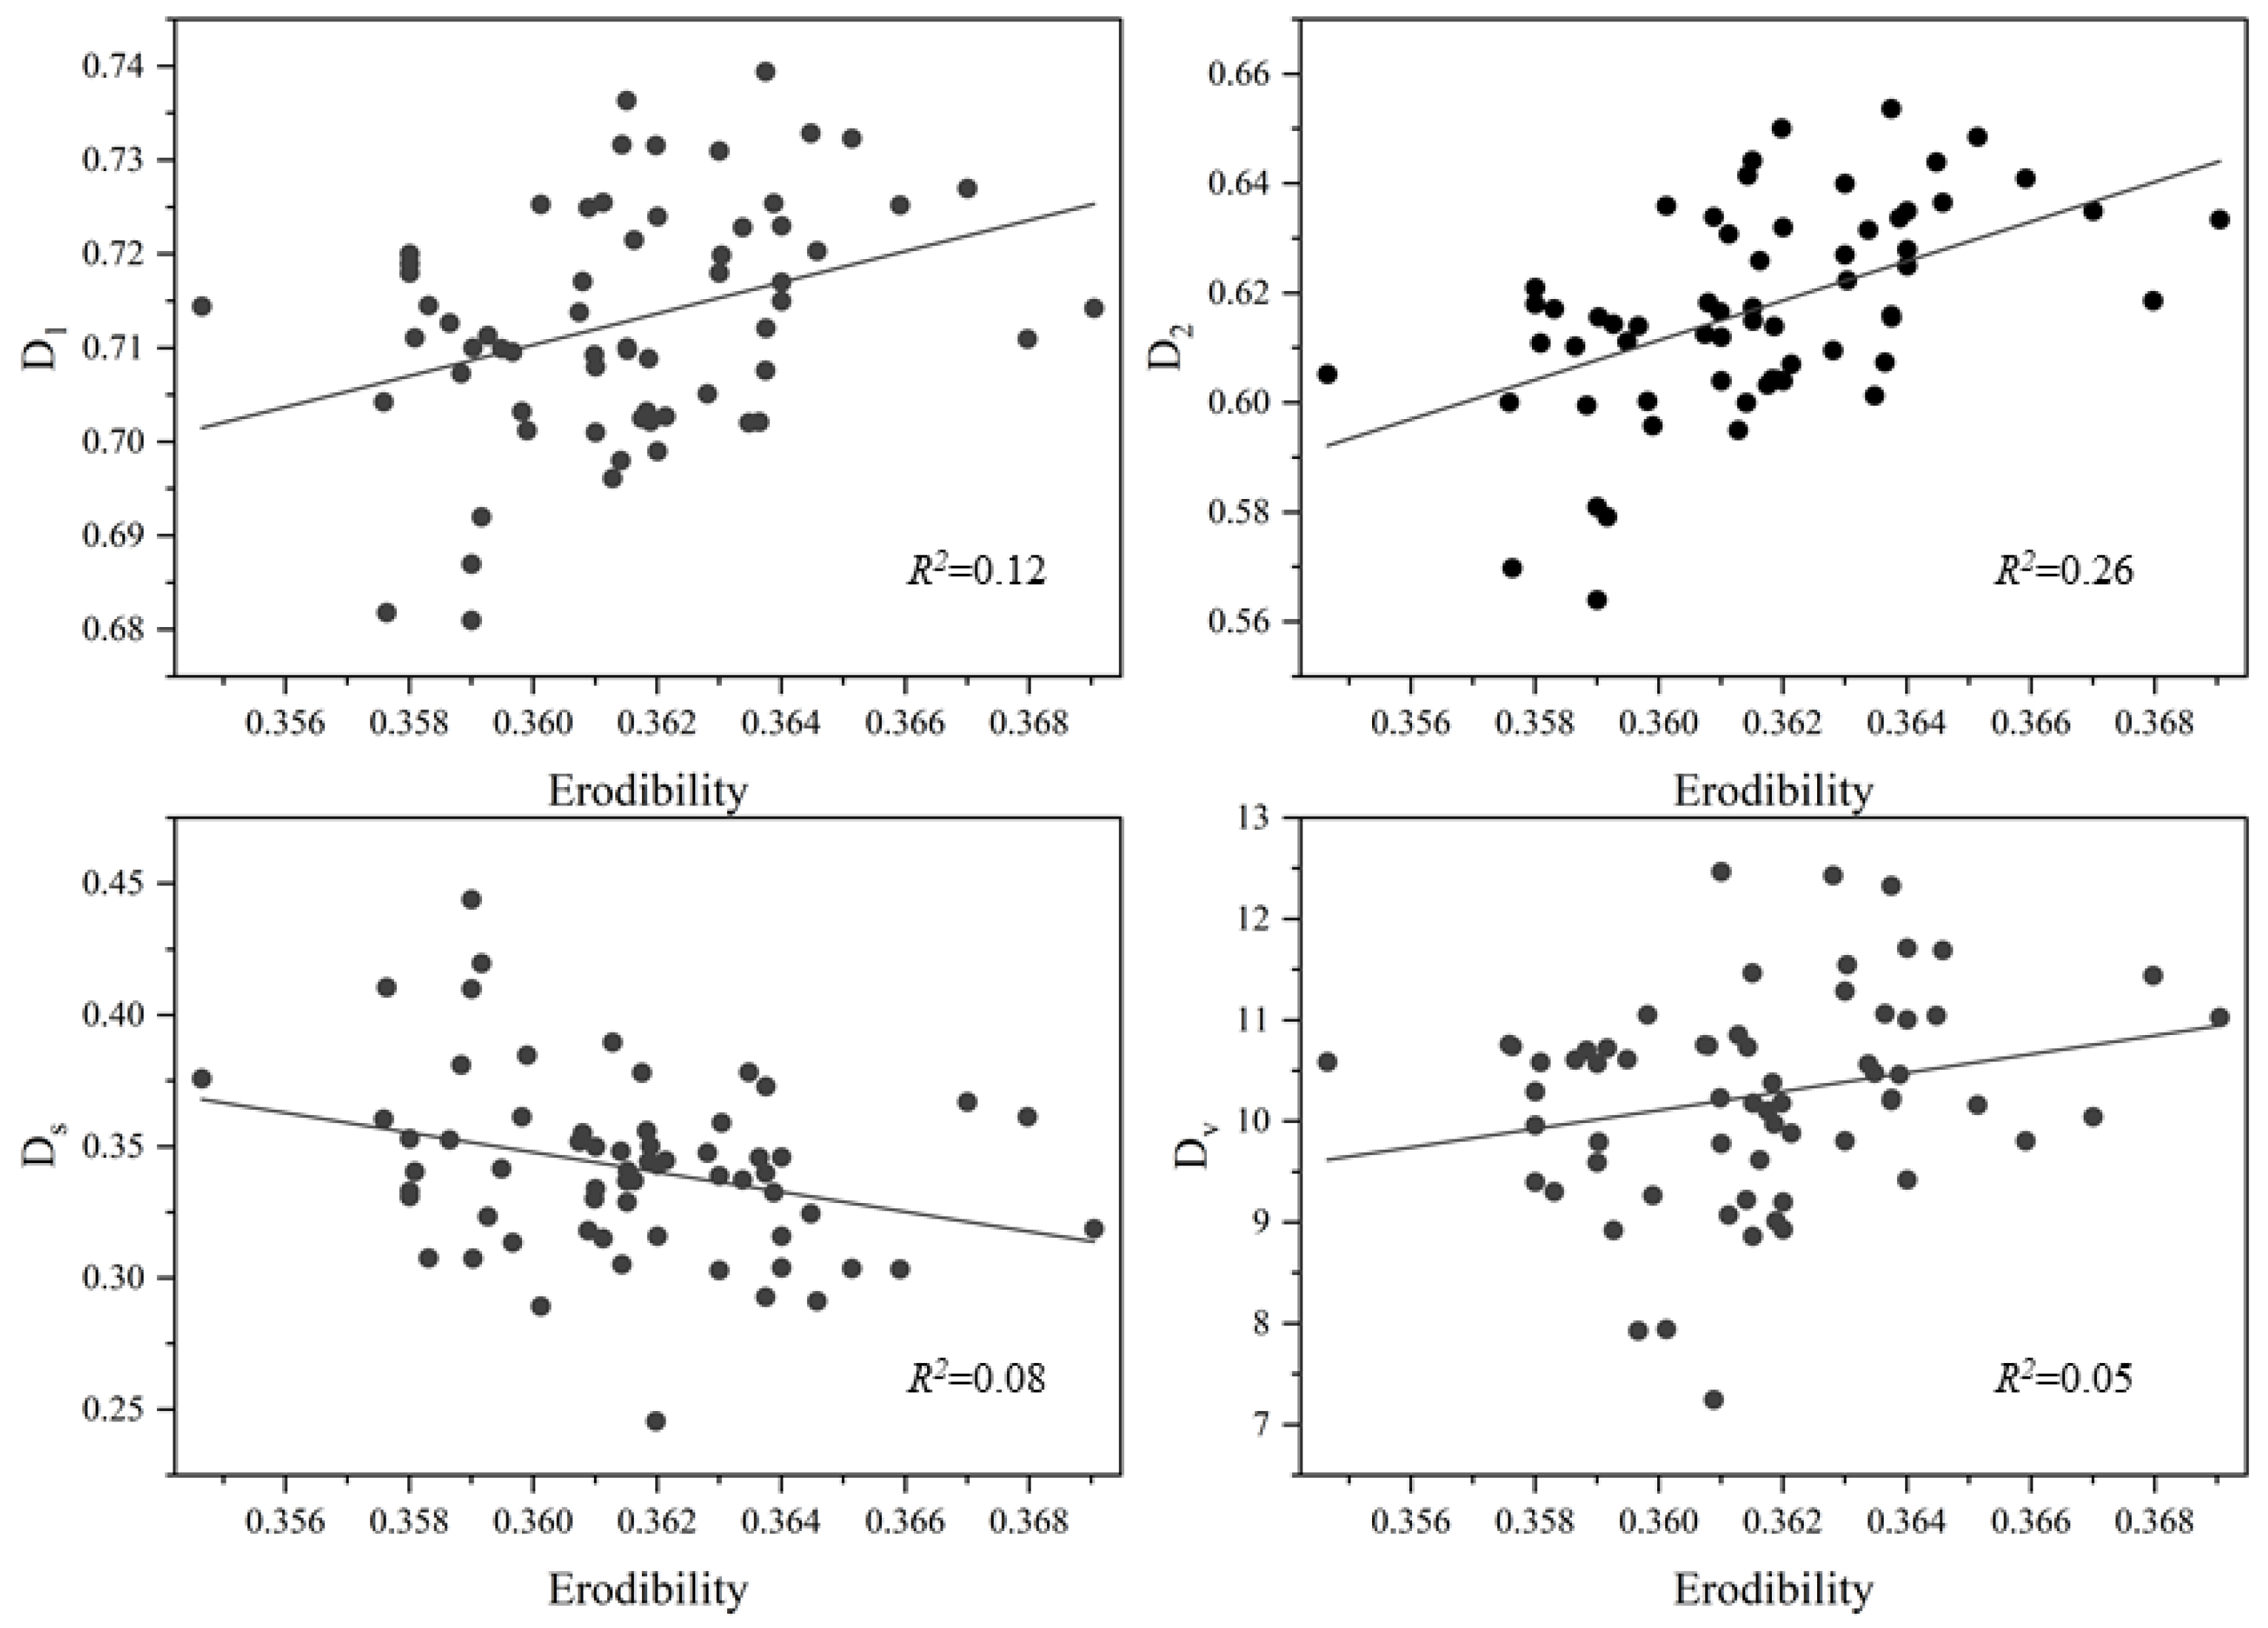
The analysis also indicated partial covariation between multifractal descriptors and EPIC-estimated intrinsic erodibility. The K-factor demonstrated a significant positive correlation with the correlation dimension D2 (r = 0.55, p < 0.01), as well as moderate positive correlations with D1 and D1/D0 (r = 0.43 and 0.44). Linear regression analysis (Figure 8) further indicated a positive but modest relationship between D2 and the K-factor (R2 = 0.2638, p < 0.05). This relatively low R2 value suggests that multifractal parameters explain only part of the variation in KEPIC, which is reasonable because KEPIC is calculated from soil texture and SOC, whereas actual erosion processes are also influenced by microtopography, vegetation, surface roughness, biological soil crusts, and near-surface wind conditions. Thus, these statistical relationships are treated as exploratory covariation rather than direct causal evidence.
Figure 8.
Linear regression relationships between multifractal parameters and soil erodibility.
4. Discussion
4.1. Response of Soil Multifractal Features to PV Panel-Induced Micro-Environments
Previous studies have examined correlations between multifractal dimensions and soil PSD [24]. Contrasting relationships have been observed across ecosystems. For instance, Wang et al. [25]. reported that in alpine cold grasslands, D1 and D2 were significantly positively correlated with clay and silt contents, but negatively correlated with sand content. This contrasts with our findings, where D1 and D2 were negatively correlated with clay but positively correlated with sand content in the PV power plant. This divergence may reflect the micro-environmental alterations induced by PV panels, which introduce a complex disturbance regime. The panels increase surface aerodynamic roughness, modify near-surface wind velocity, redistribute precipitation, and create artificial shading. These aerodynamic and hydrothermal changes may facilitate fine-particle retention and alter particle-size probability distributions. Because multifractal parameters are sensitive to changes in dominant particle fractions, the enrichment or depletion of specific particles under PV panels can shift the relationship between multifractal dimensions and conventional PSD fractions [26].
The results of this study further revealed that the PSD probability structure in the PV power plant differs from that in the Control area. Although the capacity dimension D0 remains relatively constant at 0.913 across all sites, this value should be interpreted as a finite-scale estimate constrained by the selected particle-size range, logarithmic transformation, and partitioning scheme rather than as a theoretical value for a fully continuous one-dimensional distribution. The Control area exhibited higher D1 and D2 values, indicating a more even distribution across the considered particle-size intervals. In contrast, lower D1 and D2 values in PV micro-locations indicate stronger local probability concentration or clustering of particle-size fractions. Thus, the PV panels appear to alter particle-size organization and sorting patterns rather than simply increasing generalized soil structural complexity.
It is also worth noting that discrepancies in the symmetry parameters Dv and Ds between the Control and PV areas were relatively minor. This suggests that while the PV plant profoundly alters the concentration and uniformity of the dominant particle fractions, as captured by D1 and D2, it has a negligible influence on the extreme fluctuations in particle distribution at larger scales. Nonetheless, the significant differences observed in these core informative dimensions highlight the extreme sensitivity of soil structural stability and subsequent erodibility to fine-scale structural alterations.
The observed redistribution of fine and coarse particles can also be interpreted within the framework of dust emission–deposition processes. In open desert steppes, strong near-surface winds may preferentially entrain fine particles and promote selective particle removal, producing a surface layer shaped by long-term aeolian sorting. In contrast, PV panels modify the near-surface aerodynamic environment by increasing surface roughness, reducing wind velocity in sheltered zones, and generating localized turbulence near panel edges. These processes may reduce dust emission in sheltered areas while enhancing fine-particle retention and localized deposition. At the same time, the Front edge of panels may experience wind compression and enhanced shear, the Under-panel zone may be affected by shading, moisture retention, and drip redistribution, and the Behind-panel zone may be influenced by wake turbulence and deposition. This coupled emission–deposition mechanism provides a plausible explanation for the observed PSD and multifractal differences among Front, Under, and Behind micro-locations.
These mechanisms are consistent with field observations from a solar PV array in the Hobq (Kubuqi) Desert, where PV panels modified near-surface wind–sand movement and produced spatially heterogeneous erosion–deposition patterns around panel rows [15]. A recent desert-PV assessment also showed that large-scale PV development can differentiate ecological and environmental conditions inside operation zones from adjacent areas [27]. Evidence from the Mu Us Sandy Land further indicates that wind-erosion-related soil particle-size composition and SOC/TN are strongly controlled by land-surface disturbance and reclamation history [28]. Together, these studies suggest that the PV-induced PSD responses observed here should be viewed as site-specific dryland surface-process changes rather than a universal direction of change.
4.2. Spatial Heterogeneity of Soil Erodibility and Its Structural Drivers
The micro-environmental alterations induced by PV panels have potential implications for soil conservation. As evidenced by our results, the EPIC-estimated K-factor decreased from 0.452 in the Control area to approximately 0.361 in the PV micro-locations, suggesting lower model-estimated intrinsic erodibility within the PV plant. This result should be interpreted as a texture- and SOC-based estimate rather than a direct measurement of wind erosion. The lower KEPIC values are partly related to changes in soil texture and SOC that are embedded in the EPIC equation.
To further assess the factors associated with this reduced model-estimated erodibility, the spatial variations in soil characteristics across different locations (Front, Under, and Behind) were analyzed. The correlation analysis demonstrated that D1 and D2 are positively associated with the EPIC-estimated K-factor. This association suggests that more even particle-size probability distributions, represented by higher multifractal dimensions, tend to occur with higher texture- and SOC-based erodibility estimates, whereas stronger local probability concentration is associated with lower KEPIC values. However, this relationship should be interpreted descriptively because KEPIC and multifractal parameters both depend on PSD-related information.
The relationship between multifractal dimensions and EPIC-estimated erodibility exhibits spatial variability within the PV micro-habitats. For instance, the correlation coefficient between D2 and erodibility under the PV panel reaches 0.47, which is stronger than the values of 0.15 and 0.11 observed at the front and rear locations, respectively. This pattern is consistent with Huang et al., who emphasized that the spatial variability of the K value is highly dependent on localized topography and external stressors [29]. At the location directly under the PV panel, particle sorting may be affected by localized aerodynamic interactions, shading, and potential drip redistribution from panel edges [15]. The relatively higher sand content and lower clay content observed in Row 3 Under may reflect cumulative flow channeling, wake interaction, or runoff redistribution within the array. Because direct measurements of wind velocity, vorticity, runoff, and sediment transport were not conducted, these mechanisms should be regarded as plausible explanations that require future validation.
Because the EPIC-derived K-factor is calculated from soil texture fractions and SOC, it is not statistically independent of PSD-derived multifractal parameters. Therefore, the observed correlations between multifractal dimensions and KEPIC should not be interpreted as direct causal evidence that multifractal structure independently controls soil erodibility. Rather, these relationships indicate that multifractal parameters capture PSD sorting and particle-distribution heterogeneity that are also reflected in the texture- and SOC-based erodibility equation. This limitation should be considered when applying multifractal descriptors as proxy indicators of erosion susceptibility.
Several limitations remain. First, EPIC-estimated erodibility was not independently validated using field measurements of wind erosion, dust flux, sediment transport, or sediment traps. Second, the correlation analysis between KEPIC and PSD-derived multifractal parameters is partly constrained by shared input information because KEPIC is calculated from texture and SOC. Third, vegetation cover was described qualitatively rather than quantitatively. Finally, this study was conducted at a single PV plant and during one sampling period. Future studies should combine PSD multifractal analysis with direct measurements of near-surface wind fields, surface roughness, soil crusting, vegetation cover, biological soil crusts, and sediment transport to validate the mechanisms inferred here.
5. Conclusions
This study examined how utility-scale PV plants alter soil particle-size organization and model-estimated intrinsic erodibility in desert steppes. The results show that PV panels are associated with localized particle redistribution, fine-particle retention, and distinct spatial variability among Front, Under, and Behind micro-locations. Compared with the Control area, the PV micro-locations exhibited lower information and correlation dimensions (D1 and D2), indicating stronger local clustering and a less even particle-size probability distribution, while the EPIC-estimated K-factor decreased from 0.452 to approximately 0.361. These patterns suggest that PV infrastructure can reshape surface soil particle organization and texture- and SOC-based intrinsic erodibility at the microhabitat scale. By capturing scale-dependent probability redistribution beyond conventional clay, silt, and sand fractions, multifractal parameters, especially D1 and D2, provide sensitive complementary descriptors for identifying PV-induced particle sorting and soil structural responses. The integration of laser diffraction PSD analysis, multifractal modeling, SOC measurement, and EPIC-estimated erodibility therefore offers a useful framework for evaluating soil physical changes under renewable-energy land use in fragile dryland ecosystems. By linking renewable-energy infrastructure with soil conservation concerns, this framework contributes to sustainability research by helping reconcile clean-energy expansion with the protection of fragile dryland soils. Future studies that combine this framework with direct measurements of near-surface wind fields, dust fluxes, sediment transport, vegetation, and biological soil crusts will further support sustainable planning, soil conservation, and adaptive management of dryland solar farms.
Author Contributions
B.H.: writing—original draft, validation. X.T.: writing—review and editing, funding acquisition. Z.T.: investigation. All authors have read and agreed to the published version of the manuscript.
Funding
This research was funded by the National Natural Science Foundation of China (No. 42367046), the China Postdoctoral Science Foundation (2025MD784103), the Natural Science Foundation of the Inner Mongolia Autonomous Region (2025QN04003), the Science and Technology Major Project of Inner Mongolia (2025YFHH0216), the Technical Study of the Huaneng Group Science and Technology Project (HNKJ24-H116), and the Inner Mongolia Agricultural University Scientific Research Project (YLXKZX-NND-034, YLXKZX-NND-009).
Institutional Review Board Statement
Not applicable.
Informed Consent Statement
Not applicable.
Data Availability Statement
The original contributions presented in this study are included in the article. Further inquiries can be directed to the corresponding author.
Conflicts of Interest
This study was funded by the Huaneng Group Science and Technology Project (HNKJ24-Hl16). The funder had no role in the design of the study; in the collection, analyses, or interpretation of data; in the writing of the manuscript; or in the decision to publish the results. The authors declare no other conflicts of interest.
References
- Armstrong, A.; Waldron, S.; Whitaker, J.; Ostle, N.J. Wind Farm and Solar Park Effects on Plant–Soil Carbon Cycling: Uncertain Impacts of Changes in Ground-Level Microclimate. Glob. Change Biol. 2014, 20, 1699–1706. [Google Scholar] [CrossRef] [Scilit] [PubMed]
- Zhang, K.; Li, S.; Peng, W.; Yu, B. Erodibility of Agricultural Soils on the Loess Plateau of China. Soil Tillage Res. 2004, 76, 157–165. [Google Scholar] [CrossRef] [Scilit]
- Montero, E. Rényi Dimensions Analysis of Soil Particle-Size Distributions. Ecol. Model. 2005, 182, 305–315. [Google Scholar] [CrossRef]
- Ghanbarian-Alavijeh, B.; Millán, H. The Relationship between Surface Fractal Dimension and Soil Water Content at Permanent Wilting Point. Geoderma 2009, 151, 224–232. [Google Scholar] [CrossRef] [Scilit]
- Rawls, W.J.; Brakensiek, D.L.; Logsdon, S.D. Predicting Saturated Hydraulic Conductivity Utilizing Fractal Principles. Soil Sci. Soc. Am. J. 1993, 57, 1193–1197. [Google Scholar] [CrossRef] [Scilit]
- Zhou, Z.C.; Gan, Z.T.; Shangguan, Z.P.; Dong, Z.B. Effects of Grazing on Soil Physical Properties and Soil Erodibility in Semiarid Grassland of the Northern Loess Plateau (China). CATENA 2010, 82, 87–91. [Google Scholar] [CrossRef] [Scilit]
- Zhang, W.; Guo, S.L.; Li, Y.H.; Li, Y.Y. Grain-Size Fractal Dimension of Loess and Its Environmental Significance in the Peninsula of East Liaoning. Prog. Geogr. 2010, 29, 79–86. [Google Scholar] [CrossRef]
- Carollo, F.G.; Di Stefano, C.; Nicosia, A.; Palmeri, V.; Pampalone, V.; Ferro, V. Flow Resistance in Mobile Bed Rills Shaped in Soils with Different Texture. Eur. J. Soil Sci. 2021, 72, 2062–2075. [Google Scholar] [CrossRef] [Scilit]
- Filgueira, R.R.; Fournier, L.L.; Cerisola, C.I.; Gelati, P.; García, M.G. Particle-Size Distribution in Soils: A Critical Study of the Fractal Model Validation. Geoderma 2006, 134, 327–334. [Google Scholar] [CrossRef] [Scilit]
- Liao, R.; Yu, H.; Yang, P. Multifractal Analysis of Soil Particle Size Distribution to Evaluate the Effects of Gypsum on the Quality of Sodic Soils. Eur. J. Soil Sci. 2021, 72, 1726–1741. [Google Scholar] [CrossRef] [Scilit]
- Tyler, S.W.; Wheatcraft, S.W. Fractal Scaling of Soil Particle-Size Distributions: Analysis and Limitations. Soil Sci. Soc. Am. J. 1992, 56, 362–369. [Google Scholar] [CrossRef] [Scilit]
- Qiao, J.; Zhu, Y.; Jia, X.; Shao, M. Multifractal Characteristics of Particle Size Distributions (50–200 m) in Soils in the Vadose Zone on the Loess Plateau, China. Soil Tillage Res. 2021, 205, 104786. [Google Scholar] [CrossRef] [Scilit]
- Sun, K.; Wang, H.; Pei, Z.; Wang, H.; Sun, X.; Li, Y.; Sun, G.; Alatengsuhe; Yang, J.; Su, X. Particle-Size Fractal Dimensions and Pore Structure Characteristics of Soils of Typical Vegetation Communities in the Kubuqi Desert. Front. Environ. Sci. 2023, 10, 1044224. [Google Scholar] [CrossRef] [Scilit]
- Wang, N.; Eziz, M.; Mao, D.; Sidekjan, N. Fractal Characteristics of the Particle Size Distribution of Soil along an Urban–Suburban–Rural–Desert Gradient. Land 2023, 12, 2120. [Google Scholar] [CrossRef] [Scilit]
- Tang, G.; Meng, Z.; Gao, Y.; Dang, X. Wind-Sand Movement Characteristics and Erosion Mechanism of a Solar Photovoltaic Array in the Middle of the Hobq Desert, Northwestern China. J. Mt. Sci. 2021, 18, 1340–1351. [Google Scholar] [CrossRef] [Scilit]
- Walkley, A.; Black, I.A. An Examination of the Degtjareff Method for Determining Soil Organic Matter, and a Proposed Modification of the Chromic Acid Titration Method. Soil Sci. 1934, 37, 29–38. [Google Scholar] [CrossRef] [Scilit]
- Eshel, G.; Levy, G.J.; Mingelgrin, U.; Singer, M.J. Critical Evaluation of the Use of Laser Diffraction for Particle-Size Distribution Analysis. Soil Sci. Soc. Am. J. 2004, 68, 736–743. [Google Scholar] [CrossRef]
- Martin, M.Á.; Montero, E. Laser Diffraction and Multifractal Analysis for the Characterization of Dry Soil Volume-Size Distributions. Soil Tillage Res. 2002, 64, 113–123. [Google Scholar] [CrossRef] [Scilit]
- Hentschel, H.G.E.; Procaccia, I. The Infinite Number of Generalized Dimensions of Fractals and Strange Attractors. Phys. D Nonlinear Phenom. 1983, 8, 435–444. [Google Scholar] [CrossRef] [Scilit]
- Rényi, A. On a New Axiomatic Theory of Probability. Acta Math. Acad. Sci. Hung. 1955, 6, 285–335. [Google Scholar] [CrossRef] [Scilit]
- Paz-Ferreiro, J.; Vázquez, E.V.; Miranda, J.G. V Assessing Soil Particle-Size Distribution on Experimental Plots with Similar Texture under Different Management Systems Using Multifractal Parameters. Geoderma 2010, 160, 47–56. [Google Scholar] [CrossRef] [Scilit]
- Williams, J.R.; Renard, K.G.; Dyke, P.T. EPIC: A New Method for Assessing Erosion’s Effect on Soil Productivity. J. Soil Water Conserv. 1983, 38, 381–383. [Google Scholar] [CrossRef] [Scilit]
- Zhang, K.L.; Shu, A.P.; Xu, X.L.; Yang, Q.K.; Yu, B. Soil Erodibility and Its Estimation for Agricultural Soils in China. J. Arid Environ. 2008, 72, 1002–1011. [Google Scholar] [CrossRef] [Scilit]
- Su, Y.Z.; Zhao, H.L.; Zhao, W.Z.; Zhang, T.H. Fractal Features of Soil Particle Size Distribution and the Implication for Indicating Desertification. Geoderma 2004, 122, 43–49. [Google Scholar] [CrossRef] [Scilit]
- Wang, X.; Sun, L.; Zhao, N.; Li, W.; Wei, X.; Niu, B. Multifractal Dimensions of Soil Particle Size Distribution Reveal the Erodibility and Fertility of Alpine Grassland Soils in the Northern Tibet Plateau. J. Environ. Manag. 2022, 315, 115145. [Google Scholar] [CrossRef] [Scilit] [PubMed]
- Mallick, J.; Al-Wadi, H.; Rahman, A.; Ahmed, M.; Abad Khan, R. Spatial Variability of Soil Erodibility and Its Correlation with Soil Properties in Semi-Arid Mountainous Watershed, Saudi Arabia. Geocarto Int. 2016, 31, 661–681. [Google Scholar] [CrossRef] [Scilit]
- Wu, W.; Chen, H.; Li, C.; Lu, G.; Ye, D.; Ma, C.; Ren, L.; Li, G. Assessment of the Ecological and Environmental Effects of Large-Scale Photovoltaic Development in Desert Areas. Sci. Rep. 2024, 14, 22456. [Google Scholar] [CrossRef] [Scilit] [PubMed]
- Liu, X.; Du, H.; Li, S.; Wang, T.; Fan, Y. Effects of Different Cropland Reclamation Periods on Soil Particle Size and Nutrients From the Perspective of Wind Erosion in the Mu Us Sandy Land. Front. Environ. Sci. 2022, 10, 861273. [Google Scholar] [CrossRef] [Scilit]
- Huang, X.; Lin, L.; Ding, S.; Tian, Z.; Zhu, X.; Wu, K.; Zhao, Y. Characteristics of Soil Erodibility K Value and Its Influencing Factors in the Changyan Watershed, Southwest Hubei, China. Land 2022, 11, 134. [Google Scholar] [CrossRef] [Scilit]

Disclaimer/Publisher’s Note: The statements, opinions and data contained in all publications are solely those of the individual author(s) and contributor(s) and not of MDPI and/or the editor(s). MDPI and/or the editor(s) disclaim responsibility for any injury to people or property resulting from any ideas, methods, instructions or products referred to in the content. |
© 2026 by the authors. Licensee MDPI, Basel, Switzerland. This article is an open access article distributed under the terms and conditions of the Creative Commons Attribution (CC BY) license.