


Abstract
Consumer trust is critical to the sustainable development of cross-border B2C e-commerce platforms. Accurately evaluating and diagnosing trust weaknesses has become a key concern for both practitioners and researchers. To address the inherent limitations of existing trust evaluation methods, this study proposes an improved AHP-Ridge Regression hybrid model that integrates expert knowledge with actual consumer perception data. First, an improved Analytic Hierarchy Process based on stakeholder-oriented nonlinear programming is employed to optimize the evaluation weights of nine experts, reduce subjective bias, and generate expert prior weights for each dimension and indicator. Second, these prior weights are incorporated as the regularization prior mean of the Ridge Regression model to construct the improved AHP-Ridge Regression model. Based on survey data from 387 valid respondents across five major cross-border platforms (Tmall Global, JD International, Pinduoduo Global, Sam’s Club Global, and CDFG Duty-Free), the model is compared with six baseline models using a 30-times repeated five-fold nested cross-validation. The proposed model achieves the lowest RMSE (0.3179) and highest R2 (0.6510) among all compared models, with statistically significant improvements over all baselines (Nadeau–Bengio-corrected p < 0.001, large Cohen’s d effect sizes). However, the improvement over conventional Linear Regression is modest in absolute magnitude (ΔRMSE ≈ 0.0012). The primary value of the proposed model lies not in a dramatic leap in predictive accuracy but in its theoretical grounding, interpretability, and diagnostic capability. Permutation importance analysis reveals that Platform Fluidity, AI Technology Usability, Page Layout & Navigation Clarity, Content Accuracy, and Policy Assurance are the most important predictors of consumer trust. Comprehensive calibration and residual diagnostics (including MAE, normality tests, and heteroscedasticity checks) confirm the model’s predictive reliability. Furthermore, platform-specific diagnostics identify three distinct trust profiles (high-trust benchmark, trust-improvement priority, and mixed-profile platforms), providing managers with actionable insights for resource allocation. This study offers cross-border B2C e-commerce platforms a trust evaluation tool that balances predictive accuracy and interpretability, and provides implications for sustainable platform governance and ESG-oriented management by linking trust diagnostics with platform accountability frameworks.
1. Introduction
1.1. Research Background
Over the past decade, the cross-border e-commerce industry has maintained a strong growth trajectory. According to Claight Research [1], the global cross-border B2C e-commerce market reached approximately USD 1.01 trillion in 2024, with a projected compound annual growth rate (CAGR) of 23.1% from 2025 to 2034. Driven by the wave of digital economic globalization, cross-border e-commerce has become a critical bridge connecting consumers and merchants worldwide. In particular, the B2C (business-to-consumer) model has expanded rapidly by bypassing intermediaries and offering consumers a more direct purchasing process.
However, compared with domestic e-commerce, cross-border transactions involve longer logistics chains, complex customs procedures, exchange rate and tariff risks, and cross-cultural communication barriers. These factors lead to greater information asymmetry and higher perceived risk for consumers. In such a high-uncertainty environment, building and maintaining consumer trust in platforms has become a core determinant of platform competitiveness and sustainable governance. Trust affects not only short-term conversion rates but also long-term consumer welfare and transparent digital governance.
Within the broader context of sustainable development, trust-building in cross-border B2C e-commerce is no longer limited to the safety and convenience of individual transactions. Consumer trust in a platform is not only a prerequisite for transactions but also the foundation for advancing sustainable goals such as green logistics, fair trade, data ethics, and digital inclusivity. A market environment lacking trust will suppress consumer participation, thereby hindering the sustainable development of the cross-border e-commerce ecosystem across environmental, social, and governance (ESG) dimensions. The present study directly addresses this need by proposing a model that predicts trust and provides diagnostic insights that platforms can use to align their operations with ESG principles and long-term sustainability objectives.
Existing research on online trust has yielded substantial findings. Classic frameworks include Mayer et al.’s (1995) [2] integrative model of organizational trust, and numerous empirical studies have examined the effects of website design, technical security, and social cues on trust.
However, two notable gaps remain. First, at the content level, most studies focus on general e-commerce or specific domestic contexts. Their trust evaluation dimensions consistently fail to encompass factors specific to cross-border B2C transactions, such as international logistics transparency, tariff policy clarity, and product traceability information. Consequently, a systematic, multi-dimensional trust evaluation system tailored to this context is still lacking.
Second, at the methodological level, existing studies predominantly employ Structural Equation Modeling (SEM) for path analysis or the traditional Analytic Hierarchy Process (AHP) for subjective weighting. The former struggles to quantify the relative contribution of each trust dimension; the latter, relying on expert subjective judgment, is susceptible to cognitive biases. Thus, a significant methodological challenge remains: how to integrate expert prior knowledge with actual consumer perception data. This integration should be accompanied by data-driven corrections of potential expert biases, with the ultimate goal of constructing a consumer trust evaluation model that combines predictive accuracy and interpretability.
To address these gaps, this study aims to (1) construct a multi-dimensional consumer trust evaluation system specifically for cross-border B2C e-commerce platforms, consisting of 5 dimensions and 19 indicators, and (2) propose and apply an improved AHP-Ridge Regression method. This method introduces a nonlinear programming model to optimize the aggregation of expert opinions, thereby obtaining improved AHP subjective weights. These weights are then incorporated as the regularization prior mean in Ridge Regression. Using consumer survey data for objective calibration and modeling, we ultimately obtain a comprehensive evaluation model that integrates subjective and objective information, combining predictive accuracy with interpretability.
In particular, we employ interpretability analysis (e.g., permutation importance) to reveal the marginal contribution of each indicator, enabling the model not only to predict trust levels but also to help managers identify weaknesses. This study provides a new analytical framework for understanding consumer trust in high-uncertainty environments and offers managers a quantifiable trust evaluation and diagnostic tool to identify trust deficiencies and optimize resource allocation.
Beyond these methodological concerns, the evaluation of consumer trust also carries significant implications for sustainable e-commerce governance. Cross-border platforms that fail to maintain trust risk not only customer churn but also long-term ecosystem degradation, a form of “digital market failure” that undermines the social sustainability of e-commerce. By linking trust diagnostics to platform governance decisions and ESG-aligned resource allocation, our framework provides a mechanism for proactive trust stewardship, a core component of socially sustainable platform management.
1.2. Terminology Clarification
To enhance readability and consistency, the following core terms are defined as used in this paper.
Consumer trust refers to consumers’ trusting beliefs toward the platform and its merchants within cross-border B2C e-commerce platforms. Unless otherwise stated, the term “trust” hereafter is used in this specific context.
Model predictive performance denotes the overall performance of a model in predicting consumer trust scores, evaluated using two complementary metrics: root mean square error (RMSE) for predictive error and the coefficient of determination (R2) for goodness of fit.
Improved AHP-Ridge Regression refers to the hybrid method proposed in this study, which employs weights derived from the improved AHP as the prior mean in ridge regression. This method differs from standard ridge regression (which assumes a prior mean of zero) and from conventional AHP approaches.
2. Theoretical Background
2.1. Theoretical Foundations of Consumer Trust
Consumer trust is a multidisciplinary concept rooted in philosophy, psychology, sociology, and management. One of the most widely applied frameworks is the Integrative Model of Organizational Trust (Mayer, Davis, & Schoorman, 1995) [2]. This model defines trust as the trustor’s willingness to be vulnerable to the trustee’s actions, based on the expectation that the trustee will perform a particular action important to the trustor, irrespective of the trustor’s ability to monitor or control the trustee. Within this framework, trustworthiness comprises three dimensions: ability (the trustee’s skills and competencies), integrity (the trustee’s adherence to accepted principles), and benevolence (the trustee’s genuine care for the trustor’s welfare beyond profit motives). This tripartite model has become a cornerstone of subsequent e-commerce trust research.
In the e-commerce context, scholars have extended this framework to online settings. McKnight et al. (2002) [3] further categorized trust into disposition to trust, institution-based trust, and trusting beliefs, providing a more detailed view of how trust develops online. Building on this foundation, this study defines consumer trust as consumers’ confidence in cross-border B2C e-commerce platforms regarding the platform’s ability, integrity, and benevolence in fulfilling transactional obligations.
2.2. The Uniqueness of Consumer Trust in Cross-Border B2C E-Commerce
Cross-border B2C e-commerce refers to an e-commerce model in which consumers and vendors are located in different countries or regions (Li et al., 2026) [4]. Compared with domestic e-commerce, cross-border transactions possess unique risk characteristics that profoundly influence the mechanisms underlying the formation of consumer trust.
First, information asymmetry increases significantly. Zhou et al. (2018) [5] noted that in cross-border transactions, consumers cannot easily obtain complete information on product provenance, logistics status, and after-sales policies. They found that information transparency, including product, seller, and transaction process transparency, is a critical factor in purchase decisions. When cross-border sellers fail to proactively disclose necessary privacy policies, warranty terms, or logistics rules, consumers’ information needs remain unmet, thereby inhibiting purchase intentions.
Second, perceived risk involves more complex dimensions. Ma et al. (2025) [6] systematically identified multiple risks in cross-border B2C transactions: financial risk (e.g., exchange rate fluctuations and unexpected tariffs), product risk (e.g., inability to verify quality firsthand, risk of counterfeits), privacy risk (e.g., unclear compliance for cross-border data flows), and time risk (e.g., long logistics cycles, customs uncertainty). These risks interact with and reinforce each other, resulting in significantly higher trust thresholds for consumers in cross-border transactions than in domestic e-commerce.
Third, cultural and institutional distance has a significant impact on consumer trust. Bianchi and Andrews (2012) [7] found that in emerging markets such as Chile, despite rapid growth in internet users, e-commerce adoption was still low, mainly due to consumer distrust. Cognitive barriers due to cross-cultural and cross-institutional transactions undermine the effectiveness of traditional trust-building mechanisms (e.g., social proof) in cross-border contexts.
Fourth, traditional trust signals are becoming increasingly limited, while new techno-logical signals are gaining importance. Liu and Yahya Dawod (2025) [8] studied cross-border cosmetic e-commerce and identified serious threats to traditional signals, such as platform self-operation labels, customer reviews, and compensation guarantees. Fake reviews and manipulated social proof have severely damaged the credibility of social validation signals (Peña-García et al., 2024) [9]. In contrast, the immutability and transparent verifiability of blockchain-based product traceability exert a significant and unique trust-enhancing effect. Liu and Yahya Dawod (2025) [8] found that blockchain traceability was the only variable that significantly and directly influenced purchase intention, particularly in low-trust situations. These results indicate that novel technology assurance mechanisms are reshaping the foundations of trust in cross-border B2C e-commerce, where authenticity is of vital importance. This provides a new theoretical basis for building a trust evaluation system that incorporates modern elements such as blockchain.
2.3. Key Drivers of Consumer Trust: Website Design, Social Cues, and AI Technology
The existing literature has identified multiple factors influencing consumer trust, which can be synthesized into three categories based on the nature of trust-building signals: website technical design, social cues, and AI technology.
Technical design represents the most fundamental and tangible driver of consumer trust. Ou and Sia (2010) [10] categorized website design features into technical functionality (e.g., system accessibility, stability, and response time), navigation design (e.g., clarity and structural rationality), and content design (e.g., information relevance and accuracy). Their empirical research demonstrated that these design attributes affect consumer trust and distrust via unique mechanisms. Zhang et al. (2024) [11] further noted that high-quality technical design serves as a critical “strong signal” of platform quality and reliability. Within this framework, several technical sub-dimensions can be distinguished. Platform fluidity reflects the platform’s technical reliability and stability, serving as a fundamental element for demonstrating ability. Cross-border payment system compatibility refers to a platform’s technical support for multiple international payment methods and serves as a key safeguard against perceived risk in cross-border transactions (Pavlou, 2003; Ma et al., 2025) [6,12]. Loading experience, in an era when loading speeds have generally been optimized, serves more as a hygiene factor than a key differentiator (Ou and Sia, 2010) [10]. Finally, AI technology usability represents a newer and more potent factor, as intelligent recommendations and personalized search directly reduce consumers’ decision-making thresholds (Li et al., 2026) [4].
Social cues, such as user reviews, ratings, and friend recommendations, are trust-building mechanisms grounded in social proof. Peña-García et al. (2024) [9] found that online reviews are integral to purchase decisions and directly affect consumers’ assessments of seller reliability. Nevertheless, the influence of social cues is context-dependent. In cross-border transactions, cultural and contextual differences between reviewers and consumers can diminish the signaling effectiveness of those reviews (Bianchi & Andrews, 2012) [7]. According to trust–distrust asymmetry theory (Lewicki et al., 1998; Ou and Sia, 2010) [10,13], social cues may function more as motivating factors that build trust yet are less effective in alleviating preexisting distrust. Such distrust typically stems from concerns about the platform’s core technical and informational integrity.
AI technology has emerged as a significant predictor of consumer trust. Li et al. (2026) [4] examined the impact of generative AI heuristic cues on user continuance intention in cross-border B2C e-commerce, finding that AI heuristic cues, such as vividness, personalization, and website design, influence user behavior through trust as a mediator. Hollebeek et al. (2024) noted that consumer interactions with AI are reshaping brand trust [14]. However, the effects of AI on trust are not exclusively positive; negative aspects also merit attention. Hennighausen et al. (2025) found in an online experiment that when consumers learned customer service emails were AI-generated or AI-assisted, they perceived the retailer as significantly less benevolent and less integral [15]. This finding suggests that inappropriate or excessive use of AI, particularly in empathetic after-sales communication, can paradoxically undermine existing trust.
2.4. Trust Evaluation and Sustainable E-Commerce
The relationship between consumer trust and sustainable e-commerce is emerging as a critical topic in cross-border B2C research. The sustainable e-commerce ecosystem is a multidimensional concept encompassing environmental sustainability (e.g., green logistics, low-carbon supply chains), social sustainability (e.g., consumer welfare, data ethics), governance sustainability (e.g., platform accountability, transparent data governance, algorithmic fairness), and economic sustainability (e.g., long-term accumulation of trust capital, tripartite win–win outcomes among platforms, consumers, and merchants) (Bonina et al., 2021) [16]. Within this framework, consumer trust is regarded as the “social capital foundation” underpinning all dimensions: only when consumers trust a platform will they continue to engage in transactions, support transparent supply chains, and contribute to the platform’s long-term governance.
A substantial body of empirical research has established the central role of trust in sustainable e-commerce. However, most of these studies treat trust as an outcome or a mediating variable, rather than investigating how to systematically assess and manage trust itself. The research by Rizomyliotis et al. (2024) [17] provides direct empirical evidence. Using data from 278 participants, they found that consumer trust in e-commerce platforms positively predicts purchase intention for sustainable products. More importantly, consumers’ green trust moderates this relationship: consumers with higher green trust exhibit a stronger positive effect of platform trust on their intention to purchase sustainable products. This suggests that for platforms aiming to promote sustainable products, establishing and maintaining consumer trust is a key prerequisite for facilitating sales. Soleimani’s (2022) [18] systematic literature review supports this view from a more macro-perspective. The review notes that one of the core functions of trust in e-commerce platforms is to reduce consumers’ perceived risk, a mechanism that is particularly important in the cross-border B2C context, as cross-border transactions involve unique risks such as logistics uncertainty, institutional differences, and information asymmetry. When a trust assessment system effectively identifies and addresses consumers’ primary risk concerns, it functions as a digital governance mechanism (Bonina et al., 2021) [16]. Such a transparent and accountability-oriented system aligns platform operations with the principles of governance sustainability.
Based on the empirical evidence and theoretical synthesis presented above, the theoretical connection between the AHP-Ridge hybrid assessment method proposed in this study and sustainable e-commerce governance can be understood through the following implications: First, regarding governance sustainability, the model identifies core trust drivers such as technical reliability, content security, and policy clarity, which can serve as operationalized metrics for platform accountability and transparent data governance. Platforms with higher scores on corresponding dimensions may be better positioned to implement governance practices aligned with sustainability principles. Second, regarding economic sustainability, the model provides a diagnostic approach for assessing “trust capital,” which can inform resource allocation toward features that most influence trust. This, in turn, may support the development of more resilient business models and facilitate long-term cooperation among platforms, consumers, and merchants. Third, regarding environmental and social sustainability, although this study does not directly measure environmental and social outcomes, a high-trust environment may reduce information asymmetry and perceived risk, potentially creating psychological preconditions for consumers to engage in sustainability-oriented behaviors, such as purchasing eco-friendly products. Future research could empirically link this trust assessment framework with specific environmental and social sustainability indicators.
2.5. Theoretical Framework for Consumer Trust Evaluation: Subjective, Objective, and Fusion Methods
Existing research on consumer trust evaluation has followed two main methodological pathways, each with limitations that a fusion approach seeks to address.
Subjective weighting methods are exemplified by the Analytic Hierarchy Process (AHP), proposed by Saaty (1977) [19]. AHP, which has a solid theoretical foundation, is valued for its ability to transform expert qualitative judgments into quantitative weights. However, its reliance on expert opinion introduces potential cognitive biases and inconsistencies, which can affect the reproducibility and objectivity of the results. To mitigate these issues, Li et al. (2020) proposed an improved AHP method that uses a nonlinear programming model to optimize the aggregation of expert opinions, thereby reducing subjective bias [20].
Objective modeling methods include Structural Equation Modeling (SEM) and various machine learning algorithms. SEM is effective for testing causal path relationships and verifying theoretical hypotheses (Yoon, 2002) [21], but is inherently explanatory rather than predictive and struggles to precisely quantify the relative contribution of each indicator to overall consumer trust. Machine learning methods (e.g., Random Forest, Support Vector Regression, and Neural Networks) demonstrate strong predictive capabilities (Singh et al., 2024) [22], but their “black box” nature limits interpretability and fails to meet the demand for diagnostic capabilities.
Given these limitations, a subjective–objective fusion approach is increasingly recognized as a promising solution. The proposed method uses a prior regularization strategy: ridge regression reduces overfitting by shrinking coefficients toward a prior mean. Standard ridge regression assumes a prior mean of zero and shrinks all coefficients equally, which can over-penalize important predictors when sample sizes are small. In contrast, the improved AHP-ridge regression employs the empirically derived expert weights from the improved AHP as the prior mean. This provides a theoretically sound anchor point that retains expert knowledge while permitting data-driven adjustments. Under small-sample conditions, this approach reduces estimation error and improves model generalization, resulting in a model that combines high predictive accuracy with interpretability.
3. Methodology
3.1. Research Design Overview
This study adopts a mixed-methods design, integrating qualitative expert judgment with quantitative consumer data to evaluate consumer trust in cross-border B2C e-commerce platforms. The research process comprises four stages. Stage One constructs a system for evaluating trust through literature review and expert interviews. Stage Two obtains subjective expert prior weights using an improved Analytic Hierarchy Process (AHP). Stage Three collects consumer perception data through a survey and develops an improved AHP-ridge regression prediction model. Stage Four performs interpretability diagnostics via permutation importance analysis to identify core predictors of trust. Figure 1 presents the overall research framework.
Figure 1.
Overall research framework of the study.
The overall research framework of this study is illustrated in Figure 1. The specific process includes the following steps:
- Stage One: Construction of the Consumer Trust Evaluation Indicator System.
This stage begins with a systematic review of relevant literature on online trust, cross-border B2C e-commerce consumer behavior, and platform governance. From this review, we extract key dimensions and indicators that influence consumer trust. Subsequently, in-depth interviews are conducted with experts in the cross-border B2C e-commerce field to screen and refine the indicators. This process ultimately establishes an evaluation system comprising 19 indicators across five dimensions: Graphic & Structural Design, Technical Design, Content & Security, Social Cues, and Product Traceability. The system covers multiple trust-driving mechanisms, ranging from platform technical features and information assurance to social proof.
- 2.
- Stage Two: Subjective Weighting Based on Improved AHP.
This stage employs the improved AHP method to obtain expert prior weights. Building on the traditional AHP (Saaty, 1977) [19], the improved version introduces a nonlinear programming model to optimize the aggregation of expert opinions (Li et al., 2020) [20], thereby reducing weight deviations caused by expert cognitive biases. A panel of nine experts, each with more than three years of experience in cross-border B2C e-commerce operations or research, was invited to participate in the weighting process. Each expert constructed judgment matrices by performing pairwise comparisons of the dimensions and indicators. The reliability of the expert judgments was ensured by calculating the consistency ratio (CR), and comprehensive subjective weights for each indicator were computed using the improved AHP algorithm.
- 3.
- Stage Three: Objective Modeling Based on Improved AHP-Ridge Regression.
This stage collects data on consumers’ trust perceptions through a survey. The questionnaire, developed from the indicator system established in Stage One, employs a 5-point Likert scale. We distributed the survey via the Chinese online platform Wenjuanxing and subsequently applied rigorous data cleaning and quality control procedures. In the modeling phase, we incorporate the expert prior weights obtained in Stage Two as the regularization prior mean within the ridge regression framework, yielding the improved AHP-ridge regression model. The model is trained and fine-tuned using 30 runs of 5-fold nested cross-validation, with RMSE and R2 serving as the performance evaluation metrics. For benchmarking, we conduct a comparison against six baseline models: Standard BP Neural Network, Improved AHP-BP, Linear Regression, Standard Ridge Regression, Random Forest, and SVR. Statistical significance of performance differences is assessed using the comprehensive testing framework described in Section 3.6.4.
- 4.
- Stage Four: Model Interpretability Diagnosis.
This phase employs permutation importance analysis (Breiman, 2001) [23] to quantify each indicator’s marginal contribution to consumer trust. The procedure randomly shuffles feature values and measures the resulting increase in model prediction error, yielding a global importance ranking of the 19 indicators. A grouped permutation im-portance analysis is then conducted at the dimension level. The diagnosis is further refined to the platform level through platform performance decomposition, benchmark gap analysis, and platform case studies, thereby identifying each platform’s strengths and areas for improvement. Finally, this phase compares the expert prior weights with the data-driven feature importance, providing platform managers with an interpretable diagnostic foundation for trust management.
3.2. Consumer Trust Evaluation Indicator System
3.2.1. Basis for Indicator System Construction
The system for evaluating consumer trust developed in this study is grounded in a systematic literature review and an analysis of the unique characteristics of the cross-border B2C e-commerce context. The design of the indicator system follows three key principles.
First, the Theory-Driven Principle. The selection of indicators is based on Mayer et al.’s (1995) three-dimensional trust model (Ability, Integrity, and Benevolence) [2], ensuring that each indicator can be attributed to at least one trust dimension. For instance, Platform Fluidity (U22) reflects the platform’s technical “ability,” Content Accuracy (U33) embodies the platform’s “integrity,” and policy assurance (U34) relates to both “ability” and “integrity.” The product traceability code (U52) embodies both aspects of “ability” (technical system) and “integrity” (authenticity assurance).
Second, the Context-Fit Principle. The selection of indicators fully considers the unique risk characteristics that distinguish cross-border B2C e-commerce from domestic e-commerce. These include heightened information asymmetry (Zhou et al., 2018) [5], the superimposition of multi-dimensional perceived risks (Ma et al., 2025) [6], and the impact of cultural and institutional distance (Bianchi & Andrews, 2012) [7]. Accordingly, the indicator system incorporates specific items that reflect the particularities of cross-border transactions, such as product traceability codes (U52) and policy assurance (U34).
Third, the Signal Diversity Principle. Based on the nature of trust-building signals, the indicators cover a range of types: hard technical signals (e.g., Platform Fluidity U22), content and information signals (e.g., Content Accuracy U33), institutional assurance signals (e.g., Policy Assurance U34), social proof signals (e.g., User Social Proof U41), and emerging technological signals (e.g., AI technology usability U24). This ensures comprehensive coverage of diverse trust-driving mechanisms.
Based on these principles and after two rounds of expert interviews to screen and refine the initial indicators, a consumer trust evaluation system comprising 5 first-level dimensions and 19 specific indicators was finalized, as shown in Table 1.
Table 1.
User Trust Evaluation Indicators for Cross-border E-commerce Platforms.
3.2.2. Dimension and Indicator Descriptions
- Dimension 1: Graphic & Structural Design.
This dimension focuses on the platform’s visual presentation and information architecture. It represents the consumer’s first impression, primarily associated with the “ability” dimension of Mayer et al. (1995) [2]. According to the review by Wang and Emurian (2005) [25], good website design is a foundational element for enhancing online trust. This dimension includes 3 indicators:
- U11 Color Usage: Refers to the professionalism and comfort level of the platform’s overall color scheme. Appropriate color design can convey brand identity and reduce visual discomfort, indirectly influencing consumers’ perception of the platform’s professionalism.
- U12 Page Layout & Navigation Clarity: This indicator merges the original page layout design and navigation menu clarity into a single measure. It reflects the logic of how the page information blocks are arranged, the rationality of the visual focus design, and the clarity of the website navigation structure. A clear layout and navigation help consumers quickly locate the information they need, reduce cognitive load, and enhance their sense of control over the transaction process (Ou and Sia, 2010) [10].
- U13 Image & Video Aesthetics: Refers to the quality and aesthetics of product images and videos. High-quality visual content not only enhances product appeal but also demonstrates the platform’s professionalism and authenticity (Peña-García et al., 2024) [9].
- 2.
- Dimension 2: Technical Design.
This dimension reflects the platform’s technical performance and usability, serving as the most direct technical signal for consumers to judge a platform’s “ability.” Drawing on Lee and Turban’s (2001) [34] research on the trustworthiness of shopping media, Pavlou’s (2003) [12] discussion of payment technology compatibility, and recent findings on AI technology usability by Li et al. (2026) [4], this dimension includes 4 indicators:
- U21 Loading Speed: Refers to the time required for pages and content to respond. Speed is a baseline indicator of a website’s technical capability, but its differentiating role diminishes once industry standards are met (a “hygiene factor” in the Kano model).
- U22 Platform Fluidity reflects the degree of operational stability, responsiveness, and smoothness of interaction with the platform, comprehensively capturing system reliability and seamlessness of user interface interactions (DeLone and McLean, 2003; Liu et al., 2022) [27,35]. In the cross-border B2C e-commerce context, a fluid operational experience signals the platform’s technical competence and service quality. It encompasses not only the absence of crashes but also the smoothness of interactive actions such as page transitions and click feedback, directly influencing users’ overall trust judgment regarding the platform’s “Ability” (Ou and Sia, 2010) [10].
- U23 Payment System Compatibility refers to the platform’s support for multiple international payment methods (e.g., Visa, Mastercard, PayPal, and Alipay); its multi-currency processing capabilities; the accuracy of exchange rate conversions; and the adaptability of the payment process across different countries or regions (Pavlou, 2003; Ma et al., 2025) [6,12]. In cross-border B2C e-commerce, the payment stage concentrates many technical frictions. The availability of familiar payment options and transparent fee structures directly reduces perceived financial risk and enhances trust in the transaction process.
- U24 AI Technology Usability: Refers to the availability and effectiveness of AI features such as intelligent recommendations, personalized search, and smart customer service on the platform. As an emerging trust signal, AI technology directly reduces consumers’ decision-making thresholds and information filtering costs (Li et al., 2026) [4].
- 3.
- Dimension 3: Content & Security.
This dimension encompasses the quality of information disclosure and the level of security protection on the platform. It directly addresses consumer concerns about information asymmetry and transaction security and is highly correlated with the “integrity” dimension of trust. Drawing on Jarvenpaa et al.’s (2000) [36] study on merchant reputation and Bojang et al.’s (2017) [37] empirical analysis of perceived security and privacy, this dimension includes five indicators:
- U31 Privacy Protection: Refers to the security of the platform’s collection, storage, and use of consumers’ personal information. Inadequate privacy protection can trigger consumer concerns about information misuse (Utami and Aimin, 2026) [31].
- U32 Transaction Security: Refers to the effectiveness of measures such as the payment environment, fund custodianship, and encryption technology in ensuring consumer financial security. Ma et al. (2025) [6] emphasize that consumer behavior will only occur if transactions and information are secure.
- U33 Content Accuracy: Refers to the truthfulness and accuracy of platform content, including product descriptions, specifications, and pricing information. The permutation importance analysis of this study shows this is the second-ranked core predictor, directly reflecting the platform’s “integrity.”
- U34 Policy Assurance: Refers to the clarity and fairness of terms such as return policies, tariff responsibility rules, and dispute resolution mechanisms. In cross-border B2C transactions, the transparency of policy assurance is key to reducing perceived risk (Liu & Yahya Dawod, 2025) [8].
- U35 Delivery Information Transparency: Refers to the clarity, timeliness, and completeness of information disclosed by the platform to consumers during the delivery process, including but not limited to estimated delivery time, real-time logistics tracking status, carrier information, and customs clearance progress. In cross-border B2C e-commerce, the transparency of delivery information directly reduces consumers’ anxiety and perceived risk arising from the uncertainty of cross-border transportation, serving as a significant manifestation of the platform’s “integrity” and “openness” in the logistics context (Zhou et al., 2018; Ma et al., 2025) [5,6].
- 4.
- Dimension 4: Social Cues.
This dimension focuses on the influence of social proof mechanisms on consumer trust. According to Trust Asymmetry Theory (Lewicki et al., 1998; Ou and Sia, 2010) [10,13], social cues primarily act as “motivating factors,” effective for building trust but limited in alleviating pre-existing distrust. Based on studies by Peña-García et al. (2024) [9] and Cheung et al. (2014) [38], this dimension includes 4 indicators:
- U41 User Social Proof: Refers to the collective judgment of other users as reflected by the platform’s rating data and the volume and distribution of historical reviews. This is the most direct signal of the conformity effect, although its value can be eroded by fake reviews (Liu & Yahya Dawod, 2025) [8]. This indicator is primarily linked to the “ability” and “integrity” dimensions of trust: a high-quality user base reflects the platform’s operational “ability,” whereas the content of reviews reflects the platform’s “integrity” in keeping promises.
- U42 Social Network Social Proof: Refers to recommendations and sharing of information about the platform or brand that consumers obtain through social platforms (e.g., WeChat, Xiaohongshu). Word-of-mouth on social media can significantly influence consumers’ initial trust. This indicator provides both an endorsement of “ability” (through recommendations from opinion leaders) and a signal of “benevolence” (through altruistic sharing).
- U43 Friend Social Proof: Refers to direct recommendations from a consumer’s acquaintances (friends, family). Cheung et al. (2014) [38] emphasize that personal experience and recommendations from others primarily build consumer trust in the context of social commerce.
- U44 Identity Verification Proof: Refers to buyers’ identity authentication credentials on the platform (e.g., 88VIP in Tmall Global). This indicator enhances trust through a social proof mechanism: positive reviews from certified users are perceived as more credible, reflecting the platform’s ability (to identify and manage high-quality user communities) and integrity (the authenticity of its certification system).
- 5.
- Dimension 5: Product Traceability.
This dimension measures consumers’ perception of the transparency of product transaction information. It is a unique dimension of consumer trust in the cross-border B2C context. Within Mayer et al.’s (1995) [2] three-dimensional trust framework, this dimension primarily corresponds to the “ability” and “integrity” dimensions. Based on Zhou et al.’s (2018) [5] research on information transparency and Liu and Yahya Dawod’s (2025) [8] findings on blockchain traceability, this dimension includes 3 indicators:
- U51 Pre-purchase Logistics Information: Refers to the extent to which consumers can conveniently view the shipping logistics warehouse information of a product before purchase. Clear disclosure of the shipping warehouse helps consumers understand the product’s preparation location and shipment origin. This indicator reflects the platform’s ability to provide transparency in cross-border logistics information.
- U52 Product Traceability Code: Refers to the visibility and verifiability of traceability information (e.g., product origin, production batch, inspection reports) accessible via QR code scanning or other means. This indicator not only embodies the platform’s technical “ability” to build an immutable traceability system but also serves as a physical carrier for guaranteeing information authenticity and rejecting false claims, directly addressing consumers’ concerns about the platform’s “integrity” (Liu & Yahya Dawod, 2025) [8].
- U53 Product Batch Number Query: Refers to the platform service with which consumers can query information such as production date, expiration date, and batch number. It reflects the platform’s supply chain management “ability” and signals its “integrity” in being honest about product origin.
3.2.3. Overview of the Indicator System
Table 1 presents the complete consumer trust evaluation indicator system constructed in this study, including dimension names, indicator codes, indicator names, corresponding trust dimensions, and supporting literature.
3.3. Improved AHP Method Based on the Perspective of Perceptual Preference
3.3.1. Improved AHP Method
The conventional AHP method aggregates scores from multiple experts by simply taking the mean to construct the judgment matrix. However, in the context of cross-border e-commerce, different experts may hold strong personal perceptual preferences towards certain evaluation indicators, tending to assign disproportionately higher weights to their areas of particular concern. This compromises the fairness of weight calculation. To address this inherent subjectivity, this study adopts the improved AHP method proposed by Cheng and Jia (2015) [39], which is grounded in a stakeholder (or perceptual preference) perspective. This method aims to objectively determine expert evaluation weights by quantifying the similarity of perceptual preferences among experts, thereby offsetting subjective biases before aggregating their judgments.
The improved AHP method involves two key calculations: determining expert evaluation weights and calculating traditional AHP indicator weights, which are then synthesized.
- Calculation of Expert Evaluation Weights (): First, a perceptual preference correlation coefficient is computed based on the standardized evaluation data provided by the experts. This coefficient measures the similarity between the perceptual preferences of any two experts. Subsequently, a net perceptual coefficient is derived, which represents the relative alignment of preferences after mutual offsetting. Finally, a nonlinear programming model is constructed and solved to obtain the objective evaluation weight for each expert (the detailed mathematical derivations for these steps are provided in Appendix A).
- Calculation of AHP Indicator Weights and Synthesis: Each expert performs pairwise comparisons of the indicators to construct judgment matrices. The traditional AHP (eigenvector method) is then applied to calculate the preliminary indicator weights for each expert. The comprehensive weight for each indicator is obtained by taking the weighted average of these preliminary AHP weights, using the expert evaluation weights, , as the weighting coefficients.
3.3.2. Expert Selection and Data Collection
To ensure the scientific validity and reliability of the indicator weights, this study employed a purposive sampling method to select experts from both academic research and industry practice in cross-border B2C e-commerce. The expert selection followed four criteria: (1) at least three years of professional or research experience in the cross-border B2C e-commerce field; (2) a profound understanding of consumer trust research or platform operations; (3) the ability to provide independent, professional, and conflict-free judgments on the indicator system constructed in this study; and (4) a diverse range of expert sources, balancing perspectives from academia and industry.
The nine experts cover diverse perspectives from both industry and academia. Among them, the industry experts (four individuals) all come from well-known domestic leading cross-border e-commerce platforms or trading enterprises, possessing extensive experience in platform operations, user trust management, and risk control. The five academic experts come from different disciplinary backgrounds at leading national universities, including e-commerce, information systems management, and digital trade. This cross-domain, cross-disciplinary expert composition helps to comprehensively evaluate the reasonableness of the cross-border B2C e-commerce consumer trust indicator system and the accuracy of its weight allocation from multiple dimensions.
The expert procedure for data collection was divided into two parts.
The first part consisted of expert interviews and indicator refinement. The research team sent the preliminary version of the 6-dimension, 30-indicator consumer trust evaluation system to each of the nine experts and conducted one-on-one in-depth interviews. The interview content included: (1) introducing the research background, the construction logic of the indicator system, and the theoretical framework of Mayer et al.’s (1995) [2] three-dimensional trust model; (2) soliciting expert opinions on the reasonableness, completeness, and contextual fit of the dimensions and indicators for the cross-border B2C setting; and (3) collecting expert suggestions for modifications to indicator names, definitions, and measurement methods. Based on expert feedback and consumer questionnaire data, the research team conducted two rounds of revisions, ultimately finalizing an indicator system comprising 5 first-level dimensions and 19 second-level indicators.
The second part was the AHP expert weighting process. Following the finalization of the indicator system, electronic AHP questionnaires were distributed to the nine experts. The questionnaire was designed based on Saaty’s (1977) [19] 1–9 scale, requiring experts to perform pairwise comparisons of the relative importance of both the first-level dimensions and the second-level indicators within each dimension. Each expert independently completed 1 dimension-level judgment matrix and 5 indicator-level judgment matrices, for a total of six matrices. To improve judgment quality, the questionnaire included an indicator system description and a sample response guide. A total of 9 valid AHP questionnaires were collected in this phase, yielding a response rate of 100%. The complete expert questionnaire is provided in Appendix B.
3.3.3. Consistency Test Procedure
To ensure the logical consistency and reliability of each expert’s judgment matrices, all matrices constructed in this study were subjected to the classic consistency test procedure proposed by Saaty (1977) [19]. The detailed mathematical derivation of this test is presented in the Appendix A. This section focuses on its practical application and result standards in this study.
For an m-order judgment matrix constructed by each expert, the maximum eigenvalue is obtained by solving the characteristic equation . The Consistency Index CI and the Consistency Ratio CR are then calculated. A judgment matrix is considered to have acceptable consistency when (Saaty, 1977) [19]. If , the expert is required to re-evaluate the judgment values and adjust the matrix until the standard is met.
In this study, each of the nine experts completed six judgment matrices (one dimension-level matrix with m = 5 and five indicator-level matrices with orders 3, 4, 5, 4, and 3), resulting in a total of 54 matrices that underwent the consistency test. Only matrices that passed the test were included in the weight aggregation process. All CR values included in the calculation were below the 0.1 threshold, ensuring the logical consistency of the weighting results.
3.4. Consumer Survey Design and Data Collection
3.4.1. Questionnaire Design Process
The questionnaire design followed a four-stage process: Literature Review → Initial Design → Pilot Study Revision → Formal Survey.
Stage 1: Literature Review and Initial Design. Drawing on the three-dimensional trust framework of Mayer et al. (1995) [2], as well as validated scales from classic literature such as Jarvenpaa et al. (2000) [36], Pavlou (2003) [12], and Ou and Sia (2010) [10], the research team initially designed the questionnaire items. The questionnaire was divided into three parts: Part 1 consisted of screening questions to identify eligible respondents (those with cross-border B2C e-commerce shopping experience within the past six months); Part 2 collected demographic information, including gender, age, education, monthly expenditure, and shopping frequency; Part 3 measured consumer trust perception using a 5-point Likert scale (1 = strongly disagree, 5 = strongly agree). The full questionnaire is presented in Appendix C.
Stage 2: Expert Review and Small-Scale Pretest. After the initial draft was completed, it was submitted for content validity review to three academic experts (university professors in cross-border B2C e-commerce research) and two industry experts (from cross-border e-commerce platform operations management teams). The experts provided feedback on the clarity of item wording, the contextual fit for cross-border B2C settings, and the overall structure of the questionnaire. The research team revised the items based on the feedback. Subsequently, 15 consumers with cross-border B2C e-commerce shopping experience were invited to complete a pretest of the questionnaire. During the pretest, respondents’ comprehension of the items and the time required to complete the questionnaire were recorded. The results indicated that the average completion time was approximately 3 min, and the wording of all items was generally clear and easy to understand.
Stage 3: To assess the reliability and validity of the scale and further refine item wording, the research team conducted a pilot study in December 2025 using the Wenjuanxing platform. A total of 298 questionnaires were distributed and collected via the same platform. After data cleaning, 219 valid responses were retained, yielding an effective response rate of 73.49%. Based on the pilot study data, an Exploratory Factor Analysis (EFA) was conducted, and a second round of adjustments was made to certain dimensions and items, resulting in the final version of the formal questionnaire.
Stage 4: The formal survey was conducted in May 2026. Questionnaires were distributed to the target sample via the Wenjuanxing online platform. The collected data were used for subsequent reliability and validity analyses, a test for common method bias, and the training and validation of the improved AHP-ridge regression model.
3.4.2. Data Collection Process
The formal survey was distributed and collected via the Wenjuanxing online survey platform (https://www.wjx.cn). Wenjuanxing is a widely used online survey platform in Chinese academic research, and numerous studies on e-commerce and consumer behavior have adopted it for data collection (e.g., Zhang et al., 2024; Ma et al., 2025; Li et al., 2026) [4,6,11]. The platform supports functions such as screening questions and data quality control (e.g., IP deduplication, response time limits), which effectively safeguard data quality.
The questionnaires were distributed through Wenjuanxing’s built-in sample service (i.e., its sample pool). A request to collect 600 valid responses was submitted to the service. After excluding responses that failed the screening question, attention checks, response time limits, or IP deduplication criteria, 387 valid questionnaires were retained, yielding an effective response rate of 64.5%. All respondents were consumers with prior cross-border e-commerce shopping experience, recruited in mainland China, and the primary platforms were Tmall Global (39.5%) and JD Worldwide (30.5%).
The demographic characteristics of the valid sample in this study are presented in Table 2.
Table 2.
Descriptive statistics of 387 respondents from China.
Table 2 presents the demographic characteristics of the sample. The majority of respondents were female (66.4%), and 72.9% were aged between 18 and 30 years. Most respondents held a bachelor’s or master’s degree (75.7%) and came from diverse professional backgrounds. Monthly expenditure was concentrated in the range of 3000–7999 CNY (61.5%). Overall, the sample was predominantly female, relatively young, and more educated and had higher expenditure levels.
The consumer survey respondents were asked to indicate the cross-border e-commerce platform on which they most frequently shop. The platforms most commonly reported by respondents included Tmall Global (Alibaba Group, Hangzhou, China), JD International (JD.com, Inc., Beijing, China), Pinduoduo Global (PDD Holdings, Shanghai, China), Sam’s Club Global (Walmart Inc., Bentonville, AR, USA), and CDFG Duty-Free (China Duty Free Group, Beijing, China).
All statistical analyses and model computations were performed using MATLAB R2022b (MathWorks, Inc., Natick, MA, USA) with the Statistics and Machine Learning Toolbox (version 12.3) and the Deep Learning Toolbox (version 14.4), SPSS version 26.0 (IBM Corporation, Armonk, NY, USA), and AMOS version 26.0 (IBM Corporation, Armonk, NY, USA).
3.4.3. Ethical Considerations
This study was conducted in accordance with the ethical standards as laid down in the 1964 Declaration of Helsinki. The research protocol was reviewed and approved by the Ethics Committee of Concord University College, Fujian Normal University (Approval Number: 20251118006). Informed consent was obtained from all participants before they proceeded with the questionnaires. Participation was voluntary and anonymous, and respondents were assured that their data would be used solely for academic purposes.
3.5. The Improved AHP-Ridge Regression Model
To integrate the subjective expert knowledge embedded in the improved AHP weights with the objective consumer survey data, this study proposes an improved AHP-ridge regression model. The model leverages the theoretical foundation of ridge regression by incorporating the improved AHP comprehensive weights as a prior mean into the regularization process. This approach overcomes the limitations of both purely subjective weight-based methods and purely objective data-driven methods.
3.5.1. Theoretical Foundation of Ridge Regression (Tikhonov Regularization)
Ridge Regression, also known as Tikhonov Regularization, is a classic method for addressing multicollinearity and overfitting in linear regression (Hoerl & Kennard, 2000) [40]. In standard ordinary least squares (OLS) regression, the objective is to minimize the residual sum of squares to find the coefficient vector . The OLS estimate is given by:
where Y is the dependent variable vector, X is the matrix of independent variables, and is the coefficient vector. However, when the independent variables are highly correlated, the matrix becomes ill-conditioned, leading to inflated and unstable OLS coefficient estimates.
Ridge regression addresses this by adding a penalty term to the OLS loss function, which constrains the size of the coefficients. The standard Ridge Regression optimization problem is:
In this formulation, is the penalty (squared magnitude of the coefficient vector), and is the regularization parameter that controls the strength of the penalty. As increases, the coefficients are shrunk towards zero, which reduces variance and improves the model’s generalization ability at the cost of introducing some bias (Hoerl & Kennard, 2000) [40]. The solution to this optimization problem can be expressed in closed form as:
This classical form has a Bayesian interpretation: it is equivalent to imposing a prior belief that the coefficients follow a normal distribution centered at zero, i.e., . This means the standard Ridge Regression shrinks all coefficients towards a prior mean of zero.
3.5.2. Improvement Rationale: Using Improved AHP Weights as a Regularization Prior Mean
Standard ridge regression assumes a prior mean of zero for the regression coefficients, which may be suboptimal when evaluating consumer trust. For example, the improved AHP analysis might indicate that “Content Accuracy” (U33) has a high expert-assigned weight, suggesting it is a critical factor. However, a standard ridge regression model would still apply the same zero prior to it as to all other factors, potentially diluting the impact of this expert-identified importance.
To address this limitation, the proposed improved AHP-Ridge regression model modifies the prior mean of the ridge penalty term from zero to the composite weights derived from the improved AHP method. The rationale is that these weights encapsulate valuable expert knowledge, stakeholder perspectives, and logical consistency, providing a theoretically grounded and robust starting point for coefficient estimation.
- Scale Transformation of AHP Weights and Intercept Handling
However, a scale mismatch exists between AHP composite weights (positive relative importance scores that sum to 1) and regression coefficients (conditional parameters whose scale depends on the standardization method). To apply the AHP weights on the regression coefficient scale, all predictors (X) and the outcome variable (Y) are standardized using z-scores, and the following transformation is applied to map the prior mean onto the scale of standardized regression coefficients:
where is the vector of the standard deviations of the predictors, is the standard deviation of the outcome variable, and ⊙ denotes element-wise multiplication. This transformation maps the relative importance of the AHP weights onto the scale of standardized regression coefficients. Because both and are positive and all elements of are positive, the transformed prior means are all positive.
Regarding intercept handling, the intercept of a standardized ridge regression model is determined solely by the data means (). The AHP prior information influences only the coefficient vector and not the intercept, which remains entirely data-driven. This approach is consistent with standard ridge regression implementation.
- 2.
- Theoretical Justification for Positive Priors
This study assumes that all 19 indicators are positive drivers of consumer trust, an assumption with a solid theoretical foundation. Specifically:
- Visual Design (U11–U13): Aesthetically pleasing website interfaces enhance consumers’ perceptions of platform professionalism and reliability.
- Technical Design (U21–U24): Fast loading, smooth operation, and secure payment systems provide the technical backbone for establishing trust.
- Content and Security (U31–U35): Accurate product information, transparent privacy policies, and reliable delivery data directly reduce uncertainty.
- Social Cues (U41–U44): Social proof mechanisms, such as user reviews and social network recommendations, reinforce trust through social influence.
- Product Traceability (U51–U53): Full-chain information traceability from production to delivery reduces information asymmetry and facilitates trust formation.
Therefore, the assumption that all regression coefficients are positive is theoretically well-supported and consistent.
The core improvement is that the model penalizes deviation from the expert-informed prior weights rather than from zero. This anchors the data-driven learning process in prior knowledge, ensuring that the final model captures both human expertise and the patterns embedded in consumer data.
3.5.3. Model Formula and Mathematical Principles
The optimization problem for the Improved AHP-Ridge Regression model is formulated as follows:
where:
Y is the vector of consumer trust perception scores (the dependent variable).
X is the design matrix of the 19 standardized indicator scores (independent variables).
is the vector of regression coefficients to be estimated.
is the vector of Improved AHP comprehensive weights, serving as the prior mean for the penalty term.
is the regularization parameter that controls the strength of the penalty.
The first term, , is the standard OLS loss function, which minimizes the error between the model’s predictions and the actual consumer data, thereby ensuring goodness-of-fit to the observations.
The second term, , is the regularization prior penalty. Instead of shrinking towards zero, this term shrinks it towards the expert-informed prior (the Improved AHP weights). This anchors the coefficient estimation process on subjective expert knowledge as a soft constraint. Unlike standard ridge regression, which penalizes deviations from zero, the present model penalizes deviations from the expert-defined prior means. This implies that when the data signal is weak, the coefficient estimates will tend toward the expert knowledge; when the data signal is strong, the estimates will achieve a balance between the data-driven signal and the prior.
This optimization problem yields a closed-form solution, derived by taking the derivative of the loss function and setting it to zero:
This formula reveals that the final coefficient estimate is a weighted average of the data-driven OLS term, , and the expert-informed prior , with the balance controlled by . When , the model reduces to ordinary least squares regression; when , the coefficient estimates become exactly equal to the prior means .
It is important to emphasize that the independent variables X and the dependent variable Y in Equations (5) and (6) are standardized variables (with a mean of zero and a standard deviation of one), with all standardization parameters (mean and standard deviation) calculated strictly based on the training set. Within this standardized framework, is transformed via Formula (4), ensuring it is on the same scale as . This standardization procedure ensures that: (1) all features are comparable on the same scale, preventing the influence of dimensional differences on coefficient estimation; (2) and the regression coefficients are mathematically compatible, allowing the prior information to guide coefficient estimation appropriately; and (3) the interpretability of the model is preserved, as the standardized coefficients can be directly compared in terms of their relative importance.
3.5.4. Key Difference from Standard Ridge Regression (Zero Prior Mean)
The fundamental difference between the Improved AHP-Ridge Regression and the standard Ridge Regression lies in the specification of the prior mean. The key differences are shown in Table 3.
Table 3.
Standard Ridge Regression vs. Improved AHP-Ridge Regression.
- 3.
- In standard ridge regression, the prior assumption is that all regression coefficients are zero (i.e., no indicator is important). This assumption is problematic when expert knowledge indicates that certain factors are more critical than others. The proposed improved AHP-ridge regression addresses this limitation by embedding expert knowledge into the model’s prior. By shrinking coefficients towards the Improved AHP weights rather than zero, the model preserves the relative importance structure determined by domain experts while simultaneously learning from consumer survey data.
To further validate the informational value of the AHP prior and to rule out the alternative explanation that the performance gains arise solely from the regularization framework itself, this study conducted a systematic prior sensitivity analysis comparing five prior specifications, as detailed in Table 4.
Table 4.
Prior Sensitivity Analysis Design.
The interpretation framework is as follows: If the AHP prior significantly outperforms both the uniform and shuffled priors, the performance gain is attributable to the specific numerical values of the expert knowledge; if the AHP prior shows no significant difference from the uniform and shuffled priors, the gain is primarily due to the regularization framework itself; and if all non-zero priors outperform the zero prior, then shrinkage toward a non-zero center is itself valuable. The specific results of this analysis are reported in Section 4.4.
3.6. Model Evaluation and Baseline Models
3.6.1. Evaluation Metrics
We evaluate the predictive performance of our models using Root Mean Square Error (RMSE) and the Coefficient of Determination (R2).
The root mean square error (RMSE) measures the average magnitude of prediction error and is defined as:
where is the actual value, is the predicted value, and n is the number of samples. A lower RMSE indicates higher predictive accuracy (Ma et al., 2026) [41].
Coefficient of Determination (R2) measures the proportion of variance in the target variable explained by the model:
In this equation, is the mean of the actual values. An R2 value closer to 1 indicates a better model fit (Ma et al., 2026) [41]. We report both metrics to provide a comprehensive assessment.
3.6.2. Validation Strategy
To obtain robust and generalizable performance estimates and to reduce the effect of a random data split, a rigorous 30-times repeated 5-fold nested cross-validation scheme was used in this work. This procedure guarantees that the hyperparameter selection is fully separated from the model performance evaluation, and there is no leakage.
The procedure is structured as follows:
Outer Loop: The outer loop consists of a 30-times repeated 5-fold cross-validation. In each of the 30 repetitions, the full dataset is randomly shuffled and partitioned into five equal folds. The model is trained on four folds (80% of the data) and evaluated on the remaining fold (20% of the data). This process is repeated five times, with each fold serving as the held-out test set once, yielding one complete set of RMSE and R2 estimates. The entire 5-fold procedure is then repeated 30 times using different random seeds, producing 30 independent sets of performance estimates.
Inner Loop: Within each fold of the outer training set, a separate 10-fold cross-validation is conducted exclusively for hyperparameter optimization. Specifically, the inner loop iterates over a grid of 10 candidate regularization parameter values: [0.001, 0.005, 0.01, 0.05, 0.1, 0.2, 0.5, 1, 2, 5]. The λ value that minimizes the average validation RMSE across the inner 10 folds is selected as the optimal hyperparameter. This optimized λ is then used to train the model on the full outer training set before its evaluation on the corresponding, entirely independent outer test fold.
Data Preprocessing: All data standardization (e.g., z-score normalization) is performed strictly within each outer training fold. The standardization parameters (mean and standard deviation) are computed solely based on the current outer training set and are then applied to both the training and test sets of that fold. This procedure fully adheres to the core principle of separating preprocessing from model evaluation within a nested cross-validation framework, thereby preventing information leakage from the test set into the training process.
For each model, we report the mean and standard deviation of RMSE and R2 across all 30 repetitions, providing a comprehensive view of both central tendency and variability. This methodological approach builds upon the double cross-validation scheme proposed by Durlević et al. (2025) [42] while explicitly extending it to a nested structure to enhance the rigor of model evaluation.
3.6.3. Baseline Models
To rigorously benchmark the performance of our proposed Improved AHP-Ridge Regression model, we compared it against a set of six baseline models representing different paradigms of regression and machine learning:
- Standard BP Neural Network: a classic multi-layer feedforward neural network trained via backpropagation (Shi et al., 2017) [43].
- Improved AHP-BP Neural Network: extends the standard BP network by using improved AHP weights to initialize the network or weight input samples (Li et al., 2020; Cheng & Jia, 2015) [20,39].
- Linear Regression: the simplest linear model, providing a baseline for model performance.
- Standard Ridge Regression: the standard regularized linear model with a prior mean of zero (Hoerl & Kennard, 2000) [40].
- Random Forest: a robust ensemble method based on decision trees (Durlević et al., 2025; Breiman, 2001) [23,42].
- Support Vector Regression (SVR): a kernel-based method widely used in predictive modeling, implemented with an RBF kernel (Durlević et al., 2025) [42].
3.6.4. Statistical Testing Method
To rigorously evaluate whether the performance differences between the proposed improved AHP-ridge regression model and each baseline model are statistically significant, we employed a comprehensive statistical framework that accounts for the non-independence of repeated cross-validation estimates and controls for multiple comparisons.
- Corrected Resampled t-test.
Given that the 30 RMSE estimates obtained from repeated k-fold cross-validation are not independent because they share overlapping training sets, the ordinary paired t-test can underestimate variability and yield inflated Type I error rates (Nadeau & Bengio, 2003) [44]. To address this, we adopted the Nadeau–Bengio-corrected resampled t-test. This method applies a correction factor of ρ = 1/(K − 1) = 0.25 to the variance of the paired differences, producing more conservative and reliable p-values. The corrected test statistic is calculated as:
where is the mean of the paired RMSE differences across the R = 30 repetitions, is the variance of these differences, and is the Nadeau–Bengio correction factor.
- 2.
- Bootstrap Confidence Intervals.
To provide a robust, distribution-free estimate of the uncertainty surrounding the mean RMSE difference, we report 95% bootstrap percentile confidence intervals based on B = 10,000 bootstrap resamples of the paired differences. A confidence interval that does not include zero indicates a statistically significant difference at the 0.05 level.
- 3.
- Effect Size.
To complement statistical significance testing, we report Cohen’s d as a standardized measure of effect size, allowing readers to assess the practical magnitude of performance differences. Cohen’s d is calculated as:
where is the pooled standard deviation of the two models’ RMSE values. Effect sizes are interpreted according to conventional guidelines: |d| < 0.2 indicates a negligible effect, 0.2 ≤ |d| < 0.5 indicates a small effect, 0.5 ≤ |d| < 0.8 indicates a medium effect, and |d| ≥ 0.8 indicates a large effect (Cohen, 1988) [45].
- 4.
- Multiple Comparison Correction.
Because we conduct six pairwise comparisons between the proposed model and the baseline models, we applied the Holm–Bonferroni step-down procedure (Holm, 1979) [46] to control the family-wise error rate (FWER) at α = 0.05. This procedure ranks the six uncorrected p-values in ascending order and sequentially tests each one against a progressively relaxed threshold (α/k, α/(k − 1), …, α/1). A result is deemed statistically significant only if it survives this correction.
- 5.
- Statistical Significance vs. Practical Importance.
In accordance with recommendations to avoid over-reliance on p-values (Wasserstein & Lazar, 2016) [47], we explicitly discuss statistical significance and practical importance as separate dimensions. While a result may be statistically significant after correction, its practical relevance is evaluated based on the magnitude of the RMSE difference, the Cohen’s d effect size, and the specific context of the application. This is particularly important for comparisons where the absolute RMSE difference is small (e.g., ΔRMSE ≈ 0.0010), as such differences may be statistically significant but practically negligible.
The null hypothesis for each pairwise comparison is that no difference exists in mean RMSE between the proposed model and the baseline model.
3.6.5. Implementation and Reproducibility Details
To ensure full reproducibility of the experimental results, the 30 iterations of 5-fold nested cross-validation were initialized with a fixed random seed using the rng (run) function, where run varied sequentially from 1 to 30.
3.7. Interpretability Analysis: Permutation Importance
3.7.1. Principle of Permutation Importance
To enhance the transparency and diagnostic utility of the proposed improved AHP-ridge regression model, this study employed permutation importance (Breiman, 2001) [23] to quantify the contribution of each input feature to the model’s predictive performance. This method provides a model-agnostic and intuitive measure of feature relevance, addressing the limitation that raw model parameters (e.g., connection weights) do not straightforwardly indicate feature importance (Altmann et al., 2010) [48].
The core principle is that model performance degrades when the association between a feature and the target variable is broken. If a feature is critical for making accurate predictions, randomly shuffling its values will eliminate its association with the target, thereby significantly increasing the prediction error. Conversely, if a feature is unimportant, permuting its values will have little or no effect on the model’s error (Breiman, 2001; Fisher et al., 2019) [23,49].
The algorithm proceeds in the following steps:
- Baseline performance: Calculate the baseline RMSE of the trained model on the original test set.
- Permutation: For a given feature j, randomly shuffle its values across all samples in the test set while keeping all other features unchanged.
- Performance on permuted data: Compute the RMSE of the model using the permuted test set.
- Calculate importance score: The importance score for feature j is defined as the increase in RMSE after permutation:
A positive importance score indicates that the feature contributes to model accuracy; the larger the score, the more critical the feature. A score close to zero suggests minimal predictive value.
3.7.2. Implementation Parameters
To ensure the reliability and reproducibility of the importance estimates, the permutation importance analysis was implemented with the following parameters:
- Number of Repetitions: 30 times. The permutation process for each feature was independently repeated 30 times. This provides a distribution of importance scores, from which the mean and standard deviation are reported, mitigating the influence of randomness from a single permutation.
- Performance Metric: RMSE was used as the performance metric for calculating the importance score, consistent with the model evaluation framework (Section 3.6).
- Scoring Function: The importance score is defined as the increase in RMSE; therefore, a higher positive value signifies a greater predictive contribution from that feature.
4. Results
4.1. Measurement Model Evaluation
Before training the improved AHP-ridge regression model, this study first performed reliability and validity analyses on 387 valid responses collected in the formal survey to verify the reliability, internal consistency, and construct validity of the measures. The analytical procedure follows the recommended practice of assessing measurement properties before predictive modeling (Anderson & Gerbing, 1988) [50].
To further examine the underlying dimensional structure, an exploratory factor analysis (EFA) was first conducted on the 387 formal survey responses using SPSS 26.0 with principal axis factoring and promax rotation. The Kaiser–Meyer–Olkin (KMO) measure of sampling adequacy was 0.811, exceeding the recommended threshold of 0.7, and Bartlett’s test of sphericity was statistically significant (χ2 = 3666.322, df = 171, p < 0.001), confirming the appropriateness of the data for factor analysis. The EFA extracted five factors with eigenvalues greater than 1.0, accounting for 69.983% of the total variance. This five-factor structure is consistent with the theoretical framework proposed in Section 2, confirming the basic dimensional structure of the measurement instrument.
4.1.1. Reliability and Convergent Validity
Reliability analysis aims to assess the consistency, stability, and dependability of the questionnaire measurements. This study employed Cronbach’s α coefficient as the indicator of internal consistency. According to widely accepted standards (Hair et al., 2022) [51], a Cronbach’s α value greater than 0.7 indicates good internal consistency.
For multi-item constructs, Cronbach’s α values were calculated using SPSS 26.0. As shown in Table 4, the Cronbach’s α values for the five constructs ranged from 0.747 to 0.873, all exceeding the recommended threshold of 0.7. These results indicate satisfactory internal consistency reliability for the measurement items of each construct.
For the dependent variable, TRUST, which employs a single-item measure, Cronbach’s α cannot be calculated. However, following the recommendations of Wanous et al. (1997) and Bergkvist and Rossiter (2007) [52,53], single-item measures are acceptable and demonstrate good practical utility and predictive validity when the construct is concrete, singular, and clearly understood by respondents. In the context of cross-border B2C e-commerce, consumers’ overall trust in the platform is a concrete, holistic perceptual judgment, making a single-item measure reasonable and acceptable. This item was directly adapted from classic trust scales (Jarvenpaa et al., 2000; Pavlou, 2003) [12,36] and confirmed for content validity via expert review.
Convergent validity examines the degree to which different measurement indicators of the same construct are highly correlated. This study assessed convergent validity through confirmatory factor analysis (CFA), examining factor loadings and the Average Variance Extracted (AVE).
A confirmatory factor analysis (CFA) was conducted on the measurement instrument using AMOS 26.0. The overall model fit indices were as follows: χ2/df = 2.691, CFI = 0.935, TLI = 0.921, and RMSEA = 0.066 (90% CI [0.059, 0.074]). Additionally, the unstandardized root mean square residual (RMR) was 0.013. Collectively, all indices met or exceeded the recommended fit thresholds (Hair et al., 2022) [51], indicating a good fit for the measurement instrument.
As shown in Table 5, the standardized factor loadings for the measurement items of each construct ranged from 0.585 to 0.925. Although some items had factor loadings below the recommended threshold of 0.7, all loading values exceeded the minimum acceptable threshold of 0.5 (Hidayat et al., 2021) [54] and were significant at the 0.001 level (p < 0.001). In an exploratory research context, these loading values are deemed acceptable.
Table 5.
Reliability and Convergent Validity Results.
The AVE values for the constructs ranged from 0.504 to 0.721, all exceeding the minimum standard of 0.5. Among these, Graphic & Structural Design (U1) had the highest AVE (0.721), while Product Traceability (U5) had the lowest (0.504) but still satisfied the requirement for convergent validity. The composite reliability (CR) values ranged from 0.751 to 0.885, all exceeding the recommended threshold of 0.7. Overall, the questionnaire demonstrated satisfactory convergent validity.
For the single-item variable TRUST, because it has only one observed indicator, AVE and CR cannot be calculated. This variable was directly entered into the regression model as the dependent variable.
4.1.2. Discriminant Validity
Discriminant validity tests whether different constructs are significantly distinct from one another. This study employed the Fornell–Larcker criterion (Fornell & Larcker, 1981) [55] to assess discriminant validity. According to this criterion, discriminant validity is established if the square root of the AVE for each construct (the diagonal values) is greater than its correlations with all other variables (the off-diagonal values).
As shown in Table 6, all diagonal values (square roots of AVE) were greater than the corresponding off-diagonal correlations in their respective rows and columns, satisfying the requirement for discriminant validity.
Table 6.
Discriminant Validity Test (Fornell–Larcker Criterion).
4.1.3. Common Method Bias Test
Given that the data for both independent and dependent variables were collected via a single self-report questionnaire at one point in time, common method bias (CMB) may pose a potential threat. To address this concern, we first employed Harman’s single-factor test (Podsakoff et al., 2003) [56]. An unrotated exploratory factor analysis of all 19 measurement items showed that the first unrotated factor accounted for only 27.800% of the total variance, well below the 50% threshold, suggesting that CMB is not a severe issue.
However, it is well-documented that Harman’s single-factor test has limited sensitivity, particularly in detecting CMB that is dispersed across multiple factors rather than dominated by a single factor (Podsakoff et al., 2003) [56]. To supplement this limitation, we implemented several procedural remedies during the survey design phase to minimize potential bias. Specifically, we guaranteed respondent anonymity, explicitly stated that there were no correct answers to encourage honest responses, and conducted a pre-test of the questionnaire with both experts and a small pilot sample to ensure item clarity and unambiguous wording (MacKenzie & Podsakoff, 2012; Singh et al., 2024) [22,57].
We acknowledge that without a designated marker variable, our assessment of CMB relies primarily on the Harman test and procedural remedies. Future research should consider incorporating a marker variable (Lindell & Whitney, 2001) [58] or employing a multi-trait, multi-method (MTMM) design to provide a more rigorous statistical control for common method variance.
4.2. Improved AHP Weight Calculation Results
By aggregating the expert evaluation weights and the traditional AHP weights using a weighted averaging method, this study determined the comprehensive weights at all levels for the 19 observed indicators in the index system for evaluating consumer trust in cross-border B2C e-commerce. The weights of the first-level indicators were obtained by summing the weights of their respective second-level indicators. The final weight calculation results are presented in Table 7.
Table 7.
Comprehensive Weights of Indicators at All Levels.
From the weight distribution presented in Table 6, certain differences in expert opinions regarding the importance of each indicator are evident. Among the first-level indicators, Content & Security (U3) received the highest weight (0.3340), indicating that experts generally considered platform information quality and policy transparency as core factors in building consumer trust. Graphic & Structural Design (U1) received the second-highest weight (0.2865), highlighting the importance of visual experience. Technical Design (U2) followed with a weight of 0.2224, while Social Cues (U4, 0.0832) and Product Traceability (U5, 0.0739) received relatively lower weights.
It should be noted that the above weights are entirely based on the subjective judgments of the invited experts, which reflect the expert group’s perception of the factors influencing trust. However, discrepancies may exist between expert opinions and actual consumer behavior. Therefore, in the following section, this study draws on consumer questionnaire data collected from the formal survey and adopts a data-driven approach to objectively evaluate the true impact of each indicator on consumer trust. A comparative analysis of the results from both methods is then conducted.
4.3. Multi-Model Performance Comparison and Statistical Testing
After completing the reliability and validity analysis of the questionnaire and the improved AHP weight calculation, this section aims to validate the predictive performance of the proposed improved AHP-ridge regression (AHP-Ridge) model through a multi-model comparison. The experiment employed 30 runs of five-fold nested cross-validation to train and evaluate the model. This method prevents leakage of test-set information during parameter tuning and model training, ensuring the robustness and generalization performance of the model (Durlević et al., 2025; Ma et al., 2026) [41,42]. The root mean square error (RMSE) and the coefficient of determination (R2) were used as evaluation metrics, with results presented as mean ± standard deviation. To rigorously evaluate the statistical significance of model performance differences, a Nadeau–Bengio-corrected resampled t-test (Nadeau & Bengio, 2003) [44] was employed as the primary inferential method. Given that the 30 RMSE estimates obtained from repeated 5-fold cross-validation are not independent (they share overlapping training sets), this correction applies a variance inflation factor of 1/R + 1/(K − 1) = 1/30 + 1/4 ≈ 0.37 to produce more conservative and reliable p-values. To further assess the practical magnitude of the differences, Cohen’s d effect sizes were reported, and 95% bootstrap percentile confidence intervals (based on 10,000 resamples) were computed. Additionally, the Holm–Bonferroni step-down procedure was applied to control the family-wise error rate (FWER) across the six pairwise comparisons at α = 0.05.
4.3.1. Multi-Model Performance Comparison
To comprehensively evaluate predictive performance, the proposed model was compared against six baseline models using 30 runs of 5-fold nested cross-validation: Standard Backpropagation Neural Network (BP), Improved AHP-BP, Linear Regression, Standard Ridge Regression, Random Forest (RF), and Support Vector Regression (SVR). The mean and standard deviation of RMSE, R2, and MAE across the 30 runs are summarized in Table 8.
Table 8.
Multi-Model Performance Comparison (30 Runs of 5-Fold Nested Cross-Validation).
As shown in Table 8, the proposed Improved AHP-Ridge regression model achieved the lowest RMSE (0.3179) and the highest R2 (0.6510) among all compared models, indicating the best overall predictive accuracy and fit to the consumer trust data. In terms of MAE, the model achieved 0.2204, which is the lowest among all linear models and second only to Random Forest (0.2155).
Several key observations emerge from the comparison.
First, the Improved AHP-BP (RMSE = 0.4135, R2 = 0.4284, MAE = 0.2650) showed a clear improvement over the Standard BP (RMSE = 0.4216, R2 = 0.4049, MAE = 0.2775) across all three metrics. This confirms that the AHP-guided weight initialization strategy provides meaningful benefits for neural network training and convergence.
Second, the Linear Regression model (RMSE = 0.3191, R2 = 0.6481, MAE = 0.2209) performed remarkably well, ranking second overall and nearly matching the proposed model. The Ridge Regression model (RMSE = 0.3306, R2 = 0.6235, MAE = 0.2217) underperformed relative to standard Linear Regression, which was an unexpected finding given the presence of 19 potentially correlated predictors. This counterintuitive result may be attributed to standard ridge regression’s zero-centered shrinkage, which can introduce bias by pulling coefficients away from their theoretically sensible values, even as it reduces variance.
Third, Random Forest (RMSE = 0.3531, R2 = 0.5825, MAE = 0.2155) performed comparably to the baseline linear models. Notably, while its MAE is the lowest among all models (0.2155), its RMSE (0.3531) is substantially higher than that of the linear models (e.g., AHP-Ridge RMSE = 0.3179). This discrepancy between MAE and RMSE suggests that Random Forest produces smaller average errors but suffers from larger extreme prediction errors. RMSE penalizes large outliers more heavily than MAE, indicating that the Random Forest model is less robust to extreme cases than the linear models.
The results suggest that a parsimonious linear specification with an informative prior is both sufficient and preferable for predicting consumer trust. The minimal standard deviations across the 30 runs for the linear models (e.g., 0.0042 for RMSE and 0.0031 for MAE of the proposed model) demonstrate the stability and reproducibility of the results. This contrasts with the higher variance observed for the neural network models (e.g., 0.0166 for RMSE, 0.0185 for MAE of Standard BP), which are more sensitive to random initialization and local optima.
4.3.2. Significance Testing
To rigorously evaluate the statistical significance of the performance advantage over the six baseline models, we followed the methodological standards of Nadeau and Bengio (2003) [44] and adopted four complementary approaches: (1) the Nadeau–Bengio-corrected resampled t-test, which corrects for the variance underestimation inherent in repeated cross-validation; (2) Bootstrap percentile confidence intervals based on 10,000 resamples; (3) Cohen’s d effect size to quantify the magnitude of the difference; and (4) Holm–Bonferroni correction to control the family-wise error rate across the six pairwise comparisons.
Table 9 presents the complete results of the significance testing. The Nadeau–Bengio correction factor was calculated as ρ = 1/(K − 1) = 0.25, resulting in a variance inflation factor of 8.50 relative to a naive paired t-test. This conservative adjustment reflects the shared subjects and overlapping training sets across the 30 cross-validation runs.
Table 9.
Statistical Significance Testing Results (AHP-Ridge vs. Six Baselines, 30 × 5-Fold Cross-Validation).
As shown in Table 9, the improved AHP-Ridge model achieves statistically significant improvements over all six baselines according to the Nadeau–Bengio-corrected t-test (all p < 0.001). The Holm–Bonferroni correction confirms that all six comparisons remain significant after adjusting for multiple testing, and none of the Bootstrap 95% confidence intervals contain zero. These results provide robust evidence that the performance advantage of the proposed model is not attributable to random chance.
Cohen’s d values range from 2.66 (Ridge Regression) to 19.23 (SVR), all classified as “large” effects (Cohen, 1988) [45]. The magnitude of differences varies substantially across baselines. The largest improvements are over SVR (ΔRMSE = 0.1920, d = 19.23) and Standard BP (ΔRMSE = 0.1037, d = 10.54). The smallest statistically significant improvements are over Linear Regression (ΔRMSE = 0.0012, d = 3.14) and Ridge Regression (ΔRMSE = 0.0127, d = 2.66).
The large Cohen’s d for the Linear Regression comparison, despite the small absolute RMSE difference, indicates that the proposed model’s advantage is highly consistent across cross-validation runs. This consistency, rather than the magnitude of improvement, is the key statistical finding.
It is important to clarify that the statistical significance tests reported in Table 9 were conducted exclusively on the RMSE metric. The superior R2 values of the proposed model are reported as descriptive performance indicators, and the consistent pattern of R2 improvements across all baseline models corroborates the conclusions drawn from the RMSE-based hypothesis tests.
4.3.3. Model Calibration and Residual Diagnostics
To validate the model assumptions and assess predictive reliability, a comprehensive calibration and residual diagnostic analysis was conducted on the final improved AHP-Ridge regression model.
- Overall Residual Statistics.
The residual analysis showed that the mean residual was 0.000000, indicating no systematic bias in the model. The standard deviation of residuals was 0.294266, with a skewness of 0.413261 (approximately symmetric) and a kurtosis of 4.737781 (deviating from normality). The interquartile range (IQR) was 0.245295, and the median absolute deviation (MAD) was 0.122119.
- 2.
- Residual Normality Tests.
Both the Lilliefors test (p = 0.001) and the Jarque–Bera test (JB statistic = 59.7112, p < 0.001) rejected the null hypothesis of normality. However, given the sample size of N = 387, the central limit theorem ensures the asymptotic normality of the regression coefficient estimates. Moreover, the bootstrap confidence intervals reported in Section 4.3.1 provide non-parametric inference, thus limiting the impact of non-normal residuals on model inference.
- 3.
- Calibration Analysis.
The calibration analysis examined the consistency between model predictions and actual observations. The calibration slope was 1.000061 (ideal value: 1), and the intercept was −0.000490 (ideal value: 0). The t-test for slope = 1 (t = 0.0019, p = 0.998) and the t-test for intercept = 0 (t = −0.0019, p = 0.998) both failed to reject the null hypotheses, indicating that the model is well-calibrated with no systematic bias in predictions.
- 4.
- Heteroscedasticity Tests.
Three methods were employed to test for heteroscedasticity. The Spearman rank correlation test (|residuals| vs. predicted values) showed rho = 0.0801, p = 0.116, failing to reject the homoscedasticity assumption. The Breusch–Pagan test (LM statistic = 0.6530, p = 0.419) also failed to reject homoscedasticity. The Goldfeld–Quandt test (F statistic = 1.2124, p = 0.091) similarly failed to reject homoscedasticity. Collectively, these results indicate that the residual variance is approximately constant, with no evidence of heteroscedasticity.
4.4. Prior Sensitivity Analysis Results
To further validate the informational value of the AHP prior and disentangle its contribution from the regularization framework itself, a systematic prior sensitivity analysis was conducted. Specifically, the performance of the improved AHP-Ridge model was compared under five types of prior specifications: the original AHP prior, a uniform prior, a shuffled prior, a zero prior (equivalent to standard ridge regression), and scaled priors (0.3×, 0.5×, 2×, and 3× of the original AHP weights). The RMSE results are presented in Table 10.
Table 10.
Prior Sensitivity Analysis Results (30 Runs of 5-Fold Cross-Validation).
As shown in Table 10, the RMSE values across all prior specifications are remarkably close, with a maximum difference of only 0.000020. This indicates that, for this specific dataset, the predictive performance of the improved AHP-Ridge model is highly robust to variations in the prior mean. The Original AHP prior achieved the lowest RMSE (0.317876), while the Scaled 0.5× prior performed nearly identically (ΔRMSE = +0.000001). This suggests that the expert-assigned AHP weights are well-calibrated, and a moderately weakened prior (0.5×) yields a performance essentially equivalent to the original specification.
The near equivalence of the AHP prior and the Zero prior (ΔRMSE = +0.000004) is particularly noteworthy. This finding suggests that, for this dataset, the primary benefit of the AHP prior lies not in dramatically reducing prediction error relative to an uninformative zero-centered prior, but in its theoretical grounding and the interpretive value it adds to the model.
Nevertheless, the RMSE of the original AHP prior (0.317876) was nearly identical to that of the zero prior (0.317881), while the uniform prior (0.317896) and the shuffled prior (0.317882) were both marginally higher. This result indicates that shrinkage toward a non-zero center is comparable to shrinkage toward zero only when the non-zero center carries meaningful expert information (i.e., the AHP prior); arbitrary non-zero centers do not necessarily outperform the zero prior. Therefore, anchoring the model in informative expert knowledge, rather than any arbitrary non-zero value, is the key premise underlying this methodological choice.
4.5. Statistical Significance vs. Practical Importance
While the improved AHP-Ridge model demonstrates statistically significant RMSE improvements over all baseline models according to the Nadeau–Bengio-corrected t-tests (all p < 0.001), the practical magnitude of these improvements merits separate consideration.
As shown in Table 9, the RMSE difference between the proposed model and Linear Regression is only 0.0012. This represents a relative improvement of approximately 0.38% in RMSE. On a 0–10 trust rating scale, this corresponds to an average prediction bias reduction of merely 0.0012 scale units, or approximately 0.01% of the scale range.
The Cohen’s d value of 3.14 indicates that this small absolute difference is highly consistent across the 30 cross-validation runs, confirming the reliability of the result. However, the small absolute magnitude suggests that the underlying functional relationship between the 19 indicators and consumer trust is predominantly linear, and the linear regression model already captures most of the predictive information.
In consumer trust prediction, an absolute RMSE improvement of 0.0012 may be considered marginal in practical terms. Nevertheless, the value of the AHP prior lies not in a dramatic leap in predictive accuracy over a strong linear baseline, but rather in its ability to provide a theoretically grounded, interpretable, and stable coefficient estimate that aligns with expert domain knowledge. This is particularly important when the goal is not merely prediction, but also explanation and theory testing.
4.6. Permutation Importance Analysis: Feature Contribution Ranking
After verifying the statistically significant superiority of the proposed AHP-Ridge model, this section adopts the permutation importance method to quantitatively evaluate the contribution of each of the 19 predictor features.
Permutation importance measures a feature’s contribution by randomly shuffling its values and observing the increase in the model’s prediction error (RMSE): a larger increase in error after permutation indicates a more important feature (Altmann et al., 2010) [48].
4.6.1. Permutation Importance Ranking Results
Table 11 presents the complete ranking of the 19 indicators, sorted in descending order of their permutation importance.
Table 11.
Feature Permutation Importance Ranking (30 Permutations).
As shown in Table 11, the top three most important features were Platform Fluidity (U22, 19.72%), AI Technology Usability (U24, 16.87%), and Page Layout and Navigation Clarity (U12, 13.43%). Collectively, these three features accounted for 50.02% of the total permutation importance.
Platform Fluidity (U22) emerged as the single most important predictor (importance = 0.08638), underscoring that sustained, stable technical performance is the foundational cornerstone of consumer trust in cross-border e-commerce platforms.
AI Technology Usability (U24) ranked second (importance = 0.0739), reflecting the growing importance of intelligent features in enhancing user experience and reducing consumer uncertainty.
Page Layout and Navigation Clarity (U12) ranked third (importance = 0.0588), confirming that intuitive information architecture and clear navigation pathways significantly reduce cognitive load and foster consumer confidence during cross-border transactions.
Content and Security features occupied the next tier of importance: Policy Assurance (U34) ranked fourth (11.41%) and Content Accuracy (U33) ranked sixth (9.23%). Image and Video Aesthetics (U13) ranked fifth (11.34%), further confirming the substantial contribution of visual design to trust formation.
4.6.2. Dimension-Level Grouped Permutation Importance
Simple aggregation of individual feature importances within a dimension is biased toward dimensions containing more indicators. To provide an unbiased assessment of each dimension’s contribution, we conducted a grouped permutation importance analysis (Strobl et al., 2007) [59]. This approach simultaneously permutes all features within a given dimension and measures the resulting increase in RMSE. The results are presented in Table 12, alongside the average per-indicator importance for each dimension, which controls for the number of indicators.
Table 12.
Dimension-Level Grouped Permutation Importance (30 Permutations).
The dimension-level analysis reveals a clear hierarchy of importance. Technical Design (U2) is the most important dimension, with the highest grouped importance (0.239235) and the highest average per-indicator importance (0.043329). This overwhelming dominance confirms that the foundational technical infrastructure of cross-border e-commerce platforms, including platform fluidity, AI technology usability, payment system compatibility, and loading efficiency, constitutes the most critical determinant of consumer trust.
Content and Security (U3) ranks second in grouped importance (0.139696), but its average per-indicator importance (0.019844) is lower than that of both Technical Design (0.043329) and Visual Design (0.038229) because it contains more indicators (5 vs. 4 and 3, respectively). The average per-indicator measure reveals that, per indicator, Visual Design features are nearly twice as influential as Content and Security features (0.038229 vs. 0.019844).
Visual Design (U1) ranks third in grouped importance (0.115501), but its high average per-indicator importance (0.038229) demonstrates that the three visual design features, including page layout, image and video aesthetics, and color usage, are individually highly predictive. This is consistent with the individual indicator ranking, where U12 (Page Layout) ranked third overall.
In contrast, Social Cues (U4) and Product Traceability (U5) contribute minimally to the model, regardless of the aggregation method. Their grouped importances (0.042422 and 0.014895, respectively) and average per-indicator importances (0.008282 and 0.005882) are substantially lower than those of the top three dimensions. This suggests that while social proof mechanisms and traceability information have theoretical relevance to consumer trust, their predictive signal in this specific dataset is relatively weak compared to that of technical, visual, and content-related factors.
4.7. Platform-Level Diagnostic Analysis: From Global Importance to Platform-Specific Recommendations
While the permutation importance analysis in Section 4.6 identifies the key drivers of consumer trust across the entire sample, it does not, by itself, diagnose which specific features represent weaknesses for a given platform. To bridge this gap between global importance and platform-specific diagnostics, this section presents a comprehensive framework that integrates three complementary analyses: (1) platform performance decomposition, (2) benchmark gap analysis with prioritized improvement actions, and (3) average feature contribution. Together, these analyses transform the global model knowledge into actionable, platform-level recommendations.
4.7.1. Platform Performance Decomposition
We first decomposed the model’s predictive performance by platform. As shown in Table 13, the five platforms exhibit substantial heterogeneity in both trust levels and model accuracy.
Table 13.
Platform Performance Decomposition Results.
Several patterns emerge from Table 13:
- Consumer trust varies significantly across platforms. Pinduoduo Global has the lowest mean trust score (7.3265), substantially below that of the other four platforms (all ≥ 8.0). This suggests that Pinduoduo Global exhibits a notably lower level of consumer trust relative to its competitors.
- Model accuracy differs substantially. The model achieves the highest R2 for Pinduoduo Global (0.7874), indicating that the 19 features in the model capture its trust formation mechanism well. In contrast, the model performs poorly for Sam’s Club Global (R2 = 0.0569), suggesting that trust in Sam’s Club may be driven by factors not captured in our model, potentially its membership-based business model or offline-to-online dynamics.
- Prediction error is heterogeneous. JD Global and CDFG Duty-Free exhibit the lowest RMSE (0.2236 and 0.2486, respectively), suggesting that the model fits these platforms best. Pinduoduo Global and Sam’s Club Global show higher RMSE, further corroborating the need for platform-specific diagnostic analyses.
4.7.2. Benchmark Gap Analysis and Priority Improvement Actions
To translate feature importance into concrete, platform-specific, and actionable improvement recommendations, we first define the concept of platform performance. For each platform s and each feature j, the platform performance is calculated as the mean of the Z-score standardized consumer perception scores for that feature across all samples belonging to that platform (Martilla & James, 1977) [60]. This Z-score standardization (mean = 0, standard deviation = 1) eliminates the influence of different measurement scales across features, ensuring comparability. The platform performance thus represents the average relative standing of a platform on a given feature, with positive values indicating above-average performance and negative values indicating below-average performance.
Building on this, we conducted a benchmark gap analysis to quantify each platform’s performance deficit relative to the global average and to prioritize improvement targets based on the severity of the gap weighted by the feature’s importance.
The specific algorithmic procedure is as follows:
- Calculate the Global Performance Baseline: First, based on the Z-score standardized feature matrix of all samples, we compute the global average performance for each feature across all platforms. Due to the Z-score standardization, this global baseline is approximately zero for all features.
- Calculate Platform-Specific Performance Gaps: For each platform s and each feature j, we calculate the Performance Gap:A negative value indicates that the platform performs below the global average on that feature, with larger negative values signifying a more severe performance deficit.
- Calculate the Weighted Gap: To integrate both the importance of a feature and the performance deficit, we multiply the performance gap by the feature’s global importance (derived from permutation importance analysis in Section 4.6) to obtain a Weighted Gap:This metric simultaneously reflects a feature’s deviation from the benchmark on a given platform and its predictive value for overall trust. A high-importance feature with a low performance will yield a large negative weighted gap, thus being identified as a high-priority improvement target.
- Generate the Priority Action List: For each platform, features are sorted in ascending order by their WeightedGap value (i.e., the most negative values are ranked first). The top 3 features are then defined as the platform’s priority improvement actions.
Table 14 presents the benchmark gaps by dimension, and Table 15 summarizes the Top 3 priority improvement features for each platform.
Table 14.
Platform Benchmark Gap by Dimension (vs. Global Average).
Table 15.
Top 3 Priority Improvement Features by Platform.
The benchmark gap analysis yields the following critical insights:
- Pinduoduo Global demonstrates the most extensive performance gaps across all high-importance dimensions. Its gaps are not only the largest in absolute magnitude (e.g., −1.4193 for Image Aesthetics, −1.3710 for Content Accuracy) but also affect features with the highest global importance (Page Layout: 0.0588, Image Aesthetics: 0.0497). This pattern suggests that Pinduoduo’s trust deficit is not attributable to isolated feature failures, but rather to broad-based deficiencies spanning the entire trust-building infrastructure. Consequently, its improvement strategy must be comprehensive rather than piecemeal.
- Sam’s Club Global and CDFG Duty-Free exhibit a “technical gap” pattern. Despite having high overall trust scores (8.0476 and 8.0000), both platforms are underperforming on the two most important features globally: Platform Fluidity (U22, importance = 0.0864) and AI Technology Usability (U24, importance = 0.0739). This indicates that other factors, such as brand reputation and membership exclusivity, currently sustain their trust, while their technical infrastructure is becoming a liability. Immediate investment in platform fluidity and AI features is recommended to prevent future trust erosion.
- Tmall Global and JD Global show minimal gaps on high-importance features. Their gaps are concentrated on lower-importance features (e.g., U41: Social Proof, U32: Transaction Security). This confirms that both platforms have successfully built trust in the most critical areas and have established sustainable competitive advantages.
4.7.3. Platform Case Study: Local Contributions to Trust
To understand how each dimension contributes to trust for each platform, we calculated the average feature contribution per platform across the five dimensions. This decomposition directly answers the question: “For a specific platform, which dimensions are driving trust up or down?” The specific algorithmic procedure is as follows:
- Calculate the Feature Contribution Vector for Each Sample:
First, based on the final AHP-Ridge regression model trained on the full dataset, the feature contribution for each sample is computed. For the i-th sample:
where:
- is the Z-score standardized feature vector (1 × 19) for the i-th sample.
- is the vector of final regression coefficients (19 × 1) estimated from the full dataset.
- denotes the element-wise multiplication (Hadamard product).
- The result, , is a 1 × 19 vector. Each element j represents the linear contribution of feature j to the predicted trust score for that sample. A positive value indicates that the feature increases the predicted trust score; a negative value indicates that it decreases it.
- 2.
- Aggregate to the Platform-Dimension Level:
To obtain the overall contribution of each dimension to each platform, a double averaging procedure is performed:
where:
- is the set of sample indices for platform s, which has a total of samples.
- is the set of feature indices belonging to dimension d, and is the number of features in that dimension.
- The inner average, , calculates the mean of the feature contributions across all features within that dimension for each individual sample i. This yields the “dimension-level average contribution” for that sample.
- The outer average, , then calculates the overall average of these dimension-level contributions across all samples of the platform.
Table 16 presents the dimension-level average contributions to trust for each platform.
Table 16.
Mean Feature Contribution to Trust Prediction by Platform and Dimension.
Based on the pattern of contributions across dimensions, the five platforms can be categorized into three distinct groups.
- High-Positive-Contribution Platforms (Tmall Global, JD International).
Tmall Global and JD International are the only two platforms for which all five dimensions positively contribute to the predicted trust score. For Tmall Global, the largest positive contributions come from Technical Design (+0.0267) and Visual Design (+0.0222), suggesting that users’ favorable perceptions of its technical performance and visual appeal are the primary drivers of its high trust level. For JD International, the strongest contributions are from Content and Security (+0.0180) and Visual Design (+0.0172), indicating that its trust is built on a combination of reliable content governance and aesthetically pleasing design. Overall, both platforms enjoy a broadly positive trust profile, with no dimension acting as a significant drag.
- 2.
- High-Negative-Contribution Platform (Pinduoduo Global).
Pinduoduo Global is the only platform for which all five dimensions negatively contribute to the predicted trust score, indicating a systematically low perception across all facets of user experience that consistently drags down the model’s trust prediction. Among these, Visual Design (−0.1272) and Content and Security (−0.0872) present the most severe negative contributions. This finding is highly consistent with the benchmark gap analysis (Table 16, Section 4.7.2), where Pinduoduo Global was identified as having multiple high-importance, low-performance features (e.g., Page Layout U12, Image and Video Aesthetics U13, and Content Accuracy U33) as its top priority improvement targets. Notably, the magnitude of the negative contribution from Visual Design alone (−0.1272) is larger than the total positive contribution of the strongest dimension on any other platform (e.g., Tmall Global’s Technical Design contribution is only +0.0267). This disparity underscores the severity of the trust challenge faced by Pinduoduo Global and the urgency for systematic improvements in its visual design and content governance.
- 3.
- Mixed-Contribution Platform (Sam’s Club Global, CDFG Duty-Free).
Sam’s Club Global and CDFG Duty-Free exhibit a mixed pattern, with some dimensions contributing positively and others negatively. For Sam’s Club Global, Social Cues (+0.0128) and Visual Design (+0.0092) are the key positive contributors, which aligns with its membership-driven community trust model and curated brand image. However, Technical Design (−0.0382) acts as a notable negative drag, indicating that user perceptions of platform fluidity and AI technology usability are undermining its overall trust prediction. For CDFG Duty-Free, Visual Design (+0.0167) and Product Traceability (+0.0067) contribute positively, while Technical Design (−0.0183) again emerges as the primary negative contributor. This pattern suggests that for these two platforms, strengthening core technical capabilities is the most critical lever for enhancing consumer trust.
5. Discussion and Implications
5.1. Summary of Key Findings
This study proposed an improved AHP-Ridge regression model to evaluate consumer trust in cross-border B2C e-commerce platforms. The empirical results yielded several key findings.
First, the multi-model comparison (Section 4.3) demonstrated that the proposed model significantly outperformed all six baselines. After applying the Nadeau–Bengio correction and Holm–Bonferroni adjustment, all comparisons remained statistically significant (corrected p < 0.001), with large Cohen’s d effect sizes (d > 2.66; Table 9). Notably, the absolute performance advantage over simple Linear Regression was modest (ΔRMSE = 0.0012). This indicates that the model’s principal contribution lies in its interpretive and diagnostic capabilities rather than in predictive accuracy alone.
Second, the prior sensitivity analysis (Section 4.4) revealed that the model’s predictive performance is robust to variations in the prior mean. All non-zero priors achieved RMSE values comparable to or better than the zero prior (standard ridge), confirming that informative expert knowledge, rather than arbitrary non-zero centers, is the key to the model’s methodological advantage.
Third, the permutation importance analysis (Section 4.6) identified Technical Design (grouped importance = 0.2392), Content and Security (grouped importance = 0.1397), and Visual Design (grouped importance = 0.1155) as the three dominant dimensions of consumer trust. Within these dimensions, Platform Fluidity (U22), AI Technology Usability (U24), and Page Layout and Navigation Clarity (U12) were the top three individual predictors, underscoring the primacy of technical and visual factors. Within the Content and Security dimension, individual indicators such as Policy Assurance (U34) and Content Accuracy (U33) ranked fourth and sixth, respectively.
Third, the permutation importance analysis (Section 4.6) identified three dominant dimensions of consumer trust: Technical Design (grouped importance = 0.2392), Content and Security (0.1397), and Visual Design (0.1155). At the indicator level, Platform Fluidity (U22), AI Technology Usability (U24), and Page Layout and Navigation Clarity (U12) were the top three individual predictors, underscoring the primacy of technical and visual factors. Within the Content and Security dimension, Policy Assurance (U34) and Content Accuracy (U33) ranked fourth and sixth, respectively.
Fourth, the platform-level diagnostic analysis (Section 4.7) revealed substantial heterogeneity across platforms. The benchmark gap analysis identified three distinct trust-building patterns. Pinduoduo Global exhibited substantial and consistent underperformance across all high-importance dimensions. Sam’s Club Global and CDFG Duty-Free displayed a “technical gap” pattern, with high overall trust but underperformance on the most critical technical features. Tmall Global and JD International emerged as systematic trust generators with strong performance across all dimensions.
5.2. The Effectiveness and Positioning of the Improved AHP-Ridge Regression Method
However, the magnitude of this statistically significant advantage must be interpreted with nuance. The performance difference against complex non-linear models is substantial and practically meaningful: ΔRMSE = 0.1037 for Standard BP and 0.1920 for SVR. In contrast, the improvement over the much simpler Linear Regression is notably modest (ΔRMSE = 0.0012). This represents a relative improvement of approximately 0.38% in RMSE, corresponding to an average prediction bias reduction of merely 0.0012 units on a 0–10 trust rating scale.
This finding calls for a clearer articulation of the model’s contribution. Its value rests on three complementary advantages rather than on predictive accuracy alone:
- Theoretical Grounding: The AHP prior anchors coefficient estimates to expert domain knowledge, ensuring that the final model reflects both statistical patterns and established theoretical understanding of trust formation. This integration is particularly valuable when sample sizes are limited or when theory-driven interpretation is prioritized over pure prediction.
- Coefficient Stability: The regularization framework reduces the variance of coefficient estimates, making the model less susceptible to noise in the data. This is especially important for trust research, where measurement error and multicollinearity among indicators are common challenges.
- Diagnostic Interpretability: The model provides a framework for permutation importance analysis and platform-specific diagnostics, offering actionable insights into which features are most critical for trust and which platforms require targeted improvement. This capability is absent in simpler linear models.
5.3. Deconstructing Expert and Consumer Perceptions: Convergence and Divergence
A key contribution of this study is the systematic comparison of expert-derived AHP weights with data-driven permutation importance, revealing both areas of strong cognitive consensus and critical points of divergence between experts and consumers.
5.3.1. Cognitive Consensus: The Foundational Pillars of Trust
The most prominent area of consensus concerns the relative importance of core dimensions. The permutation importance analysis (Section 4.6.2, Table 12) reveals that Technical Design (U2), Visual Design (U1), and Content & Security (U3) collectively account for the overwhelming majority of the model’s predictive power. These findings are consistent with AHP-derived expectations and prior trust theories (Mayer et al., 1995; Lee & Turban, 2001) [2,34], both of which emphasize ability (technical reliability and platform competence) and integrity (information accuracy and policy transparency) as the foundations of trust building.
Within the Technical Design dimension, Platform Fluidity (U22) emerged as the single most important predictor at the indicator level (Table 11, importance = 0.0864, 19.72% of total). This confirms the critical role of stable and uninterrupted technical performance. This finding extends prior research (e.g., Bojang et al., 2017; Liu et al., 2022) [27,37] by quantitatively establishing that technical infrastructure is not merely a hygiene factor. Instead, in the high-risk context of cross-border B2C e-commerce, it is the primary engine of trust. The high importance of AI Technology Usability (U24) (ranked 2nd, importance = 0.0739, 16.87%) further highlights the contemporary relevance of intelligent platform features, such as personalized recommendations and AI-powered customer service, in enhancing the user experience and fostering trust. This aligns with recent findings on the role of GAI trust-assisting heuristics in digital platforms (Li et al., 2026) [4].
5.3.2. Points of Divergence: Expert Biases and Data-Driven Corrections
Despite this strong consensus, the comparison between expert AHP weights and data-driven importance scores reveals systematic discrepancies. Experts assigned relatively higher importance to the Graphic & Structural Design (U1) dimension than its final data-driven model contribution would warrant. Conversely, Content & Security (U3), particularly the Policy Assurance (U34) indicator, exhibits a stronger predictive signal than experts anticipated. This divergence indicates that experts may exhibit a “visual first-impression bias,” over-emphasizing website aesthetics. In contrast, consumers’ actual trust formation, as captured by survey responses, is more heavily driven by practical assurances about content reliability and policy clarity.
A particularly revealing finding emerges from the Social Cues (U4) dimension. Although the expert-derived weight for this dimension was modest, the data-driven permutation importance reveals a more nuanced picture: while the dimension as a whole contributes moderately to the model, a clear internal hierarchy emerges. Identity Identification Proof (U44) exhibited significantly higher importance (0.0210, 4.80%) than Friend Social Proof (U43; 0.0053, 1.21%) and other social proof indicators. This finding demonstrates that, in the high-uncertainty context of cross-border commerce, consumers place greater trust in official endorsements and verified credentials than in social network signals or peer recommendations. It represents a critical specification of the general “social proof” construct: not all social signals carry equal weight, and their effectiveness depends on the credibility of the trust conveyance channel.
5.3.3. Hygiene Factors in Cross-Border E-Commerce Trust: Privacy and Security as Threshold Conditions
Several theoretically critical features, particularly Privacy Protection (U31, importance = 0.0007) and Transaction Security (U32, importance = 0.0003), exhibited remarkably low permutation importance, ranking 17th and 19th, respectively. This finding may appear counterintuitive given the established role of these factors in the trust literature (Bojang et al., 2017; Singh et al., 2024) [22,37].
We propose interpreting this pattern through the lens of Herzberg’s (1959) two-factor theory of motivation [61]. Specifically, these features may function as industry hygiene factors for cross-border e-commerce trust formation: their absence would critically undermine trust, but their presence, now an industry-wide baseline, no longer serves as a source of competitive differentiation. In the current cross-border e-commerce landscape, regulatory compliance and consumer protection standards (e.g., SSL encryption, explicit privacy policies, and third-party security certifications) have become de facto entry requirements for all legitimate platforms. This convergence may produce minimal cross-platform variance in consumers’ perceptions of these features.
At the platform level, we found preliminary empirical support for the hygiene hypothesis. Even for Pinduoduo Global, a platform with systematic performance deficits in high-importance dimensions such as Technical Design, the weighted contribution gaps for U31 (−0.0008) and U32 (−0.0003) remained marginal. This suggests that the platform’s performance on privacy and security features did not significantly deviate from consumers’ baseline expectations. While this pattern is consistent with the hygiene factor interpretation, it does not constitute conclusive evidence; it may also reflect the limited variance of these features across all platforms in our sample.
However, we acknowledge that several alternative explanations could account for the observed low importance. First, the restricted variance of these features across platforms may limit their predictive contribution in global permutation importance analysis. Second, multicollinearity with other theoretically related features (e.g., Policy Assurance, U34) could have suppressed their individual importance scores. Third, measurement limitations, such as ceiling effects or social desirability bias in self-reported privacy and security perceptions, may have attenuated their observed influence. Future research should explicitly test these competing explanations, for example, through experimental designs that manipulate these features independently or through longitudinal studies that capture their dynamic effects over time.
However, we acknowledge that several alternative explanations could account for the observed low importance of Privacy Protection and Transaction Security. First, restricted variance in these features across platforms may limit their predictive contribution in global permutation importance analysis. Second, multicollinearity with other theoretically related features (e.g., Policy Assurance, U34) could have suppressed their individual importance scores. Third, measurement limitations, such as ceiling effects or social desirability bias in self-reported privacy and security perceptions, may have attenuated their observed influence. Future research should explicitly test these competing explanations through experimental designs that manipulate these features independently or through longitudinal studies that capture their dynamic effects over time.
5.4. Theoretical Contributions
This study offers three main theoretical contributions to the literature on cross-border e-commerce platform trust and sustainable e-commerce ecosystems.
5.4.1. An Integrated AHP-Ridge Regression Framework for Trust Measurement
First, we propose a novel methodological framework that integrates the Analytic Hierarchy Process (AHP) with Ridge Regression (RR) to measure and decompose consumer trust in cross-border e-commerce platforms. While prior research has extensively explored the antecedents of online trust, most studies have relied on either purely survey-based structural equation modeling (SEM) or standalone machine learning prediction models (e.g., Kim & Park, 2013; Oliveira et al., 2017) [62,63]. The SEM approach excels at hypothesis testing but often struggles to handle feature multicollinearity while simultaneously quantifying the relative importance of individual trust indicators. Machine learning models, by contrast, prioritize predictive accuracy but lack interpretability, making it difficult to derive actionable platform-level diagnostics.
Our AHP-RR framework bridges this gap by addressing two critical methodological challenges. First, the AHP component provides a theory-driven, expert-validated weighting mechanism that maps 19 granular features onto five theoretically grounded dimensions: Visual Design, Technical Design, Content and Security, Social Cues, and Product Traceability. This five-dimensional structure was developed through a systematic synthesis of prior literature on e-commerce trust. Second, the Ridge Regression component effectively handles the multicollinearity inherent in the feature set (which would otherwise inflate the variance of Ordinary Least Squares estimates) while preserving model interpretability through the localized contribution decomposition (Section 4.7.3). This hybrid approach contributes to the IS success measurement literature by demonstrating how to combine predictive rigor with diagnostic interpretability in a single, coherent analytical pipeline.
5.4.2. A Diagnostic Typology for Platform-Specific Trust Profiles
Second, we extend the application of the benchmark gap analysis framework from general performance evaluation to the specific context of cross-border e-commerce trust. Our study demonstrates that this framework, when combined with a gap-weighted priority scoring mechanism (Equation (13)), can serve as a powerful diagnostic tool for generating platform-specific trust profiles.
Theoretically, this contribution is threefold. First, by using global permutation importance and Z-score standardized performance as objective axes, we replace the traditional reliance on subjective survey ratings. Second, our platform typology distinguishes three categories: high-trust benchmarks (Tmall, JD), a trust improvement priority (Pinduoduo), and mixed profiles with technical gaps (Sam’s Club, CDFG). This indicates that the nature of trust deficits varies qualitatively: some are structural, while others are localized. Third, the localized contribution decomposition (Section 4.7.3) provides a quantitative link between macro-level dimension importance and micro-level feature performance. It shows how feature-level perceptions drive or suppress platform-level trust scores.
5.4.3. Implications for Sustainable Platform Governance
Third, this study offers implications for the sustainability discourse by linking platform trust diagnostics to sustainable digital governance and consumer welfare.
Our findings offer three specific theoretical links. First, the Content and Security dimension (including Content Accuracy U33, Policy Assurance U34, and Privacy Protection U31) directly operationalizes digital transparency and accountability. Platforms scoring highly on this dimension, such as Tmall Global and JD International, may cultivate a more trustworthy and governance-oriented e-commerce environment by reducing information asymmetry. Second, the Product Traceability dimension (including Product Traceability Code U52) aligns with the ESG principle of supply chain accountability. Although this dimension has lower global importance, our gap analysis identifies it as a critical weakness for platforms such as Sam’s Club Global and Pinduoduo Global, pointing to a sustainability-related risk beyond traditional environmental metrics. Third, the dominance of Technical Design, Visual Design, and Content and Security in trust prediction suggests that platform usability and governance quality are important antecedents of consumer trust, with direct implications for long-term platform governance. Investments in platform reliability, AI capabilities, and content governance should therefore be viewed as strategic enablers of a durable trust advantage rather than merely as operational improvements.
By showing how trust diagnostics can be interpreted through an ESG-informed lens, this study provides a conceptual basis for integrating the social dimension of sustainability into mainstream e-commerce success measurement.
5.5. Practical Implications
Based on our diagnostic findings, we propose the following actionable recommendations for platform managers.
- Prioritize High-Impact Dimensions.
Not all features contribute equally to trust. Our model confirms that Technical Design (platform fluidity, AI usability), Visual Design (page layout, image aesthetics), and Content and Security (policy assurance, content accuracy) are the most important predictors of consumer trust. Platforms scoring below the global average on these dimensions should allocate resources accordingly, as improvements in these areas yield the greatest trust returns.
- 2.
- Adopt a Platform-Specific Improvement Strategy.
Our analysis reveals three distinct patterns that require tailored approaches:
- Tmall Global and JD International: These platforms exhibit consistently high performance across all dimensions. Their strategy should focus on defending current advantages through marginal optimization of low-importance features.
- Pinduoduo Global: This platform demonstrates a systematic performance deficit across all high-importance dimensions. A comprehensive improvement strategy addressing visual design and content governance is necessary, rather than piecemeal adjustments.
- Sam’s Club Global and CDFG Duty-Free: These platforms show a targeted technical gap. Resources should be concentrated on improving platform fluidity (U22) and AI technology usability (U24) while maintaining existing strengths in other dimensions.
- 3.
- Establish a Proactive Trust Monitoring System.
Rather than reacting to trust crises, platform managers should implement a data-driven trust dashboard based on the key indicators identified in this study. This mechanism enables early detection of performance declines in critical features (e.g., platform fluidity) and facilitates timely corrective actions, transforming trust management from a reactive response into a preventive function.
6. Conclusions
This study proposed an improved AHP-Ridge Regression hybrid model for evaluating consumer trust in cross-border B2C e-commerce platforms. The findings indicate that consumer trust is fundamentally aligned with platform performance on three key dimensions: Technical Design, Visual Design, and Content and Security. These dimensions dominate trust formation by shaping consumer perceptions of overall platform reliability. These insights enrich the literature on trust theory and e-commerce success measurement while providing a clear roadmap for platform managers to build a durable competitive trust advantage.
Importantly, these findings carry meaningful implications for the growing literature on sustainable e-commerce. Sustainable e-commerce encompasses both environmental dimensions (such as green logistics and carbon footprint) and social sustainability, which involves building a trustworthy platform ecosystem through digital governance, supply chain transparency, and consumer protection. This study proposes that the trust diagnostic framework generated by the AHP-Ridge Regression model can inform governance mechanisms for ex-ante assessment and continuous monitoring of platform trust health. By embedding trust diagnostics into daily operations and strategic decision-making, platforms can move from reactive trust repair to proactive trust stewardship. The framework thus provides a conceptual bridge between consumer trust research and sustainable e-commerce governance: it treats trust not as a static metric but as an actively governed relational asset, offering a theoretically grounded pathway for building a sustainable trust advantage that integrates predictive rigor with diagnostic transparency. These implications should be interpreted as potential pathways for ESG-oriented management rather than as direct empirical evidence of sustainability impacts.
Despite its valuable insights, this study has several limitations. First, the data were collected from a single country (China), which may limit generalizability to other cultural contexts. Second, the cross-sectional survey design captured perceptual data at a single point in time, which inherently restricts causal inferences about the dynamic interaction between platform feature performance and consumer trust. Third, the research context was restricted to the Chinese cross-border e-commerce industry, a highly competitive, policy-sensitive, and rapidly evolving technological field. External contingencies such as regulatory changes, tariff adjustments, and shifts in platform governance policies may influence the generalizability of the findings.
However, these limitations open up several promising directions for future research. First, longitudinal tracking or quasi-experimental designs could trace the long-term effects of platform features on consumer trust, revealing the causal mechanisms and temporal dynamics of trust formation and change. Second, future studies could integrate environmental sustainability indicators (e.g., green logistics performance) and broader social indicators (e.g., labor rights protection) into the trust diagnostic framework, extending the scope of analysis to a more comprehensive ESG perspective. Third, the proposed model should be tested and refined across diverse institutional, cultural, and market contexts, including mature e-commerce markets such as Europe and North America, as well as emerging markets such as Southeast Asia and Latin America. Such comparative studies would help clarify the boundary conditions of the theory and enhance its external validity.
Author Contributions
Methodology, X.X.; Investigation, X.X. and L.W.; Data curation, J.S. and L.W.; Writing—original draft, J.S.; Writing—review & editing, Q.L. and S.J.; Supervision, Q.L.; Project administration, S.J. All authors have read and agreed to the published version of the manuscript.
Funding
This research received no external funding. The APC was funded by the Special Issue “Electronic Business and Sustainable Development” in Sustainability.
Institutional Review Board Statement
The study was conducted in accordance with the Declaration of Helsinki, and approved by the Ethics Committee of Concord University College, Fujian Normal University.(protocol code 20251118006 and 18 May 2026).
Informed Consent Statement
Informed consent was obtained from all subjects involved in the study.
Data Availability Statement
The data presented in this study are available on request from the corresponding author.
Conflicts of Interest
The authors declare no conflict of interest.
Appendix A. Detailed Derivation of the Improved AHP Method
The conventional AHP method aggregates scores from multiple experts on the evaluated objects by calculating the mean score as the weight for each indicator in the judgment matrix. However, it should be noted that different experts may exhibit strong personal perceptual preferences regarding certain evaluation indicators of cross-border e-commerce platforms. This has the potential to compromise the fairness of the weight calculation. As a subjective weighting method that relies exclusively on evaluators’ judgments, this method produces results that are susceptible to both subjective and objective biases. Consequently, the aforementioned approaches cannot determine expert weights. The present study employs the enhanced AHP method proposed by Cheng Bo et al. (2015) [39], which incorporates experts’ divergent perceptual preferences. This approach involves calculating expert weights to offset subjective consistency preferences. Subsequently, the weighted average of indicator weight scores is applied to derive the comprehensive weight for each indicator. A total of nine professors specializing in cross-border e-commerce, or managers of leading cross-border e-commerce platforms, were invited to evaluate the indicator system.
Appendix A.1. Calculating Expert Weights Based on the Perspective of Perceptual Preference
To account for the opinions of experts with different perceptual preferences, it is first necessary to calculate expert weights that mitigate consistency preferences. These weights are subsequently applied to the indicator weight scores through a weighted average to derive the comprehensive weight for each indicator.
In the context of constructed evaluation indicators, it is hypothesized that a set of n experts, , ,…, , have selected m indicators, , , …, . In the present study, the variable is defined as , where i = 1, 2, …, n and j = 1, 2, …, m. This notation represents the value assigned by expert to indicator . The following matrix presents the data evaluated by the expert:
Assuming that all m indicators are of the extremely large benefit type and that the data in matrix A have been normalized, it can be seen in data matrix A that the closer the indicator values (i.e., row vectors) of two experts are, the more consistent their perceived preferences tend to be. Therefore, the definition of the perceived preference correlation coefficient is provided from the perspective of the similarity degree of vectors as follows:
where , , and and are the norms of and , respectively.
Following data standardization, the variable is constrained to the interval [0, 1]. It can thus be concluded that an increase in the magnitude of can be interpreted as indicative of an increased degree of similarity in perceived preferences.
The net perception coefficient between experts and (i, k = 1, 2, …, n) is as follows, representing the relative value of the preference remaining after the perceived preferences of the two experts are offset against each other:
The hypothesis posits that is the weight expert i assigned to indicator j. Each expert forms judgments based on personal preferences and constructs a judgment matrix that best reflects those preferences. The ensuing nonlinear programming model is as follows:
where
The weight vectors of all experts can be calculated from the perspective of expert by combining (4) and (5) as follows:
The comprehensive evaluation value of each expert, as perceived from the standpoint of , is as follows:
The matrix of comprehensive evaluation values from the perspectives of all experts is as follows:
The following programming problem must be solved to ascertain the optimal solution , which is the vector that minimizes the sum of the angles with :
For ,
where the quantity denotes the largest eigenvector of the real symmetric matrix . Therefore,
It can be demonstrated that is the positive eigenvector corresponding to the of , and that .
Thus, the comprehensive evaluation value vector of all experts is as follows:
The weights allocated to each expert are as follows:
where
Appendix A.2. Using AHP to Calculate the Weights of Indicators at Each Level
The traditional AHP indicator weight calculation methods primarily include two approaches: (1) the expert judgment method, where experts directly assign weights to each indicator, and the final weights are obtained through a weighted average, and (2) the eigenvalue method, which constructs a judgment matrix and calculates its maximum eigenvalue and the corresponding eigenvector, which is then normalized to obtain indicator weights.
This study adopts the eigenvalue method by solving the eigen equation of the judgment matrix. This approach directly uses the principle of matrix eigendecomposition and is mathematically more precise than approximation methods such as the row-sum method or the geometric-mean method (Saaty, 1977) [19]. The specific calculation steps are as follows:
- Construct the judgment matrix.
Suppose there are m indicators at a given level, with the corresponding judgment matrix . This matrix satisfies the reciprocity property, i.e., and (with ).
- 2.
- Solve for the eigenvalues and eigenvectors of the judgment matrix.
Solve the characteristic equation:
where is the maximum eigenvalue of the judgment matrix A, and w is the corresponding eigenvector. We compute all eigenvalues by matrix eigendecomposition, and select the largest eigenvalue along with its corresponding eigenvector w.
- 3.
- Normalize the eigenvector to obtain the weight vector.
The eigenvector w corresponding to the maximum eigenvalue is normalized so that the sum of its components equals 1. This yields the indicator weight vector :
To examine the logical consistency of the expert’s judgment matrix, both the Consistency Index (CI) and the Consistency Ratio (CR) are calculated:
where RI is the Random Index, whose value is determined by consulting the standard table according to the matrix order m. If , the judgment matrix is considered to have acceptable consistency, and the weight vector is valid. If , the expert is required to re-examine and adjust the judgment matrix until it satisfies the consistency requirement.
Appendix A.3. Calculation of Comprehensive Weights for Each Indicator
Comprehensive indicator weights are obtained by taking the weighted average of the traditional AHP indicator weights and the expert perception weights. The primary indicator weights are as follows:
In the above formula, denotes the weight attributed to expert i, while is the weight of the primary indicator j of expert i, calculated in accordance with the conventional AHP method.
The second indicator weights are as follows:
As demonstrated above, denotes expert i’s secondary indicator weight, calculated using the traditional AHP method.
Table A1 presents the consistency test results for all expert judgment matrices. The consistency ratio (CR) was calculated using Formula (A12). For the dimension-level judgment matrix (m = 5), the random index (RI) was set to 1.12. For the indicator-level matrices (with m = 3, 4, and 5), the corresponding RI values were 0.58, 0.90, and 1.12, respectively. All computed CR values were below the threshold of 0.10, indicating that all judgment matrices passed the consistency test and that the expert judgments exhibited sufficient logical consistency.
Table A1.
Consistency Test Results for All Expert Judgment Matrices (CR Values).
Table A2 presents the expert evaluation weights (λi) at the dimension and indicator levels. These weights were calculated using the improved AHP method based on a stakeholder-oriented nonlinear programming model, as detailed in Equations (A9)–(A21) in Appendix A. The magnitude of each weight reflects the degree of alignment between that expert’s judgments and the overall consensus of the expert panel, rather than the expert’s domain expertise.
Table A2.
Expert Evaluation Weights (λi).
Appendix B. Expert Questionnaire on User Trust for Cross-Border E-Commerce Platforms
Due to space limitations in the article, only the first-level indicator questionnaire is shown below. The second-level indicators follow the same method.
Dear Expert,
This is a questionnaire regarding trust in cross-border e-commerce platforms. In this questionnaire, “cross-border e-commerce platform” refers to domestic B2C import cross-border e-commerce retail platforms, such as Tmall Global, JD Worldwide, Pinduoduo Global, etc.
Before you begin, please answer the following question:
In your cross-border e-commerce shopping experience, do you agree that apparel and accessories, daily chemicals and food, and digital 3C products are common purchase categories for users? (Yes/No)
Please answer the questionnaire based on your past cross-border e-commerce purchase experience with apparel and accessories, daily chemicals and food, and digital 3C products.
Questionnaire 1
The following indicators of cross-border e-commerce platforms affect user trust. If any of these indicators pose a risk, user trust may be adversely affected. In your opinion, how important are Technical Design/Content and Security/Social Cues/Product Traceability compared to Graphics & Structural Design? To avoid central tendency bias, please rank the indicators according to your logic, and enter “1” in the corresponding box.
Table A3.
Graphic & Structural Design vs. Four Other Dimensions.
Table A4.
Technical Design vs. Left Dimensions.
Table A5.
Content & Security vs. Left Dimensions.
Table A6.
Social Cues vs. Left Dimension.
Appendix C. User Questionnaire for Cross-Border E-Commerce Websites
Instructions
Dear Madam or Sir,
The information collected in this questionnaire will be used for academic research purposes only and will not be disclosed to any third party. We sincerely invite you to complete this questionnaire.
“Cross-border e-commerce websites” refers to domestic import B2C cross-border e-commerce platforms (e.g., Tmall Global, JD Worldwide, Pinduoduo Global Purchase, etc.). Please recall your shopping experience for apparel, cosmetics, food, and 3C digital products on these platforms and answer the following questions.
Part 1: Personal Shopping Experience
- Have you made any purchases on cross-border e-commerce websites (e.g., Tmall Global, JD Worldwide, Pinduoduo Global Purchase, etc.) in the past six months? [Single choice]
- Yes
- No (Please skip to the end of the questionnaire and submit)
Part 2: Personal Information
- 2.
- What is your gender? [Single choice]
- Male
- Female
- 3.
- What type of product do you purchase most frequently on cross-border e-commerce websites? [Multiple choice]
- Apparel
- Cosmetics
- Food
- 3C Digital Products
- Others
- 4.
- How often do you make cross-border e-commerce purchases? [Single choice]
- 1–3 times per week
- 1–3 times per month
- 1–3 times every six months
- 1–3 times per year
- 5.
- What is your age? [Single choice]
- Under 18
- 18–25
- 26–30
- 31–40
- Over 40
- 6.
- What is the highest level of education you have completed or are currently pursuing? [Single choice]
- High school or below
- Junior college
- Bachelor’s degree
- Master’s degree or above
- 7.
- What is your occupation? [Single choice]
- Business employee
- Public servant
- Professional and technical staff
- Self-employment
- Student
- Other occupation
- 8.
- What is your monthly consumption expenditure? [Single choice]
- ≤1000 RMB
- 1000–2999 RMB
- 3000–4999 RMB
- 5000–6999 RMB
- ≥7000 RMB
- 9.
- The cross-border e-commerce website you use most often is ______. Please answer the following questions based on this website.
Part 3: User Perceived Trust in Cross-border E-commerce Websites
- 10.
- The color scheme of this cross-border e-commerce platform feels professional and comfortable. [Single choice]
- Strongly Disagree
- Disagree
- Neutral
- Agree
- Strongly Agree
- 11.
- The page layout of this cross-border e-commerce platform is clear, and the navigation structure is well-organized, making it easy for me to find the products I need. [Single choice]
- Strongly Disagree
- Disagree
- Neutral
- Agree
- Strongly Agree
- 12.
- The product images and videos displayed on this cross-border e-commerce platform are clear and aesthetically pleasing, which makes me feel positively about the products. [Single choice]
- Strongly Disagree
- Disagree
- Neutral
- Agree
- Strongly Agree
- 13.
- The pages and images on this cross-border e-commerce platform load very quickly, and I do not feel like I have to wait long. [Single choice]
- Strongly Disagree
- Disagree
- Neutral
- Agree
- Strongly Agree
- 14.
- This cross-border e-commerce platform runs stably, with few lags or errors during browsing or ordering, and the interaction is smooth throughout the entire process. [Single choice]
- Strongly Disagree
- Disagree
- Neutral
- Agree
- Strongly Agree
- 15.
- This cross-border e-commerce platform supports a variety of international payment methods I need (e.g., Visa, PayPal, Alipay, etc.), and the payment process is smooth. [Single choice]
- Strongly Disagree
- Disagree
- Neutral
- Agree
- Strongly Agree
- 16.
- The cross-border e-commerce platform makes good use of artificial intelligence technologies, such as in intelligent recommendations, personalized search, and smart customer service. These features are quite practical, helping me find desired products more quickly and complete transactions more smoothly. [Single choice]
- Strongly Disagree
- Disagree
- Neutral
- Agree
- Strongly Agree
- 17.
- I believe that this cross-border e-commerce platform will properly protect my personal information and that it will not be leaked or misused. [Single choice]
- Strongly Disagree
- Disagree
- Neutral
- Agree
- Strongly Agree
- 18.
- I believe that the payment environment on this cross-border e-commerce platform is secure and that my funds are safe. [Single choice]
- Strongly Disagree
- Disagree
- Neutral
- Agree
- Strongly Agree
- 19.
- The product descriptions, specifications, prices, and other information on this cross-border e-commerce platform are authentic and accurate, matching the actual products. [Single choice]
- Strongly Disagree
- Disagree
- Neutral
- Agree
- Strongly Agree
- 20.
- The policies regarding returns/exchanges, customs duties, and dispute resolution on this cross-border e-commerce platform are clear and fair, making me feel very reassured. [Single choice]
- Strongly Disagree
- Disagree
- Neutral
- Agree
- Strongly Agree
- 21.
- The cross-border e-commerce platform truthfully discloses logistics information to consumers. The logistics information is clear, timely, and complete, allowing me to track the package’s logistics status in real time (such as estimated delivery time, customs clearance progress, etc.). [Single choice]
- Strongly Disagree
- Disagree
- Neutral
- Agree
- Strongly Agree
- 22.
- I see that other users’ positive reviews and ratings on this cross-border e-commerce platform are quite high, which makes me feel that this platform is trustworthy. [Single choice]
- Strongly Disagree
- Disagree
- Neutral
- Agree
- Strongly Agree
- 23.
- This cross-border e-commerce website has good reviews and ratings on some social media platforms (e.g., “Xiaohongshu”), such as “This cross-border e-commerce website sells genuine products,” “The products on this cross-border e-commerce website are very good.” [Single choice]
- Strongly Disagree
- Disagree
- Neutral
- Agree
- Strongly Agree
- 24.
- My friends or family members have recommended this cross-border e-commerce platform to me. [Single choice]
- Strongly Disagree
- Disagree
- Neutral
- Agree
- Strongly Agree
- 25.
- I see that many positive reviews on this cross-border e-commerce platform come from buyers with official certification identifiers (e.g., 88VIP), which makes me feel that this platform is trustworthy. [Single choice]
- Strongly Disagree
- Disagree
- Neutral
- Agree
- Strongly Agree
- 26.
- Before placing an order, I can conveniently view the shipping logistics warehouse information of the product on the platform. [Single choice]
- Strongly Disagree
- Disagree
- Neutral
- Agree
- Strongly Agree
- 27.
- This platform provides a product traceability code, allowing me to verify the product’s origin and authenticity by scanning the code. [Single choice]
- Strongly Disagree
- Disagree
- Neutral
- Agree
- Strongly Agree
- 28.
- Using this platform’s product batch number query service, I can easily find information such as the batch number, production date, and expiration date. [Single choice]
- Strongly Disagree
- Disagree
- Neutral
- Agree
- Strongly Agree
- 29.
- Your overall level of trust in this cross-border e-commerce website is: ______ points (Please enter an integer from 0 to 10).
References
- Cross-Border B2C E-Commerce Market Size, Growth 2025–2034. Available online: https://www.expertmarketresearch.com/reports/cross-border-b2c-e-commerce-market (accessed on 28 February 2025).
- Mayer, R.C.; Davis, J.H.; Schoorman, F.D. An Integrative Model of Organizational Trust. Acad. Manag. Rev. 1995, 20, 709. [Google Scholar] [CrossRef] [Scilit]
- McKnight, D.; Chervany, N. What Trust Means in E-Commerce Customer Relationships: An Interdisciplinary Conceptual Typology. Int. J. Electron. Commer. 2001, 6, 35–59. [Google Scholar] [CrossRef] [Scilit]
- Li, X.; Liu, H.; Zhou, T.; Hu, C.; Ramayah, T. Generative Artificial Intelligence Heuristic Cues, Trust and Continuous Intention of CBeC Platform and the Moderating Role of Information Overload. Sci. Rep. 2026, 16, 3161. [Google Scholar] [CrossRef] [Scilit] [PubMed]
- Zhou, L.; Wang, W.; Xu, J.; Liu, T.; Gu, J. Perceived Information Transparency in B2C E-Commerce: An Empirical Investigation. Inf. Manag. 2018, 55, 912–927. [Google Scholar] [CrossRef] [Scilit]
- Ma, D.; Dong, J.; Lee, C.-C. Influence of Perceived Risk on Consumers’ Intention and Behavior in Cross-Border e-Commerce Transactions: A Case Study of the Tmall Global Platform. Int. J. Inf. Manag. 2025, 81, 102854. [Google Scholar] [CrossRef] [Scilit]
- Bianchi, C.; Andrews, L. Risk, Trust, and Consumer Online Purchasing Behaviour: A Chilean Perspective. Int. Mark. Rev. 2012, 29, 253–275. [Google Scholar] [CrossRef] [Scilit]
- Liu, X.; Yahya Dawod, A. When Technology Signals Trust: Blockchain vs. Traditional Cues in Cross-Border Cosmetic E-Commerce. Information 2025, 16, 913. [Google Scholar] [CrossRef] [Scilit]
- Peña-García, N.; Losada-Otálora, M.; Auza, D.P.; Cruz, M.P. Reviews, Trust, and Customer Experience in Online Marketplaces: The Case of Mercado Libre Colombia. Front. Commun. 2024, 9, 1460321. [Google Scholar] [CrossRef] [Scilit]
- Ou, C.X.J.; Sia, C.L. Consumer Trust and Distrust: An Issue of Website Design. Int. J. Hum.-Comput. Stud. 2010, 68, 913–934. [Google Scholar] [CrossRef] [Scilit]
- Zhang, L.; Shao, Z.; Zhao, T.; Li, X.; Zhang, J. Digitally-Enabled Antecedents of Trust, Repurchase Intention and the Impact of Blockchain Traceability Labels. Electron. Commer. Res. Appl. 2024, 68, 101469. [Google Scholar] [CrossRef] [Scilit]
- Pavlou, P.A. Consumer Acceptance of Electronic Commerce: Integrating Trust and Risk with the Technology Acceptance Model. Int. J. Electron. Commer. 2003, 7, 101–134. [Google Scholar] [CrossRef] [Scilit]
- Lewicki, R.J.; McAllister, D.J.; Bies, R.J. Trust and Distrust: New Relationships and Realities. Acad. Manag. Rev. 1998, 23, 438. [Google Scholar] [CrossRef] [Scilit]
- Hollebeek, L.D.; Menidjel, C.; Sarstedt, M.; Jansson, J.; Urbonavicius, S. Engaging Consumers through Artificially Intelligent Technologies: Systematic Review, Conceptual Model, and Further Research. Psychol. Mark. 2024, 41, 880–898. [Google Scholar] [CrossRef] [Scilit]
- Hennighausen, C.; Yarza Navarro-Schär, V.G.; Eller, E. AI -Mediated Communication in E-Commerce: Implications for Customer Trust. Int. J. Consum. Stud. 2025, 49, e70111. [Google Scholar] [CrossRef] [Scilit]
- Bonina, C.; Koskinen, K.; Eaton, B.; Gawer, A. Digital Platforms for Development: Foundations and Research Agenda. Inf. Syst. J. 2021, 31, 869–902. [Google Scholar] [CrossRef] [Scilit]
- Rizomyliotis, I. Consumer Trust and Online Purchase Intention for Sustainable Products. Am. Behav. Sci. 2024, 70, 706–724. [Google Scholar] [CrossRef] [Scilit]
- Soleimani, M. Buyers’ Trust and Mistrust in e-Commerce Platforms: A Synthesizing Literature Review. Inf. Syst. E-Bus. Manag. 2022, 20, 57–78. [Google Scholar] [CrossRef] [Scilit]
- Saaty, T.L. A Scaling Method for Priorities in Hierarchical Structures. J. Math. Psychol. 1977, 15, 234–281. [Google Scholar] [CrossRef] [Scilit]
- Li, W.; Xu, G.; Xing, Q.; Lyu, M. Application of Improved AHP-BP Neural Network in CSR Performance Evaluation Model. Wirel. Pers. Commun. 2020, 111, 2215–2230. [Google Scholar] [CrossRef] [Scilit]
- Yoon, S.-J. The Antecedents and Consequences of Trust in Online-Purchase Decisions. J. Interact. Mark. 2002, 16, 47–63. [Google Scholar] [CrossRef] [Scilit]
- Singh, N.; Misra, R.; Quan, W.; Radic, A.; Lee, S.-M.; Han, H. An Analysis of Consumer’s Trusting Beliefs towards the Use of e-Commerce Platforms. Humanit. Soc. Sci. Commun. 2024, 11, 899. [Google Scholar] [CrossRef] [Scilit]
- Breiman, L. Random Forests. Mach. Learn. 2001, 45, 5–32. [Google Scholar] [CrossRef] [Scilit]
- Shankar, V.; Urban, G.L.; Sultan, F. Online Trust: A Stakeholder Perspective, Concepts, Implications, and Future Directions. J. Strateg. Inf. Syst. 2002, 11, 325–344. [Google Scholar] [CrossRef] [Scilit]
- Wang, Y.D.; Emurian, H.H. An Overview of Online Trust: Concepts, Elements, and Implications. Comput. Hum. Behav. 2005, 21, 105–125. [Google Scholar] [CrossRef] [Scilit]
- Seckler, M.; Heinz, S.; Forde, S.; Tuch, A.N.; Opwis, K. Trust and Distrust on the Web: User Experiences and Website Characteristics. Comput. Hum. Behav. 2015, 45, 39–50. [Google Scholar] [CrossRef] [Scilit]
- Liu, Q.; Jiang, H.; Chen, Y. Research on the Construction of Consumer Trust Relationship Based on Cross-Border e-Commerce Platform. In Proceedings of the 8th International Conference on Industrial and Business Engineering ICIBE ’22, Macau, China, 27–29 September 2022; ACM: New York, NY, USA, 2022; pp. 39–45. [Google Scholar]
- Delone, W.H.; McLean, E.R. The DeLone and McLean Model of Information Systems Success: A Ten-Year Update. J. Manag. Inf. Syst. 2003, 19, 9–30. [Google Scholar] [CrossRef] [Scilit]
- Hoffman, D.L.; Novak, T.P.; Peralta, M. Building Consumer Trust Online. Commun. ACM 1999, 42, 80–85. [Google Scholar] [CrossRef] [Scilit]
- Shneiderman, B. Designing Trust into Online Experiences. Commun. ACM 2000, 43, 57–59. [Google Scholar] [CrossRef] [Scilit]
- Utami, R.D.; Aimin, W. Balancing Personalization, Privacy, and Value: A Systematic Literature Review of AI-Enabled Customer Experience Management. Information 2026, 17, 115. [Google Scholar] [CrossRef] [Scilit]
- Nong, Z.; Gainsbury, S. Website Design Features: Exploring How Social Cues Present in the Online Environment May Impact Risk Taking. Hum. Behav. Emerg. Technol. 2020, 2, 39–49. [Google Scholar] [CrossRef] [Scilit]
- Pan, L.; Hong, X. Trust as the Catalyst: Transforming Perceived to Created Value in Blockchain Traceability. Electron. Commer. Res. Appl. 2025, 70, 101487. [Google Scholar] [CrossRef] [Scilit]
- Lee, M.; Turban, E. A Trust Model for Consumer Internet Shopping. Int. J. Electron. Commer. 2001, 6, 75–91. [Google Scholar] [CrossRef] [Scilit]
- DeLone, W.H.; McLean, E.R. Measuring E-Commerce Success: Applying the DeLone & McLean Information Systems Success Model. Int. J. Electron. Commer. 2004, 9, 31–47. [Google Scholar] [CrossRef] [Scilit]
- Jarvenpaa, S.L.; Tractinsky, N.; Vitale, M. Consumer Trust in an Internet Store. Inf. Technol. Manag. 2000, 1, 45–71. [Google Scholar] [CrossRef] [Scilit]
- Bojang, I.; Medvedev, M.A.; Spasov, K.B.; Matvevnina, A.I. Determinants of Trust in B2C E-Commerce and Their Relationship with Consumer Online Trust. AIP Conf. Proc. 2017, 1910, 020001. [Google Scholar] [CrossRef] [Scilit]
- Cheung, C.M.K.; Xiao, B.S.; Liu, I.L.B. Do Actions Speak Louder than Voices? The Signaling Role of Social Information Cues in Influencing Consumer Purchase Decisions. Decis. Support Syst. 2014, 65, 50–58. [Google Scholar] [CrossRef] [Scilit]
- Cheung, B.; Jia, G. Improved AHP and BP Neural Network Model for Construction Companies’ Circular Economy Evaluation. Manag. Rev. 2015, 27, 36–47. [Google Scholar] [CrossRef]
- Hoerl, A.E.; Kennard, R.W. Ridge Regression: Biased Estimation for Nonorthogonal Problems. Technometrics 2000, 42, 80–86. [Google Scholar] [CrossRef]
- Ma, D.; Ren, H.; Zeng, Q.; Liu, Y.; Ma, L.; Zhang, Q.; Zhang, Z.; Wang, J. A Comprehensive Evaluation Method for Greenhouse-Grown Lettuce Based on RGB Images and Hyperspectral Data. Agronomy 2026, 16, 600. [Google Scholar] [CrossRef] [Scilit]
- Durlević, U.; Tadić, P.; Hussain, M.A. Snow Avalanche Susceptibility Mapping Using Deep Learning, Machine Learning, and Fuzzy Logic: A Case Study of the Šar Mountains, Serbia. Earth Syst. Env. 2025, 10, 3051–3069. [Google Scholar] [CrossRef] [Scilit]
- Shi, H.; Tsai, S.-B.; Lin, X.; Zhang, T. How to Evaluate Smart Cities’ Construction? A Comparison of Chinese Smart City Evaluation Methods Based on PSF. Sustainability 2017, 10, 37. [Google Scholar] [CrossRef] [Scilit]
- Nadeau, C.; Bengio, Y. Inference for the Generalization Error. Mach. Learn. 2003, 52, 239–281. [Google Scholar] [CrossRef] [Scilit]
- Cohen, J. Statistical Power Analysis for the Behavioral Sciences, 2nd ed.; Lawrence Erlbaum Associates, Inc.: London, UK, 1988. [Google Scholar]
- Holm, S. A Simple Sequentially Rejective Multiple Test Procedure. Scand. J. Stat. 1979, 6, 65–70. [Google Scholar]
- Wasserstein, R.L.; Lazar, N.A. The ASA Statement on p-Values: Context, Process, and Purpose. Am. Stat. 2016, 70, 129–133. [Google Scholar] [CrossRef] [Scilit]
- Altmann, A.; Toloşi, L.; Sander, O.; Lengauer, T. Permutation Importance: A Corrected Feature Importance Measure. Bioinformatics 2010, 26, 1340–1347. [Google Scholar] [CrossRef] [Scilit] [PubMed]
- Fisher, A.; Rudin, C.; Dominici, F. All Models Are Wrong, but Many Are Useful: Learning a Variable’s Importance by Studying an Entire Class of Prediction Models Simultaneously. J. Mach. Learn. Res. 2019, 20, 1–81. [Google Scholar]
- Anderson, J.C.; Gerbing, D.W. Structural Equation Modeling in Practice: A Review and Recommended Two-Step Approach. Psychol. Bull. 1988, 103, 411–423. [Google Scholar] [CrossRef]
- Hair, J.; Alamer, A. Partial Least Squares Structural Equation Modeling (PLS-SEM) in Second Language and Education Research: Guidelines Using an Applied Example. Res. Methods Appl. Linguist. 2022, 1, 100027. [Google Scholar] [CrossRef] [Scilit]
- Wanous, J.P.; Reichers, A.E.; Hudy, M.J. Overall Job Satisfaction: How Good Are Single-Item Measures? J. Appl. Psychol. 1997, 82, 247–252. [Google Scholar] [CrossRef] [Scilit] [PubMed]
- Bergkvist, L.; Rossiter, J.R. The Predictive Validity of Multiple-Item versus Single-Item Measures of the Same Constructs. J. Mark. Res. 2007, 44, 175–184. [Google Scholar] [CrossRef] [Scilit]
- Hidayat, A.; Wijaya, T.; Ishak, A.; Endi Catyanadika, P. Consumer Trust as the Antecedent of Online Consumer Purchase Decision. Information 2021, 12, 145. [Google Scholar] [CrossRef] [Scilit]
- Fornell, C.; Larcker, D.F. Evaluating Structural Equation Models with Unobservable Variables and Measurement Error. J. Mark. Res. 1981, 18, 39. [Google Scholar] [CrossRef] [Scilit]
- Podsakoff, P.M.; MacKenzie, S.B.; Lee, J.-Y.; Podsakoff, N.P. Common Method Biases in Behavioral Research: A Critical Review of the Literature and Recommended Remedies. J. Appl. Psychol. 2003, 88, 879–903. [Google Scholar] [CrossRef] [Scilit] [PubMed]
- MacKenzie, S.B.; Podsakoff, P.M. Common Method Bias in Marketing: Causes, Mechanisms, and Procedural Remedies. J. Retail. 2012, 88, 542–555. [Google Scholar] [CrossRef] [Scilit]
- Lindell, M.; Whitney, D. Accounting for Common Method Variance in Cross-Sectional Research Designs. J. Appl. Psychol. 2001, 86, 114–121. [Google Scholar] [CrossRef] [PubMed]
- Strobl, C.; Boulesteix, A.-L.; Zeileis, A.; Hothorn, T. Bias in Random Forest Variable Importance Measures: Illustrations, Sources and a Solution. BMC Bioinform. 2007, 8, 25. [Google Scholar] [CrossRef] [Scilit] [PubMed]
- Martilla, J.A.; James, J.C. Importance-Performance Analysis. J. Mark. 1977, 41, 77–79. [Google Scholar] [CrossRef] [Scilit]
- Herzberg, F.; Mausner, B.; Snyderman, B. The Motivation to Work, 2nd ed.; John Wiley and Sons, Ltd.: New York, NY, USA, 1967. [Google Scholar]
- Kim, S.; Park, H. Effects of Various Characteristics of Social Commerce (s-Commerce) on Consumers’ Trust and Trust Performance. Int. J. Inf. Manag. 2013, 33, 318–332. [Google Scholar] [CrossRef] [Scilit]
- Oliveira, T.; Alhinho, M.; Rita, P.; Dhillon, G. Modelling and Testing Consumer Trust Dimensions in E-Commerce. Comput. Hum. Behav. 2017, 71, 153–164. [Google Scholar] [CrossRef] [Scilit]
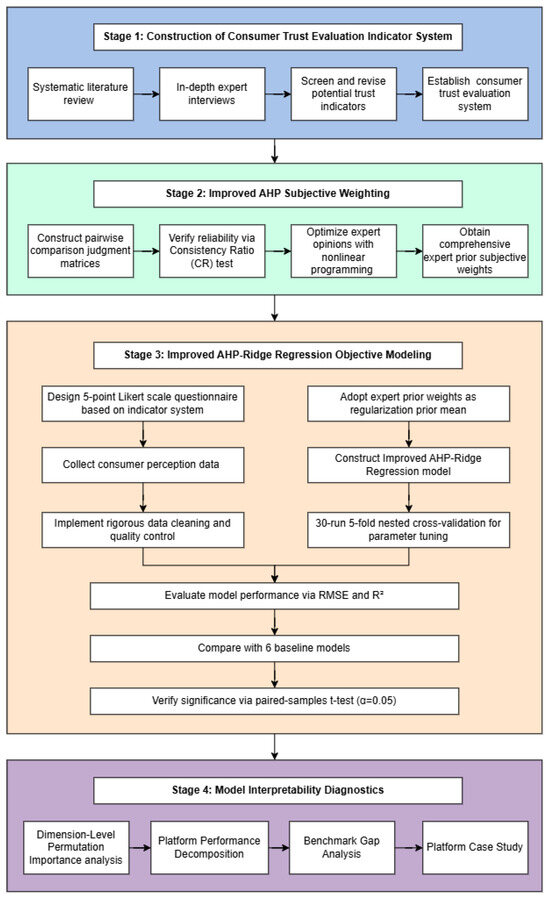
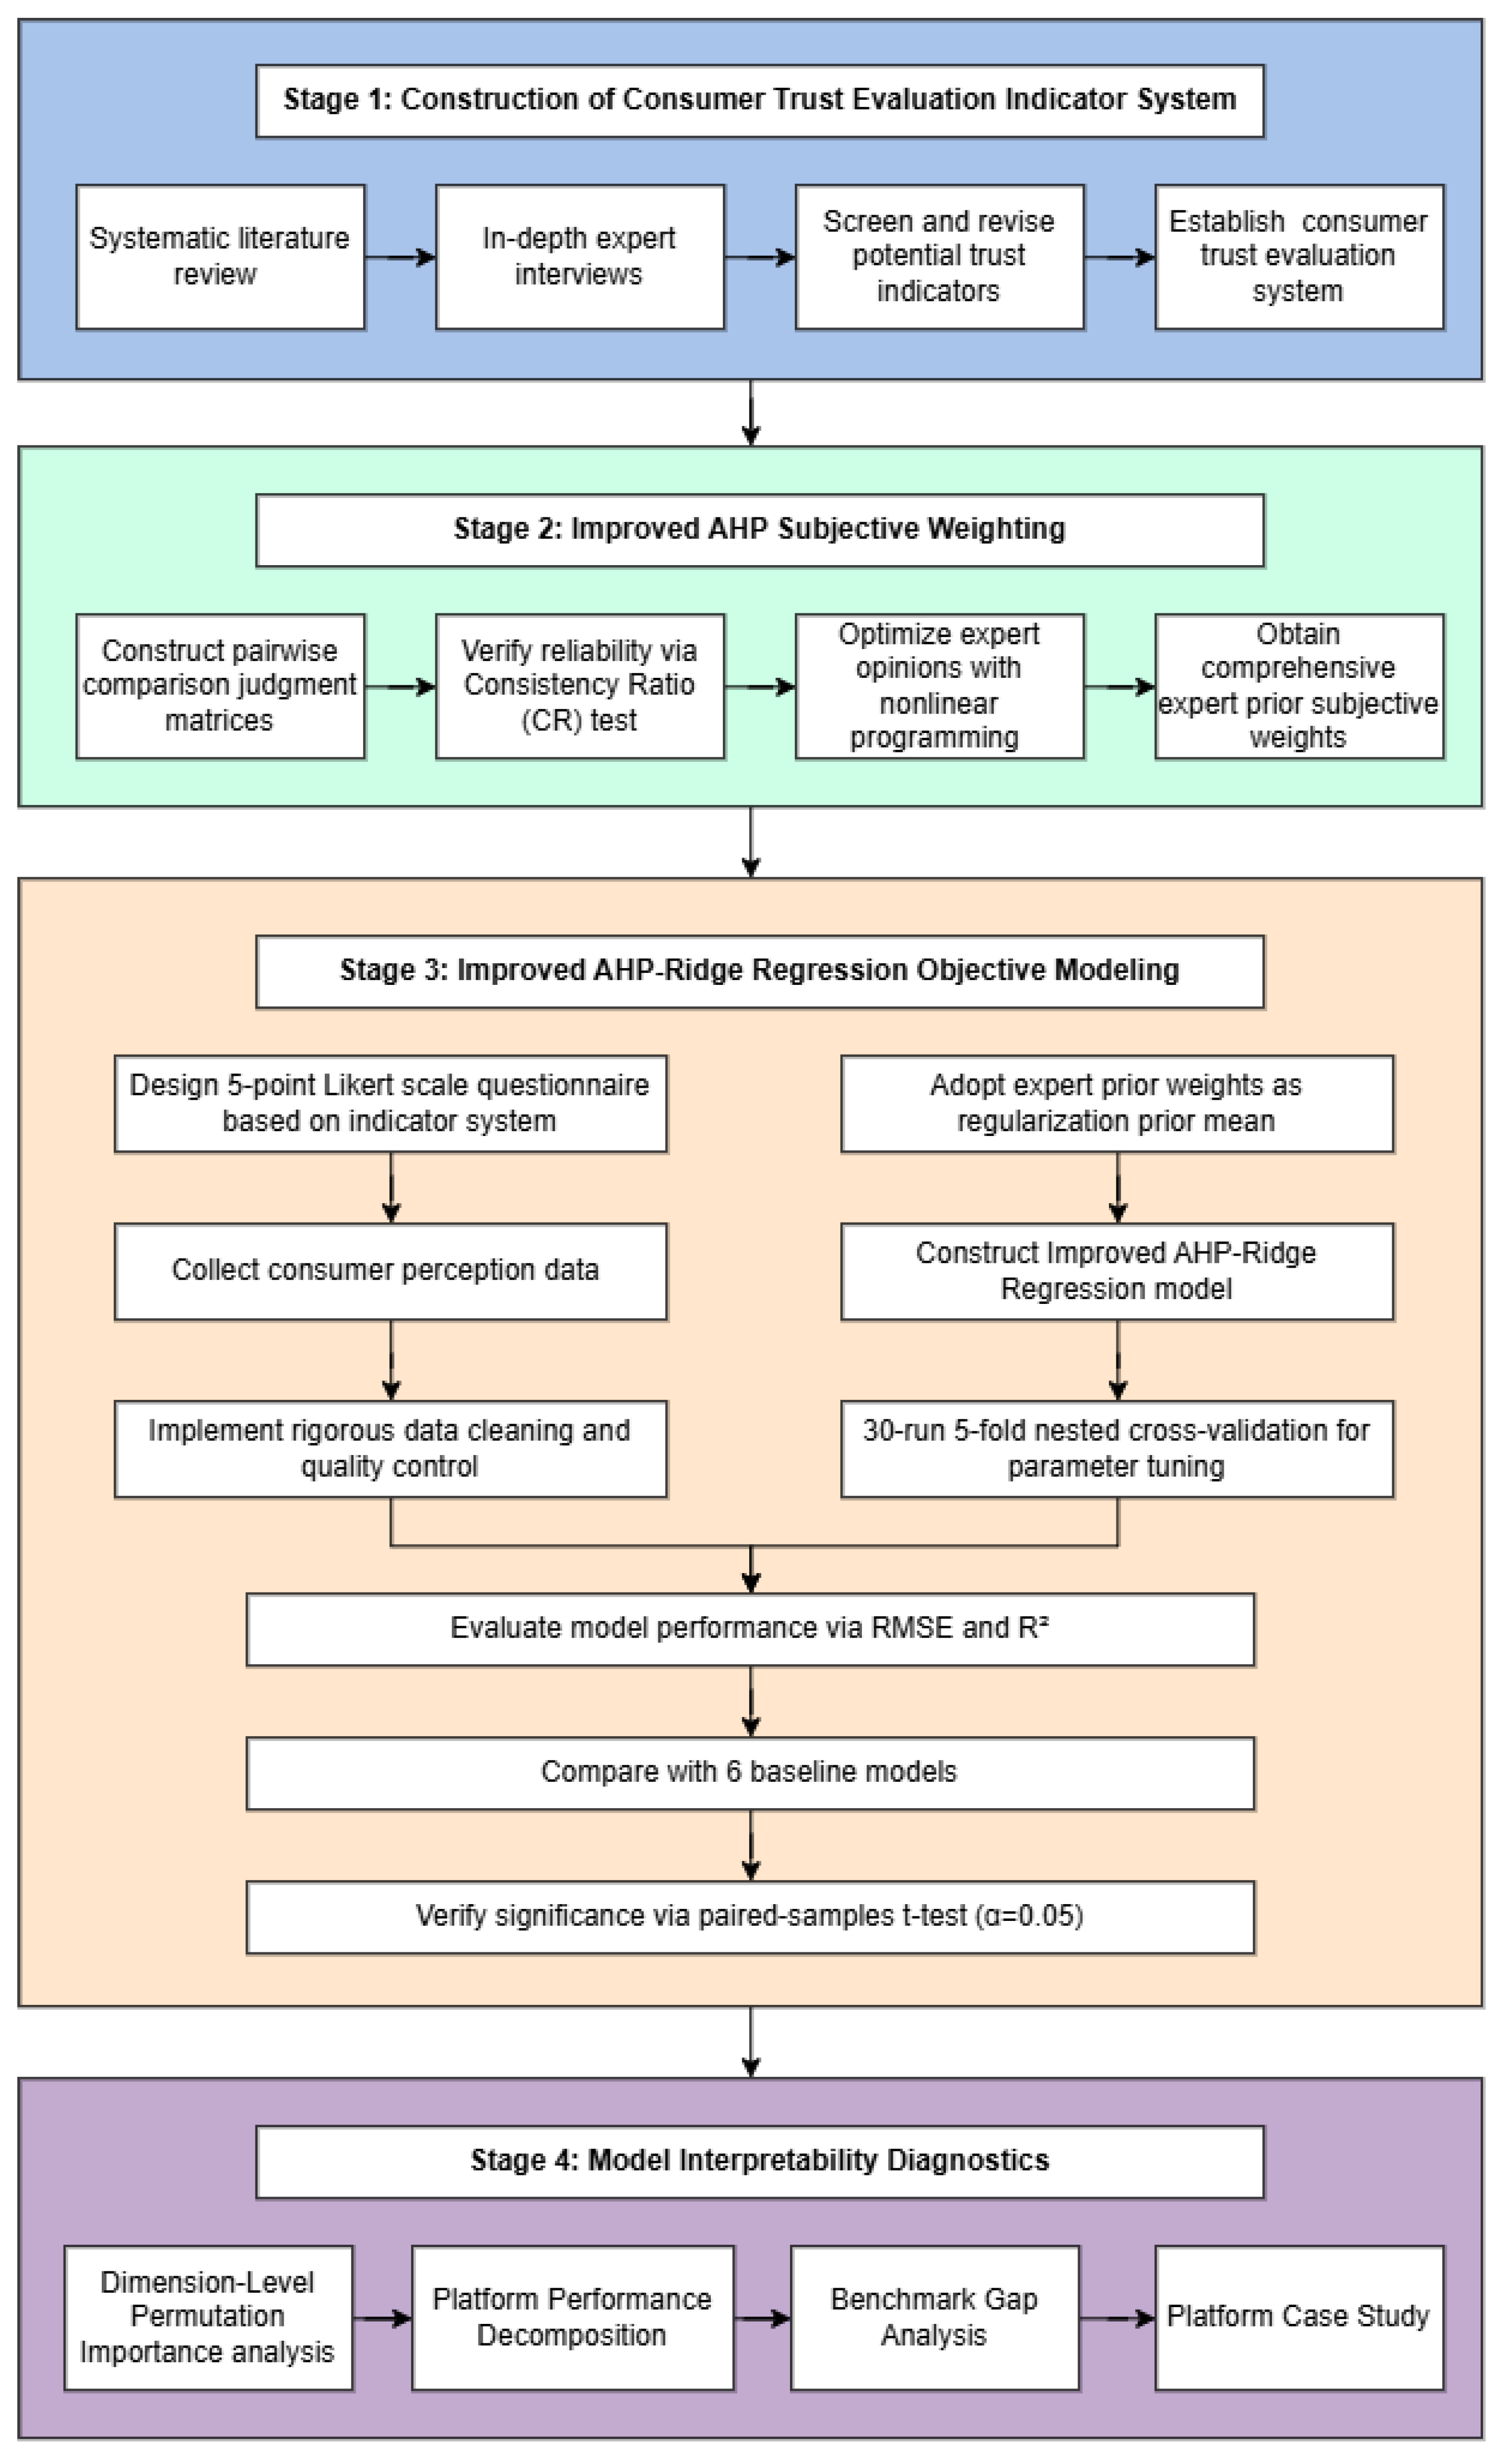

Disclaimer/Publisher’s Note: The statements, opinions and data contained in all publications are solely those of the individual author(s) and contributor(s) and not of MDPI and/or the editor(s). MDPI and/or the editor(s) disclaim responsibility for any injury to people or property resulting from any ideas, methods, instructions or products referred to in the content. |
© 2026 by the authors. Licensee MDPI, Basel, Switzerland. This article is an open access article distributed under the terms and conditions of the Creative Commons Attribution (CC BY) license.