


Abstract
The United Nations, in developing the Sustainable Development Goals, pays particular attention to cities, as they are crucial to achieving established benchmarks. Globally, many cities have high levels of food insecurity, and food access is a major component of the problem. Cities have increasingly complex and interdependent food environments. Yet, urban food systems are not well understood with respect to the impacts of redlining, residential segregation, and food store closures on food outlet distribution. Limited work is also being done on the relationship between urban sustainability efforts and food access. Here, we analyze 2229 open and closed food outlets in the Greater Grand Rapids area of southwest Michigan to examine their distribution and whether disparities are evident. We examined the impact of historic redlining on the distribution of food outlets. We also described sustainability efforts in the study area and the way county and city plans connect food access with sustainability. Roughly half of the food outlets are restaurants, 13.3% are small grocery and convenience stores, and 6.3% are pharmacies, dollar stores, and variety stores. Supermarkets and large grocery stores, which are the subject of most food access studies, account for 5% of food outlets. The most reliable predictors of food outlet distribution in the fully adjusted regression models are HOLC classification grade, median household income, educational attainment, and population density. The racial composition of the census tract was significant in only one model. The study leads us to urge more researchers to compare cities and adjacent municipalities, as income dynamics, neighborhood characteristics, population density, and educational attainment vary across urban, suburban, and rural areas.
1. Introduction
The world is facing an unprecedented food crisis, and cities are at the epicenter as 1.7 billion of the world’s 2.2 billion food-insecure people reside in urban areas [1]. Food insecurity is a significant issue in the U.S., which ranks 13th among 113 nations for food security, with a food availability score of 65.1 [2]. Approximately 18 million U.S. households were food-insecure in 2023, and food insecurity was higher in cities (15.9%) than in the suburbs (11.7%) [3]. In comparison, food insecurity rates were under 5% in Sweden, around 10% in Germany, roughly 12.6% in Belgium, and about 25% in the United Kingdom [4,5,6,7]. Food insecurity is substantially higher in parts of Africa, Asia, Central and South America, and the Caribbean [2]. Indeed, 51% of the food-insecure people in these regions live in Asia and 43% live in Sub-Saharan Africa; most live in urban areas [8]. Consequently, the United Nations Committee on World Food Security, which studies both urban and periurban communities, argues that global food security and the achievement of Sustainable Development Goals (SDGs) 2, 10, and 11 are feasible only if both dimensions of urbanization are considered [1].
Food insecurity is prevalent in the state of Michigan (14.2%) and our study area (12.4%) [9]. This paper uses the World Food Security framework to examine food access across urban, suburban, and rural areas of Greater Grand Rapids, Michigan. The study area underscores the importance of food access to the sustainability of the food system. The study assesses food access by analyzing food outlet distribution as an indicator of food insecurity. Though this is a robust area of research, most food store studies analyze only open or operating food establishments; hence, there is sparse information about the location of closed or out-of-business food venues. We address this gap by examining open and closed food venues. We also study more food outlet types than other researchers, thereby shedding light on food sources others overlook. Moreover, we examine how the historic redlining of the area fostered rigid residential segregation that remains visible today. We analyzed how redlining is related to contemporary food outlet distribution. We also analyzed sustainability initiatives aimed at improving food access and reducing disruptions to the food system in the event of natural disasters, climate, and other extreme weather events in the study area. This study is quite appropriate for the Grand Rapids area, as both the county and the city have made sustainability a significant element of their governance structures. Food access, as measured by the distribution of food outlets, is a key component of their food systems’ sustainability strategies [10,11].
Urban food access is vital. Though the study area is a major urban center with more than half a million residents, most of Michigan’s food access studies focus on Detroit and Flint [12,13,14,15,16,17,18,19,20,21,22,23,24,25,26,27]. The Grand Rapids area was settled in 1806 and incorporated in 1838 [28,29]. European immigrants settled in the Southwest, while Blacks lived on the Southside near the railroad tracks [29,30]. Tejanos and Mexicans settled in the area in the early 1900s, and Puerto Ricans in the 1950s [31]. European immigrants settled in the adjacent suburbs in the 1830s [31]. The study site is compelling because of its diverse racial/ethnic composition, varying income levels, and entrenched history of redlining and residential segregation [32,33].
2. Sustainability Initiatives and Food Access in the Greater Grand Rapids Area
2.1. Prior Food Access Assessments
Relatively few studies on food access have been conducted in the study area. A 2023 Kent County Health Department study found racial/ethnic disparities in food insecurity; 32% of Blacks, 31% of Hispanics/Latinx, and 12% of Whites were food-insecure [34]. Research found that Grand Rapids residents consumed fewer fruits and vegetables than the rest of the country [35], and that liquor and convenience stores were the city’s most plentiful food sources [36]. A comparative study of Asian Americans in Hamtramck (Michigan) and Grand Rapids found that Asians were significantly more likely to be diagnosed with diabetes. Almost 72% of the Asian study participants indicated that they were food-insecure (that is, they worried about food running out and did not have money to purchase food once it ran out) [37].
One study found that Grand Rapids’ ethnic food stores increased food availability, and People of Color (POC) had greater access to them than Whites [38]. However, about 17% of the population lived over 1.6 km from the nearest grocery store [39]. In terms of access, policymakers, researchers, and grassroots activists usually consider 1.6 km to be the distance that most residents who lack access to motorized transportation can comfortably walk to grocery stores and return home with their purchases.
The SDGs recognize that sustainability can be achieved only if the food systems are just and that there is equitable access to healthy and affordable food [1]. The salience of food access and the primacy of urban food systems (such as urban farming and community gardening) in achieving sustainability have been recognized globally [40]. Findings from a 12-country study of food security strategies and sustainability goals show that low-income countries like Ethiopia, Malawi, and Afghanistan focus on enhancing foundational agricultural activities while high-income countries like Germany, the United Arab Emirates, and Canada focus on technological and environmental innovations such as reducing nutrient losses [41]. However, findings from studies, such as the one conducted in the Dutch city of Almere in the Netherlands, show how policymakers are grappling with the challenges and opportunities to develop sustainable food landscapes in increasingly diverse and multicultural spaces [42].
Michigan has comprehensive sustainability plans to meet SDG goals that combine strategies used in low- and high-income countries. The state’s approach relies on technological and environmental advances, agricultural production, and enhancing equitable food access. This focus has spread to many counties and cities across the state. Consequently, Kent County and parts of the study area have sustainability plans. If cities and towns do not develop their own sustainability plans, they default to the county’s plan.
2.2. Kent County’s Food System Plan
Developed in 2025, the Kent County Food System Plan recognizes that food environments are vulnerable to disruptions from epidemics, natural hazards, and extreme weather events; therefore, it incorporates plans to reduce or mitigate such disruptions as part of its long-term sustainability strategy. The plan also recognized disparities in food insecurity, wherein Black and Hispanic/Latinx residents are most vulnerable to food insecurity, and that new immigrants and POC farmers lacked the resources needed to develop farming and food production businesses. The county surveyed 2879 residents and found that the ability to afford fruits and vegetables was a top concern for respondents. Other food-access-related priorities of residents included greater support for local food businesses and local farmers. Focus groups reinforced the significance of food access to residents. Food access was the top priority of the 92 participants. The ability to grow and harvest food was the second highest priority identified. Food access was also the top priority of the 31 key informants interviewed for the food systems plan. Consequently, Goal 1 of the plan sought to “ensure access to healthy food for all” [10].
Food access included the physical ability to obtain food, as well as food prices and cultural preferences. Hence, specific objectives sought to enhance the equitability of the distribution of retail food outlets; enhance public transit infrastructure in low-vehicle-access and low-income census tracts; increase the number of places and ways residents can obtain food; incentivize corner stores, minimarts, and small grocery stores to sell fresh, healthy, culturally desired, and affordable foods; increase access to places that grow, buy, or trade food; encourage partnerships between grocery stores and community members; and collaborate with public transit authorities to facilitate the transport of groceries on buses including raising the limit on the number of bags that can be brought onto the buses. Other objectives focused on making healthy foods more affordable; expanding foods-as-medicine programs that seek to ensure that low-income residents with medical conditions have access to healthy foods; expanding funding to programs like Double-Up-Food Bucks to enable low-income residents to purchase fruits, vegetables, and other produce; and promoting alternative grocery store models that foster sustainability, such as community food clubs, cooperatives, and fresh markets. Objectives also focused on helping residents to grow their own food by providing spaces in local parks and other underutilized spaces; lowering the permitting barriers to raising backyard animals; providing educational and funding resources to help residents learn about food, produce it, and start food businesses; expanding food recovery, gleaning, and donation activities; expanding the number of emergency food assistance sites and allowing such organizations to stock a broader array of food [10]. The remainder of this section focuses on the portion of the study area with explicit sustainability plans that focus on food access—Grand Rapids and Wyoming.
2.3. The Grand Rapids Climate Action and Adaptation Plan
Grand Rapids has robust sustainability goals that take food access into account. Food is a significant concern for residents. Hence, the city’s 2025 Climate Action and Adaptation Plan (CAAP) focuses on the food system as one of six pillars of its sustainability goals. Of the 440 residents surveyed during the CAAP development process, 186 (42.3%) said food systems should be a top priority. Consequently, the city aims to improve how residents produce, buy, eat, and dispose of food. The city also pledges to improve public transit to grocery stores, address high food costs, and remediate the lack of access to healthy foods in parts of the city where POC and low-income residents dwell. The city has identified Neighborhoods of Focus or census tracts with low vehicle access and limited public transit as areas to enhance food access, including providing spaces for POC to grow their own food and resources to help them start farming operations [11].
CAAP also focused on reducing barriers to owning and growing food in greenhouses in the city limits; supporting the development of small food businesses, farmers’ markets, and urban farm cooperatives; adopting a local food purchasing preference in city government procurement policies for locally grown food (food grown within 162 km of the city); using parks and other city properties to produce food; supporting farm and food business incubators and commercial kitchens; publicizing local producers; and educating local restaurants about local food producers [11].
Some of these initiatives have come to fruition. For instance, food advocates have collaborated with the city to develop an innovative grocery store, the community food club (CFC), located on the south side of Grand Rapids. The store, which has been operating for a decade, serves over 9000 people monthly. The nonprofit membership-based grocery store is for low-income residents who qualify to pay $12 or $18 for a 30-day membership. CFC reports that members see 94% more access to fresh produce, a 38% increase in food security, 31% improvement in meeting basic needs, and a 25% increase in healthy eating [43].
Grand Rapids also has a Healthy Corner Store Initiative, a collaborative project with the YMCA. The YMCA Healthy Corner Stores connect small growers, producers, and distributors to urban minimarts and corner stores to increase the quantity of fresh fruits and vegetables they stock and sell. The YMCA uses a veggie van to deliver fresh produce to corner stores and city residents. The organization also has a public education campaign to help city residents understand the benefits of eating nutritious foods [44]. The city is also concerned about reducing food waste; hence, it encourages residents and businesses to donate unused food to food pantries, soup kitchens, etc.; upcycle food; leave food unharvested on farms and in community gardens; and compost and use unconsumed food as fertilizer for the land [11].
2.4. Indoor Farming in the Study Area
Climate change and extreme weather, which result in prolonged and intense heat waves, cold snaps, storms, and droughts, can cripple outdoor farming activities. As a result, there is growing interest globally in year-round, indoor, climate-controlled, artificial-intelligence-enabled farming in food production units (FPUs) such as shipping containers. FPUs allow agriculturalists to produce food locally and take advantage of shorter supply chains. Moreover, consuming locally grown food is a crucial element in sustainability strategies [45,46]. Demand for such food is increasing in the U.S. and Michigan. As a result, three years after Square Roots pioneered its sustainable, urban, indoor farming operation in a Brooklyn (New York) parking lot, Wyoming, a suburb in the study area, became the site of its second farm. Square Roots is an indoor, climate-controlled organic farm that operates year-round. Sustainability is at the heart of operations that seek to grow food with fewer resources. Farm operators use repurposed urban infrastructure, recycled and refurbished shipping containers, less water, and less land to grow food. Because of its urban location, the farm reduces the supply chain and food kilometers between the producer and the consumer [47]. The Square Roots Wyoming farm began operations in 2019 at Gordon Food Service’s headquarters, a prominent food distributor serving the U.S. and Canada. Gordon Food Service purchases and distributes the Square Roots vegetables, leafy greens, and herbs to hundreds of restaurants, retailers, healthcare, educational institutions, and supermarkets like Whole Foods and mass merchandisers such as Meijer [48].
Operations like Square Roots are pioneering models of urban farming and sustainability that can be replicated globally. The farm, built in three months, offers not only the speed of deployment of smart form technology and the replicability of its infrastructure, but also reduced climate risk and vulnerability. The Wyoming farm grows roughly 50,000 plants at a given time and produces over 2.4 million packages of herbs and leafy greens annually while using about 95% less water than conventional farming [49]. In 2022, Square Roots opened farms in Springfield (Ohio) and Kenosha (Wisconsin) that grow about two million plants at any given time [50,51].
Scholars are probing whether FPU farming enhances sustainability and is profitable. A study of 12 hydroponic shipping container farms (HSCFs) found that technological innovations allowed farmers to produce locally, sustainably, and in new locations. Seventy-five percent of the farmers achieved increased productivity and efficiency. Study participants also reported reduced resource use; however, only half reported that HSCFs were profitable [52]. A study of an HSCF educational program in British Columbia, Canada, found that it focused on neoliberal ecological citizenship, market participation, and technological solutions rather than collective and transformative action [53].
3. Study Aims, Questions, Hypotheses, and Literature Review
This study investigates the relationship between racial characteristics, median household income, educational attainment, population density, historic redlining, and the distribution of food outlets. It analyzes five questions: (1) How are open and closed food outlets distributed? (2) How is the racial composition of the census tract related to food outlet distribution? (3) How is median household income related to food outlet distribution? (4) How is educational attainment related to food outlet distribution? (5) How is the distribution of food outlets related to historic redlining? The study is one of the first to analyze food store distribution in and around Grand Rapids, assess the relationship between redlining and food outlet configuration, and analyze food store closures in the area. The study also describes the relationship between food access and sustainability initiatives in the study area, paying particular attention to Kent County and Greater Grand Rapids.
3.1. Conceptualization
3.1.1. Supermarket Redlining
Some scholars contend that low-income, urban neighborhoods are saturated with fast-food restaurants, convenience stores, gas stations, and liquor stores, and lack supermarkets or large grocery stores [54,55,56,57]. Others report that predominantly Black census tracts had fewer restaurants than racially mixed and predominantly White ones [57]. Scholars have examined whether supermarkets and large grocery stores are present in formerly redlined neighborhoods or formerly greenlined neighborhoods, high-income areas, or suburban areas [58,59,60,61,62,63]. For instance, researchers found few supermarkets and superstores in Atlanta’s formerly redlined neighborhoods, but these neighborhoods had plenty of dollar stores and variety stores [61,64]. Research on six California cities found that liquor stores proliferated in formerly yellowlined and redlined neighborhoods; a much smaller number were in formerly greenlined neighborhoods [65]. A study of 102 cities found that formerly redlined and yellowlined neighborhoods had unhealthier food environments than formerly greenlined neighborhoods [58]. Another study of 202 cities found that yellowlined and redlined census tracts had lower food access than greenlined tracts [66]. A Salt Lake City study revealed low grocery store access in yellowlined and redlined neighborhoods [59]. A study of Hartford/East Hartford/West Hartford (the Hartford area) found that five supermarkets and large grocery stores were found in formerly greenlined and three in formerly redlined areas. No dollar stores/variety stores were found in formerly greenlined areas and only one was found in formerly redlined areas [67]. However, a Baltimore study found that redlining and gentrification were associated with improved food access [56]. Some of the patterns witnessed in the U.S. are also evident in international settings. For instance, a 10-year study of Belo Horizonte’s (Brazil) foodscape found inadequate access to healthy foods in low-income communities and that the density of unhealthy food outlets was increasing over time [68].
3.1.2. Vanishing Food Infrastructure
Grocery store closures began decades ago in the U.S. [36], but closures are understudied. Increasingly, food access scholars are researching food store closures and have identified what they call a vanishing food infrastructure. The term refers to the extensive closure of food establishments that cease operating and go out of business. These can be spread throughout an area or appear in clusters. Thus far, vanishing food infrastructures have been found in Flint [14], Lansing [69], Detroit [19], and Saginaw [70], and the Hartford area [67]. Vanishing food infrastructure can be found in economically distressed communities, areas experiencing prolonged population decline, areas with a shrinking manufacturing base, or areas saturated with food establishments. Rural areas are not immune; many closed food stores have also been identified in the countryside [71,72,73]. The closures accelerated during the COVID-19 pandemic and have persisted [73,74]. Other countries, like Canada, have seen widespread food store closures [75]. Additionally, China, which has had decades of growth in the supermarket/large grocery store sector, is witnessing the closures of supermarkets and hypermarkets in places like Guangzhou, Chongqing, Nanchang, and Fuzhou [76].
3.2. Hypotheses
Uncertainty persists regarding the density and location of different types of food stores, and few studies have examined the location of defunct food stores. We hypothesize that:
H1.
The overall density for open food outlets will be higher in census tracts where most of the residents are White than in tracts where most of the inhabitants are People of Color.
H2.
As educational attainment in a census tract increases, so does the likelihood of finding additional food outlets in the tract.
H3.
As the median household income increases in census tracts, food store closures decrease.
We base these predictions on the fact that the population size is greatest in the predominantly White or low-percentage-POC portions of the study area. This matters because food retailers such as supermarkets, grocery stores, mass merchandisers, and large restaurants tend to build facilities in or close to populous areas with customer bases that can support them. The relationship between educational attainment and food outlet density is linear; that is, food outlet density will be highest in neighborhoods with many college-educated residents. Such residents tend to have greater spending power than non-college-educated inhabitants; therefore, more food outlets are drawn to such areas. Hence, income and educational attainment are associated with purchasing power and the variety and density of food outlets in a census tract. Food outlet density is also related to food store closures: the greater the density of people in a census tract, the lower the likelihood of finding closed food stores as a robust customer base is more likely to keep food venues open.
Regarding redlining and the distribution of supermarkets and large grocery stores, we hypothesized that:
H4.
Both formerly greenlined and formerly redlined portions of the study area will have few supermarkets and large grocery stores.
H5.
Supermarkets and large grocery stores are co-mingled or co-located with dollar stores and variety stores.
We argue that instead of finding dollar stores and variety stores replacing supermarkets/large grocery stores in formerly redlined neighborhoods, we will find dollar stores/variety stores co-mingled with supermarkets and large grocery stores throughout the study area. In some states, like Michigan and Connecticut, supermarkets and large grocery stores are built in shopping malls. Hence, it is not unusual for a mall to have a pharmacy, a dollar store, a variety store, or a liquor store in the same complex as a supermarket, a large grocery store, or a mass merchandiser or superstore.
Formerly redlined areas have the lowest income, but we predict that the impact of redlining will not have as significant an impact on supermarket distribution as found elsewhere. Our results may differ because we consider a broader range of Home Owners’ Loan Corporation (HOLC) classification grades than other scholars do. So, when the study area’s industrial, commercial, unmapped, and uncoded areas are considered, the differences are not as great as when only four or fewer HOLC grades are considered. This is the case because residents of industrial/commercial zones are demographically similar to those of formerly redlined areas; residents of unmapped and uncoded areas are somewhat similar to those of formerly bluelined neighborhoods. Moreover, if A&B grades are collapsed into a single category and C&D grades into another, this will affect how differences are manifested versus when four or more HOLC grades are examined.
3.3. Structure
The paper has the following structure: Section 2 describes local sustainability initiatives. Section 3 describes the research aims, questions, and hypotheses. Section 4 discusses the methodology. Section 5 contains a comparison of the open and closed food outlets in each study city, Section 6 the impacts of redlining, and Section 7 the multivariate analyses conducted. Section 8 presents the discussion, Section 9 identifies the study’s limitations, and Section 10 contains the implications and conclusions.
4. Materials and Methods
Food outlets are places where food is grown, produced, prepared, processed, sold, or donated. The article provides extensive procedures for identifying, mapping, and analyzing food establishments. It also relies on one of the most comprehensive classifications of food venues assessed in this genre of research [12].
4.1. Defining the Study Area
4.1.1. Federal Redlining Activities
Redlining imposed federally sanctioned residential segregation in the study area, and the lingering effects are reflected in the racial/ethnic composition of neighborhoods, median household income, educational attainment, poverty levels, and the quantity and variety of food outlets present. During the 1930s and 1940s, the Home Owners’ Loan Corporation mapped and color-coded neighborhoods in over 200 U.S. cities and adjacent suburbs according to their racial, class, and immigrant composition, as well as housing quality [77,78,79,80]. When Grand Rapids’ map was drawn in 1937, HOLC coded segments of the eastern portion of Grand Rapids and all of East Grand Rapids green and gave that area an A. Areas in the eastern part of the city, adjacent to greenlined neighborhoods, were coded blue and given a grade of B. Bluelined neighborhoods were also located in the southern part of the city, as well as on the western and northern edges of the coded areas. Most of the city and suburbs were coded yellow and received a grade of C. The areas coded red (grade D) were in the central core of the city, surrounding the commercial and industrial zones [79,80].
Neighborhoods received an “A” if they had no Black residents, no families on public assistance, or no immigrants. “B” or bluelined neighborhoods had no families on public assistance and very few immigrants but were close to Black and immigrant enclaves. “C” or yellowlined neighborhoods had many families on public assistance, immigrants, and older homes. Neighborhoods with Black residents or immigrants received a “D” grade, described as hazardous, and were redlined [79,80]. HOLC coded 5% of the study area green, 13% blue, 65% yellow, 5% red, and 12% industrial and commercial. In 1940, the study site was a mid-sized urban area with a population of 164,292. At the time it was mapped, Blacks comprised about 2%, foreign-born Whites about 12%, and Native-born Whites about 86% of the study area’s population [80]. See Table 1 and Figure 1a–c.
Table 1.
Historic Redlining and Contemporary Demographic Characteristics of Census Tracts in the Greater Grand Rapids Area.
Figure 1.
Map showing the Greater Grand Rapids Area. (a) Map of the U.S. identifying the location of the Grand Rapids area (in red). (b) Map showing the racial characteristics of census tracts in the study area. The red line outlines the borders of the city of Grand Rapids. The light blue areas are predominantly White (containing 0–25% People of Color) portions of study area. Areas shaded light green have 25.1–50% People of Color. More than half of the residents of areas shaded dark green are People of Color. (c) Map showing the median household income in the study area. The areas with the lightest shading are the lowest-income parts of the study area. Light blue shading shows the second-lowest income areas. The second-highest income areas are shaded in light green, and the highest-income areas are shaded dark green [32].
As Table 1 shows, formerly green- and redlined neighborhoods currently have vastly different demographic characteristics. The former remains the Whitest, containing only 19.7% People of Color (POC), but close behind are the areas unmapped by HOLC. In the unmapped areas, POCs constitute 21% of the population. As HOLC’s color coding progressed from green to gray, the percentage of POC in the tracts increased. So around 40% of the residents of formerly bluelined neighborhoods and almost 42% of those in formerly yellowlined areas are POC. More than half of those dwelling in formerly redlined and industrial/commercial neighborhoods are POC. Formerly greenlined neighborhoods also have the highest income and educational attainment, while the formerly redlined neighborhoods have the lowest income and the highest population density.
Redlining was combined with other strategies to facilitate residential segregation. For instance, realtors used a “blockbusting” tactic wherein they urged White homeowners to sell their property and move out of neighborhoods if they suspected Black residents had purchased or tried to buy homes nearby. Realtors also practiced racial “steering” where they directed Blacks to and only sold them property in Black neighborhoods. Homeowners’ and neighborhood associations, realtors, and property developers also encouraged White homeowners to place racially restrictive covenants in their property deeds that prohibited Blacks and other POC from occupying the property. Such tactics were widely used in the study area [77].
In 2023, roughly 34% of the residents in the study area are POC. However, the POC percentage ranged from roughly 2% to 88% across census tracts, and, as later discussion shows, tracts were categorized as low-, moderate-, or high-POC. Median household income is displayed in quartiles only for the purposes of this map. Income is analyzed per $10,000 increments in the multivariate models [32].
4.1.2. Comparing Redlining in the Grand Rapids Area with Other Cities
Why study redlining in Greater Grand Rapids and incorporate findings from other cities? Food access studies have been conducted in several cities that were redlined. At the time those mentioned in this paper were redlined, 70% or more of the residents of all the cities were White. Less than 10% of the population of Greater Grand Rapids, the Hartford area, Detroit, Baltimore, Salt Lake City, Lansing/East Lansing, Flint, and Saginaw were Black. However, Blacks constituted 29% of the Atlanta area at the time it was redlined. The Grand Rapids area is most like the Hartford area: at the time both urban areas were redlined, they had populations of 164,292 and 166,267 residents and had 2% and 4% Black residents respectively. Salt Lake City and Flint had roughly 150,000 residents each and Flint had 4% Blacks while Salt Lake City had too few Blacks to be calculated [80].
The 1940 census shows that when the referenced cities were redlined, all but two were mid-sized cities—defined by the census as cities having between 75,000 and 500,000 people. Only two—Detroit and Baltimore—had populations exceeding half a million. Today, the study area is still one of three mid-sized cities mentioned in this paper—Salt Lake City, the Hartford area, and Lansing/East Lansing—while three are large. Detroit, Baltimore, and Atlanta have populations ranging from 520,000 to 645,000. Two of the referenced cities (which have experienced steep population declines) are now considered small; they are Flint and Saginaw [80]. The population size and extent of growth or decline will influence the number and type of food outlets a city has.
Currently, Whites comprise more than half of the population in Salt Lake City, Grand Rapids, and Lansing/East Lansing while Blacks constitute the bulk of the population in Detroit, Baltimore, Atlanta, Flint, and Saginaw. The study area is unique; roughly 34 percent of the residents are POC, and the locale comprises three major racial/ethnic groups—Whites, Hispanic/Latinx, and Blacks. Like Greater Grand Rapids, the Hartford area also has the same three racial/ethnic groups constituting most of its population [67]. The Grand Rapids study allows us to analyze an urban area in which the three largest racial/ethnic groups in the country are replicated [81]. Additionally, the study area allows us to compare the findings with cities that are predominantly White, predominantly Hispanic/Latinx, and predominantly Black. The study area’s population size allows us to compare it to larger and smaller urban areas.
The study area is also interesting because HOLC coded only a small portion—5%—in red. HOLC also shaded 5% of the study area green. Most of the study area (65%) was yellowlined. The percentage of the study area that was redlined is lower than several of the other cities mentioned above; 49% of the coded areas of Flint were red, as were 43% of Salt Lake City, 26% of Detroit, 23% of Atlanta, and 13% of Baltimore and Saginaw. However, the redlined portions of the Hartford area and Lansing/East Lansing were like those of Grand Rapids. In each case, 6% was redlined. The Hartford area was an anomaly when it came to greenlining—32% of that area was greenlined. Less than 10% of the other cities discussed were greenlined [80]. The percentage of a city coded in each of the HOLC categories impacts the number and type of food outlets in each graded area. Hence the percentage of formerly redlined or greenlined sections of a city will influence the number and type of food outlets in each. However, scholars have not yet analyzed the impact of redlining by comparing how it related to food outlet distribution in cities with similar or different percentages of HOLC-coded areas.
4.2. Data Collection, Sources, and Verification
The Greater Grand Rapids area offered an opportunity to study food outlet distribution in a locale experiencing vibrant economic and population growth. The study area is predominantly White with a complex racial history. It contains the exclusive, wealthy, predominantly White enclave of East Grand Rapids and suburbs like Kentwood and Wyoming with robust Black and Hispanic/Latinx populations. We conducted our study in 2023–2024 and defined the study area to include a buffer around Grand Rapids to account for edge effects, as people regularly cross jurisdictional boundaries to acquire food [14,38,82,83,84,85]. Studies also show that residents often travel five or more kilometers to obtain food [38,71,83,84,86]. Moreover, many mass merchandisers and wholesale clubs locate their stores on the outskirts of major cities, where they build sprawling facilities because land is cheaper and parking is abundant. Thus, extending our study area beyond Grand Rapids’ boundaries considers residents’ shopping behaviors and encompasses the city and its nearby suburbs. We used an eight-kilometer buffer around Grand Rapids to define the study area, which covered approximately 776.24 square kilometers. We used the areal interpolation feature in ArcGIS Pro 3.4.3 to estimate and clip census tracts extending beyond the buffer. The 8 km buffer is appropriate because there are few food outlets outside of it. We used proportional allocation to approximate the population size when there were census tract fragments to account for. However, this technique could potentially cause either over- or underestimation, an eventuality that could result in bias.
We collected data on the food outlets and classified them using a typology our team developed that had 13 major categories and 57 sub-categories [12,14,67,69]. We studied the number of food establishments present in each category. We downloaded information on food stores from Data Axle, headquartered in Dallas, Texas; it is the leading information storehouse on food establishments. For this reason, other researchers also utilize it [85,86,87,88]. We used 153 Standard Industrial Classification (SIC) division codes to identify food establishments. This is necessary because not all food outlets appear in food searches. For instance, SIC does not classify establishments like Meijer and Costco, which have large food sections, as food stores; instead, it classifies them as department stores. SIC is a federal classification system for businesses. We used the following filters to facilitate identification: the major group, industry group, and industry codes. Our multi-level search technique helped maximize the number of food outlets identified. Hence, other food access researchers also use this technique [12,14,37,67,69,70,86,87,88,89].
One limitation of Data Axle is that it does not routinely remove non-operational establishments from its database. Consequently, researchers using this data must verify its integrity. In doing so, we found that some of the food outlets in Data Axle’s database were no longer in business. Moreover, the repository does not identify or have information on all food outlets in a given area. Consequently, we gathered data on food outlets from additional sources, including directories of community gardens, urban farms, emergency food assistance programs, and stores that accept Electronic Benefits Transfer cards, as well as Bing and Google searches. We geocoded these additional food outlets and included them in the final dataset.
We collected and verified information about each food venue once during the study period. We classified a food venue as “open” if it was operating at the time we collected the data. Food outlets were classified as “closed” if they had gone out of business, closed, or abandoned, or were not operating when we collected data. We verified whether each food outlet in our database was open or closed before listing them in either category.
Several validation techniques were employed to verify food outlet information, eliminate non-food-related establishments, and enhance the accuracy of the collected data. Consequently, we contacted food outlets by telephone, email, or text to verify their addresses, identify their typology, and confirm their operational status. We also used Google Maps v19.0.0 to obtain aerial and street views of the food outlets and to verify their latitude and longitude coordinates. We double-checked all coordinates to ensure they matched the addresses and locations of the food outlets and fell within the study area’s boundaries. When necessary, we entered the correct coordinates, addresses, and types of food stores. Businesses that were not food venues were removed from the database. Those that were closed were documented and used in the food store closure part of our analysis. We identified a total of 2229 food outlets, 2021 of which were open, and 208 of which were closed.
We relied on the 2023 U.S. Census American Community Survey (ACS) 5-Year Estimates for demographic information (Table 1). Census tract-level data were extracted for non-Hispanic White, non-Hispanic Black, Hispanic/Latinx, and other racial/ethnic groups, as well as median household income; educational attainment; population size; and poverty status. The study area’s population was estimated using areal weighting interpolation in ArcGIS Pro 3.4.0, based on the 2023 U.S. Census. The term “People of Color” describes individuals who identify as Black, Hispanic/Latinx, Asian, Native American, Pacific Islander, or multi-racial. The highest level of education achieved was calculated for residents of the census tract aged 25 and older. The median household income was calculated using weights based on the number of households in each tract [32]. Census tract boundary shapefiles were downloaded from the U.S. Census Bureau’s TIGER/Line® files (2020 vintage) and used to spatially link demographic data with food outlet locations and historical redlining boundaries.
4.3. Spatial Mapping and Statistical Analyses
We conducted the spatial analyses in ArcGIS Pro 3.4.3, using the municipal boundaries and 2020 census tract shapefiles described above. We projected all data using the NAD 1983 State Plane Michigan South FIPS 2113 GeoRef coordinate system. We used spatial joins and overlay operations, including the Intersect tool, to integrate food outlet information and demographic and historical redlining data. For census tracts that extended beyond the 8 km buffer, we applied proportional allocation using areal interpolation to estimate demographic characteristics of the portion of each tract falling within the buffer [69,70,89].
We used census tracts to approximate the code HOLC assigned to each neighborhood. Where census tracts did not match the areas covered by each code, the tracts were clipped, and data were interpolated to estimate the demographic characteristics studied. Food outlet locations were geocoded using the World Geocoding Service in ArcGIS Pro and spatially joined to census tracts to assign each outlet to a tract for aggregation and analysis. We also spatially joined outlets with HOLC-graded polygons to determine the number and types of outlets located within each historical grade. We calculated the total number of food outlets in each category and type in each census tract. Tracts containing no food outlets that had residents were retained to ensure accurate geographic representation. However, census tracts that had neither food outlets nor residents were excluded from the analysis. The overall population counts in the table may vary slightly depending on whether they use U.S. Census counts or ArcGIS estimates. The differences also arise because several census tracts are spread across the study area’s border into adjacent jurisdictions. We estimated the population in clipped census tracts.
We conducted statistical analyses in SPSS 29 while the regression, spatial autocorrelation, and sensitivity analyses were conducted in R 4.5.1. For the descriptive analysis, we used a categorical variable to classify the percentage of POC residing in each census tract (see Table 2 and Figure 1). Census tracts with 0.0–25.0% POC were classified as low People of Color (LPOC), those containing 25.1–50.0% as moderate People of Color (MPOC), and those containing 50.1% or more as high People of Color (HPOC). Only seven census tracts had more than 75% POC, so we placed all tracts with more than 50% POC in the HPOC category. We adopted this approach because it allowed us to identify and study how census tracts with low, moderate, and high percentages of POC differed. This technique also allowed us to observe food access in tracts where over half of the residents were POC. However, tract racial composition was treated as a continuous variable in regression models and scaled to represent 10-percentage-point increases in the share of POC.
Table 2.
Census Tract Characteristics and Independent Variables in the Greater Grand Rapids Area.
To characterize historical redlining exposure, digitized HOLC maps were overlaid with 2020 census tract boundaries in ArcGIS Pro. Census tract boundaries and HOLC polygons were intersected to identify the portions of each tract corresponding to specific HOLC classifications. Areas designated as Grades A, B, C, and D, as well as Industrial/Commercial areas, were identified from the digitized HOLC maps. For census tracts containing areas that were not assigned an HOLC classification, the uncoded area was calculated by subtracting the total HOLC-classified area from the total census tract area. These residual areas were classified as Uncoded. Areas located outside the extent of the original HOLC maps were classified as Unmapped. In descriptive analyses, we estimated population and food outlet counts using area weighted interpolation because some census tracts included multiple HOLC-designated areas. This allowed demographic characteristics and food outlet availability to be summarized by HOLC classifications.
In regression analyses, a tract-level HOLC classification variable was created by intersecting census tract boundaries with the historical neighborhood classification layer and calculating the area of overlap between each tract and classification category. Each census tract was assigned to the classification category that occupied the largest proportion of its area. This is consistent with previously published approaches to the plurality-of-area method used to align historical HOLC maps with contemporary census geographies [90,91]. Because so few food outlets were located within Grade A and Grade D neighborhoods, Grades A and B were combined into a single A/B category, and Grades C and D were combined into a single C/D category. Other researchers use this technique in their redlining analyses [59]. Although no universal standard exists for classifying an area based on the HOLC overlap, prior studies have identified the <5% threshold as a reasonable criterion for identifying uncoded tracts [92]. The final HOLC classification variable consisted of five categories: A/B, C/D, Industrial/Commercial, Uncoded, and Unmapped. HOLC classification was modeled as a categorical variable, with A/B serving as the reference category in regression analyses.
Three census tracts with no residents were excluded from regression analyses because population was used as the model offset, resulting in a final analytic sample of 129 census tracts. Regression analysis was limited to outlet types with counts of 10 or more; therefore, the total number of food outlets analyzed differs from the numbers reported in Table A1 due to this threshold. Hence, 1949 food outlets were included in the multivariate analyses. We estimated generalized linear models separately for each major food outlet category that met our threshold to evaluate associations between census tract racial composition, historical redlining, and food outlet availability. The dependent variable was the number of outlets per census tract. We included the natural log of the tract population as an offset term to model food outlet rates and account for differences in population size. Three models were generated:
Model 1:
log (F) = β0 + β1 × POC + β2 × I + β3 × E + β4 × PD + LP
Model 2:
log (F) = β0 + β1 × HGC + β2 × I + β3 × E + β4 × PD + LP
Model 3:
where F is the count of the food outlet type, POC is the percent People of Color per census tract, HGC is the HOLC grade classification, I is the median household income per 1000 USD, E is the percent of the population with at least a bachelor’s degree, PD is the population density, and LP is the log of the population. To improve the interpretability of incidence rate ratios, continuous predictors were rescaled: percent POC and percent with a bachelor’s degree or higher were divided by 10 (per 10% increase), and population density was scaled to reflect a 10-person/km2 increase.
log (F) = β0 + β1 × POC + β2 × HGC + β3 × I + β4 × E + β5 × PD + LP
We used negative binomial regression with a log link to account for overdispersion in count data. Poisson regression was used for models with minimal overdispersion, specifically for all models examining farms, gardens, farmers’ markets, and produce vendors, food assistance outlets, and supply chain vendors. Model selection was guided by deviance, Akaike Information Criterion (AIC), Bayesian Information Criterion (BIC), and dispersion statistics, with the negative binomial model selected when overdispersion was evident. Model comparison results are also presented in Table A5, Table A6, Table A7 and Table A8.
Exposure variables were percentage of POC (per 10%) and HOLC classification. The HOLC classification was modeled using dummy variables, with grade A/B used as the reference category. Covariates included population density (10 persons/km2), median household income (per $1000), and educational attainment (percentage of residents with a bachelor’s degree or higher (per 10%)).
Prior to model estimation, we examined bivariate associations among predictors using Spearman correlations to assess redundancy. Median household income and poverty were highly inversely correlated (ρ = −0.775, p < 0.001); therefore, poverty was excluded from adjusted models to improve parsimony. Variance inflation factors from the final models were below the prespecified collinearity threshold (all VIF < 2.5). Other researchers also use this threshold [93].
Sensitivity analyses were conducted to examine further relationships among racial composition, socioeconomic conditions, and food outlet availability. First, interaction terms between the percentage of POC and median household income were added to the fully adjusted models to assess whether associations between racial composition and food outlet availability varied by income level. Second, median household income was replaced with the percentage of residents living below the federal poverty line to compare model performance and determine whether conclusions differed when poverty was used instead of income as the socioeconomic indicator. These analyses were conducted for all food outlet categories. Model fit was evaluated using the AIC, and results were compared based on the magnitude, direction, and statistical significance of the model coefficients.
4.4. Spatial Autocorrelation
We evaluated spatial autocorrelation in both food outlet distributions and model residuals using Global Moran’s I. A first-order queen contiguity matrix based on census tract boundaries was used to define spatial relationships among tracts. Global Moran’s I was calculated for raw outlet counts to assess spatial clustering. To determine if spatial dependence remained after adjustment for historical redlining, racial composition, and neighborhood socioeconomic characteristics, Moran’s I was also calculated using residuals from the final regression models. Statistical significance was evaluated at α = 0.05.
5. Descriptive Analysis of the Food Landscape
5.1. Open Food Outlet Distribution
We conducted both qualitative and quantitative analyses; descriptive statistics are presented first, followed by multivariate regression analyses. We identified 2021 open food venues (Table 3 and Figure 2). We used food outlet density to measure how food sources are distributed throughout the study area. The overall density for open food outlets was 3.96 per 1000 residents. The highest food outlet density was observed in census tracts with the lowest POC percentage; it was 4.73/1000 in LPOC census tracts. In comparison, the density was 3.89/1000 in MPOC tracts and 2.53/1000 in HPOC tracts. In other words, more than half of the food venues were in predominantly White census tracts, and food outlet density was almost twice as high in census tracts with 25% or fewer POC as in census tracts where most residents were POC (see also Table A1 and Figure A1).
Table 3.
Number and Density of Open and Closed Food Outlets.
Figure 2.
Number of food outlets in Greater Grand Rapids. (a) Graph of open and closed food outlets in the study area. The red line indicates the border of the city of Grand Rapids. (b) Map showing the 2021 open food outlets studied. (c) Map showing the location of 208 closed food outlets in the study area.
The study area’s 104 supermarkets and large grocery stores are spread throughout the city and suburbs. The density peaks at 0.24/1000 in MPOC tracts and is least dense in HPOC tracts (0.14/1000). Small groceries and convenience stores are much more numerous in the study area than supermarkets and large grocery stores. The 264 small groceries and convenience stores outnumbered supermarkets and large grocery stores by a ratio of 2.5 to 1. The results show that as the POC percentage in the census tracts increases, so does the density of small groceries and convenience stores. Hence, the density is 0.46/1000 in LPOC tracts and 0.48/1000 in MPOC tracts; it is noticeably higher in HPOC tracts at 0.68/1000. The study area has 127 pharmacies/dollar stores/variety stores, and these tend to be in predominantly White areas. Hence, the density is 0.32/1000 in LPOC, 0.22/1000 in MPOC, and 0.14/1000 in HPOC census tracts. This distribution might occur because pharmacies, dollar stores, and variety stores tend to be in commercial strips or malls, which are common in middle-income White neighborhoods.
The study site has 1023 restaurants, accounting for more than half of the food landscape. There were 508 full-service and 199 fast-food restaurants. Overall, restaurant density is highest in predominantly White tracts and significantly lower in predominantly POC census tracts. There are 2.41 restaurants/1000 in LPOC tracts, 2.13/1000 in MPOC, and 1.03/1000 in HPOC census tracts. Full-service restaurant density is significantly lower in census tracts where more than half the residents are POC than in other census tracts. Fast-food restaurant density is also higher in LPOC and MPOC census tracts (each with a density of 0.42/1000 and 0.44/1000, respectively) than in HPOC tracts (which have a density of 0.26/1000). The density of bars and clubs peaked in MPOC census tracts and was lowest in HPOC tracts, while coffee shops and juice shops occurred in much higher density in LPOC census tracts than in other tracts. For instance, the wealthiest and Whitest suburb in the study area, East Grand Rapids, has only coffee shops/juice shops, and no other kind of food venues. In comparison, very few coffee shops and juice shops were found in HPOC census tracts.
The higher the percentage of POC in a census tract, the lower the density of urban farms, community gardens, farmers’ markets, and produce vendors. Social, religious, educational, and community services food venues—of which there were 202—are densest in LPOC census tracts (0.58/1000) and least dense in HPOC tracts (0.18/1000). The distribution of food assistance venues was also interesting; the food pantry/soup kitchen density was highest in LPOC tracts (0.05/1000) and lowest in HPOC tracts (0.03/1000). The scarcity of urban farming/community gardening/farmers’ markets/produce vendors, food assistance venues, and social/religious/educational/community services outlets in HPOC census tracts is noteworthy and concerning, as the residents of these tracts experience attenuated food access. Despite the county’s and study area’s sustainability plans, which highlight racial inequities in food access and outline plans to enhance equity in the food system, our study has identified the above disparities.
5.2. Food Store Closures
We identified 208 closed food outlets (Table 3). Figure 2 shows that most were in the southern part of the study area. The overall density of closed food outlets decreased as the census tract’s POC percentage increased. More than half of the closed food outlets were observed in LPOC census tracts, which had a density of 0.47/1000. MPOC tracts had a density of 0.40/1000 while HPOC tracts had a density of 0.30/1000. This is in line with the finding that LPOC census tracts had the highest density of open food establishments. Where there are more open food outlets, one is more likely to find that some of them have gone out of business.
Formerly redlined neighborhoods had only two closed food outlets, while formerly greenlined neighborhoods had one. The bulk of the closures occurred in the formerly uncoded portion of the study area, which had the largest number of open and closed food outlets. Regarding the density of closed food venues, the lowest densities were in formerly green- and redlined neighborhoods (both had 0.12/1000). Neighborhoods coded industrial and commercial had significantly higher densities than other neighborhoods—0.70/1000.
The closures heavily impacted the supermarkets/large grocery store sector. There were 14 closed supermarkets/large grocery stores, 10 closed small groceries/convenience stores, and 13 closed pharmacies/dollar/variety stores. Of the 99 closed restaurants, most were full service. The food assistance category appears decimated; 28 (58.3%) food pantries or soup kitchens had closed. Though the area’s sustainability plans call for more individual and restaurant donations to food banks, soup kitchens, and food pantries, these efforts focus on increasing the quantity and quality of food served at existing emergency assistance venues, rather than expanding the number of such outlets.
6. The Impacts of Redlining
Though researchers focus on the relationship between supermarkets and redlining, Table 3 and Table A2, and Figure 3 suggest that other food outlets also warrant attention when studying HOLC’s mapping system. Once-greenlined neighborhoods have only nine open food outlets, while formerly redlined neighborhoods have 55. Formerly bluelined neighborhoods have 80, the once-yellowlined neighborhoods have 342, industrial/commercial areas have 374, while uncoded areas had 477, and unmapped sections have 684. The food outlet density was significantly higher in formerly industrial/commercial census tracts; it was 13.18/1000. The lowest density (1.07/1000) occurred in the formerly greenlined tracts. Researchers studying redlining and food outlet distribution tend to ignore areas that were uncoded and unmapped by HOLC, yet we find many food outlets in these areas.
Figure 3.
Supermarkets and redlining in the study area. (a) Proportional representation of food outlets in various HOLC grades. (b) Map showing the locations of traditional supermarkets, large grocery stores, mass merchandisers, wholesale clubs, supercenters, dollar stores, and variety stores. (c) Map showing the relationship between HOLC mapping and the location of closed food stores.
As Table A2 shows, none of the traditional supermarkets/large grocery stores were in formerly greenlined areas, and one was in a formerly redlined neighborhood. Figure 3 also shows that supermarkets and large grocery stores are sometimes co-located with other food outlets, which other researchers claim drives them away. The figure reveals that supermarket/large grocery stores are often intermingled with dollar stores and variety stores—the kinds of food outlets researchers claim swamp them out and replace them in neighborhoods.
The formerly greenlined area had no small grocery stores or convenience stores. Formerly yellowlined and redlined neighborhoods had similar densities of these food establishments, and the highest density was found in areas formerly coded as industrial/commercial. The pattern was similar for pharmacies, dollar stores, and variety stores. The restaurant density was lowest (0.36/1000) in formerly greenlined areas and highest in formerly industrial/commercial areas (7.89/1000). The restaurant density was somewhat similar in formerly bluelined and yellowlined (1.39/1000), but lower in redlined neighborhoods. Formerly greenlined neighborhoods had no full-service, fast-food, or takeout restaurants; instead, there were three coffee shops/juice shops. All the other HOLC neighborhood types had restaurants.
The density of urban farms, community gardens, farmers’ markets, and produce vendors ranged from 0.0 in once-greenlined and formerly industrial commercial census tracts to 0.6/1000 in formerly yellowlined and formerly redlined tracts. The density of mobile food sources peaked in the formerly industrial/commercial area, while the density of social/religious/educational/community service venues peaked in formerly redlined and industrial/commercial neighborhoods.
7. Multivariate Analysis
We conducted multivariate analyses and discussed the results of full models, identifying significant associations between food outlet distribution and independent variables. We checked for auto spatial correlation, and the Global Moran’s I tests indicated no significant residual spatial autocorrelation for most outlet categories. This suggests that spatial dependence was generally accounted for in the regression models. The residual spatial autocorrelations were insignificant for all the major food outlet categories in the final fully adjusted tract-level regression models (see Table A3 and Table A4).
We used multiple regression models to predict the occurrence of food outlets in the study area. The article discusses the results of the full model (Model 3), which showed significant relationships between food outlet distribution and independent variables. Table 4 identifies the significant predictors in each regression. Where there is no data, the predictor is not significant. If a food outlet category is not listed in the table, regressions were not performed due to sparse data. Details of the regression models for open food outlets are shown in Table A5, Table A6 and Table A7 and Figure 4a–c.
Table 4.
Significant Predictors of Food Outlet Availability in Fully Adjusted Regression Models.
Figure 4.
Incidence rate ratios (IRRs) and 95% confidence intervals for negative binomial regression models predicting the number of total open food outlets, with tract population included as a log offset. Incidence rate ratios (IRRs) and 95% confidence intervals from negative binomial regression models predicting the number of total food outlets, with tract population included as a log offset. In the charts, the green lines represent racial composition, purple lines depict HOLC grade, and blue lines represent income, educational attainment, and population density. (a) Model 1 includes percent people of color (per 10%) as the primary exposure, adjusting for median household income (per $1000), percent of the population with a bachelor’s degree or higher (per 10%), and population density (per 10 persons/km2). (b) Model 2 includes HOLC grade as the primary exposure, adjusting for the same covariates as Model 1, excluding percent people of color. (c) Model 3 includes all predictors simultaneously. Negative binomial regression was selected based on model fit; Poisson models were also tested and are reported in Table A5, Table A6 and Table A7. Green markers represent demographic exposure variable, blue represents socioeconomic covariates, and purple represents HOLC exposure. Confidence intervals and/or point estimates extending beyond the plotting range are truncated at the axis limit. The x-axis is plotted on a log10 scale; IRR = 1 indicates no association.
When the total number of open food outlets was analyzed, the racial composition of the census tract was significant only once—for specialty food stores and vendors. The HOLC classification was significant six times—for small groceries and convenience stores in uncoded and in unmapped tracts and for mobile food sources in Grades C/D and in uncoded census tracts. HOLC classification was also significant for supply chain in uncoded as well as unmapped census tracts. Median household income was also a robust predictor of food outlet distribution. It was a significant predictor five times. It was a significant explanatory factor in the distribution of supermarkets and large grocery stores; it was the only covariate that was significant for this food outlet category in the full model. Median household income was also a significant predictor of the distribution of small groceries/convenience stores, pharmacies/dollar/variety stores, specialty food stores, and social/religious/educational/community services venues.
Educational attainment was significant in four instances—the total number of food outlets, restaurants, social/religious/educational/community services, and gyms/health centers. Population density was significant in predicting the total number of open food outlets. It was the only variable that was significant in predicting the total number of closed food outlets. Population density was also a significant predictor of the distribution of small groceries/convenience stores as well as restaurants.
The incidence rate ratios (IRRs) for the full model shown in Table A7 and Figure 4c indicate that the likelihood of finding an additional food outlet declined by 1 percentage point per thousand persons. Conversely, the likelihood of finding an additional food outlet increased by 25 percentage points for every 10% increase in the number of residents with a bachelor’s/graduate degree.
The paper analyzed whether there were significant differences in the distribution of each major food outlet category. Median household income was the only significant predictor of supermarket/large grocery store distribution. The likelihood of finding an additional supermarket/large grocery store declined by 3% for every $1000 increase in median household income. This covariate was also a significant predictor of the distribution of small groceries/convenience stores. So for every $1000 increase in median household income, there was a 1% decline in the likelihood of finding an additional small grocery or convenience store. Similarly, for population density, there was a 1% decline in the likelihood of finding an additional small grocery/convenience store for every incremental increase in population size. The portions of the study area that were uncoded and unmapped by HOLC were significant predictors in small grocery/convenience store distribution when HOLC classification was considered. The analysis found that there was a 56% decline in the likelihood of finding an additional small grocery/convenience store in census tracts uncoded by HOLC and a 58% decline in the likelihood of finding a small grocery/convenience store in unmapped census tracts compared to the A/B reference group.
Another significant finding is that for every $1000 increase in household income, there was a 3% decline in the likelihood of finding an additional pharmacy/dollar/variety store. Restaurant distribution was significantly associated with only educational attainment and population density. For every 10-percent increase in the percentage of residents with a bachelor’s or higher degree, there was a 36% increase in the likelihood of finding an additional restaurant. There was, however, a 1% decline in the likelihood of finding an additional restaurant for each incremental increase in population density.
The likelihood of finding specialty food stores declined by 2% for every $1000 increase in median household income. Social/religious/educational/community service food entities occurred less frequently as household income rose. There was also a 40% increase in the likelihood of finding an additional food outlet of this type for every 10% increase in the percentage of residents who have a bachelor’s/graduate degree. There was an 82% decline in the likelihood of finding an additional mobile food outlet in HOLC Grades C/D census tracts than in Grades A/B tracts. Even more extreme, there was a 90% decline in the likelihood of finding an additional mobile food source in uncoded census tracts than in Grades A/B tracts. There were no significant differences in distribution among farms, community gardens, and farmers’ markets or food assistance venues.
In a sensitivity analysis, median household income was replaced with the percentage of residents living below the federal poverty level in the fully adjusted models. Substituting poverty for income did not meaningfully alter the observed associations between neighborhood racial composition, HOLC classification, and food outlet availability. Model selection decisions were unchanged across specifications, and the overall pattern of results was similar. Models that included median household income generally had lower AIC values than models that included poverty. Residual Moran’s I statistics were non-significant for all poverty-based models, suggesting that spatial autocorrelation was adequately accounted for in the analyses.
The results of the multivariate analyses for the distribution of closed food venues are presented in Table A8. One predictor—population density—is significant. For every 1000 increase in the population, there is a 1% decline in the likelihood of finding an additional closed food outlet (Table A8 and Figure A2).
7.1. Interaction Effects
As a sensitivity analysis, an interaction term between neighborhood racial composition and median household income was added to the fully adjusted models. The inclusion of interaction terms did not improve model fit for most food outlet categories, and the interaction terms were not statistically significant. The only exception was specialty food store vendors, for which the interaction term was statistically significant (β = −0.007, p = 0.026) and modestly improved model fit (ΔAIC = −3.18).
7.2. Support for Hypotheses
All the hypotheses were true. The study found that in the Greater Grand Rapids area, food outlet density was highest in majority White census tracts (H1). Food outlet density was highest in the census tracts with the greatest number of college-educated residents. Neighborhoods with many college graduates also tended to have the greatest variety of food outlets (H2). High-income census tracts had the lowest level of food store closures. This was evident in formerly greenlined tracts which had substantially lower density of closed food outlets than other tracts. Formerly greenlined tracts had significantly higher household incomes than other census tracts (H3).
A similar percentage of the city was greenlined and redlined and supermarkets/large grocery stores are non-existent or rare in either type of census tract. While formerly greenlined census tracts have no supermarkets/large grocery stores, only one is found in formerly redlined tracts (H4). The study found that supermarkets/large grocery stores, dollar stores, and variety stores are often found co-mingled with each other rather than being spatially isolated in separate areas (H5).
8. Discussion
This paper reports crucial findings from a study examining how differences in food store distribution are associated with the racial/ethnic composition of census tracts, median household income, educational attainment, population density, and historic redlining. It is the first to examine the distribution of open and closed food outlets in the study area. The study yielded an important finding: despite a tendency in the scholarly literature to link neighborhood racial characteristics to the distribution of food stores, racial composition of census tracts had a significant impact on the distribution of specialty food stores, and nothing else. Another race-based variable, HOLC neighborhood classification, was significant on four occasions (the distribution of mobile food sources in two neighborhood grades, small groceries/convenience stores, and supply chain). A more consequential variable was median household income. Educational attainment was significant in four instances and population density in three.
8.1. Underlying Factors Contributing to On-Going Residential Segregation
We provide some additional context on the Greater Grand Rapids area here to help interpret the results. The study area’s long history of residential segregation impacts who lives where and how food outlets are distributed. Segregation has been achieved through several means; most notable among them were the insertion of racially restrictive covenants in private property deeds in White neighborhoods, developing and enforcing restrictive zoning ordinances, and federal redlining activities. As was the case with many of the cities redlined by HOLC, private citizens, real estate agents, housing developers, banks, and homeowners’ associations and neighborhood groups encouraged the use of racial covenants in combination with other strategies (like violence, blockbusting, and racial steering) to prevent Blacks and other POC from moving into predominantly White neighborhoods. The federal government played a big role in fostering segregation efforts. The Federal Housing Administration encouraged the use of racially restrictive covenants, and HOLC followed its guidance, mimicked its biases, and issued higher grades to neighborhoods where these instruments were in place [94,95,96]. Local groups like the Grand Rapids Real Estate Board supported federal segregation efforts because they felt black occupants lowered property values, and declining property values were bad for business. Hence, the board worked to restrict housing options for Blacks [94,95,96,97]. Despite the passage of the Fair Housing Act in 1968 that banned housing discrimination, unfair housing practices persisted and racially restrictive covenants remained in property deeds. In 2022, Michigan joined a growing number of states (including Connecticut, Maryland, Utah, and California) in passing the Discharge of Restrictive Covenants Act that effectively banned the insertion of racially restrictive covenants into property deeds. Property owners can now strike them from their property deeds [98]. Understanding these and other root causes of segregation will help devise more effective policies and actions to reduce housing discrimination, increase access to food, and facilitate local and regional sustainability efforts.
8.2. Association Between Food Outlet Types and Neighborhood Racial and Income Characteristics
Earlier food access studies conducted in Grand Rapids focused exclusively on the city. However, our study of the Greater Grand Rapids area led us to urge more researchers to compare cities and adjacent municipalities, as income dynamics, neighborhood characteristics, population density, and educational attainment vary across city, suburban, and rural locales. City–suburban comparisons will become more critical as scholars and policymakers try to understand how urbanized areas consider and incorporate food access into their food systems planning and sustainability goals. City–suburban comparisons are not yet commonplace in food access research but should be incorporated into more studies globally. Studies like the ones conducted in the metropolitan area of Antwerp, Belgium [99], Melbourne, Australia [100], and Chongqing, China [101], are beginning to close that gap in the literature. The significance of this line of inquiry to global sustainability is already recognized by the United Nations [1].
We examined 57 types of food venues in our study. Our work contributes to the growing trend towards expanding the number and types of food outlets examined in this research genre. There is evidence of other food access scholars expanding the range of food outlets studied. For example, a Belo Horizonte (Brazil) study examined 16 types of food outlets [68], as did a New Zealand study [54]. A Montpellier (France) study examined 11 food outlet types [102], and the Chongqing (China) study examined seven [101]. This trend will enhance our global understanding of food accessibility. Our project leads the way by studying one of the most extensive groups of food outlets.
As is evident from the foregoing literature review and discussion, food access researchers focus heavily on the relationship between neighborhood racial characteristics and food outlet distribution. Less attention is paid to social class, educational attainment, and population density. Our study demonstrates that these latter variables are associated with food outlet distribution and, depending on the study area, can be more robust predictors of food venue distribution than race. For instance, a Chicago (Illinois) study found that residents with the highest food insecurity were found in zip codes with the lowest median income [103]. Another study of large and small food outlets in urban and suburban Flint found that both race and income were significant predictors of food store distribution. The study found that food availability declined as the percentage of Blacks in the census tracts increased, but food availability expanded significantly as median household income rose [16].
Researchers examining food outlet distribution in Seattle, Washington, also provide some support for our claims about the salience of household income. They found that the effect of income varies by which POC group (Hispanic/Latinx, Black, or Asian) is being studied. There were no significant differences among low- and middle-income Blacks vis-à-vis travel distance to full-service grocery stores. However, high-income Hispanics/Latinx residents had shorter travel distance to large grocery stores than their low-income counterparts. The reverse was true for Asians—high-income Asians had longer travel distance to large grocery stores than low-income Asians. The study also found that the greater the educational attainment of neighborhood residents, the shorter the travel distance to large grocery stores [104].
We urge researchers to assess the impacts of race/ethnicity, household income, and other economic variables simultaneously in food access research. Other scholars are adopting this approach [105]. Household income and educational attainment play such vital roles in food access because income dictates purchasing power, affordability, and the ability to travel to obtain food. Moreover, as income rises, U.S. households spend more on food [106]. Educational attainment is also an important explanatory factor as it influences knowledge of food and where to obtain it.
The study area’s food outlet distribution aligns with some of the overarching patterns observed elsewhere. For instance, we found that restaurants dominate the food environment, a finding that others report [57,72]. Our study also corroborates an earlier finding that fast-food restaurants are more common in lower-middle and middle-income census tracts than in the highest-income ones. Moreover, researchers also found that full-service and fast-food restaurant availability was lower in predominantly Black neighborhoods than in predominantly White neighborhoods [72]. However, arguments that neighborhood racial characteristics interact with income to influence the distribution of supermarkets, small grocery stores, convenience stores, and other food outlets should be more thoroughly interrogated. Past research, like a Flint study, suggests a Race × Income effect, but these differences are significant only in bivariate models, not in multivariate models [18]. In our study, the Race × Income interaction effects were not significant in the multivariate models.
Our results partly corroborate food access studies conducted elsewhere that find that supermarkets/large grocery stores and specialty stores are most likely found in census tracts with low and moderate percentages of POC [57,71]. Thus, our findings also lend some support to claims made elsewhere that high-percentage POC neighborhoods are underserved by supermarkets/large grocery stores [12,13,14,26,57,61,64].
Our findings also align with studies showing that the number of supermarkets/large grocery stores peaks in middle-class neighborhoods, not in the wealthiest ones [57,70]. East Grand Rapids, the wealthiest and Whitest town in our study area, had only one supermarket/large grocery store. However, the other suburbs had higher densities of supermarkets/large grocery stores than East Grand Rapids. Research examining 10 food outlet types in Jackson (Mississippi), Forsyth County (North Carolina), Washington County (Maryland), and suburban Minneapolis (Minnesota) found that supermarkets were over three times as likely to be in the lowest-wealth neighborhoods as in wealthier ones. Medium-wealth neighborhoods had the highest prevalence of convenience stores with gas stations of any neighborhood type [57].
The results were not as clear-cut in a national study of New Zealand’s food retailers, which found that access to food establishments was significantly higher in high-deprivation areas than in low-deprivation ones and that the former had greater access to fast-food and takeout restaurants, convenience stores, supermarkets, and vegetable stores [54]. A national study of predictors of food insecurity in England found that race/ethnicity (Asian/Asian British and African/African British) and household income as well as sex, age, household size, presence of children in the household, employment status, urban/rural status, and multiple deprivations were predictors of increased food insecurity risk [107]. Yet another United Kingdom study of food insecurity found that the most reliable predictors of food bank usage were employment status and income [108].
We found that HPOC tracts also had the lowest restaurant densities. Though researchers report that predominantly POC communities are inundated with fast-food restaurants [55,56], our findings are more aligned with those from a national study reporting that zip codes with a high percentage of low-income POC had fewer full-service and fast-food restaurants than other zip codes [72]. Though scholars find numerous pharmacies/dollar/variety stores in census tracts and neighborhoods with a high percentage of POC [61,64], our study area deviated from this pattern as our HPOC tracts have the lowest density of pharmacies/dollar stores/variety stores. HPOC tracts also had the lowest densities of farms/community gardens/farmers’ markets, and social/religious/educational/community services food venues.
Though the Kent County and Grand Rapids sustainability plans identify the need to increase opportunities for POC to grow and produce food, our study found that HPOC tracts have fewer urban farms, community gardens, and farmers’ markets than census tracts in areas with a low percentage of POC. This suggests that though the county and city have identified barriers to growing and producing food in HPOC neighborhoods, they must do more to address inequities if they are to achieve their sustainability goals. Efforts should also be made to connect the county’s and city’s sustainability plans with corporate sustainability efforts. For instance, Square Roots, which runs Gordon’s Food Service’s container farming facility in suburban Wyoming, has a Next-Gen Farmer Training Program. However, the one-year program admits people from across the country. It is unclear how many Grand Rapids area residents are in the program. Square Roots also makes food donations to area food pantries [47,48,49]. However, greater efforts could be made to connect corporate sustainability efforts with local needs (like creating farming opportunities for more POC and low-income residents) and sustainability goals.
Though supermarkets carry large volumes of food, researchers should not focus exclusively on them as they comprise about 5% or less of the food landscape in Grand Rapids, Detroit [12], Lansing [69], Flint [89], Saginaw [70], and the Hartford area [67]. Small grocery and convenience stores are far more plentiful in the study area. Although small groceries and convenience stores offer limited food selections, they are among the most accessible options in some neighborhoods. China is an example of a country where small vendors in wet markets (traditional or open-air markets) play a crucial role in the overall food system and in food access for low-income communities. China has over 40,000 wet markets, accounting for 56% of the fresh food retail sales in 2020. Nanjing’s eight million-plus residents use 351 wet markets and 63 supermarkets to obtain food [109,110,111]. Wet/traditional/open-air markets serve similar functions in Hong Kong [112] and Singapore [113].
Though it has been reported elsewhere that liquor and convenience stores are the most common food outlets in Grand Rapids [114], we found that restaurants were the most common food source in the city. The Mississippi/North Carolin/Maryland/Minnesota study had a similar finding. It also found that fast-food restaurants were more prevalent in medium-wealth neighborhoods than in the wealthiest neighborhoods. All food outlets, except bars and taverns, were less prevalent in predominantly Black neighborhoods than in predominantly White and racially mixed neighborhoods [57]. Unlike Saginaw or Flint, where fast-food restaurants outnumber full-service restaurants [70,89], the Greater Grand Rapids study area has more of the latter. Full-service restaurants were also more commonplace than fast-food restaurants in Detroit [12] and in the Mississippi/North Carolina/Maryland/Minnesota study [57].
Examining an interaction between neighborhood racial composition and median household income provided little evidence of effect modification. For most food outlet categories, interaction terms did not improve model fit and were not statistically significant. These findings suggest that associations between census tract racial composition and food outlet availability were largely consistent across neighborhood income levels. Although a significant interaction was observed with specialty food stores, this finding was not replicated across other outlet categories and should be interpreted cautiously.
Replacing median household income with neighborhood poverty in the multivariate models did not meaningfully change the study findings. Similar patterns were observed for neighborhood racial composition, HOLC classification, and food outlet availability, suggesting that the results were not dependent on which socioeconomic measure was used in the models.
8.3. Intermingling of Food Store Types and Redlining
A study of 27 U.S. metropolitan areas found that census tracts that were predominantly Black or Latinx/Hispanic were associated with shorter distances to dollar stores and greater distances to supermarkets and other stores than predominantly White neighborhoods. As the neighborhood poverty rate increased, the distance to dollar stores decreased. The researchers argue that dollar stores replace supermarkets and small grocery stores in neighborhoods [61]. Our study found that supermarkets and large grocery stores were intermingled with small groceries/corner stores, minimarts, dollar/variety stores, and fast-food restaurants. Supermarkets/large grocery stores were not typically found in isolated locations; they were interspersed with other kinds of food outlets that scholars claim displace them [54,55,56,82,115]. Supermarkets are also interspersed with small groceries and corner stores, dollar/variety stores, and fast-food outlets in Detroit, Lansing, Saginaw, and Flint [12,69,70,89].
Formerly greenlined census tracts are almost devoid of food outlets. Once-redlined census tracts have more food outlets, but not as many as the remaining HOLC classifications. This distribution partly conforms to the predictions of the supermarket redlining thesis [26,35,39,55,56,57,58,116]. In other words, formerly redlined census tracts have fewer supermarkets/large grocery stores than formerly bluelined and yellowlined tracts. While the focus has been on the red- and green-coded areas, researchers should be looking at the distribution of food outlets in the blue- and yellowlined tracts also. Our study area also shows that a substantial number of supermarkets/large grocery stores are in commercial/industrial tracts as well as the unmapped and uncoded portions of the study area. This is a novel finding. In the Greater Grand Rapids area, the unmapped areas are the small suburbs and townships that encircle the main city. This finding leads us to suggest that researchers who focus exclusively on greenlined and redlined census tracts miss essential dimensions of food outlet distribution. The assumption that retailers are choosing to locate food outlets only in formerly redlined or greenlined areas is too simplistic to account for contemporary food venue distribution. Some researchers, recognizing the significance of all the HOLC neighborhood grades, are also studying how each impacts food access in national studies [58,66].
The long-term impacts of redlining are still evident in the Greater Grand Rapids area and other redlined cities, making it more challenging to achieve sustainability goals. The rigid segregation, denial of loans for home purchases or improvement, and disinvestment in Black neighborhoods [77,94] are associated with limited food access in many ways. Supermarket and large grocery store chains do not typically locate their stores in areas with inadequate infrastructure and where residents do not have access to funds to renovate their property or build new structures. So, in addition to ensuring that those living in formerly redlined neighborhoods have access to large food retailers and public transportation, the sustainability plan must include access to land and resources for growing, processing, and selling food.
Understanding the impacts of redlining and similar practices is also relevant in the international context. For instance, though Canada did not have an official redlining policy, it has examples of rigid residential segregation in places like Africville in Halifax and Hogan’s Alley in Vancouver that are worth incorporating into food access research [117]. The United Kingdom also has a long history of residential segregation that bears similarities to redlining. Such policies concentrated Caribbean, South Asian, and African residents into dilapidated sections of cities like London and Birmingham [118].
8.4. Closures and Vanishing Food Infrastructure
Food store closures and vanishing food infrastructures are important because closures can significantly reorganize the foodscape and the larger environment. Vanishing food infrastructures can also have a significant impact on customer behavior and consumption patterns. Food store closures were unevenly distributed across our study area. Less than 5% of the food outlets identified in Grand Rapids were closed, but almost a fourth of those in suburban Wyoming were. Though the racial composition of the census tract was not significant in multivariate models, predominantly White census tracts had the highest percentage of closed food outlets, and predominantly POC tracts had the lowest. This is the case because LPOC tracts in the south suburbs had a larger number of closed food outlets than other census tracts. Few closed food outlets were found in formerly greenlined and redlined census tracts; most were in the uncoded tracts. Many supermarkets and large grocery stores have closed, which is concerning. Small grocery and convenience stores were on a firmer footing. Small grocery/convenience store closures were more common in Flint [14] and Detroit [12] than in the Greater Grand Rapids area.
We believe that food stores are more vulnerable to closure if they cannot generate adequate sales volume or do not have a sufficient and reliable customer base. Research conducted elsewhere supports these claims. A four-city (Birmingham, Alabama; Chicago, Illinois; Minneapolis, Minnesota; and San Francisco, California) study of food outlet closures found that the strongest predictor of whether food stores remained operational was sales volume. The study found that food stores in high-poverty, predominantly POC census tracts were more susceptible to closure than those in high-income, predominantly White tracts [119].
Studies have also examined the spatial dynamics of what happens when stores close. A national study of food store closures found that when grocery stores closed, this led to increased traffic to nearby fast-food outlets and convenience stores. This pattern was most evident among low-income customers. The study also found that food store closures created service gaps in the foodscape that drove consumers to non-competing food retailers. Hence the closure of dollar stores resulted in increased customer traffic at convenience stores; however, the customer traffic at grocery stores did not increase [120]. These results could help to explain our findings that more supermarkets/large grocery stores closed in our study area than small groceries and convenience stores. Maybe, the closure of large stores resulted in increased customer traffic and sales in small stores, thereby increasing the sales volume, generating new customers, making existing customers more reliant on the small groceries/convenience stores, thereby making the small stores more viable.
Scholars have also studied the closure of inner-city grocery stores built with the express purpose of enhancing access to fresh, healthy, and affordable foods. The researchers found that such stores closed because of low sales volume, lack of experience running a grocery store, poor marketing, and a failure to attract and retain a high volume of customers from the local area [121]. Policymakers, local food advocates, and researchers need to track what happens to customers of such grocery stores. To date, there are no studies that track where such customers obtain their food. There is cause for concern if the customers of such defunct grocery stores must rely on food outlets that sell limited amounts of fresh, healthy, and affordable foods.
Emergency food assistance is vanishing in the Greater Grand Rapids area as the sector undergoes a post-COVID shrinkage [122]. Our study found that most of the food assistance venues were in predominantly White, middle-income census tracts in the suburbs. These were areas unmapped by HOLC. This is disquieting as food assistance organizations play a vital role in helping low-income residents acquire food. Moreover, Kent County and Grand Rapids are increasing access to charitable food assistance as part of their sustainability plans, yet neither plan acknowledges the dramatic decline in emergency food assistance. Local plans do not acknowledge that there are more food pantries and soup kitchens in LPOC than in HPOC census tracts. Neither the city’s nor the county’s sustainability plans contain specifics on how to rebuild the emergency food assistance infrastructure—particularly in low-income, POC communities—to meet the demand for healthy and affordable food.
This study will prompt more researchers to examine food outlet closures. Already, researchers have studied food store closures in ethnic Chinese neighborhoods in New York City [73]. Scholars have also examined food store closures in rural areas [71,72]. Studies have also been conducted in China to examine the closure of small food outlets in Hangzhou, China. The study found a high rate of food store closure during the COVID-19 pandemic and immediate post-pandemic period (2019–2024). It found that food venues selling healthy foods were more likely to close than those selling unhealthy foods. Small food stores were less likely to close in areas that had high supermarket density. Small food stores selling unhealthy foods were less likely to close in areas where the overall density of small food retailers was high [123]. Researchers have also studied what factors contribute to closures of food and beverage businesses in Seoul, South Korea. They found that aesthetics matter; that is, venues that were physically attractive (displaying openness and visual appeal) survived longer than those that were unattractive. Food and beverage venues that were near cultural facilities and open space had a lower closure risk [124].
The results from China and South Korea are applicable to our findings. We believe that some of the food outlet closures we found were attributable to the COVID-19 pandemic. For instance, during the pandemic, the number of food assistance programs in the Grand Rapids area expanded to meet the demand for emergency assistance. Some of these outlets closed post pandemic. We also think that the presence or absence of cultural facilities could be a factor in food outlet closures. We note that downtown Grand Rapids, which has a major university, museums, art galleries, medical centers, numerous businesses, gentrified restaurants and shopping areas, sports facilities, hotels, waterfront access, and robust marketing/branding, did not have as many food venue closures as the suburbs that had fewer cultural attractions or amenities that draw visitors, entice them to purchase food, and drive customer traffic.
Researchers are also studying other parts of Asia where they are examining the opening and closing of supermarkets/large grocery stores and wet/traditional/open-air markets in China [76], Hong Kong [112], and Singapore [113]. Despite closures of wet/traditional/open-air markets in China, there are many more of them than supermarkets/large grocery stores [99]. The opposite is true for Hong Kong and Singapore, where wet/traditional/open-air markets are vanishing while supermarkets/large grocery stores are increasing rapidly [112,113].
As our research also shows, it is important to study buffers around cities or metropolitan areas to examine how food outlets on the outskirts of cities are arrayed. Since urbanites use food outlets in the buffer zone, it is appropriate to incorporate them in food access studies. A study of eight South Carolina counties used an 8 km buffer to determine the distances that residents are comfortable traveling to obtain food [123]. Depending on the configuration of the cities, food access researchers use buffers ranging from 4 to 16 km to account for the edge effect [13,85,125,126,127,128,129,130].
Our study has global implications as interest in the topic grows. Researchers in countries such as Canada [131,132,133], the United Kingdom [134,135,136,137,138,139,140], France [141], Italy [142,143,144], Belgium [99], Australia [100,145,146], New Zealand [54,147], China [101,109,110,111,123], South Korea [148], Japan [149], Mexico [150], and Brazil [68,151] examine food access through the lens of food outlet use and distribution.
9. Limitations
Our study has some limitations. We report data collected during a single period. Studies could be more impactful if they track and analyze data annually. Longitudinal studies could be beneficial to study shopping behavior, individual and community food needs, and changes in the food landscape. We did not examine the content of food stores, pricing at various venues, the capacity of food outlets to enhance the sale of healthy and affordable food options, travel distances to obtain food, or the type of foods consumers purchased and consumed. The study did not investigate the factors contributing to store closures or whether these closures were permanent or temporary. Moreover, once stores close, are they replaced by non-food establishments? Another limitation relates to how HOLC classifications were assigned to census tracts. Some census tracts overlapped with more than one HOLC grade, but each tract was assigned to the grade covering the largest share of its area for the regression analyses. As a result, historical variation within some tracts may not be fully reflected in the classification used for modeling.
We had census tract fragments on the edge of our study area. We used proportional allocation to calculate the population in those fragments. Though the method allows researchers to calculate population sizes for partial census tracts, it has a downside in that the method assumes an evenly dispersed population. Because the population may not be evenly dispersed, the technique could introduce bias.
Our study focused on one urban area. This study could be expanded to conduct assessments at regional and national scales. The study did not examine poverty rates because poverty is highly correlated with household income. However, future studies could be designed to examine this variable. Other covariates in studies like ours could include homeownership rates versus rental rates, the presence of children in the household, the unemployment rate, the percentage of residents receiving food assistance, and access to private transportation.
10. Implications and Conclusions
Our results have several key implications. By itself, race does not account for food store distribution effectively. Studies of this nature should analyze other independent variables such as income, educational attainment, and population density to see how the predictors perform in multivariate models. In a study area like Grand Rapids where race is not the most salient factor in food outlet distribution, food activists, policymakers, city government, and scholars should identify and devise programs to assist under-resourced low-income areas that lack food outlets selling healthy and affordable foods.
Median household income is a more reliable predictor of food outlet distribution than race. This suggests that programs should be developed to help low-income residents gain access to food (through more food outlets, transportation, engagement in growing and producing food). The study area’s food assistance programs were primarily in the suburbs, yet the sustainability plans did not account for this. More effort should be put into understanding how food assistance can expand to meet the needs of the population.
HOLC classification does help to explain food outlet distribution, but to maximize the utility of the variable, the full range of HOLC redlining classification matters and can enhance our understanding of the long-term impacts being examined. Studying all the HOLC categories of redlining will provide a fuller picture of impacts and future policy directions. Three overlooked categories—industrial, commercial, and uncoded—play important roles in food outlet distribution and these should be accounted for in analyses of redlining. If the study area has an unmapped buffer, this should also be included in the analysis as it impacts where food outlets are located and overall food access.
A vanishing food infrastructure is evident in Greater Grand Rapids. This little-studied phenomenon should be on the radar of planners, sustainability managers, and activists. Food store closures should be monitored and customer behavior tracked to see if some residents are left without healthy, affordable food options. Food outlet closures should also be tracked to identify the factors that render food outlets (especially supermarkets/large grocery stores and restaurants) vulnerable to insolvency.
Corporate sustainability efforts are not well connected to city and county sustainability goals. The cities could negotiate with Square Roots to provide training and other resources to residents wanting to farm or develop incubator businesses on how to grow food in indoor spaces (like defunct factories, closed restaurants, supermarkets, and corner stores). Repurposing closed food outlets could help to reduce food inaccessibility.
The Grand Rapids study has global implications. Our study provides a model for understanding the impacts of segregationist practices on food access. We also assessed how food access is related to sustainability goals and initiatives. We suggest that sustainability leaders be more vigilant in identifying areas of low food access, understanding the root causes of the phenomenon, and devising more effective strategies to combat inequitable access. It will be challenging to meet sustainability goals without tackling food access and food security fully.
This timely study presents results that corroborate but also deviate from other findings about supermarket redlining and food access for POC. We also urge researchers to undertake multi-city comparisons. We also suggest expanding the categories and types of food outlets studied. Our study showed that the factors that significantly impacted the distribution of each type of food outlet were different for each. Though the study area is thriving, food access is inequitable. Researchers often overlook the differences in food store access between urban and suburban POC. Our findings suggest that this nuance is worth further investigation. To enhance our understanding of food access, we should examine which food stores are open and which are closed.
Author Contributions
Conceptualization: D.E.T. conceived the study. Methodology: D.E.T., I.O. and A.B. devised and executed the methodology. Data Collection and Cleaning: I.O., A.B., K.Q., D.T., H.R., S.S. and L.F. collected and cleaned the data. Investigation: D.E.T., I.O. and A.B. made the figures from the data. Funding: D.E.T. obtained funding support for the project. Writing: D.E.T. wrote an initial and final version of the manuscript. I.O. wrote an initial draft of the literature review and results sections. A.B. wrote an initial draft of portions of the methodology and results. D.E.T. wrote the final version of the manuscript, edited it, and completed the revisions. All authors have read and agreed to the published version of the manuscript.
Funding
Funding support for this work was received from the C. S. Mott Foundation, National Philanthropic Trust, Freedom Together Foundation, and the Generation Foundation.
Institutional Review Board Statement
Not applicable.
Informed Consent Statement
Not applicable.
Data Availability Statement
The data that support the findings of this study are available from Data Axle, but restrictions apply to the availability of these data, which were used under license for the current study, and so are not publicly available. Data are, however, available from the authors upon reasonable request and with permission of Data Axle. Our analyses were conducted in SPSS 29, which required no specialized codes. Our maps were created in ArcGIS Pro 3.4.0 and required no specialized code. R codes were created to run multiple regressions and are available upon request.
Conflicts of Interest
The authors declare no conflict of interest.
Abbreviations
| AIC | Akaike Information Criterion |
| ACS | American Community Survey |
| BIC | Bayesian Information Criterion |
| CAAP | Climate Action Adaptation Plan |
| CFC | Community Food Club |
| CI | Confidence Interval |
| FIPS | Federal Information Processing Standards |
| FPU | Food Production Unit |
| HOLC | Home Owners’ Loan Corporation |
| HPOC | High People of Color |
| HSCF | Hydroponic Shipping Container Farm |
| IRR | Incidence Rate Ratios |
| LPOC | Low People of Color |
| MPOC | Moderate People of Color |
| NAD | North American Datum |
| p | p Value |
| POC | People of Color |
| SDGs | Sustainable Development Goals |
| SIC | Standard Industrial Classification |
| VIF | Variance Inflation Factor |
| YMCA | Young Men’s Christian Association |
Appendix A
Table A1.
Number of Residents, Food Outlet Types, and Racial Composition of Census Tracts in Greater Grand Rapids Area.
Figure A1.
Maps showing the spatial distribution of food outlets in Greater Grand Rapids. The red line depicts the border of the city of Grand Rapids. (a) Map showing supermarkets and large grocery stores, supercenters, and wholesale clubs. (b) Map depicting small grocery stores, minimarts, convenience stores, liquor stores selling food, and gas stations that sell food. (c) Map displaying pharmacies that sell food, dollar stores, and variety stores. (d) Map displaying full-service restaurants, fast-food restaurants, takeout restaurants, coffee shops, and other kinds of food services. (e) Map featuring farms, community gardens, farmers’ markets, and produce vendors. (f) Map showing food assistance venues. (g) Map showing food trucks and other mobile food sources. (h) Map of specialty food stores and vendors. (i) Map showing social, religious, educational, and community services. (j) Map showing gyms and health centers. (k) Map showing supply chain outlets—distributors, manufacturers, warehouses. Only the most commonly analyzed categories of food outlets, or those with counts of ten or more, are displayed in the maps. The figure lacks maps for attractions and amusement parks, and e-commerce food outlets. Data for all the food outlet categories is included in Table A1.
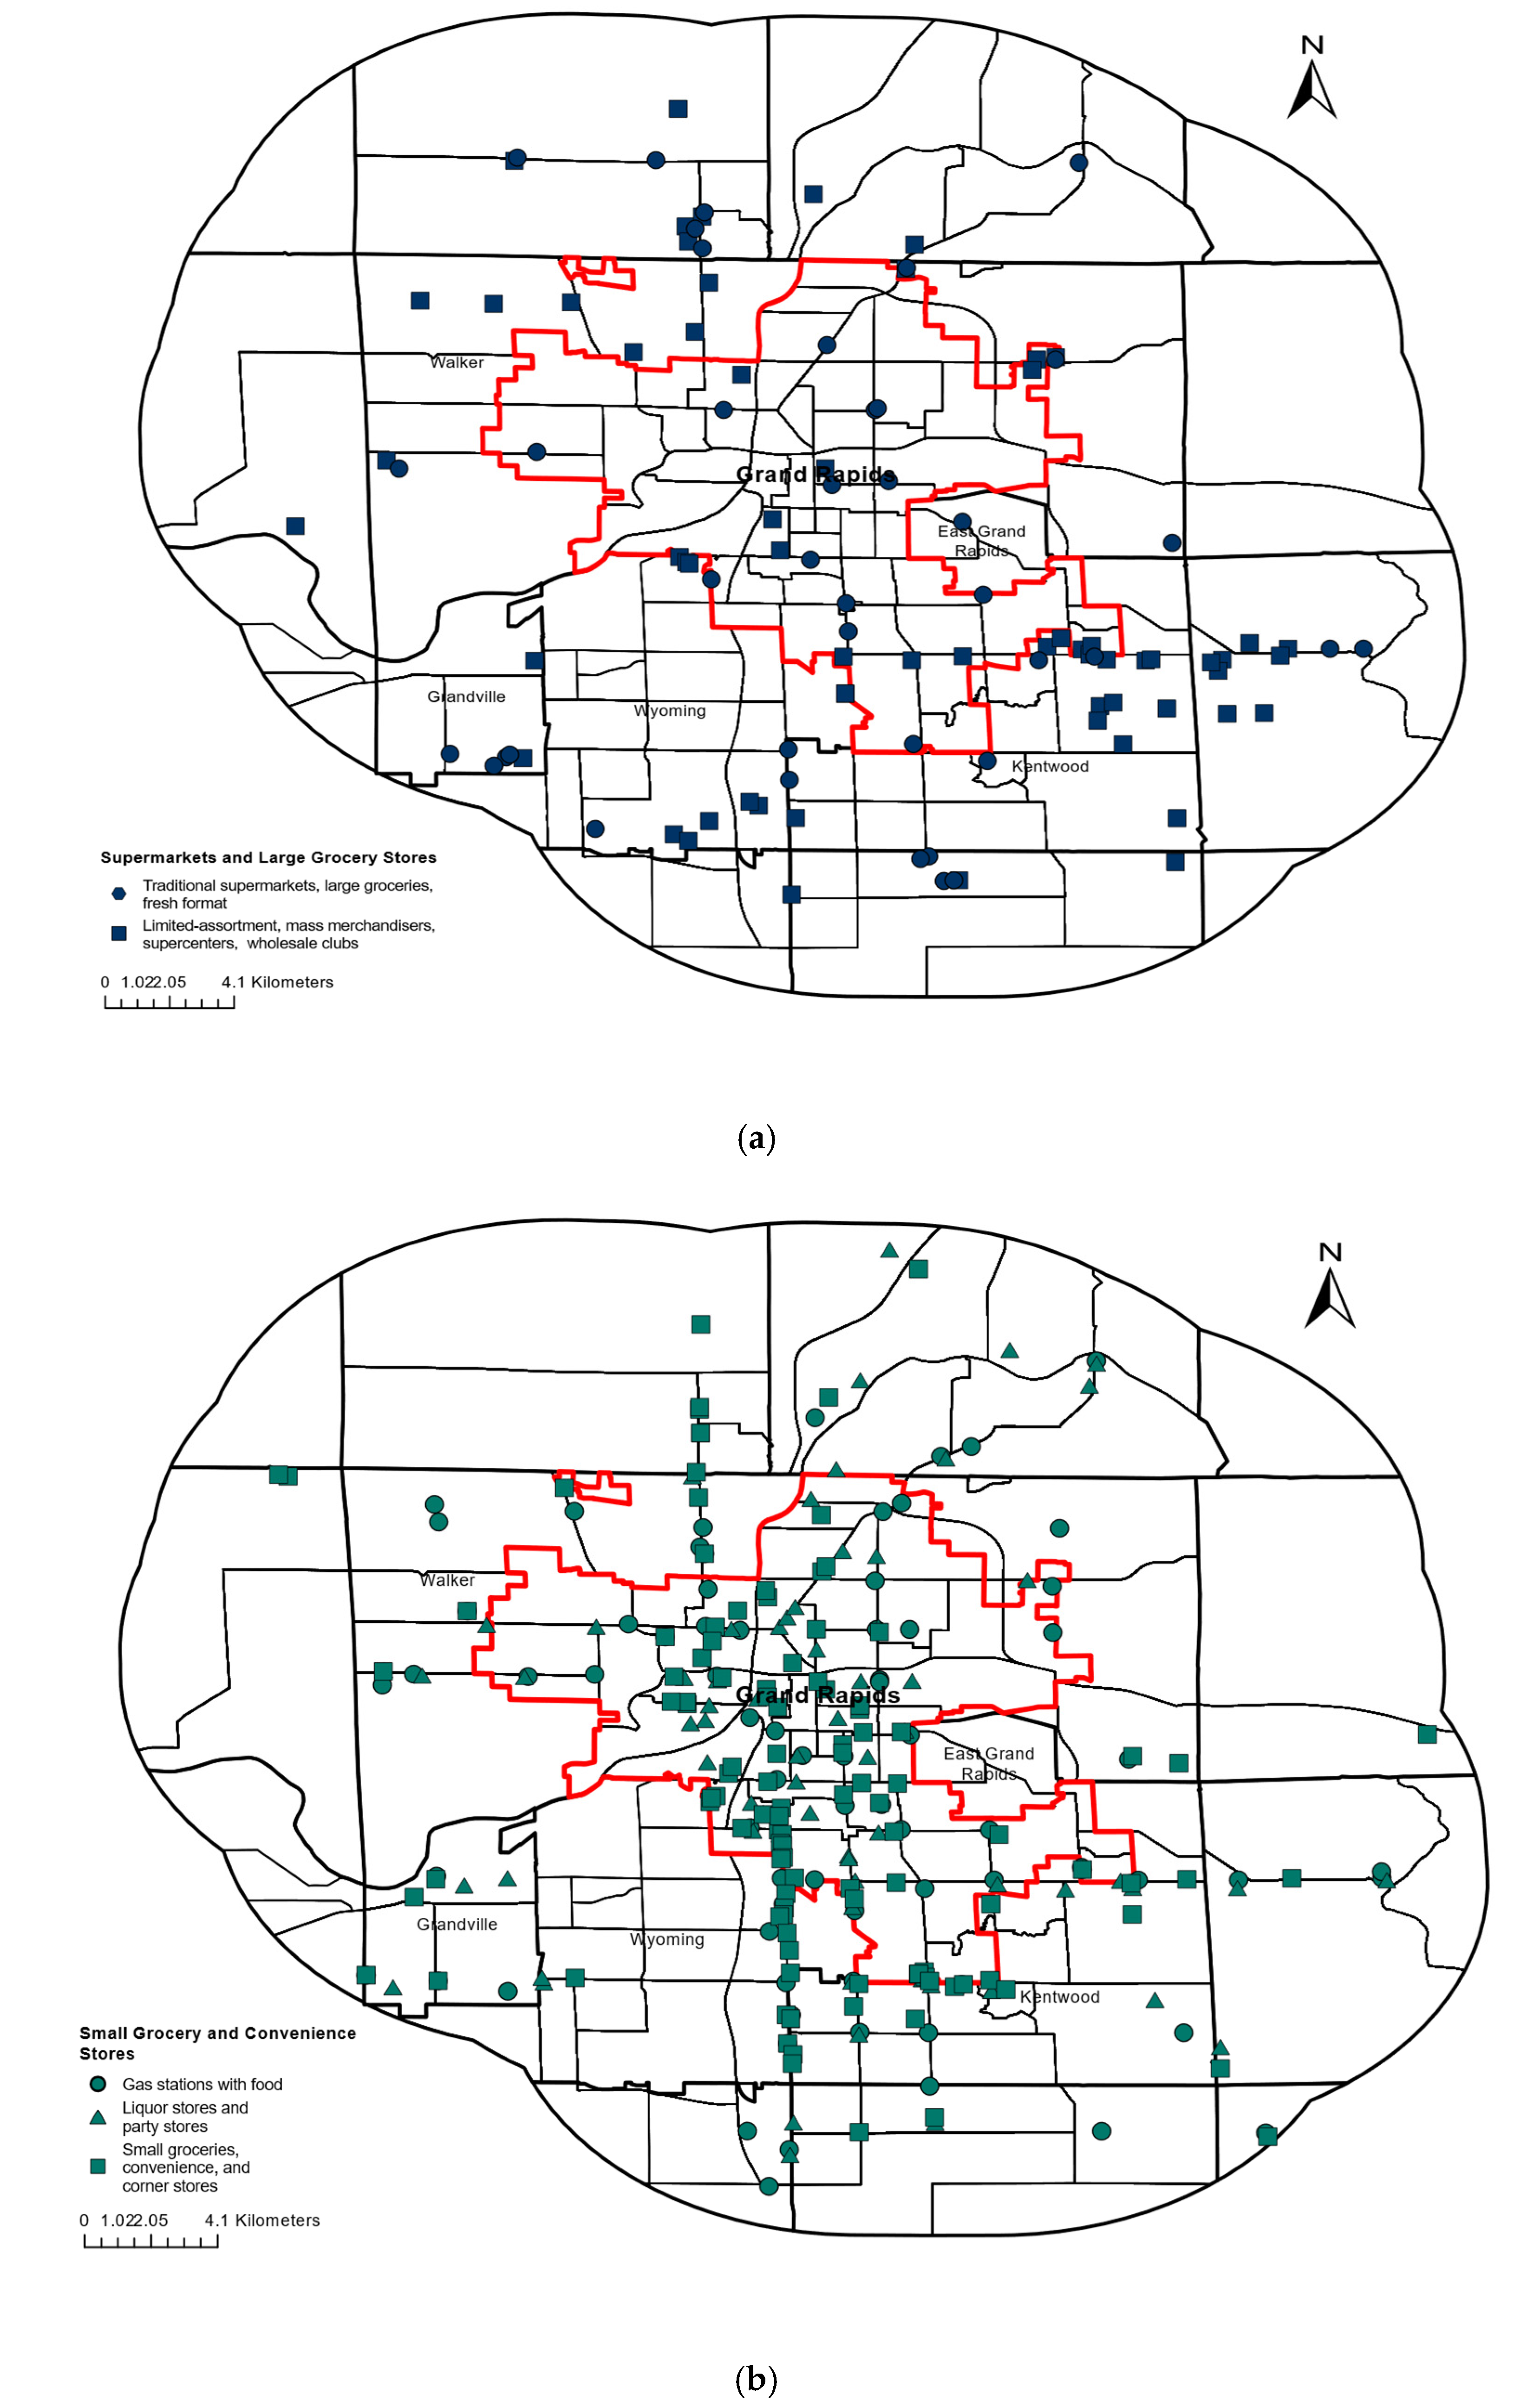
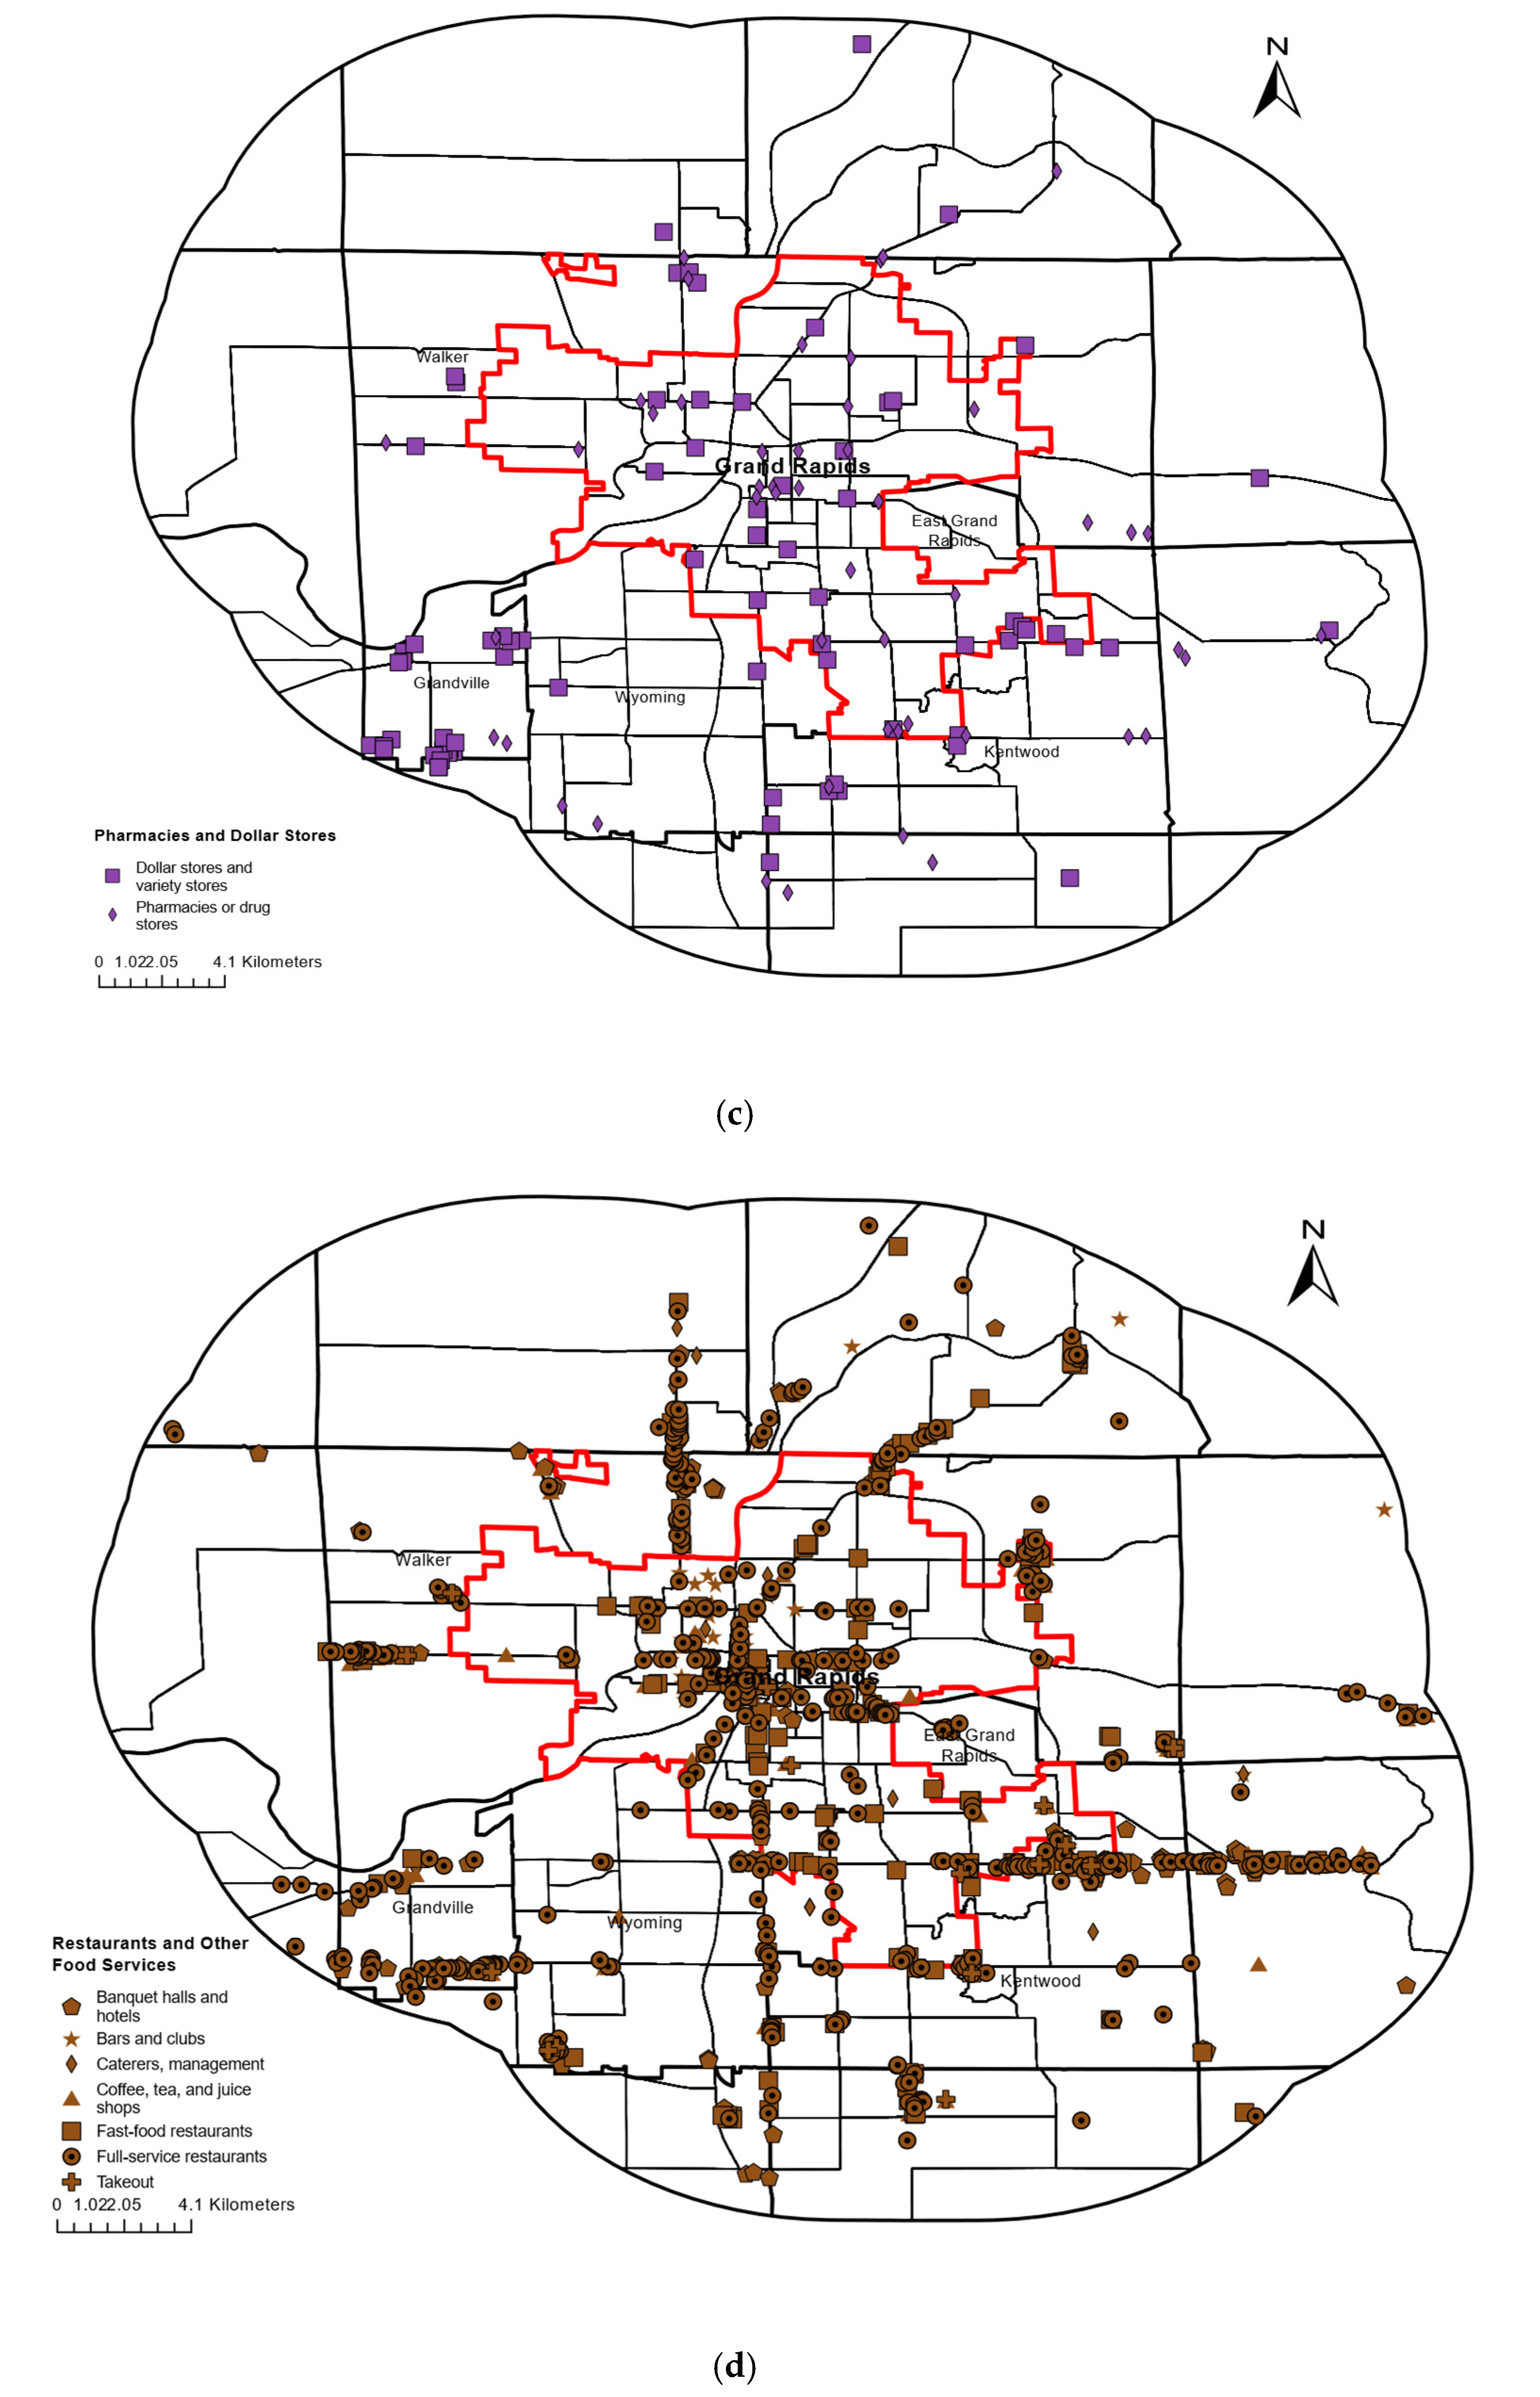
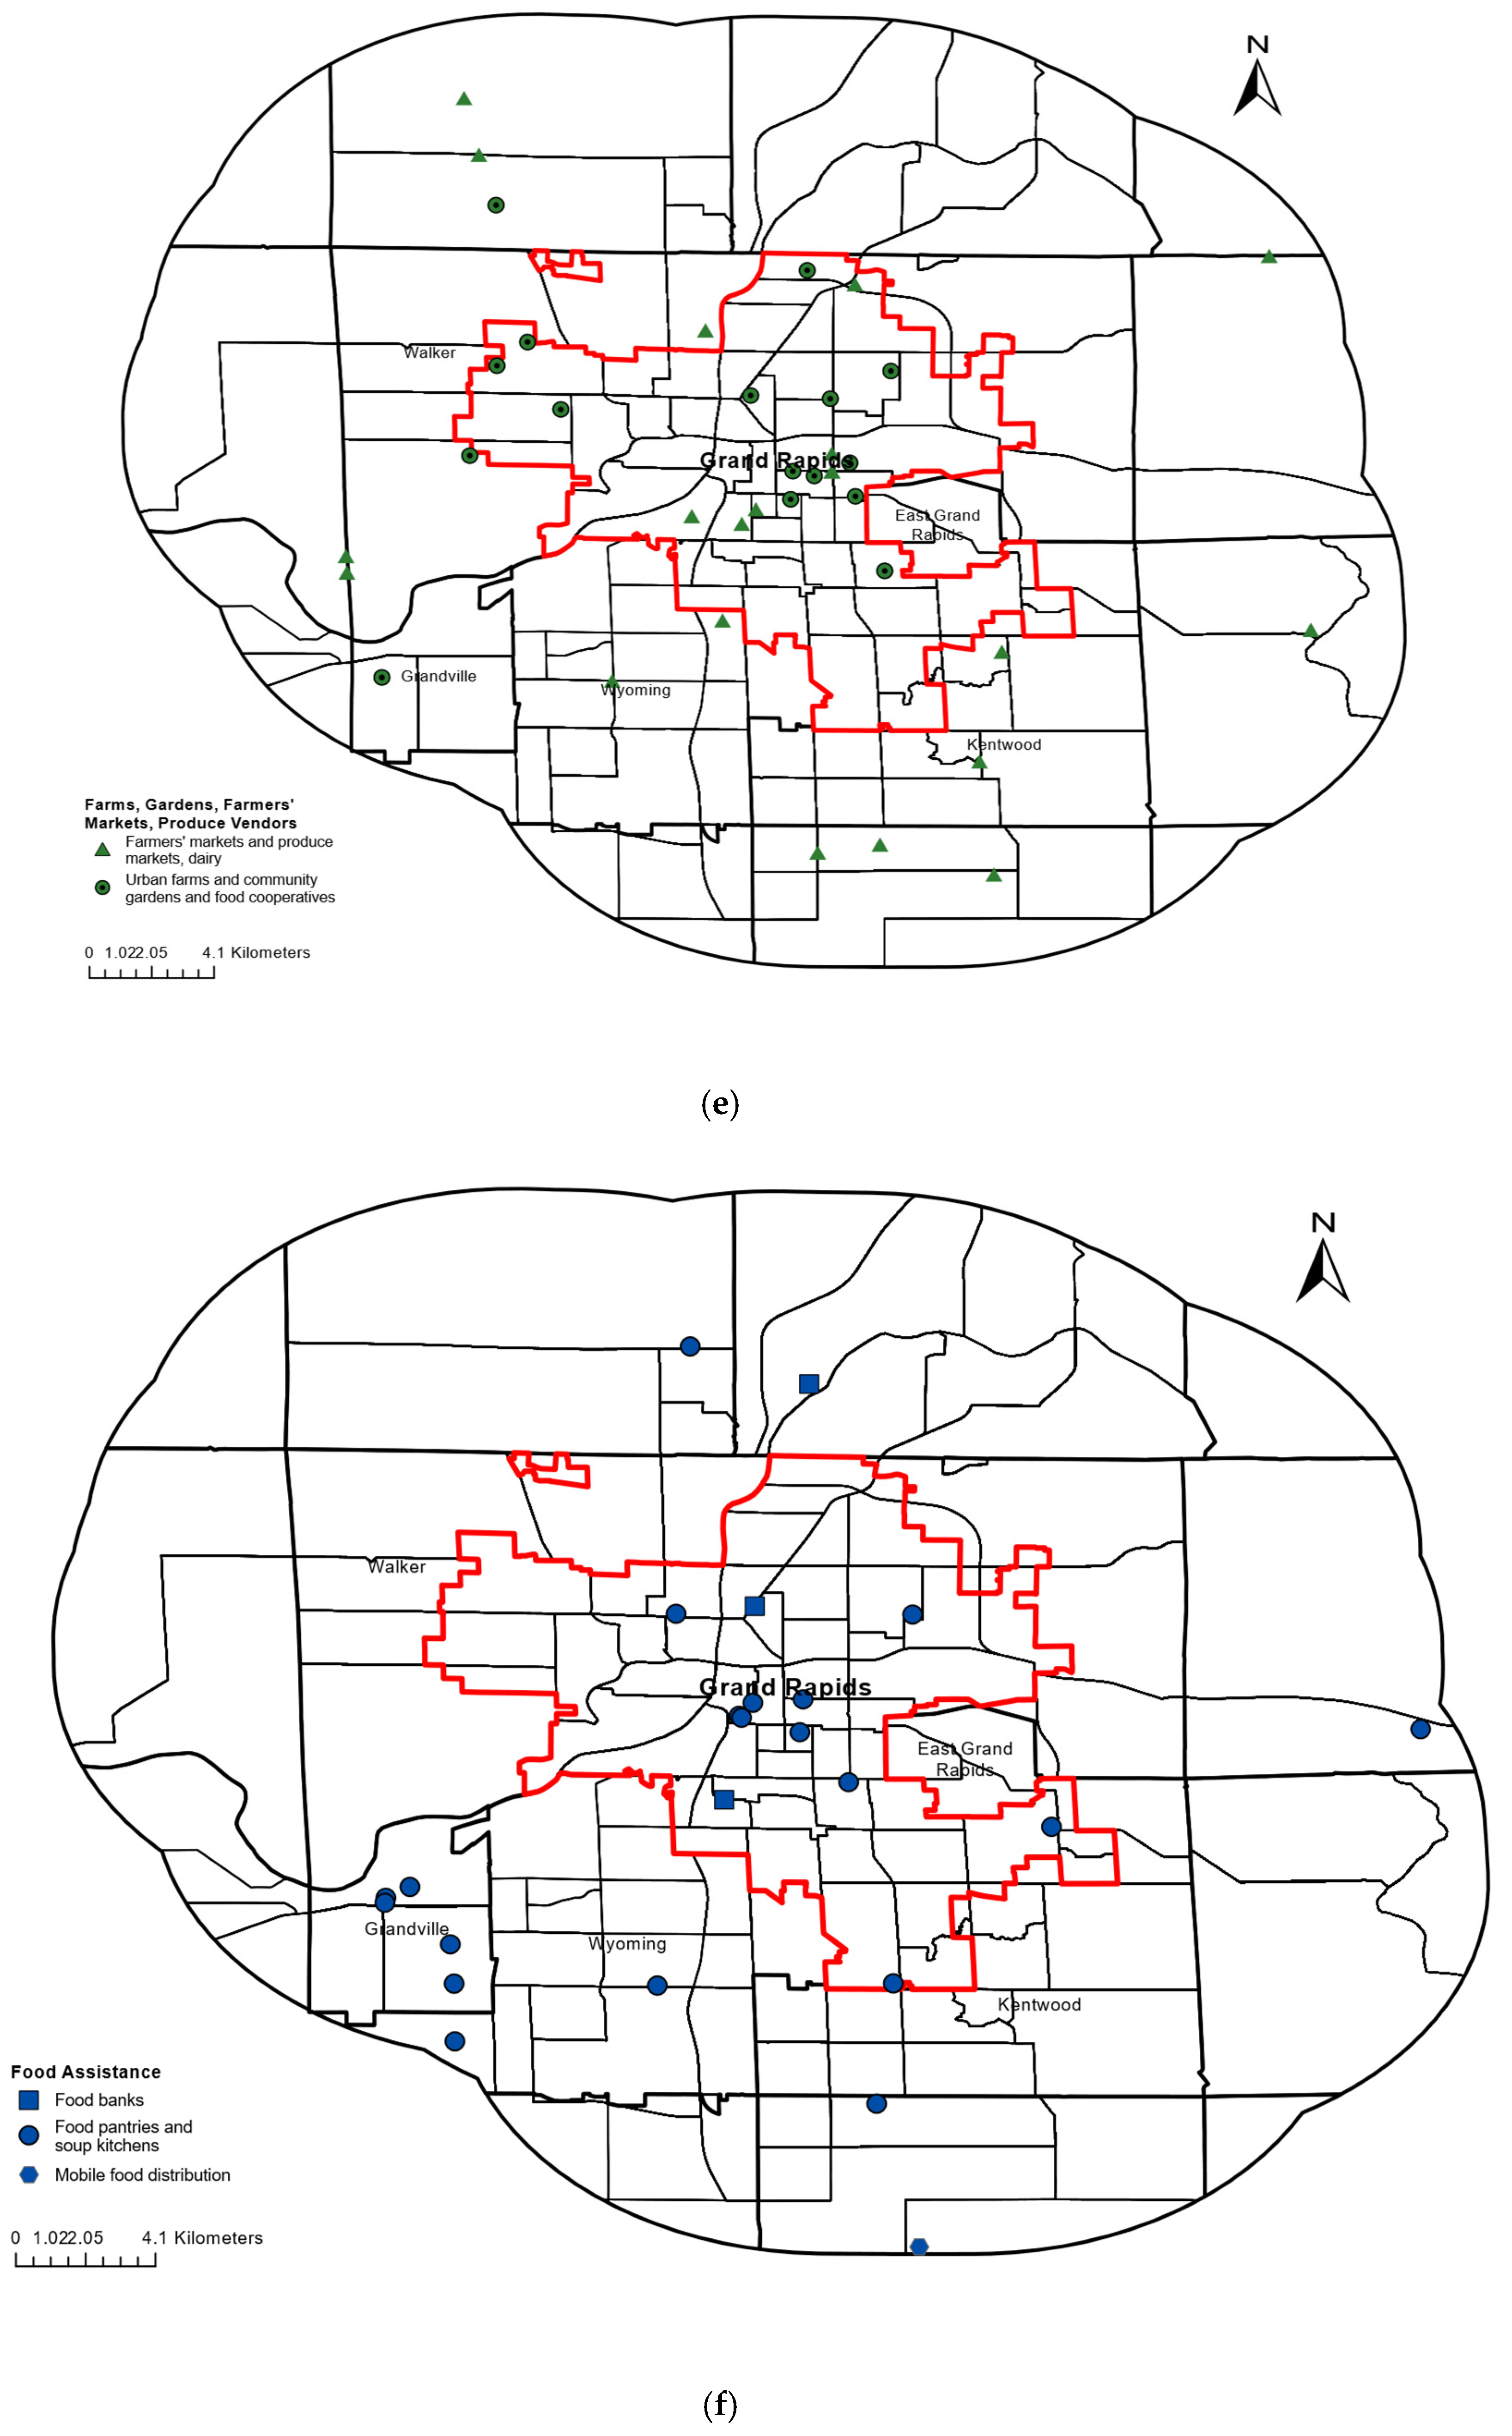
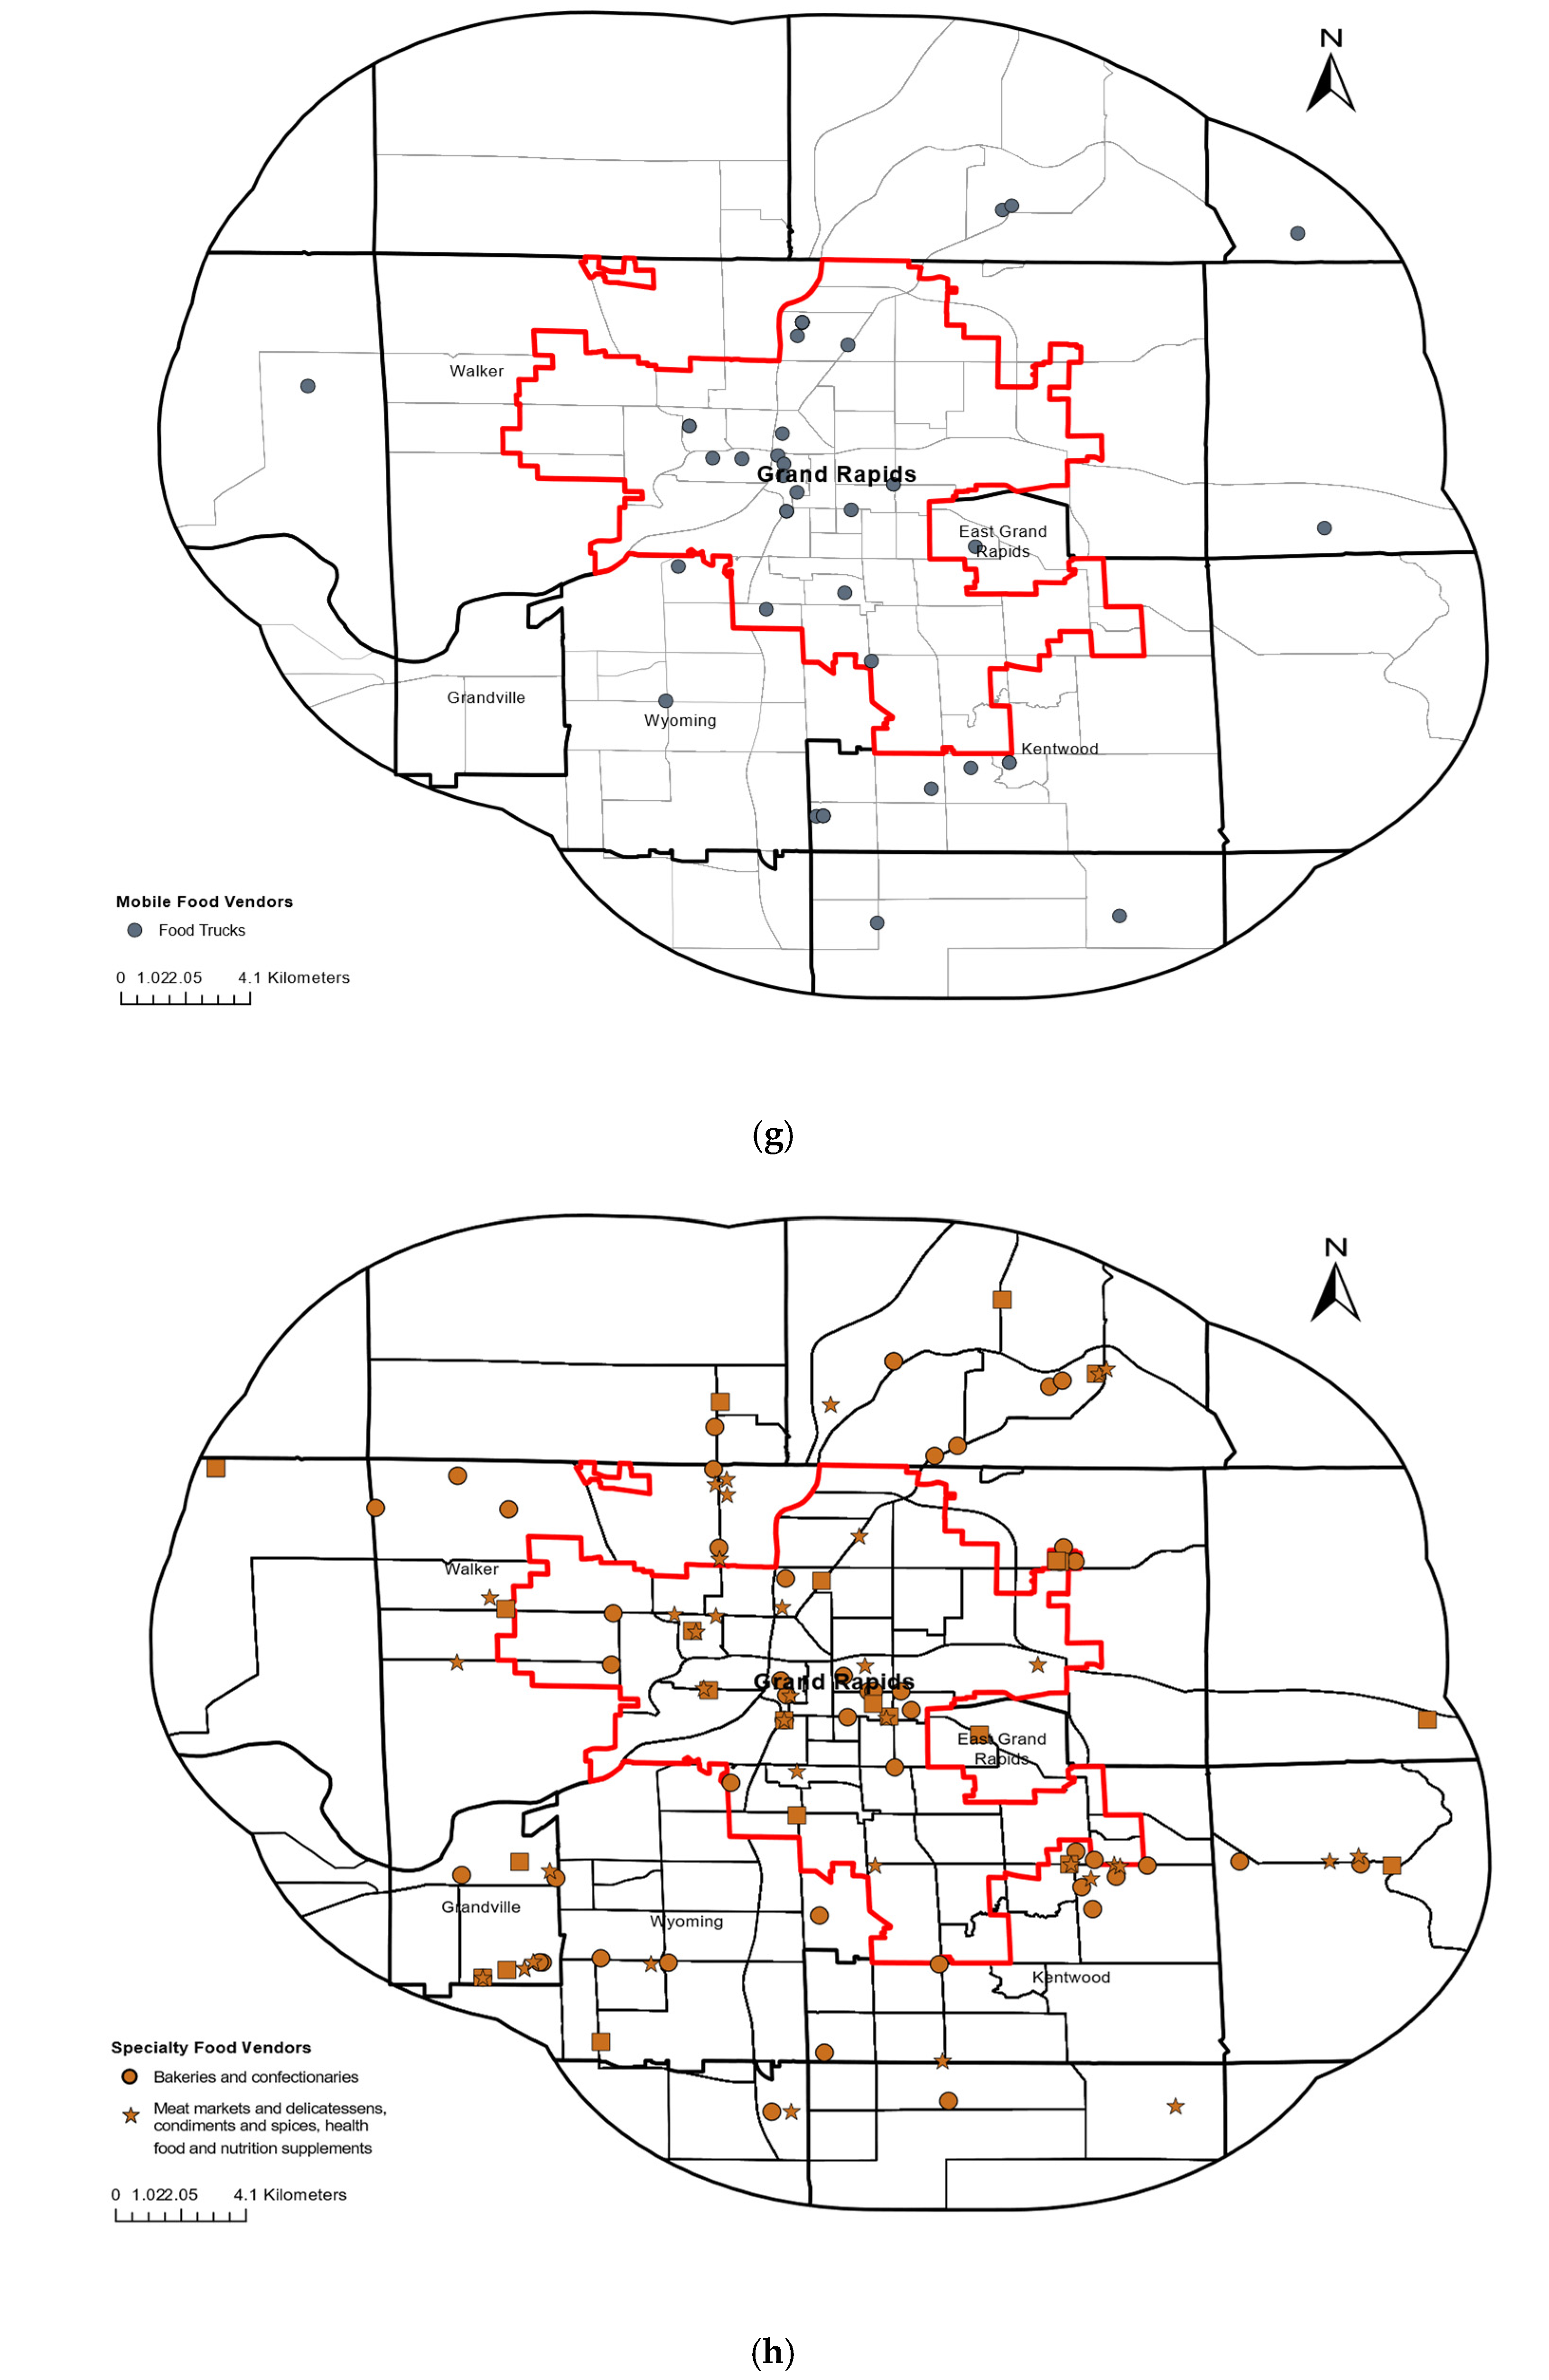
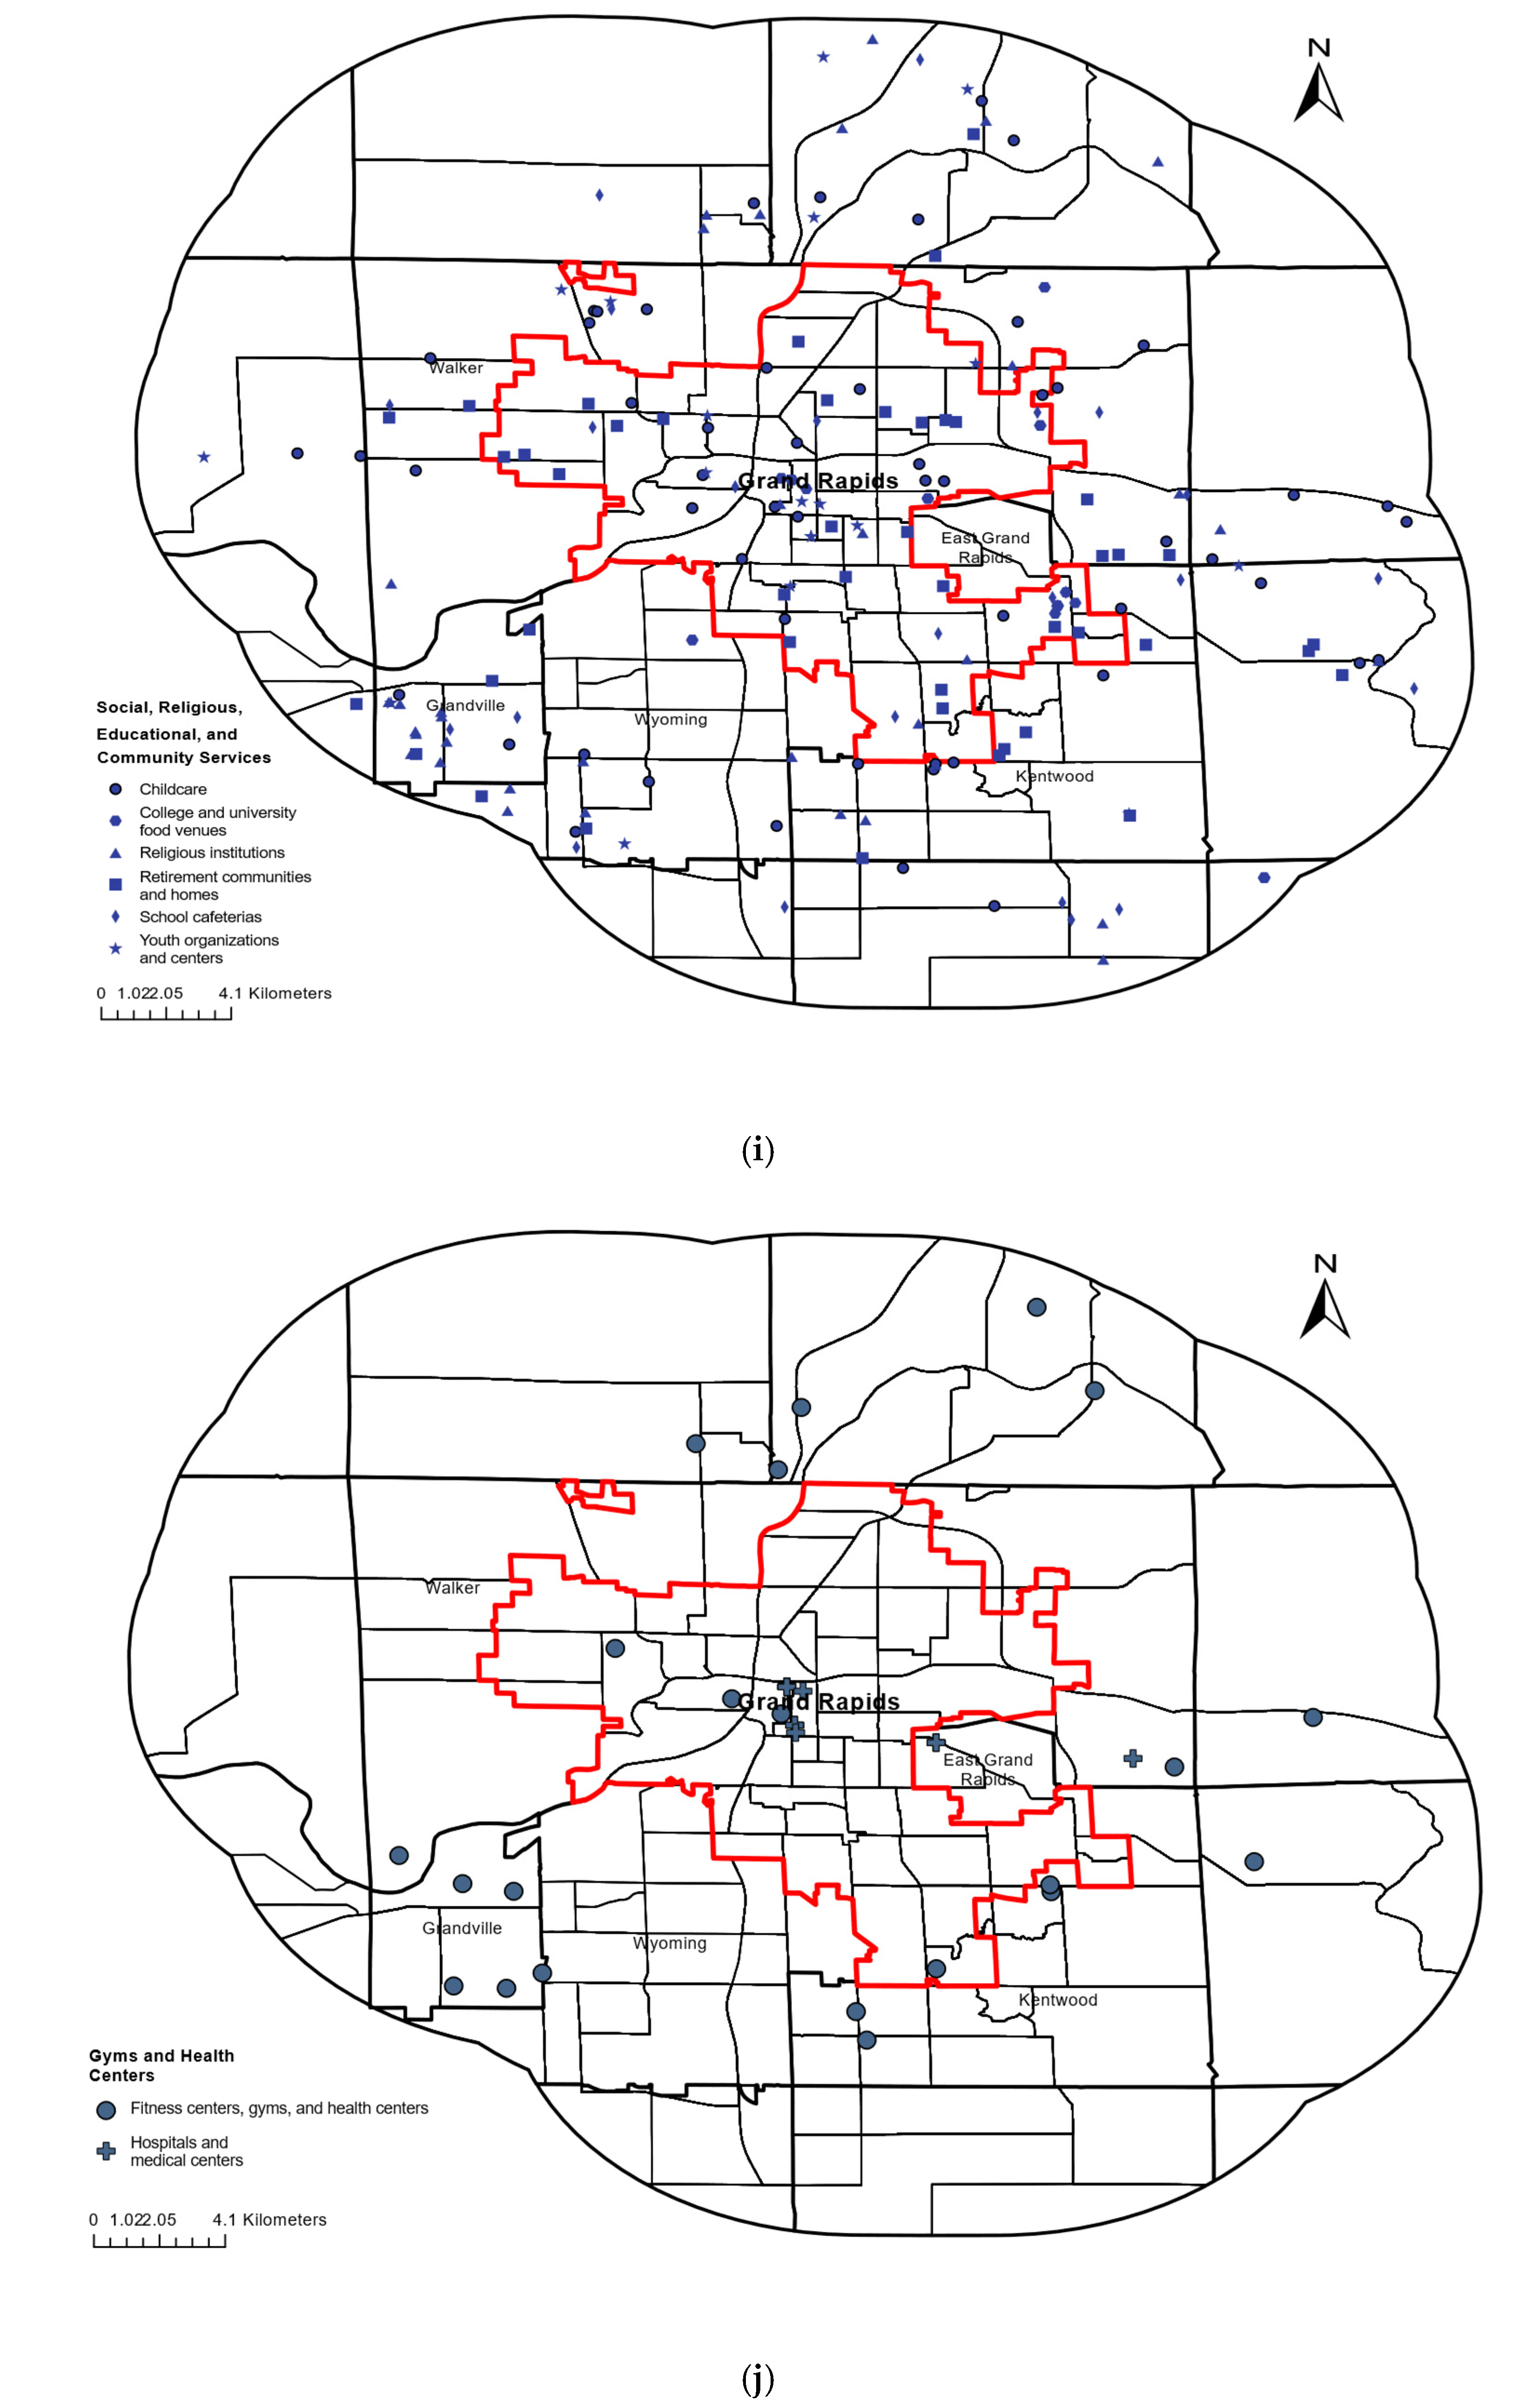
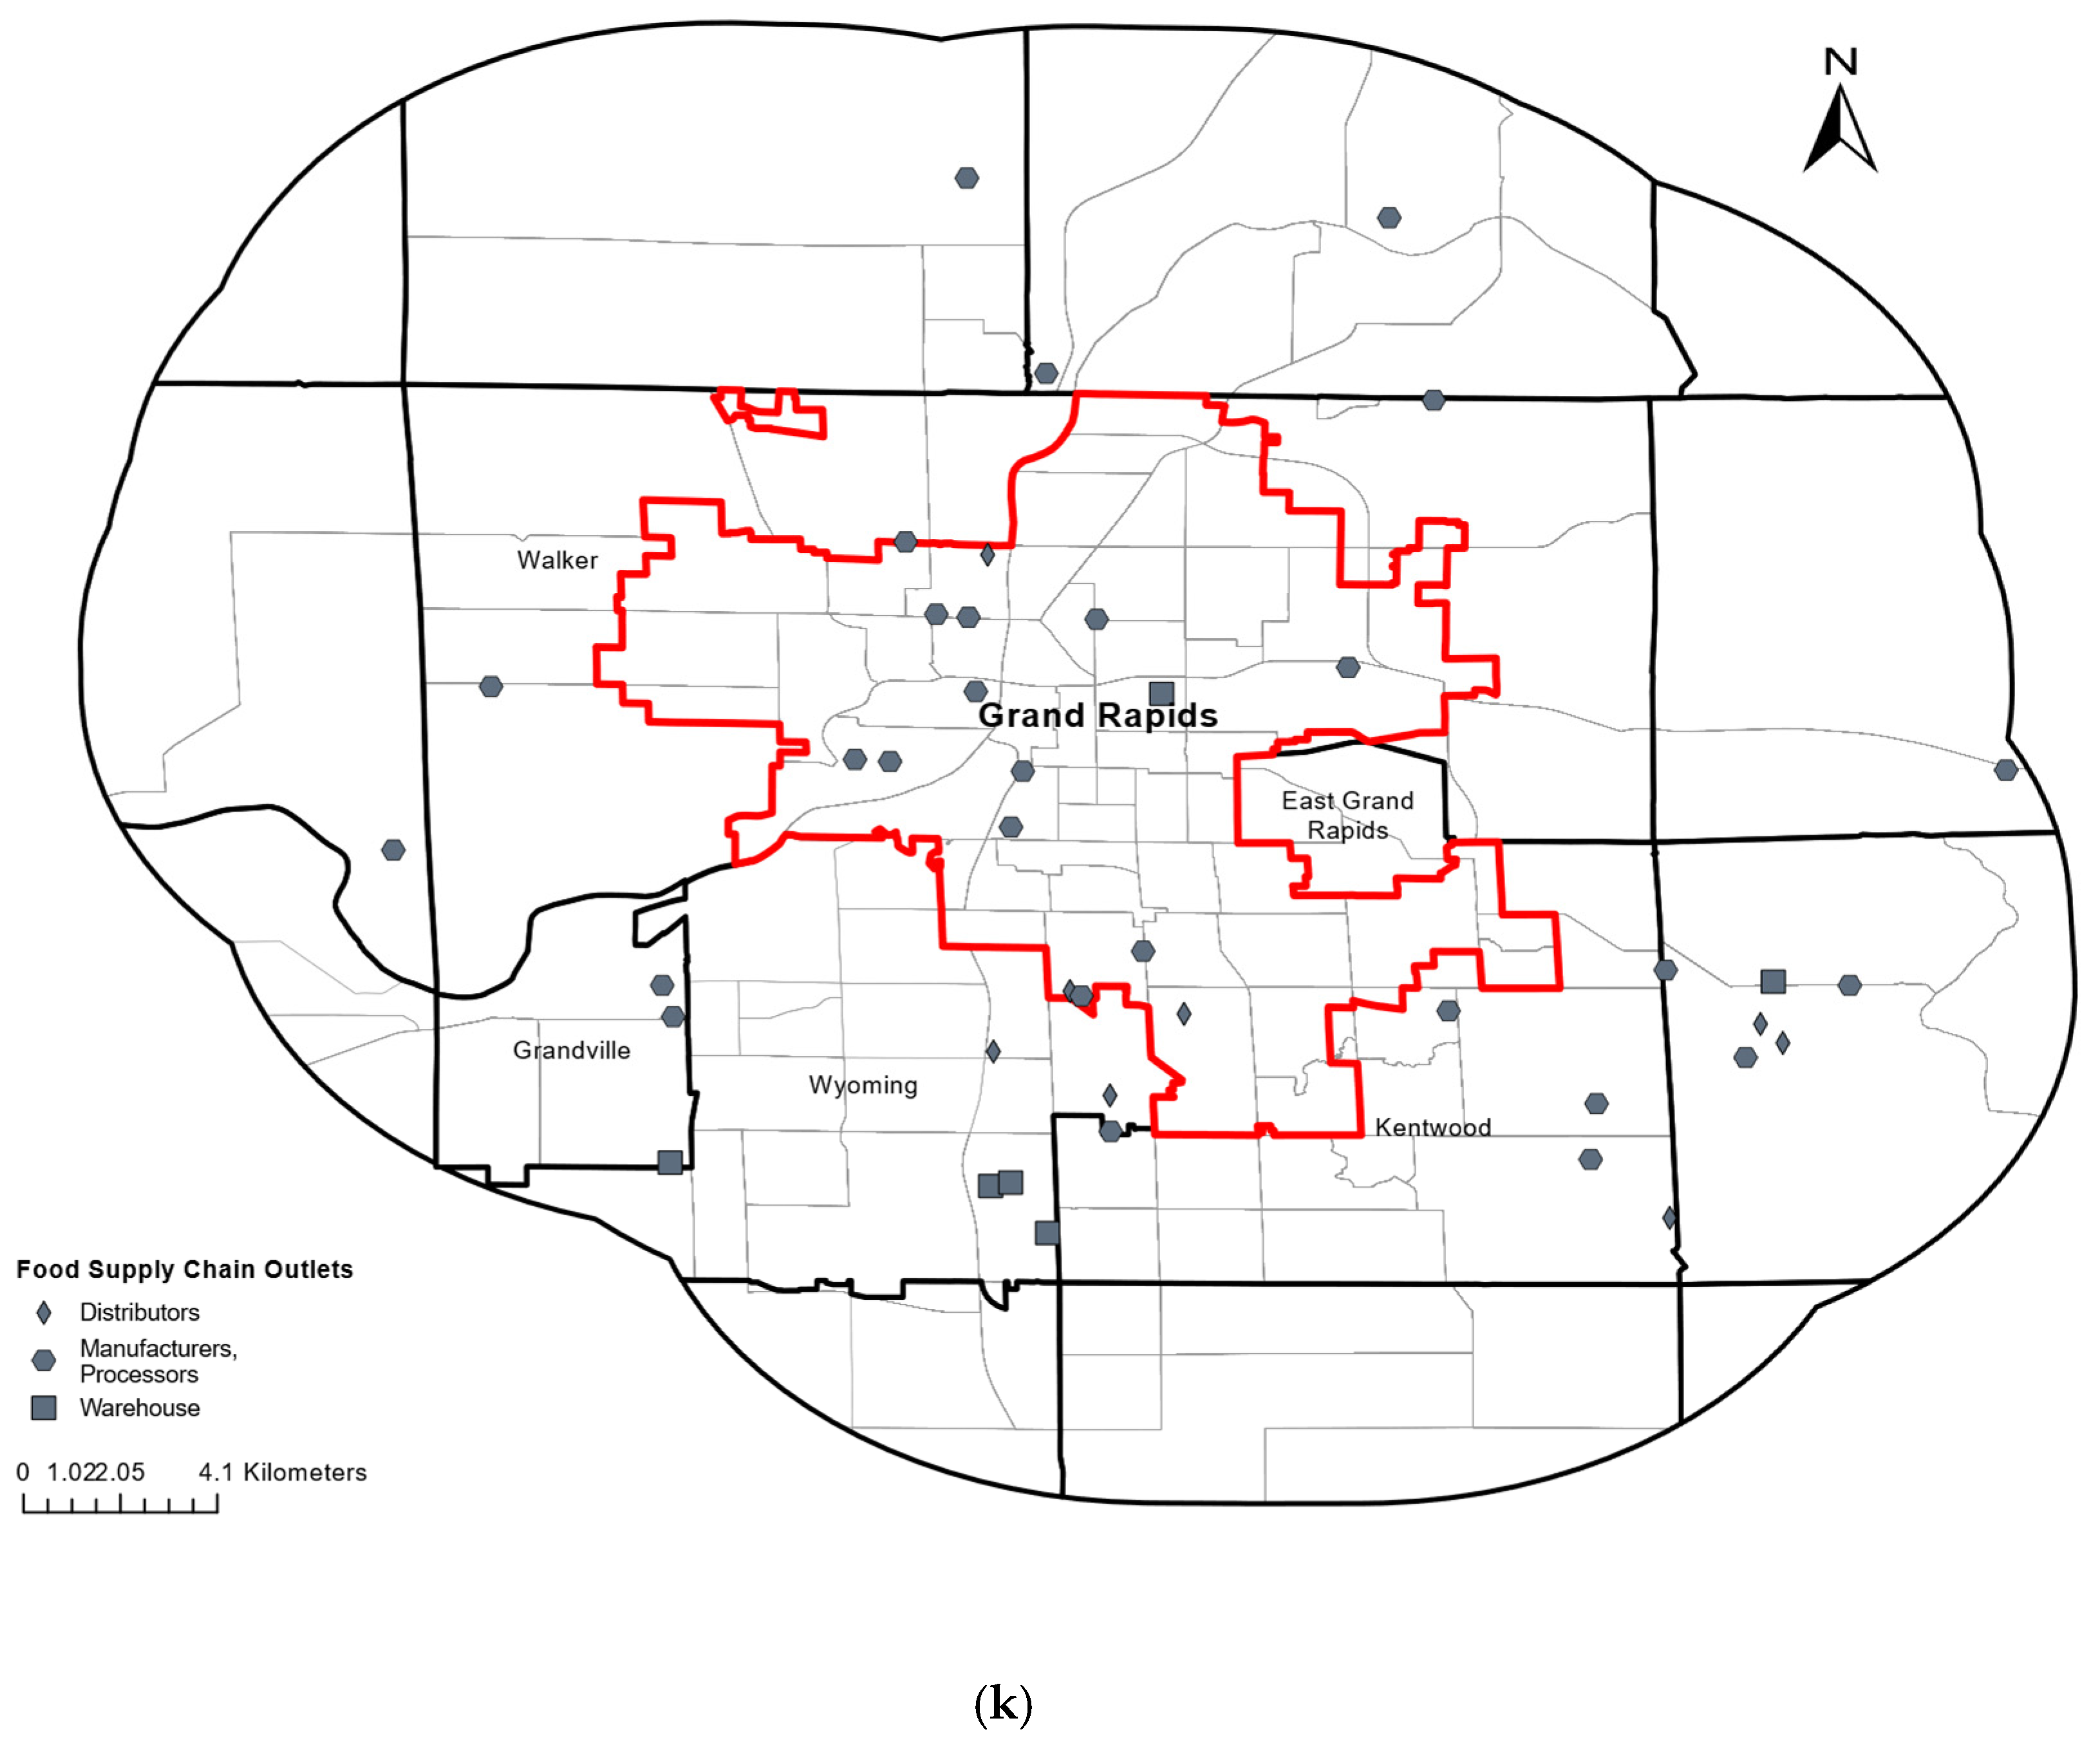
Table A2.
HOLC’s Neighborhood Codes and the Number and Density of Open Food Outlets in the Greater Grand Rapids Area.
Table A3.
Global Moran’s I Tests for Spatial Autocorrelation in the Final Fully Adjusted Tract-Level Regression Models of Food Outlet Counts.
Table A4.
Global Moran’s I Tests for Residual Spatial Autocorrelation in the Final Fully Adjusted Tract-Level Regression Models of Food Outlet Counts.
Table A5.
Incidence Rate Ratios from Fully Adjusted Model Including Census Tract Racial Composition, Adjusted for Sociodemographic Covariates.
Table A6.
Incidence Rate Ratios from Fully Adjusted Model Including HOLC Grade, Adjusted for Sociodemographic Covariates.
Table A7.
Incidence Rate Ratios from Fully Adjusted Model Including Census Tract Racial Composition and HOLC Grade, Adjusted for Sociodemographic Covariates.
Table A8.
Incidence Rate Ratios from Fully Adjusted Model Including Census Tract Racial Composition, HOLC Grade, and Study Site, Adjusted for Sociodemographic Covariates.
Figure A2.
Incidence rate ratios (IRRs) and 95% confidence intervals from negative binomial regression models predicting the number of closed food outlets, with tract population included as a log offset. Incidence rate ratios (IRRs) and 95% confidence intervals from negative binomial regression models predicting the number of closed food outlets, with tract population included as a log offset. The green lines represent racial composition, purple lines depict the HOLC grade, and the blue lines show the median income, educational attainment, and population density. (a) Model 1 includes percent people of color (per 10%) as the primary exposure, adjusting for median household income (per $1000), percent of the population with a bachelor’s degree or higher (per 10%), and population density (per 10 persons/km2). (b) Model 2 includes HOLC grade as the primary exposure, adjusting for the same covariates as Model 1. (c) Model 3 includes all predictors simultaneously. Negative binomial regression was selected based on model fit; Poisson models were also tested and are reported in Table A8. Green markers represent demographic exposure variable, blue represents socioeconomic covariates, and purple represents HOLC exposure. Confidence intervals and/or point estimates extending beyond the plotting range are truncated at the axis limit. The x-axis is plotted on a log10 scale; IRR = 1 indicates no association.
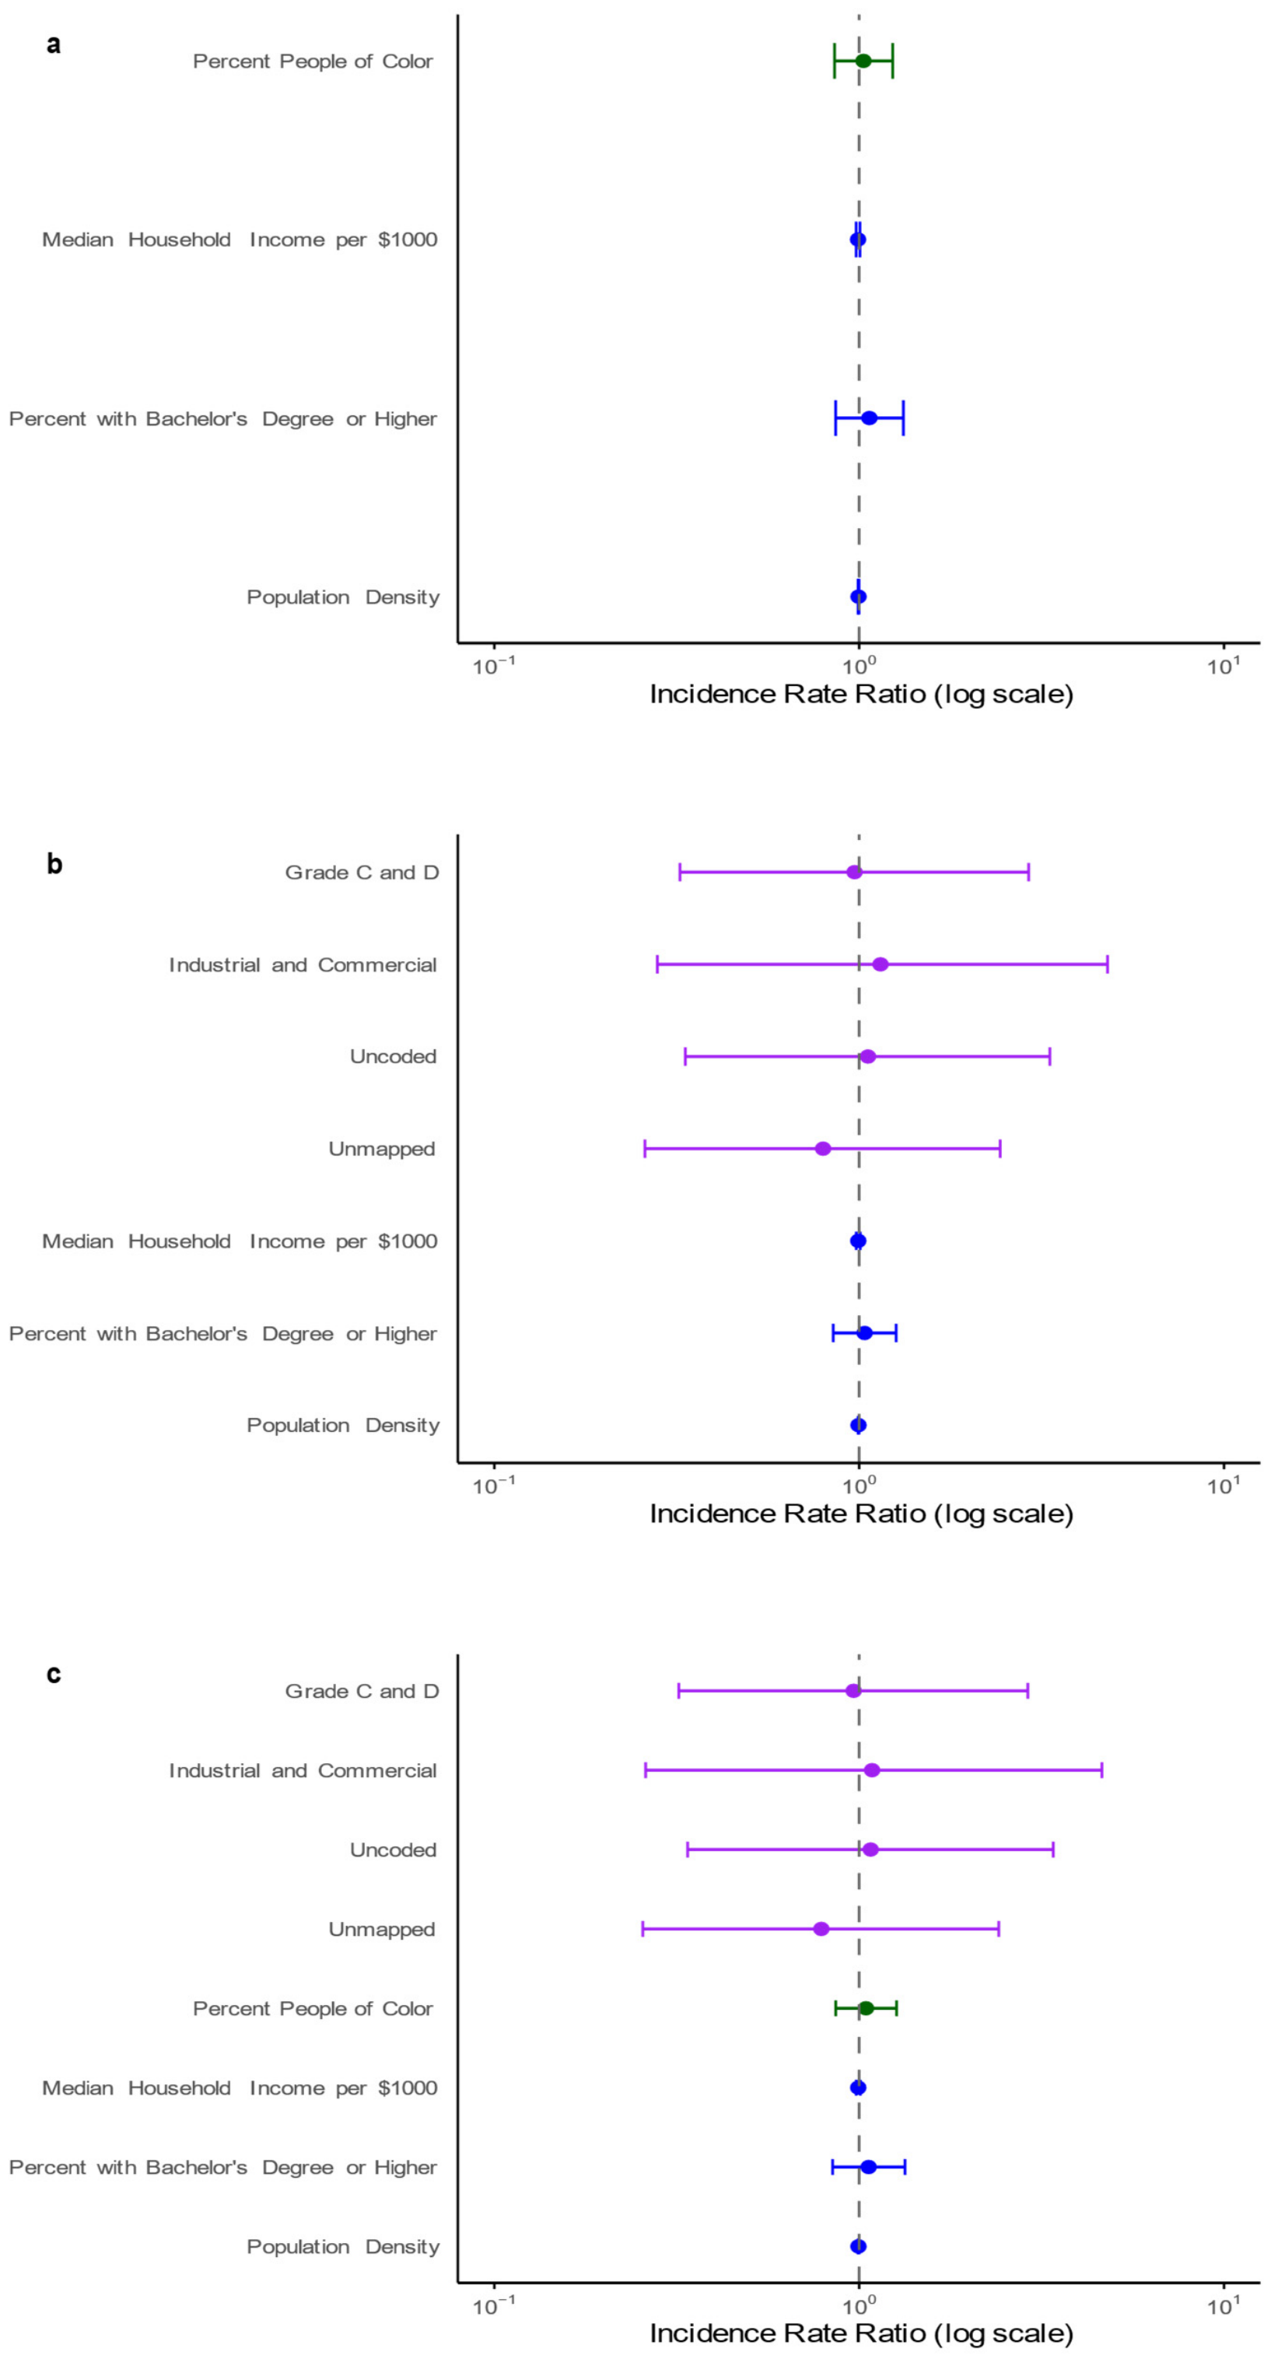
References
- Food and Agriculture Organization of the United Nations. Strengthening Urban and Peri-Urban Food Systems to Achieve Food Security and Nutrition, in the Context of Urbanization and Rural Transformation; HLPE Report No. 19; Committee on World Food Security: Rome, Italy, 2024; Available online: https://openknowledge.fao.org/handle/20.500.14283/cd1459en (accessed on 10 March 2025).
- The Economist Group. Global Food Security Index. 2022. Available online: https://impact.economist.com/sustainability/project/food-security-index/reports/Economist_Impact_GFSI_2022_Global_Report_Sep_2022.pdf (accessed on 5 May 2024).
- Rabbitt, M.P.; Reed-Jones, M.; Hales, L.J.; Burke, M.P. Household Food Security in 2023; Report No. ERR-337; U.S. Department of Agriculture, Economic Research Service: Washington, DC, USA, 2024. [CrossRef] [Scilit]
- Carrillo-Álvarez, E. Perspective: Food and nutrition insecurity in Europe: Challenges and opportunities for dietitians. Adv. Nutr. 2023, 14, 995–1004. [Google Scholar] [CrossRef] [Scilit] [PubMed]
- Berger, N.; Lebacq, T.; Vandevijvere, S.; De Ridder, K.; Le Dieu, E.; Van Campenhout, E.; Vasquez, M.S.; Bel, S.; Moyersoen, I. Food insecurity and fruit and vegetable consumption in Belgium. Eur. J. Public Health 2024, 34, ckae144.1554. [Google Scholar] [CrossRef] [Scilit]
- Joseph Rowntree Foundation. Food Insecurity. 2026. Available online: https://www.jrf.org.uk/uk-poverty-statistics/food-insecurity (accessed on 5 July 2026).
- Ozbun, T. Food Security in the U.K. in (Excluding Scotland) 2020–2023. Statista. 28 November 2025. Available online: https://www.statista.com/statistics/1258789/food-security-in-the-united-kingdom/?srsltid=AfmBOopsFA9KQQQFIgwaexLkZnvYMYO_X7cmYwyI6vFE9Ri3po5WmXG2 (accessed on 3 January 2026).
- Statista Research Department. Regional Shares of Global Population and Food Insecurity in 2022. 29 November 2025. Available online: https://www.statista.com/statistics/239468/population-food-insecurity-and-distribution-gap-shares-by-region/?srsltid=AfmBOooShCLHgTE5d3jczRtJcP2Ecic0z3V8LPVy17tYLb16IKOihUBY#statisticContainer (accessed on 3 January 2026).
- Feeding America. 2022 Map the Meal Gap: Food Insecurity in Michigan. 2024. Available online: https://map.feedingamerica.org/county/2022/overall/michigan (accessed on 9 March 2025).
- Kent County Food Policy Council. Kent County, Michigan: Food System Plan. January 2025. Available online: https://kentfoodpolicy.org/wp-content/uploads/2025/01/Copy-of-KCFPC_FSP_digital-final.pdf (accessed on 11 September 2025).
- City of Grand Rapids. Climate Action & Adaptation Plan. August 2025. Available online: https://www.grandrapidsmi.gov/departments/sustainability/the-grand-rapids-climate-action-adaptation-plan/ (accessed on 30 November 2025).
- Taylor, D.E.; Bell, A.; Treloar, D.; Ajani, A.; Alvarez, M.; Hamilton, T.; Velazquez, J.; Nandar, P.; Fillwalk, L.; Ard, K. Defying the food desert, food swamp, and supermarket redlining stereotypes in Detroit: Comparing the distribution of food outlets in 2013 and 2023. Sustainability 2024, 16, 7109. [Google Scholar] [CrossRef] [Scilit]
- Vojnovic, I.; Ligmann-Zielinska, A.; LeDoux, T.F. The dynamics of food shopping behavior: Exploring travel patterns in low-income Detroit neighborhoods experiencing extreme disinvestment using agent-based modeling. PLoS ONE 2020, 15, e0243501. [Google Scholar] [CrossRef] [Scilit] [PubMed]
- Bell, A.; Taylor, D.E. A vanishing food infrastructure: The closure of food outlets in Flint in a pandemic era. Am. Behav. Sci. 2022, 68, 550–584. [Google Scholar] [CrossRef] [Scilit]
- Saxe-Custack, A.; Lofton, H.C.; Hanna-Attisha, M.; Tata, Z.; Ceja, T.; LaChance, J. Caregiver experiences with an innovative farmers’ market incentive program for children in Flint, Michigan. Glob. Pediatr. Health 2019, 6, 2333794X19870989. [Google Scholar] [CrossRef] [Scilit] [PubMed]
- Mayfield, K.E.; Weatherspoon, L.; Hession, S.L.; Hoerr, S.M. Differences in race, median household income and food store constructs from large and small food locations: An urban and suburban spatial analysis of food access in a Flint, Michigan. J. Hum. Nutr. Food Sci. 2024, 12, 1178. [Google Scholar] [CrossRef]
- Olabisi, L.S.; Wentworth, C.; Key, K.; Wallace, R.V.; McNall, M.; Hodbod, J.; Gray, S.A. Defining success in community-university partnerships: Lessons learned from Flint. J. Responsible Innov. 2023, 10, 2102567. [Google Scholar] [CrossRef] [Scilit]
- Shaver, E.R.; Sadler, R.C.; Hill, A.B.; Bell, K.; Ray, M.; Choy-Shin, J.; Lerner, J.; Soldner, T.; Jones, A.D. The Flint food store survey: Combining spatial analysis with a modified Nutrition Environment Measures Survey in Stores (NEMS-S) to measure the community and consumer nutrition environments. Public Health Nutr. 2018, 21, 1474–1485. [Google Scholar] [CrossRef] [Scilit] [PubMed]
- Santarossa, S.; Hill, A.B.; Sitarik, A.R.; Taylor, M.; Hawkins, S.; Scher, K.; Sohaski, A.; Baseer, M.; Dombrowski, R.; Plum, A. Food insecurity in Detroit: Exploring the relationship between patient-reported food insecurity and proximity to healthful grocery stores. Public Health Nutr. 2022, 25, 954–963. [Google Scholar] [CrossRef] [Scilit] [PubMed]
- Gilleran, M.M.; Koosis, A.O.; Hill, A.B.; Beavers, A.W. A Qualitative Examination of the Detroit Community Food Response to COVID-19. Nutrients 2023, 15, 3047. [Google Scholar] [CrossRef] [Scilit] [PubMed]
- Koosis, A.O.; Hill, A.B.; Whaley, M.; Beavers, A.W. “I shouldn’t have to drive to the suburbs”: Grocery store access, transportation, and food security in Detroit during the COVID-19 pandemic. Nutrients 2025, 17, 2441. [Google Scholar] [CrossRef] [Scilit] [PubMed]
- Hill, A.B. “Treat everybody right”: Examining foodways to improve food access. J. Agric. Food Syst. Community Dev. 2021, 10, 9–16. [Google Scholar] [CrossRef] [Scilit]
- Li, X.; Vojnovic, I.; Ligmann-Zielinska, A. Spatial accessibility and travel to pharmacy by type in the Detroit region. J. Am. Pharm. Assoc. 2024, 64, 102052. [Google Scholar] [CrossRef] [Scilit] [PubMed]
- Taylor, D.E.; Ard, K.J. Food availability and the food desert frame in Detroit: An overview of the city’s food system. Environ. Pract. 2015, 17, 102–133. [Google Scholar] [CrossRef] [Scilit]
- Mayfield, K.E.; Carolan, M.; Weatherspoon, L.; Chung, K.R.; Hoerr, S.M. African American Women’s Perceptions on Access to Food and Water in Flint, Michigan. J. Nutr. Educ. Behav. 2017, 49, 519–524.e1. [Google Scholar] [CrossRef] [Scilit] [PubMed]
- Sadler, R.C.; Kong, A.Y.; Chanderraj, E.R.; Carravallah, L.A. Linking the Flint food store survey: Is objective or perceived access to healthy foods associated with glycemic control in patients with Type 2 diabetes? Int. J. Environ. Res. Public Health 2021, 18, 10080. [Google Scholar] [CrossRef] [Scilit] [PubMed]
- Budzynska, K.; West, P.; Savoy-Moore, R.T.; Lindsey, D.; Winter, M.; Newby, P.K. A food desert in Detroit: Associations with food shopping and eating behaviours, dietary intakes and obesity. Public Health Nutr. 2013, 16, 2114–2123. [Google Scholar] [CrossRef] [Scilit] [PubMed]
- History and Directory of Kent County, Michigan, Containing a History of Each Township, and the City of Grand Rapids; the Name, Location and Postoffice Address of All Residents Outside of the City: A List of Postoffices in the County; a Schedule of Population; and Other Valuable Statistics; Daily Eagle Steam Printing House: Grand Rapids, MI, USA, 1870; pp. 114–136. Available online: https://archive.org/details/bad0957.0001.001.umich.edu (accessed on 15 February 2025).
- Robinson, T.E. A City Within a City: The Black Freedom Struggle in Grand Rapids, Michigan; Temple University Press: Philadelphia, PA, USA, 2012. [Google Scholar]
- Jelks, R.M. African Americans in the Furniture City: The Struggle for Civil Rights in Grand Rapids; The University of Illinois Press: Champaign, IL, USA, 2006. [Google Scholar]
- Fernández, M.A. From Spanish-Speaking to Latino: Mexicans and Puerto Ricans in West Michigan; The Ohio State University: Columbus, OH, USA, 2015; ProQuest 28245143. [Google Scholar]
- U. S. Census Bureau. QuickFacts: Grand Rapids, Walker City, Grandville City, Wyoming City, Kentwood City, East Grand Rapids City, Michigan. 2023. Available online: https://www.census.gov/quickfacts/fact/table/grandrapidscitymichigan,walkercitymichigan,grandvillecitymichigan,wyomingcitymichigan,kentwoodcitymichigan,eastgrandrapidscitymichigan/PST045223 (accessed on 6 January 2025).
- U. S. Census Bureau. ACS 5-Year Estimates. 2022. Available online: https://data.census.gov/advanced?g=040XX00US26$1400000&y=2022 (accessed on 6 January 2025).
- Kent County Health Department. Kent County Community Needs Assessment. 2023. Available online: https://kentcountyhealthconnect.org/wp-content/uploads/2024/04/2023-CHNA-Final-Report.pdf (accessed on 11 February 2025).
- Cyzman, D.; Wierenga, J.; Sielawa, J. Pioneering Healthier Communities, West Michigan. Health Promot. Pract. 2009, 10, 146–155. [Google Scholar] [CrossRef] [Scilit] [PubMed]
- Mello, C.; King, L.O.; Adams, I. Growing Food, Growing Consciousness: Gardening and Social Justice in Grand Rapids, Michigan. J. Cult. Agric. 2017, 39, 143–147. [Google Scholar] [CrossRef] [Scilit]
- Wu, T.-Y.; Bessire, R.; Ford, O.; Rainfille, A.J.; Chong, C.M.; Caboral-Stevens, M. Food Insecurity and Diabetes: An Investigation of Underserved Asian Americans in Michigan. Health Promot. Pract. 2022, 23, 67S–75S. [Google Scholar] [CrossRef] [Scilit] [PubMed]
- Rybarczyk, G.; Taylor, D.; Brines, S.; Wetzel, R. A Geospatial Analysis of Access to Ethnic Food Retailers in Two Michigan Cities: Investigating the Importance of Outlet Type within Active Travel Neighborhoods. Int. J. Environ. Res. Public Health 2020, 17, 166. [Google Scholar] [CrossRef] [Scilit] [PubMed]
- Kotval-K, Z.; Khandelwal, S.; Wills, K. Access to foods using Grand Rapids, Michigan, as a case study: Objective versus subjective issues. J. Agric. Food Syst. Community Dev. 2021, 10, 145–159. [Google Scholar] [CrossRef] [Scilit]
- Tabrez, Z. Sustainable cities: Enhancing food systems with urban agriculture. Discov. Food 2025, 5, 173. [Google Scholar] [CrossRef] [Scilit]
- Slim, F.; Ibrahim, Z.; Toufeili, I.; Haddarah, A.; Rejeb, A. Assessing food insecurity strategies across twelve countries from different income levels: A sustainability and food systems perspective. Discov. Sustain. 2025, 6, 689. [Google Scholar] [CrossRef] [Scilit]
- Agyekum, S.; Awuh, H.E. Striving for just sustainabilities in urban foodscape planning: The case of Almere city in the Netherlands. Local Environ. 2024, 29, 1063–1084. [Google Scholar] [CrossRef] [Scilit]
- Community Food Club. An Innovative and Dignified Approach to Food Security. 2026. Available online: https://www.communityfoodclubgr.org/ (accessed on 13 April 2026).
- YMCA of Greater Grand Rapids. Healthy Corner Stores. Available online: https://www.grymca.org/healthy-corner-stores/ (accessed on 2 April 2026).
- Leiding, B.; Paulus, S.; Lehmann, D.J. The future of resilient food production—Current challenges and opportunities. Front. Sustain. Food Syst. 2026, 10, 1673667. [Google Scholar] [CrossRef] [Scilit]
- Alian, M.; Dhoubhadel, S.P.; Risal, S.; Tiwari, P.; Zhu, W.; Balan, V. Financial analysis of shipping container-based mushroom cultivation. Sustain. Food Technol. 2026, 4, 4140–4156. [Google Scholar] [CrossRef] [Scilit]
- Roots, S. Your Local Farm, 365 Days a Year. Available online: https://www.squarerootsgrow.com/our-farms (accessed on 2 April 2026).
- Roots, S. Scaling Indoor Farming at Speed: Square Roots’ New Michigan Farm Campus. 2019. Available online: https://medium.com/square-roots/scaling-indoor-farming-at-speed-square-roots-new-michigan-farm-campus-94e06cf7d688 (accessed on 5 April 2026).
- Kell, J. Square Roots and Gordon Food Service Celebrate New Michigan Indoor Farm, Expanding Partnership to Grow More Local Food Across the U.S. 2021. Available online: https://www.squarerootsgrow.com/blog/press-release-square-roots-and-gordon-food-service-celebrate-new-michigan-indoor-farm-expanding-partnership-to-grow-more-local-food-across-the-u-s (accessed on 3 April 2026).
- The Packer. Square Roots Opens Another Indoor Farm with Gordon Food Service. 31 October 2022. Available online: https://www.thepacker.com/news/produce-crops/square-roots-opens-another-indoor-farm-gordon-food-service (accessed on 3 April 2026).
- Bluebook. Square Roots and Gordon Food Service Celebrate New Indoor Farm. 17 August 2022. Available online: https://www.bluebookservices.com/square-roots-and-gordon-food-service-celebrate-new-indoor-farm/ (accessed on 5 April 2026).
- Wagner, N.; Morrish, D.; Juarez, M. Identifying the influential factors, benefits and challenges of hydroponic shipping container farm businesses: A snapshot of farmers’ perceptions. Renew. Agric. Food Syst. 2021, 36, 519–526. [Google Scholar] [CrossRef] [Scilit]
- Edwards, G. Magical mindless labor: Exploring ecological citizenship education through a case study utilizing a hydroponic shipping container farm. Educ. Citizsh. Soc. Justice 2026. [Google Scholar] [CrossRef] [Scilit]
- Sushil, Z.; Vandevijvere, S.; Exeter, D.J.; Swinburn, B. Food swamps by area socioeconomic deprivation in New Zealand: A national study. Int. J. Public Health 2017, 62, 869–877. [Google Scholar] [CrossRef] [Scilit] [PubMed]
- Robitaille, É.; Paquette, M.C. Development of a method to locate food deserts and food swamps following the experience of a region in Quebec, Canada. Int. J. Environ. Res. Public Health 2020, 17, 3359. [Google Scholar] [CrossRef] [Scilit] [PubMed]
- Hager, E.R.; Cockerham, A.; O’Reilly, N.; Harrington, D.; Harding, J.; Hurley, K.M.; Black, M.M. Food swamps and food deserts in Baltimore City, MD, USA: Associations with dietary behaviours among urban adolescent girls. Public Health Nutr. 2017, 20, 2598–2607. [Google Scholar] [CrossRef] [Scilit] [PubMed]
- Morland, K.; Wing, S.; Roux, A.D. Neighborhood characteristics associated with the location of food stores and food service places. Am. J. Prev. Med. 2002, 22, 23–29. [Google Scholar] [CrossRef] [Scilit] [PubMed]
- Li, M.; Yuan, F. Historical redlining and food environments: A study of 102 urban areas in the United States. Health Place 2022, 75, 102775. [Google Scholar] [CrossRef] [Scilit] [PubMed]
- Joyner, L.; Yagüe, B.; Cachelin, A.; Rose, J. Farms and gardens everywhere but not a bite to eat? A critical geographic approach to food apartheid in Salt Lake City. J. Agric. Food Syst. Community Dev. 2022, 11, 67–88. [Google Scholar] [CrossRef] [Scilit]
- Sadler, R.C.; Bilal, U.; Furr-Holden, C.D. Linking historical discriminatory housing patterns to the contemporary food environment in Baltimore. Spat. Spatio-Temporal Epidemiol. 2021, 36, 100387. [Google Scholar] [CrossRef] [Scilit] [PubMed]
- Shannon, J. Dollar stores, retailer redlining, and the metropolitan geographies of precarious consumption. Ann. Am. Assoc. Geogr. 2021, 111, 1200–1218. [Google Scholar] [CrossRef] [Scilit]
- Crowe, J.; Lacy, C.; Columbus, Y. Barriers to food security and community stress in an urban food desert. Urban Sci. 2018, 2, 46. [Google Scholar] [CrossRef] [Scilit]
- Zhang, M.; Ghosh, D. Spatial supermarket redlining and neighborhood vulnerability: A case study of Hartford, Connecticut. Trans. GIS 2016, 20, 79–100. [Google Scholar] [CrossRef] [Scilit] [PubMed]
- Shannon, J. From food deserts to supermarket redlining: Making sense of food access in Atlanta. Atlanta Studies, 14 August 2018. [CrossRef] [Scilit]
- Lee, J.P.; Ponicki, W.; Mair, C.; Gruenewald, P.; Ghanem, L. What explains the concentration of off-premise alcohol outlets in Black neighborhoods. SSM–Popul. Health 2020, 12, 100669. [Google Scholar] [CrossRef] [Scilit] [PubMed]
- Shaker, Y.; Grineski, S.E.; Collins, T.W.; Flores, A.B. Redlining, racism and food access in US urban cores. Agric. Hum. Values 2023, 40, 101–112. [Google Scholar] [CrossRef] [Scilit] [PubMed]
- Taylor, D.E.; Bell, A.; Sternberg, K.; Treloar, D.; Lewis, S.; Wright, T. Sociodemographic disparities and the distribution of open and closed food outlets in the Hartford area of Connecticut. Sci. Rep. 2026. [Google Scholar] [CrossRef] [Scilit] [PubMed]
- Justiniano, I.C.S.; de Menezes, M.C.; Mendes, L.L.; Pessoa, M.C. Retail food environment in a Brazilian metropolis over the course of a decade: Evidence of restricted availability of healthy foods. Public Health Nutr. 2022, 25, 2584–2592. [Google Scholar] [CrossRef] [Scilit] [PubMed]
- Taylor, D.E.; Allison, K.; Hamilton, T.; Bell, A. Race, socioeconomic status and food access in two predominantly White cities: The case of Lansing, East Lansing, and surrounding townships in Michigan. Sustainability 2023, 15, 15065. [Google Scholar] [CrossRef] [Scilit]
- Taylor, D.E.; Bell, A.; Saherwala, A.; Lewis, S.; Rybarczyk, G.; Wetzel, R. Food Insecurity and Inaccessibility in Saginaw, Michigan: Assessing the Prevalence of Food Deserts, Food Swamps, and Supermarket Redlining. J. Agric. Food Syst. Community Dev. 2025, 14, 383–429. [Google Scholar] [CrossRef] [Scilit]
- Gillespie, R.; DeWitt, E.; Slone, S.; Cardarelli, K.; Gustafson, A. The impact of a grocery store closure in one rural highly obese Appalachian community on shopping behavior and dietary intake. Int. J. Environ. Res. Public Health 2022, 19, 3506. [Google Scholar] [CrossRef] [Scilit] [PubMed]
- Yeager, C.D.; Gatrell, J.D. Rural food accessibility: An analysis of travel impedance and the risk of potential grocery closures. Appl. Geogr. 2014, 53, 1–10. [Google Scholar] [CrossRef] [Scilit]
- Yi, S.S.; Ali, S.; Russo, R.G.; Foster, V.; Radee, A.; Chong, S.; Tsui, F.; Kranick, J.; Lee, D.; Imbruce, V.; et al. COVID-19 leads to dramatic changes in the food retail environment in New York City: May–July 2020. J. Immigr. Minor. Health 2021, 24, 31–37. [Google Scholar] [CrossRef] [Scilit] [PubMed]
- Powell, L.M.; Chaloupka, F.J.; Bao, Y. The availability of fast-food and full-service restaurants in the United States: Associations with neighborhood characteristics. Am. J. Prev. Med. 2007, 33, S240–S245. [Google Scholar] [CrossRef] [Scilit] [PubMed]
- Goddard, E. The impact of COVID-19 on food retail and food service in Canada: Preliminary assessment. Can. J. Agric. Econ. Can. D’agroeconomie 2020, 68, 157–161. [Google Scholar] [CrossRef] [Scilit]
- Siebers, L.Q. Superstore Closures in China: The Past, Now, and The Future. The European Financial Review. 20 September 2023. Available online: https://www.europeanfinancialreview.com/superstore-closures-in-china-the-past-now-and-the-future/ (accessed on 12 February 2025).
- Taylor, D.E. Toxic Communities: Environmental Racism, Industrial Pollution, and Residential Mobility; New York University Press: New York, NY, USA, 2014. [Google Scholar]
- Rothstein, R. The Color of Law: A Forgotten History of How Our Government Segregated America; Norton: New York, NY, USA, 2018. [Google Scholar]
- Kukic, M. Grand Rapids, Michigan. Mapping Inequality: Redlining in New Deal America. Available online: https://dsl.richmond.edu/panorama/redlining/map/MI/GrandRapids/context#mapview=full&loc=13/43.0075/-85.6583 (accessed on 16 July 2025).
- Nelson, R.K.; Winling, L.; Marciano, R.; Connolly, N.; Ayers, E.L. Mapping Inequality: Redlining in New Deal America. 2023. Available online: https://dsl.richmond.edu/panorama/redlining/map/MI/GrandRapids/areas#mapview=full&loc=12/42.9549/-85.6776 (accessed on 17 March 2025).
- U.S. Census Bureau. QuickFacts. 2024. Available online: https://www.census.gov/quickfacts/fact/table (accessed on 8 March 2025).
- Rose, D.D.; Bodor, J.N.; Swalm, C.M.; Rice, J.C.; Farley, T.A.; Hutchinson, P.L. Deserts in New Orleans? Illustrations of Urban Food Access and Implications for Policy; Paper prepared for the University of Michigan National Poverty Center and the USDA Economic Research Service: Ann Arbor, MI, USA, 2009. Available online: https://citeseerx.ist.psu.edu/document?repid=rep1&type=pdf&doi=abc8b418aa0783c8f3b0a0c4fca8f137ad806e0a (accessed on 8 March 2025).
- Sadler, R.C.; Gilliland, J.A.; Arku, G. An application of the edge effect in measuring accessibility to multiple food retailer types in Southwestern Ontario, Canada. Int. J. Health Geogr. 2011, 10, 34. [Google Scholar] [CrossRef] [Scilit] [PubMed]
- Sadler, R.C.; Gilliland, J.A.; Arku, G. A food retail-based intervention on food security and consumption. Int. J. Environ. Res. Public Health 2013, 10, 3325–3346. [Google Scholar] [CrossRef] [Scilit] [PubMed]
- Zenk, S.N.; Schulz, A.J.; Israel, B.A.; James, S.A.; Bao, S.; Wilson, M.L. Neighborhood racial composition, neighborhood poverty, and the spatial accessibility of supermarkets in metropolitan Detroit. Am. J. Public Health 2005, 95, 660–667. [Google Scholar] [CrossRef] [Scilit] [PubMed]
- Liese, A.D.; Colabianchi, N.; Lamichhane, A.P.; Barnes, T.L.; Hibbert, J.D.; Porter, D.E.; Nichols, M.D.; Lawson, A.B. Validation of 3 food outlet databases: Completeness and geospatial accuracy in rural and urban food environments. Am. J. Epidemiol. 2010, 172, 1324–1333. [Google Scholar] [CrossRef] [Scilit] [PubMed]
- Lisabeth, L.D.; Sánchez, B.N.; Escobar, J.; Hughes, R.; Meurer, W.J.; Zuniga, B.; Garcia, N.; Brown, D.L.; Morgenstern, L.B. The food environment in an urban Mexican American community. Health Place 2010, 16, 598–605. [Google Scholar] [CrossRef] [Scilit] [PubMed]
- Raja, S.; Ma, C.; Yadav, P. Beyond food deserts: Measuring and mapping racial disparities in neighborhood food environments. J. Plan. Educ. Res. 2008, 27, 469–482. [Google Scholar] [CrossRef] [Scilit]
- Taylor, D.E.; Bell, A.; Saherwala, A. Understanding food access in Flint: An analysis of racial and socio-economic disparities. Am. Behav. Sci. 2022, 68, 503–549. [Google Scholar] [CrossRef] [Scilit]
- Huang, S.J.; Sehgal, N.J. Association of historic redlining and present-day health in Baltimore. PLoS ONE 2022, 17, e0261028. [Google Scholar] [CrossRef] [Scilit] [PubMed]
- Lane, H.M.; Morello-Frosch, R.; Marshall, J.D.; Apte, J.S. Historical redlining is associated with present-day air pollution disparities in U.S. cities. Environ. Sci. Technol. Lett. 2022, 9, 345–350. [Google Scholar] [CrossRef] [Scilit] [PubMed]
- Noelke, C.; Outrich, M.; Baek, M.; Reece, J.; Osypuk, T.L.; McArdle, N.; Ressler, R.W.; Acevedo-Garcia, D. Connecting past to present: Examining different approaches to linking historical redlining to present-day health inequities. PLoS ONE 2022, 17, e0267606. [Google Scholar] [CrossRef] [Scilit] [PubMed]
- Johnston, R.; Jones, K.; Manley, D. Confounding and collinearity in regression analysis: A cautionary tale and an alternative procedure, illustrated by studies of British voting behaviour. Qual. Quant. 2018, 52, 1957–1976. [Google Scholar] [CrossRef] [Scilit] [PubMed]
- Federal Housing Administration. Underwriting Manual: Underwriting and Valuation Procedure Under Title II of the National Housing Act; Federal Housing Administration: Washington, DC, USA, 1936. Available online: https://www.publiconsulting.com/wordpress/ontheline/wp-content/uploads/sites/62/2018/02/1936FHA-Underwriting.pdf (accessed on 9 June 2025).
- Robinson, T.E. A City Within a City: The Social and Economic Construction of Segregated Space in Grand Rapids, Michigan 1945–1975. Doctoral Dissertation, University of Michigan, Ann Arbor, MI, USA, 2006. Available online: https://www.proquest.com/docview/305302632?fromopenview=true&pq-origsite=gscholar&sourcetype=Dissertations%20&%20Theses (accessed on 9 June 2025).
- Hughes, D.J. Depicting Racial Residential Segregation: An Empirical Analysis of a Geographical Racial Project in Kent County, Michigan. Master’s Thesis, Western Michigan University, Kalamazoo, MI, USA, 2024. Available online: https://www.proquest.com/docview/3066232771?pq-origsite=gscholar&fromopenview=true&sourcetype=Dissertations%20&%20Theses (accessed on 10 June 2025).
- Grand Rapids Study Committee on Human Relations. Report to the Grand Rapids City Commission; Grand Rapids Study Committee on Human Relations: Grand Rapids, MI, USA, 1954; p. 12. [Google Scholar]
- Michigan Compiled Laws (MCL). Michigan Legislature. Act 234. Discharge of Prohibited Restrictive Covenants Act. 13 December 2022. Available online: https://www.legislature.mi.gov/documents/2021-2022/publicact/pdf/2022-PA-0234.pdf (accessed on 15 September 2025).
- Geurden, B.; Cant, J.; Beckers, J. Food accessibility in the suburbs of the metropolitan city of Antwerp (Belgium): A factor of concern in local public health and active and healthy aging. Int. J. Environ. Res. Public Health 2022, 19, 15754. [Google Scholar] [CrossRef] [Scilit] [PubMed]
- Murphy, M.; Badland, H.; Jordan, H.; Koohsari, M.J.; Giles-Corti, B. Local food environments, suburban development, and BMI: A mixed methods study. Int. J. Environ. Res. Public Health 2018, 15, 1392. [Google Scholar] [CrossRef] [Scilit] [PubMed]
- He, Y.; Pu, H.; Liu, N.; Zhang, Y.; Sheng, Y. An analysis of food accessibility of mountain cities in China: A case study of Chongqing. Appl. Sci. 2022, 12, 3236. [Google Scholar] [CrossRef] [Scilit]
- Recchia, D.; Perignon, M.; Rollet, P.; Bricas, N.; Vonthron, S.; Perrin, C.; Sirieix, L.; Charreire, H.; Méjean, C. Store-specific grocery shopping patterns and their association with objective and perceived retail food environments. Public Health Nutr. 2023, 27, e13. [Google Scholar] [CrossRef] [Scilit] [PubMed]
- Buscemi, J.; O’Donnell, A.; Takgbajouah, M.; Patano, P. A spatial analysis of food insecurity and body mass index with income and grocery store density in a diverse sample of adolescents and young adults. Nutrients 2023, 15, 1435. [Google Scholar] [CrossRef] [Scilit] [PubMed]
- Ware, B.O.; Amin, M.D.; Jessup, E.L.; McCluskey, J.J. Neighborhood racial composition, income, and distance to grocery retailers in Seattle. Agric. Resour. Econ. Rev. 2021, 50, 512–532. [Google Scholar] [CrossRef] [Scilit]
- Li, Y.; Wang, S.; Cao, G.; Li, D.; Ng, B.P. Disentangling racial/ethnic and income disparities of food retail Environments: Impacts on adult obesity prevalence. Appl. Geogr. 2021, 137, 102607. [Google Scholar] [CrossRef] [Scilit]
- Sinclair, W.; Stewart, H. Food Spending as a Share of Income Declines as Income Rises; Economic Research Service, U.S. Department of Agriculture: Washington, DC, USA, 2026. Available online: https://ers.usda.gov/data-products/chart-gallery/58372 (accessed on 21 March 2026).
- Stanley, A.K.; Hadi, Y.; Newbold, D.; Heuvelman, H.; Krige, A. Identifying predictors for food insecurity in England: A cross-sectional database analysis. J. Health Popul. Nutr. 2025, 44, 53. [Google Scholar] [CrossRef] [Scilit] [PubMed]
- Garratt, E.A.; Armstrong, B. Food insecurity and food bank use: Who is most at risk of severe food insecurity and who uses food banks? Public Health Nutr. 2024, 27, e174. [Google Scholar] [CrossRef] [Scilit] [PubMed]
- Zhong, T.; Zhenzhong, S.; Crush, J.; Xu, Z.; Huang, X.; Scott, S.; Tang, S.; Zhang, X. The impact of proximity to wet markets and supermarkets on household dietary diversity in Nanjing City, China. Sustainability 2018, 10, 1465. [Google Scholar] [CrossRef] [Scilit]
- Zhong, S.; Crang, M.; Zeng, G. Constructing freshness: The vitality of wet markets in urban China. Agric. Hum. Values 2020, 37, 175–185. [Google Scholar] [CrossRef] [Scilit]
- Zhong, S.; Werner, C. The hidden strength of small business: Social networks and wet market vendors in China. Econ. Anthropol. 2024, 12, e12323. [Google Scholar] [CrossRef] [Scilit]
- Gerlofs, B.A.; Lucca Iaquinto, B.; Poon, K.Y.N.; Tsang, C.T.Y. Tank to table: Hong Kong’s wet markets and the geographies of lively commodification beyond companionship. Ann. Am. Assoc. Geogr. 2023, 114, 844–862. [Google Scholar] [CrossRef] [Scilit]
- Mele, C.; Ng, M.; Bo, M. Urban markets as a ‘corrective’ to advanced urbanism: The social space of wet markets in contemporary Singapore. Urban Stud. 2015, 52, 103–120. [Google Scholar] [CrossRef] [Scilit]
- Mello, C. Local Food and Power Dynamics in Southeast Grand Rapids, Michigan Local Food and Power Dynamics in Southeast Grand Rapids, Michigan; The University of New Mexico: Albuquerque, NM, USA, 2013; UMI 3601165; Available online: https://digitalrepository.unm.edu/anth_etds/46/ (accessed on 10 May 2025).
- Bodor, J.N.; Rice, J.C.; Farley, T.A.; Swalm, C.M.; Rose, D. The association between obesity and urban food environments. J. Urban Health 2010, 87, 771–781. [Google Scholar] [CrossRef] [Scilit] [PubMed]
- Eisenhauer, E. In poor health: Supermarket redlining and urban nutrition. GeoJournal 2001, 53, 125–133. [Google Scholar] [CrossRef] [Scilit]
- Community Housing Transformation Centre. Reinforcing Black Canadian Communities Through Housing Transformation. 13 February 2023. Available online: https://centre.support/reinforcing-black-canadian-communities-through-housing-transformation/ (accessed on 18 May 2025).
- Hilliard, C. Housing and peripheralization of race politics in Britain, 1948–1977. Past Present 2025, 272, 242–278. [Google Scholar] [CrossRef]
- Warren, J.L.; Gordon-Larsen, P. Factors associated with supermarket and convenience store closure: A discrete time spatial survival modelling approach. J. R. Stat. Soc. Ser. A Stat. Soc. 2017, 181, 783–802. [Google Scholar] [CrossRef] [Scilit] [PubMed]
- Amin, M.D.; Badruddoza, S. The evolving retail landscape: Food store closures and market dynamics. J. Nutr. Educ. Behav. 2025, 57, S90. [Google Scholar] [CrossRef] [Scilit]
- Engler-Stringer, R.; Fuller, D.; Abeykoon, A.M.H.; Olauson, C.; Muhajarine, N. An examinaiton of failed grocery store interventions in former food deserts. Health Educ. Behav. 2019, 46, 749–754. [Google Scholar] [CrossRef] [Scilit] [PubMed]
- Taylor, D.E.; Wright, T.; Ortiz, I.; Surdoval, A.; McCoy, E.D.; Daupan, S.M. Rising food insecurity and the impacts of the COVID-19 pandemic on emergency food assistance in Michigan. J. Agric. Food Syst. Community Dev. 2022, 11, 27–55. [Google Scholar] [CrossRef] [Scilit]
- Liang, Y.; Li, Z.; Peng, K.; Wang, Z. The death of neighborhood food outlets: Untangling spatial determinants of food retail environment vulnerability via interpretable machine learning. Appl. Geogr. 2025, 182, 103700. [Google Scholar] [CrossRef] [Scilit]
- Cho, W.; Kwon, Y.; Sik Jeong, K.; Yang, J. Survival characteristics of food and beverage businesses in a gentrified commercial area—A case study in Seoul, Korea. Heliyon 2023, 9, e21514. [Google Scholar] [CrossRef] [Scilit] [PubMed]
- Barnes, T.L.; Freedman, D.A.; Bell, B.A.; Colabianchi, N.; Liese, A.D. Geographic measures of retail food outlets and perceived availability of healthy foods in neighbourhoods. Public Health Nutr. 2015, 19, 1368–1374. [Google Scholar] [CrossRef] [Scilit] [PubMed]
- Rose, D.J. Captive audience? Strategies for acquiring food in two Detroit neighborhoods. Qual. Health Res. 2011, 21, 642–651. [Google Scholar] [CrossRef] [Scilit] [PubMed]
- Caspi, C.E.; Lenk, K.; Pelletier, J.E.; Barnes, T.L.; Harnack, L.; Erickson, D.J.; Laska, M.N. Association between store food environment and customer purchases in small grocery stores, gas-marts, pharmacies and dollar stores. Int. J. Behav. Nutr. Phys. Act. 2017, 14, 76. [Google Scholar] [CrossRef] [Scilit] [PubMed]
- Martin, K.S.; Havens, E.; Boyle, K.E.; Matthews, G.; Schilling, E.A.; Harel, O.; Ferris, A.M. If you stock it, will they buy it? Healthy food availability and customer purchasing behaviour within corner stores in Hartford, CT, USA. Public Health Nutr. 2012, 15, 1973–1978. [Google Scholar] [CrossRef] [Scilit] [PubMed]
- Krieg, A.; Neiger, C. Differential access to food outlets in Chicago. J. Urban Aff. 2024, 48, 570–590. [Google Scholar] [CrossRef] [Scilit]
- Moore, L.V.; Diez Roux, A.V. Associations of Neighborhood Characteristics with the Location and Type of Food Stores. Am. J. Public Health 2006, 27, 211–217. [Google Scholar] [CrossRef] [Scilit] [PubMed]
- Larsen, K.; Gilliland, J. Mapping the evolution of ‘food deserts’ in a Canadian city: Supermarket accessibility in London, Ontario, 1961-2005. Int. J. Health Geogr. 2008, 18, 16. [Google Scholar] [CrossRef] [Scilit] [PubMed]
- Smoyer-Tomic, K.E.; Spence, J.C.; Amrhein, C. Food deserts in the prairies? Supermarket accessibility and neighborhood need in Edmonton, Canada. Prof. Geogr. 2006, 58, 307–326. [Google Scholar] [CrossRef] [Scilit]
- Apparicio, P.; Cloutier, M.S.; Shearmur, R. The case of Montréal’s missing food deserts: Evaluation of accessibility to food supermarkets. Int. J. Health Geogr. 2007, 6, 4. [Google Scholar] [CrossRef] [Scilit] [PubMed]
- Pearson, T.; Russell, J.; Campbell, M.J.; Barker, M.E. Do ‘food deserts’ influence fruit and vegetable consumption? A cross-sectional study. Appetite 2005, 45, 195–197. [Google Scholar] [CrossRef] [Scilit] [PubMed]
- Donkin, A.J.; Dowler, E.A.; Stevenson, S.J.; Turner, S.A. Mapping access to food at a local level. Br. Food J. 1999, 101, 554–564. [Google Scholar] [CrossRef] [Scilit]
- Wrigley, N. Food deserts in British cities: Policy context and research priorities. Urban Stud. 2002, 39, 2029–2040. [Google Scholar] [CrossRef] [Scilit]
- Cummins, S.; Macintyre, S. A systematic study of an urban foodscape: The price and availability of food in Greater Glasgow. Urban Stud. 2002, 39, 2115–2130. [Google Scholar] [CrossRef] [Scilit]
- Cummins, S.; Macintyre, S. The location of food stores in urban areas: A case study in Glasgow. Br. Food J. 1999, 101, 545–553. [Google Scholar] [CrossRef] [Scilit]
- Clarke, G.; Eyre, H.; Guy, C. Deriving indicators of access to food retail provision in British cities: Studies of Cardiff, Leeds and Bradford. Urban Stud. 2002, 39, 2041–2060. [Google Scholar] [CrossRef] [Scilit]
- Pool, U.; Dooris, M. Prevalence of food security in the UK measured by the Food Insecurity Experience Scale. J. Public Health 2022, 44, 634–641. [Google Scholar] [CrossRef] [Scilit] [PubMed]
- Vandroux, R.; Wolff, F. Poor health and food insecurity among food assistance recipients: Evidence from France. Food Policy 2025, 134, 102895. [Google Scholar] [CrossRef] [Scilit]
- Berti, F.; Valzania, A. Less state and more solidarity shops: The Italian method to combat food poverty. Front. Sustain. Food Syst. 2025, 9, 1596425. [Google Scholar] [CrossRef] [Scilit]
- Oncini, F. Anything but hard discount: Storevorousness and the social stratification of grocery shopping venues in Italy (2014–2022). J. Consum. Cult. 2026. [Google Scholar] [CrossRef] [Scilit]
- Marino, D.; Bernaschi, D.; Felici, F.B. How does food accessibility shape the city food landscape? Socio-Economic inequalities in the metropolitan region of Rome. Land 2026, 15, 214. [Google Scholar] [CrossRef] [Scilit]
- Summerhayes, L.; Baker, D.; Vella, K. Food diversity and accessibility enabled urban environments for sustainable food consumption: A case study of Brisbane, Australia. Humanit. Soc. Sci. Commun. 2024, 11, 1227. [Google Scholar] [CrossRef] [Scilit]
- Burns, C.M.; Inglis, A.D. Measuring food access in Melbourne: Access to healthy and fast foods by car, bus and foot in an urban municipality in Melbourne. Health Place 2007, 13, 877–885. [Google Scholar] [CrossRef] [Scilit] [PubMed]
- Pearce, J.; Blakely, T.; Witten, K.; Bartie, P. Neighborhood deprivation and access to fast-food retailing: A national study. Am. J. Prev. Med. 2007, 32, 375–382. [Google Scholar] [CrossRef] [Scilit] [PubMed]
- Kim, K.; Kim, M.K.; Shin, Y.J. The concept and measurement of food security. J. Prev. Med. Public Health 2008, 41, 387–396. [Google Scholar] [CrossRef] [Scilit] [PubMed]
- Murakami, K.; Sasaki, S.; Takahashi, Y.; Uenishi, K. Japan Dietetic Students’ Study for Nutrition and Biomarkers Group. Neighborhood food store availability in relation to food intake in young Japanese women. Nutrition 2009, 25, 640–646. [Google Scholar] [CrossRef] [Scilit] [PubMed]
- Reyes-Puente, A.L.; Peña-Portilla, D.G.; Alcalá-Reyes, S.; Rodríguez-Bustos, L.; Núñez, J.M. Changes in food environment patterns in the metropolitan area of the Valley of Mexico, 2010–2020. Int. J. Env. Res. Public Health 2022, 19, 8960. [Google Scholar] [CrossRef] [Scilit] [PubMed]
- de Oliveira, R.T.; de Castro Junior, P.C.P.; Suéte Matos, Y.A.C.; Ferreira, A.A.; Salles-Costa, R. Food acquisition locations and food groups acquired according to levels of food insecurity in Brazil. Int. J. Environ. Res. Public Health 2024, 21, 1577. [Google Scholar] [CrossRef] [Scilit] [PubMed]
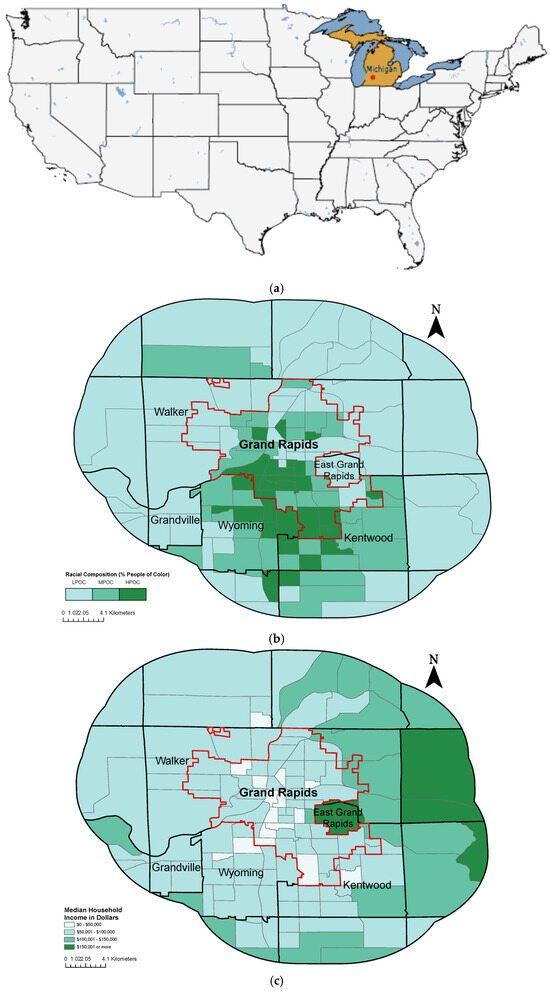
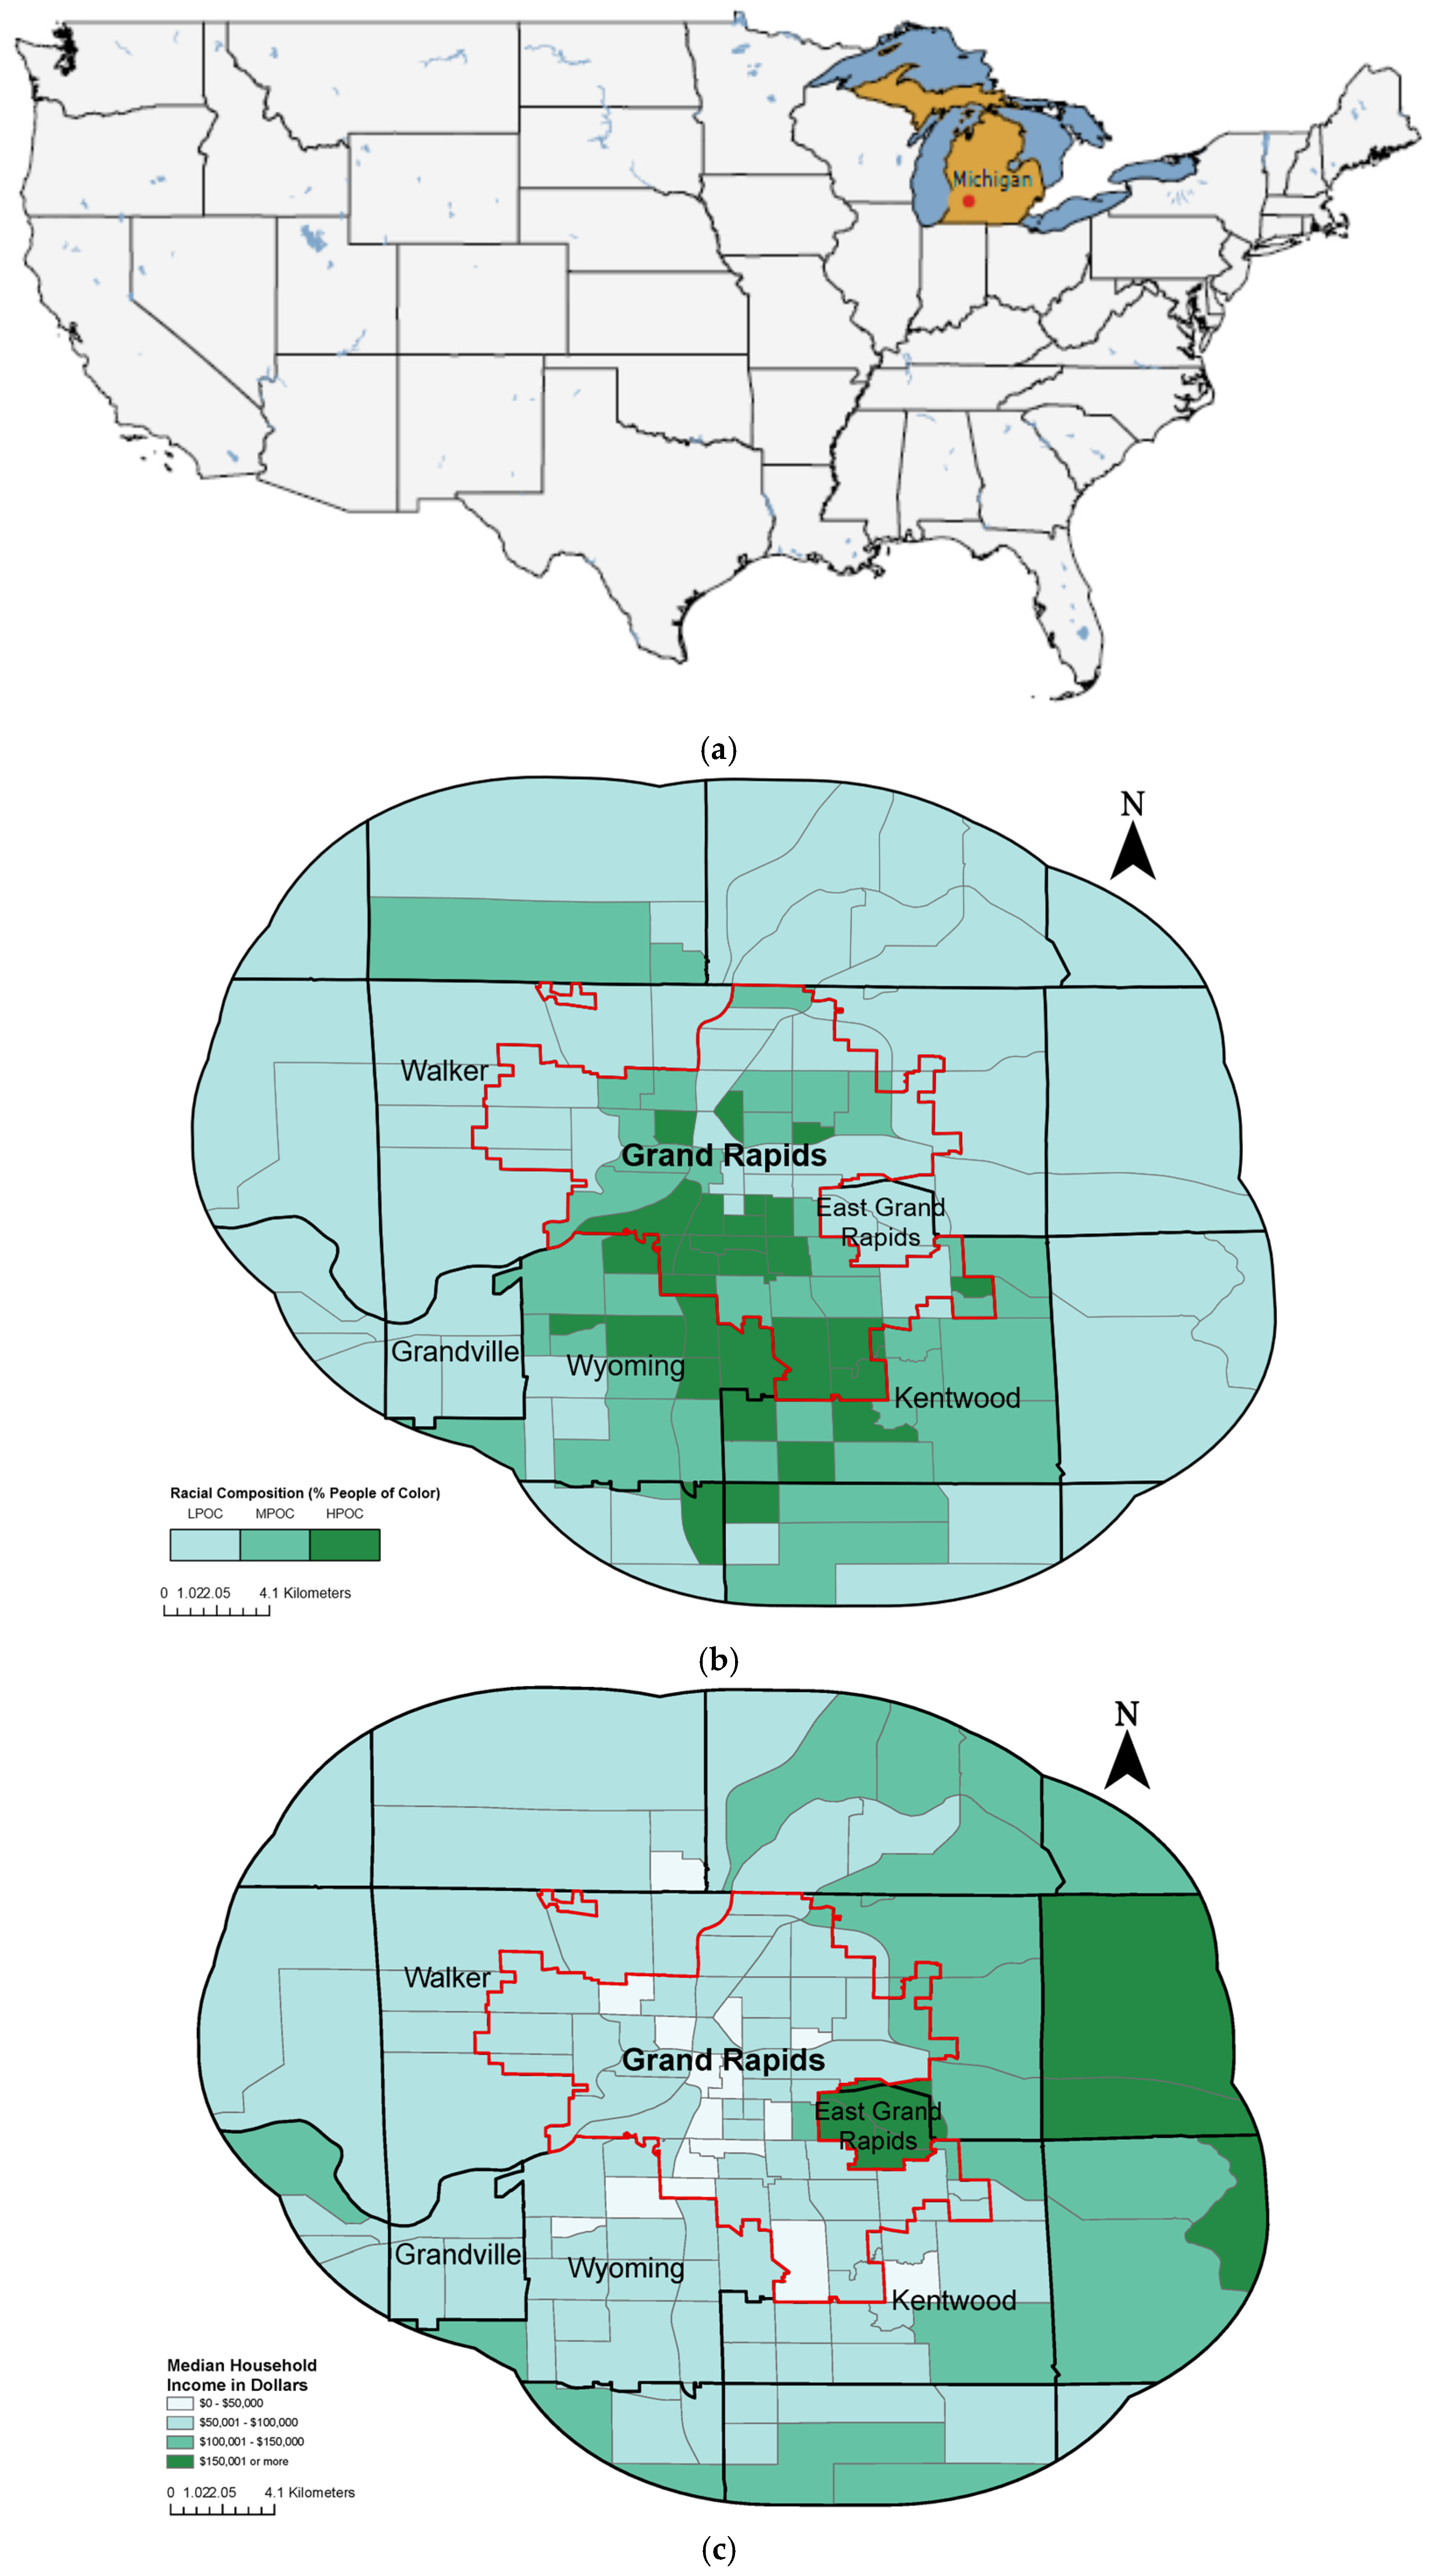
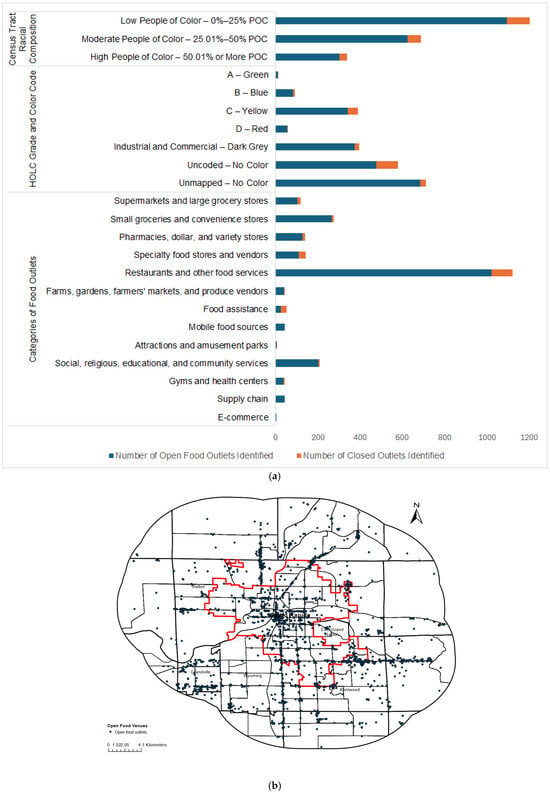
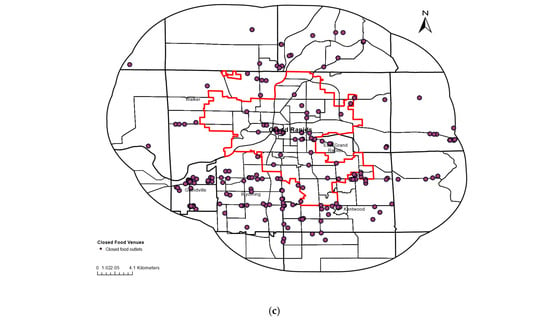
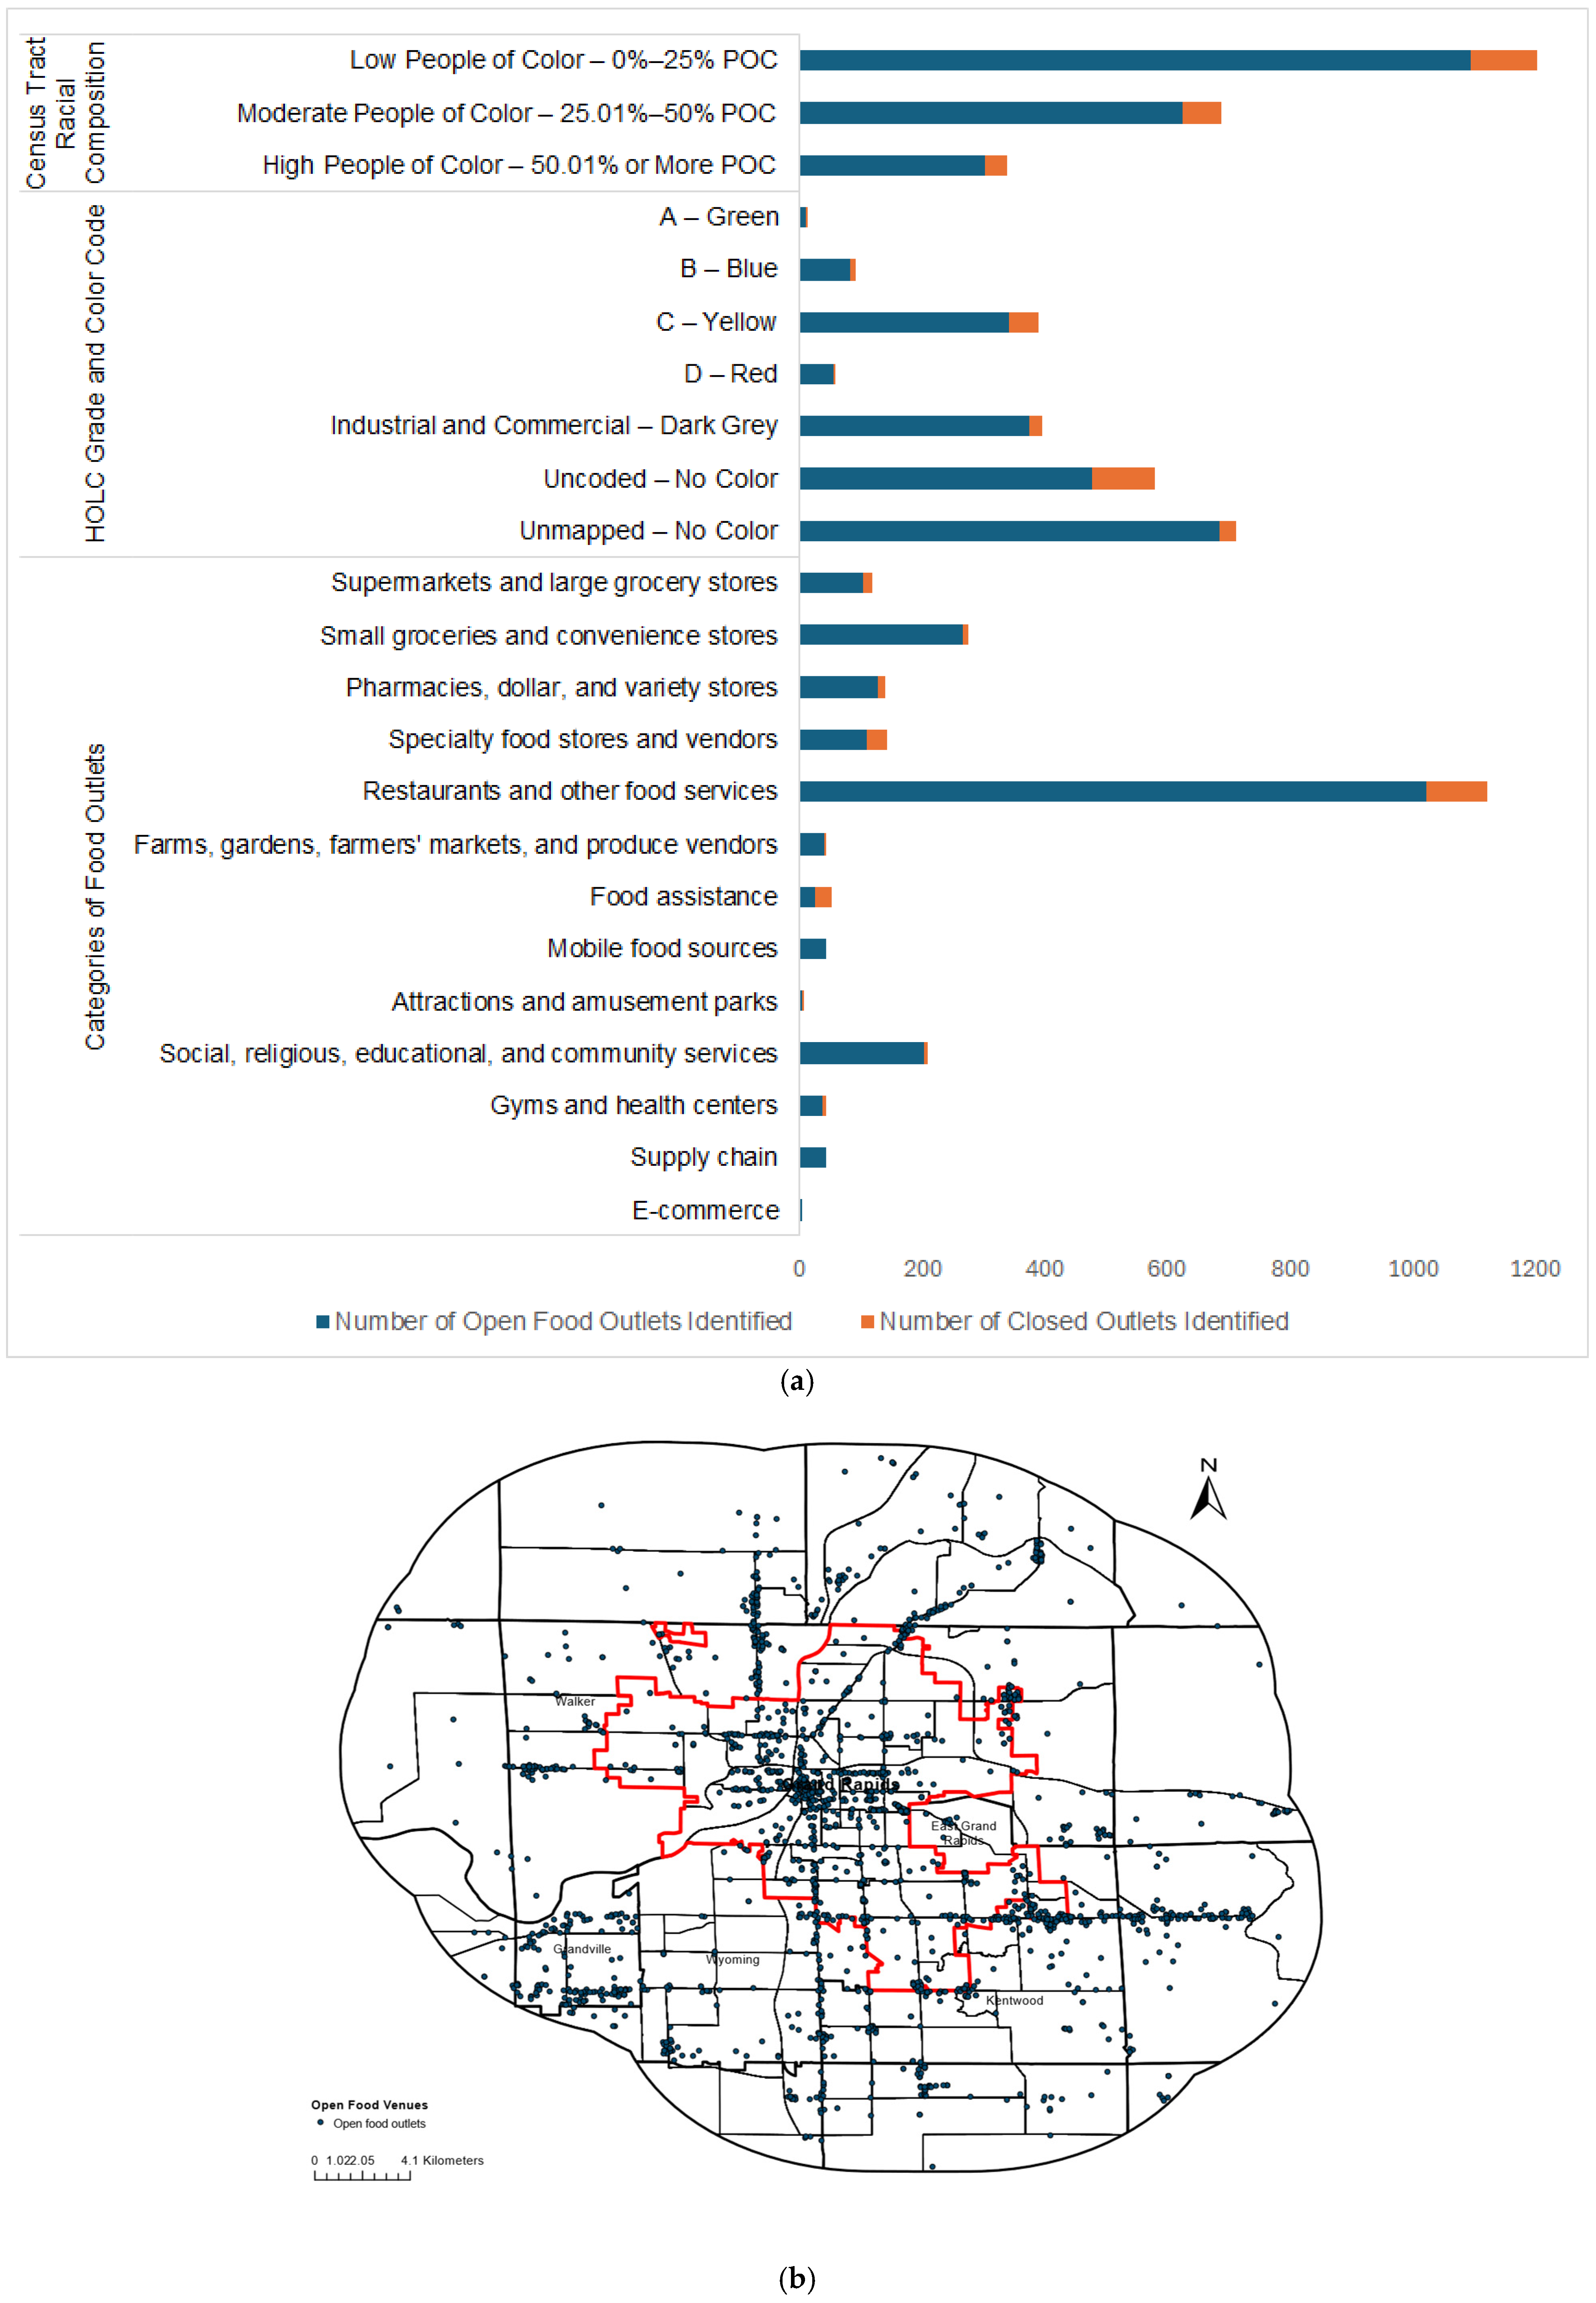
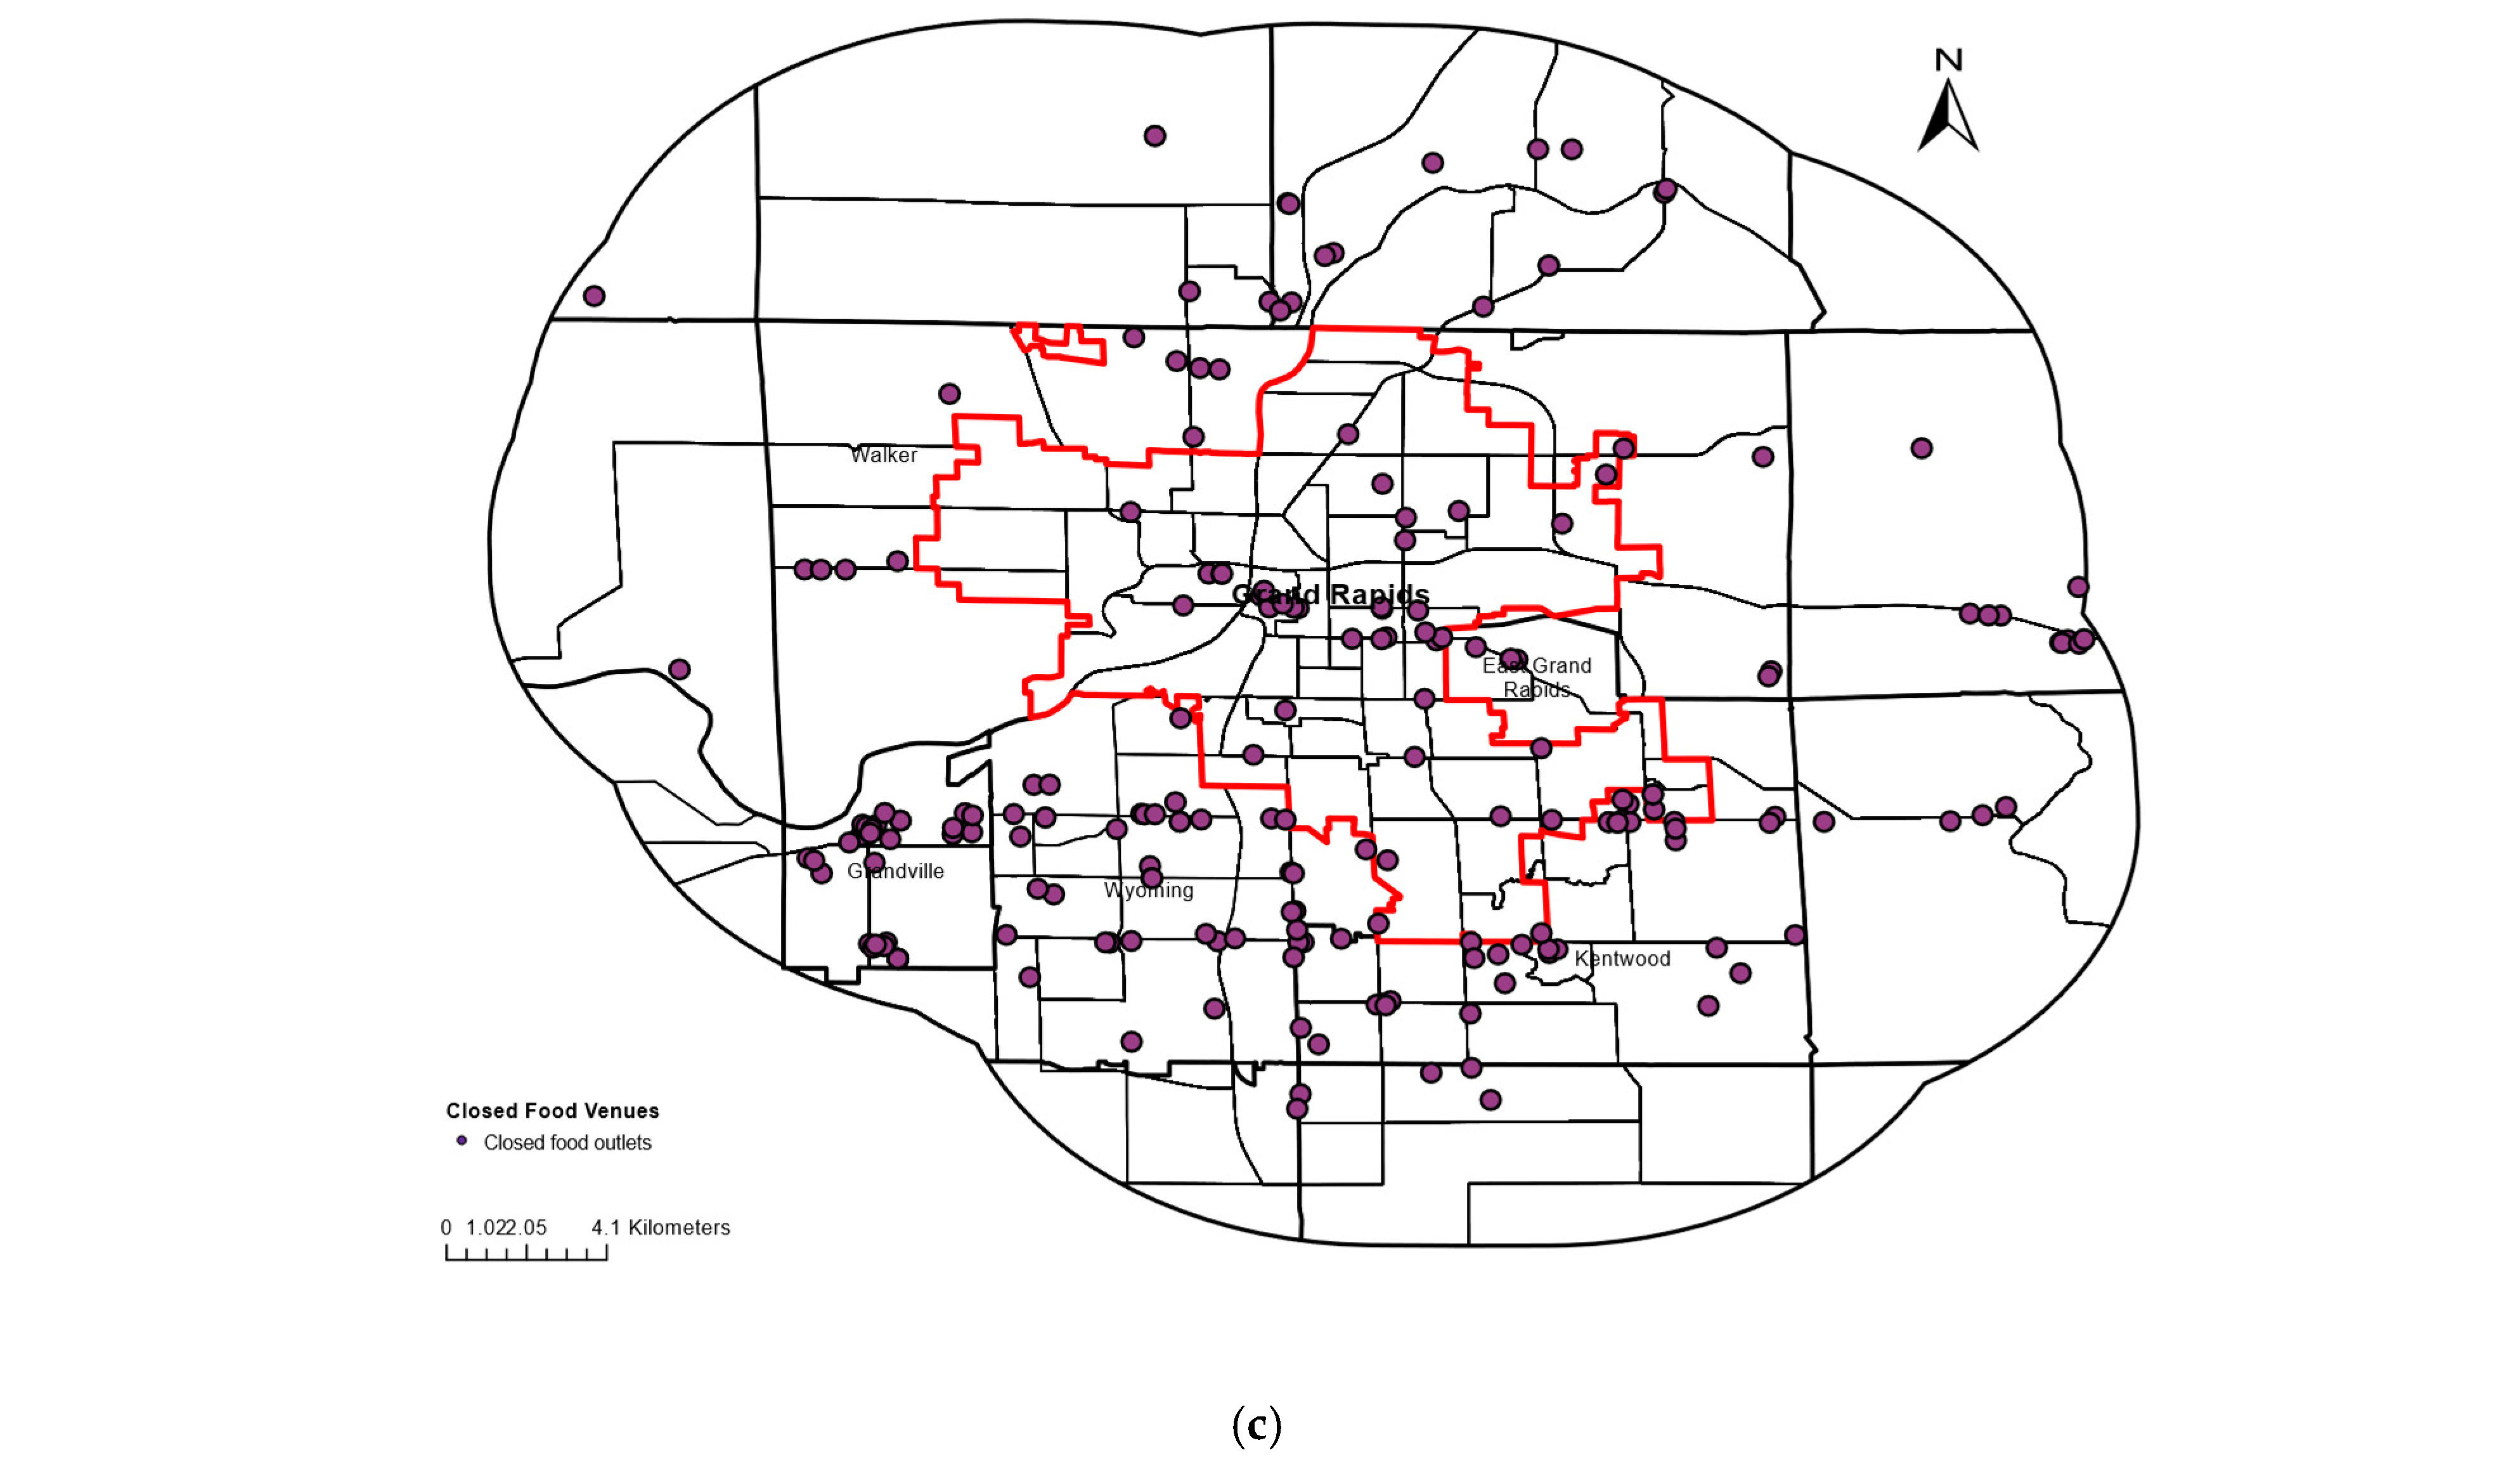
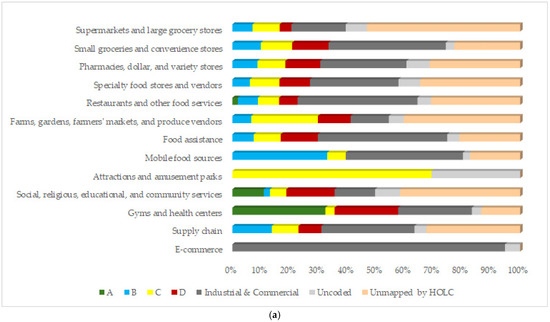
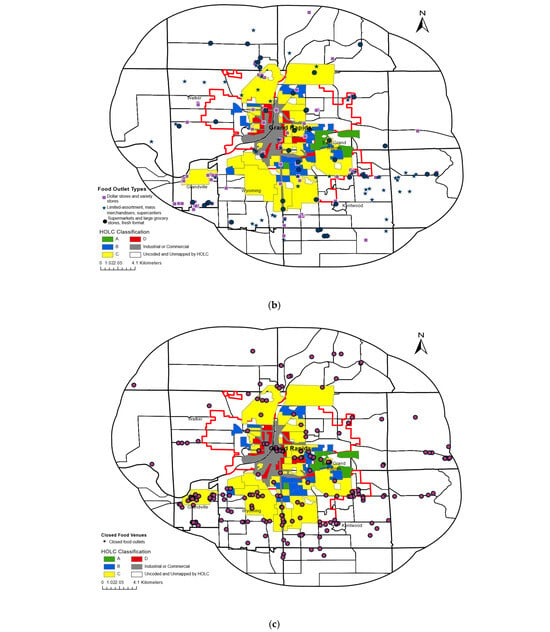
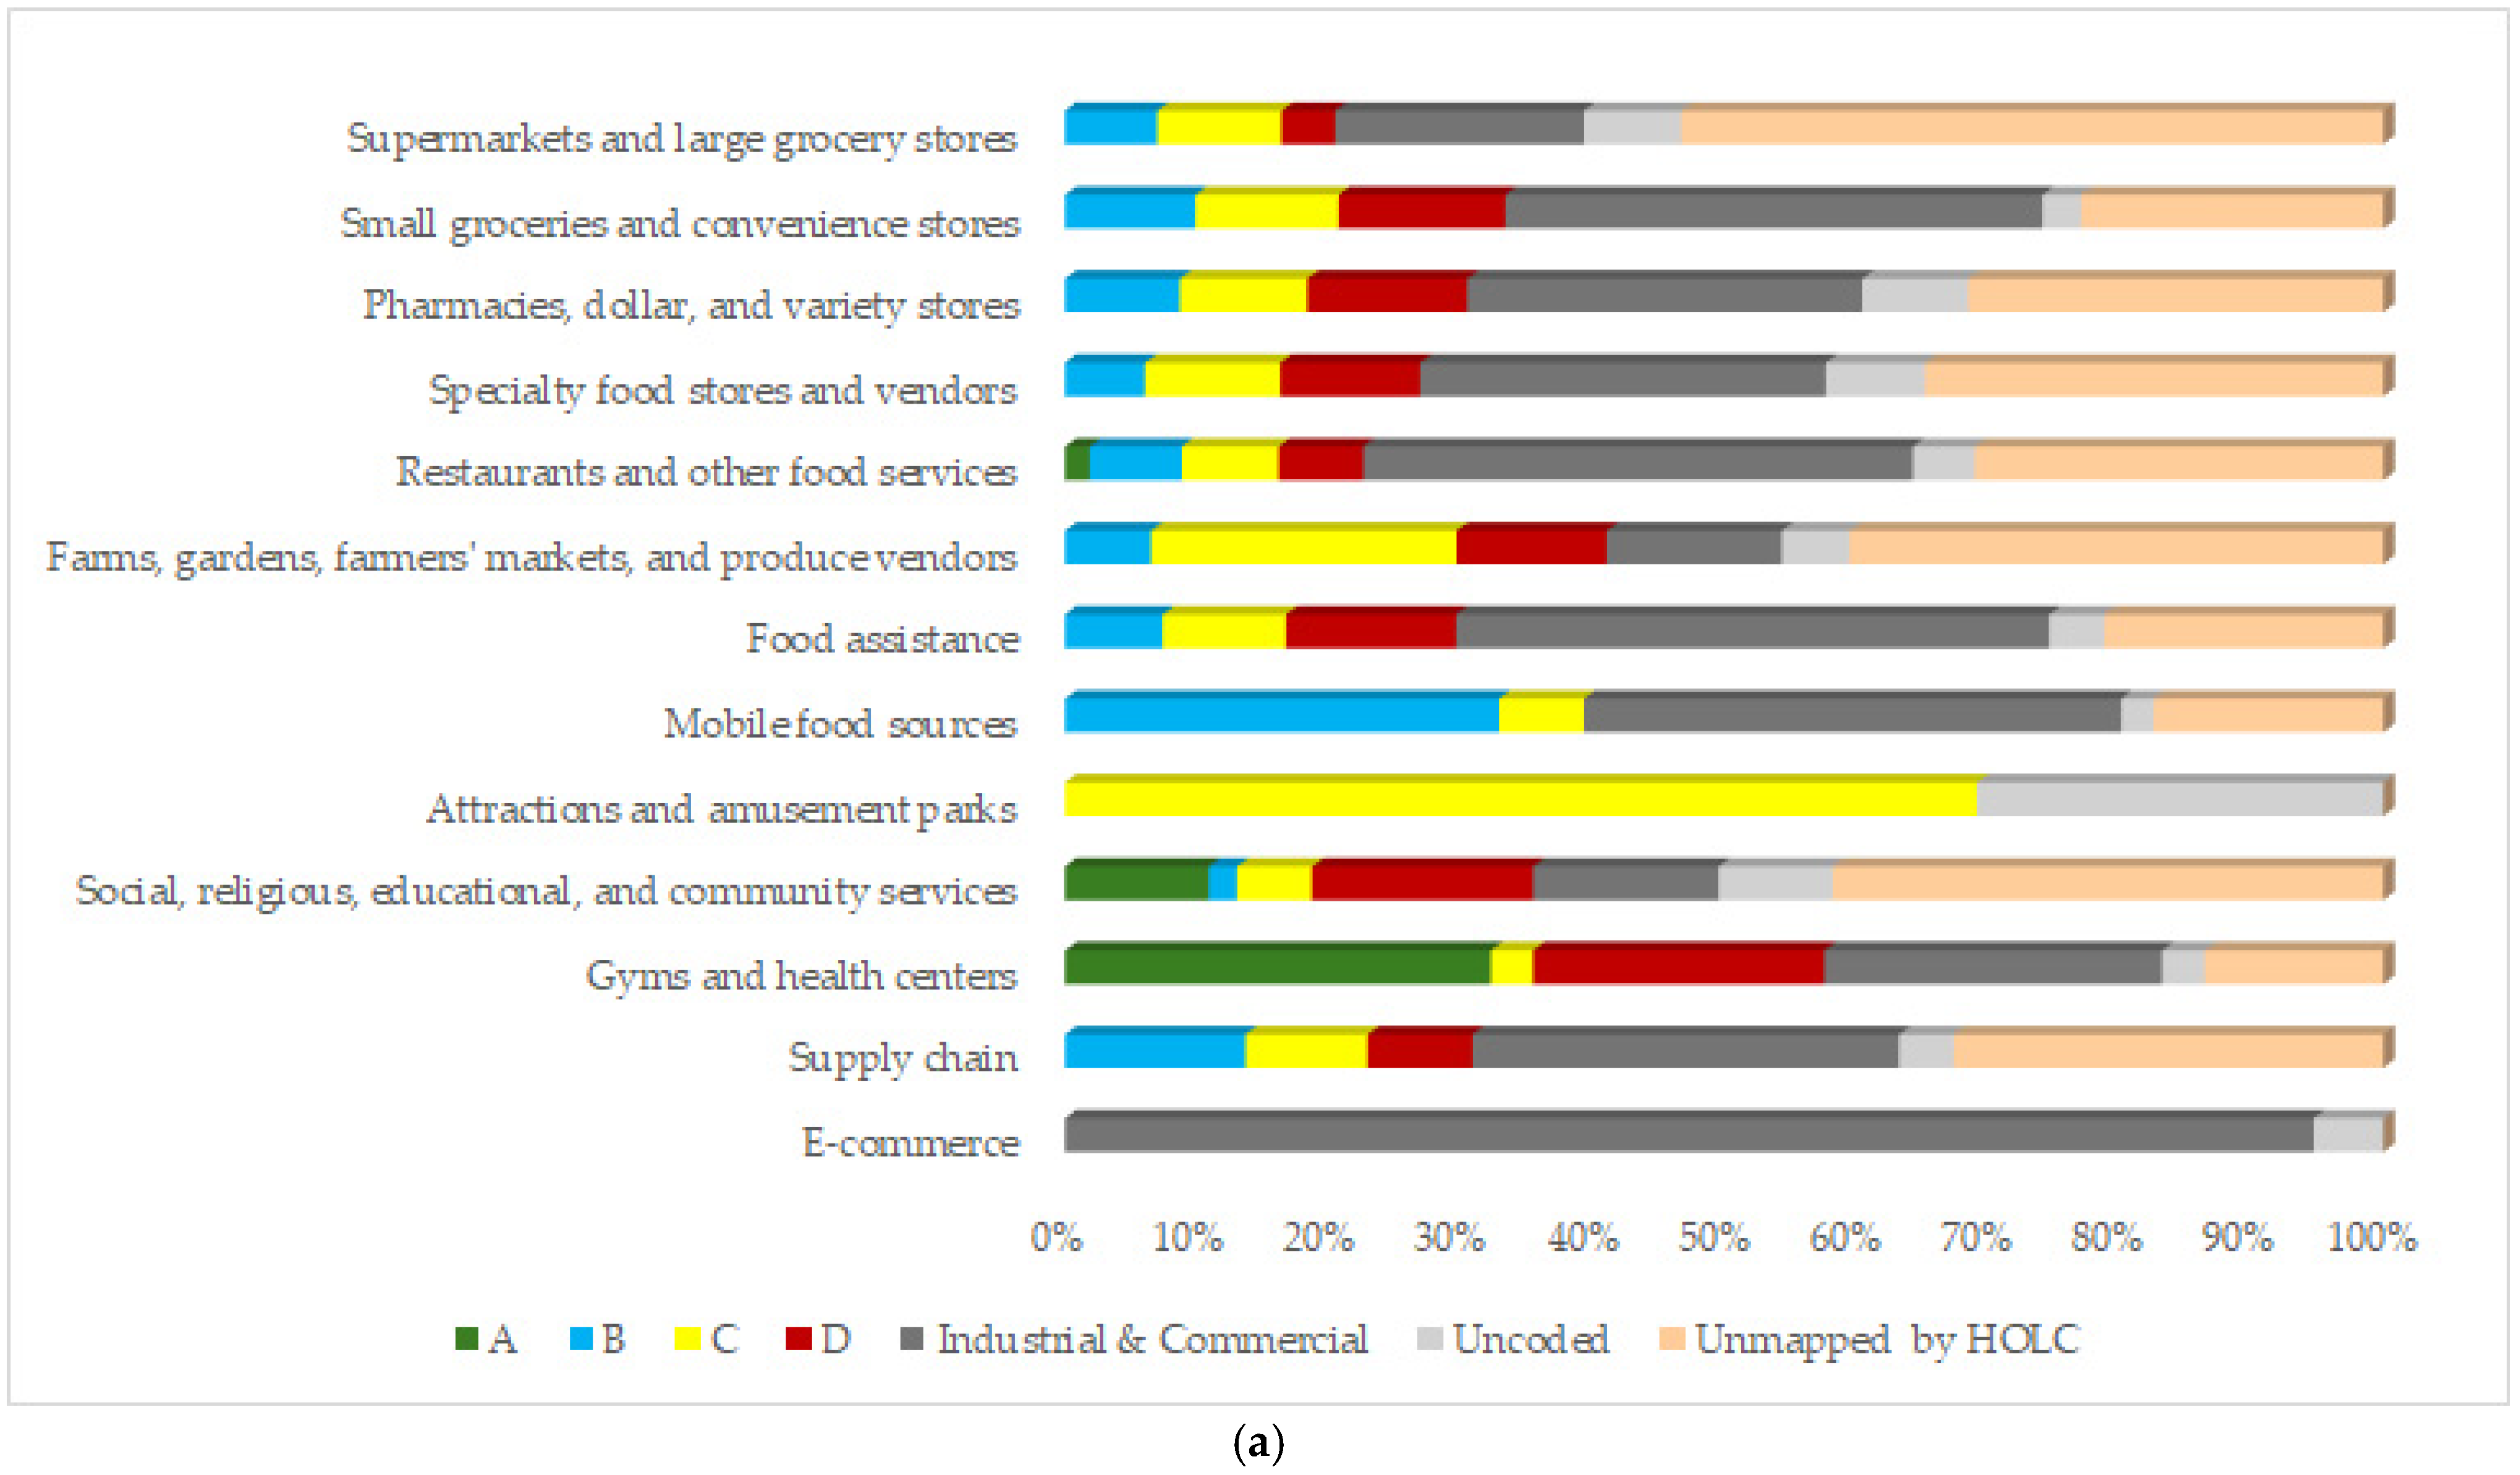
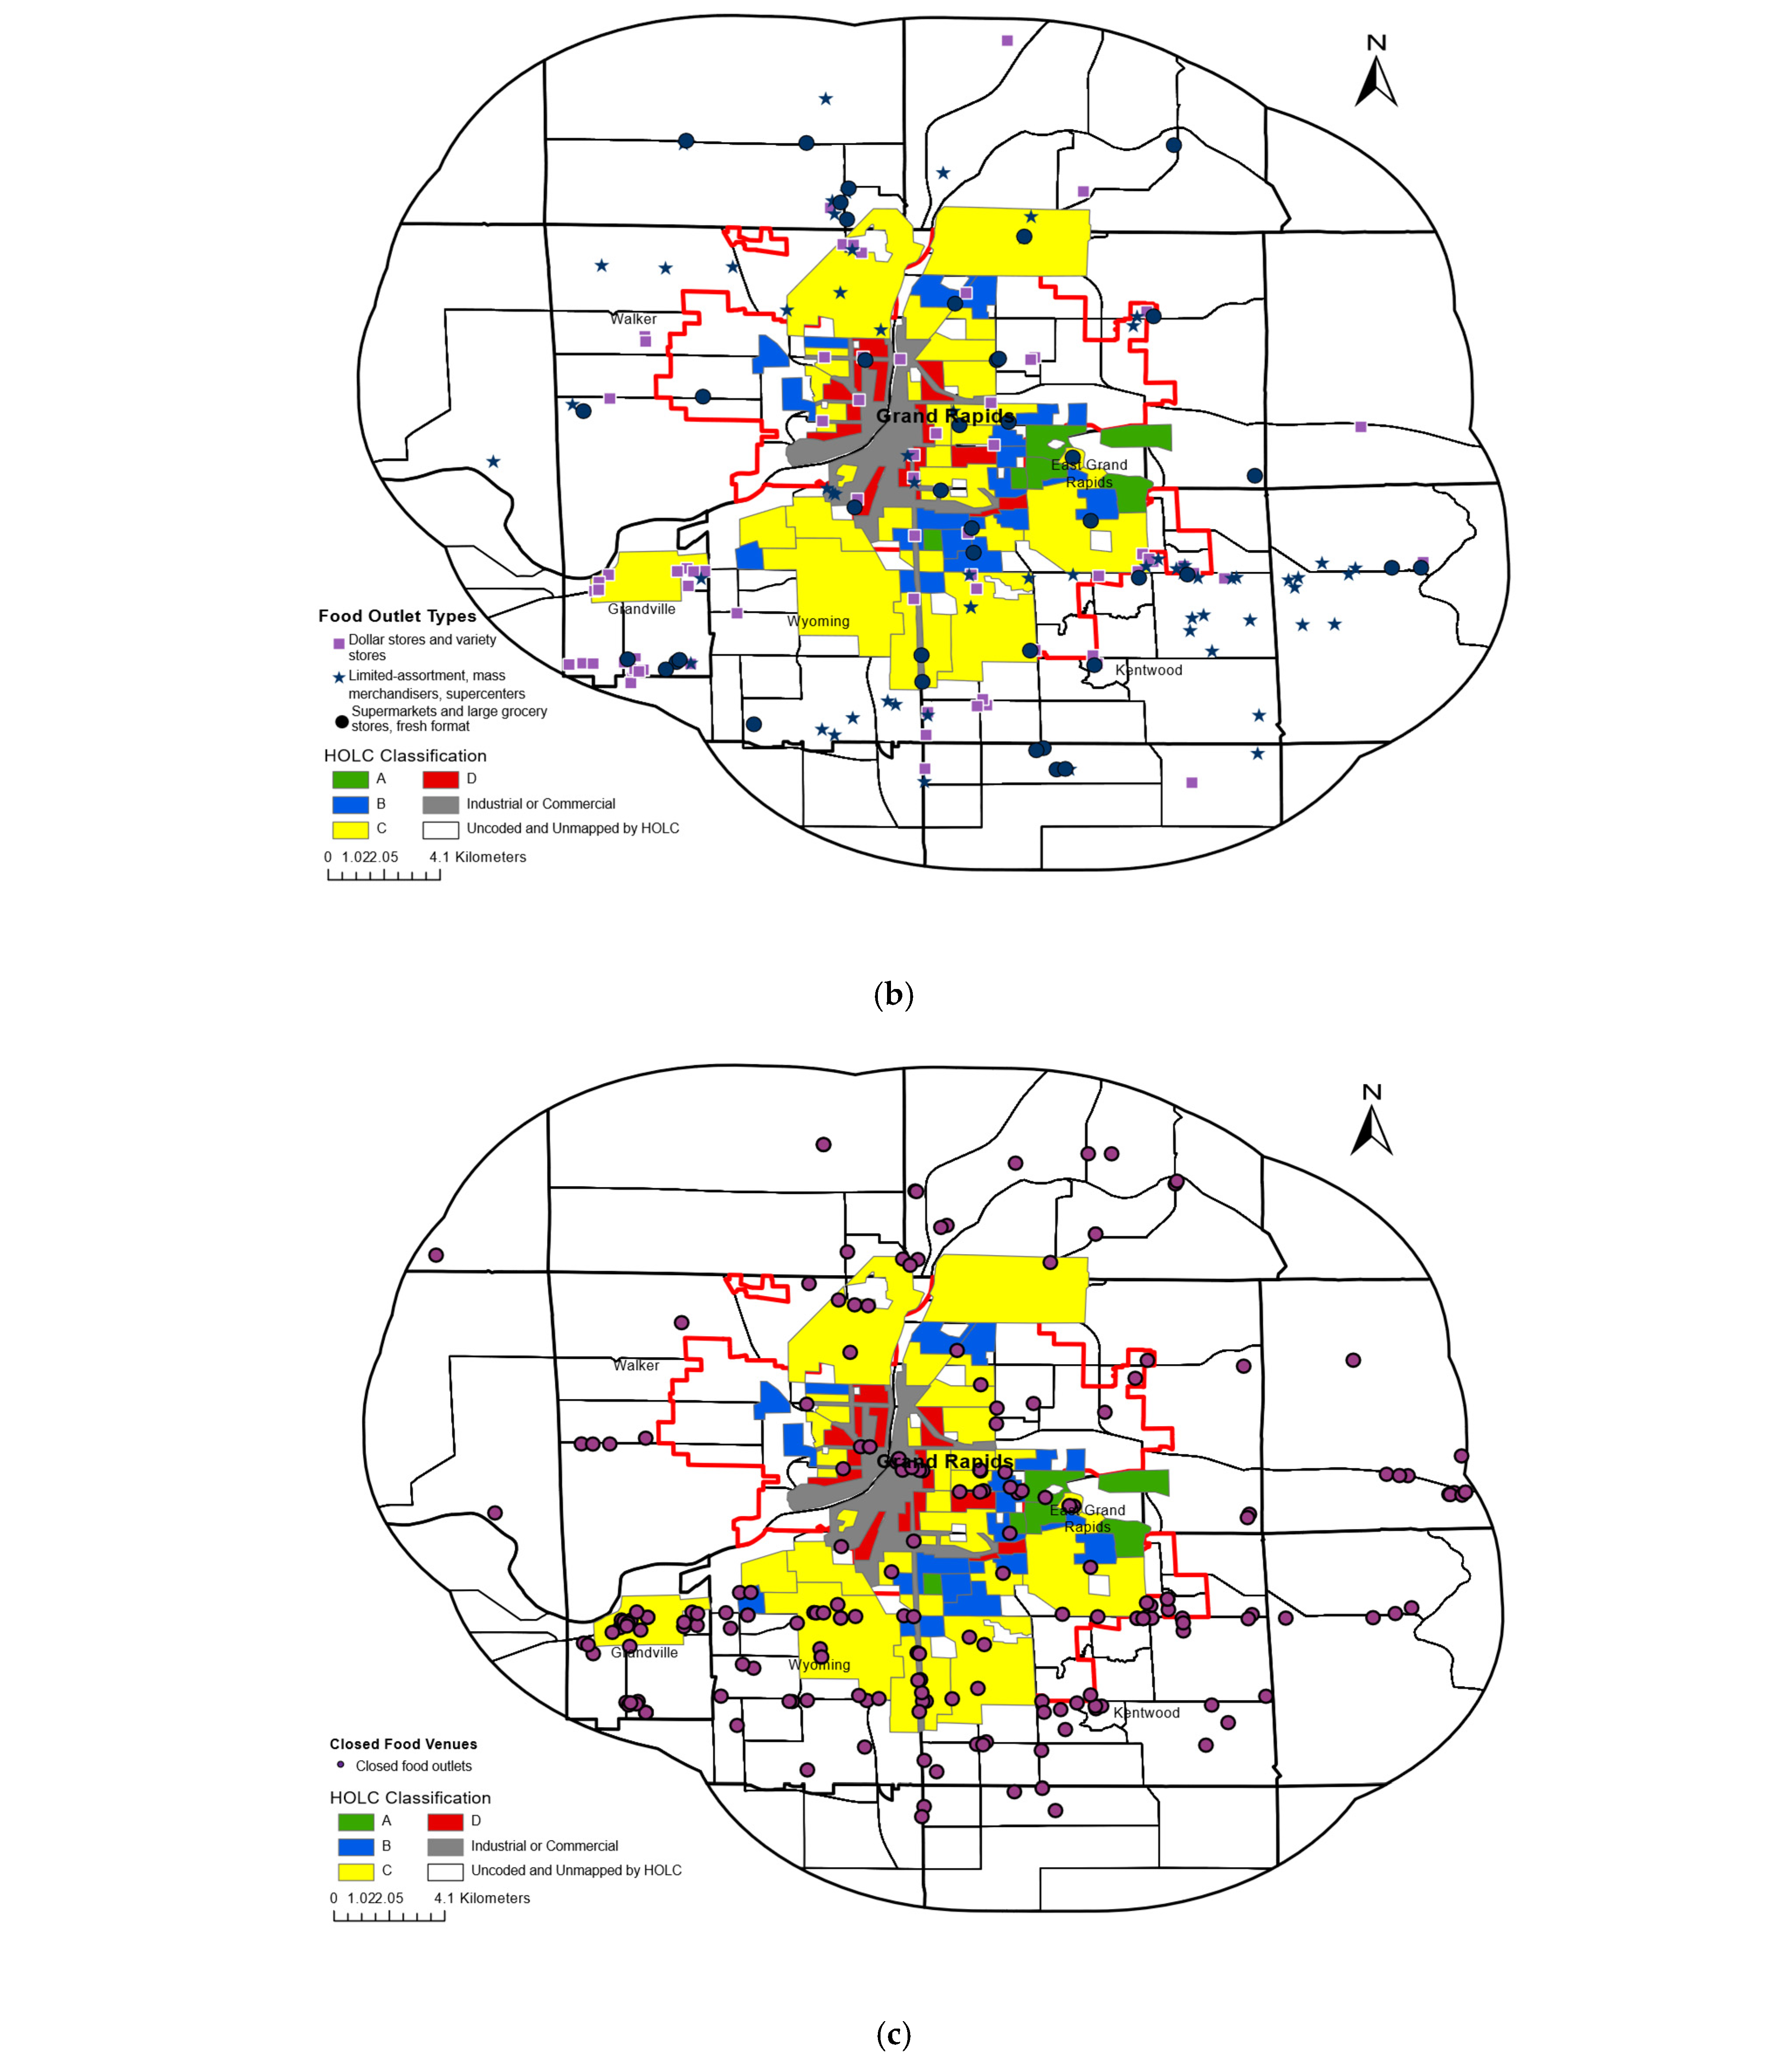
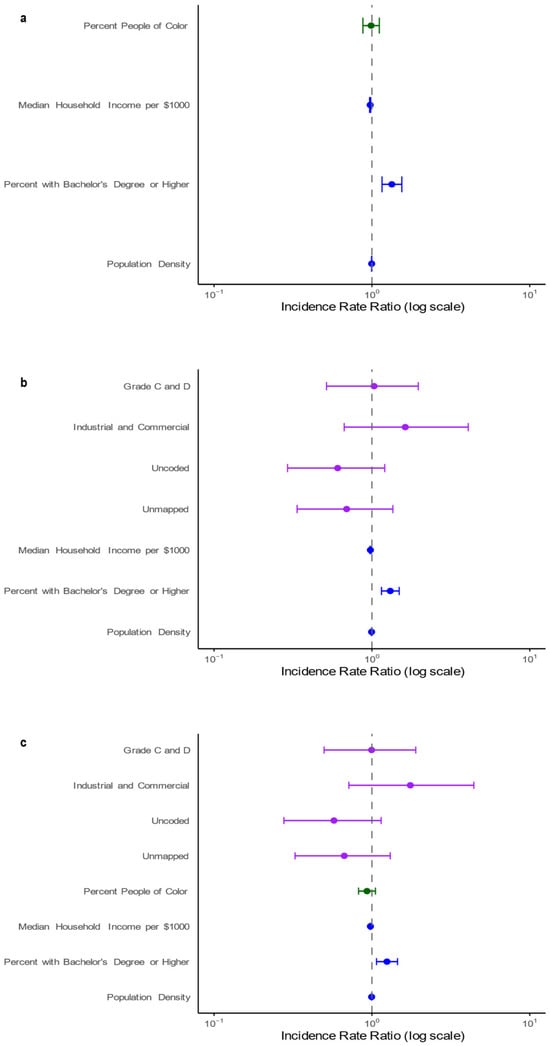
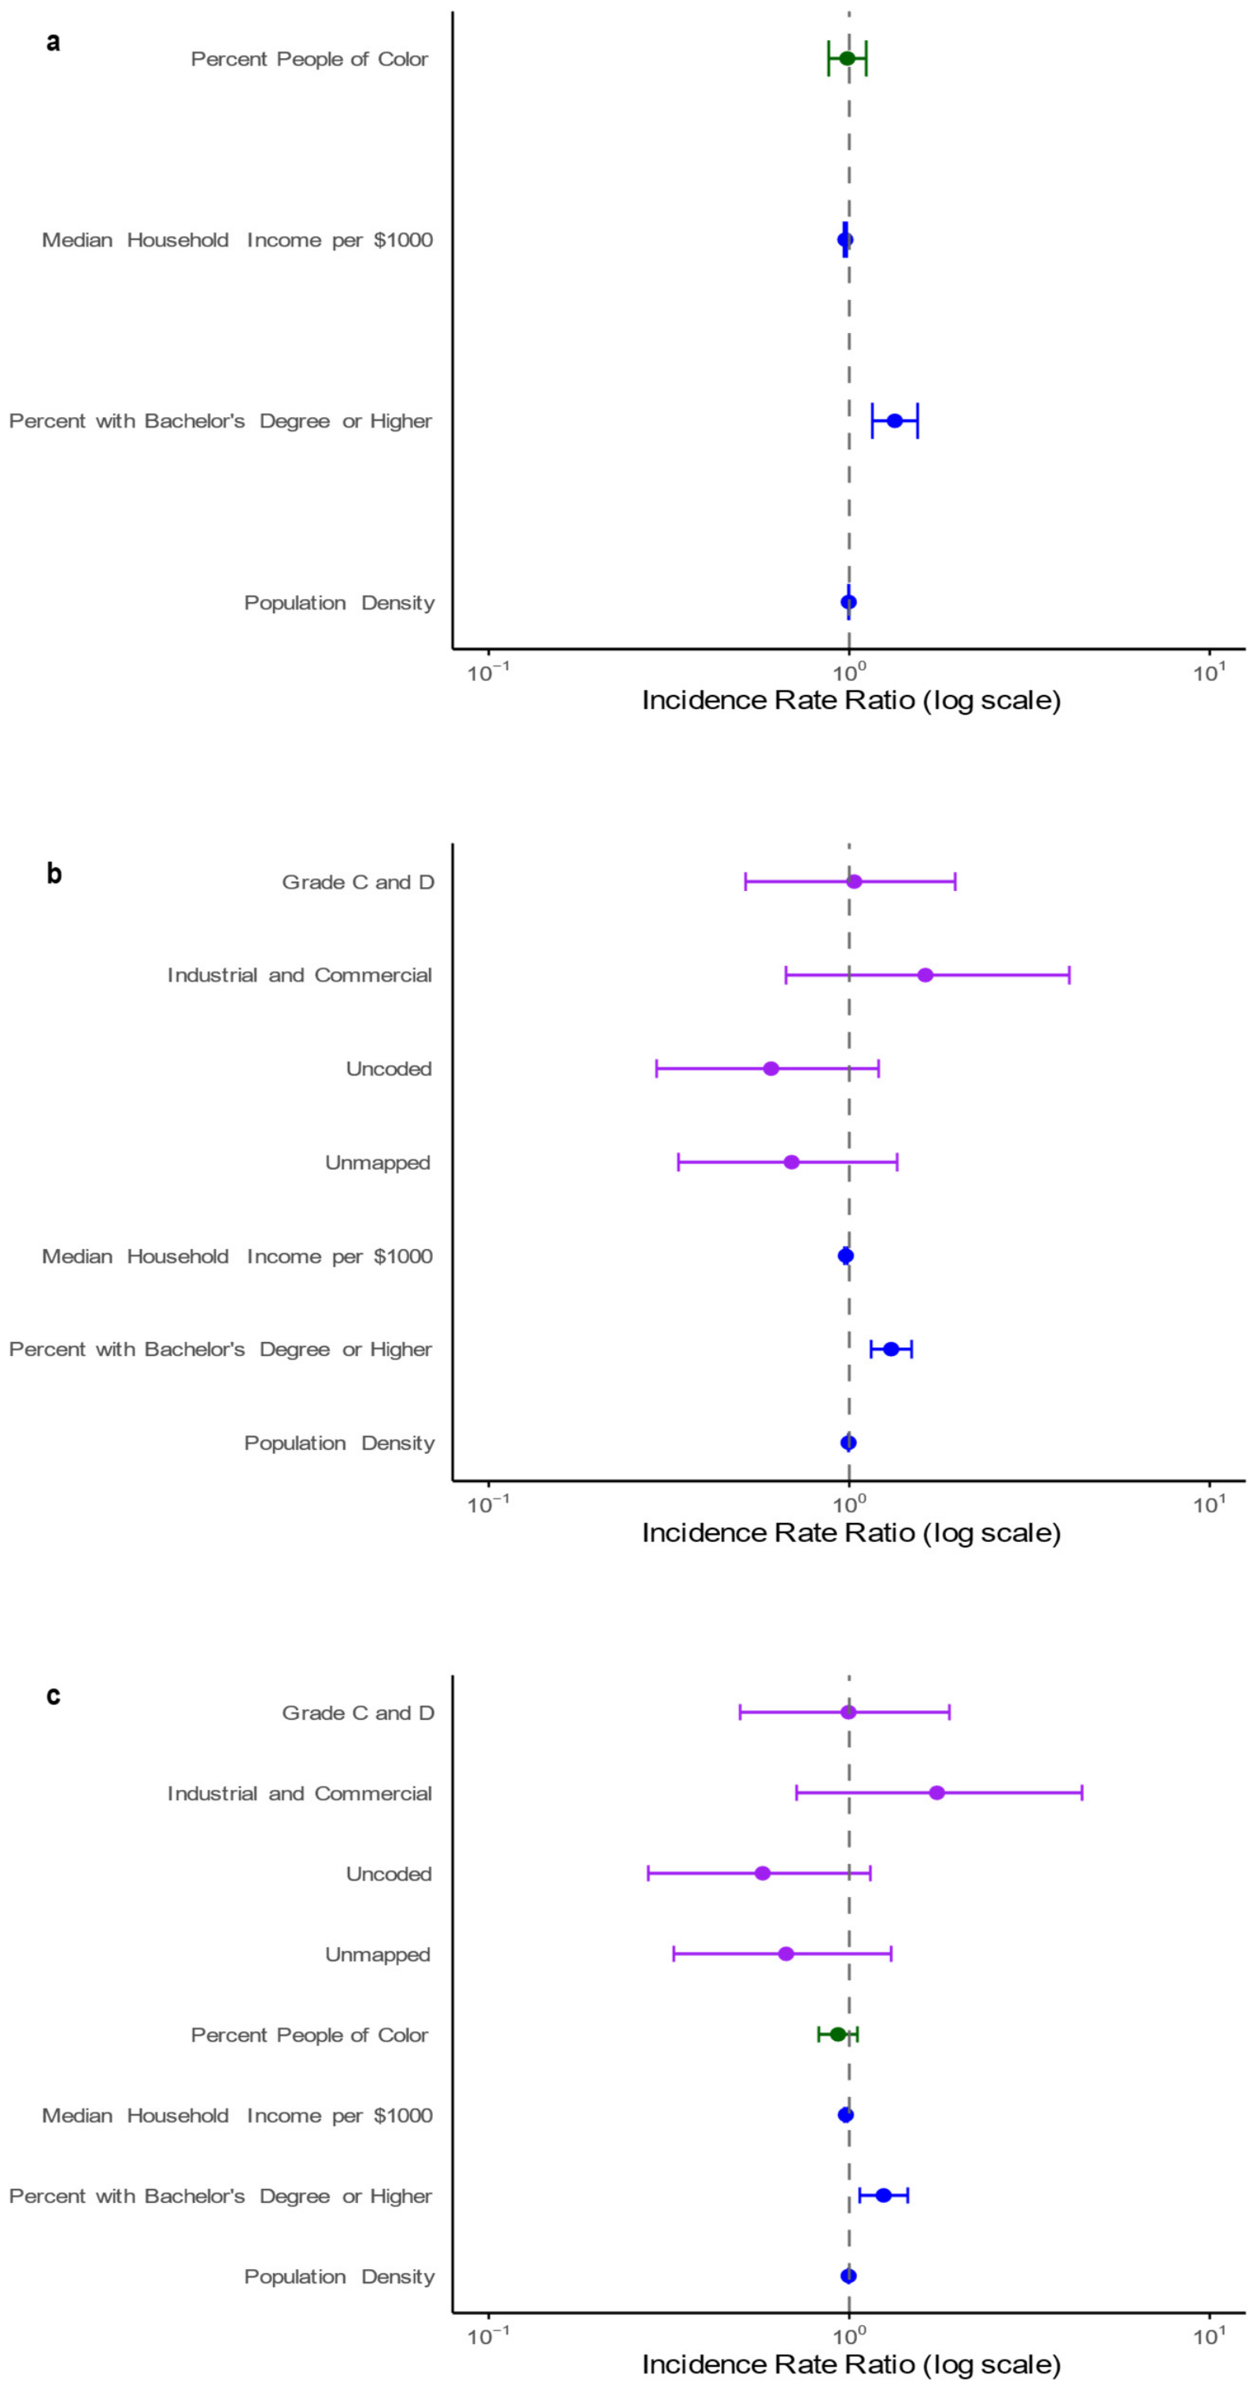

Disclaimer/Publisher’s Note: The statements, opinions and data contained in all publications are solely those of the individual author(s) and contributor(s) and not of MDPI and/or the editor(s). MDPI and/or the editor(s) disclaim responsibility for any injury to people or property resulting from any ideas, methods, instructions or products referred to in the content. |
© 2026 by the authors. Licensee MDPI, Basel, Switzerland. This article is an open access article distributed under the terms and conditions of the Creative Commons Attribution (CC BY) license.