


Abstract
The escalating global contradiction between water supply and demand has imposed novel imperatives on regional water security within the paradigm of resilient city development. To elucidate the supply–demand dynamics of water provisioning services under heterogeneous institutional contexts, this study selected the Guangdong–Hong Kong–Macao (GHKM) region as the empirical study area. Employing the Integrated Valuation of Ecosystem Services and Trade-offs (InVEST) model, we coupled meteorological, land-use/land-cover (LULC), and pedological data to quantify the provisioning of water yield services in 2024. Concurrently, sector-specific water demands—encompassing agricultural, industrial, domestic, and ecological categories—were accounted for using statistical yearbooks. Subsequently, a Supply–Demand Index (SDI) was formulated to delineate the spatial matching patterns. The findings reveal pronounced spatial heterogeneity in water service provisioning; high-value zones are predominantly aggregated along the western and southern coastal belts, whereas low-value zones are dispersed across the northern mountainous terrains. Based on the SDI classification, the study area comprises 12 supply-surplus, 6 supply–demand-equilibrium, and 5 supply-deficit administrative units. Notably, the northern Guangdong mountainous region assumes a critical ecological role in water conservation, whereas the core megalopolises of the Pearl River Delta exhibit an acute dependency on extrinsic water subsidies, with Macao demonstrating a distinct ecological deficit in water provisioning. Furthermore, this study uncovers the overestimation artifact of water yield estimations over urban impervious surfaces, thereby providing a robust empirical foundation for the cross-regional synergistic governance and adaptive management of water resources.
1. Introduction
1.1. Research Background
Water resources constitute foundational natural resources and strategic assets essential for sustainable socio-economic development. Since the Industrial Revolution, rapid population growth, economic expansion, climate change, and land use/land cover (LULC) changes have intensified pressure on global water systems, resulting in increasingly prominent water supply–demand imbalances. Global domestic and industrial water consumption increased from approximately 300 km3/year in 1950 to 1345 km3/year in 2010 [1], and nearly 4 billion people experience severe water scarcity for at least one month annually [2]. Climate change and human interventions, including dam construction and water abstraction, further alter hydrological processes and increase uncertainty in regional water availability [3,4]. Consequently, water yield services, as an important ecosystem service linking natural hydrological processes and human water demand, have received increasing attention in resource management research.
China faces severe water resource challenges due to limited per capita availability and significant spatial-temporal heterogeneity [5,6]. Existing studies have extensively evaluated water yield services in major regions such as the Yellow River Basin [7], Yangtze River Basin [8], and Beijing–Tianjin–Hebei region [9], demonstrating that precipitation, climate change, and LULC dynamics are key drivers affecting water yield capacity [10,11]. However, several limitations remain. Current research has focused primarily on supply-side assessment, while water demand quantification and spatialization require further improvement [12,13]. Moreover, supply–demand matching studies are still largely descriptive, lacking integrated quantitative frameworks for identifying spatial imbalance and regional dependency patterns [14,15]. In this study, urban resilience is adopted as an interpretive perspective rather than a quantitative analytical framework [16]. The concept is used to understand how spatial mismatches between water yield supply and human demand may reflect structural pressures within regional water systems. The analytical framework is primarily based on the InVEST model and Supply–Demand Index (SDI), rather than resilience indicators such as adaptive capacity, redundancy, or recovery potential.
The Guangdong–Hong Kong–Macao (GHKM) Greater Bay Area represents one of China’s most dynamic and highly urbanized regions, yet faces challenges related to water resource security and ecosystem management [17]. The region includes nine mainland cities in Guangdong Province together with the Hong Kong and Macao Special Administrative Regions, characterized by substantial differences in water resource conditions, management systems, and socio-economic development patterns. Northern and western mountainous areas mainly function as ecological water conservation and supply zones, whereas Pearl River Delta core cities, Hong Kong, and Macao exhibit concentrated water demand and strong dependence on external water resources. This cross-regional structure provides an important empirical context for examining water supply–demand relationships under heterogeneous institutional conditions.
This study aims to investigate the spatial mismatch between water yield supply and demand in the Guangdong–Hong Kong–Macao Greater Bay Area. Specifically, it (1) quantifies water yield supply using the InVEST model; (2) estimates water demand based on statistical yearbook data; (3) constructs a Supply–Demand Index (SDI) to identify spatial imbalance patterns; and (4) analyzes the spatial differentiation and driving mechanisms of water resource dependence across the study region.
1.2. Domestic and International Research Progress
Water yield services describe the hydrological processes through which ecosystems regulate precipitation via canopy interception, soil infiltration, and groundwater recharge, ultimately generating surface runoff and replenishing water resources. As a key link between ecological processes and human water demand, they have become an important focus in ecosystem service research [18,19]. International studies originated in the 1970s from watershed hydrology research on forest ecosystems, initially focusing on the effects of land cover change on runoff. Since the 21st century, ecosystem service frameworks and quantitative modeling advances have driven a shift from qualitative description to spatially explicit simulation and regional-scale assessment [20,21]. Multiple methods have been developed for water yield estimation, including field-based water balance approaches, hydrological process models, and land-use-based empirical models. Among them, the InVEST model is widely applied due to its moderate data requirements and strong spatial visualization capability [22,23,24,25]. Based on the Budyko hydro-climatic framework [26], it integrates precipitation, evapotranspiration, soil water content, and land use to simulate spatial water yield patterns.
Research on supply-side mechanisms shows that precipitation is the dominant controlling factor, while land use/land cover changes significantly affect evapotranspiration and runoff processes. Forest ecosystems regulate hydrological processes but do not necessarily increase total water yield [27,28]. On the demand side, studies have evolved from aggregate indicators such as per capita water use and GDP intensity to spatialized approaches using population density, nighttime light data, and industrial distribution [29]. However, demand-side estimation and spatial accuracy remain relatively weak, and supply–demand matching studies are still largely descriptive, lacking unified quantitative frameworks and cross-regional analysis.
Ecosystem service supply–demand research emerged from ecological carrying capacity studies in the 1990s, with Costanza et al. providing a foundational basis for global valuation approaches [30]. Subsequent studies emphasized that supply-based assessments alone are insufficient, leading to increased focus on demand analysis and supply–demand interaction frameworks. Burkhard et al. proposed a supply–demand matrix approach [12], and Kroll et al. conducted urban–rural gradient analyses, providing key methodological references [31]. Water resource studies still insufficiently address dynamic supply–demand evolution and coordination mechanisms.
In water yield service research, models such as InVEST, SWAT, and ARIES are commonly used for supply estimation, while demand is typically derived from statistical data, surveys, or scenario-based approaches [32,33]. Supply–demand matching is usually assessed using indices, ratios, or spatial overlay methods [34,35]. Although multi-scale studies exist (global to urban scales), data inconsistency and model limitations restrict cross-regional comparability. The InVEST model remains widely used due to its flexibility and standardized parameterization, and is therefore adopted in this study.
Recent studies increasingly shift from static evaluation to dynamic interaction analysis, yet challenges remain in scale consistency, mechanism interpretation, and policy applicability. These limitations are particularly pronounced in cross-administrative regions where heterogeneous statistical standards introduce additional uncertainty.
The dataset used in this study includes meteorological, land use, soil, and topographic data for the year 2024. All datasets were resampled to a unified spatial resolution to ensure consistency across inputs. Detailed data sources are listed in Table 1.
Table 1.
Data Sources.
The remainder of this paper is organized as follows. Section 2 introduces the study area, data sources, and research methods. Section 3 presents the modeling framework for water yield supply and demand estimation, as well as the SDI construction method. Section 4 reports the spatial patterns of water supply, demand, and their matching relationships. Section 5 discusses the driving mechanisms and implications for regional water resource management and summarizes the main conclusions and policy implications.
2. Study Area
2.1. Physiographic Characteristics
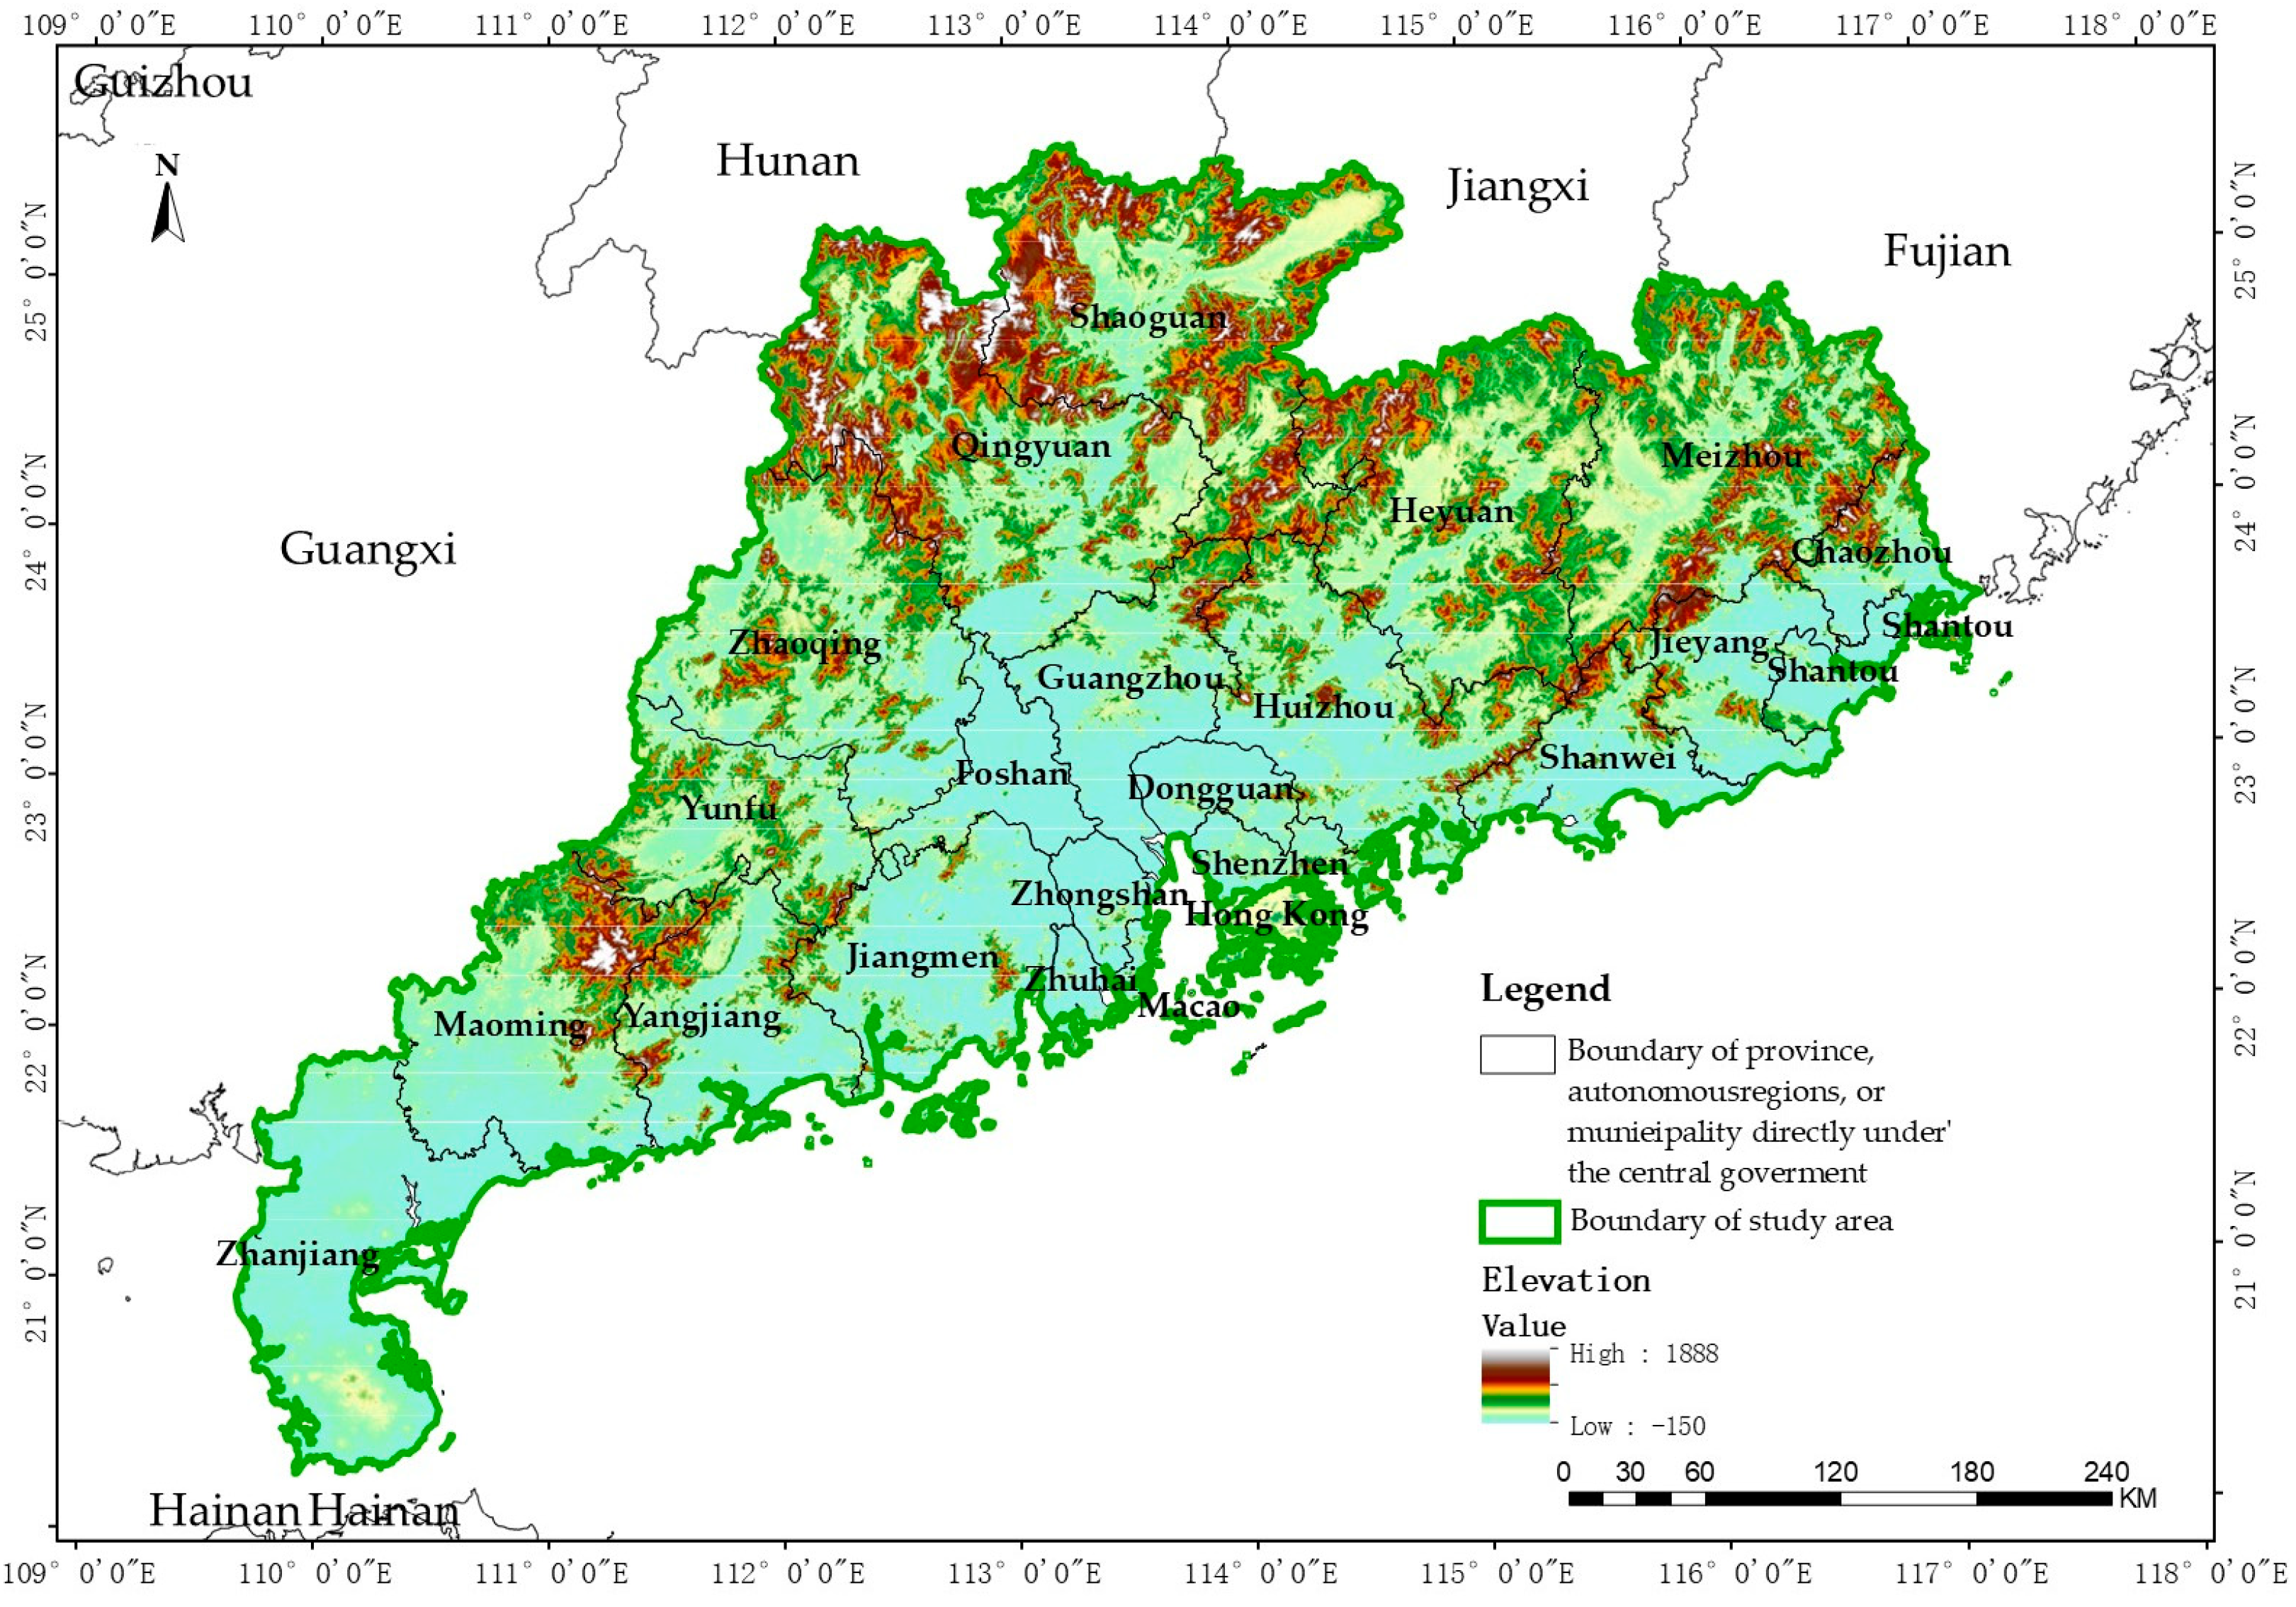
The study area is situated along China’s South China coast, on the eastern bank of the Pearl River estuary and the northern coast of the South China Sea, encompassing a total area of 181,600 km2. The study area encompasses the entirety of Guangdong Province along with the Hong Kong and Macao Special Administrative Regions, with geographic coordinates ranging from 20°08′ to 25°31′ N latitude and 109°39′ to 117°19′ E longitude. The region is bordered by Fujian Province to the east, the Guangxi Zhuang Autonomous Region to the west, the South China Sea to the south, and Hunan and Jiangxi Provinces to the north (Figure 1).
Figure 1.
Spatial Extent of the Study Area.
The regional topography exhibits a pattern of high elevations in the north and low elevations in the south, with a central depression surrounded by higher terrain. The northern region is predominantly characterized by mountainous and hilly terrain, hosting the Nanling Mountains and their extensions, with elevations ranging from 300 to 1500 m [36]. This area serves as the primary water source and upstream catchment zone. The central region comprises the Pearl River Delta Plain, characterized by low terrain, dense drainage networks, and average elevations below 50 m, functioning as the main channel for Pearl River discharge to the sea and the regional population and economic core area. The southern coastal region features interspersed plains and low mountains/hills, with a highly convoluted coastline hosting multiple excellent harbors.
The Pearl River constitutes the most significant river system within the study area, formed by the confluence of three major tributaries—the West River, North River, and East River. The river traverses six provinces/regions (Yunnan, Guizhou, Guangxi, Guangdong, Hunan, and Jiangxi), extending 2320 km in length with a drainage area of 453,000 km, ranking second among rivers in China. The Pearl River system develops into a reticulate river network within the Pearl River Delta, with hundreds of rivers crisscrossing the area, ultimately discharging through eight major outlets into the South China Sea. Multiple reservoirs within the study area serve as critical water conservation and supply assurance facilities.
The study area exhibits a subtropical monsoon climate, characterized by abundant thermal resources, ample precipitation, co-occurring high temperatures and precipitation, with prolonged summers and mild winters [37]. The mean annual temperature ranges from 20–24 °C, while annual precipitation varies between 1300 and 2500 mm, exhibiting a general spatial pattern of more precipitation in the south and less in the north, and greater precipitation over mountainous areas than on plains. Influenced by the East Asian monsoon, precipitation concentrates during April–September—accounting for approximately 75–85% of annual totals—with May–June comprising the pre-flood season dominated by frontal precipitation, and July–September constituting the post-flood season characterized primarily by typhoon-generated rainfall and convective precipitation.
Annual precipitation exhibits pronounced inter-annual variability, with precipitation differing by factors of 2–3 between wet and dry years, and surface runoff substantially varying between high-flow and low-flow periods. Annual potential evapotranspiration approximates 1200–1500 mm, representing moderately high levels, while actual evapotranspiration is significantly influenced by underlying surface conditions and water availability [38]. The study area exhibits diverse soil types, predominantly comprising red earth, lateritic red earth, and paddy soils [39]. Red earth and lateritic red earth are primarily distributed across hills and terraces below 500 m elevation, exhibiting pronounced allitization. Paddy soils are mainly situated within the Pearl River Delta Plain and intermontane valleys, constituting important regional cultivated land resources. Forest soils are predominantly characterized by mountain red earth, mountain yellow earth, and mountain meadow soils, with relatively high soil organic matter content.
2.2. Socioeconomic Context
The GHKM region constitutes one of China’s most economically vibrant areas, with a permanent population of approximately 136.51 million and population density reaching 751 persons/km2, exceeding five times the national average. The Pearl River Delta region exhibits the highest population density, with Shenzhen, Dongguan, Guangzhou, and Foshan each having permanent populations exceeding 5 million [40]. The concentrated population generates robust water demand. The study area can be partitioned into five sub-regions: the Pearl River Delta region, Eastern Guangdong, Western Guangdong, Northern Guangdong mountainous area, and Hong Kong and Macao Special Administrative Regions. These subregions exhibit pronounced heterogeneity in economic development levels, industrial structures, and water demand patterns.
Regarding industrial structure, the study area is dominated by manufacturing and modern service industries. The Pearl River Delta has developed pillar industrial clusters encompassing electronic information, equipment manufacturing, petrochemicals, textiles and apparel, and food and beverages, alongside the rapid development of modern financial services, logistics, business services, and technology services [40]. Eastern, Western, and Northern Guangdong exhibit industrial structures predominantly characterized by resource-based industries, agriculture, and tourism, with relatively lower industrial hierarchy. Hong Kong functions as an international financial, trade, and shipping center, while Macao’s economy is primarily centered on tourism and gaming.
The differentiated industrial structures under cross-institutional contexts result in pronounced heterogeneity across regions in water resource utilization efficiency and water use management patterns. Such supply–demand matching research under cross-institutional settings not only addresses gaps in existing research predominantly focusing on single provinces or watersheds but also provides a distinctive empirical basis for exploring collaborative water resource governance under heterogeneous institutional environments. Basic information for each city is presented in Table 2.
Table 2.
Overview of the Study Area.
3. Research Methods
3.1. Technical Framework Overview
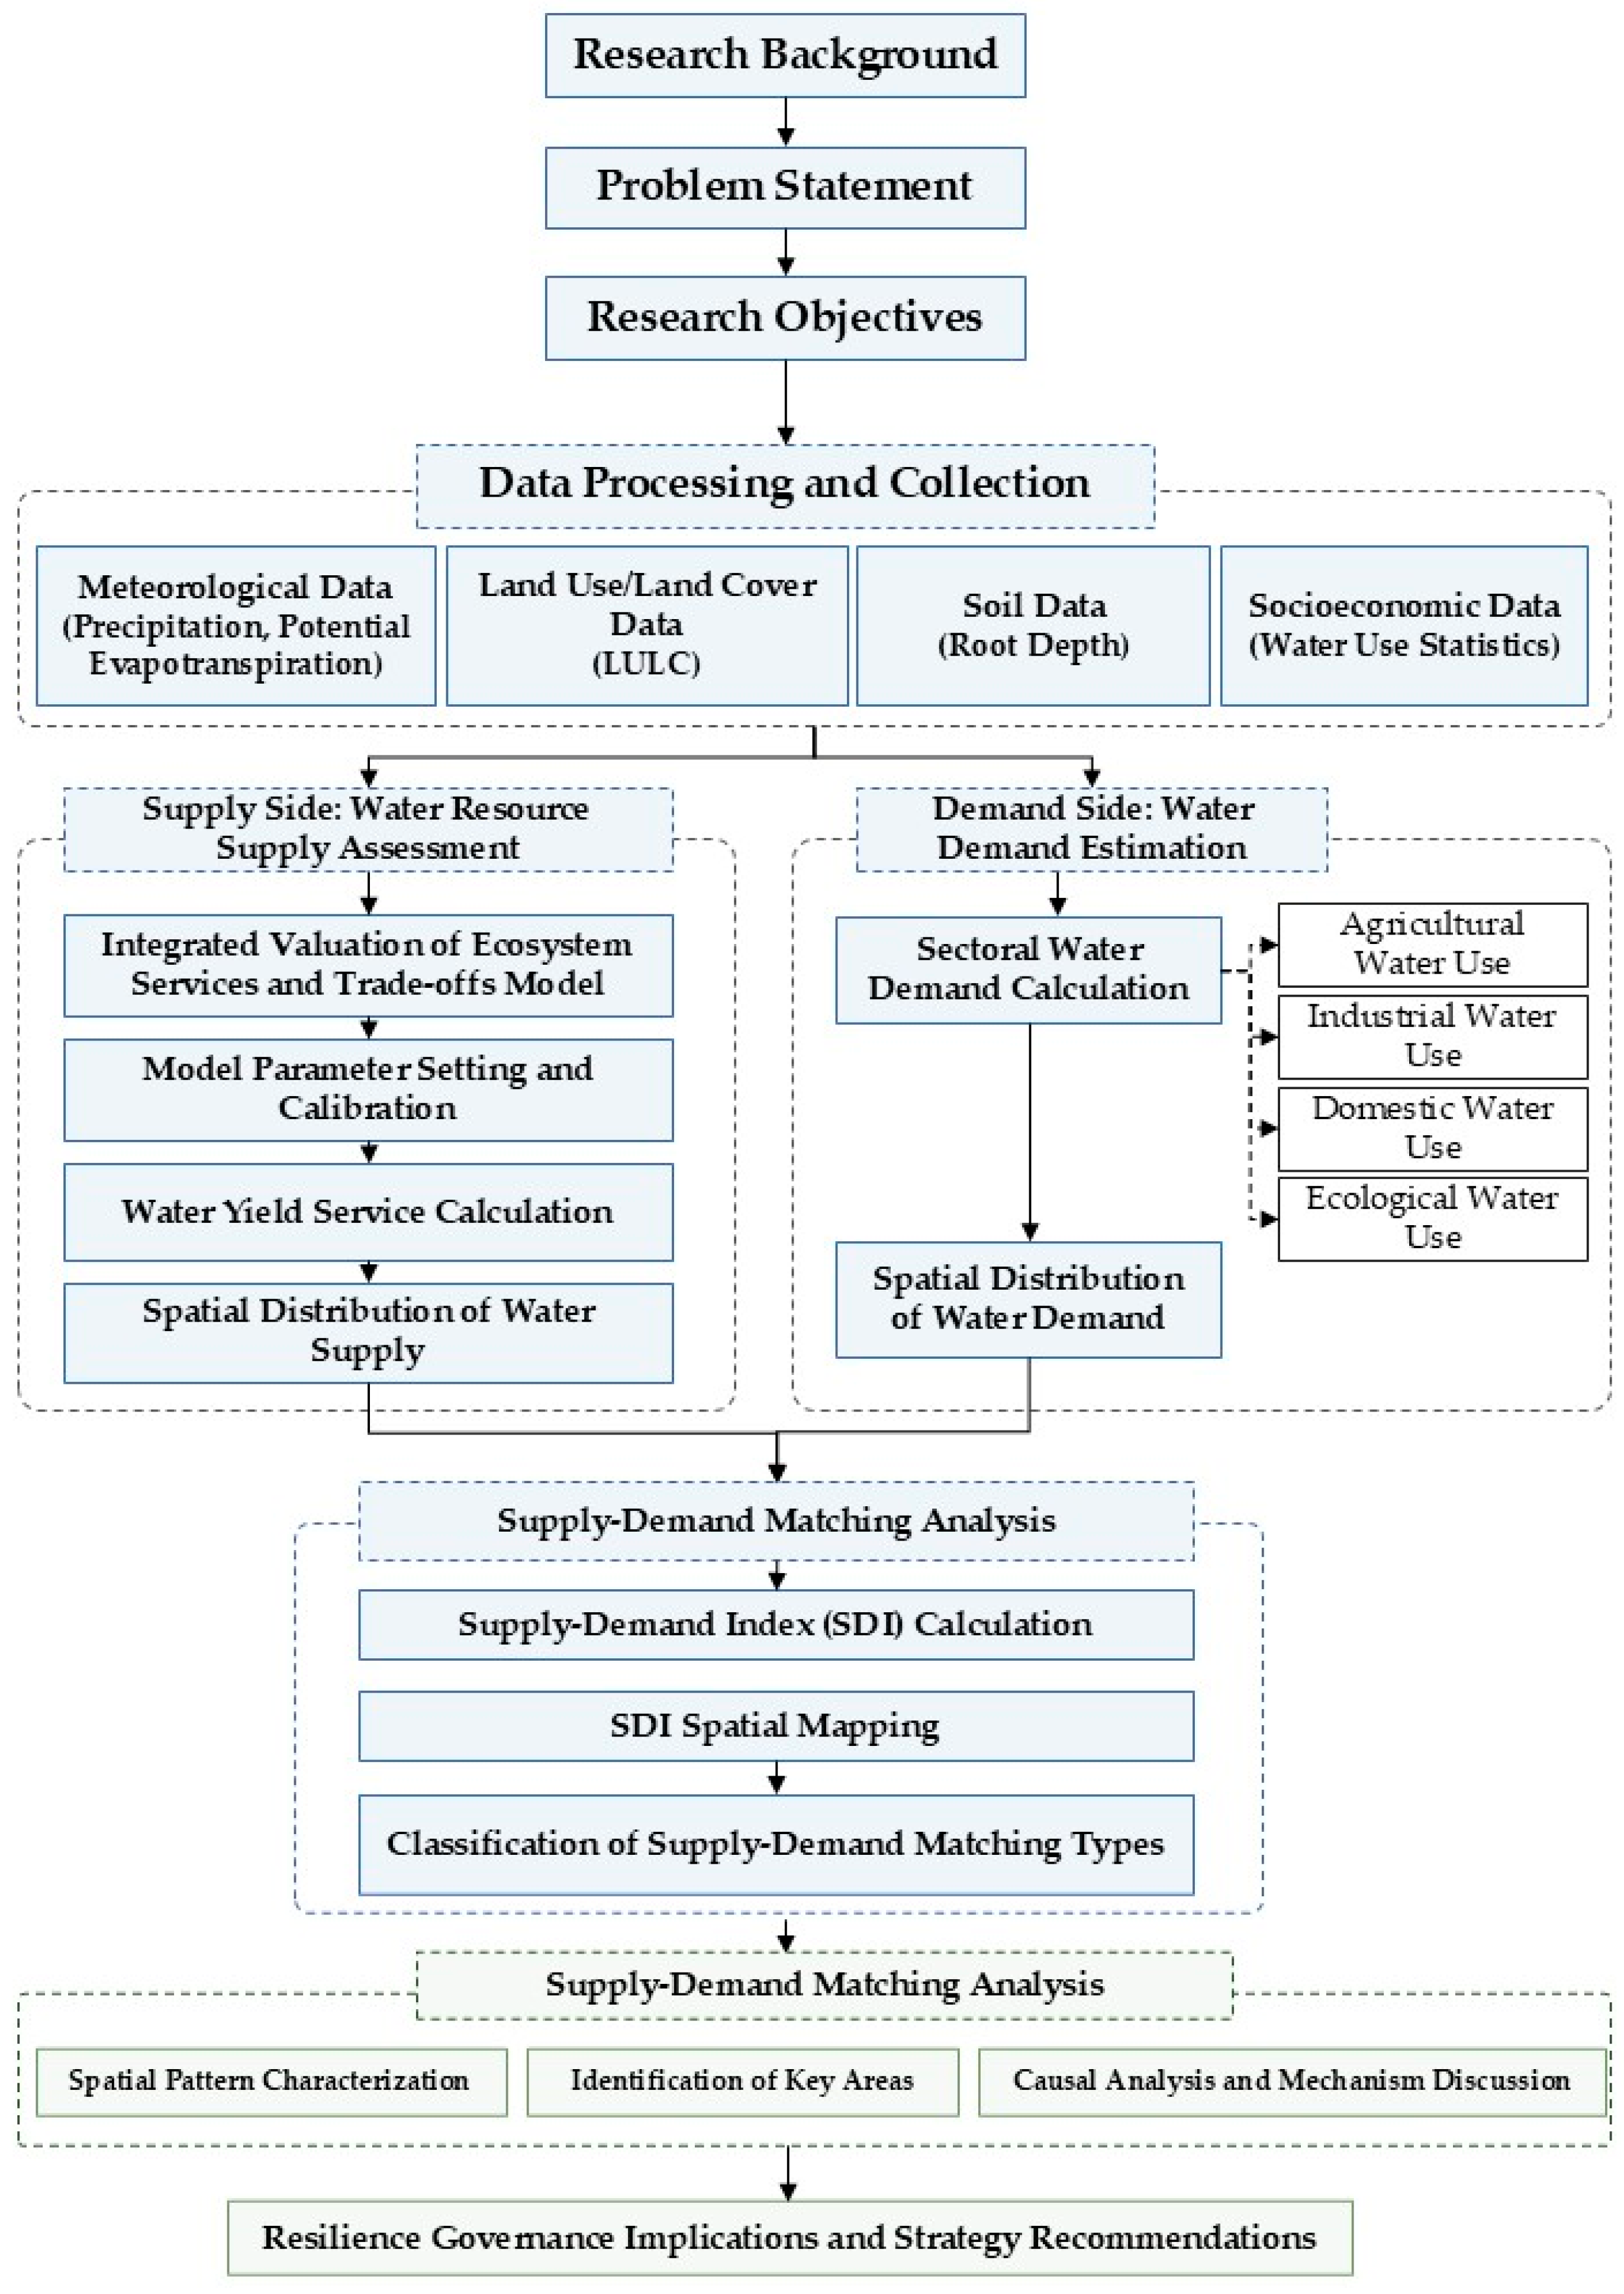
The technical framework employed in this study is illustrated in Figure 2. Initially, a comprehensive database for water yield service supply and demand assessment was constructed based on multi-source data encompassing meteorological, land use, soil, digital elevation model (DEM), and socioeconomic datasets. Subsequently, the InVEST model was employed to simulate water yield service supply, while water demand was quantified based on statistical yearbook data. Furthermore, the Supply–Demand Index (SDI) was utilized to characterize water yield service supply–demand matching patterns, with thresholds delineating supply surplus zones, supply–demand equilibrium zones, and supply deficit zones. Finally, ArcGIS spatial mapping and statistical analyses were conducted to reveal the water yield service supply–demand matching characteristics in the Guangdong–Hong Kong–Macao Greater Bay Area.
Figure 2.
Research Approach.
3.2. Water Yield Service Supply–Demand Assessment Methodology
Water yield services refer to the processes and capacities through which ecosystems intercept, infiltrate, and store precipitation via various media, including forest canopy, litter, soil, lakes, and reservoirs. This not only satisfies ecosystem water requirements but also provides water resources for downstream regions [41], exhibiting multiple functions including water supply, runoff regulation, flood storage, water purification, soil and water conservation, and temperature regulation [42], thereby constituting an important ecosystem service. Water yield services represent the comprehensive outcome of ecosystem and hydrological processes under specific climatic conditions, influenced by multiple factors including ecosystem type, surface characteristics, climatic conditions, and anthropogenic activities [43,44]. Therefore, conducting quantitative assessment and visualization research on water yield services facilitates effective water resource management and conservation, holding significant importance for sustainable regional development and enhancement of human well-being. It should be noted that this study simplifies hydrological processes by not explicitly representing reservoir regulation effects, which may introduce uncertainty in regions with significant reservoir operations. However, this simplification is commonly adopted in large-scale water yield assessments due to the lack of consistent operational reservoir data. Future studies could incorporate reservoir operation rules or coupled hydrological models to improve estimation accuracy.
This study simulates water yield based on the water balance principle, utilizing annual mean precipitation, annual mean reference crop evapotranspiration, along with parameters including vegetation type, maximum root layer depth, plant available water content, land use/land cover, and root depth. The water yield module does not differentiate between surface water, groundwater, and baseflow; instead, it treats the difference between precipitation and actual evapotranspiration for each grid cell as water yield. This study incorporates the following simplifying assumptions: (1) no differentiation between surface water, groundwater, and baseflow; (2) exclusion of regulation effects from artificial storage facilities such as reservoirs and dams; (3) for urban impervious surfaces, the model may overestimate water yield capacity, as this portion of water predominantly manifests as rapid runoff and is difficult to utilize effectively. This study does not include direct hydrological validation due to the lack of consistent long-term observed streamflow, watershed discharge, or reservoir inflow data, and therefore simulated water yield is not calibrated against observed records. Consequently, uncertainties may exist in absolute magnitude estimates, while the analysis primarily focuses on spatial patterns and relative supply–demand relationships. Future work should incorporate gauged streamflow data or coupled hydrological models to improve validation and reduce uncertainty. The calculation is as follows in Formula (1):
where Water Yield(i) represents the water yield for each raster grid cell, Act_et(x) represents the actual evapotranspiration for grid cell i, and R(i) represents the precipitation for grid cell i. The calculation of Act_et(i) (actual evapotranspiration) commonly employs the Budyko hydro-climatic coupling equilibrium hypothesis. Budyko proposed that actual evapotranspiration is influenced by factors including potential evapotranspiration and precipitation. This framework was subsequently optimized and refined by Fu [45] and Yao et al. [46]. The InVEST water yield model is based on a simplified water balance (P − AET) that does not explicitly represent key hydrological processes such as runoff routing, groundwater flow, or channel storage. Therefore, it is more suitable for capturing long-term spatial patterns of water yield rather than detailed process-based hydrological dynamics. The calculation is as follows in Formula (2):
where Pot_et(i) represents potential evapotranspiration. Formula (3) is calculated as follows:
where Ref_cet0(i) represents the reference crop evapotranspiration for grid cell i, and Kc(ℓi) represents the vegetation (crop) evapotranspiration coefficient for the specific land use/land cover type within grid cell i. Ref_cet0(i) reflects local climatic conditions through reference crop evapotranspiration. Kc(ℓi) is largely dependent on the vegetation properties of the land use/land cover within grid cell i. In land use/land cover maps, Kc is employed to modify Ref_cet0 to the evapotranspiration corresponding to specific crop or vegetation types within the grid cell.
ω is an empirical parameter in the Budyko framework that represents the combined effects of climate and catchment characteristics on evapotranspiration partitioning. The InVEST model employs Equation (4) proposed by Donohue et al. [47], which is calculated as follows:
where Ava_wcp(i) represents soil available water content (mm), determined by Plant Available Water Capacity (PAWC) and the minimum value between the maximum root layer depth of the soil and plant root depth, Formula (5) calculated as follows:
The maximum depth to which plant roots can extend in soil, i.e., the maximum root layer depth, varies depending on environmental physical and chemical characteristics. Plant root depth generally refers to the depth at which root biomass comprises 95% of the total soil layer biomass. PAWC represents the difference between field capacity and wilting point.
Z is an empirical seasonality parameter that reflects local precipitation distribution characteristics. Following Redhead et al. [48], Z is estimated as 0.2 × N, where N denotes the annual number of precipitation events. It is noted that this parameter is not locally calibrated due to the lack of long-term event-based precipitation observations, introducing uncertainty in absolute water yield estimation. Previous studies have shown that Z is sensitive in water yield simulations, primarily affecting magnitude rather than spatial distribution patterns.
The ω parameter was not directly calibrated using observed streamflow data due to data availability limitations at sub-regional scales. Instead, it was derived from established empirical formulations under humid monsoon climatic conditions reported in previous studies. Uncertainties in PAWC and root depth may further propagate into ω estimation, influencing absolute evapotranspiration and water yield values.
Actual evapotranspiration for water bodies, urban areas, and wetlands is calculated directly from reference evapotranspiration Ref_cet0(i), with precipitation acting as an upper bound (Equation (6)). This modeling approach focuses on spatial patterns of water yield rather than absolute hydrological calibration, given the absence of observed streamflow data for validation.
where Ref_cet0(i) represents reference crop evapotranspiration, and Kc(ℓi) represents the factor affecting transpiration for specific land use/land cover types.
This study considers water yield service demand as actual water resource consumption, primarily derived from agricultural, industrial, domestic, and ecological water consumption data in the Guangdong–Hong Kong–Macao region, Formula (7) calculated as follows:
where Water_demandtot represents total water demand (m3), Wateragr represents agricultural water demand (m3), Waterind represents industrial water demand (m3), Waterurb represents domestic water demand (m3), and Watereco represents ecological water demand (m3). Water demand data were obtained from statistical yearbooks and aggregated at the municipal level. No further spatial disaggregation was conducted within administrative units, and city-level totals were directly assigned to corresponding boundaries. This ensures consistency with the InVEST-derived water yield supply at the same spatial scale for comparable analysis.
3.3. Ecosystem Service Supply–Demand Matching Index
This study employs the Supply–Demand Index (SDI) to characterize ecosystem service supply–demand matching, Formula (8) calculated as follows:
where SDI represents the ecosystem service supply–demand matching index; ESS represents ecosystem service supply; and ESD represents ecosystem service demand. SDI > 0 indicates that supply exceeds demand, i.e., a surplus condition; SDI = 0 indicates that supply equals demand, i.e., an equilibrium condition; SDI < 0 indicates that supply is less than demand, i.e., a deficit condition.
SDI threshold classification criteria [12,14]: The classification of supply–demand matching levels was determined by integrating previous ecosystem service supply–demand classification approaches, the statistical distribution characteristics of SDI values, and the specific water resource conditions of the study area. Specifically, the Jenks Natural Breaks classification method was first applied to identify natural groupings within the SDI value distribution, and the thresholds were further adjusted according to regional water supply–demand characteristics and management implications. Based on this combined approach, SDI was classified into three categories: SDI > 5 (supply surplus zone), 1–5 (supply–demand transition zone), and SDI ≤ 1 (supply deficit zone). This classification reflects both the statistical characteristics of the sample distribution and the practical differences in water resource dependence across the Guangdong–Hong Kong–Macao region.
4. Results
4.1. Water Yield Service Supply
The total water yield service supply in the Guangdong–Hong Kong–Macao region in 2024 reached 2.82 × 10¹¹ m3. Water yield service supply calculations are based on the water balance principle, primarily influenced by two key factors: precipitation and evapotranspiration. Since soil factors remain relatively stable, spatiotemporal variations in meteorological factors emerge as the dominant factors driving spatial differentiation in water yield service supply. Among the 23 cities (including Hong Kong and Macao), 5 are classified as high-supply zones, 5 as low-supply zones, with the remainder exhibiting moderate supply levels (Table 3).
Table 3.
Summary of High-Supply and Low-Supply Units for Water Yield Service in the Guangdong–Hong Kong–Macao Region, 2024.
Water yield service supply in the Guangdong–Hong Kong–Macao region exhibits pronounced spatial heterogeneity, with clearly delineated distribution patterns distinguishing high-supply and low-supply zones. Employing the zonal statistics function of ArcGIS 10.5 (Environmental Systems Research Institute, Inc., Redlands, CA, USA), water yield service supply was aggregated to the municipal administrative unit scale, with standardized processing utilizing unit area water yield (m3/ha) to eliminate the confounding effects of varying administrative unit areas. It should be noted that high water yield values observed in highly urbanized areas may partly result from the InVEST model’s representation of impervious surfaces, where reduced evapotranspiration increases modeled water yield. Therefore, SDI results for cities with high impervious coverage should be interpreted cautiously, as modeled water yield does not necessarily represent directly available water resources.
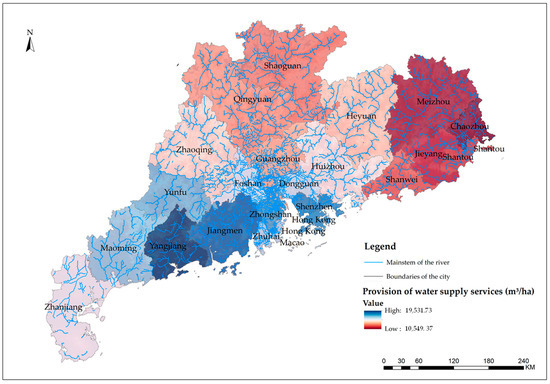
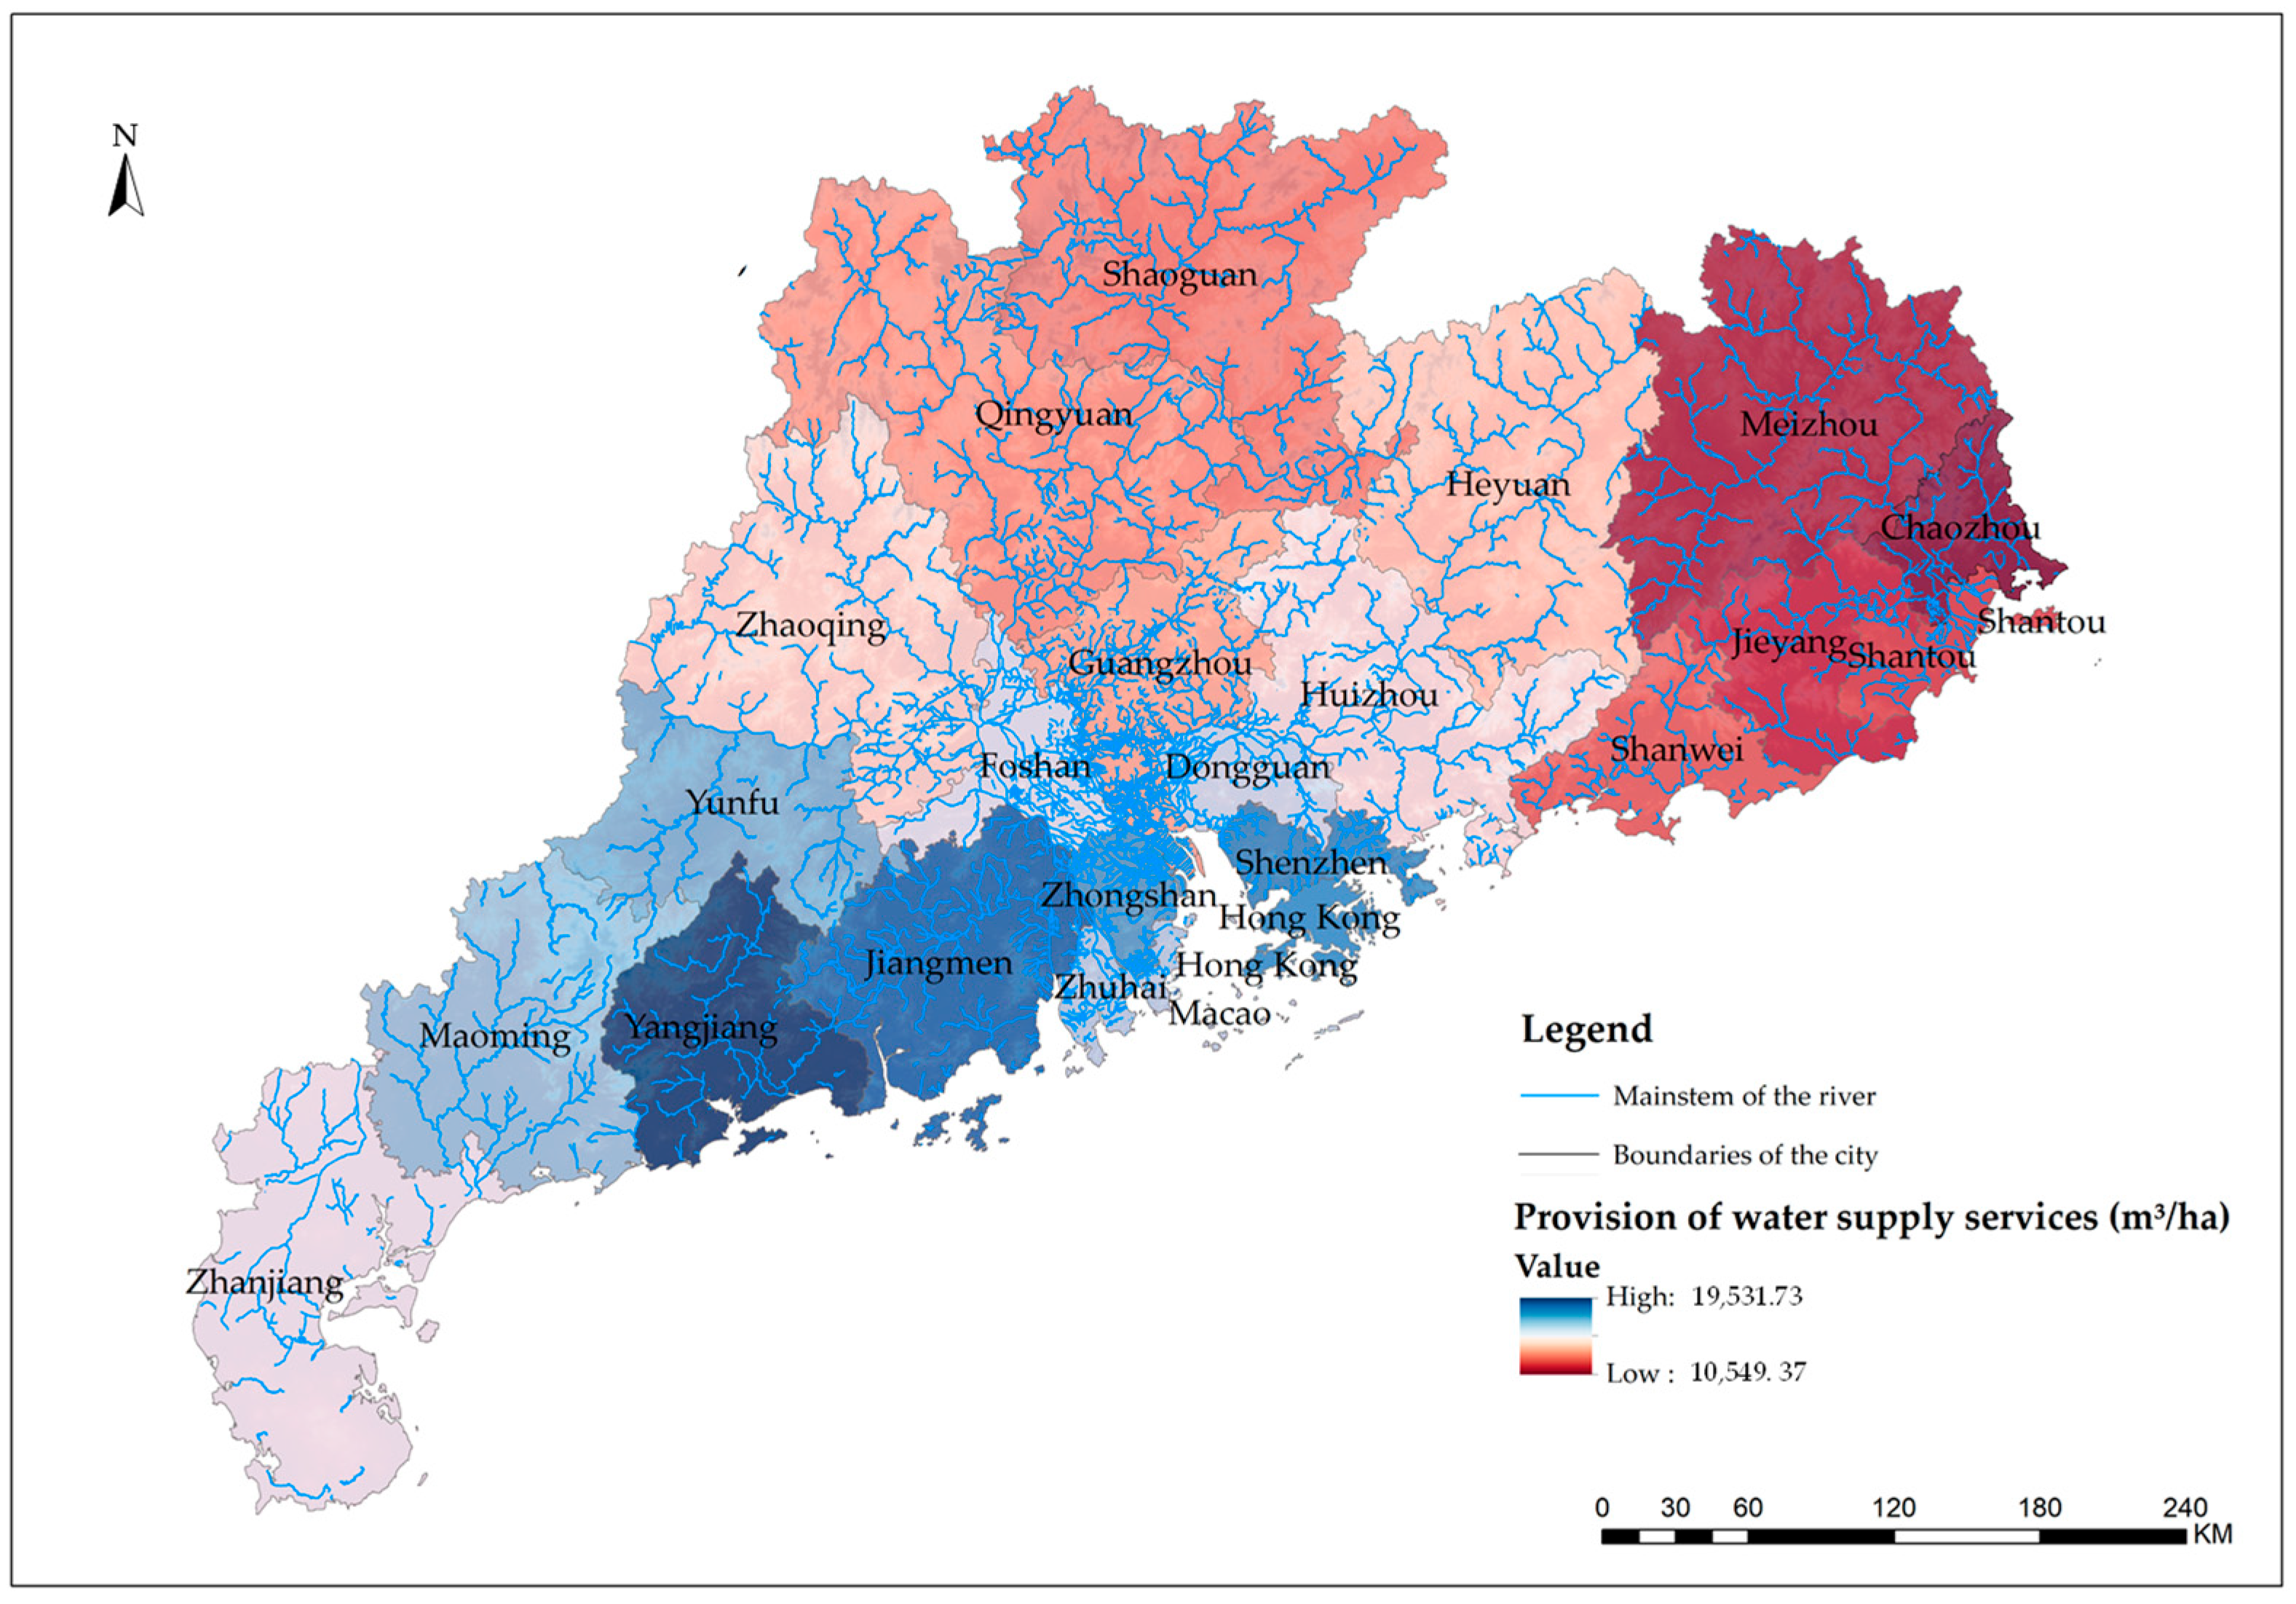
In 2024, high water yield service supply units in the Guangdong–Hong Kong–Macao region are predominantly concentrated in western and southern areas. Yangjiang exhibits the highest unit area water yield at 19,531.73 m3/ha, followed by Macao (19,160.02 m3/ha), Jiangmen (19,135.41 m3/ha), Hong Kong (18,339.74 m3/ha), and Shenzhen (17,617.91 m3/ha). These areas are characterized by impervious surfaces as the predominant land use/land cover type, where extensive impervious surfaces reduce water transpiration and decrease water infiltration, thereby readily forming water supply predominantly as surface runoff, consequently increasing water yield service supply. Although urban areas exhibit relatively high water yield services, this portion of water resources often cannot be effectively utilized and may instead induce severe urban waterlogging problems. It should be particularly emphasized that while Shenzhen, Hong Kong, Macao, and other such units display high unit area water yield values, these figures represent only theoretical total runoff. The vast majority of this water manifests as rapid surface runoff, rapidly discharged to the sea via urban drainage networks, rendering it difficult to constitute effective water supply [49]. Therefore, these values should not be directly interpreted as indicating abundant water resources.
In stark contrast, low-supply units are predominantly distributed in eastern and northern regions, including Shanwei (13,200.41 m3/ha), Shantou (13,058.61 m3/ha), Jieyang (13,037.39 m3/ha), Meizhou (12,909.37 m3/ha), and Chaozhou (10,549.37 m3/ha). These regions exhibit lower water yield service supply, characterized by relatively lower urbanization levels, smaller proportions of impervious surfaces, and land use types predominantly comprising cultivated land, forestland, and grasslands. The stronger soil infiltration capacity in these areas results in comparatively weaker water yield service capacity.
From the spatial distribution pattern perspective (Figure 3), high-value zones for water yield service supply exhibit contiguous distribution in western areas, forming a pronounced high-supply belt, while southern regions are characterized by predominantly patchy distribution. Overall, the spatial distribution of water yield service supply in the Guangdong–Hong Kong–Macao region is jointly constrained by the spatial heterogeneity of precipitation, urbanization processes, and underlying surface conditions, exhibiting pronounced regional differences and polarization characteristics.
Figure 3.
Spatial Distribution Map of Water Yield Service Supply in the Guangdong–Hong Kong–Macao Region, 2024.
4.2. Water Yield Service Demand
Total water yield service demand in the Guangdong–Hong Kong–Macao region in 2024 reached 4.21 × 10¹⁰ m3 (Table 4), while total modeled water yield supply was 2.82 × 10¹¹ m3, indicating that regional water supply exceeds demand at the aggregate scale. However, this overall surplus masks significant spatial imbalance between supply and demand across administrative units.
Table 4.
Summary of High-Demand and Low-Demand Units for Water Yield Service in the Guangdong–Hong Kong–Macao Region, 2024.
Water yield service demand primarily encompasses four categories: agricultural water use, industrial water use, domestic water use, and ecological water use. Among these, the proportions of domestic water use and industrial water use demonstrate an upward trend, while agricultural water use exhibits a declining trend.
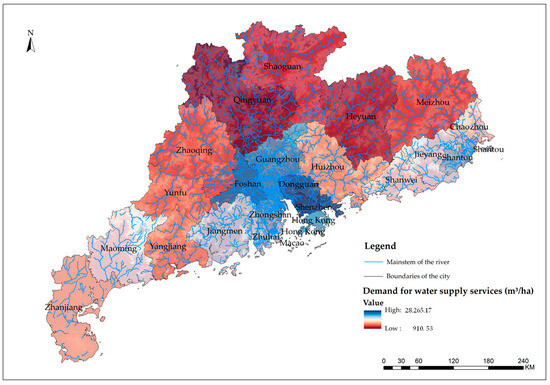
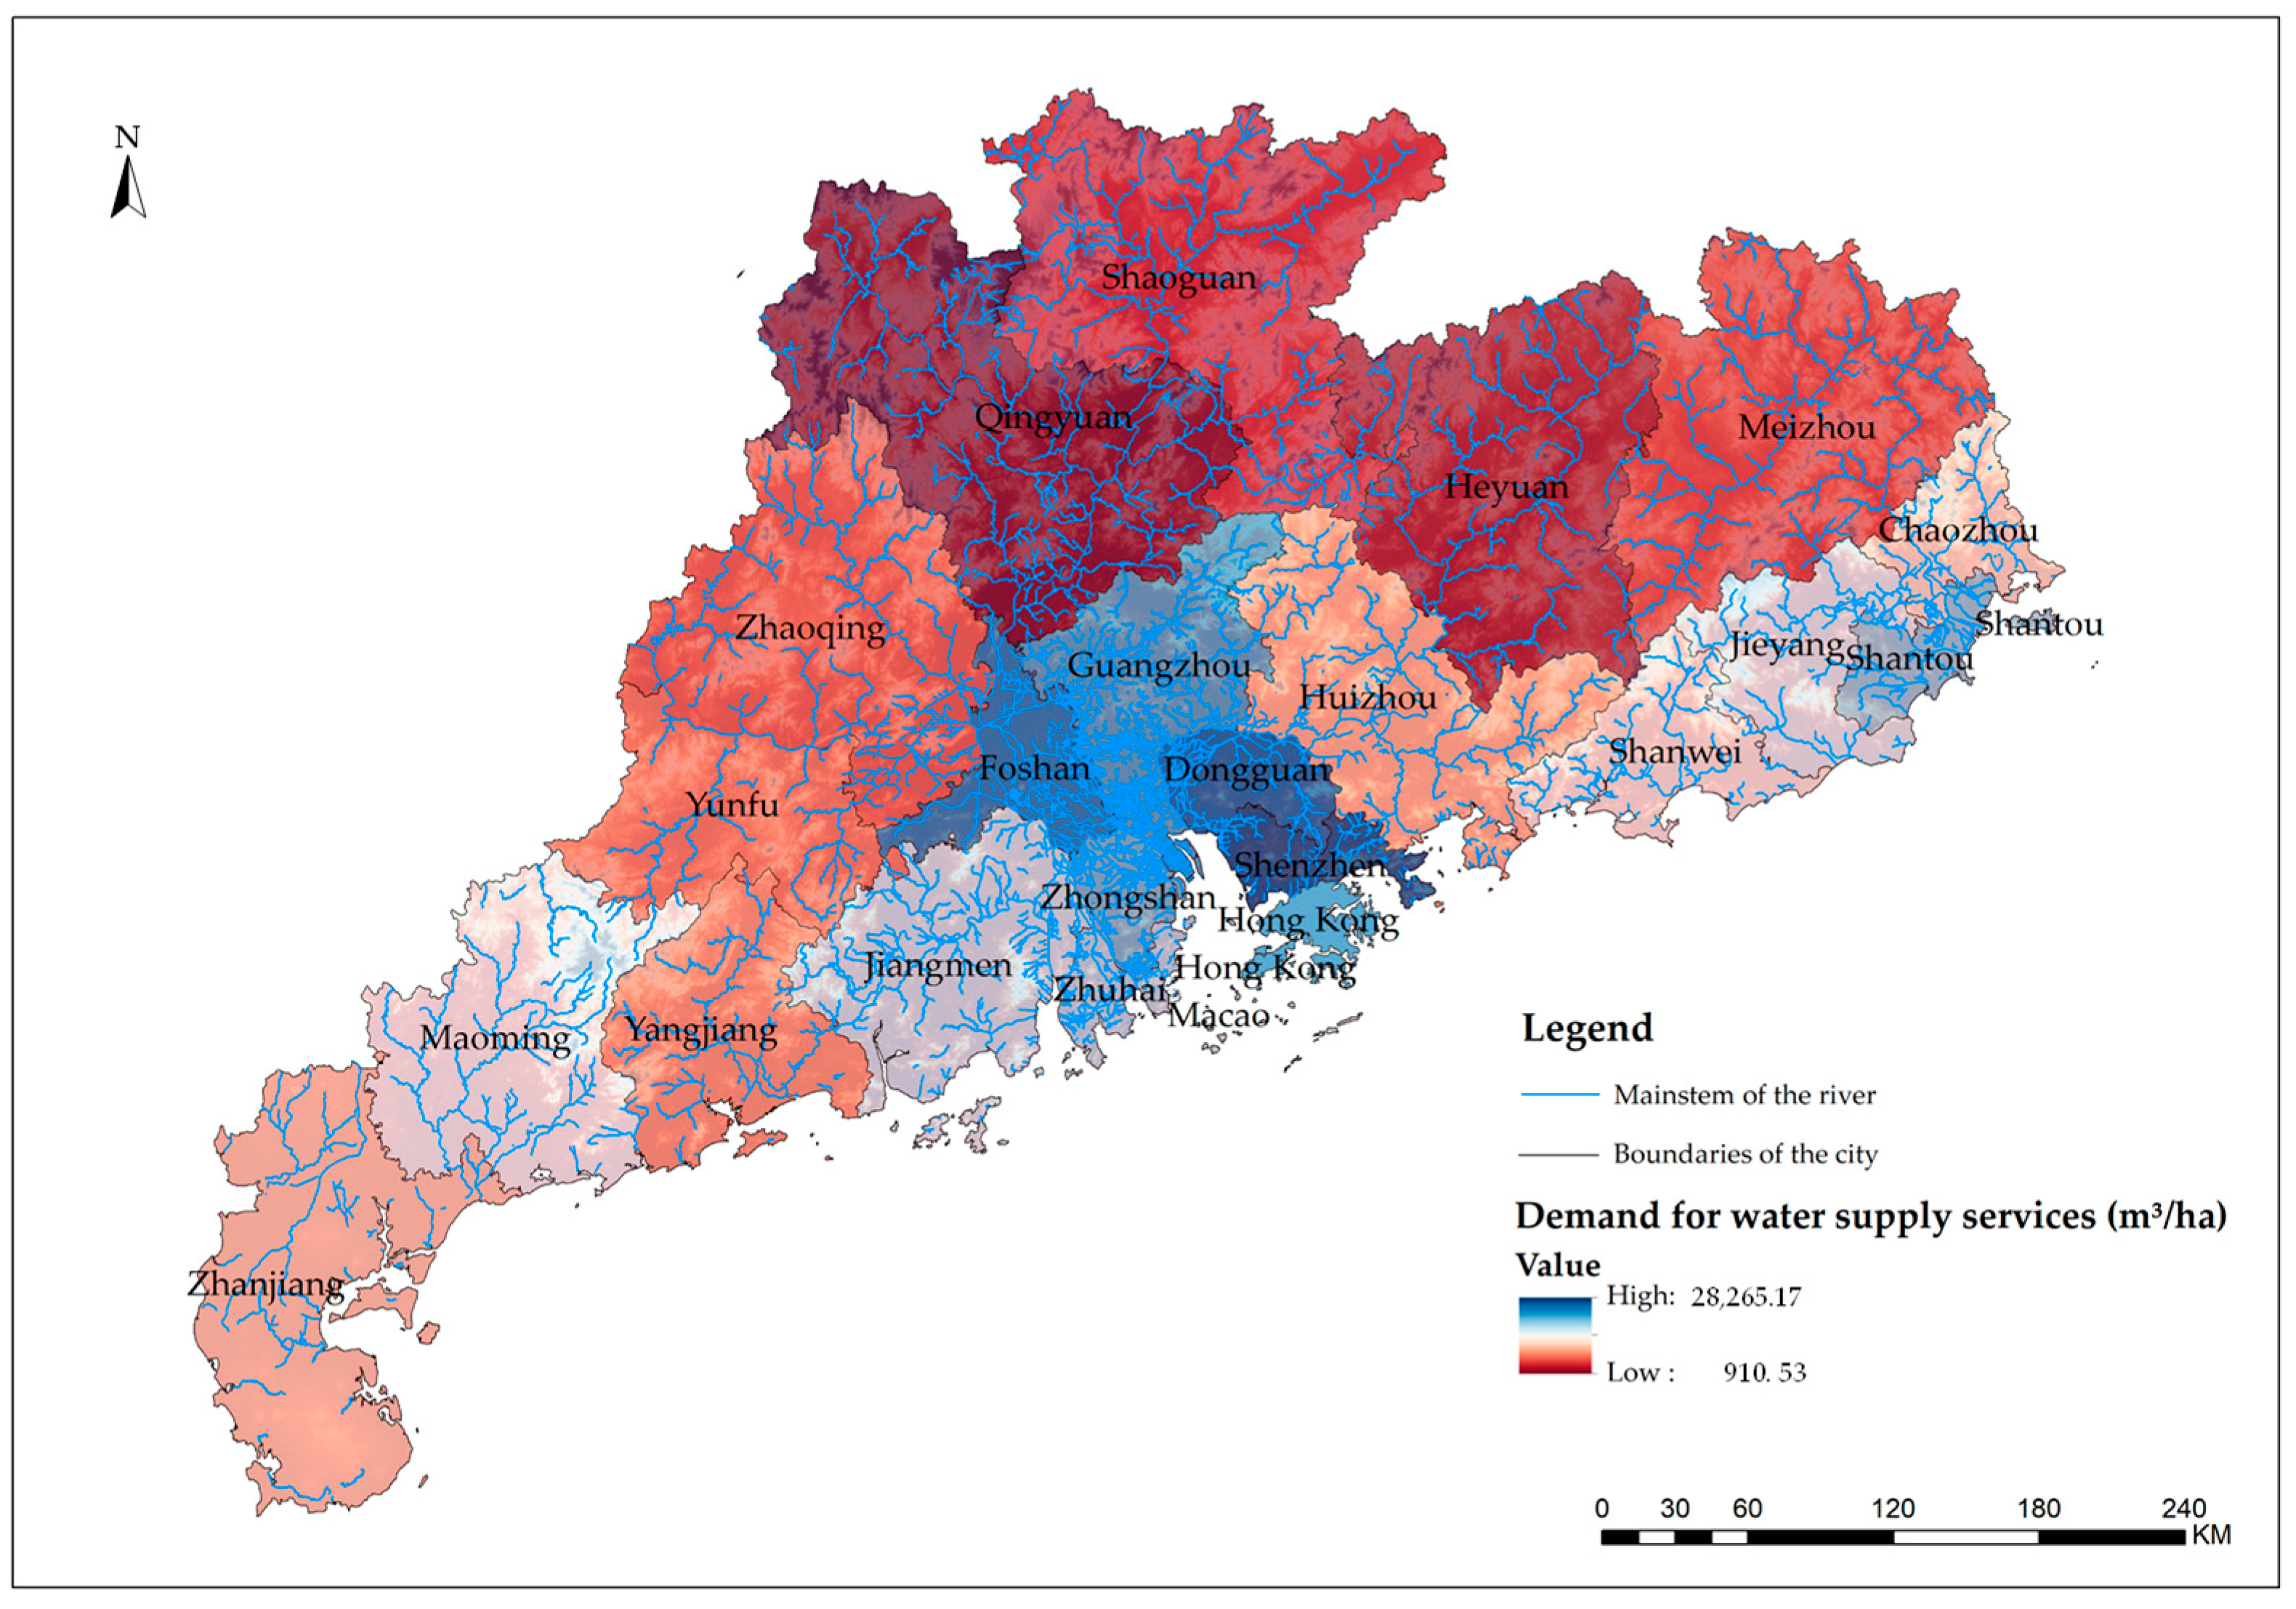
Water demand exhibits pronounced spatial heterogeneity, with high-demand zones concentrated in densely populated and economically developed urban core areas. In 2024, the highest unit-area demand was observed in Macao (28,265.17 m3/ha), followed by Shenzhen, Dongguan, Foshan, and Hong Kong. These areas are located in the Pearl River Delta core region, characterized by intensive economic activity and high population density. In contrast, low-demand zones are mainly distributed in northern Guangdong mountainous areas such as Shaoguan, Heyuan, Meizhou, and Qingyuan, where population density and economic intensity are relatively low.
From the spatial distribution perspective (Figure 4), high-value zones for water yield service demand are predominantly concentrated in Pearl River Delta core cities, characterized by dense populations and developed economies with robust water demand.
Figure 4.
Spatial Distribution Map of Water Yield Service Demand in the Guangdong–Hong Kong–Macao Region, 2024.
In contrast, low-value zones are primarily distributed in the Northern Guangdong mountainous area and parts of Eastern and Western Guangdong, where population density is relatively low, economic development is comparatively lagged, and water demand is relatively modest.
4.3. Water Yield Service Supply–Demand Matching
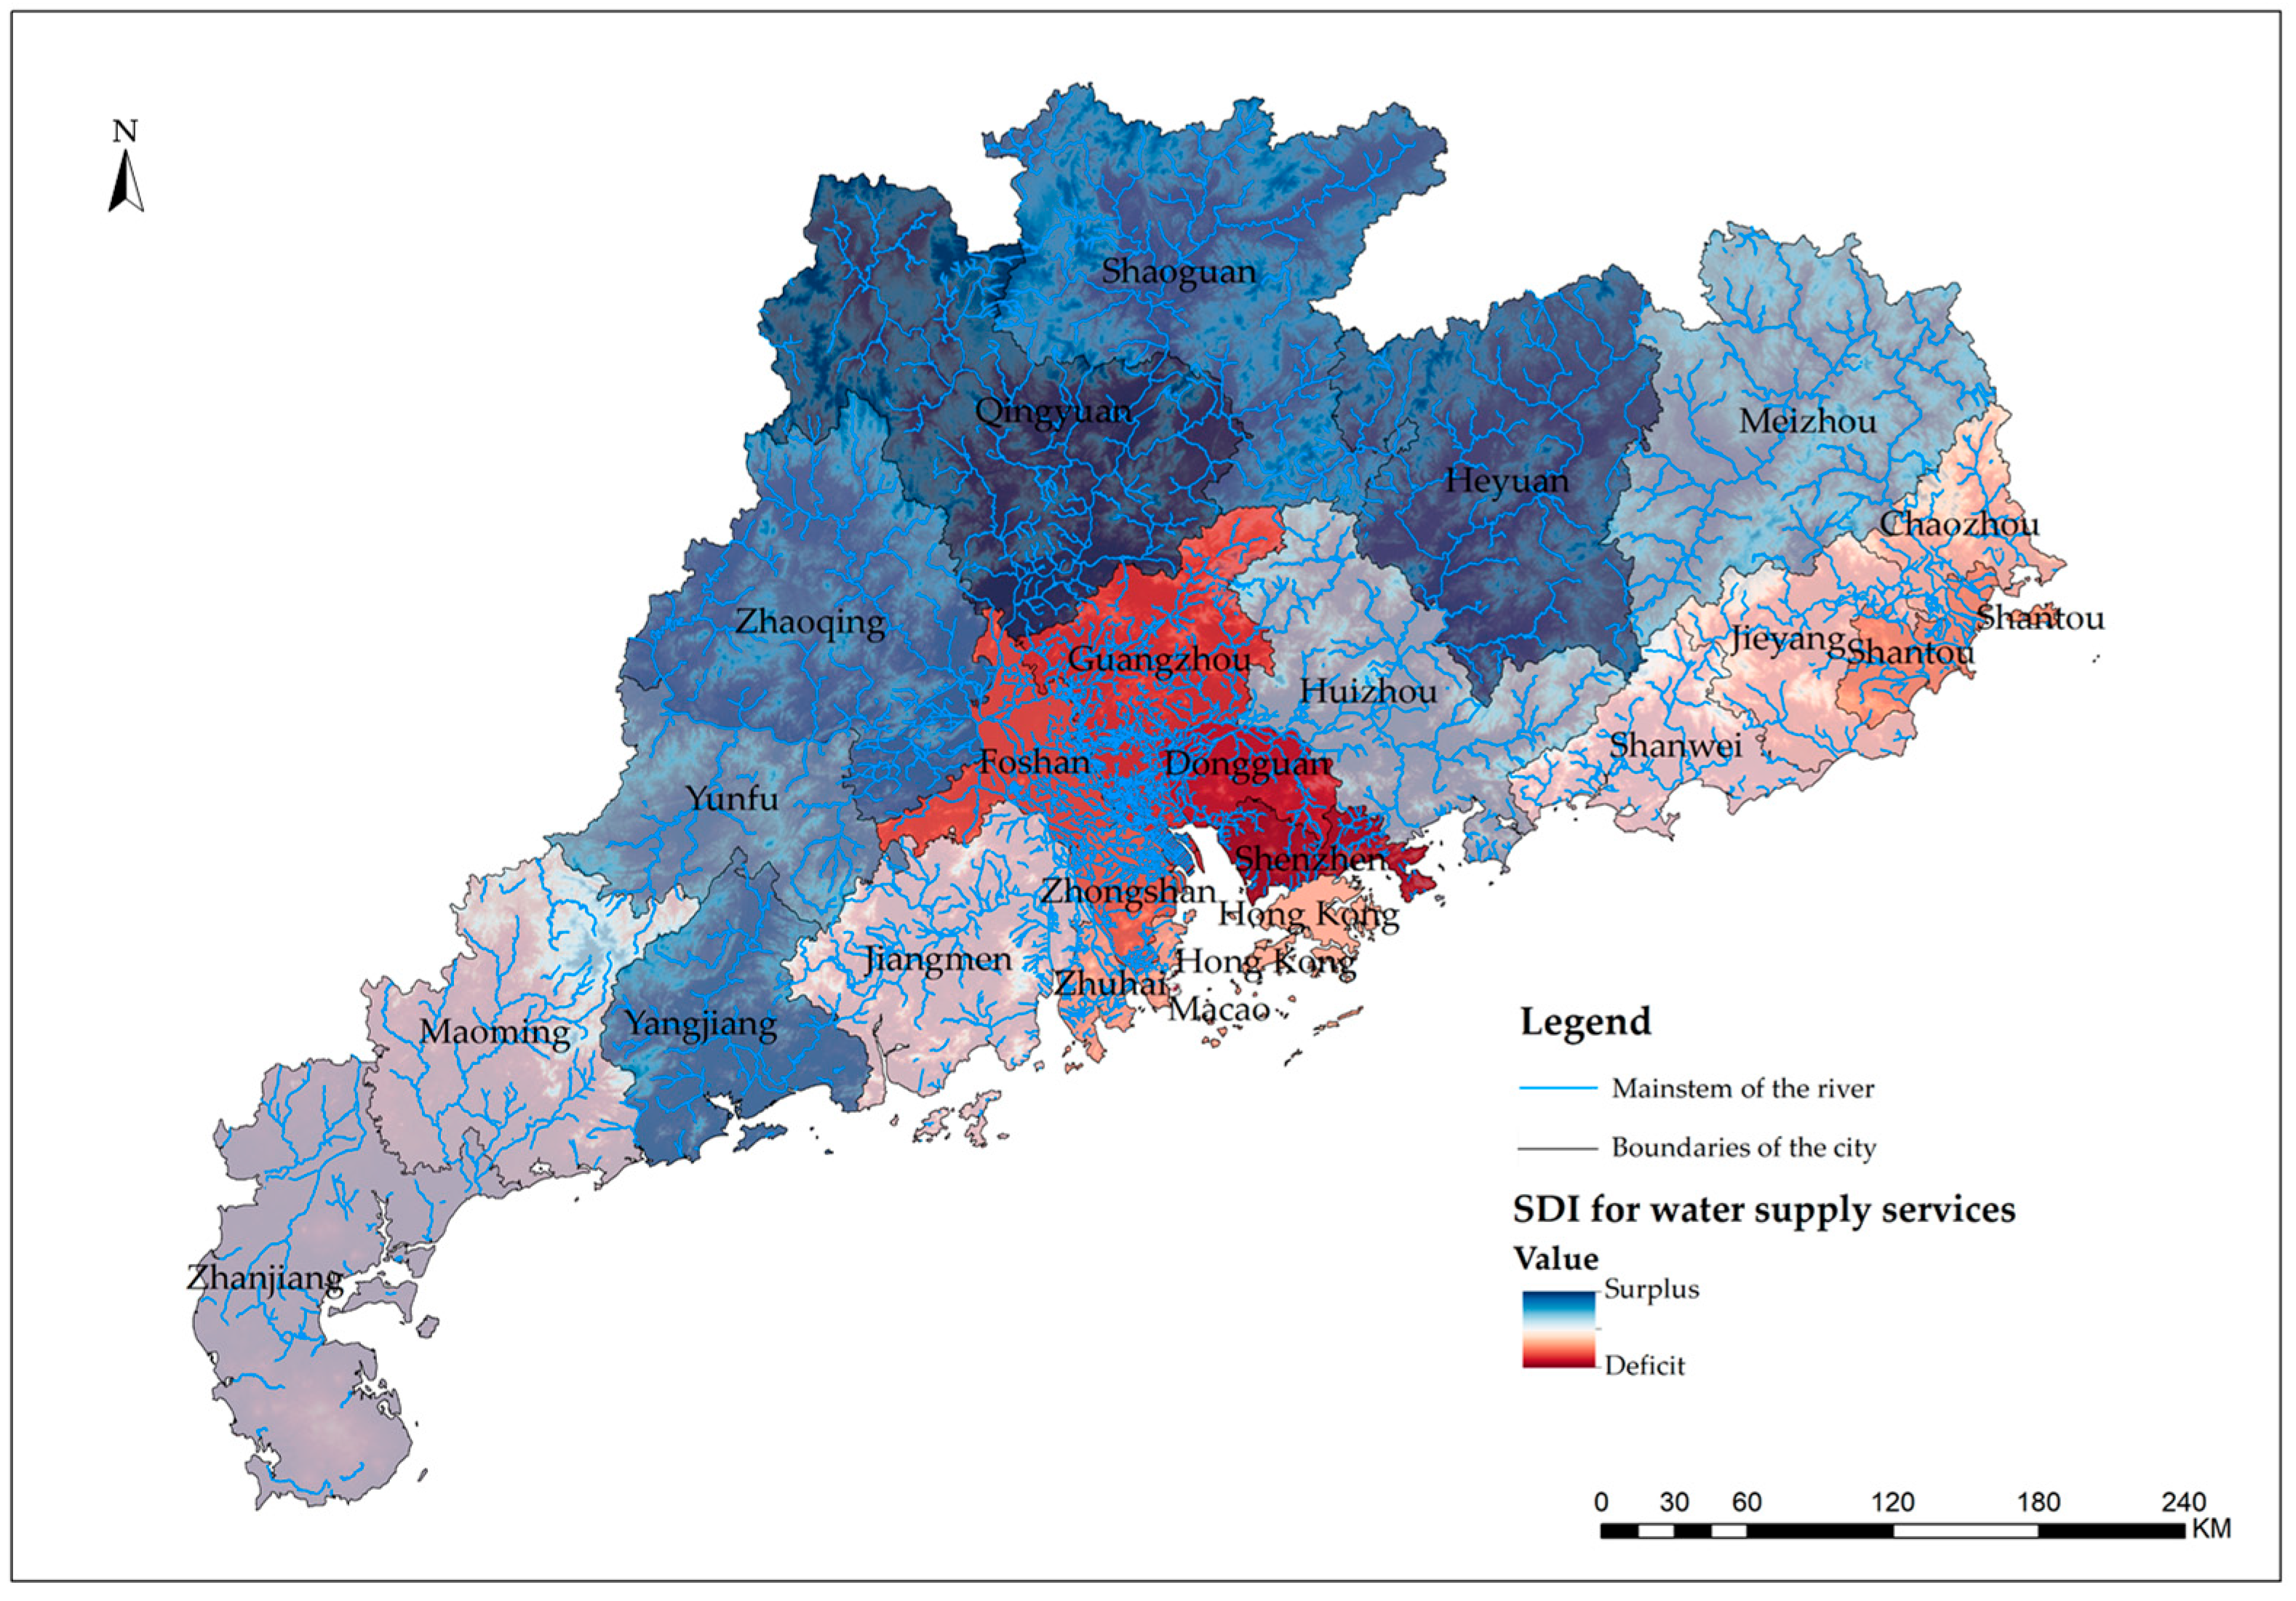
The spatial distribution map of water yield service supply–demand matching in the study area (Figure 5) exhibits pronounced north–south differentiation characteristics. High SDI value zones (depicted in deep blue) are predominantly concentrated in northern mountainous areas, exemplified by Shaoguan, Qingyuan, and Heyuan, where regional water yield substantially exceeds local demand, assuming ecological functions of water conservation and export.
Figure 5.
Spatial Distribution Map of Water Yield Service SDI Values in the Guangdong–Hong Kong–Macao Region, 2024.
Proceeding southward toward the Pearl River Delta core area, SDI values demonstrate a declining trend, with cities such as Guangzhou, Foshan, Dongguan, and Shenzhen exhibiting lighter coloration, reflecting water supply gaps in densely populated and economically developed regions. Hong Kong and Macao, as highly urbanized regions, exhibit low SDI values with extremely pronounced dependence on cross-border water supply.
Based on SDI values, the 23 administrative units can be classified into three distinct categories (Table 5):
Table 5.
Classification of Water Yield Service Supply–Demand Matching Types in the Study Area, 2024.
- (1)
- Supply Surplus Zone (SDI > 5)
This category encompasses 12 cities: Qingyuan (SDI = 15.32), Heyuan (SDI = 14.99), Shaoguan (SDI = 13.90), Zhaoqing (SDI = 12.39), Yangjiang (SDI = 11.25), Yunfu (SDI = 11.02), Meizhou (SDI = 10.11), Huizhou (SDI = 7.63), Zhanjiang (SDI = 7.47), Maoming (SDI = 6.67), Jiangmen (SDI = 5.89), and Shanwei (SDI = 5.30). Water yield service supply in these cities substantially exceeds local demand, positioning them as critical water source areas within the study region that assume the function of supplying water to the Pearl River Delta core area.
- (2)
- Supply–Demand Equilibrium Zone (1 < SDI ≤ 5)
This category comprises six cities: Zhuhai (SDI = 3.74), Shantou (SDI = 1.93), Zhongshan (SDI = 1.18), Hong Kong (SDI = 1.27), Jieyang (SDI = 4.72), and Chaozhou (SDI = 4.19). Water yield service supply in these cities marginally exceeds demand, with relatively coordinated supply–demand relationships.
- (3)
- Supply Deficit Zone (SDI ≤ 1)
This category encompasses five cities: Guangzhou (SDI = 0.86), Foshan (SDI = 0.97), Dongguan (SDI = 0.80), Shenzhen (SDI = 0.23), and Macao (SDI = −0.32). Water yield service supply in these cities inadequately meets local demand, with substantial dependence on external water supply sources. Notably, Macao exhibits a negative SDI value, indicating that its water yield service supply completely fails to satisfy local demand, necessitating complete reliance on cross-border water supply.
Water yield service supply–demand matching in the study area exhibits pronounced spatial mismatch characteristics. High-value supply zones are predominantly distributed in western coastal areas and northern mountainous regions of Guangdong, while high-value demand zones are concentrated in Pearl River Delta core cities. This spatial mismatch pattern in supply and demand constitutes the core challenge for water resource management in the study region.
- (1)
- Pattern of Overall Higher SDI Values in Northern Regions Compared to Southern Regions
The Northern Guangdong mountainous area (Qingyuan, Shaoguan, Heyuan, and Yunfu) constitutes the most critical water source zone within the study region, with SDI values consistently exceeding 10 and water yield service supply substantially surpassing local demand. In contrast, Pearl River Delta core cities (Shenzhen, Dongguan, Guangzhou, and Foshan) serve as primary water resource consumption zones, with SDI values all below 1 and water yield service supply failing to adequately meet local demand. The formation of this pattern characterized by higher northern SDI and lower southern SDI values is closely associated with regional development trajectories: the Pearl River Delta core area has experienced rapid economic development and high population concentration, with continuously escalating water demand; while the Northern Guangdong mountainous area, functioning as an ecological conservation zone, assumes water source protection responsibilities with limited industrial development and relatively lower population density.
- (2)
- Prominence of Cross-Border Water Supply Dependence
The pronounced dependence of Hong Kong and Macao Special Administrative Regions on cross-border water supply represents a quintessential manifestation of the study region’s supply–demand pattern. Hong Kong’s water supply relies substantially on the East River water transfer scheme, while Macao primarily depends on water supply from Zhuhai. Such cross-border water resource dependence relationships not only augment the complexity of water supply security assurance but also impose more stringent requirements on cross-administrative regional water resource collaborative management.
- (3)
- Institutional Drivers of Supply–Demand Mismatch
Cross-institutional contexts further exacerbate the management challenges associated with the supply–demand mismatch pattern. Pronounced heterogeneity exists among mainland cities, Hong Kong, and Macao across multiple dimensions, including water resource management systems, data statistical standards, and planning coordination mechanisms, resulting in inadequate water resource supply–demand information sharing and incomplete collaborative scheduling mechanisms. For instance, discrepancies between water use data statistical standards in Hong Kong and Macao compared to mainland practices increase uncertainties in regional water resource supply–demand analysis.
5. Discussion and Conclusions
5.1. Discussion
Although this study does not explicitly compute deviations from long-term mean precipitation, existing climatological records indicate that 2024 does not represent an extreme wet or dry year in the Pearl River Delta, but rather falls within a near-normal hydrological range.
This study’s findings on water yield service supply–demand matching indicate that precipitation is the dominant controlling factor of water yield supply, consistent with the hydrological structure embedded in the Budyko-based InVEST framework. However, the interpretation of high water yield values in urban areas requires careful consideration. Within the model structure, higher water yield in impervious surfaces is primarily a consequence of reduced evapotranspiration rather than an increase in physically accessible or utilizable water resources. In other words, the model captures changes in water balance components rather than actual water availability for human use.
Therefore, theoretical water yield derived from the InVEST model should not be directly interpreted as usable water supply, especially in highly urbanized regions. A substantial proportion of modeled water yield in cities such as Shenzhen, Hong Kong, and Macao represents rapid surface runoff generated under impervious conditions. This runoff is typically characterized by short residence time, limited storage capacity, and low direct usability, and may instead increase the risk of urban waterlogging and drainage pressure rather than contributing to effective water supply.
It should also be emphasized that the reliability of these results is influenced by multiple sources of uncertainty inherent in both input data and model structure. Key meteorological inputs, including precipitation and reference evapotranspiration, may introduce bias due to spatial interpolation and data resolution limitations. Land use/land cover classification accuracy also affects the estimation of evapotranspiration and runoff coefficients, particularly in heterogeneous urban–rural transition zones. In addition, model parameters such as the Z factor (reflecting seasonal rainfall distribution) and PAWC (plant available water content) introduce further uncertainty due to regional variability and empirical calibration constraints.
From a structural perspective, the InVEST model does not explicitly represent several important hydrological processes, including surface runoff routing, groundwater flow, inter-basin water exchange, and reservoir regulation. This simplification may lead to systematic bias in complex hydrological environments, particularly in highly regulated and highly urbanized catchments where human interventions strongly modify natural flow regimes. As a result, the model outputs are more suitable for representing long-term spatial patterns and relative differences in water yield rather than precise quantification of hydrologically observed runoff.
5.2. Conclusions
This study develops a spatially explicit framework for assessing water yield supply–demand relationships in the Guangdong–Hong Kong–Macao Greater Bay Area by integrating the InVEST model with municipal statistical data. The framework enables a quantitative evaluation of spatial mismatches between ecological water supply and socio-economic water demand under a cross-administrative regional system.
The results show that: (1) Water yield supply exhibits significant spatial heterogeneity across the Guangdong–Hong Kong–Macao region. In addition, several highly urbanized cities show relatively high modeled water yield values, which should be interpreted cautiously considering the influence of impervious surfaces in the InVEST model. (2) Water demand is highly concentrated in the Pearl River Delta core cities, driven by dense population distribution, intensive economic activities, and rapid urbanization. The mismatch between supply and demand presents a spatial differentiation pattern, with mountainous areas generally providing higher local supply capacity, whereas urbanized areas exhibit stronger dependence on external water resources. (3) The study further reveals that cross-regional water resource coordination is important under heterogeneous institutional contexts, as local water yield capacity does not necessarily correspond to actual water availability due to differences in demand intensity, infrastructure, and management systems.
Overall, the study provides empirical evidence on spatial water resource imbalance and cross-regional dependency patterns in rapidly urbanizing coastal megaregions, offering implications for improving coordinated water resource management across administrative boundaries.
The overall pattern of higher SDI values in northern regions compared with southern regions is consistent with findings from other major Chinese urban agglomerations such as the Beijing–Tianjin–Hebei region and the Yellow River Basin. However, this study focuses on a cross-institutional context, where differences in administrative systems, water transfer infrastructures, and statistical standards jointly shape supply–demand relationships. The cases of Hong Kong and Macao further illustrate this complexity. Hong Kong shows a relatively balanced SDI value but remains highly dependent on external water transfer systems, while Macao exhibits persistent water deficit conditions due to limited local supply capacity. These results should be interpreted as spatial dependency patterns. In this study, resilience is used only as an interpretive perspective to describe spatial imbalance, rather than a measurable outcome of system performance or governance effectiveness.
Author Contributions
Conceptualization, W.-L.H. and H.-L.L.; methodology, W.-L.H.; software, K.L.; validation, W.-L.H., H.-L.L. and K.L.; formal analysis, K.L.; investigation, W.-L.H.; resources, W.-L.H.; data curation, W.-L.H.; writing—original draft preparation, W.-L.H.; writing—review and editing, W.-L.H.; visualization, W.-L.H.; supervision, W.-L.H.; project administration, W.-L.H.; funding acquisition, W.-L.H. All authors have read and agreed to the published version of the manuscript.
Funding
This research was funded by Guangdong Science and Technology (grant number: 2024A0505050031).
Institutional Review Board Statement
Not applicable.
Informed Consent Statement
Not applicable.
Data Availability Statement
The original contributions presented in this study are included in the article. Further inquiries can be directed at the corresponding author.
Acknowledgments
The authors thank everyone who aided with scientific research.
Conflicts of Interest
The authors declare no conflicts of interest.
Abbreviations
The following abbreviations are used in this manuscript:
| ARIES | Artificial Intelligence for Ecosystem Services |
| DEM | Digital Elevation Model |
| ES | Ecosystem Services |
| GBA | Greater Bay Area |
| GDP | Gross Domestic Product |
| GHKM | Guangdong–Hong Kong–Macao |
| InVEST | Integrated Valuation of Ecosystem Services and Tradeoffs |
| LULC | Land Use/Land Cover |
| PAWC | Plant Available Water Capacity |
| SDI | Supply–Demand Index |
| SWAT | Soil and Water Assessment Tool |
References
- Flörke, M.; Kynast, E.; Bärlund, I.; Eisner, S.; Wimmer, F.; Alcamo, J. Domestic and industrial water uses of the past 60 years as a mirror of socio-economic development: A global simulation study. Glob. Environ. Change 2013, 23, 144–156. [Google Scholar] [CrossRef] [Scilit]
- Mekonnen, M.M.; Hoekstra, A.Y. Four billion people facing severe water scarcity. Sci. Adv. 2016, 2, e1500323. [Google Scholar] [CrossRef] [Scilit] [PubMed]
- Haddeland, I.; Heinke, J.; Biemans, H.; Eisner, S.; Flörke, M.; Hanasaki, N.; Konzmann, M.; Ludwig, F.; Masaki, Y.; Schewe, J. Global water resources affected by human interventions and climate change. Proc. Natl. Acad. Sci. USA 2014, 111, 3251–3256. [Google Scholar] [CrossRef] [Scilit] [PubMed]
- Schewe, J.; Heinke, J.; Gerten, D.; Haddeland, I.; Arnell, N.W.; Clark, D.B.; Dankers, R.; Eisner, S.; Fekete, B.M.; Colón-González, F.J.; et al. Multimodel assessment of water scarcity under climate change. Proc. Natl. Acad. Sci. USA 2014, 111, 3245–3250. [Google Scholar] [CrossRef] [Scilit] [PubMed]
- Ma, T.; Sun, S.; Fu, G.; Hall, J.W.; Ni, Y.; He, L.; Yi, J.; Zhao, N.; Du, Y.; Pei, T.; et al. Pollution exacerbates China’s water scarcity and its regional inequality. Nat. Commun. 2020, 11, 650. [Google Scholar] [CrossRef] [Scilit] [PubMed]
- Jiang, Y. China’s water security: Current status, emerging challenges and future prospects. Environ. Sci. Policy 2015, 54, 106–125. [Google Scholar] [CrossRef] [Scilit]
- Ma, X.; Liu, S.; Guo, L.; Zhang, J.; Feng, C.; Feng, M.; Li, Y. Evolution and Analysis of Water Yield under the Change of Land Use and Climate Change Based on the PLUS-InVEST Model: A Case Study of the Yellow River Basin in Henan Province. Water 2024, 16, 2551. [Google Scholar] [CrossRef] [Scilit]
- Liu, G.; Wang, W. Competing Effects of Vegetation Greening-Induced Changes in Summer Evapotranspiration and Precipitation on Water Yield in the Yangtze River Basin Based on WRF Simulations. Water Resour. Res. 2025, 61, 3. [Google Scholar] [CrossRef] [Scilit]
- Sheng, S.; Huang, J. Spatiotemporal Dynamics and Driving Mechanisms of Ecosystem Services in the Beijing–Tianjin–Hebei Urban Agglomeration: Implications for Sustainable Land Use Planning. Land 2025, 14, 969. [Google Scholar] [CrossRef] [Scilit]
- Gong, L.; Liang, K. Assessing the Climate and Land Use Impacts on Water Yield in the Upper Yellow River Basin: A Forest-Urbanizing Ecological Hotspot. Forests 2025, 16, 1304. [Google Scholar] [CrossRef] [Scilit]
- Gong, S.; Zhang, Y.; Pu, X.; Wang, X.; Zhuang, Q.; Bai, W. Assessing and Predicting Ecosystem Services and Their Trade-Offs/Synergies Based on Land Use Change in Beijing–Tianjin–Hebei Region. Sustainability 2024, 16, 5609. [Google Scholar] [CrossRef] [Scilit]
- Burkhard, B.; Kroll, F.; Nedkov, S.; Müller, F. Mapping ecosystem service supply, demand and budgets. Ecol. Indic. 2012, 21, 17–29. [Google Scholar] [CrossRef] [Scilit]
- Song, S.; Fang, L.; Yang, J.; Zhou, R.; Bai, G.; Qiu, Y. The Spatial-Temporal Matching Characteristics of Water Resources and Socio-Economic Development Factors: A Case Study of Guangdong Province. Water 2024, 16, 362. [Google Scholar] [CrossRef] [Scilit]
- Li, Z.Z.; Hu, B.; Qin, Y.; Cheng, X. Drivers of spatiotemporal disparities in the supply-demand budget of ecosystem services: A case study in the Beijing-Tianjin-Hebei urban agglomeration, China. Front. Environ. Sci. 2022, 10, 2022. [Google Scholar] [CrossRef] [Scilit]
- Jiang, Y.; Ouyang, B.; Yan, Z. Spatial Correlation between the Changes in Supply and Demand for Water-Related Ecosystem Services. ISPRS Int. J. Geo-Inf. 2024, 13, 68. [Google Scholar] [CrossRef] [Scilit]
- Sommese, F. Nature-Based Solutions to Enhance Urban Resilience in the Climate Change and Post-Pandemic Era: A Taxonomy for the Built Environment. Buildings 2024, 14, 2190. [Google Scholar] [CrossRef] [Scilit]
- Wang, Y.; Huang, C.; Wu, G.; Wang, W. Status and challenges of water resources and supply in the Guangdong-Hong Kong-Macao Greater Bay Area (GBA) of China. Water Cycle 2022, 3, 65–70. [Google Scholar] [CrossRef] [Scilit]
- Brauman, K.A.; Daily, G.C.; Duarte, T.K.e.; Mooney, H.A. The Nature and Value of Ecosystem Services: An Overview Highlighting Hydrologic Services. Annu. Rev. Environ. Resour. 2007, 32, 67–98. [Google Scholar] [CrossRef] [Scilit]
- Ecosystems and Human Well-Being: Current State and Trends: Findings of the Condition and Trends. Available online: https://www.researchgate.net/publication/266373793_Ecosystems_and_Human_Well-Being_Current_State_and_Trends_Findings_of_the_Condition_and_Trends_Working_Group_Millennium_Ecosystem_Assessment_Series (accessed on 1 May 2026).
- Daily, G.C. Nature’s Services: Societal Dependence on Natural Ecosystems; Island Press: Washington, WA, USA, 1997. [Google Scholar]
- Liu, J.; Yang, H.; Gosling, S.N.; Kummu, M.; Flörke, M.; Pfister, S.; Hanasaki, N.; Wada, Y.; Zhang, X.; Zheng, C.; et al. Water scarcity assessments in the past, present and future. Earth’s Future 2017, 5, 545–559. [Google Scholar] [CrossRef] [Scilit] [PubMed]
- Yin, G.; Wang, X.; Zhang, X.; Fu, Y.; Hao, F.; Hu, Q. InVEST Model-Based Estimation of Water Yield in North China and Its Sensitivities to Climate Variables. Water 2020, 12, 1692. [Google Scholar] [CrossRef] [Scilit]
- Wei, P.; Chen, S.; Wu, M.; Deng, Y.; Xu, H.; Jia, Y.; Liu, F. Using the InVEST Model to Assess the Impacts of Climate and Land Use Changes on Water Yield in the Upstream Regions of the Shule River Basin. Water 2021, 13, 1250. [Google Scholar] [CrossRef] [Scilit]
- Wu, C.; Qiu, D.; Gao, P.; Mu, X.; Zhao, G. Application of the InVEST model for assessing water yield and its response to precipitation and land use in the Weihe River Basin, China. J. Arid Land 2022, 14, 426–440. [Google Scholar] [CrossRef] [Scilit]
- InVEST 3.6.0 User’s Guide: Integrated Valuation of Ecosystem Services and Tradeoffs. Available online: https://invest.readthedocs.io/en/latest/index.html (accessed on 1 May 2026).
- Zhang, L.; Potter, N.; Hickel, K.; Zhang, Y.; Shao, Q. Water balance modeling over variable time scales based on the Budyko framework—Model development and testing. J. Hydrol. 2008, 360, 117–131. [Google Scholar] [CrossRef] [Scilit]
- Pei, H.; Liu, M.; Shen, Y.; Xu, K.; Zhang, H.; Li, Y.; Luo, J. Quantifying impacts of climate dynamics and land-use changes on water yield service in the agro-pastoral ecotone of northern China. Sci. Total Environ. 2022, 809, 151153. [Google Scholar] [CrossRef] [Scilit] [PubMed]
- Wu, L.; Xu, Y.; Yang, Z.; Ma, X. Factors Influencing the Spatial Differentiation of Water Yield: Statistics and Appraisals with Predictors of Subbasins. J. Hydrol. Eng. 2025, 30, 04024048. [Google Scholar] [CrossRef] [Scilit]
- Zhao, X.; Li, S.; Pu, J.; Miao, P.; Wang, Q.; Tan, K. Optimization of the national land space based on the coordination of urban-agricultural-ecological functions in the Karst Areas of Southwest China. Sustainability 2019, 11, 6752. [Google Scholar] [CrossRef] [Scilit]
- Costanza, R.; d’Arge, R.; de Groot, R.; Farber, S.; Grasso, M.; Hannon, B.; Limburg, K.; Naeem, S.; O’Neill, R.V.; Paruelo, J.; et al. The value of the world’s ecosystem services and natural capital. Nature 1997, 387, 253–260. [Google Scholar] [CrossRef] [Scilit]
- Kroll, F.; Müller, F.; Haase, D.; Fohrer, N. Rural–urban gradient analysis of ecosystem services supply and demand dynamics. Land Use Policy 2012, 29, 521–535. [Google Scholar] [CrossRef] [Scilit]
- Li, K.; Goslee, S.C. Modeling tools for ecosystem service tradeoffs and synergies in agricultural landscapes. J. Soil Water Conserv. 2025, 80, 521–537. [Google Scholar] [CrossRef] [Scilit]
- Ma, Y.; Chen, H.; Yang, M.; Zhang, J.; Wang, J.; Huang, J. Assessment of supply–demand relationships considering the interregional flow of ecosystem services. Environ. Sci. Pollut. Res. 2024, 31, 27710–27729. [Google Scholar] [CrossRef] [Scilit] [PubMed]
- Yin, D.; Yu, H.; Shi, Y.; Zhao, M.; Zhang, J.; Li, X. Matching supply and demand for ecosystem services in the Yellow River Basin, China: A perspective of the water-energy-food nexus. J. Clean. Prod. 2023, 384, 135469. [Google Scholar] [CrossRef] [Scilit]
- Zhang, J.; Qi, H.; Han, H. Analysis of temporal and spatial changes in the supply and demand relationship of ecosystem services in the transition zone from the Loess Plateau to the Qingzang Plateau. J. Environ. Eng. Technol. 2025, 15, 1375–1386. [Google Scholar] [CrossRef]
- Digital Elevation Model (DEM) Data. Available online: http://www.gscloud.cn/ (accessed on 1 May 2026).
- 1-km Monthly Precipitation Dataset for China (1901–2024). Available online: https://data.tpdc.ac.cn/ (accessed on 1 May 2026).
- 1-km Monthly Potential Evapotranspiration Dataset for China (1901–2024). Available online: https://data.tpdc.ac.cn/zh-hans/data/8b11da09-1a40-4014-bd3d-2b86e6dccad4 (accessed on 1 May 2026).
- Soil Data. Available online: https://data.tpdc.ac.cn/zh-hans/data/844010ba-d359-4020-bf76-2b58806f9205 (accessed on 1 May 2026).
- Guangdong Statistical Yearbook 2024. Available online: https://www.stats.gov.cn/fw/dftjxmgl/dftjdczd/gd/ (accessed on 1 May 2026).
- Hu, W.; Li, G.; Gao, Z.; Jia, G.; Wang, Z.; Li, Y. Assessment of the impact of the Poplar Ecological Retreat Project on water conservation in the Dongting Lake wetland region using the InVEST model. Sci. Total Environ. 2020, 733, 139423. [Google Scholar] [CrossRef] [Scilit] [PubMed]
- Xu, W.; Xiao, Y.; Zhang, J.; Yang, W.; Zhang, L.; Hull, V.; Wang, Z.; Zheng, H.; Liu, J.; Polasky, S.; et al. Strengthening protected areas for biodiversity and ecosystem services in China. Proc. Natl. Acad. Sci. USA 2017, 114, 1601–1606. [Google Scholar] [CrossRef] [Scilit] [PubMed]
- Biao, Z.; Wenhua, L.; Gaodi, X.; Yu, X. Water conservation of forest ecosystem in Beijing and its value. Ecol. Econ. 2010, 69, 1416–1426. [Google Scholar] [CrossRef] [Scilit]
- Šatalová, B.; Kenderessy, P. Assessment of water retention function as tool to improve integrated watershed management (case study of Poprad river basin, Slovakia). Sci. Total Environ. 2017, 599–600, 1082–1089. [Google Scholar] [CrossRef] [Scilit] [PubMed]
- Baopu, F. On the Calculation of Evaporation From Soil. Sci. Meteorol. Sin. 1996, 12, 289–293. [Google Scholar] [CrossRef] [Scilit]
- Yao, J.; Mao, W.; Yang, Q.; Xu, X.; Liu, Z. Annual actual evapotranspiration in inland river catchments of China based on the Budyko framework. Stoch. Environ. Res. Risk Assess. 2017, 31, 1409–1421. [Google Scholar] [CrossRef] [Scilit]
- Donohue, R.J.; Roderick, M.L.; McVicar, T.R. Roots, storms and soil pores: Incorporating key ecohydrological processes into Budyko’s hydrological model. J. Hydrol. 2012, 436–437, 35–50. [Google Scholar] [CrossRef] [Scilit]
- Redhead, J.W.; Stratford, C.; Sharps, K.; Jones, L.; Ziv, G.; Clarke, D.; Oliver, T.H.; Bullock, J.M. Empirical validation of the InVEST water yield ecosystem service model at a national scale. Sci. Total Environ. 2016, 569–570, 1418–1426. [Google Scholar] [CrossRef] [Scilit] [PubMed]
- Dai, W.; Tan, Y. Study on Multi-Scenario Rain-Flood Disturbance Simulation and Resilient Blue-Green Space Optimization in the Pearl River Delta. Buildings 2024, 14, 3797. [Google Scholar] [CrossRef] [Scilit]

Disclaimer/Publisher’s Note: The statements, opinions and data contained in all publications are solely those of the individual author(s) and contributor(s) and not of MDPI and/or the editor(s). MDPI and/or the editor(s) disclaim responsibility for any injury to people or property resulting from any ideas, methods, instructions or products referred to in the content. |
© 2026 by the authors. Licensee MDPI, Basel, Switzerland. This article is an open access article distributed under the terms and conditions of the Creative Commons Attribution (CC BY) license.