Article

Multi-Scenario Simulation and Driving Factor Analysis of Carbon Storage Based on PLUS-InVEST and XGBoost-SHAP Models: A Study from Weihe River Basin, China


1
School of Architecture and Surveying Engineering, Shanxi Datong University, Datong 037003, China
2
School of Coal Engineering, Shanxi Datong University, Datong 037003, China
3
School of Resources and Environmental Engineering, Anhui University, Hefei 230601, China
*
Author to whom correspondence should be addressed.
Sustainability 2026, 18(15), 7775; https://doi.org/10.3390/su18157775
Submission received: 20 June 2026 / Revised: 14 July 2026 / Accepted: 20 July 2026 / Published: 31 July 2026

Abstract

Against China’s dual-carbon strategy and watershed ecological high-quality development initiatives, exploring land-use-driven carbon storage variations is crucial for watershed spatial governance, ecological restoration and carbon sink improvement. As the Yellow River’s largest tributary, the Weihe River Basin straddles the ecotone of arid–semiarid Northwest China and the eastern monsoon region, with fragile ecosystems, intense human activities and dramatic land-use evolution. Clarifying its spatiotemporal carbon dynamics and nonlinear factor response patterns can support low-carbon ecological regulation and coordinated watershed sustainability. This study integrates PLUS and InVEST models to quantify the spatiotemporal patterns of land use and carbon storage across 2000–2020 land use data. Four development scenarios are established to predict 2030 carbon storage spatial heterogeneity, and an interpretable XGBoost-SHAP framework was employed to disentangle the nonlinear responses of carbon storage to natural and socioeconomic drivers. The results show that basin carbon storage exhibited an overall increasing trend, with a net increase of 452.29 × 10⁴ t over the 2 decades. Spatially, high-carbon areas presented patchy aggregation in the northeast, sporadic distribution in the west and zonal expansion in the south–central basin, while low-carbon areas were concentrated in the downstream Guanzhong Plain urban agglomeration. Land-use transitions represented a major source of regional carbon variability, with forest expansion driven by the Grain-for-Green Program generating the largest carbon sequestration increments. The 2030 scenario simulations revealed elevated carbon storage under natural development, cropland protection, and ecological protection scenarios, with the ecological protection scenario yielding the most prominent carbon gain. Conversely, unconstrained economic expansion coincided with prominent carbon storage declines, which implies that targeted ecological conservation and restoration could help alleviate carbon depletion across the watershed. NDVI, slope, and population density are the primary determinants of carbon storage, exhibiting typical staged nonlinear influencing effects. This study provides reliable scientific references for refined ecological restoration, spatial optimization, and carbon sink enhancement in ecologically fragile river basins.

1. Introduction

Watersheds serve as critical biogeochemical corridors connecting terrestrial and aquatic ecosystems, functioning as fundamental landscape ecological units that regulate regional and global carbon cycling and maintain landscape sustainability. Their robust carbon sequestration capacity stabilizes climatic feedback, improves ecological resilience, and sustains long-term ecosystem service provision [1]. Against the backdrop of accelerating anthropogenic climate warming, China has formally pledged to achieve carbon peaking by 2030 and carbon neutrality by 2060 to promote regional green development and socio-ecological sustainability [2]. Accordingly, enhancing the carbon sink potential of terrestrial ecosystems and mitigating anthropogenic carbon emissions has risen to central research priorities across global ecological research communities [3]. Land-use and land-cover change (LUCC), the dominant human-induced disturbance, reshapes vegetation and soil carbon pools and reorganizes the spatiotemporal distribution of terrestrial carbon storage. Unravelling LUCC–carbon storage coupling mechanisms is therefore critical for boosting ecosystem carbon sequestration and mitigating climate warming [4], and it further reshapes the spatiotemporal distribution patterns of terrestrial carbon storages. Therefore, exploring the effects of land-use transitions on the spatiotemporal evolution of terrestrial carbon storage is essential for enhancing terrestrial ecosystem carbon sequestration capacity and alleviating anthropogenic climate change.
Methodologically, quantifying approaches for ecosystem carbon storage have evolved from traditional field inventory surveys [5], and satellite remote-sensing interpretations [6], to process-based numerical simulation models [7,8]. Field investigations yield precise site-level carbon data, while remote sensing supports large-scale monitoring. Yet, both are constrained by single-ecosystem or single-carbon-pool datasets. In contrast, simulation models exhibit unique advantages, including low data dependency, flexible operability, and robust multi-scale adaptability [9,10,11]. Among prevailing various carbon-storage-assessment models, the Integrated Valuation of Ecosystem Services and Trade-offs (InVEST) model has been widely adopted ecological research due to its modest data requirements, high computational efficiency, and reliable simulation performance. For instance, Zhu et al. [12] deployed the InVEST model to evaluate wetland carbon storage across the Guangdong–Hong Kong–Macao Greater Bay Area, whereas Zeng and Sun [13] coupled the InVEST model with the Multiscale Geographically Weighted Regression (MGWR) model to quantify terrestrial carbon storages and their driving factors throughout the Yellow River Basin. Nevertheless, the InVEST model has inherent limitations in directly simulating future land-use dynamics for multi-scenario carbon-storage prediction. Thus, it is commonly coupled with LUCC simulation models to support sustainable land management decisions.
Classical land-use models, including CA-Markov [14], CLUE-S [15], and FLUS [16], can effectively replicate historical land patterns but fail to capture patch interactions and latent land competition rules. Despite their satisfactory performance in simulating future land-use changes, these models still suffer from deficiencies in capturing spatial interactions, as well as identifying the fundamental driving forces behind land-use transitions and landscape patch evolution. To overcome these methodological bottlenecks, Liang et al. [17] developed the Patch-generating Land-Use Simulation (PLUS) model by introducing a spatial interaction network. This model transforms the implicit and unobservable land competition mechanism into an explicit structural system with interpretable parameters. It can not only accurately simulate the generation and evolution of various land-use patches across temporal and spatial scales but also conduct in-depth analysis on the driving forces of land-use change, thereby improving simulation accuracy and reproducing realistic land-use patterns. For instance, Hou et al. [18] integrated the PLUS and InVEST models to analyze the spatiotemporal variations of land use and carbon storage and conduct multi-scenario simulation in the Dongting Lake Basin. Zhao et al. [19] combined the PLUS-InVEST-Geodetector model to explore the spatiotemporal dynamics and driving factors of ecosystem carbon storage in the Taihu Lake Urban Agglomeration. Cheng et al. [20] further deployed the same coupled workflow to predict carbon-storage changes under diverse scenarios across Shaanxi Province. Collectively, existing carbon storage studies from the perspective of LUCC have increasingly focused on simulating future land-use scenarios and their impacts on carbon storage dynamics.
Nevertheless, carbon storage dynamics arise from synergistic interactions among LUCC transition, natural environmental gradients, and socio-economic drivers. Analysis on the driving mechanisms of carbon storage has become a major research frontier. At present, a suite of statistical tools, including Geodetector [21,22] and Geographically Weighted Regression (GWR) [23,24], have been widely employed to quantify driving effects. eXtreme Gradient Boosting (XGBoost) is an ensemble machine-learning algorithm derived from gradient-boosting decision trees. When integrated with the SHapley Additive exPlanations (SHAP) framework, it can convert the internal decision-making logic of the XGBoost model into visualized feature contribution graphs, enabling quantitative and multi-dimensional visual interpretation of driving factor effects. This integrated modeling approach achieves high-precision prediction and mechanism interpretation, facilitating comprehensive elucidation of the synergistic impacts of natural and socioeconomic factors on carbon storage variability [25,26,27]. However, existing PLUS-InVEST carbon studies mostly focus on spatiotemporal characterization and scenario prediction, lacking quantitative nonlinear threshold identification for driver factors, which restricts targeted low-carbon watershed governance.
The Weihe River Basin, the largest tributary of the Yellow River, provides an ideal natural laboratory for addressing these challenges. Spanning the Loess Plateau and the Guanzhong Plain, the basin epitomizes the coupled human–natural conflicts typical of Northwestern China’s ecologically fragile transition zones. Over the past 2 decades, due to compound disturbances from the Grain-for-Green Program, large-scale ecological conservation and restoration, and rapid urbanization, the land-use patterns have undergone dramatic changes, which profoundly affect the dynamics of regional carbon storage.
Although previous Weihe River studies have extensively investigated LUCC dynamic simulation [28,29], regional and local habitat quality assessment [30,31], and driving interpretation via the Geodetector model and conventional statistical methods [32,33], laying a solid theoretical and methodological basis for understanding the spatiotemporal evolution of watershed ecological pattern evolution, several knowledge gaps remain prominent: (1) systematic quantitative assessments of carbon-storage dynamics induced by historical LUCC transitions are scarce; (2) the majority of driver analyses generally depend on traditional linear statistical models such as Geodetector and GWR, which fail to capture the sophisticated nonlinear carbon-storage responses to the coupled effects of natural and anthropogenic drivers; (3) few studies have implemented scenario-based carbon storage forecasting and quantitative threshold detection of influencing factors tailored to the basin’s typical features of ecological vulnerability and intense human–land contradictions, leading to insufficient quantitative evidence to support refined watershed low-carbon ecological governance.
Accordingly, this study constructs an integrated PLUS-InVEST-XGBoost-SHAP analytical framework to fill the aforementioned gaps. Specifically, three core research objectives are proposed: (1) to reconstruct the spatiotemporal evolution of LUCC and terrestrial carbon storage across the Weihe River Basin from 2000 to 2020; (2) to project 2030 land-use configurations and corresponding carbon storage shifts under four typical development scenarios (natural development, cultivated-land protection, ecological protection, and economic development); and (3) to identify the relative importance, nonlinear marginal effects, and critical response thresholds of natural conditions and socioeconomic activities regulating carbon storage via an interpretable XGBoost-SHAP machine-learning model. This research aims to provide scientific evidence for land-use planning, low-carbon strategy implementation, and the reconciliation of conservation with socio-economic development in the Weihe River Basin. Furthermore, this integrated modelling workflow offers a methodological reference for sustainable carbon sink management of similar watersheds in arid and semi-arid regions.

2. Materials and Methods

2.1. Overview of the Study Area

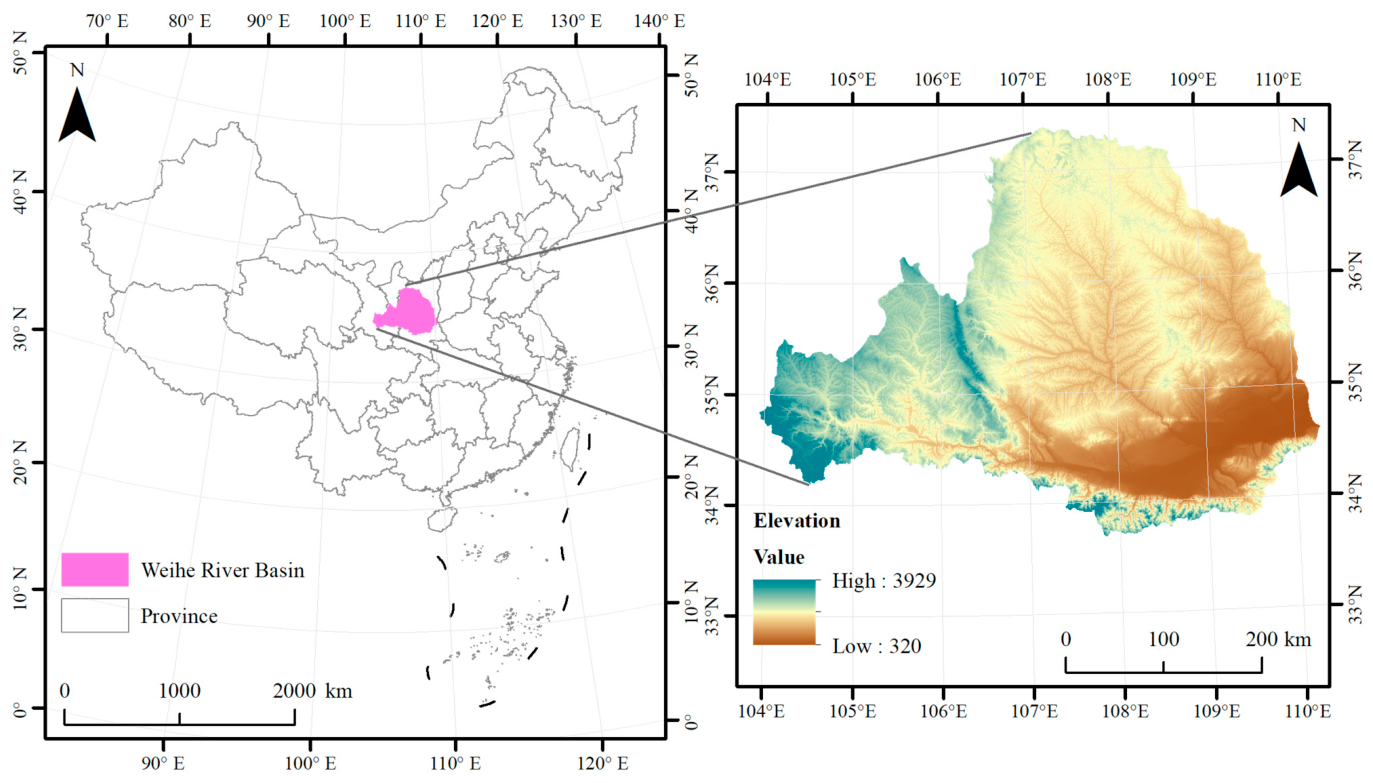
The Weihe River Basin (103.5–110.5° E, 33.5–37.5° N, 13.48 × 10⁴ km2; Figure 1), stretches across Gansu, Ningxia, and Shaanxi, encompassing major cities such as Xi’an and Baoji. Its terrain slopes down from the western and southern highlands to the northeast, forming three differentiated geomorphic zones: forested upstream mountains, severely eroded midstream loess gullies, and populous downstream Guanzhong Plain with vast cropland and built-up areas. Characterized by a warm temperate semi-arid/semi-humid monsoon climate (6–13 °C annual temperature, 400–800 mm annual precipitation), the basin displays remarkable hydrothermal heterogeneity and fragile ecosystems. Cropland, forest, and grassland dominate land cover, whereas construction land clusters on the plain, triggering fierce trade-offs among ecological preservation, grain security, and urban sprawl.
Since the full launch of the Grain-for-Green Program in 1999, the Weihe River Basin has emerged as a vital ecological restoration site featured with geomorphology-dependent land-use shifts. Midstream loess gullies constitute core restoration hotspots, where extensive steep cropland has been transformed into forests and grasslands. Upstream mountains implement enclosure afforestation, forming persistent carbon sinks through biomass and soil organic carbon accumulation. Conversely, downstream Guanzhong Plain sees cropland loss primarily from urban expansion, whose carbon losses partially counteract upstream and midstream carbon sequestration gains. Spatial carbon increments closely match restored regions. Such contrasting carbon budgets between restoration-driven hilly zones and urbanized plains render this basin a representative watershed to unpack LUCC-induced carbon storage dynamics.

2.2. Data Sources and Preprocessing

This study integrated multi-source geospatial datasets to quantify watershed carbon storage and calibrate the PLUS. The datasets used are mainly divided into two categories: historical land-use data and explanatory covariates for simulating LUCC trajectories. To comprehensively capture the multidimensional drivers of land expansion and landscape reorganization, predictor variables were selected across natural environmental and socioeconomic dimensions, following well-established covariate screening protocols from analogous watershed modeling research [34,35,36,37]. Detailed metadata for all input datasets, including spatial resolution, original repositories, and standardized preprocessing pipelines, are summarized in Table 1.
To eliminate systematic biases arising from inconsistent spatial reference and raster resolution discrepancies, all raw geospatial datasets were subjected to unified preprocessing within the ArcGIS tools (https://www.arcgis.com/, accessed on 6 May 2026), consistent with the standardized calibration workflow for PLUS simulation proposed by Liang et al. [17,35]. All raster datasets were resampled to a uniform spatial resolution of 90 m × 90 m, yielding a consistent matrix dimension of 6346 × 6432 pixels. A unified Albers Conic Equal Area projection was assigned to all raster and vector datasets to eliminate areal distortion across the heterogeneous basin terrain, ensuring spatially consistent comparison and quantitative computation of land-use transitions and carbon-storage metrics.

2.3. Research Methods

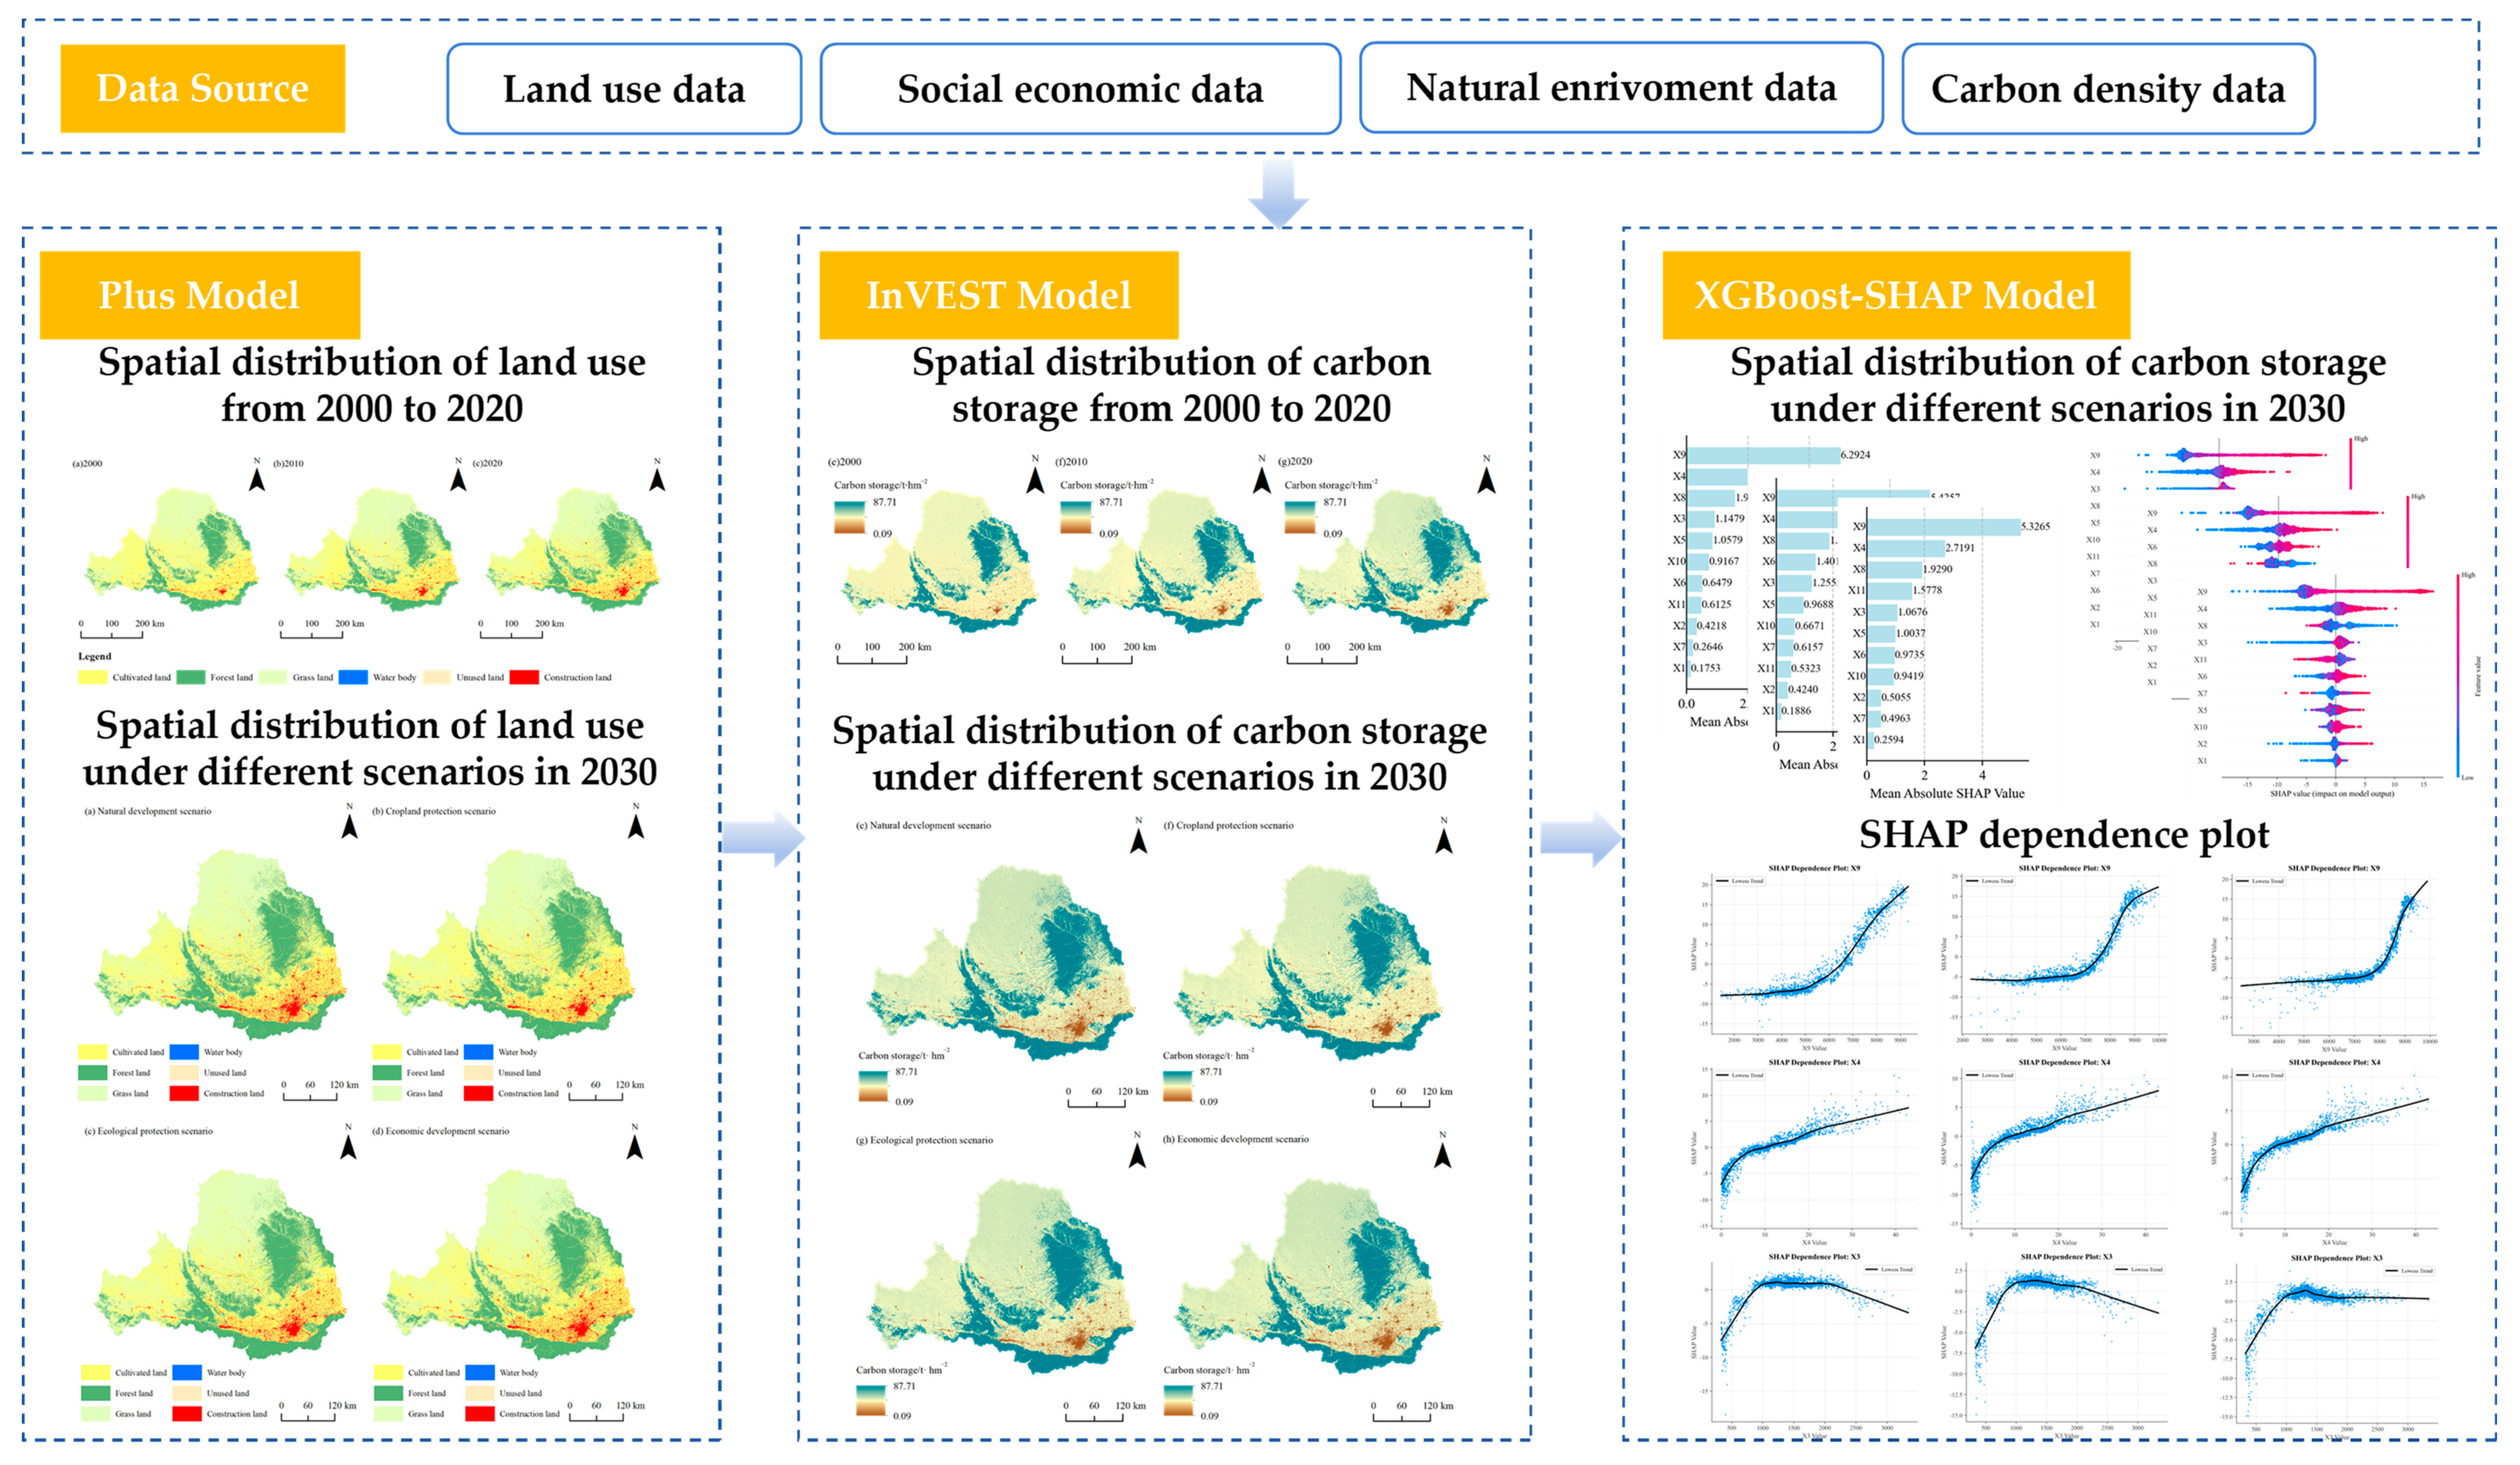
This study integrated the PLUS-InVEST-XGBoost-SHAP modeling framework to explore land-use changes, spatiotemporal evolution of carbon storage, and their underlying driving factors in the Weihe River Basin. The analytical workflow proceeded sequentially as follows: (1) characterize historical LUCC pattern across 2000, 2010, and 2020; (2) simulate future land-use patterns under different 2030 development scenarios using PLUS model; (3) apply the InVEST carbon-storage module to reconstruct carbon-storage distributions for the historical period and four future scenarios; (4) implement the XGBoost-SHAP model to identify the relative importance, directional marginal effects, and critical response thresholds of natural and socioeconomic covariates regulating carbon storage heterogeneity. The detailed technical flowchart of this research is illustrated in Figure 2.

2.3.1. PLUS Model

The PLUS model is a practical and efficient model for simulating land-use patterns and patch dynamics. Its methodological superiority lies in the integration of the Land Expansion Analysis Strategy (LEAS) and Cellular Automata based on Random Seeds (CARS), which can effectively improve the simulation accuracy of LUCC trajectories [17].
In this study, the historical land-use datasets of the Weihe River Basin in 2000 and 2010 were adopted as the basic data sources, paired with the full suite of natural and socioeconomic LUCC covariates outlined in Section 2.2. First, the LEAS module embedded with the random forest algorithm was adopted to quantify the spatial development probability of each land-use type across the entire study area. Afterwards, the CARS module was applied to reconstruct and simulate the spatial pattern of land use in the Weihe River Basin in 2020. Model validation was further conducted by comparing the simulated land-use data in 2020 with the actual observations, with comprehensive confusion matrix, producer’s accuracy, user’s accuracy, and class-wise error metrics provided for elaborate classification assessment (see Table S2). Validation outputs yielded a Kappa coefficient of 0.789 and an overall accuracy of 0.857 [35]; forest and cultivated land exhibited satisfactory simulation performance, whereas fragmented water bodies and unused land presented notable classification deviations that induced slight simulation uncertainties. Nevertheless, such inaccuracies of rare land categories cannot impair the reliability of watershed-scale carbon storage analysis.
(1)
Multi-scenario Settings
To guarantee the objectivity of parameter configuration and the traceability of scenario assumptions, land-use transition adjustment percentages in this study were determined based on three comprehensive and reliable foundations: ① national and provincial statutory planning documents, including the Outline of the Yellow River Basin’s Ecological Protection and High-quality Development Plan (2021) [https://www.gov.cn/zhengce/2021-10/08/content_5641438.htm (accessed on 6 May 2026)], the Revised Regulations on the Protection of the Weihe River of Shaanxi Province (2022) [https://www.shaanxi.gov.cn/zfxxgk/zcwjk/dfxfg/202402/t20240226_2320574.html (accessed on 6 May 2026)], the Tianshui Municipal Weihe River Basin Ecological Protection Regulations (2024) [https://www.maiji.gov.cn/info/13781/516142.htm (accessed on 6 May 2026)], and the Shaanxi Provincial Territorial Spatial Master Plan (2021–2035) [https://www.gov.cn/zhengce/zhengceku/202402/content_6930042.htm (accessed on 6 May 2026)]; ② peer-reviewed regional LUCC simulation studies [36,37,38]; and ③ iterative sensitivity experiments were conducted to optimize the Markov transition coefficients, with a gradient adjustment range of −50% to 50%, and a fixed increment of 10%. Based on the above foundations, four distinctive development scenarios were established for 2030, and the Markov transition probabilities derived from historical LUCC trajectories during 2000–2020 were then adjusted for each scenario to achieve targeted land-use evolution simulations. The detailed scenario configurations are specified as follows:
Natural development scenario (ND): This scenario follows the historical land-use transition rules from 2000 to 2020 without modifying the transition probability among different land-use types and served as the baseline reference for the other three scenarios.
Cultivated land-protection scenario (CP): This scenario prioritized strict cultivated land-protection policies and curb construction land expansion by reducing the transition probability from cultivated land to construction land by 60%.
Ecological protection scenario (EP): This scenario prioritizes human–land relationships, the maintenance of ecosystem stability and biodiversity, and the assurance of regional ecological security. Specifically, the transition probability from cultivated land to construction land was reduced by 30%, the probability of forest and grassland converting to construction land was reduced by 50%, and the probability of cultivated land to forest and grassland was increased by 30%.
Economic development scenario (ED): This scenario optimizes the land-use structure to support industrial development and regional economic growth. The transition probability from construction land to forest, grassland, and water bodies was reduced by 30%, while the transition probabilities from cultivated land, forest, and grassland to construction land were increased by 20%.
The adjustment procedure for target transition probabilities was standardized as follows:
Step 1: Calculate baseline Markov transition probability matrix Pbase(i, j) from historical land-use maps.
Step 2: Scale target transition pairs with fixed coefficient: encouraged conversions use Pscenario(i, j) = Pbase(i, j) × (1 + r), while restricted conversions adopt Pscenario(i, j) = Pbase(i, j) × (1 − r), with r ranging from 0.1–0.5 and corresponding to 10–50% adjustment amplitudes.
Step 3: Normalize each row of the revised matrix to satisfy Markov row-sum constraints (total row probability = 1) and import the matrix into PLUS to acquire 2030 land-use demand under each scenario.
(2)
Neighborhood Weight Parameter Setting
The neighborhood weight parameter ranges from 0 to 1 and characterizes the spontaneous expansion capacity of each land-use type, with higher values indicating stronger spatial expansion tendency (Table 2). The detailed calculation formula is presented as follows:
w i = T A i T A min T A max T A min
where wi denotes neighborhood weight of the i-th land-use type, ranging from 0 to 1. TAi denotes the historical expansion area of the i-th land-use type. TAmin and TAmax represent the minimum and maximum expansion areas among all land-use types, respectively.
(3)
Transition Rule Matrix Parameter Setting
Based on the land-use transition matrix and Markov transition probability matrix of the study area, as well as relevant conservation and environmental policies for the Weihe River Basin, the land-use transition matrices for all scenarios were established (Table 3).

2.3.2. InVEST Model

The InVEST model comprises multiple evaluation modules covering habitat quality, carbon storage, water yield, and other ecological indicators. In this study, the carbon-storage module was adopted to calculate watershed total carbon storage using land-use raster data and carbon density. The relevant equations are expressed as follows:
C i = C i a b o v e + C i b e l o w + C i s o i l + C i d e a d
C t o t a l = i = 1 n C i × S i
where Ci is the carbon density of land-use type i; Ci−above, Ci−below, Ci−soil, and Ci−dead represent the carbon density of aboveground biomass, belowground biomass, soil, and dead organic matter, respectively (unit: Mg·hm−2); Ctotal is the total carbon storage; n denotes the number of land-use types; and Si refers to the area of land-use type i.
Previous studies by Chen et al. [39], Giardina et al. [40], and Alam et al. [41] demonstrated that carbon density presents a significant linear correlation with climate factors. Drawing on nationwide field-measured carbon density datasets [42] and existing watershed-scale research focused on the Yellow River Basin [43], the study further calibrated carbon density parameters by integrating local climatic features and correction frameworks proposed in the previous literature. The original empirical fitting functions linking carbon density to climate drivers are expressed as Equations (4)–(6):
C B P = 6.798 e 0.0054 M A P ( R 2 = 0.70 )
C B T = 28 M A T + 398 ( R 2 = 0.47 ,   P < 0.01 )
C S P = 3.3968 M A P + 39996.1 ( R 2 = 0.11 )
where MAP and MAT represent mean annual precipitation and mean annual temperature; CBP and CBT denote biomass carbon density calculated based on MAP and MAT, respectively; and CSP denotes soil carbon density. Given that the Weihe River Basin is a pivotal sub-basin of the Yellow River Basin with unique hydrothermal conditions, to eliminate regional estimation bias and improve model accuracy, a set of localized correction coefficients was introduced to revise the basin-scale carbon-density parameters. The revised formulas for carbon density are presented as follows:
K B P = C B P C B P
K B T = C B T C B T
K B = K B P × K B T = C B P C B P × C B T C B T
K S = C S P C S P
where KBP and KBT are the precipitation-based and temperature-based correction factors for biomass carbon density, respectively; KB is the overall correction factor for biomass carbon density, and KS is the correction factor for soil carbon density. C′ represents the data of the Weihe River Basin, while C′′ represents the data of the Yellow River Basin. The mean annual temperature of the Yellow River Basin and the Weihe River Basin is 8.2 °C and 7.6 °C, and the mean annual precipitation is 517.1 mm and 673.9 mm, respectively. Equations (7)–(10) were used to calculate the carbon density of each land-use type across the Weihe River Basin, and the results are presented in Table 4.
As indicated in Table 4, the carbon density ranks in descending order as forest land, cultivated land, grassland, unused land, construction land, and water bodies.

2.3.3. XGBoost-SHAP Model

To systematically reveal the driving mechanisms of natural and socio-economic factors on carbon storage associated with land use, this study established an integrated analytical framework of XGBoost-SHAP. A total of 11 driving factors were selected from two dimensions, natural conditions (elevation, slope, aspect, MAP, MAT, NDVI, and NPP), and socio-economic activities (population density, GDP, distance to expressways, and distance to national/provincial highways). These indicators were adopted to quantify the contribution of each factor to carbon storage variations.
(1)
XGBoost Model
XGBoost is an ensemble learning algorithm based on gradient boosting [25]. It constructs high-accuracy prediction by iteratively assembling multiple weak learners and optimizing the objective function in an additive manner. Distinct from conventional gradient boosting algorithms, XGBoost explicitly incorporates a regularization term into the objective function L(t).
L ( t ) = i = 1 n l ( y i , y ^ i ( t ) ) + i = 1 T Ω ( f k )
where l denotes the loss function; yi is the observed value of the i-th sample; y ^ i ( t ) represents the predicted value of the i-th sample at the t-th iteration; n is the total number of samples; T stands for the total number of trees; and Ω ( f k ) is the complexity penalty term of the k-th tree, which is defined as follows:
Ω ( f k ) = γ T + 1 2 λ j = 1 C w j 2
where C refers to the number of leaf nodes of the k-th tree; wj is the weight of leaf nodes; and γ and λ are regularization coefficients. The regularization term constrains model complexity, which effectively improves the generalization capability and mitigates overfitting.
Model performance was assessed using the coefficient of determination (R2), root mean square error (RMSE), and mean absolute error (MAE):
R 2 = 1 i = 1 n y i y ^ i 2 i = 1 n y i y ¯ i 2
R M S E = 1 n i = 1 n y i y ^ i 2
M A E = 1 n i = 1 n y i y ^ i
where yi represents the observed true value of the i-th sample, y ^ i represents the model predicted value, y ¯ represents the mean value of the observed true values, and n denotes the total number of samples. R2 quantifies the explanatory degree of the model for data variability, and a value closer to 1 indicates a higher goodness of fit. RMSE and MAE are dimensional error indicators with units consistent with the original physical unit of the dependent variable, which reflect the overall prediction deviation and average absolute deviation of the model, respectively. Smaller values of these indicators indicate higher model prediction accuracy, lower error fluctuation, and more stable generalization performance.
(2)
SHAP Model
SHAP is a game theory-based model interpretation approach that can quantitatively assess the contribution of each feature to model outputs in a consistent manner. Calculation of SHAP values for influencing factors enables the identification of core driving factors and the exploration of interaction effects among variables [26,27]. The corresponding formula is expressed as:
φ i = S H \ i S ! ( H S 1 ) ! H ! ( t ( S i ) t ( S ) )
where φi is the SHAP value of the i-th influencing factor; H represents the set of all influencing factors; S denotes the feature subset excluding the i-th factor; and t(S) is the model prediction corresponding to the combination of factors within subset S.
(3)
Sampling and Preprocessing
A regular grid center sampling strategy with a 4 km × 4 km spatial interval was adopted to construct a spatially balanced sample database, effectively avoiding the biases of spatial aggregation and uneven distribution caused by random sampling. After removing outliers via the 3σ statistical threshold, a total of 8174 valid samples were retained. The complete dataset was randomly split into a training set (70% of all valid samples) and a test set (30% of all valid samples) for subsequent modeling and preliminary accuracy assessment. To improve the model accuracy and stability, a standardization and multi-level quality control preprocessing workflow was implemented on the dataset. Specifically, samples with extreme outliers of dependent variables were eliminated based on the 3σ statistical threshold to reduce the interference of extreme outliers on model fitting. All independent variables were processed via Z-score standardization to eliminate the dimensional differences of various factors and unify the data scale. Furthermore, the Variance Inflation Factor (VIF) was introduced to diagnose the multicollinearity of independent variables, and high-redundancy features with VIF > 10 were strictly removed to effectively avoid model parameter deviation and fitting distortion induced by multicollinearity.
XGBoost hyperparameters were globally optimized through random search coupled with 3-fold cross-validation. Only 30% of valid grid samples were used for iterative tuning to balance computational cost and precision, covering tree depth, learning rate, base learner count, sampling ratios, and regularization terms. The optimized hyperparameter set was further validated using 5-fold spatial cross-validation across training and test subsets to assess fitting goodness, prediction error, and generalization capacity.
The fully preprocessed full-set samples were employed to train the final XGBoost benchmark model. TreeSHAP was then implemented to compute SHAP values for quantitative driver attribution. Mean absolute SHAP values quantified global feature importance, while Lowess smoothing of SHAP dependence curves uncovered the nonlinear marginal responses and critical response thresholds of individual drivers to carbon storage.

3. Results

3.1. Spatial Distribution Characteristics of Land Use

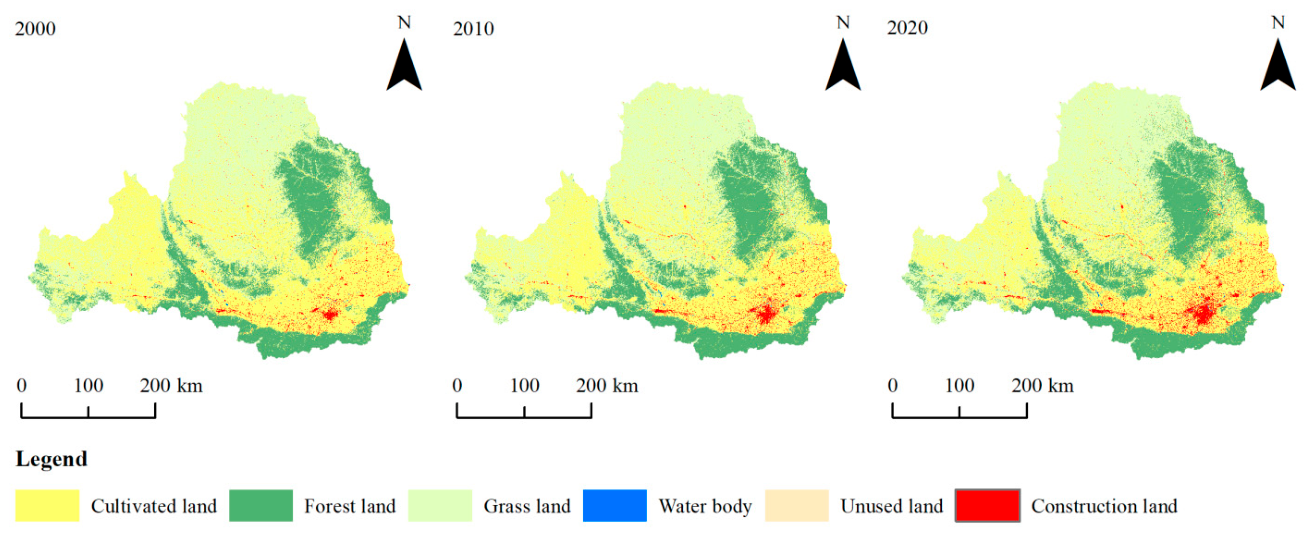
During 2000–2020, cultivated land was the most widespread land-use type in the Weihe River Basin, predominantly concentrated in the upper reaches (Dingxi and Tianshui) and the lower reaches (Baoji, Xianyang, Xi’an and Weinan). Grassland ranked second, occurring as extensive contiguous patches in Qingyang City between the Jinghe River and Beiluo River basins, and as small, fragmented patches interspersed with cultivated land. Forest land was mainly distributed in the southern parts of Baoji, Xi’an, and Weinan in the middle and lower reaches, forming a zonal pattern along the southeast flow direction of the Weihe River. Construction land was sporadically distributed across all cities and counties, with major concentrations on the Guanzhong Plain (Baoji, Xi’an, Xianyang, and Weinan), showing noticeable urban expansion during this period. Water bodies and unused land occupied relatively small areas; water bodies were mainly found in the middle reaches, while unused land appeared as scattered patches interspersed among other types (Figure 3).
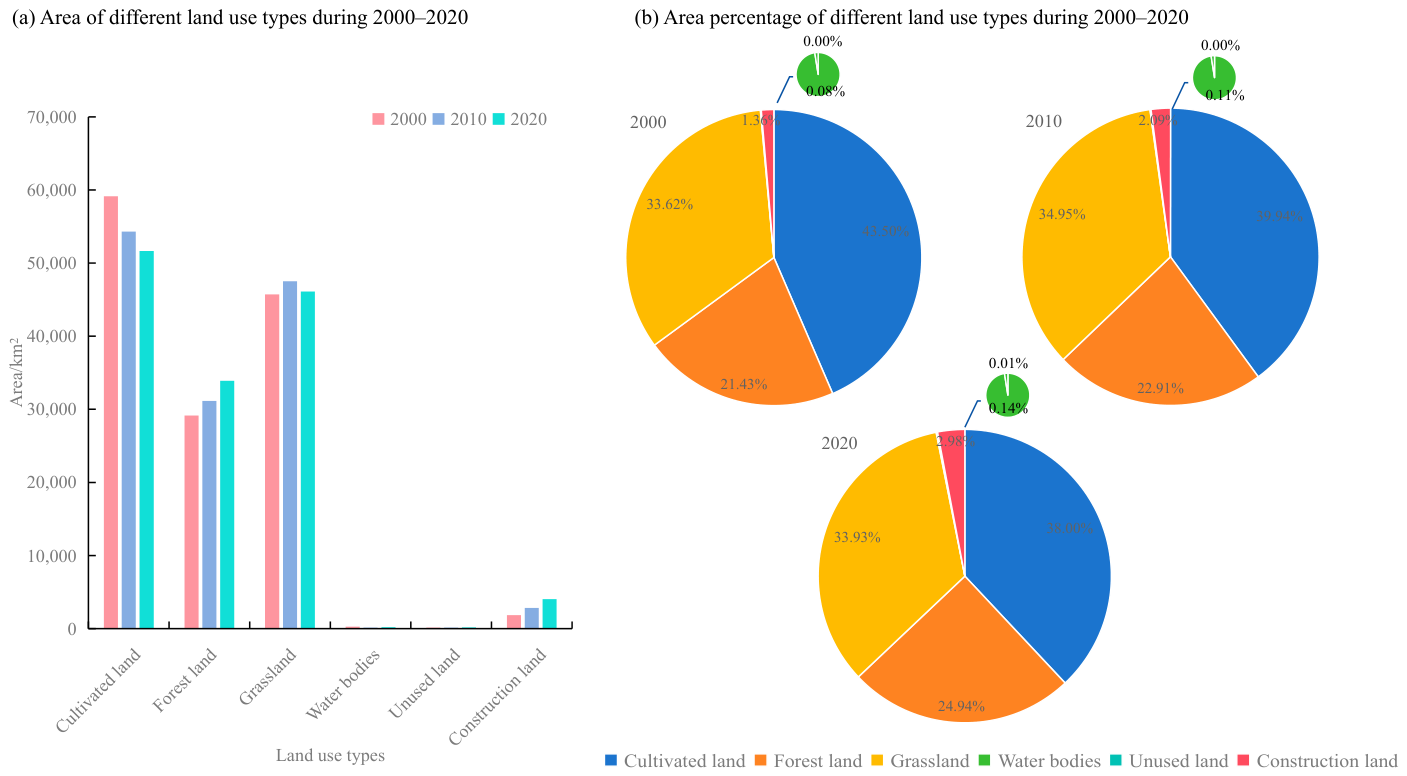
As illustrated in Figure 4, the land-use structure remained relatively stable during 2000–2020, with the proportional areas of various land-use types consistently following a hierarchical order: cropland > grassland > forestland > construction land > water bodies > unused land. The proportion of cropland ranged from 38.00% to 43.50%, grassland accounted for 33.62–34.95%, and forestland occupied 21.43–24.94%. Collectively, water bodies, construction land, and unused land contributed less than 3% of the total area. From a temporal perspective, construction land exhibited prominent expansion, with its area proportion rising from 1.36% in 2000 to 2.98% in 2020. Overall, cropland area exhibited a continuous declining trend, while all other land-use types expanded, forming an evolutionary pattern of “one decreasing type with multiple increasing types”. Quantitative statistics for each land category revealed that cropland suffered a total loss of 7484.39 km2, while forestland achieved a net increase of 4773.91 km2. Grassland presented a phased trajectory of initial growth followed by contraction, yielding a total net increment of 417.34 km2, and construction land underwent substantial net expansion of 2200.18 km2.
Table 5 quantifies land conversions across 2000–2020. Cropland exhibited the largest outflow of 13,366.18 km2, primarily shifting to grassland (71.30%), built-up land (16.07%), and forest (12.01%). Its inflow only accounted for 44.01% of the total lost area, with 93.70% newly reclaimed cropland derived from grassland. Forest gained 5293.78 km2, mostly from cropland and grassland, while its outflow was merely 519.87 km2, reflecting stable forest coverage. Grassland had an inflow of 9712.79 km2, marginally exceeding its 9295.45 km2 outflow; newly added grassland was overwhelmingly converted from cropland, and grassland mainly shifted back to cropland and forest.
Built-up land saw an inflow of 2235.54 km2 (96.05% from cropland, 3.33% from grassland) against a trivial outflow of 35.36 km2, revealing drastic urban sprawl. Water bodies exchanged 116.49 km2 inflow and 37.69 km2 outflow among cropland, grassland, and built-up zones. Unused land experienced negligible turnover of only 2.28 km2.
Such shifts were jointly shaped by ecological policies and urbanization pressures. The Grain-for-Green initiative and soil erosion governance converted extensive steep cropland to forest and grassland, optimizing ecological landscapes and boosting watershed conservation. Conversely, rapid construction of the Guanzhong urban agglomeration consumed vast high-quality cropland for urban and industrial expansion, the key driver of cropland shrinkage and built-up growth. Collectively, the basin’s agrarian-dominated landscape has transitioned toward concurrent ecological restoration and urban development, calling for strict regulation of persistent cropland loss.

3.2. Spatiotemporal Distribution Pattern of Carbon Storage from 2000 to 2020

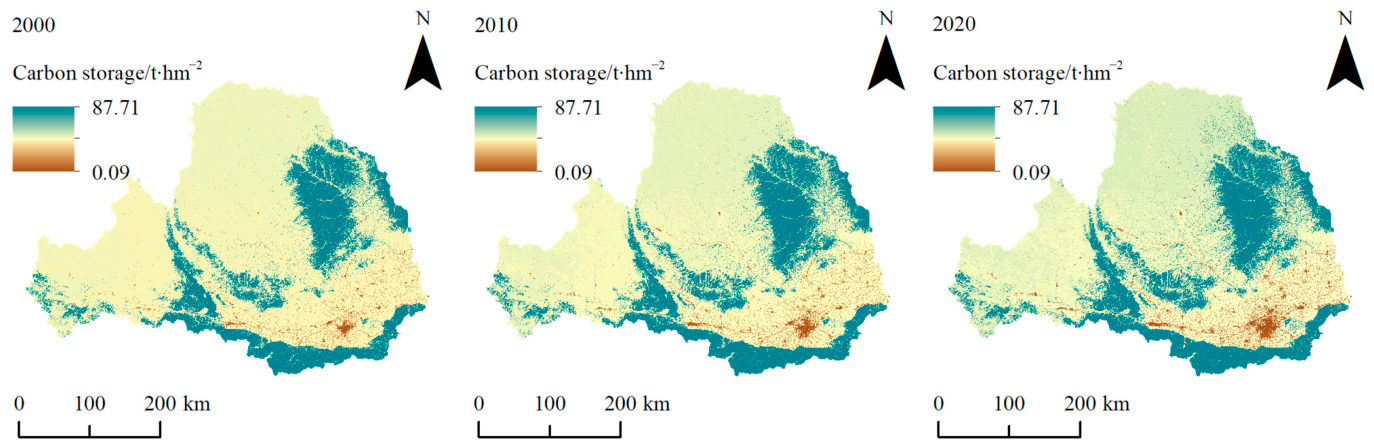
The carbon storage and sequestration module of the InVEST model was adopted to acquire the spatiotemporal distribution and variations of carbon storage in the Weihe River Basin during 2000–2020. As illustrated in Figure 5 and Table 6, the total carbon storage of the basin rose from 107,850.25 × 104 t in 2000 to108,081.27 × 104 t in 2010, and further increased to 108,302.54 × 104 t in 2020. Over the 20-year period, regional carbon storage presented a continuous increasing trend, with a total increment of 452.29 × 10⁴ t. In terms of the impacts of land-use change on carbon storage, the area of cultivated land decreased by 7484.39 km2, resulting in a carbon storage loss of 5264.52 × 104 t. Meanwhile, the carbon storage of forest land increased from 31,552.68 × 104 t in 2000 to 36,722.34 × 104 t in 2020, with a net growth of 5169.66 × 104 t. The carbon storage of grassland increased from 34,503.20 × 104 t to 34,818.25 × 104 t, an increase of 315.05 × 10⁴ t. For water bodies, carbon storage grew from 1.21 × 10³ t to 2.09 × 10³ t, with an increment of 8.67 × 10² t. The carbon storage of unused land rose from 19.59 × 10² t to 119.75 × 10² t, increasing by 100.16 × 10² t. The carbon storage of construction land increased from 193.87 × 10⁴ t to 424.89 × 10⁴ t, with a growth of 231.02 × 10⁴ t. The above results indicate that the growth of forest land carbon storage is the primary influence driver for the increase of total carbon storage in the study area.
Table 6 presents the variations in carbon storage induced by land-use changes across the Weihe River Basin from 2000 to 2020, which reveals the basin-scale carbon budget pattern in terms of land conversion area and carbon surplus or deficit. Over the 2 decades, the conversion of cultivated land constituted the primary source of regional carbon sink growth. The areas of cultivated land converted to forest land and grassland reached 1605.69 km2 and 9530.51 km2, corresponding to carbon sequestration increments of 1738.80 × 104 t and 7194.58 × 104 t, respectively. Collectively, these two conversion types contributed a total carbon storage gain of 9159.56 × 104 t. In contrast, the conversions from cultivated land to water bodies, unused land, and construction land generally resulted in carbon loss. In particular, a total area of 2147.34 km2 of cultivated land was transformed into construction land, leading to a carbon storage reduction of 225.47 × 10⁴ t.
Forest land mainly gained carbon through inward conversion, while its outward conversion area remained limited. A total of 518.18 km2 of forest land was converted into cultivated land and grassland, causing a carbon loss of 373.72 × 10⁴ t. The areas of forest land converted to construction land and water bodies were extremely small, and the associated carbon loss was negligible.
Grassland was among the most dynamically converted land-use types in the basin. The areas of grassland converted to cultivated land and forest land were 5511.08 km2 and 3687.72 km2, which brought a total carbon storage increase of 7878.30 × 104 t. The small-scale conversions of grassland to water bodies, unused land, and construction land only caused slight carbon loss. The conversion activities of water bodies and unused land were relatively limited. Conversions of water bodies to cropland corresponded to the largest carbon reductions observed among water-related land transitions; a total of 24.15 km2 of water areas were reclaimed for cultivation, accompanied by a carbon storage decline of 16.99 × 10⁴ t. Scattered reclamation of unused land into cultivated land, forest land, and grassland mainly generated a slight rise in carbon sink. The total outward conversion area of unused land was merely 2.27 km2, with a carbon sequestration increment of 15.10 × 10⁴ t. The reclamation of construction land into forest land, cultivated land, and water bodies achieved partial carbon recovery. The total outward conversion area of construction land was 35.37 km2, yielding a cumulative carbon sequestration of 5.28 × 10⁴ t. Nevertheless, the continuous encroachment of cultivated, forest, and grassland by built-up areas constitutes a major source of regional carbon loss.
Grassland was among the most dynamically converted land-use types in the basin. The areas of grassland converted to cultivated land and forest land were 5511.08 km2 and 3687.72 km2, which brought a total carbon storage increase of 7878.30 × 104 t. The small-scale conversions of grassland to water bodies, unused land, and construction land only caused slight carbon loss. The conversion activities of water bodies and unused land were relatively limited. Conversions of water bodies to cropland corresponded to the most substantial carbon reductions among all water-related land transitions. A total of 24.15 km2 of water areas were reclaimed for agricultural use, with a matching carbon-storage decline of 16.99 × 10⁴ t. Scattered reclamation of unused land into cultivated land, forest land, and grassland mainly generated a slight rise in carbon sink. The total outward conversion area of unused land was merely 2.27 km2, with a carbon sequestration increment of 15.10 × 10⁴ t. The reclamation of construction land into forest land, cultivated land, and water bodies achieved partial carbon recovery. The total outward conversion area of construction land was 35.37 km2, yielding a cumulative carbon sequestration of 5.28 × 10⁴ t. Nevertheless, the continuous occupation of cultivated land, forest land, and grassland by expanding construction land remained a critical driver of carbon loss.
Overall, the implementation of the Grain-for-Green Program promoted the conversion of large areas of cultivated land and grassland into forest land with high carbon density, which dominated the growth of carbon storage in the study area. Reclamation for cultivated land and occupation of ecological land by urban construction were the main pathways of carbon loss. The carbon sink benefits from ecological restoration far exceeded the carbon loss caused by land development. Consequently, the land-use transitions in the Weihe River Basin generally showed a net carbon sink surplus during 2000–2020.
The spatial distribution of carbon storage in the Weihe River Basin shows prominent regional heterogeneity. Specifically, high carbon-storage areas are characterized by three differentiated spatial forms: contiguous patches in the northeastern basin, discrete scattered points in the western upstream basin, and continuous belts in the south–central basin. Low carbon-storage values are mainly concentrated in the lower reaches, namely the densely urbanized Guanzhong Plain Urban Agglomeration. In general, the spatial pattern of carbon storage maintained high temporal consistency throughout the study period from 2000 to 2020.

3.3. Spatiotemporal Changes of Land Use and Carbon Storage Under Different Scenarios

3.3.1. Spatiotemporal Variations of Land Use Under Different Scenarios

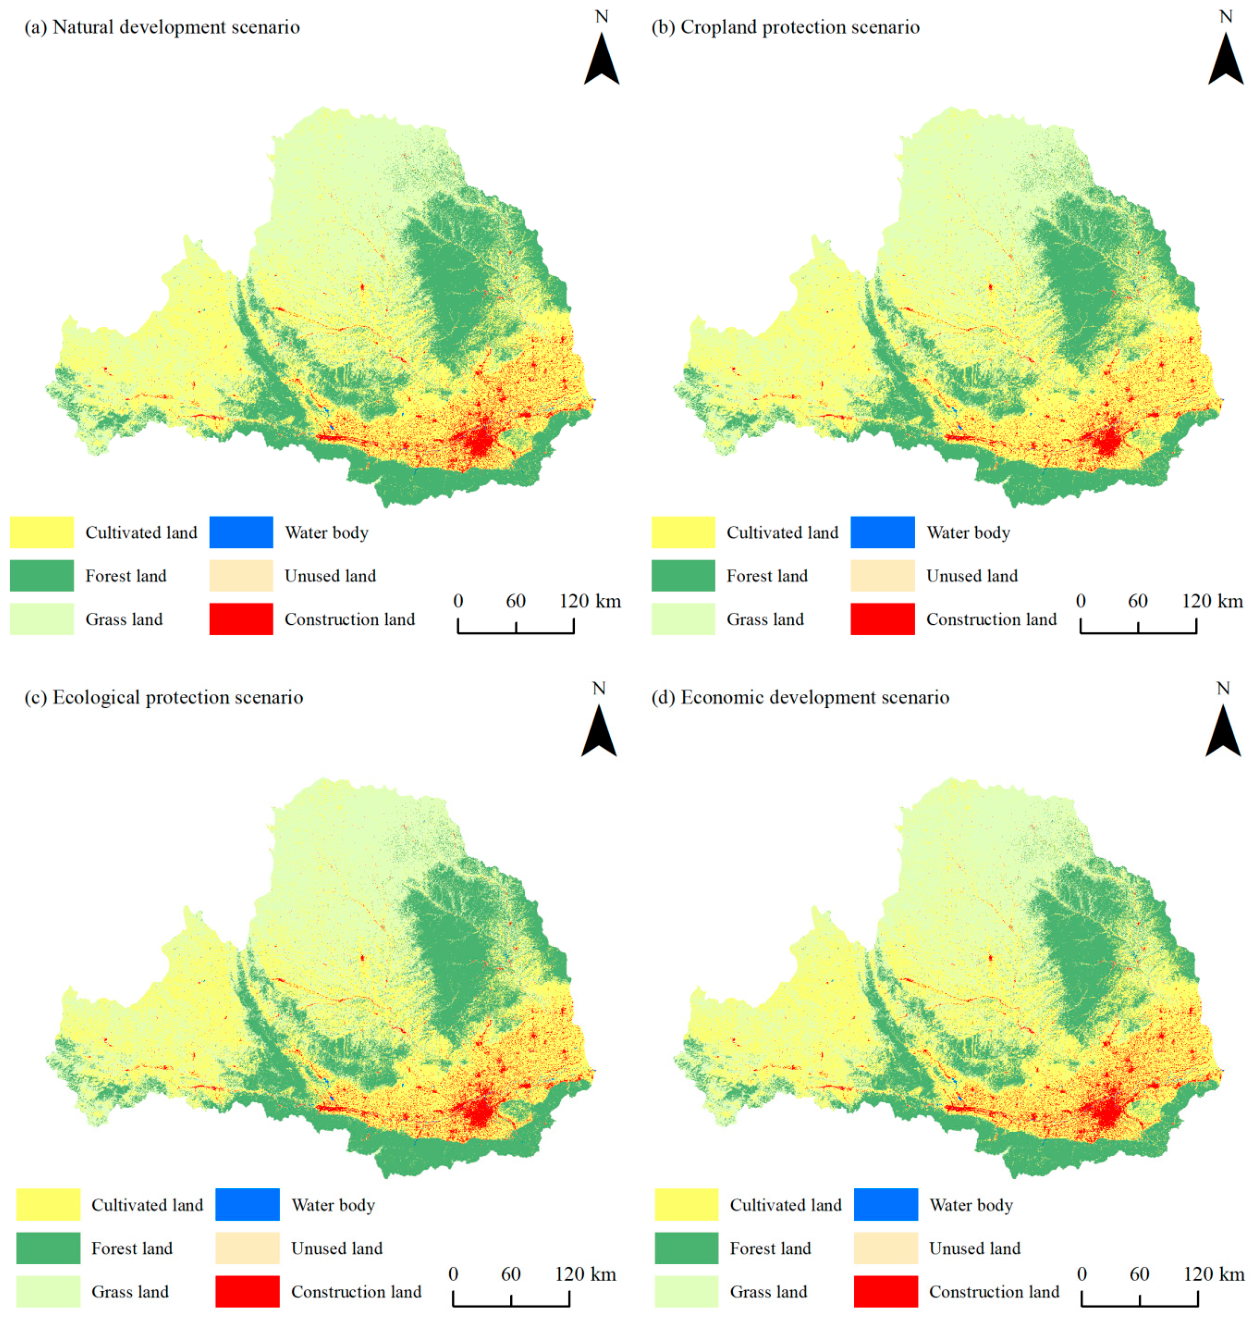
Taking the land-use data for 2020 as the baseline, this study compared the land-use evolution patterns under four scenarios: natural development, ecological protection, economic development, and cultivated land protection (Figure 6).
Cultivated land showed a decreasing trend under the natural development and ecological protection scenarios, with a reduction of 2332.42 km2 and 4084.70 km2 relative to 2020, corresponding to a decline rate of 4.52% and 7.91%, respectively. The largest loss of cultivated land occurred under the ecological protection scenario due to large-scale implementation of the Grain for Green Program. By contrast, slight expansion of cultivated land was observed under the economic development and cultivated land-protection scenarios through land consolidation and reclamation of unused land, with area increases of 2.11% and 1.55%, which effectively maintained the total cultivated land area. Forest land experienced a slight decrease of 2.94% only under the economic development scenario, while area growth was detected in the other three scenarios. The ecological protection scenario presented the highest growth rate of 8.25%, as the conversion of sloping cultivated land promoted the contiguous expansion of ecological land. The growth rates of forest land under the natural development and cultivated land protection scenarios were 7.73% and 1.67%, respectively. Grassland increased slightly by 1.02% merely under the ecological protection scenario and declined to varying degrees in the other scenarios. The most remarkable reduction of 3.25% appeared under the economic development scenario, which was mainly attributed to urban expansion and cultivated land reclamation. Water bodies expanded moderately under the natural development, ecological protection, and economic development scenarios, benefiting from the construction of artificial water conservancy facilities and the development of ponds and wetlands. Under the cultivated land-protection scenario, the original water system was strictly preserved, and the area of water bodies remained unchanged compared with the baseline. Unused land decreased continuously across all four scenarios. Intensive exploitation of unused land occurred under the cultivated land-protection and economic-development scenarios, whereas reclamation of wasteland was strictly restricted under the ecological protection scenario, leading to the largest retention of residual unused land. Construction land expanded in all scenarios. The growth rate reached 34.25% under the economic development scenario, indicating extensive urban sprawl. In the cultivated land-protection scenario, the expansion of construction land was effectively restricted by setting control boundaries, with only a slight increase of 0.50%. In terms of land-use structure, the ecological protection scenario achieved the highest degree of ecological optimization but had a relatively weak capacity for food security guarantee. The economic development scenario prioritized urbanization, which consumed forest and grass resources to supplement construction and cultivated land quotas and imposed severe ecological pressure. Without policy constraints, the natural development scenario witnessed prominent spontaneous non-agricultural conversion of cultivated land. The cultivated land-protection scenario balanced cultivated land security and construction regulation, making it a desirable approach to coordinate food guarantee and intensive land use. In future management, integrated regulation strategies can be adopted to reconcile the multiple demands of ecological conservation, food security, and socio-economic development in the basin.

3.3.2. Spatiotemporal Variations of Carbon Storage Under Different Scenarios

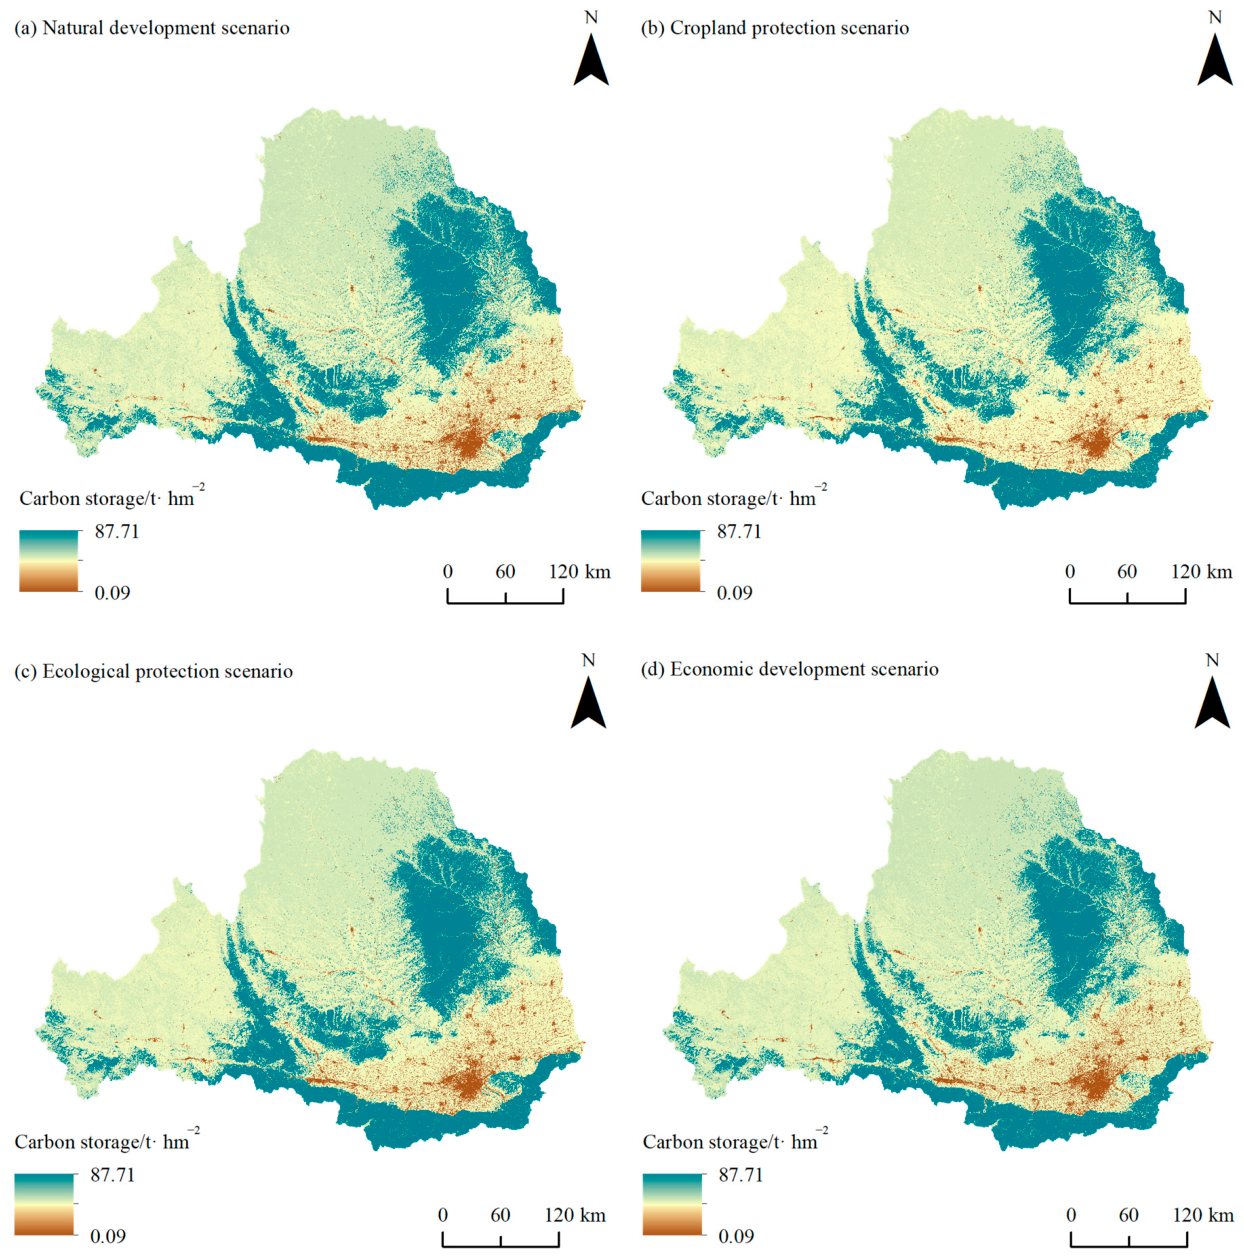
Figure 7 and Table 7 illustrate the spatial distribution and changes of carbon storage in the Weihe River Basin under the four development scenarios in 2030. Under the natural development scenario, the total carbon storage increased from 108,302.54 × 104 t in 2020 to 108,517.11 × 104 t in 2030, with a net increment of 214.57 × 10⁴ t. This growth was primarily driven by the expansion of forest land, whose proportion rose from 24.94% to 26.87%, accompanied by a forest carbon-storage increase of 2837.60 × 104 t. Under the ecological protection scenario, the total carbon storage reached 108,898.08 × 104 t, representing an increase of 595.53 × 10⁴ t compared with 2020. Specifically, forest land carbon storage increased by 3030.24 × 104 t, while cultivated land carbon storage decreased by 2873.18 × 104 t.
For the cultivated land-protection and economic-development scenarios, the total carbon storage was 108,438.93 × 104 t and 107,004.70 × 104 t, respectively. Relative to the 2020 baseline, the former saw a rise of 136.39 × 10⁴ t, whereas the latter experienced a decline of 1297.84 × 104 t. Their forest land carbon storage changed by +611.43 × 10⁴ t and −1080.10 × 104 t correspondingly. Overall, forest land carbon storage served as the primary contributor to the variations of total carbon storage across all four scenarios.
Among all scenarios, the ecological protection scenario yielded the largest carbon storage growth. The results demonstrate that ecological conservation measures such as the Grain-for-Green Program can effectively enhance the carbon sequestration capacity of terrestrial ecosystems. This finding provides empirical evidence for the positive carbon sink benefits brought by relevant ecological policies.

3.4. Interpretative Analysis Based on the XGBoost-SHAP Model

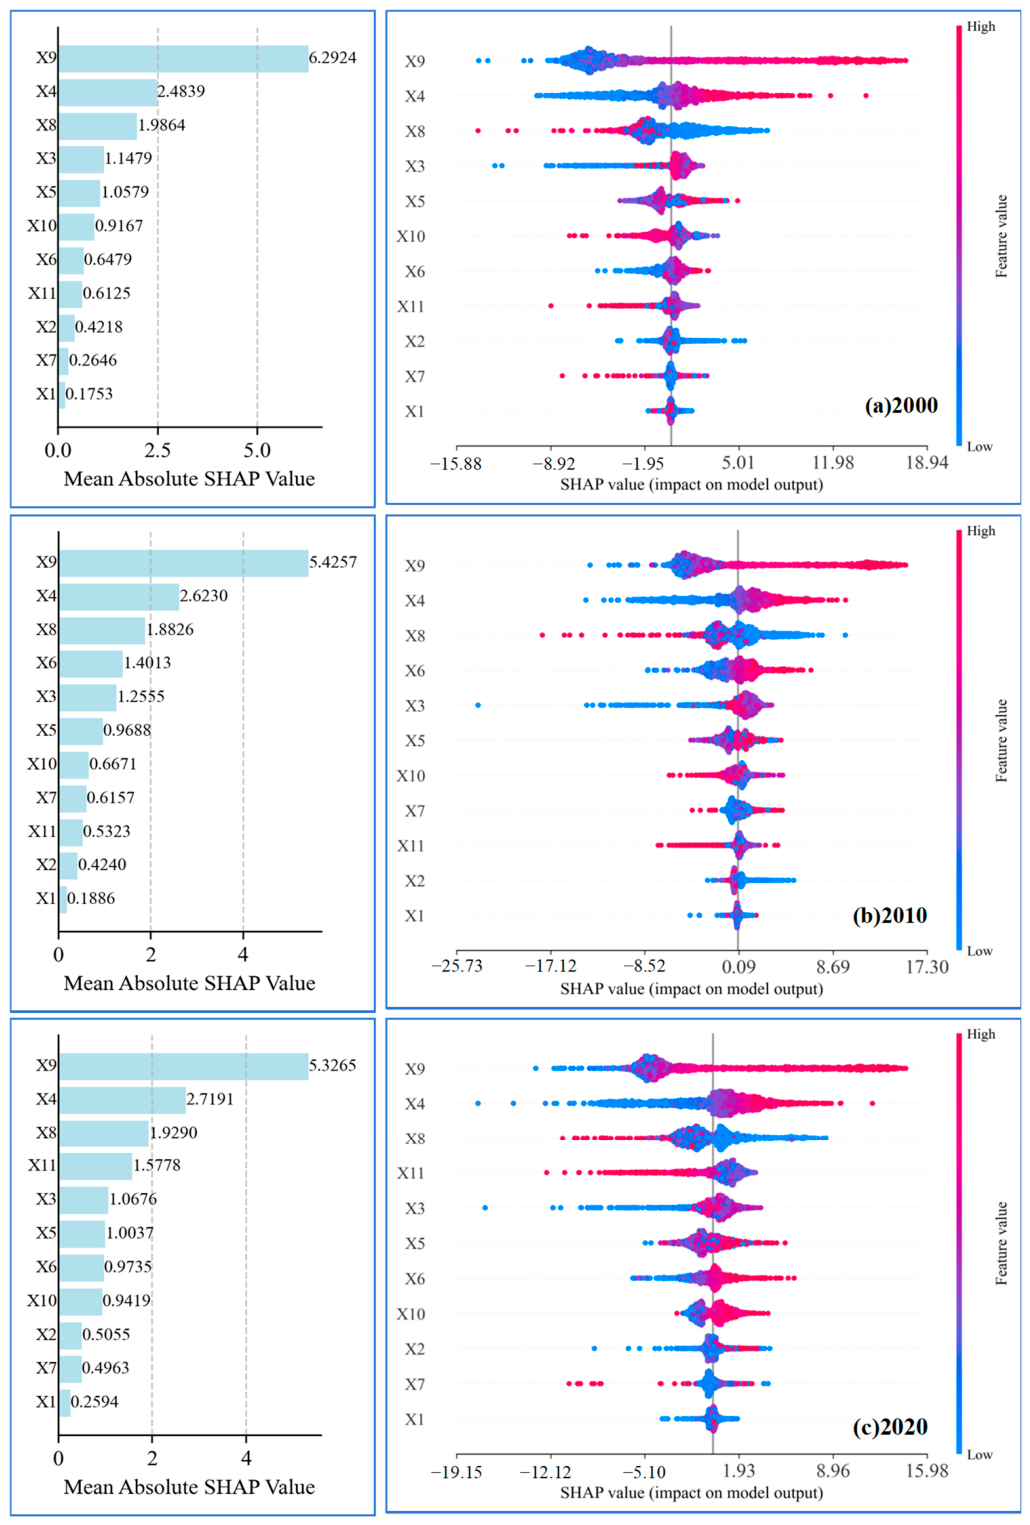
This study employed the XGBoost and SHAP models to quantify the contributions of various driving factors to regional carbon storage for the years 2000, 2010, and 2020. The fitting accuracy of the XGBoost model was evaluated using five-fold stratified spatial cross-validation, with three universal metrics: R2, RMSE, and MAE. The results showed that the R2 values for 2000, 2010, and 2020 were 0.74, 0.74, and 0.70, respectively. Corresponding RMSE values were 6.07 t/hm2, 6.25 t/hm2, and 6.86 t/hm2, while the MAE values were 3.32 t/hm2, 3.42 t/hm2, and 3.88 t/hm2. The R2 values exceeded 0.70 for all 3 years, accompanied by generally low error metrics, indicating that the XGBoost model possesses fitting accuracy and interpretability for the spatial differentiation of carbon storage in the Weihe River Basin [44]. The reliable model outputs further support the subsequent quantitative analysis of the effect magnitude, direction, and nonlinear thresholds of each driving factor via SHAP.
The results revealed obvious temporal heterogeneity in the effects of driving factors on carbon storage (Figure 8). According to the temporal variations in mean absolute SHAP values, NDVI(X9), slope (X4), and population density (X8) were consistently the top three primary factors throughout the study period, primarily determining the spatial differentiation of regional carbon storage. The mean absolute SHAP value of NDVI decreased gradually from 6.292 to 5.327, indicating that ecological restoration has achieved remarkable outcomes and reduced the spatial heterogeneity of vegetation coverage, thereby weakening its differentiated constraint effect on carbon storage. The mean absolute SHAP value of slope increased steadily from 2.484 to 2.623 and further to 2.719, demonstrating that topographic conditions exerted a persistent fundamental control over the spatial pattern of carbon storage. Among natural environmental factors, elevation (X3) showed an increasing-then-decreasing trend: its mean absolute SHAP value rose from 1.148 in 2000 to 1.255 in 2010 and declined to 1.068 in 2020. Intensive urban development in low-altitude areas in 2010 amplified the spatial divergence of carbon storage caused by elevation. NPP(X6) experienced the most dramatic fluctuations, increasing sharply from 0.648 in 2000 to 1.401 in 2010 and then decreasing to 0.973 in 2020. The drastic reconstruction of land-use patterns driven by rapid urbanization during 2000–2010 intensified the divergence of vegetation growth conditions, which was the main reason for the sharp rise in the explanatory power of vegetation productivity. The driving intensity of MAT (X11) changed most significantly, with its mean absolute SHAP value slightly declining from 0.612 (2000) to 0.532 (2010) and then surging to 1.578 in 2020. Under the background of regional climate warming, hydrothermal conditions exhibited an enhanced non-linear regulation effect on vegetation carbon sequestration. MAP (X10) and aspect (X5) maintained moderate contributions with mild temporal fluctuations. The mean absolute SHAP value of aspect remained around 1.0 across the three periods, suggesting that light conditions posed no substantial stage-specific impacts on carbon storage.
In terms of socio-economic and road network factors, GDP(X7) also presented an increasing-then-decreasing trend (0.265 → 0.616 → 0.496). Extensive economic expansion in 2010 led to massive occupation of construction land and strengthened the negative disturbance of GDP on carbon storage. Arterial roads (X2) and expressways (X1) were weak driving factors with only slight increases in their explanatory power; their mean absolute SHAP values ranked lowest among all factors, indicating that road construction only caused fragmented ecological disturbances at local scales and exert limited influence on the overall spatial pattern of regional carbon storage.
Combined with the SHAP statistical indicators, value ranges, and temporal evolution of factor importance, the spatial differentiation of carbon storage was characterized by long-term dominance of natural factors and staged enhancement of anthropogenic influences. NDVI was the primary factor affecting carbon storage. Its SHAP value range narrowed gradually from −14.245 to 17.362 in 2000 to −13.234 to 14.385 in 2020, accompanied by a continuous decline in discrete degree. Areas with high NDVI values corresponded to positive SHAP values and higher carbon storage, while areas with low NDVI values showed negative SHAP values and weakened carbon sequestration capacity. Vegetation was identified as the major carbon sink of the study area. Benefiting from large-scale ecological restoration and homogenized vegetation coverage, the differentiated driving effect of NDVI on carbon storage decreased year by year.
Slope and elevation constituted the second-tier topographic factors with divergent effects. The increasing mean absolute SHAP value of slope indicated that topographic control was continuously strengthened. Steep slopes were conducive to organic matter accumulation and presented higher carbon storage, whereas flat areas were prone to land development and severe carbon loss. The influence of elevation peaked in 2010 and then decreased. Its negative extreme SHAP value changed from −13.048 to −17.017. Land consolidation and afforestation activities mitigated the anthropogenic disturbances in low-altitude areas and weakened the inherent constraints of topography on carbon storage. Aspect had narrow SHAP fluctuations and limited impacts on carbon differentiation.
Anthropogenic factors underwent prominent changes in both intensity and action attributes. Population density remained the third important factor with sustained negative effects, and its negative extreme SHAP value reached −17.889 in 2010 due to severe vegetation destruction and carbon loss during rapid urbanization. In the later stage, intensive urban development and ecological buffer construction alleviated the inhibitory effect of population agglomeration. GDP was generally negatively correlated with carbon storage; the extensive development in 2010 aggravated carbon loss, while the popularization of green development after 2020 increased the proportion of positive samples, and the carbon sequestration benefits of green industries gradually emerged.
The regulatory capacity of climatic factors increased over time. Air temperature became a prominent driving factor, with its mean absolute SHAP value rising from 0.612 to 1.578 and the overall SHAP mean turning positive. Climate warming enhanced the positive effects of hydrothermal conditions on vegetation carbon sequestration. Precipitation exerted a mild positive effect on vegetation growth and carbon accumulation, with moderate and stable explanatory power. Expressways and arterial roads were weak factors with concentrated SHAP distributions, and their interference with regional carbon patterns was limited to local land fragmentation.
Overall, the spatial pattern of carbon storage was largely shaped by natural background conditions, including vegetation and topography. Human activities transformed from vegetation destruction and carbon loss in the early stage to the coordinated mode of intensive land use and ecological restoration. Anthropogenic interventions have gradually produced positive carbon sequestration benefits.
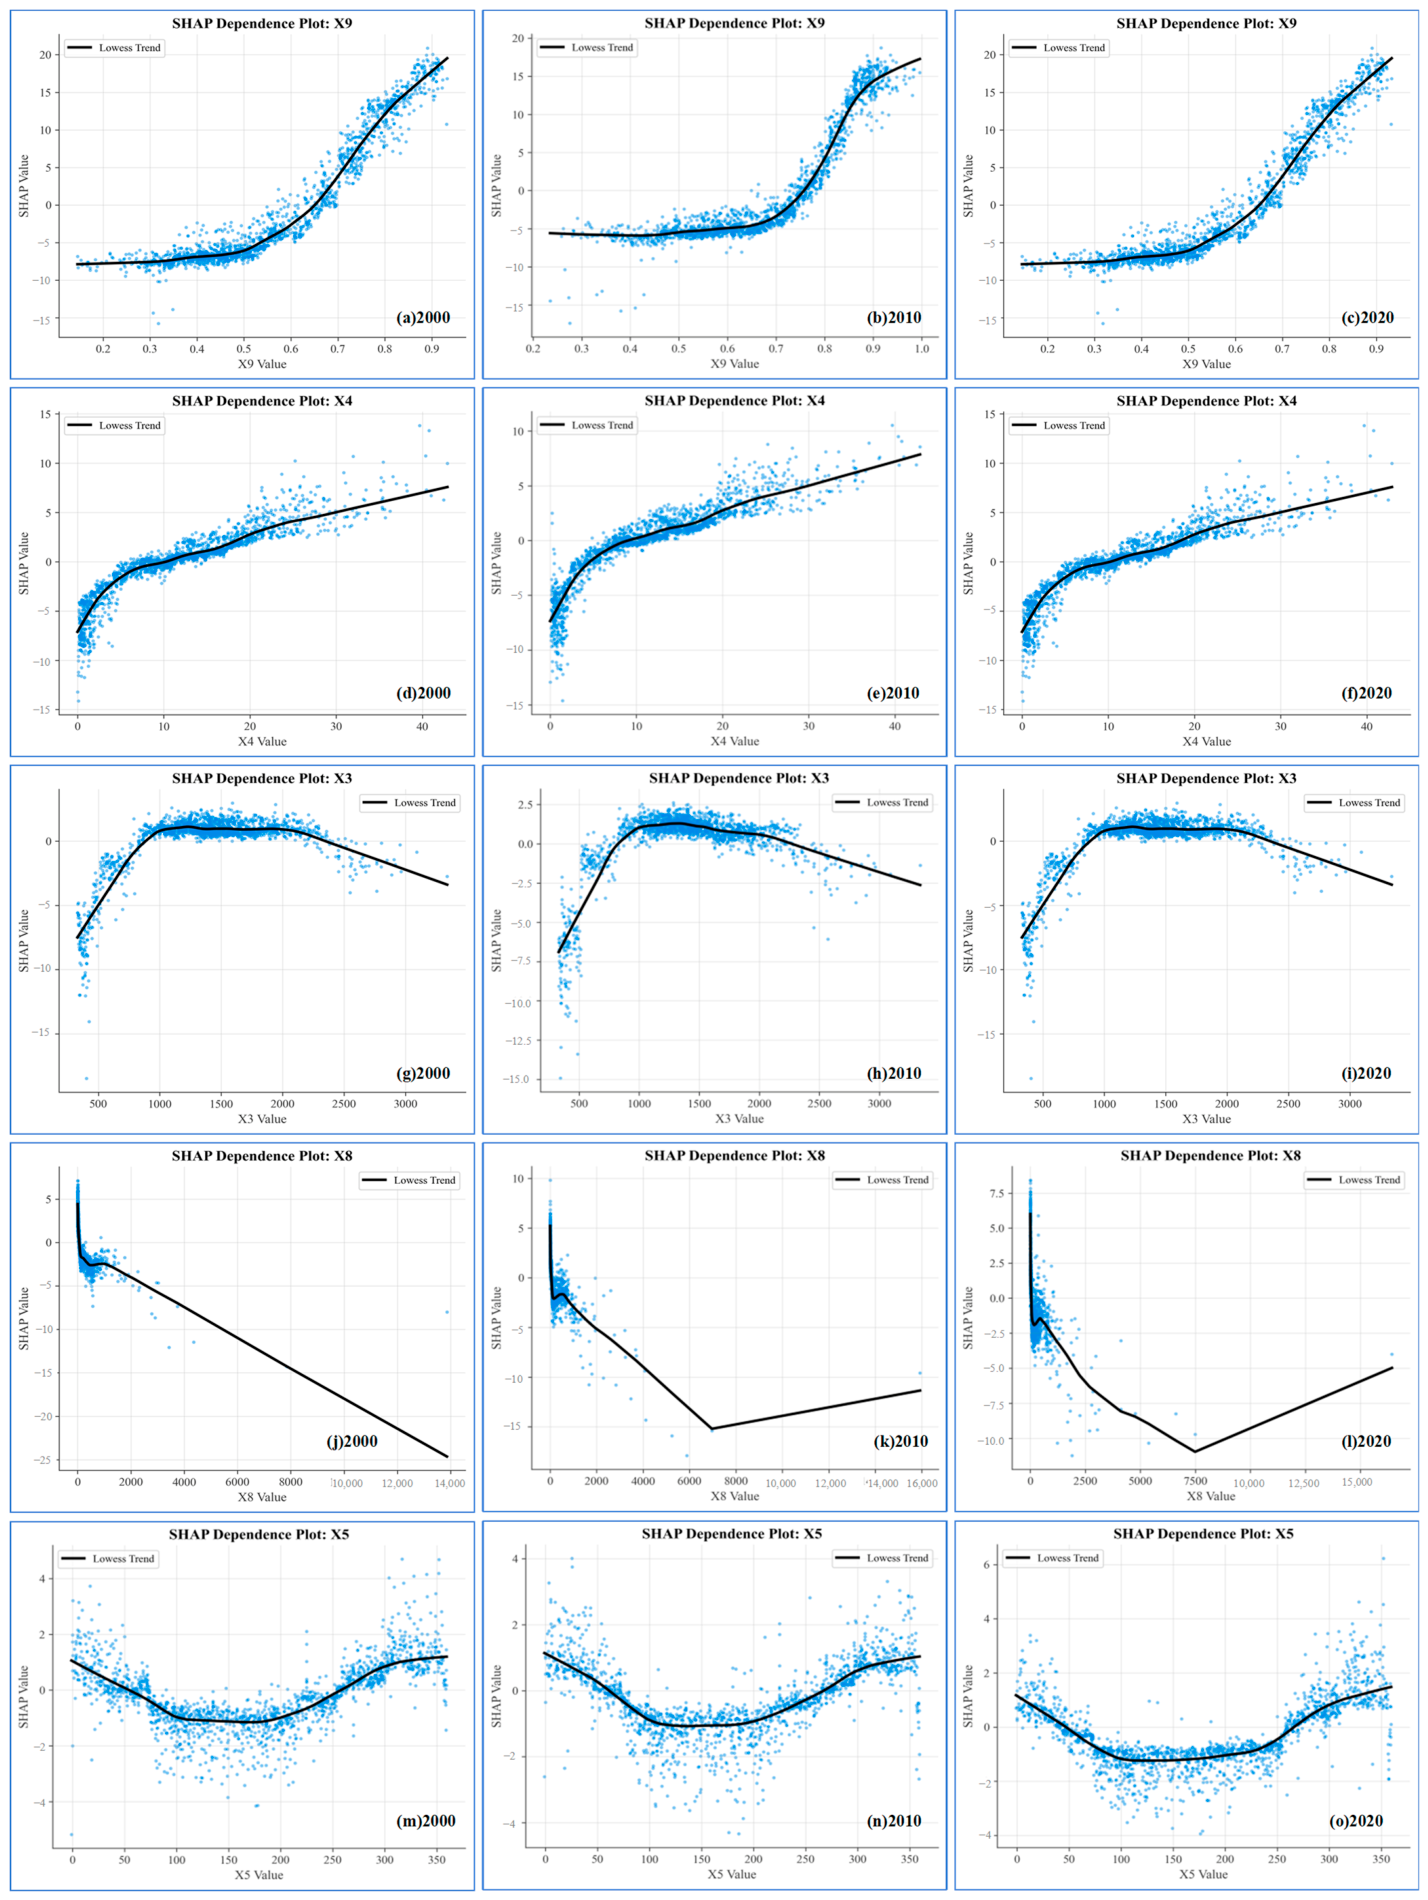
This study further employed SHAP dependence plots to systematically identify the nonlinear response relationships and critical thresholds of the five primary factors driving carbon storage variations in the Weihe River Basin (Figure 9). Vegetation, topographic, and anthropogenic factors exhibited distinct yet temporally stable nonlinear regulatory patterns, with both invariant and stage-specific threshold characteristics across 2000, 2010, and 2020.
NDVI exerted prominent threshold-dependent effects on carbon storage with slight temporal discrepancies. The critical NDVI threshold remained stable at 0.65 in 2000 and 2020 and shifted moderately upward to 0.75 in 2010. NDVI values below these period-specific thresholds corresponded to sparse vegetation and bare land, generating negative SHAP values and limited carbon sequestration. In contrast, NDVI exceeding the inflection point substantially enhanced vegetation coverage, thereby sharply elevating regional carbon storages. The tiered threshold range of 0.65–0.75 provides a quantitative criterion for precision vegetation restoration and targeted carbon sink improvement across the watershed.
Slope exhibited highly consistent threshold-mediated nonlinearity throughout the study period, with a unified critical breakpoint at 10°. Gentle terrain (<10°) suffers intensive human disturbances, severe soil erosion and insufficient vegetation accumulation, resulting in persistent negative carbon effects. Conversely, slopes above 10° restrict anthropogenic interference and sustain stable vegetation growth, yielding continuously increasing positive SHAP values. The temporally invariant 10° geomorphic threshold offers reliable support for zoned ecological restoration and differentiated carbon sink management.
Population density imposed sustained monotonic negative constraints on carbon storage. Sparsely populated areas with negligible human disturbance maintained intact ecosystems and positive carbon sequestration benefits. However, slight population growth triggered immediate negative SHAP responses, indicating that human aggregation consistently inhibits regional carbon accumulation and dominates local carbon loss.
Elevation presented a stable unimodal nonlinear pattern. Low-elevation zones (<1000 m) experienced intensive land exploitation and depleted carbon storages, while the 1000–2000 m mid-altitude belt provided optimal hydrothermal and soil conditions for maximum carbon accumulation. High elevations (>2000 m) constrain vegetation productivity due to low temperature and thin soils, gradually weakening carbon sink capacity. This dual-threshold elevation effect highlights the 1000–2000 m zone as the core priority area for watershed carbon conservation.
Slope aspect displayed a robust U-shaped response with fixed dual breakpoints at 50° and 250°. North-facing shaded slopes (0–50°) maintained favorable soil moisture and positive carbon effects, whereas transitional semi-sunny slopes (50–250°) suffered severe water stress and the strongest carbon suppression. Sunny slopes (>250°) recovered positive carbon contributions as sufficient radiation compensated for evapotranspiration water loss. Although threshold positions remained temporally stable, the inhibitory magnitude within the transitional band intensified over time, suggesting growing water limitation on semi-shaded terrain. Collectively, these multi-factor nonlinear thresholds provide quantitative theoretical support for refined, terrain-based differentiated low-carbon watershed governance.

4. Discussion

4.1. Analysis of Carbon Storage Evolution in the Weihe River Basin

Land-use restructuring reshapes vegetation and soil carbon pools, altering regional carbon storage. Forests cover over 20% of the Weihe River Basin and serve as primary carbon sinks, so forest-rich zones consistently hold higher carbon storage. Though basin-wide carbon storage rose continuously from 2000 to 2020, this aggregate trend masks divergent carbon source-sink patterns shaped by stepped geomorphology and uneven human disturbances. Upstream loess gullies undergo intensive ecological restoration; the central Guanzhong Plain bears rapid urbanization; downstream reaches suffer wetland degradation. Distinct carbon trade-offs across subregions necessitate targeted zoning strategies for carbon regulation and ecological optimization.
From 2000 to 2010, large-scale Grain-for-Green and soil-erosion-control projects converted abundant cropland and grassland to forests, expanding high-carbon vegetation and lifting regional carbon sequestration. Over the 2 decades, forests and built-up areas expanded, while cropland shrank drastically. The overall carbon-storage growth indicates that carbon gains from high-carbon vegetation can offset carbon losses induced by low-carbon built-land expansion [45].
Nevertheless, aggregate statistics obscure hidden spatial heterogeneity. The Guanzhong Plain hosts fertile cropland with stable soil organic carbon, balancing food provision and carbon sequestration. Unchecked urban sprawl continuously occupies high-quality farmland, triggering simultaneous losses of topsoil and vegetation carbon and forming permanent local carbon deficits. These regional carbon losses are concealed by the basin-wide carbon increment, leading to overestimated ecological benefits of land transitions.
Upstream loess zones also show uneven carbon sink returns from Grain-for-Green. Steep gully afforestation yields persistent long-term carbon accumulation, while gentle-slope restored grasslands exhibit low, volatile sequestration efficiency. Temporally, centralized restoration during 2000–2010 delivered remarkable carbon gains, yet marginal restoration benefits faded after 2010, slowing regional carbon density growth. Such spatiotemporal disparities highlight heterogeneous carbon sink potential across restored terrain.
The ecological protection scenario prioritizes ecological conservation to optimize human–land relationships and guarantee ecological security. Under this scenario for 2030, the expansion of construction land was properly controlled, and more grassland and cultivated land were converted into forest land, resulting in a notable increase in forest area. Previous studies by Zhang et al. [46] and Yang et al. [47] also demonstrated that expanding forest land and limiting the sprawl of construction land can effectively boost regional carbon storage. Notably, the counterintuitive phenomenon under the ecological protection scenario—continuous reduction of cultivated land alongside the highest level of basin carbon storage—carries profound targeted policy implications for watershed sustainable governance. This phenomenon does not mean that cultivated land loss is conducive to carbon sequestration, but it reflects a reasonable land-use structure-optimization trade-off: the ecological protection scenario eliminates extensive low-efficiency cultivated land and degraded grassland with low carbon density, and it converts them into high-carbon-density forest ecosystems. The substantial carbon increment generated by forest expansion far offsets the carbon sink loss caused by cultivated land shrinkage.
The cropland protection scenario imposes rigid farmland constraints, slowing forest expansion and converting partial grasslands back to cropland, which only delivers mild carbon growth due to limited high-carbon vegetation expansion. Conversely, unregulated urban expansion under the economic development scenario consumes extensive cropland, forests and grasslands, triggering a sharp carbon decline.
Multi-scenario outcomes collectively prove differentiated zoning governance is the core solution to reconcile carbon sequestration, grain security and urban development. Upstream loess gullies should advance ecological restoration to amplify carbon sinks, whereas the Guanzhong Plain must adhere strictly to cropland redlines to avoid irreversible carbon costs from prime farmland loss. Rigid bans on construction encroachment of forest and grassland are required to sustain long-term watershed ecological balance.

4.2. Analysis of Driving Factors for Carbon Storage

The SHAP values of driving factors clearly reflect their relative importance to carbon storage in the Weihe River Basin. NDVI, slope, and population density were identified as the primary factors, which is in good agreement with the results reported by Li and Ding [48] and Shi et al. [49]. The existing literature only reports simple correlations between these three factors and carbon storage without elaborating their intrinsic linkage patterns. Based on XGBoost-SHAP global contribution results of 2000, 2010, and 2020, this paper further interprets their action logic, nonlinear threshold effects, and coupling relationships, which can provide quantitative basis for differentiated land-use governance.
Vegetation serves as the primary carrier of carbon storage, which largely accounts for the prominent contribution of NDVI to spatial variations in carbon storage. As a vegetation comprehensive index, NDVI directly determines the upper limit of biomass and soil carbon pools: higher NDVI corresponds to stronger photosynthetic carbon fixation, and continuous litter input promotes soil organic carbon accumulation, forming a coupled vegetation–soil carbon sink system. The gradual decline of NDVI’s mean absolute SHAP value (6.292–5.327) over the past 2 decades reflects the vegetation homogenization effect brought by the Grain-for-Green Program, which narrows the spatial differentiation of watershed carbon sequestration capacity. A critical threshold of NDVI (0.65–0.75) is detected via SHAP dependence plots: regions with NDVI below 0.65 show continuous carbon deficit due to insufficient vegetation coverage, while carbon storage rises nonlinearly once NDVI exceeds this threshold.
As a key topographic factor, slope regulates the spatial distribution and dynamics of ecosystem carbon storage by redistributing hydrothermal resources and changing the intensity of human disturbance, and its control effect on carbon patterns continuously strengthened (mean absolute SHAP value rose from 2.484 to 2.719). The slope of 10° is a dividing threshold for human disturbance intensity. Flat and gentle slopes (<10°) are suitable for farming, residential construction, and transportation development. Long-term disturbances from agricultural activities, deforestation, and infrastructure construction have severely damaged native vegetation, broken soil aggregate structures, and weakened the carbon pool foundation. Slopes steeper than 10° are restricted by high development costs, where human interference is weak. In steep areas of the Weihe River Basin, secondary broad-leaved forests, mixed broadleaf–conifer forests, and artificial bamboo forests are widely distributed. These vegetation types feature high annual carbon sequestration rates and large biomass carbon storage, forming stable positive carbon sink zones.
Elevation presents a nonlinear correlation with carbon storage, shifting from negative to positive along the altitude gradient. This finding is consistent with the research of Hu et al. [7] on the Chishui River Basin in Guizhou Province. In areas below 1200 m, dense population, expanding cultivated land and urban construction have reduced natural vegetation and resulted in low carbon storage. The elevation range of 1200–2000 m is characterized by abundant water and soil resources, fertile soil, and a mild humid mountain environment, which favors biological growth, maintains high ecosystem productivity, and accumulates large amounts of carbon.
From 2000 to 2020, the driving pattern of carbon storage gradually evolved from absolute dominance by natural factors to joint regulation by natural and anthropogenic factors, as also concluded by Yang et al. [50] Among natural drivers, NDVI and elevation play leading roles, which is supported by Ren et al. [51] and Liu et al. [52]. In terms of anthropogenic factors, population density mainly imposes negative effects on carbon storage. Rising population density drives the expansion of settlements and cultivated land, encroaching on grassland, shrubland, and secondary forests and consequently causing carbon loss, which is closely associated with human disturbances on land surfaces [53]. The extreme negative SHAP value of population density appeared in 2010 during rapid urbanization of Guanzhong Plain Urban Agglomeration; urban green belts built after 2010 partially alleviated such inhibitory impacts, yet high-density built-up areas still consume massive ecological and cultivated land.
The three core driving factors do not act independently but jointly shape the spatial differentiation of carbon storage through coupling interactions. Areas with high slope, high NDVI, and low population density (Southern Qinling Mountains) present superimposed carbon sequestration benefits; low-slope, low-NDVI, and high-population-density Guanzhong Plain forms concentrated carbon loss hotspots; loess hilly-gully areas with medium conditions face dual pressures of cultivation and soil erosion. The identified NDVI and slope thresholds can be applied to zoning land management and carbon-sink restoration in the basin.

4.3. Proposals for Sustainable Development of the Weihe River Basin

Integrating the spatiotemporal evolution of carbon storage, multi-scenario carbon projections to 2030, and nonlinear threshold responses of primary influencing drivers identified via the XGBoost-SHAP framework, this study proposes differentiated zoning strategies to coordinate carbon sequestration enhancement, cultivated land security, and sustainable socioeconomic development in the Weihe River Basin. The empirically determined thresholds (NDVI: 0.65–0.75; slope: 10°), together with elevation and aspect-dependent carbon patterns, provide quantitative terrain–vegetation benchmarks for refined watershed ecological governance.
Targeted hierarchical management should be implemented according to slope and NDVI threshold gradients. Steep terrain (>10°) with high vegetation coverage (NDVI > 0.75), mainly distributed in the Southern Qinling Mountains and upstream mountainous areas, constitutes the basin’s stable major carbon sink zones. Such regions should be designated as permanent ecological reserves with strict prohibitions on disorderly land reclamation and construction so as to sustain intact forest soil–vegetation carbon pools and maintain long-term carbon sequestration stability. By contrast, loess hilly–gully areas in the mid-reaches with steep slopes (>10°) and low NDVI (<0.65) suffer severe vegetation degradation and persistent carbon deficits. Continuous ecological restoration and targeted afforestation are required to elevate vegetation coverage beyond the 0.65 threshold and reverse localized carbon loss.
For low-altitude gentle plains (<10°) dominated by the Guanzhong urban agglomeration, strict cropland redline protection and compact urban development are essential to mitigate human-induced carbon degradation. Given the intensified carbon-suppressive effects of population aggregation in flat terrain, systematic construction of urban green belts and riparian ecological corridors can effectively offset carbon emissions from urban sprawl. Furthermore, ecological occupation–compensation balance and targeted carbon compensation mechanisms should be standardized to internalize the carbon cost of land-use conversion. Multi-source spatial monitoring systems are recommended to optimize urban layouts and alleviate traffic and anthropogenic carbon disturbances in densely populated plain areas.
Gentle cropland with moderate NDVI (0.65–0.75) undertakes dual functions of food security and soil carbon accumulation. Low-intensity tillage, organic fertilization, and contour-cultivation strategies should be widely promoted to stabilize topsoil organic carbon and prevent vegetation degradation that may drop NDVI below the sequestration threshold. Combined with rural low-carbon facility upgrading, such agricultural optimization can establish a coordinated farmland–urban carbon mitigation system compatible with the basin’s natural carbon sink framework [54].
Considering the spatial mismatch between regional carbon gains and losses, carbon-deficit hotspots, including loess hilly regions and urban fringe zones, should be prioritized for ecological rehabilitation. Slope afforestation and ecological buffer belt construction can effectively weaken the inhibitory carbon effects of human aggregation. In addition, strict protection of riverine and wetland ecosystems is necessary to unlock aquatic carbon sink potential, providing comprehensive support for the watershed’s dual-carbon goals and long-term ecological sustainability.

4.4. Limitations and Research Prospects

This study constructed a coupled framework integrating PLUS, InVEST, XGBoost, and, SHAP models to realize dynamic carbon-storage simulation and driving factor-attribution analysis. Compared with single models, the integrated framework can accomplish multi-scenario land-use simulation, carbon-storage estimation. and driving factors exploration. Nevertheless, several limitations still exist.
First, the carbon density parameters in this study were derived from published literature to ensure basic simulation reliability. However, strong ecological heterogeneity across the Weihe River Basin leads to terrain- and soil-dependent carbon-density differences, introducing estimation uncertainties. Linear climate correction was performed to derive universal correction coefficients, leading to systematic spatial bias. This averaging smooths hydrothermal, soil, and vegetation disparities among geomorphic zones and underestimates carbon-storage gaps between mountain forests, loess-terraced grasslands, and Guanzhong urban croplands; fixed uniform coefficients also fail to capture microclimate-driven zonal carbon pool variations in sub-basins. Future studies should divide the basin into the Qinling mountain, loess hilly–gully, and Guanzhong plain subregions to build zone-specific climate correction factors, combined with multi-year field sampling to generate spatially differentiated carbon-density parameters. Such zonal calibration can eliminate homogenization bias and improve spatial carbon-storage simulation accuracy, while more environmental covariates and local field data can further reduce overall estimation errors.
Second, spatial scale conversion brings non-negligible simulation uncertainty. This study resampled 1 km resolution GDP, population density, and climate raster data to 90 m via bilinear interpolation. The smoothing effect of downscaling weakens the fine spatial differentiation of socioeconomic indicators, underestimates the local human activity intensity around roads and settlements, and produces slight deviation in the random forest regression of driving factors within the LEAS module, further propagating errors to land-use simulation and carbon-storage-estimation results.
Third, the PLUS model entails inherent subjectivity in parameter configuration. This study solely adopts conventional developmental pathways for multi-scenario simulation, omitting disturbance scenarios driven by extreme climatic events and abrupt ecological disasters. Furthermore, fragmented minor land covers (water bodies and unused land) exhibit inferior simulation accuracy, constituting another core constraint of the land-use modelling workflow. Future efforts may calibrate land-conversion parameters via field survey datasets to alleviate estimation biases stemming from classification discrepancies.
Fourth, this study identified major driving factors of carbon storage but failed to explore the interactions and causal relationships among different factors. For future work, it is necessary to establish a set of watershed-adaptive model parameter systems and combine field-sampling data to optimize carbon-density calculation and improve estimation precision. Expand the dimension of scenario simulation by incorporating extreme precipitation and ecological disasters. Introduce the geographical detector model and optimized machine-learning algorithms to clarify the interaction effects and causal relationships of driving factors. Moreover, multi-resolution parallel simulation should be carried out to quantitatively evaluate the scale conversion uncertainty caused by resampling coarse socioeconomic data, so as to further enhance the robustness of carbon storage simulation results. Additionally, subsequent research can integrate traffic travel data and long-term NPP-VIIRS nighttime light datasets into the XGBoost-SHAP framework to quantify ecological carbon sinks and multi-dimensional anthropogenic carbon sources stemming from transportation, residential consumption, and urban industrial activities [55,56].

5. Conclusions

This study constructed a coupled PLUS-InVEST-XGBoost-SHAP analytical framework to reveal spatiotemporal dynamics of carbon storage in the Weihe River Basin during 2000–2020, simulate carbon storage patterns under four development scenarios for 2030, and identify the nonlinear responses and thresholds effects of natural and anthropogenic drivers shaping carbon storage heterogeneity. The main conclusions are summarized as follows:
(1) Cultivated land, forestland, and grassland were the dominant land-use types in the Weihe River Basin during 2000–2020. Cultivated land decreased substantially, while other land categories exhibited synchronous expansion. Driven by the Grain-for-Green Program and rapid urbanization, large-scale cropland-to-forest conversion produced prominent net ecological restoration, forming a typical pattern of single-type decline and multi-type land expansion.
(2) Watershed carbon storage showed a sustained increasing trend over the study period, with growth of 231.03 × 10⁴ t (2000–2010) and 221.27 × 10⁴ t (2010–2020). Forestland acted as the dominant carbon sink, and cropland afforestation contributed the most to carbon increments, whereas forest reclamation for agriculture served as the primary cause of regional carbon loss.
(3) Multi-scenario projections indicated distinctly divergent carbon trajectories by 2030. The ecological protection scenario achieved the highest carbon sequestration benefit, while unconstrained economic growth induced severe carbon depletion, highlighting the essential role of ecological restoration in sustaining watershed carbon functions.
(4) Spatial heterogeneity in carbon storage is governed by coupled natural and anthropogenic drivers (NDVI, slope, and population density) with stage-specific nonlinear responses. The dominant regulatory mechanism shifts from natural dominance to human–natural interactions, where ecological restoration substantially promotes carbon sequestration. The identified thresholds offer quantitative insights into spatially targeted low-carbon watershed management.

Supplementary Materials

The following supporting information can be downloaded at: https://www.mdpi.com/article/10.3390/su18157775/s1, Table S1: Processed driving factors, spatial unification parameters and PLUS model core auxiliary parameters; Table S2: Confusion matrix and simulation accuracy metrics of the PLUS model for 2020 land-use simulation.

Author Contributions

Conceptualization, J.C. and J.X.; methodology, Y.H.; software, Y.H.; validation, J.C. and P.G.; formal analysis, J.N.; investigation, J.N.; resources, J.C.; data curation, Y.H.; writing—original draft preparation, J.C.; writing—review and editing, J.C.; visualization, P.G.; supervision, J.X.; project administration, J.X.; funding acquisition, J.X. All authors have read and agreed to the published version of the manuscript.

Funding

This research was supported by Scientific and Technological Innovation Programs of Higher Education Institutions in Shanxi (2023L280), College Students’ Innovation and Entrepreneurship Training Program of Institutions of Higher Education in Shanxi Province (S202510120011) and Industry-Academia-Research Special Project of Shanxi Datong University (2022CXY23).

Institutional Review Board Statement

Not applicable.

Informed Consent Statement

Not applicable.

Data Availability Statement

All publicly available raw datasets used in this study are accessible via the open data repositories listed in Table 1 of the manuscript. All post-processed datasets supporting the PLUS model simulation are provided in the newly added Supplementary Tables S1 and S2. The complete model parameter setting files and raster processing scripts can be obtained from the corresponding author upon reasonable request.

Acknowledgments

We appreciate anonymous reviewers and their valuable comments. Also, we thank the editors for the editing and comments.

Conflicts of Interest

The authors declare no conflicts of interest.

Abbreviations

CARSCellular Automata based on Random Seeds
CLCDChina Land Cover Dataset
GDPGross Domestic Product
InVESTIntegrated Valuation of Ecosystem Services and Trade-offs
LEASLand Expansion Analysis Strategy
LUCCLand-use and land-cover change
MAPMean Annual Precipitation
MATMean Annual Temperature
NDVINormalized Difference Vegetation Index
NPPNet Primary Productivity
PLUSPatch-generating Land Use Simulation
SHAPSHapley Additive exPlanations
XGBoosteXtreme Gradient Boosting

References

  1. Bai, Y.; Tang, X.; Xue, F.; Long, D.; Li, J.; Tang, Y. Spatiotemporal variation and dynamic simulation of carbon storage based on PLUS and InVEST models in the Li river basin, china. Sci. Rep. 2025, 15, 6060. [Google Scholar] [CrossRef]
  2. Mallapaty, S. How China could be carbon neutral by mid-century. Nature 2020, 586, 482–483. [Google Scholar] [CrossRef] [PubMed]
  3. Ren, S.; Terrer, C.; Li, J.; Cao, Y.; Yang, S.; Liu, D. Historical impacts of grazing on carbon storages and climate mitigation opportunities. Nat. Clim. Change 2024, 14, 380–386. [Google Scholar] [CrossRef]
  4. Wang, X.; Meng, J. Research Progress on the Environmental-Ecological Impacts of Land Use Change. Acta Sci. Nat. Univ. Pekin. 2014, 50, 1133–1140. [Google Scholar] [CrossRef]
  5. Zhu, L.; Song, R.; Sun, S.; Li, Y.; Hu, K. Land use/land cover change and its impact on ecosystem carbon storage in coastal areas of China from 1980 to 2050. Ecol. Indic. 2022, 142, 109178. [Google Scholar] [CrossRef]
  6. Wang, K.; Wang, Y.; Chen, X.; Zheng, J.; Li, J.; Sun, Y. Remote sensing estimation of forest carbon storage in Jiangxi Province based on ensemble learning algorithms and Optuna Tuning. Acta Ecol. Sin. 2025, 45, 685–700. [Google Scholar] [CrossRef]
  7. Hu, Z.; Cao, L.; Li, J.; Ying, C.; Liu, Y. Spatio-temporal evolution and multi-scenario prediction of carbon storage in coastal zone ecosystems of Zhejiang mainland based on the InVEST-PLUS-GeoDetector model. Acta Ecol. Sin. 2026, 46, 3695–3711. [Google Scholar] [CrossRef]
  8. Peng, Q.; Aji, D.; Li, P.; Hu, C.; Kang, J.; Wang, K. Spatio-temporal Evolution and Prediction of Carbon Storage in Arid Areas Based on PLUS-InVEST Model: A Case Study of Kaidu River Basin. Environ. Sci. 2025, 46, 7758–7768. [Google Scholar] [CrossRef] [PubMed]
  9. Yang, H.; He, H.; Liu, B.; Yang, H.; Han, D. Multi-scenario simulation of land use and carbon storage assessment in arid region of northwest China based on the PLUS-InVEST-Geodetector model. Environ. Sci. 2026, 47, 3049–3060. [Google Scholar] [CrossRef] [PubMed]
  10. Huang, L.; Cheng, A.; Liu, X.; Bi, Y. Simulation and prediction of land use change and carbon storage spatiotemporal evolution in Yulin City based on the PLUS-InVEST model. Environ. Sci. 2026, 47, 3061–3071. [Google Scholar] [CrossRef] [PubMed]
  11. Cao, Z.; Zhang, Y. Spatiotemporal Evolution of Land Use and Carbon Storage in Henan Province Based on InVEST-PLUS Model. Environ. Sci. 2025, 46, 7043–7057. [Google Scholar] [CrossRef] [PubMed]
  12. Zhu, M.; Zhao, K.; Shao, Z.; Li, L. Spatio-temporal analysis of carbon sequestration of wetlands in Guangdong-Hong Kong-Macao Greater Bay Area based on the InVEST model. Environ. Sci. 2025, 46, 1964–1973. [Google Scholar] [CrossRef] [PubMed]
  13. Zeng, Q.; Sun, C. Estimation and influencing factors of carbon storage in terrestrial ecosystems in the Yellow River Basin. Acta Ecol. Sin. 2024, 44, 5476–5493. [Google Scholar] [CrossRef]
  14. Paruke, W.; Ai, D.; Fang, Y.; Zhang, Y.; Li, M.; Hao, J. Spatial and Temporal Evolution and Prediction of Carbon Storage in Kunming City Based on InVEST and CA-Markov Model. Environ. Sci. 2024, 45, 287–299. [Google Scholar] [CrossRef] [PubMed]
  15. Wang, P.; Lin, L.; Peng, Y.; Huang, Z.; Song, C.; Zhang, T.; Cui, G. The trend analysis of land-use structure change in Zhejiang Province based on CLUE-S Model. Ecol. Sci. 2024, 43, 196–206. [Google Scholar] [CrossRef]
  16. Liu, Y.; Yang, Y.; Huang, H.; Guo, X.; Zhan, H.; Zhang, Z.; Liu, Q. Land use change and simulation analysis in Dali City based on FLUS model. Ecol. Sci. 2025, 44, 212–222. [Google Scholar] [CrossRef]
  17. Liang, X.; Guan, Q.; Clarke, K.C.; Liu, S.; Wang, B.; Yao, Y. Understanding the drivers of sustainable land expansion using a patch-generating land use simulation (PLUS) model: A case study in Wuhan, China. Comput. Environ. Urban Syst. 2021, 85, 101569. [Google Scholar] [CrossRef]
  18. Hou, Y.; Wen, D.; Wang, Z.; Zhang, X.; Lou, Y. Spatiotemporal Evolution and Multi-scenario Prediction of Carbon Storage in Dongting Lake Basin Based on PLUS-InVEST Model. Environ. Sci. 2025, 46, 6487–6500. [Google Scholar] [CrossRef] [PubMed]
  19. Zhao, J.; Zhou, S.; Ge, Y.; Li, C.; Li, C. Multi-scenario Simulation of Land Use and carbon storage Assessment in the Urban Agglomeration Around Taihu Lake Based on PLUS-InVEST-Geodetector Model. Environ. Sci. 2026, 47, 880–891. [Google Scholar] [CrossRef] [PubMed]
  20. Cheng, M.; Ji, G.; Huang, J.; Geng, J.; Li, L.; Lu, J. Multi-scenario land cover simulation and carbon storage assessment in Shaanxi province based on the PLUS-InVEST model. Environ. Sci. 2025, 46, 5729–5740. [Google Scholar] [CrossRef] [PubMed]
  21. Bi, F.; Wu, Z.; Liang, H.; Du, Z.; Lei, T.; Sun, B. Spatio-temporal changes and driving factors of carbon storage in the middle reaches of the Yellow River based on PLUS-InVEST-GeoDetector model. Environ. Sci. 2025, 46, 4742–4753. [Google Scholar] [CrossRef] [PubMed]
  22. Zhang, Z.; Liu, J.; Zhang, Q.; Chen, C.; Yang, C. Analysis of spatial-temporal variation and driving forces of carbon storage in Suzhou city based on the PLUS-InVEST-Geodetector model. Environ. Sci. 2025, 46, 2963–2975. [Google Scholar] [CrossRef] [PubMed]
  23. Gai, Z.; Jiang, D.; Bai, W.; Wang, H.; Du, G. Impact of cultivated land use type changes on soil organic carbon storage in a typical black soil region from a spatial differentiation perspective. Res. Soil Water Conserv. 2026, 33, 139–149, 157. [Google Scholar] [CrossRef]
  24. Gong, Y.; Du, J.; Zhu, X.; Li, L.; Li, Y.; Liu, X.; Han, J. Spatiotemporal patterns and driving factors of forest vegetation carbon storage in Jiangxi province, China (1990–2024): A Geographically Weighted Regression approach. Remote Sens. 2026, 18, 1862. [Google Scholar] [CrossRef]
  25. Gao, Y.; Wang, J.; Wang, H. Evaluating perceived built environment factors influencing children’s walking to school: An XGBoost–SHAP approach. EPJ Data Sci. 2026, 15, 57. [Google Scholar] [CrossRef]
  26. Li, Y.; He, Y.; Yang, F.; An, H.; Li, J.; Xie, Y. An XGBoost-SHAP analysis of the driving factors of carbon emissions in China’s first-tier cities. Sci. Rep. 2026, 16, 1659. [Google Scholar] [CrossRef] [PubMed]
  27. Xia, X.; Sun, S.; Liu, Q.; Guo, H.; Wang, Y. Spatio-temporal heterogeneity and driving mechanisms of RSEI in the north-south sections of the Beijing-Hangzhou grand canal: An empirical study using GEE and XGBoost-SHAP. Sci. Rep. 2026, 16, 16790. [Google Scholar] [CrossRef] [PubMed]
  28. Zheng, Y.; Wang, Z.; Li, S.; Zheng, Z.; Wang, F.; Zhao, X.; He, J.; Ji, D.; Wang, W. Analysis of spatiotemporal dynamic evolution characteristics and driving forces of land use/cover change in the Weihe River Basin in the past 30 years. Environ. Sci. 2025, 46, 7106–7118. [Google Scholar] [CrossRef] [PubMed]
  29. Zhang, Y.; Jiang, H.; Yang, W. Evolution characteristics and driving factors of production-living-ecological space pattern in Weihe River Basin, China. J. Earth Sci. Environ. 2025, 47, 718–732. [Google Scholar] [CrossRef]
  30. Hu, F.; Zhang, Y.; Guo, Y.; Zhang, P.; Lv, S.; Zhang, C. Spatial and temporal changes in land use and habitat quality in the Weihe River Basin based on the PLUS and InVEST models and predictions. Arid Land Geogr. 2022, 45, 1125–1136. [Google Scholar] [CrossRef]
  31. Yan, Z.; Gao, F.; He, B.; Wang, L.; Han, F. Spatiotemporal changes and influencing factors of habitat quality in the Weihe River Basin from 1990 to 2020. Environ. Sci. 2025, 46, 5850–5860. [Google Scholar] [CrossRef] [PubMed]
  32. Li, H.; Yang, T.; Liao, Y.; Qu, Y. Analysis of distribution pattern and driving habitat quality of rivers in the Wei River Basin (Shaanxi section). Ecol. Environ. Sci. 2024, 33, 1153–1162. [Google Scholar] [CrossRef]
  33. Wang, Y.; Han, X.; An, K.; An, K.; Zhang, M.; Tian, H.; Tuo, H.; Zhang, X.; Ye, F.; Yin, Z.; et al. Google Earth Engine-based dynamic monitoring of ecological status in the Weihe River Basin and mechanisms driving it. Acta Pratacult. Sin. 2026, 35, 1–19. [Google Scholar] [CrossRef]
  34. Jia, J.; Guo, W.; Xu, L.; Gao, C. Spatio-temporal evolution and driving force analysis of carbon storage in Anhui province coupled with PLUS-InVEST-GeoDetector model. Environ. Sci. 2025, 3, 1703–1715. [Google Scholar] [CrossRef] [PubMed]
  35. Zhang, S.; Gao, Q.; Zhang, R.; Song, C.; Su, Z. Evaluating the changes and driving factors of carbon storage using the PLUS-InVEST Model: A case study of Napa Sea Basin. China Environ. Sci. 2024, 44, 5192–5201. [Google Scholar] [CrossRef]
  36. Shao, T.; Tang, X. Spatio-temporal patterns, driving mechanisms, and multi-scenario projections of expansion in the Ningxia Yellow River urban agglomeration. Sustainability 2026, 18, 6674. [Google Scholar] [CrossRef]
  37. Xiong, G.; Wu, X.; Yang, M.; Zhang, Y.; Yi, D. Spatiotemporal variations and influencing factors of carbon storage in karst regions based on PLUS-InVEST model. Res. Soil Water Conserv. 2025, 32, 307–315+326. [Google Scholar] [CrossRef]
  38. Cheng, Y.; Chen, Y. Spatial and temporal characteristics of land use changes in the Yellow River Basin from 1990 to 2021 and future predictions. Land 2024, 13, 1510. [Google Scholar] [CrossRef]
  39. Chen, G.; Yang, Y.; Liu, L.; Li, L.; Li, X.; Zhao, Y.; Yuan, Y. Research review on total belowground carbon allocation in forest ecosystem. J. Subtrop. Resour. Environ. 2007, 1, 34–42. [Google Scholar] [CrossRef]
  40. Giardina, P.; Ryan, M.G. Evidence that decomposition rates of organic carbon in mineral soil do not vary with temperature. Nature 2000, 404, 858–861. [Google Scholar] [CrossRef] [PubMed]
  41. Alam, S.A.; Starr, M.; Clark, B.J.F. Tree biomass and soil organic carbon densities across the Sudanese woodland savannah: A regional carbon sequestration study. J. Arid Environ. 2013, 89, 67–76. [Google Scholar] [CrossRef]
  42. Xu, L.; He, N.; Yu, G. Dataset of Carbon Density in Terrestrial Ecosystems of China in the 2010s. China Sci. Data 2019, 4, 86–92. [Google Scholar] [CrossRef]
  43. Yang, J.; Xie, B.; Zhang, D. Spatio-temporal evolution of carbon storages in the Yellow River Basin based on InVEST and CA-Markov models. Chin. J. Eco-Agric. 2021, 29, 1018–1029. [Google Scholar] [CrossRef]
  44. Sun, Y.; Ma, J.; Zhao, W.; Gou, Z.; Chen, Y.; Wang, M. Spatiotemporal heterogeneity of surface soil organic carbon in China: Novel insights from interpretable machine learning coupled with Google Earth Engine. ACS Environ. Au 2026, 6, 213–224. [Google Scholar] [CrossRef] [PubMed]
  45. Li, M.; Wu, D.; He, H.; She, H.; Zhao, L.; Liu, C.; Hu, Z.; Li, Q. Spatiotemporal Evolution and Driving Factors of Carbon Storage in the Yellow River Basin from 1990 to 2020. Ecol. Environ. Sci. 2025, 34, 333–344. [Google Scholar] [CrossRef]
  46. Zhang, X.; Liu, Y.; Wang, W.; Xue, Y.; Li, B.; Jin, S. Multi-scenario Simulation of Land Use Change in China Based on PLUS-InVEST Model and Its Impacts on Ecosystem Service Functions. Acta Ecol. Sin. 2025, 45, 9577–9593. [Google Scholar] [CrossRef]
  47. Yang, S.; Zan, M.; Yuan, R.; Chen, Z.; Kong, J.; Xue, C.; Zhou, J.; Zhai, L. carbon storage Changes and Forecasting in Xinjiang Based on PLUS and InVEST Models. Environ. Sci. 2025, 46, 378–387. [Google Scholar] [CrossRef] [PubMed]
  48. Li, K.Y.; Ding, X. Analysis of Spatiotemporal Evolution and Driving Factors of Carbon Storage in Yuxi City Based on the PLUS-InVEST-Geodetector Model. Environ. Sci. 2025, 46, 6501–6511. [Google Scholar] [CrossRef] [PubMed]
  49. Shi, B.; Zhao, Y.; Wu, L.; Zhang, H.; Yang, F. Spatiotemporal Dynamic Prediction of Carbon Storage in the Yellow River Basin (Henan Section) and Analysis of Its Driving Factors. Environ. Sci. 2026, 47, 2520–2533. [Google Scholar] [CrossRef] [PubMed]
  50. Yang, H.; Kou, M.; Qi, W.; Li, Y.; Gao, T. Spatiotemporal Simulation and Driving Force Analysis of Carbon Storage in the Heihe River Basin Based on LUCC Changes. Environ. Sci. 2025, 46, 7070–7082. [Google Scholar] [CrossRef] [PubMed]
  51. Ren, L.; Jin, X.; Li, N.; Wang, L.; Cao, R. Research on the spatio-temporal evolution and driving forces of carbon storage in the Henan section of the Yellow River Basin. Sci. Surv. Mapp. 2026, 51, 129–139. [Google Scholar] [CrossRef]
  52. Liu, C.; Cao, Y.; Gong, L.; Li, J.; Xiao, C. Study of carbon storage effect and driving mechanism in Poyang Lake region based on the transition of “production-living-ecological space”. Ecol. Sci. 2026, 45, 172–183. [Google Scholar] [CrossRef]
  53. Li, L.; Li, Z.; Li, Y.; Wang, D.; Wang, H.; Yu, Z.; Hao, Z.; Jia, C.; Ding, P. Carbon storage evolution in Weifang City, multi-scenario simulation and driving factor analysis. Sci. Technol. Eng. 2026, 26, 2652–2665. [Google Scholar] [CrossRef]
  54. Wang, Z.; Matsuhashi, R. Low-energy miniature wearable air-conditioner with direct cold-air delivery: A novel water–electricity hybrid energy system. Build. Environ. 2026, 297, 114590. [Google Scholar] [CrossRef]
  55. Wang, Z.; Mae, M.; Nishimura, S.; Matsuhashi, R. Vehicular fuel consumption and CO2 emission estimation model integrating novel driving behavior data using machine learning. Energies 2024, 17, 1410. [Google Scholar] [CrossRef]
  56. Guan, Q.; Meng, T.; Guan, C.; Chen, J.; Li, H.; Zhou, X. Multi-Scale Analysis of Carbon Emissions in Coastal Cities Based on Multi-Source Data: A Case Study of Qingdao, China. Land 2024, 13, 1861. [Google Scholar] [CrossRef]
Figure 1. Geographical location of the Weihe River Basin.
Sustainability 18 07775 g001
Figure 2. Technical framework.
Sustainability 18 07775 g002
Figure 3. Spatial distribution of land use in the Weihe River Basin from 2000 to 2020.
Sustainability 18 07775 g003
Figure 4. Land-use change in the Weihe River Basin from 2000 to 2020.
Sustainability 18 07775 g004
Figure 5. Spatial pattern and changes of carbon storage in the Weihe River Basin from 2000 to 2020.
Sustainability 18 07775 g005
Figure 6. Distribution of land use under different development scenarios in 2030.
Sustainability 18 07775 g006
Figure 7. Spatial distribution of carbon storage under different scenarios in 2030.
Sustainability 18 07775 g007
Figure 8. Carbon storage impact factor importance ranking and SHAP global interpretation plot (Note: X1–X11 represent expressways, national and provincial highways, elevation, slope, aspect, NPP, GDP, population density, NDVI, annual precipitation, and annual temperature, respectively).
Sustainability 18 07775 g008
Figure 9. SHAP dependence plots (Note: X1–X11 represent expressways, national and provincial highways, elevation, slope, aspect, NPP, GDP, population density, NDVI, annual precipitation, and annual temperature, respectively).
Sustainability 18 07775 g009
Table 1. Data source.
Data TypeData NameResolutionData SourceProcessing Method
Land Use DataLand-use data for 2000 to 202030 mCLCD Dataset of Wuhan University, available at: https://zenodo.org/records/5816591 (accessed on 6 May 2026)-
Natural Geographic FactorsElevation30 mGeospatial Data Cloud, available at: http://www.gscloud.cn
(accessed on 6 May 2026)
Derived from Digital Elevation Model (DEM) data
Slope30 mGeospatial Data CloudCalculated from DEM data
Aspect30 mGeospatial Data CloudCalculated from DEM data
NPP (Net Primary Productivity)30 mResource and Environment Science and Data Center, Chinese Academy of Sciences, available at: https://www.resdc.cn
(accessed on 6 May 2026)
-
MAT (Mean annual temperature)1 kmNational Earth System Science Data Center, available at: https://www.geodata.cn
(accessed on 6 May 2026)
-
MAP (Mean annual precipitation)1 kmNational Earth System Science Data Center-
NDVI (Normalized Difference Vegetation Index)30 mGeospatial Data Cloud-
Socioeconomic FactorsPopulation density1 kmResource and Environment Science and Data Center, Chinese Academy of Sciences-
GDP (Gross Domestic Product)1 kmResource and Environment Science and Data Center, Chinese Academy of Science-
Distance to expressways30 mOpenStreetMap, available at: https://download.geofabrik.de
(accessed on 6 May 2026)
Euclidean Distance tool in ArcGIS
Distance to national and provincial highways30 mOpenStreetMapEuclidean Distance tool in ArcGIS
Restricted Conversion AreaLand-use constraint30 m-Reclassified in ArcGIS, with restricted areas assigned value 0 and unrestricted areas assigned value 1
Table 2. Neighborhood weight parameters.
Land Use TypeCultivated LandForest LandGrasslandWater BodiesUnused LandConstruction Land
neighborhood weight0.95410.4980.00800.434
Table 3. Land-use transfer matrix under different scenarios.
Land Use Type ND ScenarioCP ScenarioEP ScenarioED Scenario
ABCDEFABCDEFABCDEFABCDEF
A111111100000111111100111
B111111111010010000111111
C111111111111011000101111
D000100000100000100000100
E111111111111111111111111
F000010000010000010000010
Note: A, B, C, D, E, and F represent cultivated land, forest land, grassland, water bodies, unused land, and construction land, respectively; 1 represents conversion is permitted, while 0 represents conversion is prohibited.
Table 4. Carbon density of different land-use types (Mg/hm2).
Land Use TypeCi−aboveCi−belowCi−soilCidead
Cultivated land5.9428.2233.192.99
Forest land14.8340.5248.634.31
Grassland12.3530.2430.592.31
Water bodies0.11000
Unused land 0.4506.620
Construction land0.889.6200
Note: Ci−above, Ci−below, Ci−soil, and Cidead represent aboveground biomass carbon density, belowground biomass carbon density, 0–100 cm soil organic carbon density, and dead organic matter carbon density, respectively.
Table 5. Land use transition matrix of the Weihe River Basin from 2000 to 2020 (km2).
Land Type
in 2000
Land Type in 2020
Cultivated LandForest
Land
Grass
Land
Water BodiesUnused LandConstruction LandTotalTransfer AreaTurnover Rate (%)
Cultivated land45,775.381605.699530.5173.738.912147.3459,141.5713,366.1822.60
Forest338.9828,617.33179.200.130.001.5629,137.21519.871.78
Grassland5511.083687.7236,410.2014.607.4974.57457,05.669295.4520.34
Water bodies24.150.361.2473.120.0311.91110.8137.6934.01
Unused land0.280.011.700.120.490.162.772.2882.16
Construction land7.300.010.1427.910.011810.981846.3535.361.92
Total51,657.1733,911.1146,123.00189.6116.944046.53135,944.36--
Transfer area5881.795293.789712.79116.4916.442235.545881.7923,256.84-
Transfer rate(%)11.3915.6121.0661.4497.0855.25---
Table 6. Carbon storage changes based on land-use conversation in the Weihe River Basin from 2000 to 2020.
Land TransformationArea (km2)Carbon Storage Change (104 t)Land TransformationArea/km2Carbon Storage Change (104 t)
Cultivated land to Forest land1605.691738.80Forest land to Cultivated land338.98238.44
Cultivated land to Grassland9530.517194.58Forest land to Grassland179.20135.28
Cultivated land to Water73.730.08Forest land to Water0.130.00
Cultivated land to Unused land8.910.63Forest land to Unused land0.000.00
Cultivated land to Construction land2147.34225.47Forest land to Construction land1.560.16
Total13,366.189159.56Total519.87373.88
Grassland to Cultivated land5511.083876.49Water to Cultivated land24.1516.99
Grassland to Forest land3687.723993.43Water to Forest land0.360.39
Grassland to Water14.600.02Water to Grassland1.240.94
Grassland to Unused land7.490.53Cultivated land to Unused land0.030.00
Grassland to Construction land74.577.83Water to Construction land11.911.25
Total9295.467878.30Total37.6919.56
Unused land to Cultivated land0.280.20Construction land to Cultivated land7.305.13
Unused land to Forest land0.010.01Construction land to Forest land0.010.01
Unused land to Grassland1.701.28Construction land to Grassland0.140.10
Unused land to Water0.120.00Construction land to Water27.910.03
Unused land to Construction land0.160.02Construction land to Unused land0.010.01
Total2.271.51Total35.375.28
Table 7. Carbon storage under different scenarios in 2030 (×104 t).
Land Use TypeNatural Development
Scenario
Cultivated Land Protection ScenarioEcological Protection ScenarioEconomic Development Scenario
Cultivated land34,695.0336,897.7133,462.4737,102.88
Forest land39,559.9537,333.7739,752.5835,642.24
Grassland33,716.2233,779.6235,174.6533,688.23
Water bodies0.250.210.240.24
Unused land0.810.641.190.70
Construction land544.87427.00506.94570.42
Total108,517.13108,438.95108,898.07107,004.71
Disclaimer/Publisher’s Note: The statements, opinions and data contained in all publications are solely those of the individual author(s) and contributor(s) and not of MDPI and/or the editor(s). MDPI and/or the editor(s) disclaim responsibility for any injury to people or property resulting from any ideas, methods, instructions or products referred to in the content.