


Abstract
The digital transformation of everyday consumption has prompted platforms to quantify pro-environmental behavior through gamification, yet how such quantification affects the continuance of green consumption remains poorly understood. Existing research on the quantified self has concentrated on self-oriented domains such as health and efficiency, with little attention to its role in prosocial green consumption or to the difference between competitive and non-competitive quantification. Drawing on social identity theory, this study uses two scenario-based online experiments to examine how quantified self orientation shapes consumers’ intention to continue green consumption and the underlying mechanism. Experiment 1 (competitive vs. non-competitive quantified self, between-subjects) tests the main effect and the mediating role of symbolic behavioral motivation; Experiment 2 (2 × 2 between-subjects) introduces in-group versus out-group contexts as a moderator. The results show that, relative to non-competitive quantification, competitive quantification elicits stronger continuance intention and self-rated behavioral intensity; symbolic behavioral motivation partially mediates this effect; and group context moderates the relationship between symbolic motivation and green consumption, amplifying it in the in-group and attenuating it in the out-group. By extending the quantified self from self-oriented to prosocial settings, the study delineates an instrument–motivation–context pathway and informs the design of gamified, identity-based interventions for sustainable consumption.
1. Introduction
The diffusion of digital technologies into everyday life is reshaping how green consumption is encouraged: a growing number of platforms draw on gamification mechanisms to motivate users to engage in pro-environmental behavior. Alipay’s Ant Forest, for example, lets users earn virtual “water” that can be redeemed for real trees planted on their behalf, thereby attracting sustained participation in behaviors that indirectly generate environmental benefits [1]. Some platforms go further and quantify green consumption behavior into visualized indicators, distinguishing competitive indicators (e.g., real-time rankings and energy points) from non-competitive ones (e.g., carbon footprint reports and achievement-unlocking progress) in order to stimulate continued participation [2]. In 2019, the “Broccoli PK” campaign run by Henan University and Zhengzhou University on Ant Forest mobilized more than a thousand instances of sustained action and interaction, and average monthly participation in public welfare activities remained above baseline after the campaign ended—an exemplary case of competitive green philanthropy. By contrast, although the “Green Points Contest” launched by one online retail platform briefly attracted large numbers of users through rankings among strangers, its uninstall rate surged by 40% once the campaign concluded. The same competitive design produced sustained participation in one case yet triggered large-scale attrition after the campaign in the other. It is precisely this contradiction that the present paper sets out to interrogate: does the competitive quantified self enhance or erode the long-term intention to consume green?
Research on the drivers of green consumption has largely proceeded along three lines—reference groups and social norms at the group level, environmental awareness and personal norms at the individual level, and external economic incentives and policy interventions—examining their effects on green consumption behavior [3,4,5,6]. Only after the quantified self and gamified applications became widespread did their influence on green consumption begin to attract attention, with discussion spanning quantification scenarios, the presentation and features of feedback data, and the community sharing of quantified data [7,8]. The way scholars frame their questions has shifted accordingly: rather than merely asking whether the quantified self is present, they increasingly attend to the form in which it is presented. Du et al. [9], for instance, found that the competitive affordances of gamification can divide the quantified self into competitive (e.g., rankings and contests) and non-competitive (e.g., personal data tracking) types, both of which afford users hedonic experiences and reinforce their environmental cognition, thereby positively influencing green consumption intention. Most of this work, however, has focused on the positive and short-term effects of the quantified self [10,11]. Two issues remain unresolved in the green consumption domain: first, how competitive and non-competitive quantified selves differentially affect consumers’ green consumption behavior, with their long-term effects still unclear; and second, that the quantified self may induce individuals to engage in inauthentic green consumption in pursuit of “impressive data” in competitive rankings, thereby producing adverse consequences.
Accordingly, drawing on social identity theory and adopting an experimental approach, this study clarifies the mechanism through which the quantified self acts on green consumption behavior from the standpoint of competitiveness, and extends the application of the quantified self from self-oriented domains to the prosocial setting of green consumption. The findings also offer guidance for firms and governments in designing pro-environmental incentive mechanisms—namely, leveraging competitive quantification to raise consumer engagement, refine green marketing strategies, and strengthen the public’s enthusiasm for green consumption and their intention to continue such behavior.
To more clearly define the academic contributions of this study, Table 1 systematically reviews the representative literature closely related to this research. It can be seen that existing research has significant gaps in three areas: first, research on the quantified self has largely focused on “self-interested” domains such as health management, and its mechanisms of action in “prosocial” contexts such as green consumption remain to be explored; second, while symbolic motivation has been mentioned, its role as a mediating pathway between quantified self and green consumption has not been empirically tested; and third, social identity theory has not yet been systematically incorporated to explain how the quantified self context influences green consumption. Building upon these three gaps, this study constructs and tests an integrated framework of “tool (quantified self orientation)—motivation.”
Table 1.
Comparison of the related research literature and identification of gaps in this study.
2. Theoretical Background
2.1. The Quantified Self
As a data practice, the quantified self has been widely applied to the management of individual behavior. Swan [12] defines the quantified self as the use of digital technologies to track, record, and analyze personal data so as to help users understand their position and progress toward a goal, thereby gaining self-knowledge and improvement and ultimately achieving self-enhancement [17]. Scholars hold that the competitive quantified self denotes a process in which an individual’s own data (e.g., rankings and energy points)—collected through platform architectures such as algorithms, interface design, and default settings—are placed within a social or public comparison frame, transforming self-tracking from internally oriented self-knowledge and improvement into a process of competing with others and pursuing social recognition and a sense of superiority [18,19]. Empirical evidence supports this: Du et al. [9], for example, found that on gamified platforms such as Ant Forest, designs incorporating ranking and contest elements significantly enhanced users’ environmental engagement, whereas designs providing only personal progress tracking mainly affected users’ self-efficacy rather than their social comparison motivation.
Building on the systematic review by Feng et al. [13], existing research has identified motivational heterogeneity within quantified self practices, distinguishing self-tracking motivations into intrinsic motivation centered on self-knowledge and goal attainment and extrinsic motivation associated with social recognition and status display. How these two types of motivation separately shape users’ long-term behavior and psychological outcomes has received little discussion to date. The competitive quantified self, which centers on ranking and surpassing others, differs from the traditional self-enhancement orientation; its behavioral consequences cannot be overlooked, yet they have scarcely been brought into research on sustainable consumption. The concept of the “quantified self” in the existing literature has been operationalized in two distinct ways: one is the trait-like quantified self tendency, a stable dispositional preference for tracking and analyzing one’s own data consistently across situations and over time [19]; the other is the situational quantified self manipulation, a quantified self psychological state temporarily induced in an experimental setting through specific interface designs (e.g., whether rankings or comparative information are displayed) [7]. The present study focuses on the latter, operationalizing the “competitive quantified self” and the “non-competitive quantified self” as two different modes of platform data presentation rather than measuring participants’ stable quantified self trait. This definition is adopted so as not to misread a state temporarily induced in the experiment as a stable individual trait.
Nonetheless, two gaps remain in existing quantified self research. First, study settings have concentrated on self-oriented domains such as health management and personal efficiency improvement, with little systematic examination of whether and how the technology can drive prosocial behaviors such as green consumption. Second, the research orientation has leaned toward positive and short-term effects, devoting little attention to long-term effects or to potential negative consequences such as competitive anxiety and behavioral rebound. It is precisely from these two gaps that the present paper proceeds.
2.2. Symbolic Green Consumption Under the Quantified Self
Green consumption refers to a behavioral pattern in which, throughout the processes of deciding on, purchasing, using, and disposing of products, consumers proactively choose environmentally friendly alternatives and, by reducing resource consumption and optimizing consumption patterns, minimize their negative impact on the environment and promote sustainable development [20]. This behavior spans three stages—purchase, use, and disposal—prioritizing the purchase of environmentally friendly products, minimizing unnecessary consumption, and properly handling waste [21]. Its motivations are diverse, potentially stemming from concern for the environment itself as well as from extrinsic factors such as enhancing one’s social image or conforming to social norms [15]. Researchers’ interest in green consumption has likewise shifted gradually from how well a product performs to what it can “signal.” Early research emphasized the utilitarian attributes and price disadvantages of green products, but Griskevicius et al. [14] showed that status motives drive people to purchase expensive green products in public settings to display altruism, bringing the symbolic value of green consumption into focus. The quantified self—and the competitive quantified self in particular—may render this symbolic motivation explicit: what individuals care about is no longer whether they personally endorse environmentalism but external rewards such as rankings and the recognition of others. Symbolic behavioral motivation refers to the psychological drive to display one’s self-image, status, or values to society through consumption behavior [22]. Drawing on the existing literature [14,16], the construct can be broadly divided into three motivations: (1) status-seeking motivation—displaying social status, wealth, or superiority through green consumption in exchange for others’ admiration and respect; (2) moral self-verification motivation—using green consumption to affirm an image of oneself as “a moral person” and “a responsible citizen” so as to satisfy the need for moral consistency; and (3) group-belonging motivation—seeking the recognition, acceptance, and positive appraisal of in-group members through green consumption so as to strengthen social bonds. For empirical measurement, this study adopts the composite scale of Chen et al. [16], treating symbolic motivation as a single construct and not administering it along separate dimensions; consequently, any inference involving sub-dimensions in what follows (e.g., which symbolic meaning is more strongly activated within the in-group) constitutes an interpretive discussion grounded in the literature, lacks direct support from the present data, and is accordingly confined to the level of “symbolic motivation as a whole.”
Research on symbolic motivation still leaves two gaps. On the one hand, although Griskevicius et al. [14] distinguished public from private consumption contexts, they did not differentiate the types of “publicness”—displaying to a value-congruent “in-group” versus a value-incongruent “out-group” entails markedly different social risks and expected rewards. On the other hand, digital platforms create novel social comparison contexts through quantification and visualization mechanisms, and how these reconfigure the symbolic meaning of green consumption awaits systematic examination. The differences in publicness across group types, and the reshaping of symbolic meaning by digital quantification contexts, are the two issues this paper addresses.
3. Research Hypotheses
3.1. Quantified Self Orientation and Green Consumption Continuance Intention
The quantified self refers to the process by which individuals record, monitor, and analyze their own behavior through digital means [23]. Depending on the degree of competitiveness, it can be divided into “competitive” and “non-competitive” contexts [24]. In competitive contexts, an individual’s behavioral data (e.g., public rankings and leaderboards) are placed within a frame of comparison with others [25], activating social comparison tendencies and heightening attention to one’s relative position within the group. To maintain or enhance their status, individuals tend to keep participating in group-sanctioned behaviors, thereby reinforcing the continuance of green consumption behavior [26]. By contrast, behavioral records in non-competitive contexts serve mainly for self-monitoring and lack external comparison pressure and public feedback mechanisms [27], so behavioral continuance depends more heavily on unstable intrinsic motivation [28]. Accordingly, this study proposes:
H1.
Relative to the non-competitive quantified self, the competitive quantified self significantly increases green consumption continuance intention.
3.2. The Mediating Role of Symbolic Behavioral Motivation
This study further proposes that quantified self orientation (competitive vs. non-competitive) influences green consumption continuance intention by affecting the degree to which individuals’ symbolic behavioral motivation is aroused [29]. In the competitive quantified self context, the quantification and public display of behavioral outcomes enable individuals to prove their ability and status to others [27], and symbolic behavioral motivation is thereby highly activated; in the non-competitive context, attention centers on personal growth and the impetus for outward display is lacking, so the arousal of symbolic motivation is markedly lower [30]. Social psychological research indicates that activated symbolic motivation drives individuals to undertake highly symbolic behaviors, which in the green consumption domain manifest as purchasing more recognizable environmentally friendly products to convey one’s sense of environmental responsibility and moral image. The social recognition and self-presentation effects of such consumption strengthen the intention to continue the behavior [31,32]. We therefore propose:
H2a.
Symbolic behavioral motivation mediates the relationship between quantified self orientation and green consumption continuance intention; that is, the competitive quantified self indirectly promotes continuance intention by enhancing symbolic motivation.
H2b.
Symbolic behavioral motivation mediates the relationship between quantified self orientation and green consumption behavioral intensity.
3.3. The Moderating Role of In-Group/Out-Group Identity
In the era of digital platforms, individuals are often nested within multiple groups, and the degree to which they internalize different groups varies markedly. According to social identity theory [33], through psychological processes such as categorization, identification, and comparison, individuals divide the groups to which they belong into “in-groups” and “out-groups” according to the degree of internalization. Classic studies show that individuals exhibit greater preference for and identification with in-group members (the in-group favoritism effect), while tending to differentiate themselves from and keep their distance from out-group members [33,34]. When individuals are in an in-group context, their identification with the group is strengthened and they are more inclined to seek in-group members’ recognition through symbolic consumption [35], so that symbolic motivation is more readily translated into actual green consumption behavior [36]. Conversely, in an out-group context, owing to a lack of psychological identification, individuals pay less attention to the out-group’s evaluations [37], and even high symbolic motivation can hardly be translated effectively into green consumption behavior [38]. Group context therefore moderates the relationship between symbolic motivation and green consumption behavior.
H3.
Group context moderates the relationship between symbolic behavioral motivation and green consumption behavior. Specifically, an in-group context strengthens the positive relationship between the two, whereas an out-group context weakens it.
3.4. The Overall Theoretical Model
Integrating H1 through H3, this study constructs an “instrument (quantified self orientation)–motivation (symbolic behavioral motivation)–context (group context)” analytical framework (Figure 1): the competitive quantified self influences the continuance intention and behavioral intensity of green consumption via symbolic behavioral motivation, while group context (in-group vs. out-group) moderates the translation of this symbolic pathway into actual behavior. This framework extends the application of the quantified self to the domain of prosocial consumption and provides the overall logic for the subsequent empirical tests.
Figure 1.
The proposed conceptual model. Note: Quantified self orientation (competitive vs. non-competitive) is the independent variable; green consumption continuance intention is the dependent variable; symbolic behavioral motivation is the mediator; group context (in-group vs. out-group) is the moderator. H1 denotes the direct effect; H2a and H2b denote the mediating role of symbolic behavioral motivation; H3 denotes the moderating role of group context.
4. Experimental Manipulation and Hypothesis Testing
4.1. Pilot Study
To test whether the manipulation of consumers’ quantified self orientation was effective, this study designed two platform interface scenarios: one that elicited a competitive quantified self orientation by emphasizing social comparison (e.g., real-time rankings and the performance gap relative to top users), and another that elicited a non-competitive quantified self orientation by emphasizing self-referential progress (e.g., personal improvement over time and goal attainment rate). Thirty students from a university took part in the pilot study; they read an excerpted material within a limited time and recorded their level of activity participation. Quantified self orientation was divided into competitive and non-competitive dimensions, and a questionnaire was used to identify and classify consumers’ quantified self orientation (“To what extent do you regard the following format as competitive? 1 = strongly disagree, 5 = strongly agree”). The material contained two formats for presenting carbon reduction (per-capita carbon emissions drew on You [39]): one presented competitive feedback in a leaderboard format, displaying the real-time rankings of two reference users and of the participant, together with the gap relative to the leader and motivational prompts; the other presented non-competitive feedback in a personal progress format, showing the participant’s own emission reductions, the comparison with the previous month, goal completion progress, and a record of continuous improvement, accompanied by positive encouragement. On the basis of participants’ endorsement ratings of the two formats, their inclination toward a competitive or a non-competitive quantified self orientation could be identified. It should be noted that this pilot study served only to test whether the two sets of scenario materials could effectively distinguish competitive from non-competitive quantified presentations; it used a within-subjects evaluation design with a convenience sample and did not serve a hypothesis-testing function. Moreover, because the pilot study was within-subjects whereas the main experiments were between-subjects, the two designs are not fully aligned, and its conclusions provide only preliminary evidence of material validity.
The results showed that participants rated Condition 1 (M = 4.47, SD = 0.68) significantly higher than Condition 2 (M = 2.04, SD = 0.64), t(29) = 14.848, p < 0.001. This indicates that, within this pilot sample, emphasizing real-time ranking comparison with others was preferred over highlighting self-referential data. However, given the small sample size of this manipulation check (N = 30), the finding should be interpreted with caution. The primary evidence for our hypotheses comes from the larger main experiments (Experiment 1, N = 120; Experiment 2, N = 240), which recruited more representative samples of ordinary consumers.
4.2. Experiment 1
Experiment 1 aimed to examine the differential effects of the competitive versus the non-competitive quantified self on green consumption behavior—measured in two aspects, continuance and intensity—and to test the mediating role of symbolic behavioral motivation. To this end, we designed two sets of scenario materials and recruited 120 ordinary consumers through an online experimental platform, randomly assigning them to a “competitive quantified self” group (N = 60) and a “non-competitive quantified self” group (N = 60); participants read and responded independently and received remuneration. This study used the G*Power 3.1 software [40] to estimate the a priori sample size. For an independent samples t-test (two-tailed), with a medium effect size (Cohen’s d = 0.5), a significance level (α = 0.05), and statistical power (1 − β = 0.80), the calculated minimum total sample size was 128 participants. A total of 120 participants were ultimately recruited, which is close to the minimum requirement and indicates that the sample size possesses sufficient statistical power. In both groups, the scenario was set as the use of a smart environmental-tracking platform called “Green Living,” which records an individual’s carbon footprint across scenarios such as travel, dining, and home life and generates a “personal carbon map.” The two sets of materials differed in a key manipulation of data presentation and feedback framing. The material received by the competitive group emphasized social comparison: the interface displayed the user’s real-time ranking among all active users on the platform (e.g., “No. 856”) and listed the emission reduction data of leading users, ending with the competitive incentive prompt “Reduce another 30 kg to enter the top 500.” This design was intended to elicit a “competitive quantified self” perception based on social comparison. The material received by the non-competitive group focused on self-comparison and personal goal progress: the interface displayed only the comparison between the participant’s own emission reductions this month and last month, the magnitude of improvement (e.g., +22%), and a personal goal (a monthly reduction of 100 kg CO2), without any ranking or information involving comparison with others. This design was intended to elicit a “non-competitive quantified self” perception based on self-tracking. After reading the assigned material, participants completed 5-point Likert scales measuring the intensity and continuance of green consumption intention (items adapted from existing scales [41,42,43]; 1 = strongly disagree, 5 = strongly agree; Experiment 1 used a 5-point scale to remain consistent with the pilot study), including three green consumption continuance items such as “I plan to maintain or increase my green consumption behavior in the future” and three green consumption intensity items such as “I am willing to spend more time practicing green consumption behavior.” Participants then completed a 5-point Likert scale of symbolic motivation (items drawn from the scale developed by Chen et al. [16]; 1 = strongly disagree, 5 = strongly agree), including four items such as “Using green products helps me establish a positive image among my friends.” Finally, participants reported how frequently they used environmental-/health-related applications.
4.2.1. Manipulation Check
To test the effectiveness of the manipulation, after completing all questionnaire measures, participants answered a manipulation check item: “Do you think the data-feedback format of the ‘Green Living’ platform constitutes a competitive comparison?” (1 = strongly disagree, 5 = strongly agree). An independent samples t-test (first row of Table 2) showed that the competitive quantified self group (M = 4.350, SD = 0.515) scored significantly higher than the non-competitive quantified self group (M = 2.133, SD = 0.982), t(118) = 15.480, p < 0.001. This indicates that the experimental manipulation of quantified self orientation was successful.
Table 2.
Independent samples t-test results for each variable, by group.
It should be noted that this was a scenario-priming experiment: participants completed the questionnaire after reading the scenario material, so what was measured was behavioral intention rather than actual behavior. The experiment is therefore more accurately characterized as a “scenario experiment” rather than a behavioral experiment in the strict sense. Building on this, Experiment 2 adopted a 2 × 2 between-subjects design and further strengthened the manipulation checks.
4.2.2. Group Difference Test (Independent Samples t-Test)
Using independent samples t-tests (Table 2), the mean differences between the competitive and the non-competitive quantified- self groups on the core study variables were compared. For quantified self orientation, the competitive group (M = 4.350, SD = 0.515) scored significantly higher than the non-competitive group (M = 2.133, SD = 0.982), t = 15.480, p < 0.001. Likewise, symbolic behavioral motivation (t = 10.879, p < 0.001), green consumption continuance intention (t = 11.218, p < 0.001), and green consumption behavioral intensity (t = 16.954, p < 0.001) also differed extremely significantly between the two groups. These differences indicate that the competitive and non-competitive conditions produced systematic differences on the key variables, that the group manipulation was effective, and that the prerequisites for the subsequent model tests were satisfied.
4.2.3. Reliability Analysis
Table 3 presents the internal consistency reliability of the scales used in the study (symbolic behavioral motivation and green consumption behavior). The overall Cronbach’s α was computed for each variable, together with the α if each item was deleted and the corrected item–total correlation. The analysis showed an overall reliability of 0.888 for symbolic behavioral motivation (4 items), 0.894 for green consumption continuance (3 items), and 0.886 for green consumption intensity (3 items), all exceeding the acceptable threshold of 0.7 and indicating excellent internal consistency.
Table 3.
Scale reliability analysis.
4.2.4. Common Method Bias Test
Since all core variables in this study were measured via self-report, common method bias (CMB) may be present. This study controlled for and assessed CMB at both the statistical and procedural levels.
First, an unrotated principal component factor analysis was conducted on all measurement items using Harman’s one-factor test. The results showed that the first factor explained 56.44% of the total variance, exceeding the empirical threshold of 40% [44], suggesting the presence of non-negligible common method variance in the data.
To further quantify the potential impact of CMB on the core findings, this study conducted a supplementary analysis using the marker variable method [45]. “Frequency of using eco-friendly apps” was included in the regression model as a marker variable to serve as a control variable. Theoretically, this variable has no direct association with the core constructs (symbolic motivation and sustained intention to engage in green consumption) and is therefore suitable as a proxy for CMB. The results show that, after controlling for this variable, the direct effect of quantified self orientation on the intention to continue green consumption remained significant (β = 0.503, p < 0.001), and the predictive role of symbolic behavior motivation on the intention to continue green consumption also remained significant (β = 0.422, p < 0.001). Although the standardized coefficients of the core paths decreased slightly, neither their direction nor their significance levels changed substantially.
At the same time, to verify the discriminant validity between the motivation for symbolic behavior and the intention to continue green consumption, this study conducted correlation and partial correlation analyses on the two constructs. The zero-order correlation revealed a significant positive correlation between the two (r = 0.775, p < 0.001). After controlling for quantified self orientation and group context, the partial correlation coefficient between the two decreased to r = 0.523 (p < 0.001), which is far below the strict discriminant validity threshold of 0.85 [46]. Combined with the clear theoretical distinction between the two constructs—symbolic motivation reflects the “drive behind behavior” (i.e., why one acts), while sustained willingness reflects the “propensity to act” (i.e., whether one is willing to act), with the two belonging to different dimensions of motivation and intention—the above evidence indicates that although the two constructs are correlated, they do not measure the same phenomenon.
Furthermore, the independent variable in this study (quantified self orientation) was obtained through the manipulation of situational materials rather than participant self-reports, which to some extent reduces the threat posed by CMB to between-group comparisons; the core finding of the 2 × 2 between-subjects design in Experiment 2 was an interaction effect, and methodological research indicates that CMB typically attenuates rather than exaggerates estimates of interaction effects [47,48], and thus the conclusions regarding the interaction are conservative.
In summary, although a certain degree of common method variance was detected in the data, supplementary analyses indicate that it is not severe enough to substantially distort the core conclusions of this study.
4.2.5. Hierarchical Regression and Mediation Analysis (Outcome: Green Consumption Continuance Intention)
Using hierarchical regression and bootstrap mediation tests, this section examined the mediating role of symbolic behavioral motivation between quantified self orientation and green consumption behavior. In the hierarchical regression, Model 1 predicted symbolic behavioral motivation from the control variables (A–E) and quantified self orientation; quantified self orientation significantly and positively predicted symbolic behavioral motivation (β = 0.386, p < 0.001). Model 2 predicted green consumption continuance from the control variables and quantified self orientation; the effect was significant and positive (β = 0.513, p < 0.001). Model 3 added symbolic behavioral motivation to Model 2; the effect of quantified self orientation remained significant but decreased (β = 0.365, p < 0.001), while symbolic behavioral motivation also had a significant positive effect (β = 0.384, p < 0.001). These results (Table 4) provide preliminary evidence of partial mediation. Figure 2 shows the mediation model results, with standardized regression coefficients on each path; the value on the path from quantified self orientation to the outcome is the direct effect after including the mediator.
Table 4.
Hierarchical regression results (outcome: green consumption continuance intention).
Figure 2.
The mediating effect of symbolic behavioral motivation between quantified self orientation and green consumption continuance intention. Note: Path values are standardized regression coefficients. *** p < 0.001.
A bootstrap mediation test (Table 5) further examined the significance of the mediation effect. The total effect of quantified self orientation on green consumption continuance was 0.513; the direct effect was 0.365 (71.15% of the total), and the indirect effect through symbolic behavioral motivation was 0.148 (28.85% of the total), with a 95% bootstrap confidence interval that did not include 0. This confirms that symbolic behavioral motivation played a significant partial mediating role in the relationship between quantified self orientation and green consumption continuance.
Table 5.
Mediation effect (outcome: green consumption continuance intention).
4.2.6. Hierarchical Regression and Mediation Analysis (Outcome: Green Consumption Behavioral Intensity)
This section follows the same analytical structure as Section 4.2.5 and tests the mediating role of symbolic behavioral motivation between quantified self orientation and green consumption behavioral intensity. In the hierarchical regression (Table 6), Model 1 is the same as above (predicting symbolic behavioral motivation). Model 2 shows that quantified self orientation significantly and positively predicted green consumption behavioral intensity (β = 0.562, p < 0.001). After symbolic behavioral motivation was added in Model 3, the effect of quantified self orientation remained significant but decreased (β = 0.416, p < 0.001), and symbolic behavioral motivation also significantly predicted intensity (B = 0.378, p < 0.001). Figure 3 shows the mediation model results; following the same structure as Figure 2, standardized coefficients and significance levels are labeled on each path.
Table 6.
Hierarchical regression results (outcome: green consumption behavioral intensity).
Figure 3.
The mediating effect of symbolic behavioral motivation between quantified self orientation and green consumption behavioral intensity. Note: Path values are standardized regression coefficients. *** p < 0.001.
A bootstrap mediation test (Table 7) showed that the total effect of quantified self orientation on green consumption behavioral intensity was 0.562; the direct effect was 0.416 (74.02% of the total), and the indirect effect through symbolic behavioral motivation was 0.146 (25.98% of the total), with a 95% bootstrap confidence interval that likewise did not include 0. This confirms that symbolic behavioral motivation also played a significant partial mediating role in the relationship between quantified self orientation and green consumption behavioral intensity.
Table 7.
Mediation effect (outcome: green consumption behavioral intensity).
Taken together, Figure 2 and Figure 3 indicate that symbolic behavioral motivation partially mediated the relationship between quantified self orientation and both dimensions of green consumption behavior. In both models, after symbolic behavioral motivation was included, the direct effect of quantified self orientation on green consumption behavior remained significant, and the indirect effect through symbolic behavioral motivation was also significant (see the bootstrap confidence intervals in Table 5 and Table 7). These results support H2a and H2b.
4.3. Experiment 2
4.3.1. Procedure
Experiment 2 adopted a 2 (quantified self orientation: competitive vs. non-competitive) × 2 (degree of group context internalization: in-group vs. out-group) between-subjects design. Through an online experimental platform, 240 ordinary consumers were recruited and randomly assigned in equal numbers to four experimental conditions (60 per condition). This study used the G*Power 3.1 software [40] to estimate the a priori sample size. For a 2 × 2 between-subjects analysis of variance, assuming a medium effect size (f = 0.25), a significance level (α = 0.05), and statistical power (1 − β = 0.80), the calculation yielded a minimum total sample size of 128 participants required to detect an interaction effect. To ensure an adequate sample size for each experimental condition and to enhance statistical robustness, a total of 240 participants were ultimately recruited (60 per condition), far exceeding the minimum requirement. The procedure was as follows. Participants first read the instructions and learned that the task concerned “the user experience of a new environmental-tracking platform.” They then read the scenario material and, according to their randomly assigned condition, viewed different versions of the platform interface description (for example, in the competitive quantified self + in-group condition, the app displayed the internal leaderboard and incentive prompts of the participant’s “Sustainable Living Alliance” community; in the competitive quantified self + out-group condition, the app displayed a carbon reduction leaderboard across multiple communities; in the non-competitive quantified self + in-group condition, the app displayed only the individual’s own progress and emphasized continued contribution to the community; in the non-competitive quantified self + out-group condition, the app displayed only the individual’s own progress and presented a passive comparison chart of carbon reductions across multiple communities). Next, participants completed manipulation check items to verify the effectiveness of the quantified self orientation and group context manipulations; they then completed the green consumption continuance intention scale (Experiment 2 used a 7-point Likert scale, 1 = strongly disagree, 7 = strongly agree, to increase measurement sensitivity and accommodate the 2 × 2 interaction test) and the symbolic behavioral motivation scale (also changed to a 7-point scale); finally, they reported demographic information (gender, age, education, monthly disposable income, and frequency of using environmental applications), and after the experiment, they received remuneration and were informed of the study’s purpose. Compared with Experiment 1, Experiment 2 incorporated two methodological improvements: first, independent manipulation check items were included in the main experiment; second, a 2 × 2 between-subjects design was used so that cross-validation could mitigate the influence of common method bias—arising from reliance on a single self-report measure—on the interaction test. It should be clearly noted that in Experiment 2, the dependent variable scale was adjusted from a 5-point scale to a 7-point scale, primarily based on methodological considerations. There are two reasons for this: first, testing for interaction effects in a 2 × 2 between-subjects design requires higher measurement sensitivity; second, a 7-point scale reduces participants’ tendency to choose midpoints, thereby increasing data variability. However, this adjustment came at a clear cost: the scores from the two experiments are no longer on the same scale, making direct cross-experimental comparisons impossible. Our strategy was to position Experiment 2 primarily as a replication and extension of the findings from Experiment 1. Evidence of replication is reflected in the high consistency in the direction of the main effect of self-oriented quantification across both experiments (competitive > non-competitive); evidence of extension comes from the interaction effect in Experiment 2. Therefore, the conclusions of this study are based on the robust evidence of “consistent effect direction,” rather than relying on numerical comparisons across experiments. We also took this into account when reporting the proportion of the mediating effect, avoiding overinterpretation.
4.3.2. Manipulation Checks
To test whether the manipulations of the two independent variables were successful, after reading the scenario material and before measuring the core variables, participants answered the following manipulation check items. For quantified self orientation, using a 7-point Likert scale (1 = strongly disagree, 7 = strongly agree), participants rated “I think the platform-feedback format in the material above constitutes a competitive comparison.” An independent samples t-test showed that the competitive group (M = 5.82, SD = 1.08) scored significantly higher than the non-competitive group (M = 2.45, SD = 1.21), t(238) = 18.47, p < 0.001, Cohen’s d = 2.39, indicating that the manipulation of quantified self orientation was successful. For the degree of group context internalization, the seven-pair circle pictorial method (Inclusion of Other in the Self Scale; Aron et al. [49]) was used: participants chose, from seven pairs of increasingly overlapping circles, the pair that best described the relationship between “me” and “this community” (1 = no overlap, 7 = complete overlap). An independent samples t-test showed that the in-group group (M = 5.67, SD = 1.34) chose significantly higher values than the out-group group (M = 2.89, SD = 1.52), t(238) = 15.23, p < 0.001, Cohen’s d = 1.97, indicating that the manipulation of the degree of group context internalization was successful.
4.3.3. Descriptive Statistics of the Dependent Variable by Condition
The means and standard deviations of green consumption continuance intention under each experimental condition are shown in Table 8.
Table 8.
Means (standard deviations) of green consumption continuance intention, by condition.
4.3.4. Correlation Matrix of the Main Variables
Table 9 presents the Pearson correlation coefficients among the main variables in Experiment 2.
Table 9.
Means, standard deviations, and correlation matrix of the main variables (N = 240).
4.3.5. Independent Samples t-Test
Independent samples t-tests compared the competitive quantified self (Group1 = 1) and the non-competitive quantified self (Group1 = 0) on each variable (Table 10). For symbolic behavioral motivation, the competitive group (M = 5.37, SD = 1.03) was significantly higher than the non-competitive group (M = 3.18, SD = 0.68), t(207.35) = −19.488, p < 0.001. For the degree of group context internalization, the competitive group (M = 3.90, SD = 2.32) did not differ significantly from the non-competitive group (M = 4.08, SD = 2.00), t(232.92) = 0.627, p = 0.531. For green consumption behavior, the competitive group (M = 5.99, SD = 0.56) was significantly higher than the non-competitive group (M = 3.19, SD = 0.61), t(238) = −37.193, p < 0.001.
Table 10.
Independent samples test.
4.3.6. Two-Way ANOVA on Green Consumption Continuance Intention
A 2 × 2 two-way ANOVA was conducted with quantified self orientation (competitive vs. non-competitive) and group context (in-group vs. out-group) as independent variables and green consumption continuance intention as the dependent variable. The main effect of quantified self orientation was significant, F(1, 236) = 138.24, p < 0.001, η2 = 0.37, with the competitive group (M = 5.99) showing significantly higher continuance intention than the non-competitive group (M = 3.19). The main effect of group context was not significant, F(1, 236) = 2.31, p = 0.13, η2 = 0.01. The interaction between quantified self orientation and group context was significant, F(1, 236) = 6.72, p = 0.01, η2 = 0.03. Its magnitude should be viewed objectively: η2 = 0.03 approaches a “small” effect, and the main effect of group context was not significant (η2 = 0.01); we therefore characterize this contextual moderation as detectable but mild and avoid expressions such as “decisive” in the discussion.
Simple effects analysis showed that, in the competitive quantified self condition, the in-group group (M = 6.23) had significantly higher continuance intention than the out-group group (M = 5.75), F(1, 236) = 4.82, p = 0.03; in the non-competitive quantified self condition, the difference between the in-group (M = 3.45) and the out-group (M = 2.93) was also significant, F(1, 236) = 3.95, p = 0.04. It should be noted that what is tested here is the interaction of quantified self orientation and group context on continuance intention, which is not equivalent to the moderation, stated in H3, of the relationship between symbolic motivation and green consumption by group context; the test of H3 is presented in the moderation analysis below, with this ANOVA serving only as collateral evidence that group context does have an effect.
4.3.7. Mediation Analysis (PROCESS Model 4)
PROCESS Model 4 (Hayes [50]) was used to test the mediating effect of symbolic behavioral motivation between quantified self type (Group1) and green consumption behavior. With 5000 bootstrap samples, the 95% confidence interval of the indirect effect was computed (Table 11). The total effect was significant (B = 2.801, p < 0.001), the direct effect was significant (B = 2.334, p < 0.001), and the indirect effect was significant (B = 0.467, 95% bootstrap CI [0.231, 0.834]), indicating that symbolic behavioral motivation played a partial mediating role between quantified self type and green consumption behavior; the mediation effect accounted for 16.7% of the total effect (slightly lower than the approximately 26–29% in Experiment 1, suggesting that mediation is not the dominant pathway). This study did not use a moderated mediation model to jointly test whether this indirect effect varied with group context; see the Limitations.
Table 11.
Mediation effect test results.
4.3.8. Moderation Test and Simple Slope Analysis (PROCESS Model 1)
PROCESS Model 1 (Hayes [50]) was used to test the moderating effect of the degree of group context internalization on the relationship between symbolic behavioral motivation and green consumption behavior. The variables forming the interaction term were mean-centered, and 5000 bootstrap samples were drawn. The results (Table 12) showed that symbolic behavioral motivation had a significant positive effect on green consumption behavior (β = 0.9204, SE = 0.0427, t = 21.5478, p < 0.001), and the degree of group context internalization had a significant negative effect (β = −0.0858, SE = 0.0267, t = −3.2080, p = 0.0015). The symbolic behavioral motivation × degree of group context internalization interaction was significant (B = 0.0660, SE = 0.0190, t = 3.4763, p = 0.0006, 95% CI [0.0286, 0.1034]), indicating that the degree of group context internalization significantly moderated the relationship between symbolic behavioral motivation and green consumption behavior. Adding the interaction term significantly improved the model’s explanatory power (R2 = 0.6677, p < 0.001). This relatively high R2 also draws attention to the high correlation among constructs: the correlation between symbolic motivation and green consumption intention reached 0.80 (Table 9), and whether the two are adequately separable in measurement cannot be determined from Cronbach’s α alone. Constrained by the available data, this study did not provide confirmatory factor analysis or discriminant validity evidence (e.g., AVE, HTMT); we therefore cannot rule out that part of the association stems from overlap in construct content, and the strength of the relevant conclusions is qualified accordingly.
Table 12.
Moderation effect test results.
Simple slope analysis (Table 13) showed that at a low level of group context internalization (M − 1 SD), symbolic behavioral motivation had a significant positive effect on green consumption behavior (β = 0.7778, p < 0.001); at a medium level (mean), the effect was significant and positive (β = 0.9204, p < 0.001); and at a high level (M + 1 SD), it was significant and positive (β = 1.0629, p < 0.001). As the degree of group context internalization increased, the positive effect of symbolic behavioral motivation on green consumption behavior strengthened progressively, indicating that the degree of group context internalization positively moderated this relationship.
Table 13.
Simple slope (conditional effects) analysis.
4.3.9. Distinctive Validity Test
Given the high zero-order correlation between the motivation for symbolic behavior and the intention to continue green consumption (r = 0.80; see Table 9), this study conducted a systematic distinctive validity test based on the data from Experiment 2 (N = 240) to confirm that the two are indeed empirically distinct and independent constructs.
First, principal component analysis was used to extract factors for the motivation for symbolic behavior (4 items) and the intention to continue green consumption (6 items), with the goal of identifying two factors. The results showed that the standardized loadings of all items on their respective factors ranged from 0.801 to 0.862 (all > 0.80), and the cross-factor loadings were all below 0.30, indicating that each item excellently represented its respective construct.
Next, the composite reliability (CR) and average variance extracted (AVE) for each construct were calculated. As shown in Table 14, the CR value for the motivation for symbolic behavior was 0.891, and the AVE value was 0.672; the CR value for the intention to continue green consumption was 0.930, and the AVE value was 0.689. The CR values for both constructs were well above the empirical threshold of 0.70, and the AVE values were well above the threshold of 0.50 [51], indicating that both constructs possess good convergent validity.
Table 14.
Reliability and convergent validity measures for each construct.
Finally, discriminant validity was assessed using the heterogeneity-to-monogeneity ratio (HTMT) [52]. The results showed that the HTMT value between symbolic behavioral motivation and the intention to continue green consumption was 0.853, with a 90% bootstrap confidence interval of [0.78, 0.92], which is below the lenient threshold of 0.90. Based on the above evidence, although the two constructs are highly correlated (which is consistent with theoretical expectations that symbolic motivation itself is a key driver of green consumption), they can still be empirically regarded as distinct, independent constructs. Therefore, analyses using symbolic behavioral motivation as a mediating variable have a sound measurement basis.
Specifically, in the Fornell–Larcker criteria [51], the square roots of the AVE for the two constructs were 0.820 (SBM) and 0.830 (GCCI), respectively; the difference between these values and the interconstruct correlation (r = 0.800) was only 0.02–0.03, which is far below the typically recommended ideal gap (e.g., >0.10–0.15). At the same time, the upper limit of the 90% confidence interval for the HTMT ratio is 0.92, exceeding the strict threshold of 0.85 [52].
This limitation may stem from the intrinsic conceptual link between the two constructs: symbolic behavior motivation is itself one of the core psychological mechanisms driving the sustained intention to engage in green consumption [19,20], and the two constructs naturally overlap theoretically in terms of content. In other words, the high correlation is not entirely due to measurement flaws but has theoretical validity. However, insufficient discriminant validity at the measurement level may indeed have some impact on the estimation of the mediating effect. Therefore, this methodological limitation should be fully considered when interpreting the mediating effects reported in this study.
4.3.10. Test of the Moderated Mediation Effect
To test the “tool–motivation–context” framework developed in this study as a whole, we used Hayes’s (2022) PROCESS macro (Model 14) [50] to test a moderated mediation model. Bootstrap sampling was set to 5000 repetitions to calculate the 95% confidence interval for the indirect effect.
The results indicate (see Table 15) that the moderated mediation index is significant (Index = 0.0186, Boot SE = 0.0065, 95% CI [0.0049, 0.0307]), suggesting that group context significantly moderates the mediating effect of symbolic motivation.
Table 15.
Results of the moderated mediation analysis (PROCESS Model 14).
Analysis of conditional indirect effects (see Table 15) revealed that in the out-group context, the indirect effect of symbolic motivation was 0.1664 (95% CI [0.0914, 0.2605]); at the mean level, it was 0.2224 (95% CI [0.1547, 0.2978]); and increased to 0.2597 (95% CI [0.1877, 0.3325]) in the in-group context. As the group context shifted from out-group to in-group, the mediating effect of symbolic motivation showed a gradual increase.
These results confirm that group context significantly moderates the mediating role of symbolic motivation between quantified self orientation and sustained intention to engage in green consumption—the in-group context amplifies this indirect effect, while the out-group context weakens it. Thus, the integrated “tool–motivation–context” framework proposed in this study has received comprehensive empirical support.
5. Conclusions and Discussion
5.1. Main Findings
First, the competitive quantified self significantly increased green consumption continuance intention. The statistical analysis of Experiment 1 (N = 120) showed that the competitive group’s continuance intention (M = 4.46, SD = 0.36) was significantly higher than that of the non-competitive group (M = 2.81, SD = 1.08); an independent samples t-test indicated a significant difference between the two groups (t(118) = 11.22, p < 0.001), and the behavioral intensity dimension showed a consistent result, supporting H1. This indicates that when individuals use competitive quantified tools with comparison, ranking, and goal attainment functions, their intention to sustain green consumption and their self-rated behavioral investment are both significantly higher than those of individuals facing a non-competitive self-tracking format. The competitive design mobilizes social comparison motivation and the achievement need, transforming one-off external incentives into more durable behavioral momentum. One consequence is that prosocial behavior is sustained longer—providing empirical evidence for using gamification to support long-term prosocial behavior. What is measured here is behavioral intention and intention intensity rather than actual purchases or emission reduction records; unless otherwise specified, “green consumption behavior” below refers to self-reported behavioral intention.
Second, symbolic behavioral motivation served a significant but limited partial mediating role between quantified self orientation and green consumption intention. The bootstrap test in Experiment 1 showed an indirect effect of 0.148 (95% CI [0.047, 0.254]), accounting for 28.85% of the total effect, and a direct effect of 0.365 (95% CI [0.225, 0.504]), accounting for 71.15% of the total effect, supporting H2. In Experiment 2, this mediation effect fell to about 16.7% of the total effect, suggesting that although symbolic motivation has explanatory power, it is not the only pathway through which the quantified self influences green consumption. The symbolic motivation here emphasizes the outward expression function of behavior. The study found that when consumers internalize green consumption as an expression of self-identity (e.g., environmentalist, responsible citizen) and social image (e.g., fashionable, tasteful), they are more likely to integrate such behavior into daily life in a stable, long-term manner. This points to a deeper driver beyond utilitarian considerations such as saving money or health: consumers sustain green consumption not only for economic benefit or social norms but also because it satisfies the need for identity and self-expression. The research focus of green consumption motivation thus shifts from “whether it pays off” to “expressing who I am.” However, behavioral intensity is likewise a self-reported intention, and whether this relationship translates into observable behavioral frequency awaits testing with objective behavioral indicators.
Third, the relationship between in-group and out-group identity moderates the association between symbolic motivation and green consumption behavior. The moderation analysis for Experiment 2 (N = 240) revealed a significant interaction effect between quantified self orientation and group context on the intention to continue green consumption, F(1, 236) = 6.72, p = 0.01. More importantly, the moderated mediation analysis (PROCESS Model 14) further indicated that the moderated mediation index was significant (Index = 0.0186, 95% CI [0.0049, 0.0307]), and the indirect effect of symbolic motivation was significantly stronger in the in-group context (Effect = 0.2597) than in the out-group context (Effect = 0.1664). This suggests that group context not only directly moderates the relationship between quantified self orientation and consumption willingness but also further moderates the entire indirect path: “quantified self orientation → symbolic motivation → willingness to continue green consumption.”
5.2. Theoretical Contributions
The theoretical contributions of this study are mainly threefold, and together they constitute an integrated “instrument–motivation–context” explanatory framework. First, it brings the quantified self from self-oriented uses such as health and efficiency into the prosocial setting of green consumption. Previous research has mostly focused on the self-management function of the quantified self [12,13], with little systematic examination of whether and how it can drive prosocial behavior. This study identifies the “social” dimension of quantified self design—competitiveness—as a key factor driving sustained prosocial behavior, showing that the quantified self is not merely a self-tracking tool but can also serve as a behavioral intervention means embedded in social comparison and incentive structures. This finding aligns with the “social incentives” dimension of the SHIFT framework proposed by White et al. [15]: when sustainable behavior is endowed with social comparison and identity display functions, its persistence increases accordingly, which also answers Feng et al.’s [13] call to extend the boundaries of quantified self research. Second, it clarifies the core mediating mechanism of symbolic behavioral motivation between the quantified self and green consumption intention, enriching the motivational spectrum of green consumption. Traditional research has relied mostly on cognitive paradigms such as the theory of reasoned action and the theory of planned behavior [3,5], which struggle to fully explain why consumers are willing to bear the extra costs of green consumption over the long term. Adopting an identity perspective, this study advances the explanation from the rational level of “weighing costs and benefits” to the meaning construction level of “expressing the self,” responding to Griskevicius et al.’s [14] conjecture about the context-dependence of status motives and converging with Chen et al.’s [16] finding on the mediating role of symbolic benefits. Third, it introduces group context as a boundary condition, refining the existing “public/private” dichotomy into an “in-group/out-group” mechanism. This study links individual-level motivation with social-level relationships: green consumption is not only the outward expression of personal values but also a process of seeking recognition within concrete social relationships. This brings social identity theory [33] into the explanation of consumption behavior and provides a contextualized perspective for understanding the “gamification–motivation–behavior” pathway. This study conducted a comprehensive test of the aforementioned integrated framework using moderated mediation analysis (PROCESS Model 14), confirming the validity of the complete “tool–motivation–context” pathway and providing a contextualized perspective for understanding the “gamification–motivation–behavior” causal pathway.
5.3. Managerial Implications
The findings offer useful guidance for firms and governments seeking to promote green consumption. At the level of technological tool design, gamification and sociality should be combined. Building on the “self-tracking” functions of green consumption applications such as carbon footprint tracking and second-hand trading, firms and developers can introduce competitive social elements—for example, setting up real-time “green contribution” leaderboards at the individual, friend, and community levels, designing phased challenge tasks and virtual achievement badges, and enabling users to share their results to social networks conveniently. Such designs make abstract environmental contributions visible and comparable, leveraging social comparison and achievement motivation to enhance user engagement stickiness and behavioral continuance intention. In marketing and public communication, the focus should shift from “publicizing how green a product is” to “helping consumers build an identity.” Marketers and policy advocates should go beyond simply promoting the environmental attributes of products and work to connect green consumption behavior with positive identity symbols such as “smart,” “responsible,” and “fashionable,” shaping ideal identity prototypes such as the “green lifestyle expert” through brand narratives and collaboration with opinion leaders. Communication strategies also need refinement: for the in-group that already possesses environmental awareness, use specialized discourse that strengthens circle identity; for the broader public, start from universal values such as health, economy, and family care, gradually cultivating a sense of identification and turning “outsiders” into “insiders.” For organizational and community management, the key is to create a supportive in-group context. When firms implement green offices or sustainable procurement, they cannot rely on rules and regulations alone but must cultivate a corresponding organizational culture: management should lead by example, publicly commend best-practice teams or individuals, and integrate environmental goals into the team honor system through departmental energy-saving competitions; consumer-facing brands need to carefully operate user communities, encouraging members to recognize one another so that the community continually reinforces members’ environmental identity. The specific form of the in-group also varies by culture: in the West, voluntary initiatives such as the United States’ “Energy Star” and the United Kingdom’s “Carbon Trust” often evolve gradually into institutionalized standards; in East Asia, programs such as Alipay’s “Ant Forest” rely more on existing social relationships such as friends, family, and colleagues to form informal communities; both are effective in their own way at sustaining the motivation for green behavior.
5.4. Limitations and Future Research
At least three aspects of this study require caution, and they also point to work that can be done next. First, the representativeness of the sample is limited. This limitation directly affects the external validity of this study. The data collection for this study primarily focused on urban users and students who are familiar with digital technology; this group exhibits certain generalizability in terms of age, educational background, and socioeconomic status. The impact of these sample characteristics on the generalizability of the study’s conclusions may manifest in two ways: First, this group is more sensitive to and familiar with gamification mechanisms such as digital rankings and competitive feedback, which may have amplified the main effect of the competitive quantified self observed in this study—for older groups or those unfamiliar with digital platforms, competitive quantification designs may not produce the same strong behavioral drive, and may even trigger anxiety or avoidance reactions. Second, this group may already possess a higher baseline level of environmental awareness (a self-selection effect in environmental research), which could lead to an overestimation of the baseline value for green consumption intentions, thereby affecting the generalizability of the strength of relationships between variables. Therefore, whether the findings of this study can be generalized to older populations, groups with lower educational levels, and societies with different cultural backgrounds remains to be further verified. Future research should employ broader, more diverse samples for replication and validation, and conduct cross-cultural comparisons to examine how values such as individualism and collectivism influence the effects of competitive mechanisms and symbolic motivation. Another concern relates to the measurement method. This study relies entirely on self-reports to measure consumption intentions; although self-report methods are commonly used in research on behavioral intentions, their inherent limitations cannot be overlooked. First, self-reporting makes it difficult to distinguish between “genuine intentions” stemming from internal environmental beliefs and “strategic expressions” motivated by the desire to maintain symbolic status or gain social approval. The measured intentions may be mixed with idealized self-projections, and there may be a discrepancy between the “sustained intentions” expressed by participants in the questionnaire and their actual purchasing decisions and consumption behaviors in real life. Second, measuring both mediating variables and dependent variables simultaneously within the same questionnaire may introduce common method bias, artificially inflating the relationship between variables. Although the experimental design of this study (situational priming + random assignment) mitigates the threat of common method bias to causal inference to some extent, the aforementioned risks cannot be ignored. Therefore, the conclusions of this study regarding “green consumption behavior” should be understood as findings at the level of “willingness to engage in green consumption behavior,” and caution should be exercised when generalizing these findings to actual behavior. Future research could incorporate the Implicit Association Test (IAT) to capture authentic, non-self-reported attitudes; employ behavioral or field experiments to observe actual purchasing behavior; and utilize longitudinal designs to track the dynamic process of behavioral change, thereby more comprehensively testing the effects revealed in this study. Furthermore, discriminant validity tests revealed that while the two constructs in this study—motivation for symbolic behavior and sustained intention to engage in green consumption—are distinguishable, both the Fornell–Larcker criterion (a gap of only 0.02–0.03 between √AVE and the interconstruct correlation) and the HTMT ratio (with a 90% CI upper limit of 0.92) were “marginally passing,” indicating a high proportion of variance shared between the two constructs. This suggests that the self-report scales currently used may not sufficiently distinguish between the concepts of “consumption driven by symbolic motivation” and “sustained intention to engage in green consumption” at the measurement level. Therefore, while the mediating effects reported in this study are statistically significant, their effect sizes may be somewhat inflated; readers should exercise caution when interpreting these findings. There is also a limitation at the level of analytic strategy: this study estimated mediation and moderation separately and did not test, with a unified moderated mediation model, how the indirect path varies with group context; “instrument–motivation–context” thus remains a theoretically coherent framework that still awaits holistic verification. Subsequent research could manipulate the independent variable and the moderator simultaneously within the same between-subjects design, use conditional process analysis for a more direct test, and replace the in-group/out-group dichotomy with a continuous variable to measure perceived group-norm strength and identity salience. In addition, attention should be paid to the potential long-term side effects of competitive quantified design—such as user anxiety, burnout, data falsification, and even behavioral rebound after the competitive mechanism is removed—so as to provide a basis for designing responsible and sustainable intervention tools.
Author Contributions
Conceptualization, H.L.; methodology, H.L.; software, P.T.; validation, Y.Z. and H.L.; formal analysis, Y.Z.; investigation, H.Z. and Y.Z.; resources, H.Z.; data curation, Y.Z.; writing—original draft preparation, Y.Z.; writing—review and editing, H.Z. and P.T.; visualization, P.T.; supervision, H.Z.; project administration, H.L.; funding acquisition, H.L. and H.Z. All authors have read and agreed to the published version of the manuscript.
Funding
This research was funded by the National Natural Science Foundation of China (grant number 72102092); Jiangxi Province Education Science Planning Project (grant number 23QN010, 2025GYB099); Jiangxi University Party Construction Research Project (grant number 22DJQN005); and Jiangxi Normal University Innovation Fund Project(grant number YJS2025033).
Institutional Review Board Statement
The study was conducted in accordance with the Declaration of Helsinki, and approved by the Ethics Committee of School of Economics and Management, Jiangxi Normal University (protocol code IRB-JXNU-B-20251101 and 1 November 2025 of approval).
Informed Consent Statement
Informed consent was obtained from all subjects involved in the study.
Data Availability Statement
The raw data supporting the conclusions of this article will be made available by the authors on request.
Acknowledgments
The authors wish to acknowledge the contributions and support of those universities that provide experimental sites, facilities and other support for this study.
Conflicts of Interest
The authors declare no conflicts of interest. The funders had no role in the design of the study; in the collection, analyses, or interpretation of data; in the writing of the manuscript; or in the decision to publish the results.
References
- Du, S.H.; Xu, J.H.; Zhang, D.P.; Yang, X.G. How gamification drives e-commerce users’ green consumption behavior: An online ethnography study of Ant Forest. Nankai Bus. Rev. 2022, 25, 191–202. [Google Scholar] [CrossRef]
- Mou, Y.P.; Cao, Y.J.; Zhang, H. The impact of gamification design of platform enterprises on users’ continuous usage behavior. Chin. J. Manag. 2023, 20, 1827–1836. [Google Scholar]
- Johnstone, M.; Tan, L.P. An exploration of environmentally-conscious consumers and the reasons why they do not buy green products. Mark. Intell. Plan. 2015, 33, 804–825. [Google Scholar] [CrossRef] [Scilit]
- Lavan, N.; Kennedy, F.B. Green purchase intention on consumer decision making towards green products. Asian J. Econ. Bus. Account. 2017, 5, 1–7. [Google Scholar] [CrossRef] [Scilit]
- Cui, B.J.; Mei, Y. The influence mechanism of consumer self-concept on green product purchase intention: The mediating effect of face consciousness. J. Henan Norm. Univ. (Philos. Soc. Sci. Ed.) 2021, 48, 52–59. [Google Scholar] [CrossRef]
- Carrete, L.; Castaño, R.; Felix, R.; Centeno, E.; González, E. Green consumer behavior in an emerging economy: Confusion, credibility, and compatibility. J. Consum. Mark. 2012, 29, 470–481. [Google Scholar] [CrossRef] [Scilit]
- Gao, J.; Zhang, R. Interruption and continuation: A study on the influence mechanism of quantified self construction on green lifestyle transformation. Collect. Essays Financ. Econ. 2022, 11, 92–101. [Google Scholar] [CrossRef]
- De Moya, J.F.; Pallud, J. From panopticon to heautopticon: A new form of surveillance introduced by quantified-self practices. Inf. Syst. J. 2020, 30, 940–976. [Google Scholar] [CrossRef] [Scilit]
- Du, H.S.; Ke, X.B.; Wagner, C. Inducing individuals to engage in a gamified platform for environmental conservation. Ind. Manag. Data Syst. 2020, 120, 692–713. [Google Scholar] [CrossRef] [Scilit]
- Zhang, J.M.; Qin, W.J. The double-edged sword effect of green consumption behavior on prosocial behavior: Mediating mechanisms based on moral self-identity and psychological entitlement. Econ. Manag. Rev. 2024, 40, 112–122. [Google Scholar] [CrossRef]
- Wu, B.; Li, D.J.; Wang, C.Y. Green or hedonistic? The effect of engaging in environmental protection activities on consumer behavior. Acta Psychol. Sin. 2016, 48, 1574–1588. [Google Scholar] [CrossRef] [Scilit]
- Swan, M. The quantified self: Fundamental disruption in big data science and biological discovery. Big Data 2013, 1, 85–99. [Google Scholar] [CrossRef] [Scilit] [PubMed]
- Feng, S.; Mäntymäki, M.; Dhir, A.; Salmela, H. How self-tracking and the quantified self promote health and well-being: Systematic review. J. Med. Internet Res. 2021, 23, e25171. [Google Scholar] [CrossRef] [Scilit] [PubMed]
- Griskevicius, V.; Tybur, J.M.; Van den Bergh, B. Going green to be seen: Status, reputation, and conspicuous conservation. J. Personal. Soc. Psychol. 2010, 98, 392–404. [Google Scholar] [CrossRef] [Scilit] [PubMed]
- White, K.; Habib, R.; Hardisty, D.J. How to SHIFT consumer behaviors to be more sustainable: A literature review and guiding framework. J. Mark. 2019, 83, 22–49. [Google Scholar] [CrossRef] [Scilit]
- Chen, K.; Mei, J.; Sun, W. The impact of egoistic motivations on green purchasing behavior: The mediating roles of symbolic and functional benefits in China. Sustainability 2025, 17, 5180. [Google Scholar] [CrossRef] [Scilit]
- Taylor, S.E.; Neter, E.; Wayment, H.A. Self-evaluation processes. Personal. Soc. Psychol. Bull. 1995, 21, 1278–1287. [Google Scholar] [CrossRef] [Scilit]
- Cohen, J.E. The regulatory state in the information age. Theor. Inq. Law 2016, 17, 369–414. [Google Scholar] [CrossRef] [Scilit]
- Li, D.J.; Zhang, Y.D. Why consumers give up: The internal mechanism of continuous participation intention formation in quantified self. Nankai Bus. Rev. 2018, 21, 118–131. [Google Scholar]
- Peattie, K. Green consumption: Behavior and norms. Annu. Rev. Environ. Resour. 2010, 35, 195–228. [Google Scholar] [CrossRef] [Scilit]
- Joshi, Y.; Rahman, Z. Factors affecting green purchase behavior and future research directions. Int. Strateg. Manag. Rev. 2015, 3, 128–143. [Google Scholar] [CrossRef] [Scilit]
- Liu, D.S. On symbolic behavior in sports consumption. J. Shanghai Univ. Sport 2014, 38, 37–42. [Google Scholar] [CrossRef]
- Li, J.; Peng, L.; Wei, C.; Ma, P. The impact of comparative quantitative feedback on usage intention of self-improvement applications. J. Manag. Sci. 2024, 37, 16–27. [Google Scholar]
- Rooksby, J.; Rost, M.; Morrison, A.; Chalmers, M. Personal tracking as lived informatics. In Proceedings of the SIGCHI Conference on Human Factors in Computing Systems, Toronto, ON, Canada, 26 April–1 May 2014; ACM: New York, NY, USA, 2014; pp. 1163–1172. [Google Scholar] [CrossRef] [Scilit]
- Wang, W.J. Data calculation, dynamic optimization, quantified self: On the alienated forms of dataized labor and its transcendence possibilities. Stud. Dialectics Nat. 2022, 38, 116–122. [Google Scholar] [CrossRef]
- Crossley, M.; Dai, Z.H.; Liu, B.C. Focusing on social, environmental and epistemic justice: Priority issues in international and comparative education research. Comp. Educ. Rev. 2025, 47, 17–29. [Google Scholar] [CrossRef]
- Kong, D.; Zhu, Y.X. The impact of community interaction on continuous participation intention of quantified self users: The moderating role of health literacy. J. Xinyang Norm. Univ. (Philos. Soc. Sci. Ed.) 2026, 46, 1–11. [Google Scholar] [CrossRef]
- Wang, N.; Cheng, C. A study on factors influencing users’ continuous feedback behavior based on grounded theory. Inf. Sci. 2021, 39, 47–52. [Google Scholar] [CrossRef]
- Zhu, X.; Sun, X.X. Analysis of Chinese consumers’ green consumption motivation sources: Functional needs or symbolic needs? Enterp. Econ. 2015, 12, 68–75. [Google Scholar] [CrossRef]
- Mudiyappan, C.; Antonyinico, I.; Huang, M.H. The role of social aspiration and identity congruence in driving anti-green consumption: Evidence from India. Int. Rev. Public Nonprofit Mark. 2025, 22, 693–711. [Google Scholar] [CrossRef] [Scilit]
- Liu, F.F. Symbolic play and symbols in play (Part I): Related concepts, forms of expression and their value. Presch. Educ. 2023, 21, 4–7. [Google Scholar]
- Minson, J.A.; Monin, B. Do-gooder derogation: Disparaging morally motivated minorities to defuse anticipated reproach. Soc. Psychol. Personal. Sci. 2012, 3, 200–207. [Google Scholar] [CrossRef] [Scilit]
- Tajfel, H.; Turner, J.C. An integrative theory of intergroup conflict. In The Social Psychology of Intergroup Relations; Austin, W.G., Worchel, S., Eds.; Brooks/Cole: Boston, MA, USA, 1979; pp. 33–47. [Google Scholar]
- Brewer, M.B. The psychology of prejudice: Ingroup love or outgroup hate? J. Soc. Issues 1999, 55, 429–444. [Google Scholar] [CrossRef] [Scilit]
- Zhang, X.B.; Li, X.L.; Ma, Z.Y.; Dai Luyao, S.H.I.; Zuo, B. “We are big, you are small”: The connection between ingroup/outgroup and size-space. Acta Psychol. Sin. 2025, 57, 1638–1648. [Google Scholar]
- Ameen, N.; Cheah, J.H.; Kumar, S. It’s all part of the customer journey: The impact of augmented reality, chatbots, and social media on the body image and self-esteem of Generation Z female consumers. Psychol. Mark. 2022, 39, 2110–2129. [Google Scholar] [CrossRef] [Scilit]
- Chen, G.H.; Sun, H.Y.; Ding, W.; Du, X.M.; Ye, T.; Zhao, W.G. The differential effects of social exclusion on cooperative behavior from the perspective of in-group/out-group dichotomy. Psychol. Sci. 2025, 48, 640–650. [Google Scholar] [CrossRef]
- Yalan, Q.; Fangfang, W.; Bin, Z.; Wenlin, K.; Shijie, S.; Jing, W. Dependence or separation: The relationship between in-group favoritism and out-group derogation. Psychol. Sci. 2024, 47, 450–457. [Google Scholar] [CrossRef]
- You, N. Spatio-Temporal Dynamics and Driving Factors of per Capita Energy Consumption Carbon Emissions in the Central Yunnan Urban Agglomeration. Master’s Thesis, Kunming University of Science and Technology, Kunming, China, 2024. [Google Scholar] [CrossRef]
- Faul, F.; Erdfelder, E.; Lang, A.G.; Buchner, A. G*Power 3: A flexible statistical power analysis program for the social, behavioral, and biomedical sciences. Behav. Res. Methods 2007, 39, 175–191. [Google Scholar] [CrossRef] [Scilit] [PubMed]
- Zhao, H.; Furuoka, F. Linking social capital to green purchasing intentions in livestreaming sessions: The moderating role of perceived visible heterogeneity. Humanit. Soc. Sci. Commun. 2025, 12, 492. [Google Scholar] [CrossRef] [Scilit]
- Olya, H.; Akhshik, A. Tackling the complexity of the pro-environmental behavior intentions of visitors to turtle sites. J. Travel Res. 2019, 58, 313–332. [Google Scholar] [CrossRef] [Scilit]
- Stern, P.C.; Dietz, T.; Abel, T.; Guagnano, G.A.; Kalof, L. A value-belief-norm theory of support for social movements: The case of environmentalism. Hum. Ecol. Rev. 1999, 6, 81–97. [Google Scholar]
- Podsakoff, P.M.; MacKenzie, S.B.; Lee, J.Y.; Podsakoff, N.P. Common method biases in behavioral research: A critical review of the literature and recommended remedies. J. Appl. Psychol. 2003, 88, 879–903. [Google Scholar] [CrossRef] [Scilit] [PubMed]
- Lindell, M.K.; Whitney, D.J. Accounting for common method variance in cross-sectional research designs. J. Appl. Psychol. 2001, 86, 114–121. [Google Scholar] [CrossRef] [Scilit] [PubMed]
- Kline, R.B. Principles and Practice of Structural Equation Modeling, 3rd ed.; Guilford Press: New York, NY, USA, 2011. [Google Scholar]
- Siemsen, E.; Roth, A.; Oliveira, P. Common method bias in regression models with linear, quadratic, and interaction effects. Organ. Res. Methods 2010, 13, 456–476. [Google Scholar] [CrossRef] [Scilit]
- Evans, M.G. A Monte Carlo study of the effects of correlated method variance in moderated multiple regression analysis. Organ. Behav. Hum. Decis. Process. 1985, 36, 305–323. [Google Scholar] [CrossRef] [Scilit]
- Aron, A.; Aron, E.N.; Smollan, D. Inclusion of Other in the Self Scale and the structure of interpersonal closeness. J. Pers. Soc. Psychol. 1992, 63, 596–612. [Google Scholar] [CrossRef]
- Hayes, A.F. Introduction to Mediation, Moderation, and Conditional Process Analysis: A Regression-Based Approach, 3rd ed.; The Guilford Press: New York, NY, USA, 2022. [Google Scholar]
- Fornell, C.; Larcker, D.F. Evaluating structural equation models with unobservable variables and measurement error. J. Mark. Res. 1981, 18, 39–50. [Google Scholar] [CrossRef] [Scilit]
- Henseler, J.; Ringle, C.M.; Sarstedt, M. A new criterion for assessing discriminant validity in variance-based structural equation modeling. J. Acad. Mark. Sci. 2015, 43, 115–135. [Google Scholar] [CrossRef] [Scilit]
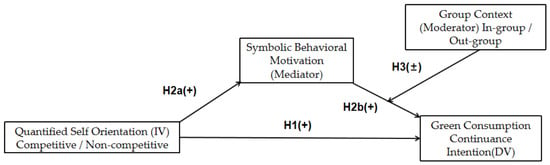
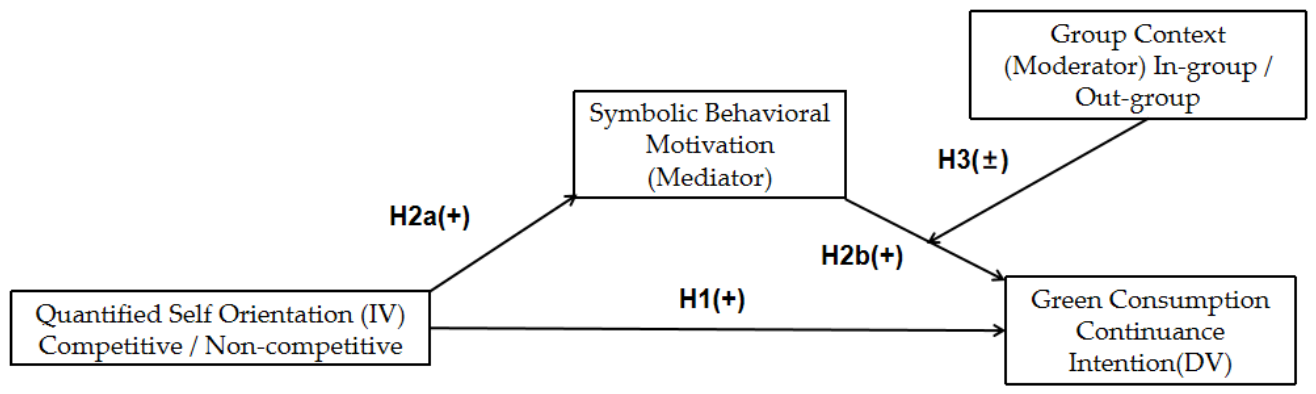
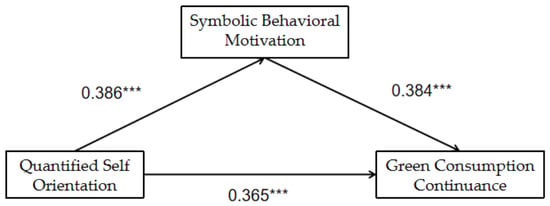
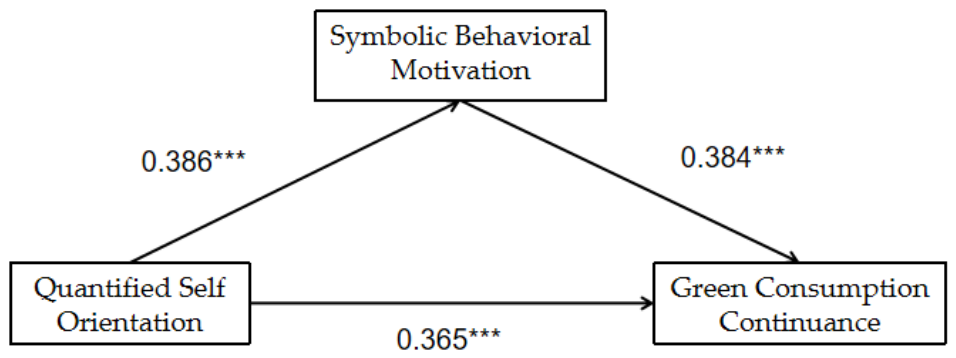
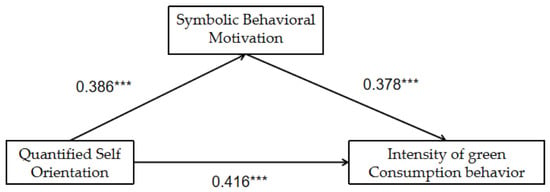
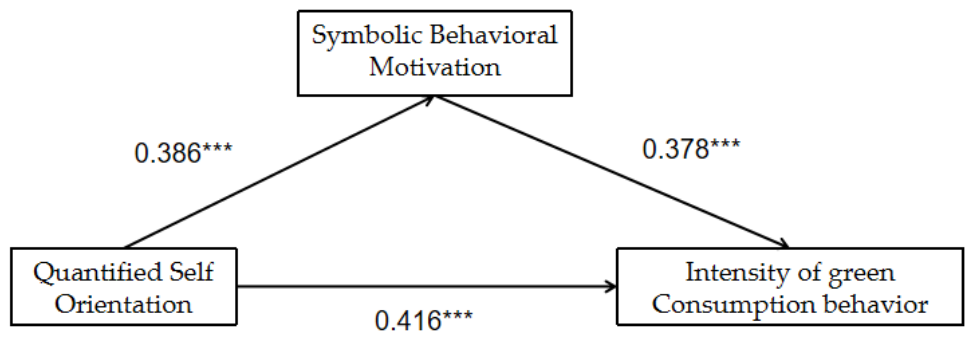

Disclaimer/Publisher’s Note: The statements, opinions and data contained in all publications are solely those of the individual author(s) and contributor(s) and not of MDPI and/or the editor(s). MDPI and/or the editor(s) disclaim responsibility for any injury to people or property resulting from any ideas, methods, instructions or products referred to in the content. |
© 2026 by the authors. Licensee MDPI, Basel, Switzerland. This article is an open access article distributed under the terms and conditions of the Creative Commons Attribution (CC BY) license.