


Abstract
This study examines how EU EMAS-registered organizations prioritize environmental goals, monitor environmental indicators, and report achievement outcomes. Based on a Computer-Assisted Web Interview survey of 297 organizations from different sectors and countries, the analysis focuses on self-reported goal achievement rather than objectively verified environmental performance. Nearly all surveyed organizations reported having set environmental goals (98.7%), with energy reduction and regulatory compliance among the most frequently prioritized areas. In this sample, higher self-reported goal achievement was correlated with higher perceived importance of environmental goals. The association between the perceived importance of monitoring and self-reported achievement was less consistent and varied by environmental aspect. The findings suggest that EMAS organizations use structured goal-setting and monitoring practices, but reported achievement levels vary by sector, country, and organizational priorities. Given the cross-sectional and self-reported nature of the data, the results should be interpreted as associative rather than causal. No claims of directional or causal effects are made.
1. Introduction
In recent years, the increasing awareness and urgency of ensuring environmental sustainability have driven organizations worldwide to integrate environmental goals into their strategic agendas. This shift is a response to regulatory pressures enforced in recognition of the profound impact that corporate practices have on the environment and society [1,2]. This topic is of paramount importance: environmental sustainability is crucial for mitigating climate change, preserving biodiversity, and ensuring the long-term viability of natural resources. Organizations that proactively address environmental concerns are not only contributing to global sustainability efforts but also enhancing their reputations, achieving cost savings, and fostering innovation.
The intersection of environmental goals with organizational strategies raises several pertinent questions about how these goals are prioritized, assessed, and achieved. Describing these dynamics provides descriptive evidence that may inform discussions on environmental policies and practices, without implying causality. This study aims to provide a systematic analysis of these aspects by examining responses from a survey conducted across EU EMAS-registered organizations, focusing on the following key research questions:
- What environmental goals are most important for organizations, and to what extent do organizations achieve them?
- What indicators do organizations use to monitor environmental performance, and how does their prioritization relate to self-reported achievement outcomes?
- How are factors such as sector and country associated with variation in these dynamics?
By exploring these questions, the following hypotheses will be evaluated:
Hypothesis 1 (associative).
The importance placed on environmental goals is positively correlated with their self-reported achievement rate.
Hypothesis 2 (associative).
The emphasis placed on monitoring environmental indicators is positively correlated with self-reported environmental goal achievement.
In doing so, this study aims to provide a detailed and nuanced understanding of how EMAS-registered organizations prioritize environmental goals and assess self-reported achievement outcomes. The findings offer descriptive insights into goal-setting, monitoring practices, and reported achievement patterns. These insights may serve as a descriptive basis for further hypothesis generation, not for direct policy prescription.
This study contributes to the literature by providing one of the first cross-national and sector-comparative analyses on how EMAS-registered organizations prioritize environmental goals and link them to monitoring practices and reported achievement outcomes. Unlike previous studies focusing on specific countries or sectors, this research integrates data from nearly 300 organizations across the EU, providing unique insights into how perceived strategic importance is associated with reported outcomes. No causal interpretation of these associations is intended or claimed.
2. Literature Review
Voluntary environmental management programs for organizations, such as ISO 14001 or the Eco-Management and Audit Scheme (EMAS), are popular environmental policy instruments. Among these, EMAS stands out for its stringent requirements, while encouraging eco-efficiency by reducing energy and material consumption and waste production [3]. As of March 2025, 4184 organizations and 17,193 sites were EMAS-registered, with Germany, Italy, and Spain leading in numbers [4]. Those organizations have 2,526,694 employees in total, which is approximately 1.25% of the total EU workforce.
EMAS mandates organizations to publish environmental statements detailing significant environmental aspects, goals, legal compliance, and performance indicators on emissions, waste generation, water, energy, and resource consumption, and biodiversity in their annually approved environmental statements. Although these indicators are defined in the EMAS Regulation and validated by an accredited EMAS verifier, comparing organizations’ performance remains challenging.
Although EMAS environmental statements are publicly available, their direct use for quantitative cross-national and cross-sector analysis is limited. Differences in indicator selection, system boundaries, reference periods, and reporting practices substantially constrain comparability. For this reason, this study uses a standardized questionnaire to describe organizational priorities, monitoring practices, and self-reported achievement levels consistently across countries and sectors. This approach allows for comparative analysis, while acknowledging the limitations associated with self-reported data.
A recent study based on the same broader EU survey dataset compared EMAS-registered and non-EMAS organizations and identified differences in the structure of environmental goal-setting and monitoring priorities, with EMAS organizations displaying a more operational and indicator-oriented profile [5]. The present study takes a narrower and different analytical focus. Rather than comparing EMAS and non-EMAS organizations, it examines only the EMAS subsample and investigates how perceived goal importance and monitoring importance co-occur with self-reported achievement outcomes within EMAS-registered organizations.
The increasing role of European Sustainability Reporting Standards (ESRS) further underscores the relevance of structured goal-setting and monitoring within organizational environmental management systems. The regulatory environment around the ESRS has continued to evolve in 2025–2026, including the EU Omnibus simplification package, the “stop-the-clock” adjustments, and the publication of revised ESRS delegated acts [6]. These developments point toward a more focused and streamlined reporting architecture, while maintaining the relevance of structured, decision-useful environmental data [6,7]. Consequently, exploring how organizations select and track environmental targets offers essential real-world insights into how streamlined disclosure frameworks operate in practice.
At the same time, the recent literature on environmental performance indicators and sustainability reporting highlights a persistent tension between the growing demand for comparable environmental data and the risks of indicator overload, inconsistent methodological boundaries, and limited cross-organizational comparability [8,9,10].
Despite the importance of environmental management systems in the environmental policy agenda, their effectiveness in reducing pollution, including greenhouse gas emissions, remains debated [11,12,13,14]. Previous research has primarily focused on the environmental effects of EMAS in specific countries, such as Spain [15], Italy [16,17,18,19,20], Germany [21], Slovakia [22,23], Poland [24,25], and Lithuania [26].
Researchers showed that EMAS organizations often outperform sectoral references, while noting issues with budget allocation for improvement [16,27]. Others [20] highlighted significant environmental benefits both in the short and long term in energy-intensive industries. Research on Polish organizations indicated that EMAS becomes more effective as it matures, influencing environmental awareness, management commitment, the use of Sectoral Reference Documents (SRDs), Best Environmental Management Practices (BEMPs), and environmental performance indicators [24]. A review on EMAS registration motivations and environmental performance revealed diverse driving factors and mixed results, though most studies underline the positive impact of EMAS adoption [11]. Another review examining 53 studies covering 182,926 companies indicated a positive influence of ISO 14001 and EMAS certifications on corporate environmental performance, with a stronger effect for firms focusing on environmental innovation and with mature certifications [28]. Other studies also observed that adopting an EMS reduces air emissions [27,29], improves corporate sustainability [30], and enhances legal compliance [31,32].
However, some researchers found no evidence of reduced air emissions, increased environmental investments, or greater use of renewable energy by certified organizations [21,33,34]. In the energy sector, Comoglio et al. [35] identified gaps in environmental reporting among EMAS-registered hydropower companies, emphasizing the need for specific guidelines. This raises concerns about the future ability of businesses to apply the new reporting requirements effectively, as the European Commission proposed to remove the Commission’s power to adopt sector-specific ESRS. In this context, EMAS-registered companies, already benefiting from BEMPs and SRDs, may have a significant advantage in preparing for ESRS compliance. Similarly, Italian thermal power plants lacked comprehensive reporting on biodiversity and local issues while showing deficiencies in indicator selection and aligning budget allocation with relevant environmental impacts [36]. These localized, corporate-level indicator discrepancies parallel wider systemic challenges found in macro-level policy monitoring. At the policy-monitoring level, Matukhno et al. [37] evaluate the effectiveness of sustainability and climate policies across different frameworks remains highly complex due to misaligned indicator designs, varying scopes, and disparate scoring logics. Although their analysis concerns national policy effectiveness rather than organizational EMAS practices, it reinforces the need for rigorous, indicator-based sustainability assessments to reconcile internal corporate disclosures with broader national climate goals [37]. Research assessing environmental statements from the Spanish, Portuguese, and Italian hotel industries found poor use of best practices and performance benchmarks among certified organizations, questioning the notion that EMAS signals environmentally best-in-class or frontrunner behavior [15].
Analyses of companies’ justifications for the lack of improvement suggest a symbolic adoption of the certification, meeting only the minimum requirements [38]. These findings question the prevailing opinion about the positive impact of voluntary environmental management standards on sustainability, with implications for managers, policymakers, and stakeholders [15,16].
Existing studies provide valuable insights into the effectiveness of EMAS in EU countries, yet they do not fully clarify how organizations prioritize, monitor, and report the achievement of environmental goals. Research remains limited on how EMAS-registered organizations link environmental priorities, performance indicators, and reported achievement outcomes across different sectors and countries. Addressing these gaps, this study describes how organizations in the sample set and monitor environmental objectives, documents correlates of self-reported success, and discusses descriptive patterns that may be relevant for environmental policy and management pending further causal research.
While existing studies demonstrate varied effectiveness of EMAS, little is known about how organizations simultaneously prioritize environmental objectives and measure success through indicators. This study addresses this gap by examining the relationships between goal importance, indicator monitoring, and self-reported achievement in a diverse, multi-sectoral EU sample.
Within environmental management systems such as EMAS, environmental goals and monitoring activities serve as internal management instruments. The importance attributed to specific goals reflects organizational priorities, while monitoring provides feedback on implementation and progress. Prior research indicates that these mechanisms can support coordination, learning, and internal control; however, their translation into measurable improvements depends on organizational context and follow-up actions. Accordingly, the relationships between goal importance, monitoring, and reported achievement outcomes examined in this study should be interpreted as associative rather than strictly causal.
3. Methodology
3.1. Data Collection
The study, conducted in 2023, targeted organizations registered in the European Eco-Management and Audit Scheme (EMAS) within the European Union. The sample size was calculated based on the total EMAS population (N = 3951), with a 95% confidence level and a 5% maximum error, setting the minimum sample at n = 250. The population size refers to the number of EMAS-registered organizations at the time of data collection; higher figures reported elsewhere reflect later updates of the EMAS register. The questionnaire was sent to all EMAS-registered organizations, yielding 297 responses. These 297 responses constitute the EMAS subsample of a broader EU dataset previously used to compare EMAS and non-EMAS organizations [5]. In contrast to that comparative factor-analytic study, the present paper focuses exclusively on EMAS-registered organizations and examines descriptive associations between reported goal importance, monitoring importance, and self-reported achievement. The survey followed a census-style invitation, and participation was voluntary.
Data collection used the Computer-Assisted Web Interview (CAWI) method to ensure broad outreach and reliable findings. The survey included the following main sections:
- Evaluation and prioritization of specific environmental goals within organizations, addressing how these goals are set and the level of importance assigned to them.
- Monitoring practices for environmental performance indicators, focusing on the importance placed on different indicators and the extent of reported achievement.
Respondents rated the relevance of various environmental goals (e.g., reducing air emissions, water consumption, and waste generation) in their organizations from irrelevant to decisive. They were also queried about the environmental performance indicators monitored within their organizations. All performance-related measures are based on self-reported assessments provided by respondents.
The questionnaire consisted exclusively of closed-ended questions; no qualitative data was collected. Goals, areas, and indicators were selected using a top-down approach involving experts, SRDs, BEMPs, ISO 14031, and literature review.
A pilot study with three participants validated questionnaire clarity, wording, and estimated completion time. Minor modifications were made for usability. The survey was initially developed in Polish, then translated into English, German, Spanish, Italian, French, Slovak, and Portuguese, with native speakers and back-translation ensuring consistency. Respondents answered in their native languages, while those from Austria, the Netherlands, Cyprus, Sweden, Hungary, Denmark, and the Czech Republic used English.
The survey was conducted via the online platform and remained open for three months. A follow-up email was sent after two weeks to boost participation. CAWI ensured standardized data collection, minimizing interviewer bias, and facilitating real-time data entry for efficient analysis. As participation was voluntary, non-response bias cannot be excluded and is addressed in the Limitations section.
3.2. Data Analysis
Multiple statistical tools were used to analyze questionnaire responses, identifying patterns, differences, and correlations between organizational characteristics and self-reported environmental performance. All analyses were conducted using self-reported variables derived from the questionnaire responses. The applied tests included:
- Mann–Whitney U test: Comparing differences between two independent groups (e.g., sector, country).
- Kruskal–Wallis test: Identifying significant differences across more than two groups.
- Kendall’s tau test: Assessing the significance, strength, and direction of variable relationships (e.g., importance of environmental goals vs. achievement).
A 5% significance level (p < 0.05) was used. Given the exploratory nature of this study, no formal correction for multiple comparisons (such as False Discovery Rate control) was applied. Consequently, individual p-values reported herein must not be interpreted as definitive population inferences; rather, they are treated strictly as exploratory signals that flag descriptive distributional differences within our specific sample that warrant further targeted, confirmatory research. Data analysis was conducted using IBM SPSS Statistics version 29.0.2.0 (IBM Corp., Armonk, NY, USA). Statistical notations used throughout the results are abbreviated as follows: KW = Kruskal–Wallis test (χ2); MW = Mann–Whitney U-test; KT = Kendall’s tau correlation test (τ); p = p-value; n = sample size; SD = standard deviation; Avg = average; Mdn = median.
Variables derived from Likert-type questions were treated as ordinal and normalized to an equidistant 0–1 scale to facilitate cross-indicator comparisons. To ensure reproducibility, the exact survey items, original response scales, and coding operationalizations are detailed below:
- Environmental goals importance: evaluated via the item “At what level of importance are environmental goals targeted in your organization?” scored across 16 environmental aspects using a 5-point scale: Irrelevant (0.00), Unimportant (0.25), Medium important (0.50), Important (0.75), and Decisive (1.00).
- Overall goals achievement rate: evaluated via a single macro-organizational question: “Are goals met?” scored on a 3-point scale: We realize few of our environmental goals (0.00), We realize most of our environmental goals (0.50), and We realize all our environmental goals (1.00).
- Indicator monitoring importance: evaluated via the matrix item: “What environmental performance indicators are monitored in your organization? For the indicators monitored, please indicate their importance...” mapped across 21 indicators using a 5-point scale where an unmonitored status was assigned the baseline value: We do not monitor (0.00), Irrelevant (0.25), Unimportant (0.50), Important (0.75), and Critical (1.00).
- Aspect-level results achievement rate: derived from the secondary component of the tracking matrix inquiring about the specific areas “in which you have achieved environmental effects.” This tracks aspect-level reported achievement rates across individual indicator streams (e.g., energy, waste, water metrics) rather than the macro-level organizational goal perception.
- Contextual controls: Employee Number was categorized into four intervals (<10 employees = 0.00; 10–50 = 0.33; 50–250 = 0.67; >250 = 1.00) and Perceived Environmental Friendliness relative to market peers was scored on a 3-point scale (Less than competitors = 0.00; As competitors = 0.50; More than competitors = 1.00).
Missing values resulting from incomplete survey sheets were handled strictly through pairwise deletion; consequently, the effective sample size (n) fluctuates across isolated bivariate tests depending entirely on the total pool of valid entries for those specific parameters. No separate “not applicable” response options were provided in the survey layout. To ensure analytical clarity, a clear distinction must be maintained between the macro-organizational overall goals achievement rate and the aspect-level results achievement rate. The overall goals achievement rate captures a single, generalized perception of overarching organizational goal fulfillment. In contrast, the aspect-level results achievement rate tracks isolated environmental effects across individual indicator streams.
This study adopts a comparative descriptive approach. The statistical tests employed (Mann–Whitney and Kruskal–Wallis) assess differences in distributions across predefined groups but do not control for simultaneous effects of multiple variables. Therefore, findings should be interpreted as identifying associations rather than independent causal relationships. Missing values were handled using pairwise deletion. Therefore, the sample size (n) varies across statistical tests depending on the number of valid responses available for each variable or group comparison. No formal sensitivity analysis or multivariate robustness test was conducted. This limitation is acknowledged. Consequently, all reported group comparisons (e.g., by country or sector) should be interpreted as unadjusted descriptive differences, not as net effects after controlling for confounding variables. Furthermore, due to the voluntary nature of the survey, certain localized subgroup analyses (e.g., specific country cohorts or NACE production sectors like Section F or D) are based on small sample sizes (n < 15). Statistical metrics derived from these small subsamples are structurally fragile and must be interpreted with high caution as tentative, exploratory signals within this specific sample, rather than as robust or generalizable organizational trends.
4. Results and Discussion
4.1. Sample Characteristics
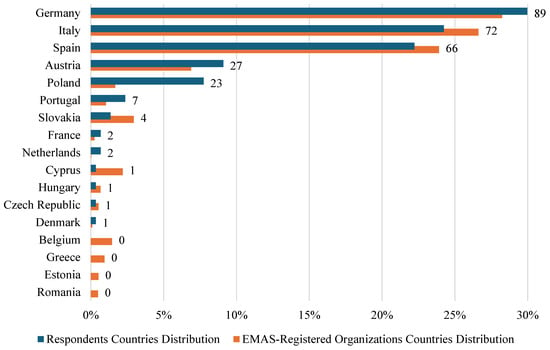
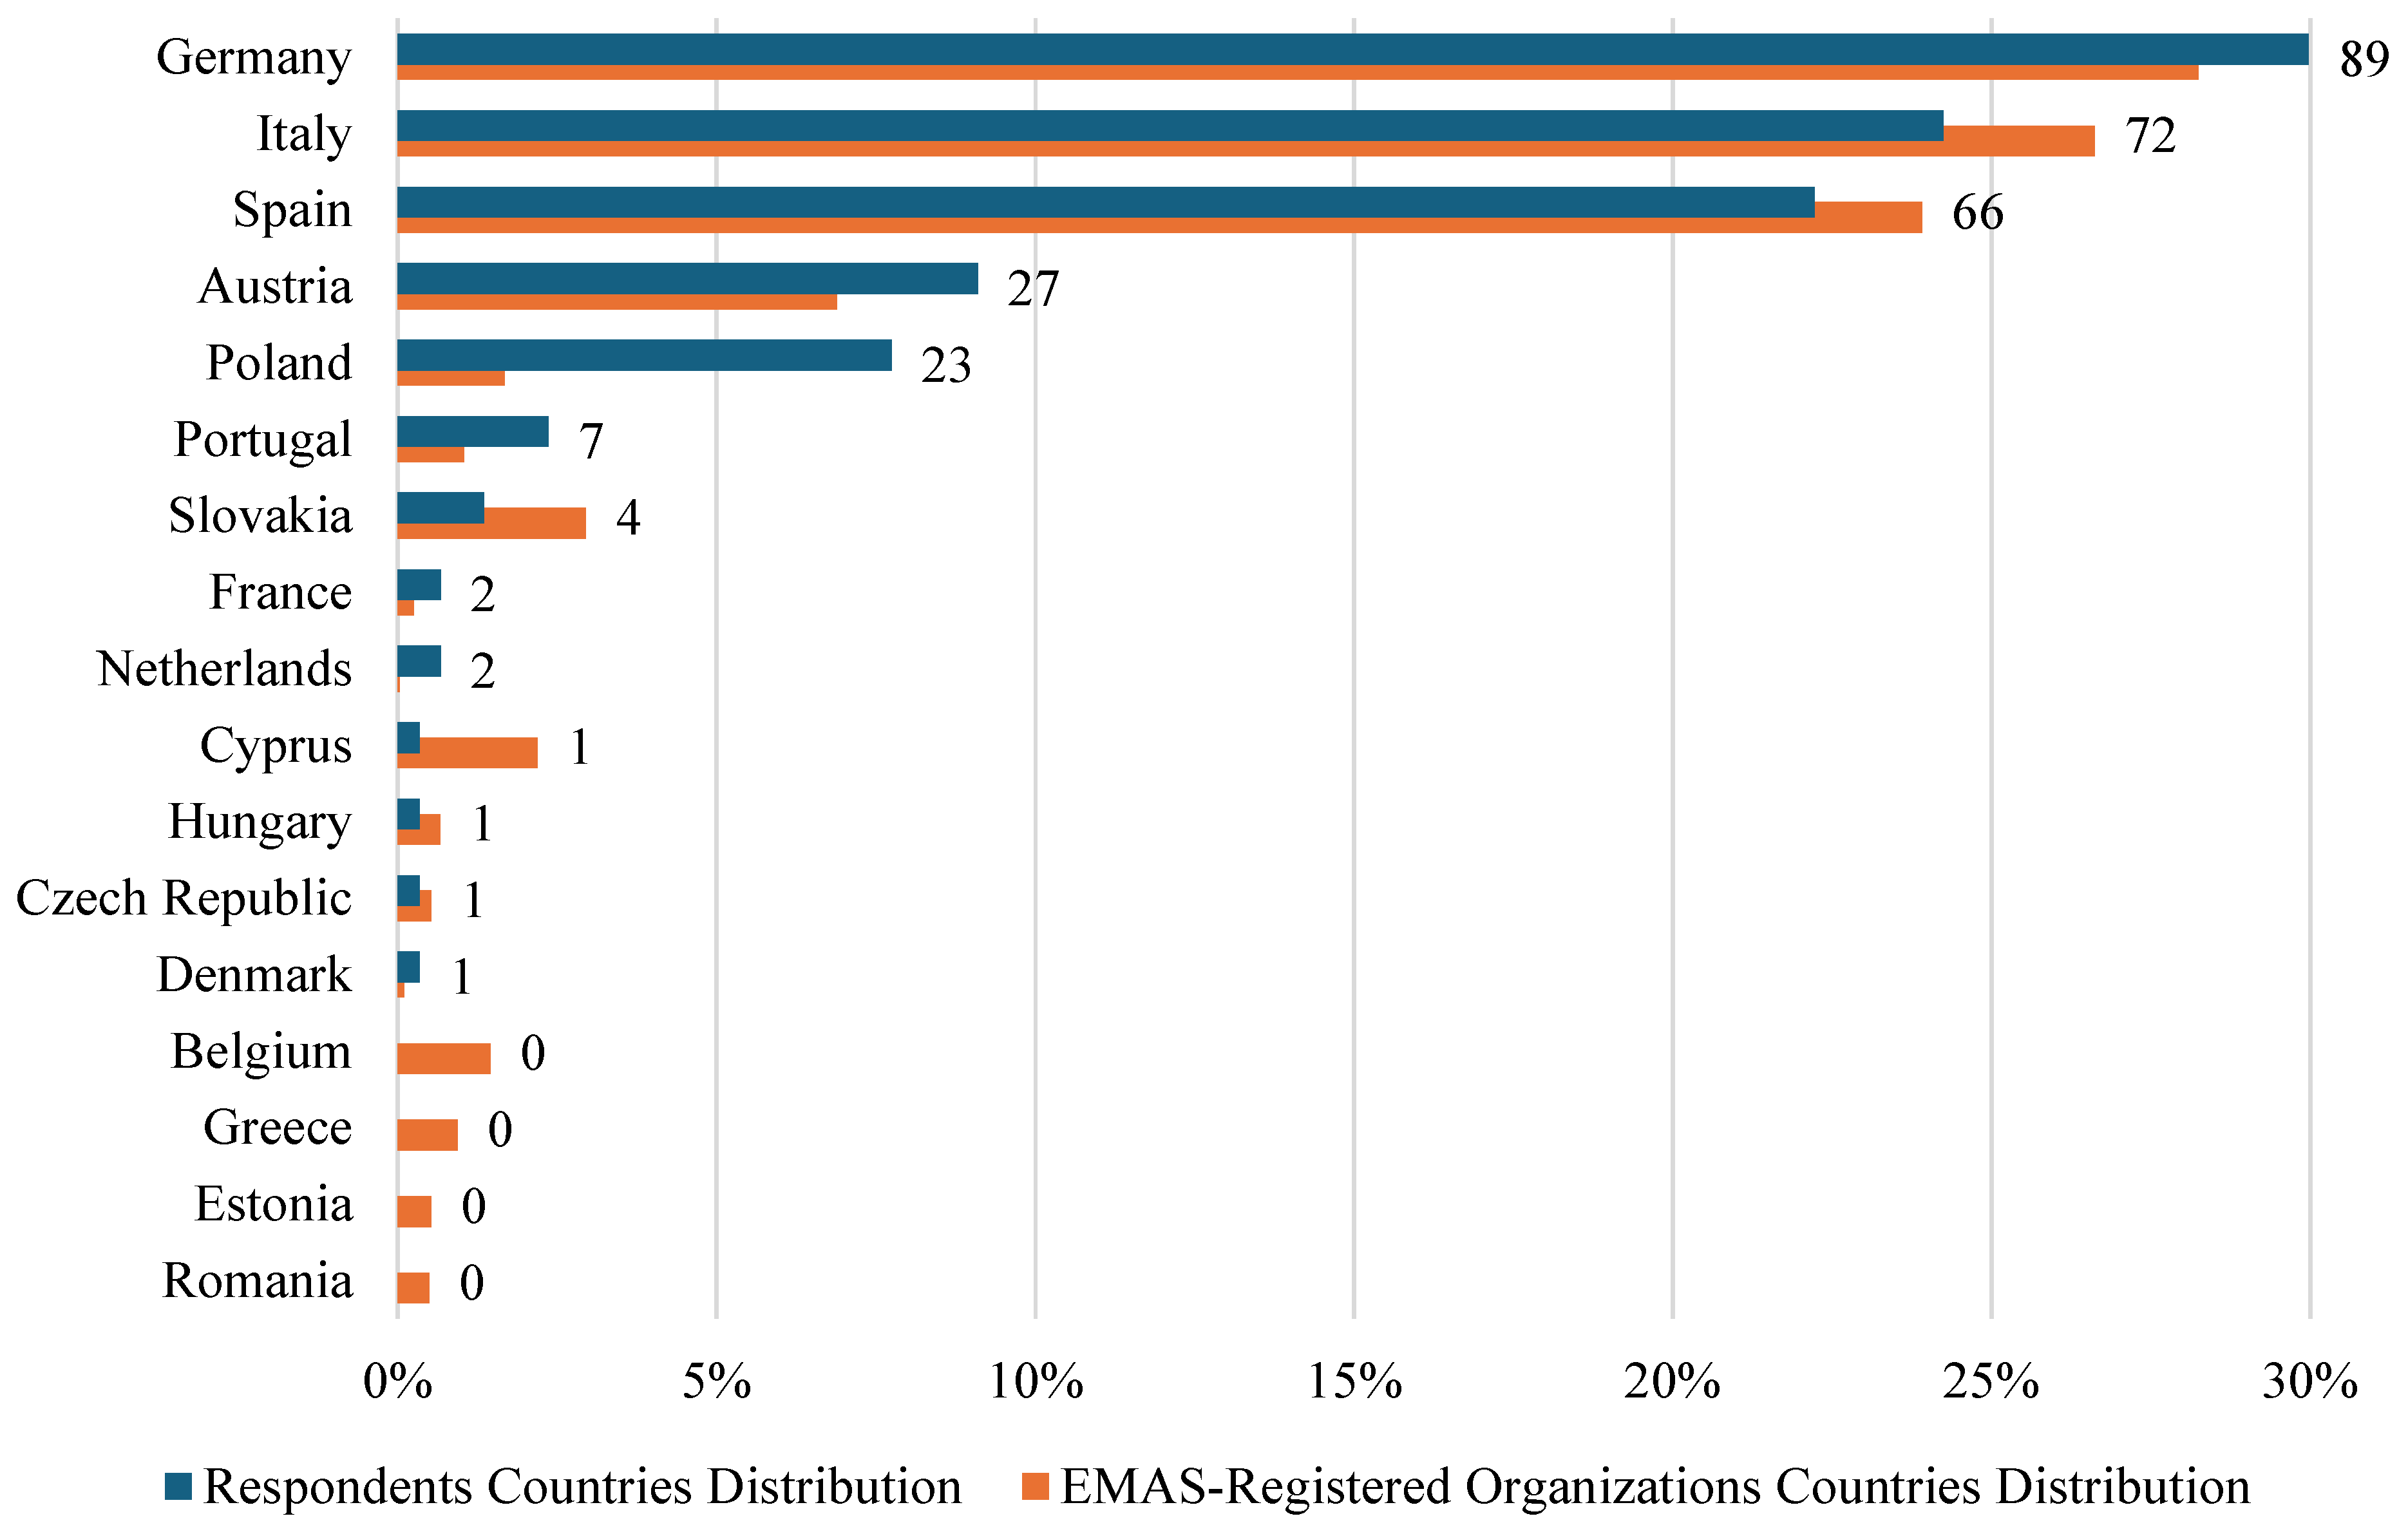
The study sample included 297 responses, representing 7.5% of all EMAS-registered organizations at the time of research. The surveyed organizations span various European countries (Figure 1), with most responses from Germany (30.0%, response rate 7.5%), Italy (24.2%, 6.3%), Spain (22.2%, 7.2%), Austria (9.1%, 9.6%), and Poland (7.7%, 32.8%) (Figure 1). Among the country cohorts, only Polish organizations were overrepresented compared to their 1.7% share of total EMAS registrations. Smaller contributions came from Portugal, Slovakia, France, and others (<3%). These distributions reflect the structure of the responding sample and should not be interpreted as country-level organizational characteristics.
Figure 1.
Comparison of respondents’ country distribution with the distribution of EMAS-registered organizations, highlighting the total count of respondents for each country on the right side of the bar.
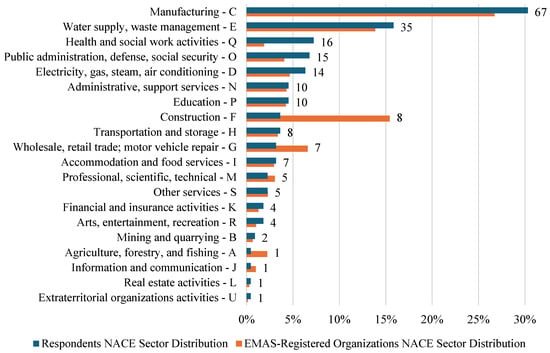
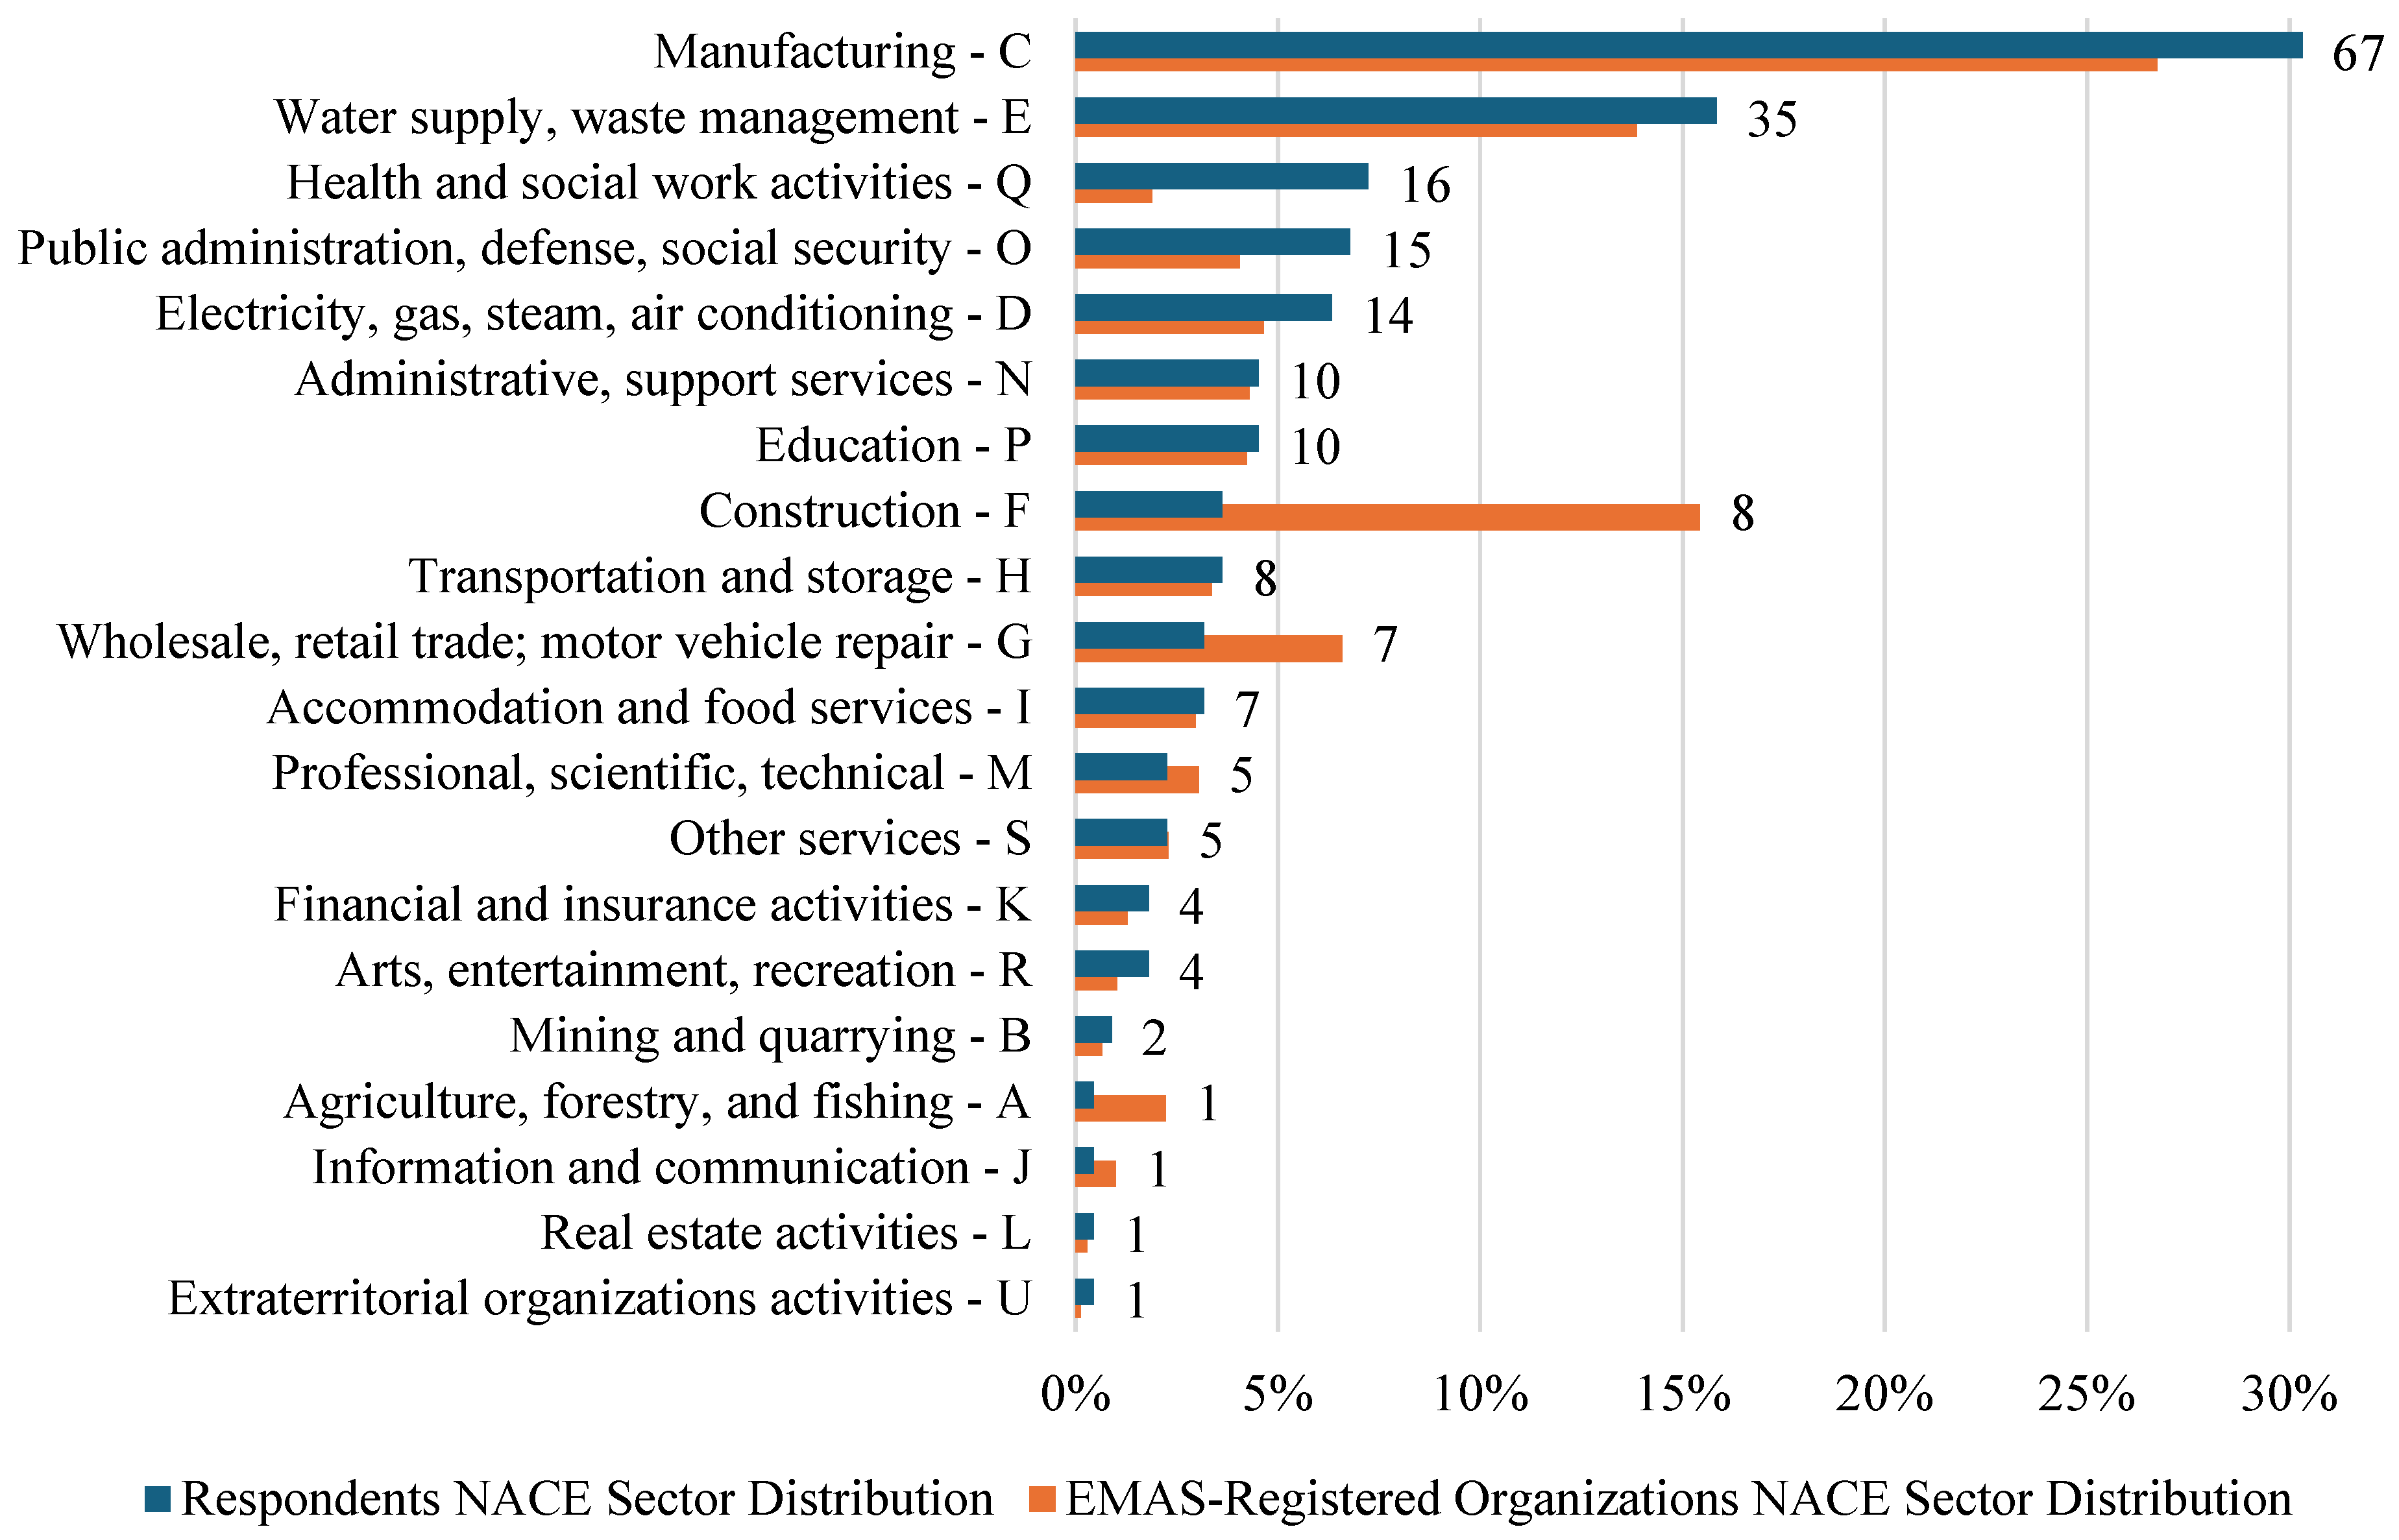
In terms of industry sectors, most respondents operated in manufacturing (30.3%, section C) and water supply, sewerage, waste management, and remediation (15.8%, section E) (Figure 2). The human health and social work sector (7.2%, section Q) was overrepresented compared to its actual EMAS share (1.9%), while construction (3.6%, section F) was underrepresented compared to its 15.4% share. Sectoral differences therefore represent aggregate patterns within the sample rather than sector-specific causal effects.
Figure 2.
Comparison of respondents’ NACE sector distribution with the distribution of EMAS-registered organizations, highlighting the total count of respondents for each sector on the right side of the bar.
Large organizations (>250 employees) made up 45.5% of respondents, exceeding their 27.2% share in EMAS. Smaller firms (<10 employees) were slightly underrepresented (3.7% vs. 12.1%). The median first EMAS registration year was 2007, indicating an overrepresentation of long-standing EMAS adopters compared to the overall 2013 median. These characteristics may influence self-reported goal-setting, monitoring practices, and achievement outcomes and are therefore considered when interpreting the results.
Regarding perceived (self-assessed) environmental performance, 59.3% of respondents consider themselves better than competitors, 39.4% on par, and only 1.3% worse. This “better-than-average” bias, observed in other organizational contexts [39], may lead to overconfidence, potentially hindering continuous improvement and risk assessment. Despite some distribution differences, the sample offers a broad overview of EMAS-registered organizations across different countries and sectors.
4.2. Importance of Environmental Goals
4.2.1. Overall Importance Levels
Almost all organizations (98.7%) reported setting environmental goals, indicating a high level of formal engagement with environmental management. Since EMAS-registered organizations are required to have an environmental program, this share would ideally be expected to reach 100%. On a scale from 0 (irrelevant) to 1 (decisive), the average importance of environmental goals was scored 0.69 ± 0.14, with a median of 0.70, indicating that environmental goals are generally considered “important”.
A further analysis of differences across sample characteristics regarding the importance placed on environmental goals (Table 1) revealed that organizations operating in specific sectors and located in specific countries reported significantly higher importance scores than others. For example, organizations in the electricity, gas, steam, and air conditioning supply sector (section D) assigned significantly higher importance to environmental goals compared to other sectors (Mann–Whitney’s U-test (MW), Mdn = 0.75 vs. Mdn = 0.69, ND = 14, NOthers = 204, p = 0.040). This difference reflects patterns within the responding sample and does not imply sector-determined behavior. Similarly, organizations located in Spain reported, on average, higher environmental objective scores than those located in other countries within this sample (MW, Mdn = 0.73 vs. Mdn = 0.69, NSpain = 66, NOthers = 228, p = 0.002).
Table 1.
Influence of selected country and production sector on overall goals importance, goals achievement rate, and monitoring importance (minimum count = 7). Cells are color-coded using a local scale within each column to reflect deviations from the column average: green indicates values above average, red indicates values below average (dark green = more than 0.10 above average; green = +0.05 to +0.10 above average; light green = +0.03 to +0.05 above average; white = within ±0.03 of the average; light red = –0.03 to –0.05 below average; red = –0.05 to –0.10 below average; dark red = more than –0.10 below average).
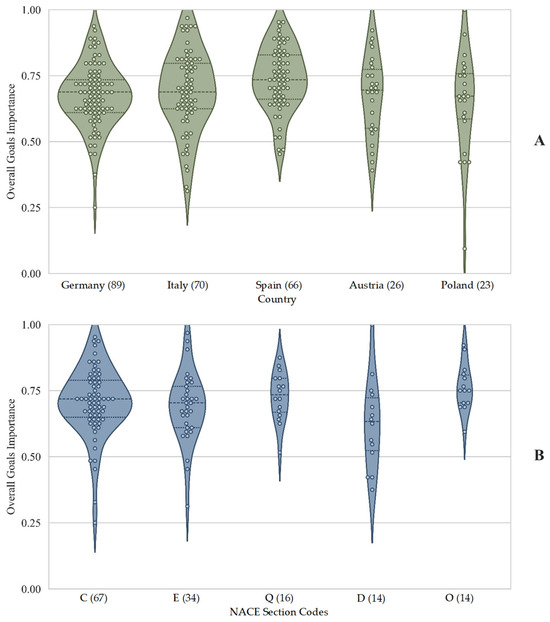
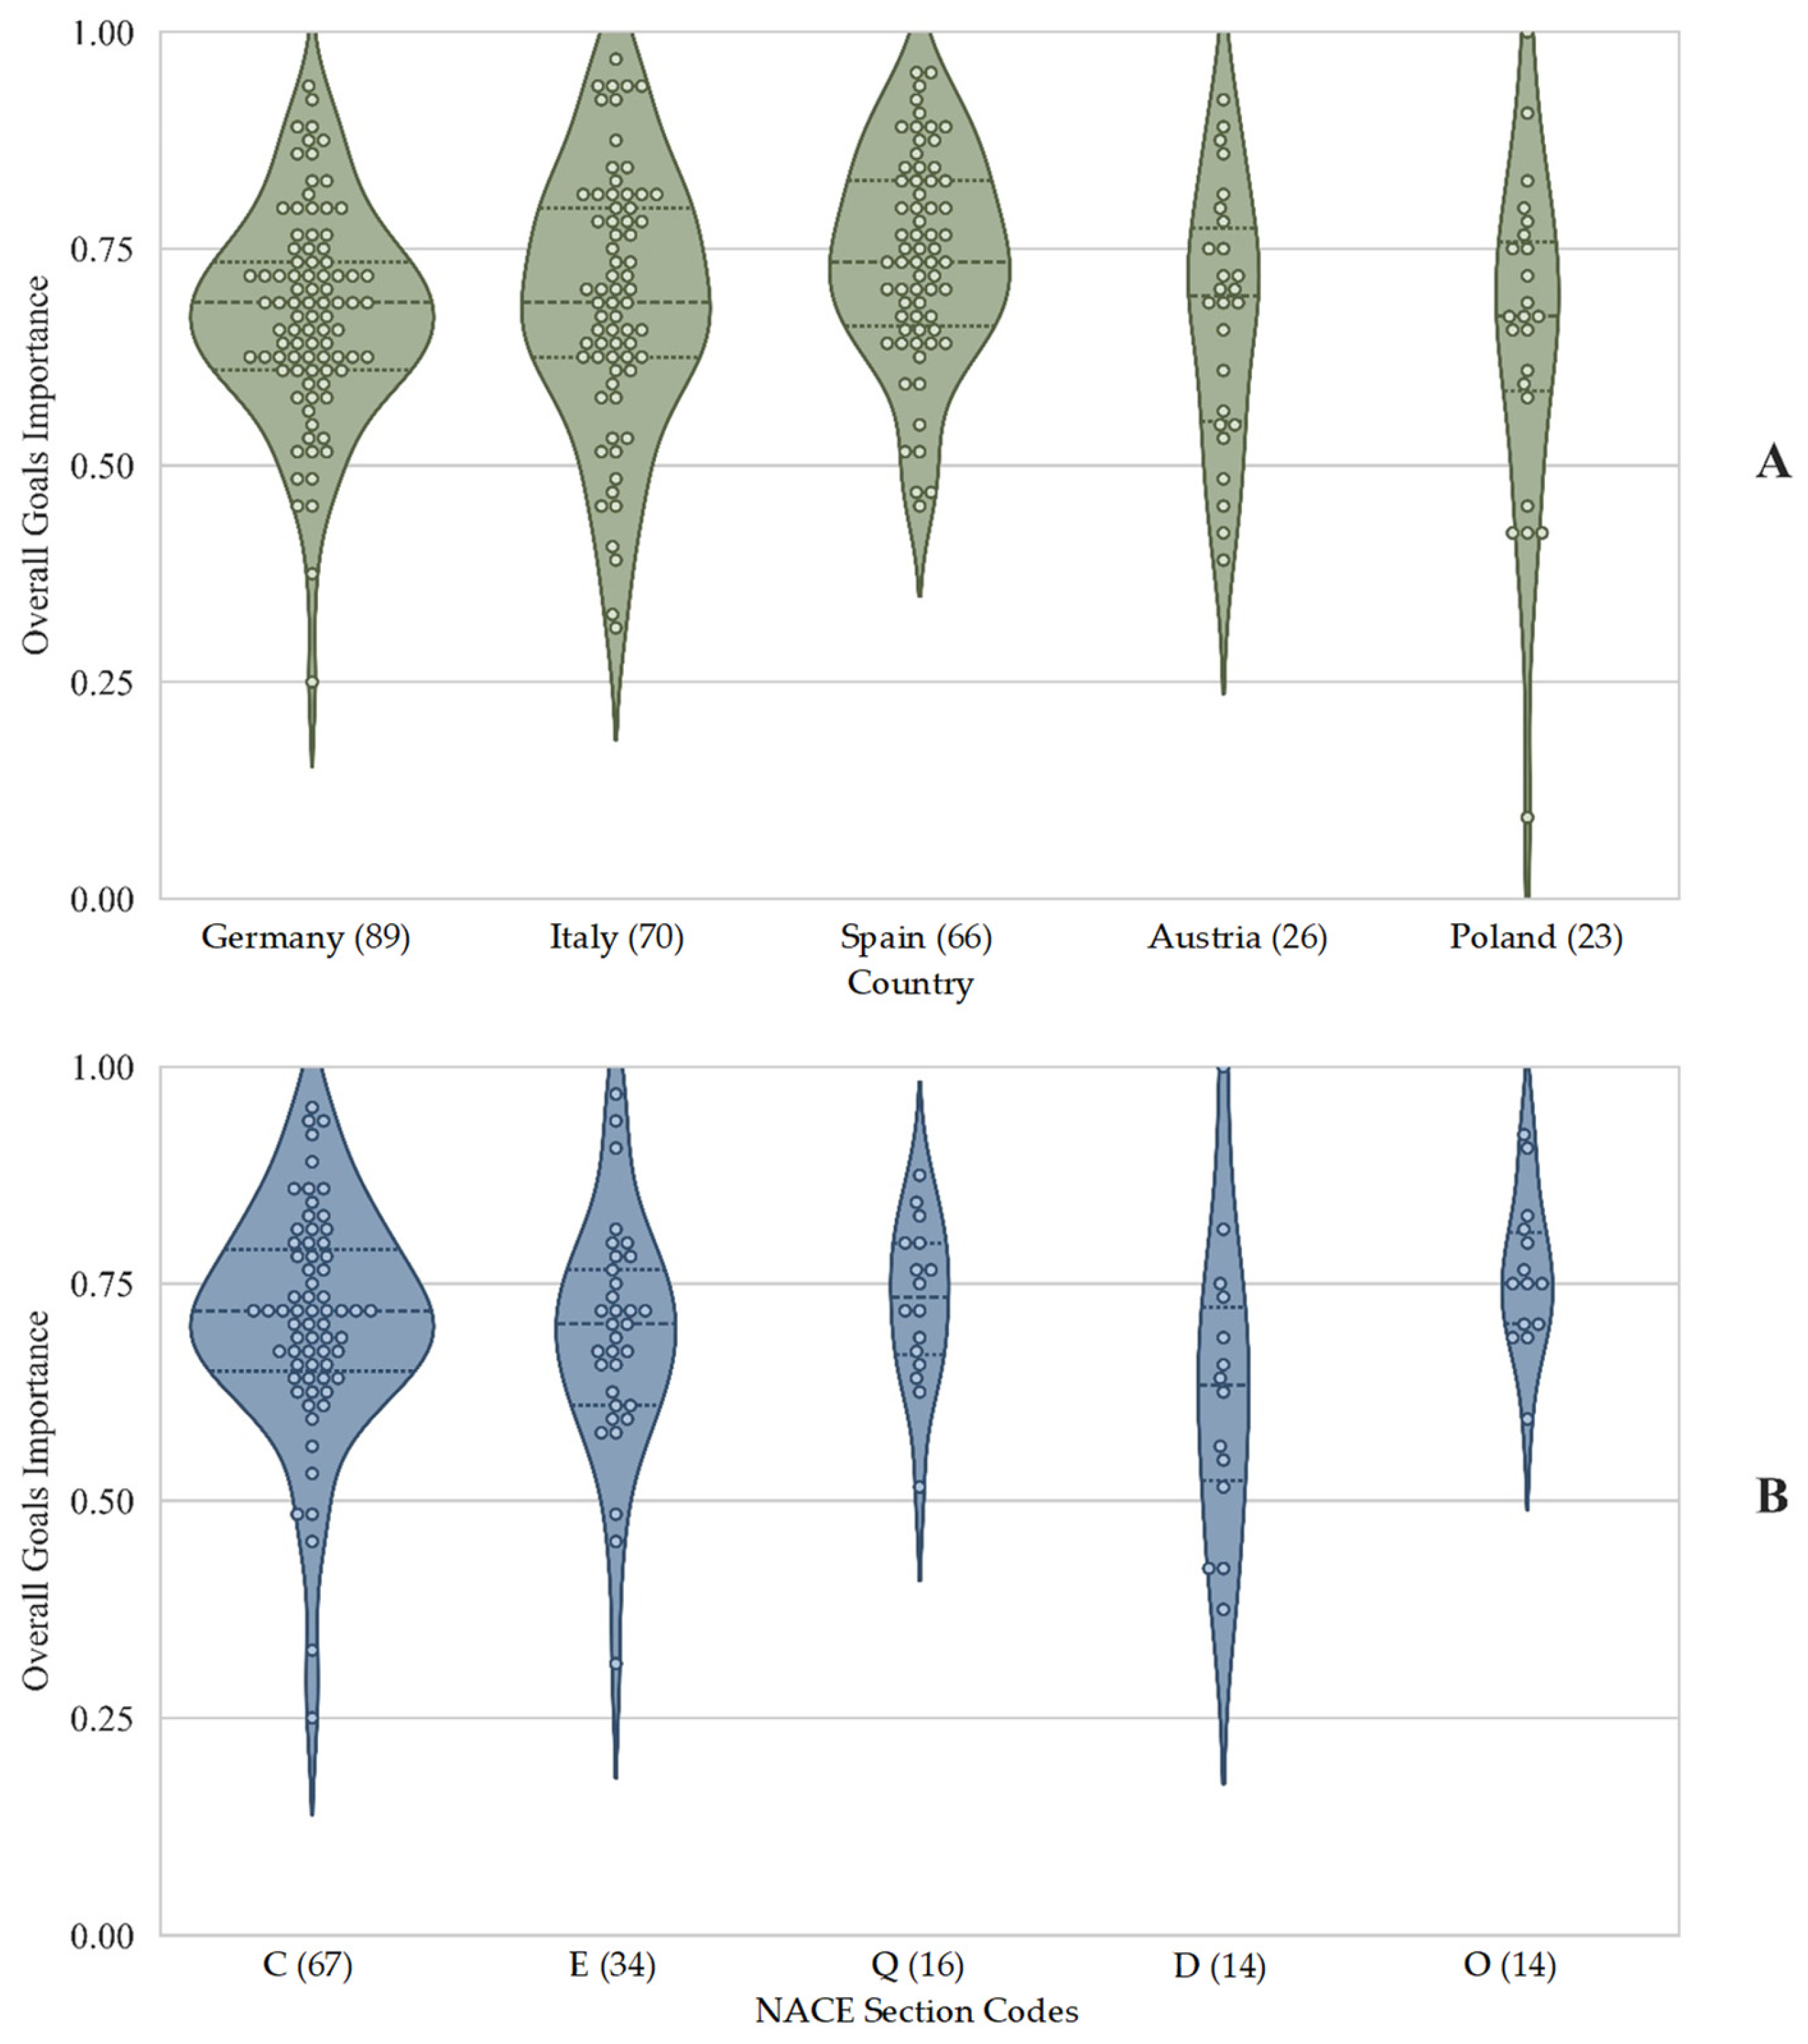
In contrast, public administration and defense sector (section O) rated environmental objectives as less important compared to other sectors in the respondents’ self-assessments (MW, Mdn = 0.63 vs. Mdn = 0.70, NO = 14, NOthers = 204, p = 0.035). Figure 3 illustrates the distribution of the goals’ importance across countries and sectors. In Panel A, German and Italian organizations showed similar average scores within the responding sample, but German responses were more concentrated within a narrower range (between 0.5 and 0.75), whereas Italian responses were more widely dispersed. Responses from Austrian and Polish organizations demonstrated even greater variability within the sample, particularly toward the lower end of the scale, suggesting a more diverse spectrum of opinions on the prioritization of environmental goals within these countries. Panel B shows that the public administration and defense sector (section O) had a broader range of responses compared to the manufacturing (section C) and water supply, sewerage, waste management (section E) sectors. These aggregate differences suggest that country- and sector-level contextual factors may be associated with variation in prioritization of environmental objectives. The variability across both dimensions may reflect differences in regulatory frameworks, market dynamics, organizational culture, or leadership involvement [40]. However, given that some sectoral categories (e.g., ND = 14 and NO = 14) represent small slices of the overall sample, these differences are highly tentative and should not be over-interpreted.
Figure 3.
Violin plots with overlaid swarm plots displaying the descriptive distribution of overall goal importance across selected countries (A) and NACE section codes (B). Group sample sizes (n) are explicitly provided on the horizontal axis labels. To ensure the reliability of the distribution profiles and avoid visually misleading shapes, only countries and sectors with n ≥ 14 from our sample were selected for inclusion. For Panel B, the labels correspond to the following sectors: C = Manufacturing; E = Water supply, sewerage, and waste management; Q = Human health and social work activities; D = Electricity, gas, steam, and air conditioning supply; O = Public administration and defense. The width of each violin body displays the smoothed probability density of responses across the importance scale, showing where data points cluster. These plots are strictly descriptive sample reflections and do not control for external organizational confounding variables.
4.2.2. Importance of Environmental Goals Targeting the Different Environmental Aspects
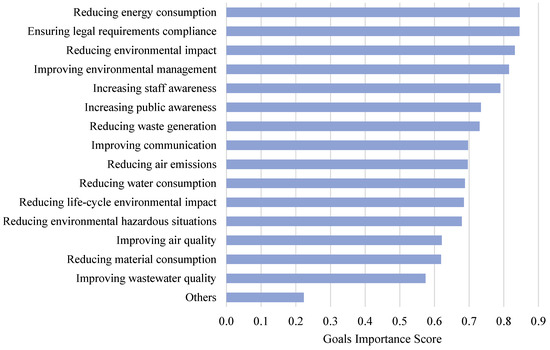
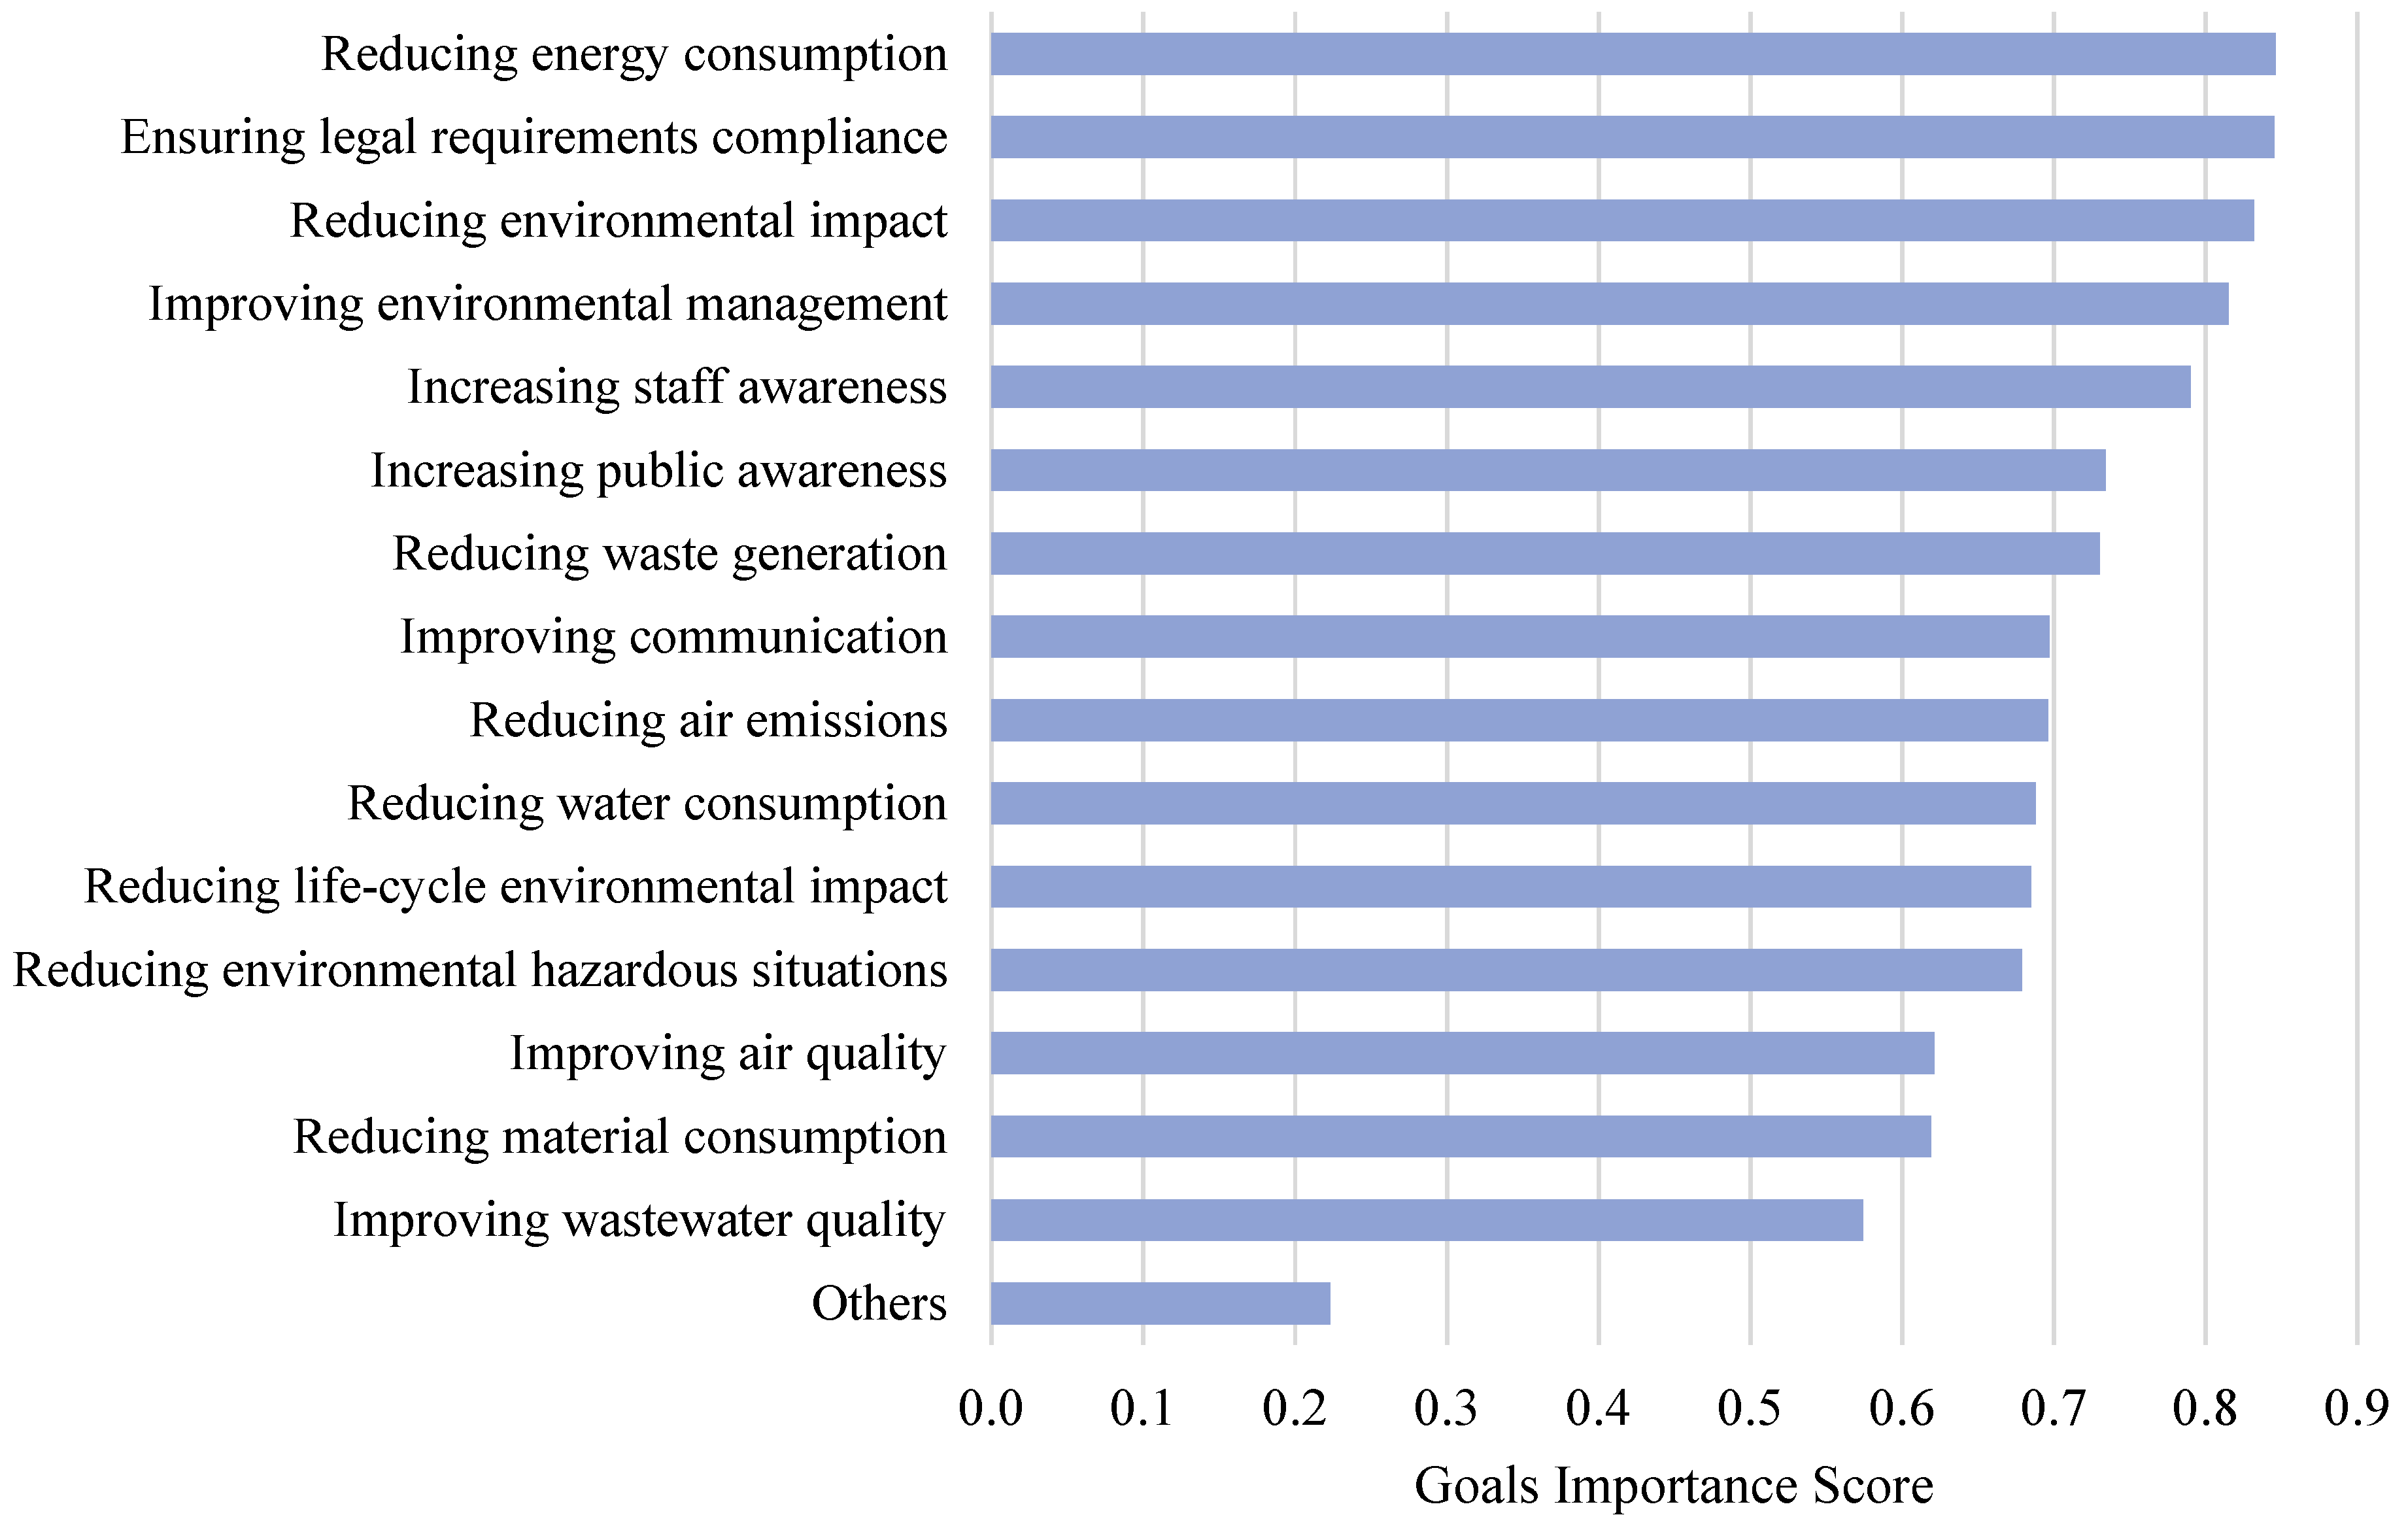
When assessing the importance of specific environmental aspects, it was found that certain goals were prioritized more than others (Figure 4). Reducing energy consumption was rated the highest, with an average importance score of 0.85. This may reflect the perceived economic and environmental value associated with energy efficiency and cost savings. Reducing waste generation (0.73) and air emissions (0.70) followed energy consumption, indicating these are also priorities for many organizations. On the other hand, several aspects were considered less critical. The category labeled “other” had the lowest importance score of 0.22, followed by improving wastewater quality (0.57), reducing the consumption of production materials (0.62), and improving air quality (0.62). Other areas describing more strategic or general environmental commitments received high ratings. Examples are ensuring compliance with legal and other requirements (0.85), reducing overall environmental impacts (0.83), and improving the management of environmental aspects (0.81).
Figure 4.
Average goals importance scores for the environmental aspects and areas considered.
The importance of specific environmental goals also varied significantly across sectors and countries. For instance, reducing material consumption was rated higher by manufacturing organizations (section C) (MW, Avg = 0.71 vs. Avg = 0.59, NC = 67, NOthers = 151, p = 0.010), compared to others, which may be related to the direct cost and resource efficiency implications of material use. In the water supply, sewerage, waste management, and remediation activities sector (section E), improving the wastewater quality was rated more important (MW, Avg = 0.69 vs. Avg = 0.58, NE = 34, NOthers = 184, p < 0.001), which may be associated with the sector’s operational focus (direct involvement in water management issues and direct responsibility in managing water resources). In contrast, some goals were rated lower in importance by specific sectors. For example, human health and social work activities sector (section Q) assigned lower importance to air emissions (MW, Avg = 0.59 vs. Avg = 0.72, NQ = 16, NOthers = 202, p = 0.001) and material consumption (MW, Avg = 0.50 vs. Avg = 0.64, NQ = 16, NOthers = 202, p = 0.009), which may be related to a generally lower direct involvement with emission-intensive and material-intensive activities. Some environmental goals, such as improving the management of environmental aspects and those grouped under “other,” showed significant differences among countries (Kruskal–Wallis test (KW), χ2(13) = 23, p = 0.045, χ2(13) = 70, p < 0.001), which may reflect differences in national-specific legislative framework, contextual conditions, and local priorities.
4.2.3. Goals Achievement Rate
Organizations were asked to rate their success in achieving environmental goals on a scale from 0 (few goals achieved) to 1 (all goals achieved). Most organizations (75.2%) reported that they achieved most of their environmental goals, while 21.8% indicated that they had achieved all of them. Only 3.1% indicated they had achieved few goals. The overall average score for goal achievement was 0.59, indicating that most organizations report achieving substantial progress toward their environmental objectives.
Significant differences were observed between the importance assigned to environmental goals across groups with different levels of goal achievement (KW, χ2(2) = 8, p = 0.018). Organizations that achieved few goals had assigned relatively low importance to them (average importance score of 0.58), whereas those that achieved most or all their goals reported higher importance scores (0.69 and 0.72, respectively). This finding is descriptively consistent with Hypothesis 1. In this sample, higher importance scores co-occurred with higher self-reported achievement scores. This pattern parallels earlier descriptive findings in the literature [41].
Goals achievement levels also varied by country (KW, χ2(13) = 49, p < 0.001) (Table 1). Within the responding sample, organizations located in Austria and Poland reported higher average self-reported achievement scores (0.81 and 0.76, respectively), whereas those located in Germany reported a lower average (0.53). No inference is made about national characteristics beyond this sample. Organizations that rated themselves as more environmentally friendly than their competitors also reported higher self-reported goal achievement (0.62 vs. 0.56) (KW, χ2(2) = 18, p < 0.001). This is a descriptive difference within the sample and does not indicate a causal effect of self-perception on performance. This suggests that a proactive stance on environmental responsibility may be associated with higher self-reported goal achievement.
4.3. Importance of Environmental Indicators
4.3.1. Overall Monitoring Importance
Organizations rated the importance of monitoring environmental performance using indicators on a scale from 0 (not important) to 1 (critically important). The average importance level across all respondents was 0.59, with a median of 0.63. This suggests that, overall, monitoring is considered “moderately important”. A positive correlation was found between the importance of environmental goals and the emphasis placed on monitoring (Kendall’s tau test (KT) τ = 0.228, p < 0.001). Organizations that view their environmental goals as more important also tended to value monitoring more highly, reflecting an integrated approach to environmental management in which goal-setting and monitoring are closely linked. This finding is consistent with research reporting associations between greater emphasis on environmental monitoring and closer alignment of monitoring practices with environmental goals and related management instruments [42].
Further analysis of sample characteristics revealed notable variations in the perceived importance of monitoring across different sectors (Table 1). Organizations in the manufacturing sector (section C) assigned higher importance to monitoring (MW, Mdn = 0.67 vs. Mdn = 0.60, NC = 67, NOthers = 153, p < 0.001), reflecting a stronger focus on monitoring within the responding sample. In contrast, public administration and defense sector (section O) (MW, Mdn = 0.33 vs. Mdn = 0.64, NO = 15, NOthers = 205, p = 0.002) and the construction sector (section F) (MW, Mdn = 0.49 vs. Mdn = 0.64, NF = 8, NOthers = 212, p = 0.018) rated monitoring significantly lower. Because the sample counts for public administration (n = 15) and construction (n = ) are small, these comparative statistical distributions are fragile and indicate localized sample signals rather than definitive sector-wide attributes.
The adoption of advanced environmental performance assessment methods also correlated with the perceived importance of monitoring. Organizations implementing advanced methodologies such as ISO 14051 (MW, Mdn = 0.69 vs. Mdn = 0.61, NYes = 15, NNo = 244, p = 0.015), ISO/TS 14033 (MW, Mdn = 0.67 vs. Mdn = 0.61, NYes = 25, NNo = 240, p = 0.044) and lifecycle environmental cost assessments (MW, Mdn = 0.67 vs. Mdn = 0.61, NYes = 31, NNo = 235, p = 0.017) reported higher monitoring importance levels. These methods demand more rigorous data collection and analysis. These results indicate that the use of structured assessment methods co-occurs with higher perceived monitoring importance. However, the cross-sectional design does not allow the direction of this relationship to be established.
These results indicate that monitoring importance is closely linked to how organizations structure and prioritize their environmental management activities, rather than directly reflecting achieved environmental outcomes.
4.3.2. Monitoring Importance of the Different Environmental Aspects
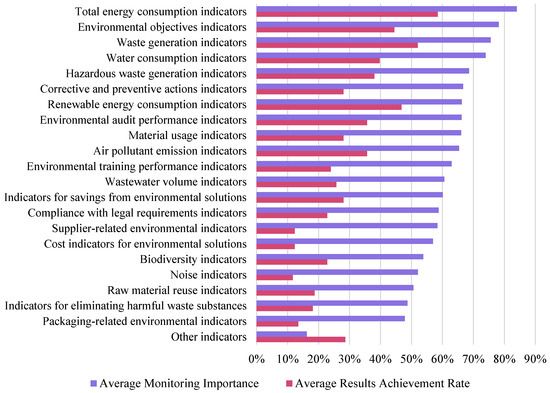
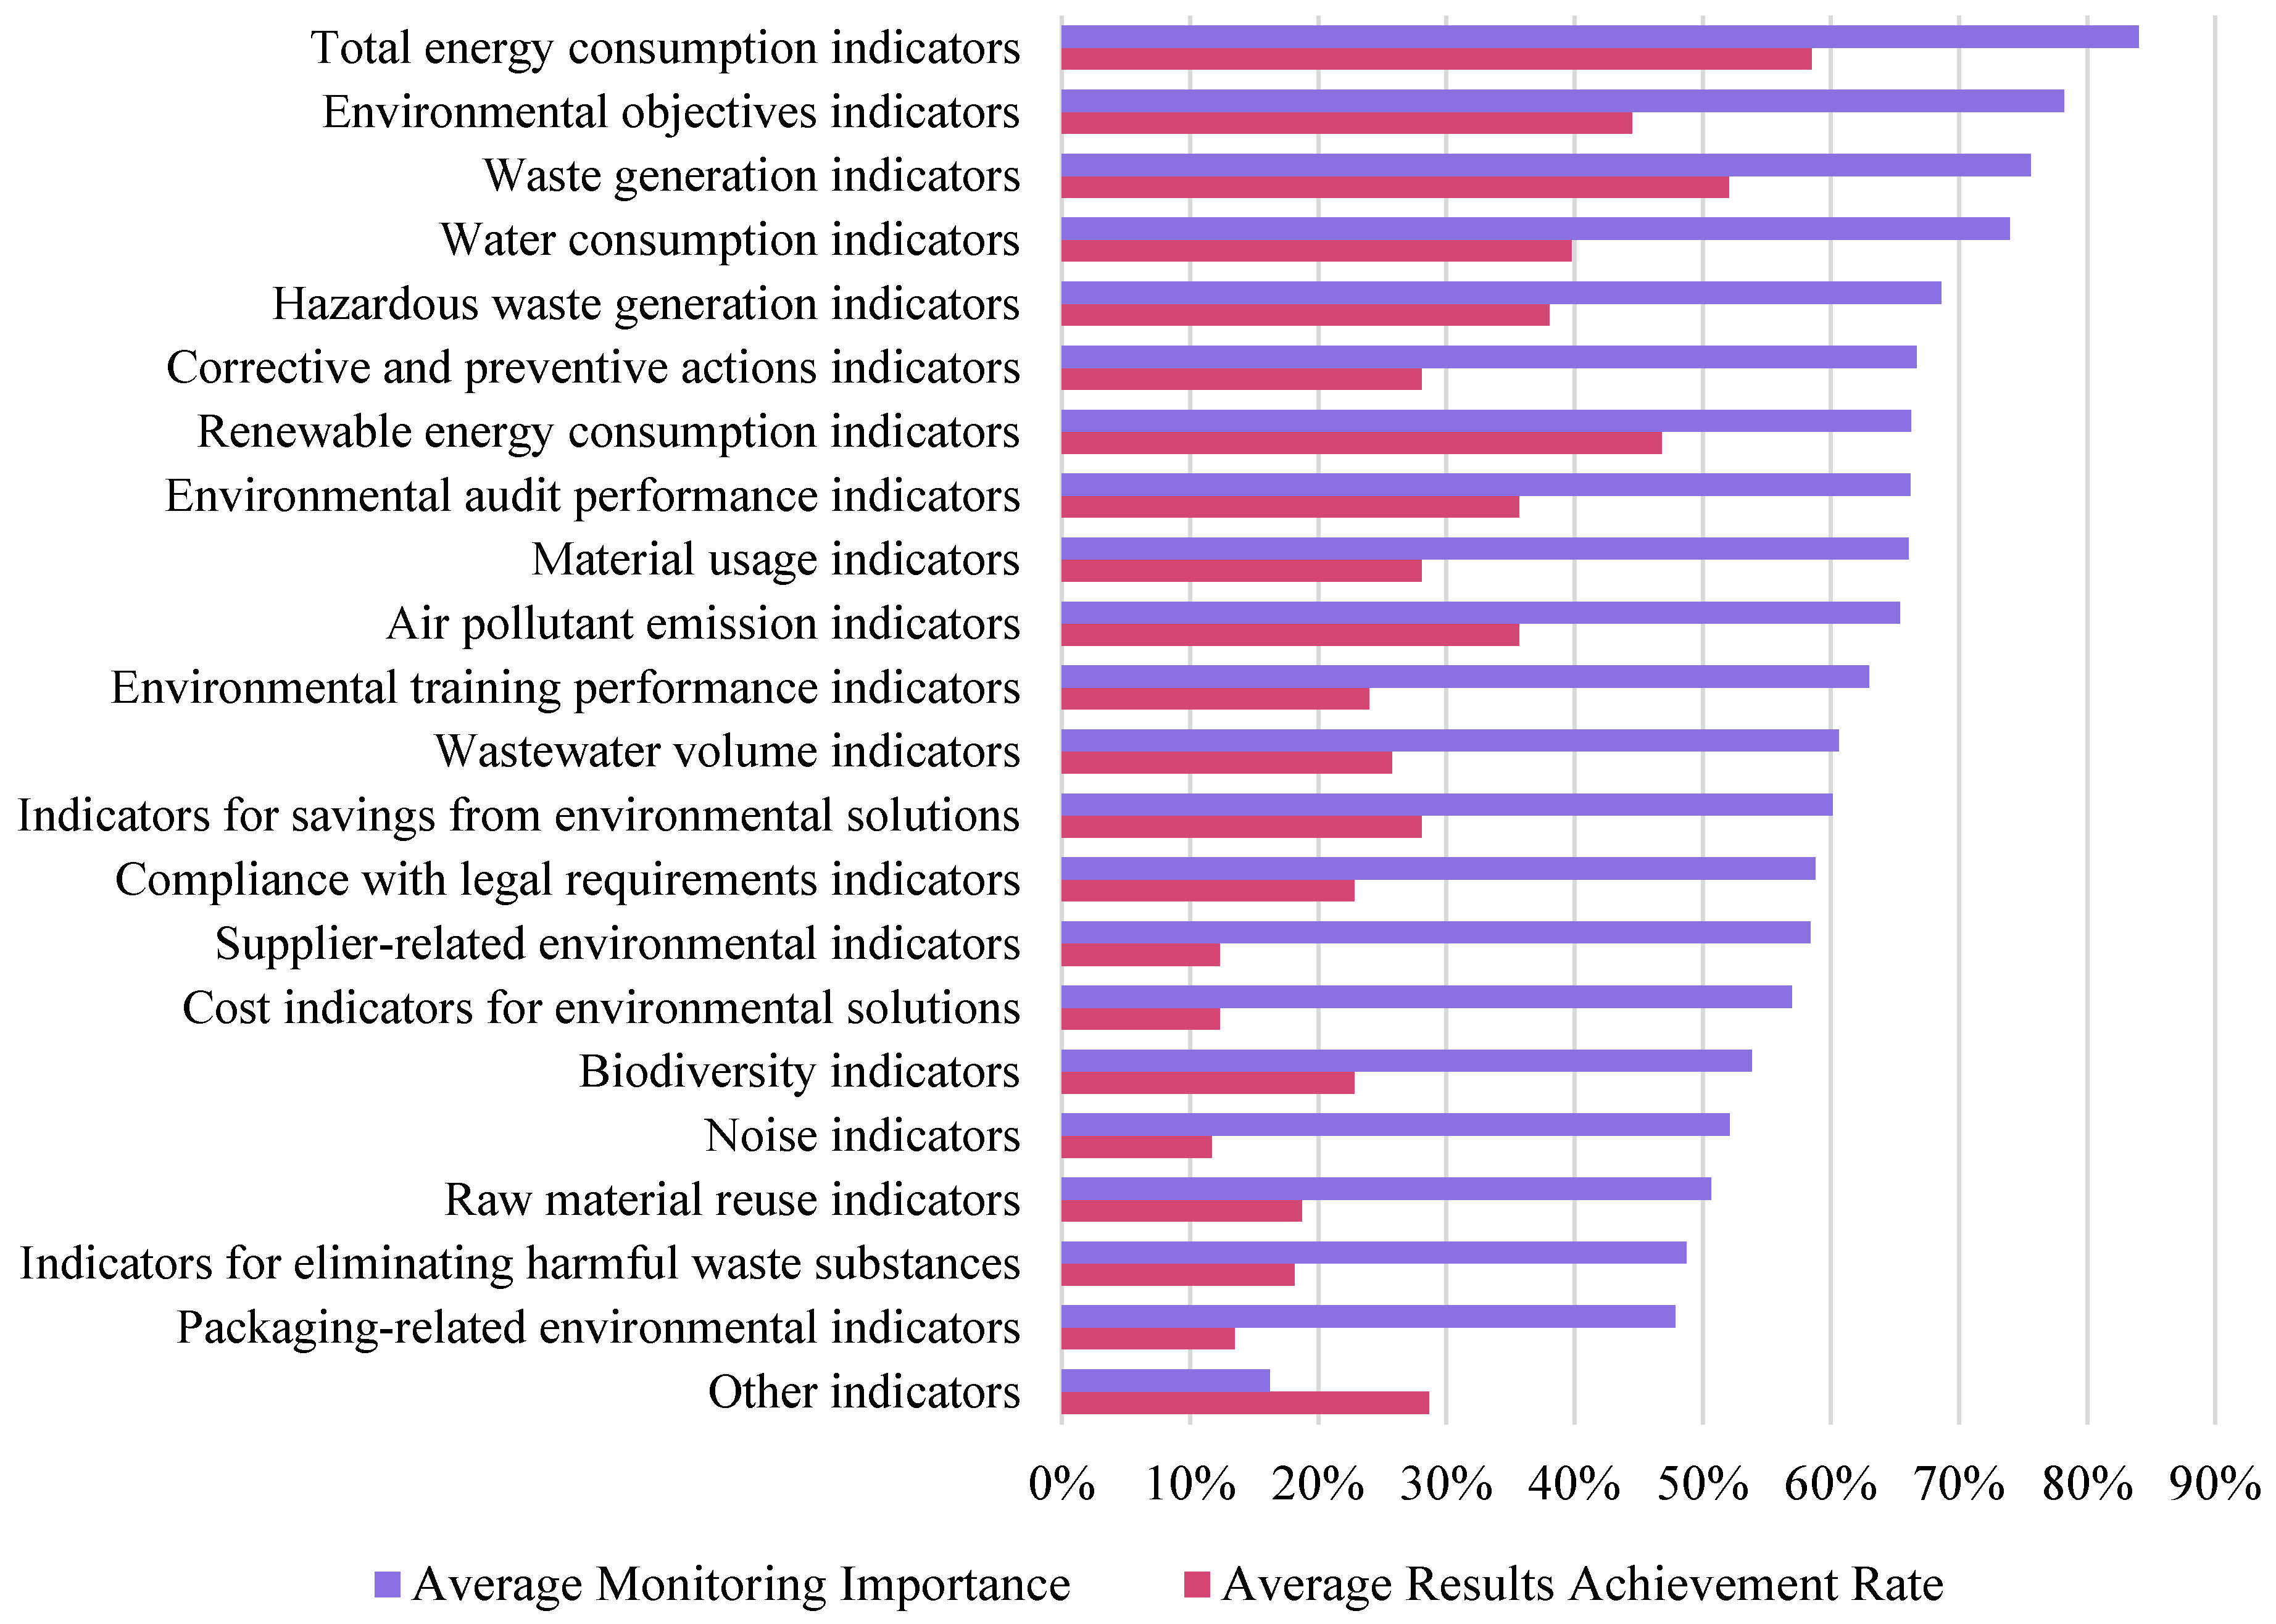
The importance assigned to monitoring varied considerably across different environmental aspects (Figure 5). Indicators related to total energy consumption received the highest importance score (0.84), suggesting a strong focus on energy efficiency. This was followed by the importance placed on indicators for achieving environmental objectives (0.78), waste generation (0.76) and water consumption (0.74). These results do not fully align with previous research. Campos et al. [43] found that ISO 14001-certified companies prioritize indicators linked to legal requirements, such as emergency preparedness and legal compliance. In contrast, our findings show that compliance with legal requirements received a moderate importance score (0.59), while key priorities include indicators tied not only to legal compliance (e.g., waste generation) but also to environmental impact and cost reduction. Future research could explore how these monitoring priorities differ between EMAS and ISO 14001-certified organizations.
Figure 5.
Comparison of average monitoring importance and average self-reported results achievement rate for the environmental indicators considered.
In contrast, some areas were considered less important. Monitoring of packaging (0.48), eliminating harmful substances from waste (0.49), raw material reuse (0.51), and noise generation (0.52) received the lowest scores. The lower prioritization of these aspects may be due to difficulties in measurement, lower perceived relevance, or limited regulatory pressure in these domains. Additionally, not all aspects are equally applicable to every sector. For instance, packaging and raw materials reuse might be more relevant to manufacturing sectors, while noise control could be less critical in service-based industries, where machinery and equipment are less prominent.
The analysis also highlighted how the importance placed on monitoring through indicators correlates with the emphasis placed on environmental goals. The relationship between monitoring and goal importance was statistically significant for most aspects. For example, strong and significant correlations were observed for:
- water consumption (KT, τ = 0.489, p < 0.001);
- air emissions (KT, τ = 0.409, p < 0.001);
- total energy consumption (KT, τ = 0.317, p < 0.001);
- materials consumption (KT, τ = 0.387, p < 0.001);
- waste generation (KT, τ = 0.334, p < 0.001);
- wastewater management (KT, τ = 0.320, p < 0.001).
Weak but significant correlations were found for the remaining aspects, with detailed results reported in a publicly available repository [44].
These results suggest that organizations tend to place greater monitoring emphasis on areas they prioritize within their environmental goals, while sectoral differences were also evident. For instance, the construction sector (section F) rated renewable energy consumption monitoring significantly lower than others (MW, Avg = 0.21 vs. Avg = 0.69, NF = 7, NOthers = 153, p = 0.010), which may be related to the industry’s traditional reliance on non-renewable energy sources. The manufacturing sector (section C) rated raw material reuse higher (MW, Avg = 0.68 vs. Avg = 0.43, NC = 58, NOthers = 137, p < 0.001), which may be associated with a focus on resource efficiency and cost savings through recycling and reuse.
Noise monitoring also showed considerable variability, being prioritized by organizations in the energy sector (section D) (MW, Avg = 0.71 vs. Avg = 0.22, ND = 13, NOthers = 192, p = 0.018). This sector’s emphasis on noise monitoring may be related to the operational noise generated by power plants and the regulatory requirements to mitigate such impacts. On the other hand, the public administration (section O) rated this aspect significantly lower (MW, Avg = 0.22 vs. Avg = 0.56, NO = 15, NOthers = 190, p = 0.020), possibly due to less direct exposure to noise-generating activities. The energy sector (section D) placed significantly higher importance than others on legal compliance indicators (MW, Avg = 0.80 vs. Avg = 0.58, ND = 11, NOthers = 182, p = 0.006), which may reflect the strict regulations governing environmental and safety standards in the energy industry. Conversely, the monitoring of packaging indicators was rated much lower in the water supply, sewerage, waste management, and remediation activities sector (section E) (MW, Avg = 0.37 vs. Avg = 0.66, NE = 33, NOthers = 169, p = 0.038), where packaging is not a primary issue. We note that some of these specific aspect-level comparisons rely on narrow subgroups down to single-digit observations (e.g., NF = 7, ND = 11). These findings must therefore be treated with caution as descriptive anomalies within the sample cluster rather than predictable industry dynamics.
Smaller organizations (fewer than ten employees) placed less importance on monitoring of environmental audit indicators (KW, χ2(3) = 21, p < 0.001), which may be related to limited resources or capacity.
Organizations located in Poland and Spain reported higher average environmental audit monitoring importance (MW, Avg = 0.76 vs. Avg = 0.65, NPoland = 22, NOthers = 222, p < 0.001; MW, Avg = 0.84 vs. Avg = 0.62, NSpain = 46, NOthers = 198, p = 0.049), while organizations located in Germany reported lower scores (MW, Avg = 0.56 vs. Avg = 0.71, NGermany = 75, NOthers = 169, p = 0.001). The emphasis on legal compliance indicators was also higher among organizations located in Poland (MW, Avg = 0.85 vs. Avg = 0.56, NPoland = 22, NOthers = 243, p < 0.001) compared to those located in Austria (MW, Avg = 0.48 vs. Avg = 0.60, NAustria = 24, NOthers = 241, p = 0.002) and Italy (MW, Avg = 0.48 vs. Avg = 0.62, NItaly = 65, NOthers = 200, p = 0.015). These aggregate variations may be associated with differences in national regulatory pressures, institutional context, cultural attitudes towards compliance, or resource availability and warrant further investigation.
4.3.3. Overall Results Achievement Rate
The average percentage of self-reported achieved improvements across all aspects by EMAS-registered organizations was 29.3%, indicating a moderate level of reported achievement.
In contrast with previous preliminary studies [45,46], a seemingly paradoxical pattern appears in the data, with direct implications for our hypothesis testing. Across all environmental aspects combined, the correlation between overall monitoring importance and overall self-reported achievement was weak but significantly negative (KT, τ = −0.238, p < 0.001). Consequently, Hypothesis 2 is contradicted at the aggregate organizational level.
However, when examined aspect by aspect (Section 4.3.4, Figure 5), higher monitoring importance was generally associated with higher achievement for specific indicators (e.g., energy, waste, water). Thus, Hypothesis 2 is partially supported at the aspect-by-aspect level, where higher monitoring emphasis co-occurs with higher reported achievement for these specific operational areas.
Therefore, Hypothesis 2 cannot be broadly accepted without qualification; its interpretation depends entirely on the level of analytical aggregation. One possible descriptive interpretation consistent with these patterns points to a mechanism of reverse causality: organizations facing more complex environmental challenges or higher environmental risk exposure may monitor their processes more intensively precisely because their achievement levels are lower or structurally harder to improve. Under this interpretation, monitoring importance would reflect an organization’s underlying risk profile and operational vulnerabilities rather than immediate management effectiveness. This dynamic would produce a negative aggregate correlation while allowing positive aspect-level correlations to coexist. While the present cross-sectional data cannot definitively adjudicate between this reverse-causality interpretation and alternative explanations (e.g., measurement artifacts, non-linear relationships), it suggests that monitoring intensity is often mobilized as a reactive diagnostic tool for difficult areas. Therefore, no single directional claim about monitoring effectiveness is made from these patterns. Instead, we report the observed associations as they appear and note their inconsistency as a descriptive finding that warrants further investigation.
Conversely, a weak but significant positive correlation was found between the importance placed on environmental goals and the overall percentage of achieved results (KT, τ = 0.173, p = 0.002). This result is consistent with earlier findings indicating a positive, albeit weak, association between goal importance and reported achievement outcomes. Sample characteristics were also associated with reported outcomes. Organizations located in Poland reported higher achievement rates (MW, Mdn = 0.45 vs. Mdn = 0.18, NPoland = 11, NOthers = 160, p = 0.023). However, given the small sample size (NPoland = 11), this localized finding remains tentative and requires larger-scale verification.
Organizations that perceived themselves as more environmentally friendly than competitors (KW, χ2(2) = 7, p = 0.033) also reported a higher achievement rate.
4.3.4. Resulting Achievement Rate of the Different Environmental Aspects
Achievement rates varied widely across specific environmental aspects (Figure 5). Total energy consumption had the highest achievement rate at 59%, followed by waste generation at 52% and energy consumed from renewable sources at 47%. These aspects may be more straightforward to measure and manage, and they also offer clear financial incentives, such as cost savings. In contrast, the lowest achievement rates were observed in noise reduction, supplier-related indicators, and the cost of implementing environmental solutions, each with just 12% reported achievement. This pattern indicates higher reported achievement in areas that are more directly measurable and operationally actionable, such as energy consumption and waste generation. This pattern aligns with a study analyzing ISO 14001 implementation in Denmark [47], which reported similar tendencies. In contrast, noise control, supplier engagement, and cost-related factors may require cross-departmental coordination, long-term investments, or engagement with external partners, making them more difficult to address.
The data also indicates an association between monitoring importance and reported results achievement. Organizations that reported achieving results in specific areas tend to assign higher importance to monitoring those aspects. For example, eliminating harmful substances from waste (MW, Avg = 0.92 vs. Avg = 0.47, NYes = 3, NNo = 140, p = 0.010), wastewater volume (MW, Avg = 0.85 vs. Avg = 0.59, NYes = 5, NNo = 127, p = 0.046), reuse of materials (MW, Avg = 0.88 vs. Avg = 0.51, NYes = 4, NNo = 139, p = 0.028), and compliance with legal requirements (MW, Avg = 0.91 vs. Avg = 0.59, NYes = 8, NNo = 132, p = 0.005). Given the severe sample imbalance and the minimal number of observations in the achievement groups (NYes to ), these specific statistical comparisons are highly fragile and should be interpreted with caution.
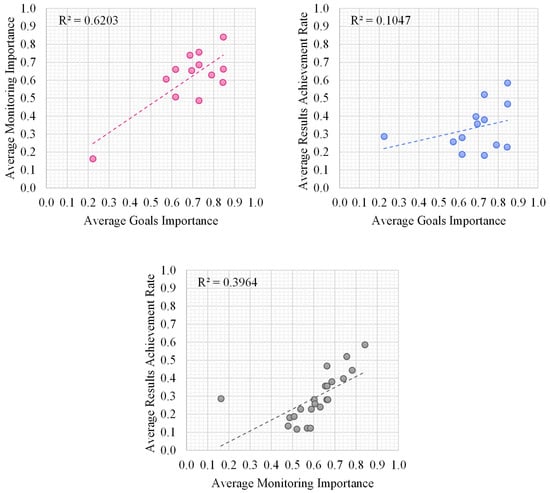
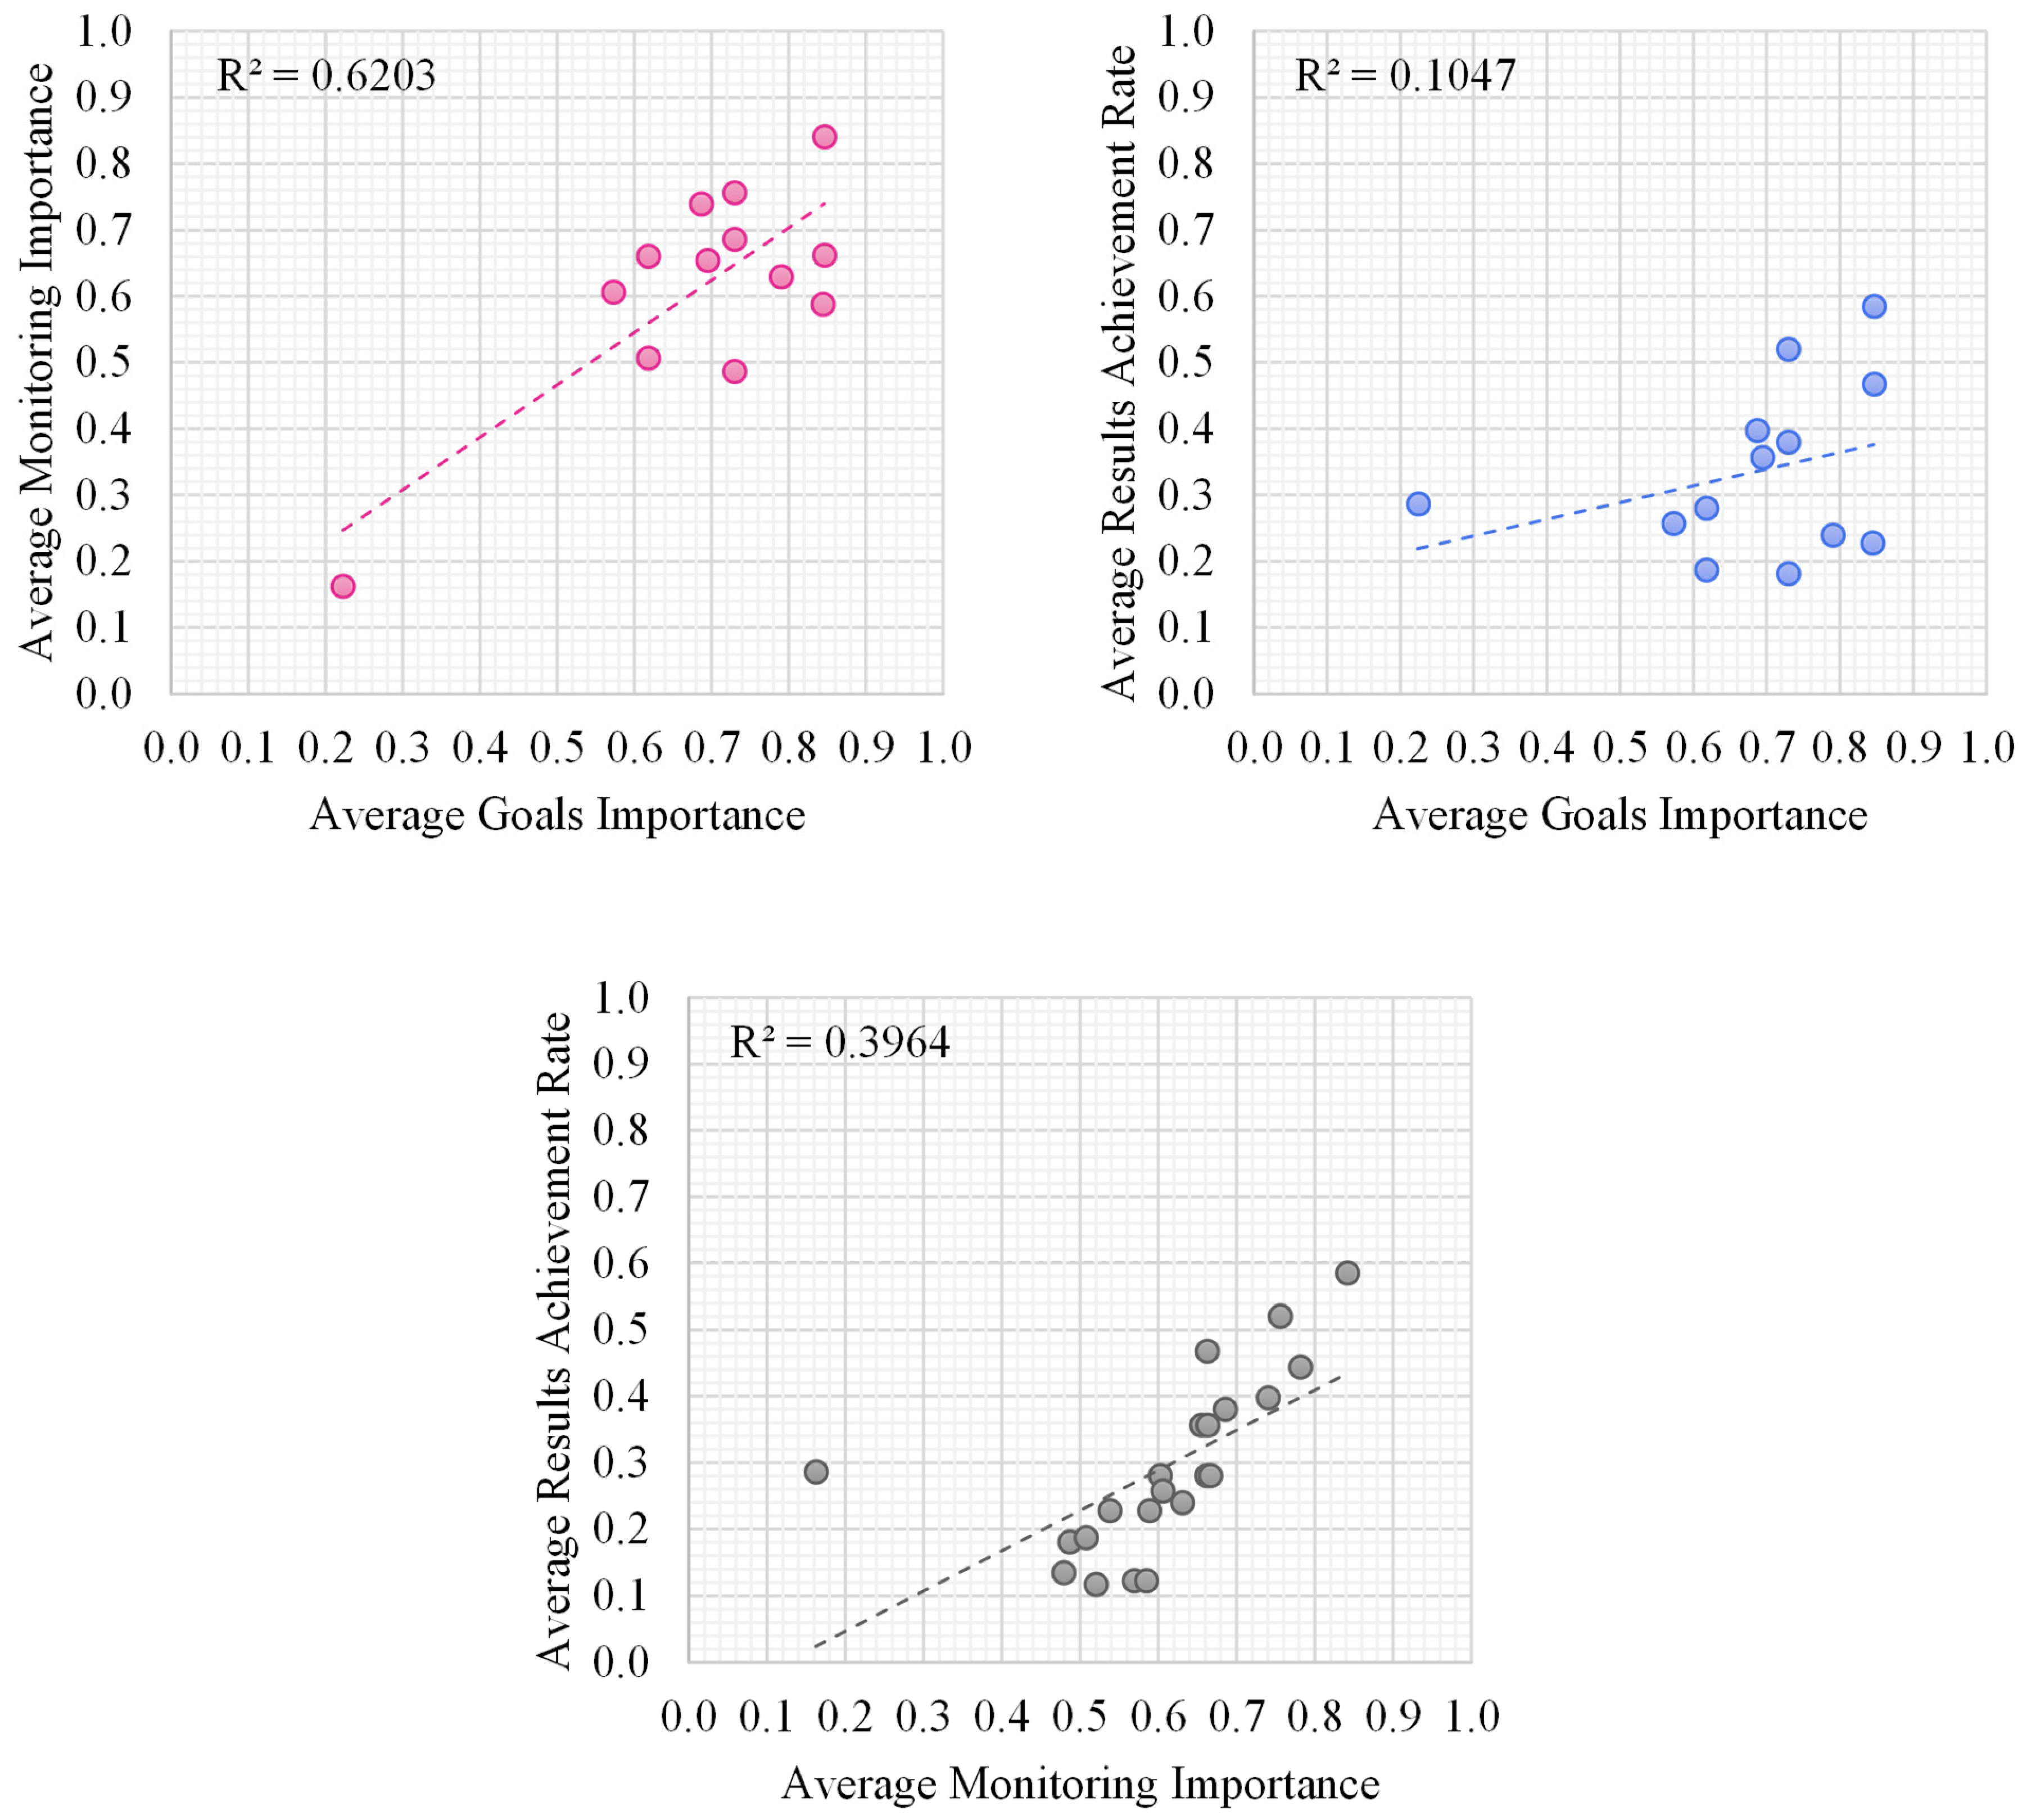
Similarly, the importance placed on environmental goals was positively correlated with achievement of results across almost all aspects, with detailed results reported in a publicly available repository [44]. An exception was noted for renewable energy consumption, where goal importance was not significantly associated with reported results, highlighting a potential area for further investigation and improvement. Overall, these findings indicate that higher importance assigned to monitoring and environmental goals is associated with higher achievement across several environmental outcomes. The relationship between average goal importance, average monitoring importance, and average results achievement rate for the various aspects analyzed in the study is visualized in Figure 6.
Figure 6.
Scatter plots showing relationships between aspect-level averages of goal importance, monitoring importance, and achievement rates. Points represent sample-wide means for distinct environmental aspects, paired with a linear trend line and its coefficient of determination (R2). The unit of analysis is the aggregated environmental aspect, not individual organizations. These macro-level trends should not be used to infer individual firm behavior.
The analysis of results achievement also revealed that organizational characteristics were associated with variation across several aspects. A detailed report of significant findings is reported in a publicly available repository [44]. Organizations in the energy sector (section D) reported lower achievement rates for reducing total energy consumption (MW, Avg = 0.44 vs. Avg = 0.60, ND = 9, NOthers = 126, p = 0.028) and renewable energy consumption (MW, Avg = 0.22 vs. Avg = 0.49, ND = 9, NOthers = 126, p < 0.001), which may indicate difficulties in transitioning away from traditional energy sources. Small organizations, particularly those with up to 10 employees, reported higher achievement rates in several areas, including environmental audits (MW, Avg = 0.60 vs. Avg = 0.35, NU10 = 5, NOthers = 166, p = 0.005), environmental training (MW, Avg = 0.80 vs. Avg = 0.43, NU10 = 5, NOthers = 166, p = 0.001), and achieving environmental objectives (MW, Avg = 0.60 vs. Avg = 0.23, NU10 = 5, NOthers = 166, p = 0.001). This pattern may be associated with more streamlined decision-making and greater flexibility in smaller organizations [48], although the small subgroup size means that this interpretation should be treated with caution. Moreover, larger and more structured organizations might already have more easily implementable actions in place, which could limit their progress in these areas.
Regarding monitoring through environmental indicators, some results showed substantial variation across the sample. Organizations located in Poland, for example, reported the highest average achievement rate within the sample in indicators on the status of corrective and preventive actions (MW, Avg = 0.82 vs. Avg = 0.19, NPoland = 11, NOthers = 160, p = 0.045), while Portuguese organizations showed significantly lower rates (MW, Avg = 0.00 vs. Avg = 0.23, NPortugal = 3, NOthers = 168, p = 0.002). Regarding biodiversity, public administration (section O) reported a significantly higher average achievement rate within the responding organizations (MW, Avg = 0.56 vs. Avg = 0.23, NO = 9, NOthers = 126, p = 0.004) than the water supply, sewerage, waste management, and remediation activities sector (section E) (MW, Avg = 0.00 vs. Avg = 0.29, NE = 17, NOthers = 118, p = 0.009). These aggregate variations may be associated with differences in regulatory pressures, institutional contexts, and resource availability; however, the present study does not allow for systematic testing of these mechanisms.
5. Limitations
While the study offers valuable insights into the environmental practices of EMAS-registered organizations across Europe, several limitations must be acknowledged.
First, the sample distribution is not fully representative of the macro EMAS population. Polish organizations, large enterprises, and long-standing EMAS adopters are overrepresented, while certain European countries and NACE sectors are underrepresented or absent. Because no statistical weighting or sensitivity analysis was applied to correct these imbalances, this institutional profile may inherently skew the data toward organizations with more mature goal-setting frameworks and highly developed monitoring practices. These systemic biases limit the immediate generalizability of the findings to smaller, newly registered, or geographically distinct EMAS entities.
Second, there were limitations in survey interpretation. The negative association between overall monitoring importance and overall achievement rate contrasts with the positive relationship observed for specific results. Further research is required to clarify these dynamics.
Third, the analysis revealed variations in performance by country and sector, particularly in aspects such as legal compliance and environmental auditing. These aggregate differences may be associated with contextual factors such as regulatory pressure, organizational culture, or resource availability, which were not directly measured in this study. Therefore, the findings should not be interpreted as deterministic characteristics of individual organizations. Acknowledging these variations opens opportunities for future research to explore underlying factors such as cultural, economic, or regulatory environments.
Fourth, the study does not employ multivariate modeling to control for potential confounding variables. Consequently, observed group differences may reflect underlying structural characteristics rather than independent country or sector effects. Future research could apply regression-based or multilevel modeling approaches to disentangle these relationships. No formal sensitivity analysis was conducted to test whether the negative association between overall monitoring importance and overall reported achievement persists under alternative operationalizations of the variables.
Fifth, while the use of a single self-reported survey instrument may introduce common method bias, no formal statistical test was conducted to assess its magnitude. Therefore, common method bias cannot be excluded. Future research could benefit from incorporating external or objective performance data.
Sixth, causal interpretation is not warranted. All analyses are cross-sectional and correlational. The positive association between goal importance and self-reported achievement may reflect reverse causality (high achievement causing perceived importance) or omitted variables (e.g., general management quality). No claims of directionality or causality are made.
Seventh, country and sector comparisons reflect sample aggregates only. The observed differences between countries or sectors do not imply that organizational behavior is determined by these macro categories. Without multilevel modeling or organizational-level controls, these comparisons should not be interpreted as national or sectoral effects.
Lastly, self-reported achievement may diverge from objective performance. Social desirability bias, overconfidence, and the better-than-average effect (observed in this sample) could inflate reported achievement. No objective validation (e.g., against EMAS environmental statements) was carried out. Hence, the term “achievement” throughout this paper refers strictly to perceived, self-reported achievement.
6. Conclusions
This study offers a detailed descriptive analysis of environmental goal prioritization, monitoring practices, and self-reported achievement outcomes among EU organizations registered in EMAS. It contributes descriptive evidence on patterns that have received limited prior attention.
The results highlight that EMAS-registered organizations generally place considerable importance on environmental goals, with prioritization levels varying by sector and country. Notably, organizations in the electricity, gas, steam, and air conditioning supply sector, as well as organizations located in Spain, reported, on average, higher importance scores within the sample. The observed positive association between goal prioritization and reported goal achievement is consistent with Hypothesis 1 and aligns with the expected relationship between structured goal-setting processes and self-reported achievement within environmental management systems.
Furthermore, the study provides new insights into the role of performance indicators within environmental management systems. While the importance attributed to monitoring was positively associated with the importance of environmental goals, the relationship between monitoring importance and achieved environmental results proved to be more complex. In particular, higher monitoring importance was not consistently associated with higher overall achievement rates, indicating that higher monitoring intensity is not consistently associated with higher reported environmental outcomes. These findings highlight the need to distinguish between the role of monitoring as a management practice and reported achievement outcomes.
Despite overall positive trends, specific environmental aspects, such as noise reduction and supplier-related self-reported environmental performance, and tracking the cost of environmental solutions remain challenging. These areas showed lower achievement rates, which may indicate potential areas for targeted interventions and more tailored sector-specific strategies. The findings are consistent with the need for a more nuanced approach to environmental management, recognizing that contextual factors such as industry sector, organizational size, and regulatory environment may be associated with reported outcomes.
For policymakers and organizations, these findings illustrate that self-reported priorities and achievement vary by sector and country within the responding sample. Whether this variation implies a need for tailored policies depends on replication with objective performance data and causal identification strategies. The observed descriptive associations suggest that future research should examine whether, and under what organizational conditions, structured goal-setting and monitoring practices contribute to perceived or objectively verified EMAS effectiveness, particularly in light of upcoming European Sustainability Reporting Standards (ESRS) requirements. EMAS-registered organizations, due to their existing structures, may be well positioned to align with ESRS. However, further research is needed to explore how this alignment can be leveraged in practice.
While the study provides descriptive empirical patterns, its limitations are substantial. The cross-sectional, self-reported design precludes causal inference. The sample is not fully representative. No multivariate controls were applied. Therefore, the results should be used primarily for hypothesis generation. Longitudinal, quasi-experimental, or objectively verified designs are required to establish whether the observed associations reflect causal relationships.
Overall, the findings suggest that the prioritization of environmental goals is positively associated with reported achievement outcomes, although the strength of this relationship varies across contexts and should be interpreted with caution.
Author Contributions
Conceptualization, S.C., A.M.-F. and B.P.; methodology, S.C., A.M.-F. and B.P.; validation, B.P.; formal analysis, S.C.; investigation, S.C. and B.P.; resources, A.M.-F. and B.P.; data curation, S.C. and B.P.; writing—original draft preparation, S.C. and B.P.; writing—review and editing, C.C. and B.P.; visualization, S.C.; supervision, C.C., S.F., A.M.-F. and B.P.; project administration, A.M.-F. and B.P.; funding acquisition, A.M.-F. and B.P. All authors have read and agreed to the published version of the manuscript.
Funding
This research has been supported by the National Science Centre (Poland) within the framework of project No. 2021/41/B/HS4/02391 titled Environmental effectiveness of the organization and its determinants.
Institutional Review Board Statement
Ethical review and approval were waived for this study as per applicable institutional policy and EU and national legislation, including Regulation (EU) 2016/679 (General Data Protection Regulation, GDPR), as the study did not involve human subjects and was based exclusively on anonymous, non-personal organizational data.
Informed Consent Statement
Informed consent for participation was obtained from all subjects involved in the study.
Data Availability Statement
The dataset and statistical results underlying this study are publicly available in a data repository [44].
Conflicts of Interest
The authors declare no conflict of interest.
References
- Baah, C.; Jin, Z.; Tang, L. Organizational and Regulatory Stakeholder Pressures Friends or Foes to Green Logistics Practices and Financial Performance: Investigating Corporate Reputation as a Missing Link. J. Clean. Prod. 2020, 247, 119125. [Google Scholar] [CrossRef] [Scilit]
- Phan, T.N.; Baird, K. The Comprehensiveness of Environmental Management Systems: The Influence of Institutional Pressures and the Impact on Environmental Performance. J. Environ. Manag. 2015, 160, 45–56. [Google Scholar] [CrossRef] [Scilit] [PubMed]
- Bocken, N.M.P.; Short, S.W.; Rana, P.; Evans, S. A Literature and Practice Review to Develop Sustainable Business Model Archetypes. J. Clean. Prod. 2014, 65, 42–56. [Google Scholar] [CrossRef] [Scilit]
- European Commission EMAS Register. Available online: https://webgate.ec.europa.eu/emas2/public/registration/list (accessed on 3 August 2024).
- Matuszak-Flejszman, A.; Paliwoda, B. Contrasting Environmental Priorities of EMAS and Non-EMAS Organizations—A Comparative Factorial Analysis of 847 EU Cases. Sustainability 2026, 18, 6456. [Google Scholar] [CrossRef] [Scilit]
- European Commission. Commission Adopts Revised Sustainability Reporting Standards; Directorate-General for Financial Stability, Financial Services and Capital Markets Union: Brussel, Belgium, 2026. [Google Scholar]
- EFRAG. Amended ESRS Package and Double Materiality Implementation Guidance; European Financial Reporting Advisory Group: Brussels, Belgium, 2026. [Google Scholar]
- Adjanor-Doku, C.; Ellis, F.Y.; Affum-Osei, E. Environmental performance: A systematic review of literature and directions for future studies. Corp. Soc. Responsib. Environ. Manag. 2025, 32, 71–87. [Google Scholar] [CrossRef] [Scilit]
- Goossens, Y.; Schmidt, T.G. Mind the method! A systematic literature review of the methodological choices used to assess the environmental impacts of diets. Clean. Environ. Syst. 2025, 18, 100289. [Google Scholar] [CrossRef] [Scilit]
- Lyytimäki, J.; Tapio, P.; Varho, V.; Söderman, T. The use, non-use and misuse of indicators in sustainability assessment and communication. Int. J. Sustain. Dev. World Ecol. 2013, 20, 385–393. [Google Scholar] [CrossRef] [Scilit]
- Boiral, O.; Guillaumie, L.; Heras-Saizarbitoria, I.; Tayo Tene, C.V. Adoption and Outcomes of ISO 14001: A Systematic Review. Int. J. Manag. Rev. 2018, 20, 411–432. [Google Scholar] [CrossRef] [Scilit]
- García-Álvarez, M.; de Junguitu, A.D. Shedding Light on the Motivations and Performance of the Eco-Management and Audit Scheme (EMAS). Environ. Impact Assess. Rev. 2023, 99, 107045. [Google Scholar] [CrossRef] [Scilit]
- Nawrocka, D.; Parker, T. Finding the Connection: Environmental Management Systems and Environmental Performance. J. Clean. Prod. 2009, 17, 601–607. [Google Scholar] [CrossRef] [Scilit]
- Tourais, P.; Videira, N. Why, How and What Do Organizations Achieve with the Implementation of Environmental Management Systems?—Lessons from a Comprehensive Review on the Eco-Management and Audit Scheme. Sustainability 2016, 8, 283. [Google Scholar] [CrossRef] [Scilit]
- Heras-Saizarbitoria, I.; Boiral, O.; Díaz de Junguitu, A. Environmental Management Certification and Environmental Performance: Greening or Greenwashing? Bus. Strategy Environ. 2020, 29, 2829–2841. [Google Scholar] [CrossRef] [Scilit]
- Castelluccio, S.; Comoglio, C.; Fiore, S. Environmental Performance Reporting and Assessment of the Biodegradable Waste Treatment Plants Registered to EMAS in Italy. Sustainability 2022, 14, 7438. [Google Scholar] [CrossRef] [Scilit]
- Daddi, T.; Testa, F.; Frey, M.; Iraldo, F. Exploring the Link between Institutional Pressures and Environmental Management Systems Effectiveness: An Empirical Study. J. Environ. Manag. 2016, 183, 647–656. [Google Scholar] [CrossRef] [Scilit] [PubMed]
- Marrucci, L.; Daddi, T. The Contribution of the Eco-Management and Audit Scheme to the Environmental Performance of Manufacturing Organisations. Bus. Strategy Environ. 2022, 31, 1347–1357. [Google Scholar] [CrossRef] [Scilit]
- Merli, R.; Preziosi, M. The EMAS Impasse: Factors Influencing Italian Organizations to Withdraw or Renew the Registration. J. Clean. Prod. 2018, 172, 4532–4543. [Google Scholar] [CrossRef] [Scilit]
- Testa, F.; Iraldo, F.; Daddi, T. The Effectiveness of EMAS as a Management Tool: A Key Role for the Internalization of Environmental Practices. Organ. Environ. 2018, 31, 48–69. [Google Scholar] [CrossRef] [Scilit]
- Kube, R.; Von Graevenitz, K.; Löschel, A.; Massier, P. Do Voluntary Environmental Programs Reduce Emissions? EMAS in the German Manufacturing Sector. Energy Econ. 2019, 84, 104558. [Google Scholar] [CrossRef] [Scilit]
- Džubáková, M. Adoption of Voluntary Environmental Tools in Slovak Republic—Focused on ISO 14001 and EMAS. Int. J. Learn. Change 2019, 11, 222. [Google Scholar] [CrossRef] [Scilit]
- Petrová, E.; Štofa, T.; Šoltés, M. Exploration of the Factors That Influence the Implementation of Environmental Management Systems—The Case of Slovakia. Economies 2021, 9, 68. [Google Scholar] [CrossRef] [Scilit]
- Matuszak-Flejszman, A.; Szyszka, B.; Jóhannsdóttir, L. Effectiveness of EMAS: A Case Study of Polish Organisations Registered under EMAS. Environ. Impact Assess. Rev. 2019, 74, 86–94. [Google Scholar] [CrossRef] [Scilit]
- Szyszka, B.; Matuszak-Flejszman, A. EMAS in Poland: Performance, Effectiveness, and Future Perspectives. Pol. J. Environ. Stud. 2017, 26, 809–817. [Google Scholar] [CrossRef] [Scilit] [PubMed]
- Stasiškienė, Ž.; Anne, O.; Aleknavičiūtė, D.; Paulauskienė, T.; Viederytė, R.; Abele, L. The Analysis of EMAS Efficiency in Industrial Companies: A Case of Lithuania. Environ. Res. Eng. Manag. 2020, 76, 111–117. [Google Scholar] [CrossRef] [Scilit]
- Comoglio, C.; Castelluccio, S.; Scarrone, A.; Onofrio, M.; Fiore, S. Assessing the Environmental Performances of Waste-to-Energy Plants: The Case-Study of the EMAS-Registered Waste Incinerators in Italy. Waste Manag. 2022, 153, 209–218. [Google Scholar] [CrossRef] [Scilit] [PubMed]
- Erauskin-Tolosa, A.; Zubeltzu-Jaka, E.; Heras-Saizarbitoria, I.; Boiral, O. ISO 14001, EMAS and Environmental Performance: A Meta-Analysis. Bus. Strategy Environ. 2020, 29, 1145–1159. [Google Scholar] [CrossRef] [Scilit]
- Nguyen, Q.A.; Hens, L. Environmental Performance of the Cement Industry in Vietnam: The Influence of ISO 14001 Certification. J. Clean. Prod. 2015, 96, 362–378. [Google Scholar] [CrossRef] [Scilit]
- Ikram, M.; Zhou, P.; Shah, S.A.A.; Liu, G.Q. Do Environmental Management Systems Help Improve Corporate Sustainable Development? Evidence from Manufacturing Companies in Pakistan. J. Clean. Prod. 2019, 226, 628–641. [Google Scholar] [CrossRef] [Scilit]
- Mazzi, A.; Toniolo, S.; Mason, M.; Aguiari, F.; Scipioni, A. What Are the Benefits and Difficulties in Adopting an Environmental Management System? The Opinion of Italian Organizations. J. Clean. Prod. 2016, 139, 873–885. [Google Scholar] [CrossRef] [Scilit]
- McGuire, W. The Effect of ISO 14001 on Environmental Regulatory Compliance in China. Ecol. Econ. 2014, 105, 254–264. [Google Scholar] [CrossRef] [Scilit]
- Potoski, M.; Prakash, A. Do Voluntary Programs Reduce Pollution? Examining ISO 14001′s Effectiveness across Countries. Policy Stud. J. 2013, 41, 273–294. [Google Scholar] [CrossRef] [Scilit]
- Zobel, T. The Impact of ISO 14001 on Corporate Environmental Performance: A Study of Swedish Manufacturing Firms. J. Environ. Plan. Manag. 2016, 59, 587–606. [Google Scholar] [CrossRef] [Scilit]
- Comoglio, C.; Castelluccio, S.; Fiore, S. Environmental Reporting in the Hydropower Sector: Analysis of EMAS Registered Hydropower Companies in Italy. Front. Environ. Sci. 2023, 11, 1178037. [Google Scholar] [CrossRef] [Scilit]
- Castelluccio, S.; Fiore, S.; Comoglio, C. Environmental Reporting in Italian Thermal Power Plants: Insights from a Comprehensive Analysis of EMAS Environmental Statements. J. Environ. Manag. 2024, 359, 121035. [Google Scholar] [CrossRef] [Scilit] [PubMed]
- Matukhno, O.; Stanytsina, V.; Dobrovolska, O.; Artemchuk, V. An Exploratory Protocol for Sustainability-Oriented Cross-Index Assessment of National Climate Policy Effectiveness. Sustainability 2026, 18, 3444. [Google Scholar] [CrossRef] [Scilit]
- Tessitore, S.; Testa, F.; Iraldo, F.; Daddi, T. Isomorphic or Dissimilar Implementation among Environmental Management Scheme Adopters? Empirical Evidence from the European Context. Bus. Strategy Dev. 2019, 2, 290–302. [Google Scholar] [CrossRef] [Scilit]
- Haffke, L. Biases in Risk Assessments under EU Anti-Money Laundering Law—Evidence of the Better-than-Average Effect from Germany. J. Money Laund. Control 2022, 26, 751–766. [Google Scholar] [CrossRef] [Scilit]
- Piwowar-Sulej, K. Pro-Environmental Organizational Culture: Its Essence and a Concept for Its Operationalization. Sustainability 2020, 12, 4197. [Google Scholar] [CrossRef] [Scilit]
- Tang, Z.; Powell, B.C.; Marino, L.; Tang, J.; Dickson, P. The Impact of Organizational Goal Setting on the Industrial Munificence-Goal Attainment Relationship. Int. J. Bus. Manag. 2009, 3, 107. [Google Scholar] [CrossRef] [Scilit]
- Derchi, G.-B.; Davila, A.; Oyon, D. Green Incentives for Environmental Goals. Manag. Account. Res. 2023, 59, 100830. [Google Scholar] [CrossRef] [Scilit]
- Campos, L.M.S.; de Melo Heizen, D.A.; Verdinelli, M.A.; Cauchick Miguel, P.A. Environmental Performance Indicators: A Study on ISO 14001 Certified Companies. J. Clean. Prod. 2015, 99, 286–296. [Google Scholar] [CrossRef] [Scilit]
- Paliwoda, B.; Matuszak-Flejszman, A.; Castelluccio, S.; Comoglio, C.; Fiore, S. Environmental Performance of European Union EMAS-Registered Organizations; RepOD: 2024. Available online: https://repod.icm.edu.pl/dataset.xhtml?persistentId=doi:10.18150/YLKLW0 (accessed on 1 July 2026).
- De Giovanni, P.; Esposito Vinzi, V. The Benefits of a Monitoring Strategy for Firms Subject to the Emissions Trading System. Transp. Res. Part D Transp. Environ. 2014, 33, 220–233. [Google Scholar] [CrossRef] [Scilit]
- Green, K.; Zelbst, P.J.; Bhadauria, V.; Meacham, J. Do Environmental Collaboration and Monitoring Enhance Organizational Performance? Ind. Manag. Data Syst. 2012, 112, 186–205. [Google Scholar] [CrossRef] [Scilit]
- Mosgaard, M.A.; Bundgaard, A.M.; Kristensen, H.S. ISO 14001 Practices—A Study of Environmental Objectives in Danish Organizations. J. Clean. Prod. 2022, 331, 129799. [Google Scholar] [CrossRef] [Scilit]
- Sen, S.; Savitskie, K.; Mahto, R.V.; Kumar, S.; Khanin, D. Strategic Flexibility in Small Firms. J. Strateg. Mark. 2023, 31, 1053–1070. [Google Scholar] [CrossRef] [Scilit]

Disclaimer/Publisher’s Note: The statements, opinions and data contained in all publications are solely those of the individual author(s) and contributor(s) and not of MDPI and/or the editor(s). MDPI and/or the editor(s) disclaim responsibility for any injury to people or property resulting from any ideas, methods, instructions or products referred to in the content. |
© 2026 by the authors. Licensee MDPI, Basel, Switzerland. This article is an open access article distributed under the terms and conditions of the Creative Commons Attribution (CC BY) license.