


Abstract
Over the past few decades, South Africa has experienced recurrent drought events of varying intensity. The Musina Local Municipality is particularly vulnerable due to a semi-arid climate, erratic rainfall, and rising temperatures which collectively contribute to heightened environmental stress. This study analyzed drought spatiotemporal patterns, livelihood impacts, and associated coping strategies in Musina from 1991 to 2023. Adopting a mixed-method approach, the research integrated quantitative climate data from the Copernicus Climate Data Store with qualitative insights gathered through semi-structured questionnaires administered to local community members. Drought frequency and distribution were examined using rainfall anomalies, temperature trends, and the Standardized Precipitation Evapotranspiration Index (SPEI). With more than 15 drought events recorded between 1991 and 2023, the findings indicate that Musina experiences recurrent drought episodes including major drought events in 1991–1992 and 2015–2016, characterized by rising temperatures that intensify evapotranspiration and exacerbate water scarcity. SPEI results highlight repeated drought conditions over the study period, with over 14 identified episodes and variable recovery periods, while notably negative values during major events (1991–1992 and 2015–2016) reflect severe moisture deficits associated with elevated temperatures. These climatic shifts have significantly undermined agricultural productivity, livestock health, and household water security, thereby threatening overall livelihood stability. More than 50% of the households experienced water shortages, with 17% reporting crop losses and 17% livestock mortality. While the study identified various coping mechanisms—such as reliance on boreholes, government water aid, conservation agriculture, and livelihood diversification—community vulnerability remains high due to limited water infrastructure and ongoing climate variability. These results contribute to efforts to reduce localized drought risk by providing a detailed understanding of drought dynamics and the effectiveness of community-based adaptation strategies in Musina.
1. Introduction
Drought is a chronic hydroclimatic hazard characterized by prolonged deficits in water availability that manifests through rainfall shortages and increased evapotranspiration due to increased temperatures [1,2,3,4]. Drought is not merely a short-term climatic anomaly but a complex, slow-onset environmental hazard that affects hydrological systems, agricultural productivity, and ecosystem stability [2,3]. Globally, drought is recognized as one of the most costly and far-reaching natural hazards affecting food security, public health, economic development, and environmental sustainability, particularly over arid and semi-arid regions [5]. In recent decades, the frequency and duration of drought events have increased worldwide due to climate variability and anthropogenic climate change [1]. Rising global temperatures have altered the hydrological cycle, intensified evapotranspiration, and increased the likelihood that precipitation deficits will evolve into severe drought and flood conditions [6,7]. These changes have heightened drought risks in water-scarce regions where livelihoods are strongly dependent on climate-sensitive sectors such as agriculture. Drought is identified as a major driver of land degradation and rural vulnerability, especially in developing countries [5,6,8]. Climate change is expected to intensify and increase the frequency of drought in the future, thereby exposing already vulnerable populations. Hence, it is vital to study drought to monitor, predict, and mitigate its severe and far-reaching environmental and socio-economic impacts. Understanding drought is crucial for proactive planning and building community resilience.
South Africa is among the most drought-prone regions due to a lack of adaptive capacity, its highly variable rainfall regime, and strong dependence on seasonal precipitation [9]. Large-scale atmospheric circulation systems, particularly the El Niño Southern Oscillation (ENSO), Indian Ocean Dipole, subtropical high-pressure systems, and regional circulation anomalies play a critical role in shaping drought occurrence in the region [7]. El Niño episodes are frequently associated with widespread rainfall suppression over southern Africa, leading to severe agricultural and hydrological droughts as observed during 1991–1992, 2015–2016, and 2019 drought events [9].
The country’s average annual rainfall is approximately 495 mm, significantly lower than the global average of 860 mm [9]. This low and uneven rainfall distribution makes South Africa highly vulnerable to drought, especially when rainfall patterns are disturbed by climate change or other environmental factors such as topography and ocean currents [10,11]. Limpopo Province is recognized as one of the most drought-vulnerable provinces due to its hot semi-arid climate and heavy reliance on rain-fed agriculture [7,12]. The province has experienced recurrent droughts over the past several decades, with notable events occurring during 1982–1984, 1991–1992, 2003–2004, 2015–2016, and 2017–2019 [13]. For example, during the severe drought episodes around 2017–2019, Musina Local Municipality, located in Limpopo Province, frequently experienced prolonged dry spells, erratic rainfall and high temperatures that threatened agriculture, livestock farming and household water scarcity [14,15].
For instance, the 2015–2016 drought, one of the most severe in recent history, caused significant water shortages, reduced crop yields, and increased food prices across Limpopo Province, particularly in Musina Local Municipality [7].
Understanding drought dynamics requires an integrated spatiotemporal approach that captures both long-term climatic trends and short-term variability. Advances in climate datasets, geospatial analysis, and drought indices such as the Standardized Precipitation Evapotranspiration Index (SPEI) have significantly improved the ability to assess drought frequency [13]. SPEI is valuable in semi-arid regions because it incorporates both precipitation and temperature, thereby accounting for increased evapotranspiration under warming conditions. When combined with analyses of rainfall and temperature anomalies, these approaches provide robust insights into the evolving characteristics of drought.
Notably, a study by Nembilwi [13] used the SPEI to assess the severity and frequency of drought events in some local municipalities in Limpopo Province. The study’s findings indicated a gradual increase in temperatures, rainfall deficits, and declining dam levels, particularly during strong El Niño years, and highlighted significant impacts on crop production, livestock farming, and household water availability across the province, indicating an increased occurrence of droughts. Moreover, local communities rely heavily on short-term coping strategies, such as greywater use, borehole use, and government drought relief, which are often insufficient during prolonged droughts. These findings can be generalizable for similar semi-arid areas like Musina Local Municipality.
More recent regional-scale studies [13,16] employed advanced drought indices, streamflow, and socio-economic factors, as well as trend analysis and climate projections, to examine drought intensification under climate change scenarios. These studies consistently reported increasing drought severity across South Africa, particularly in semi-arid regions, and emphasized the need for improved early warning systems, integrated water resource management, and locally tailored adaptation strategies.
Understanding the frequency and spatial distribution of droughts in Musina is essential for effective drought management and adaptation planning. While research on drought in South Africa, such as [16,17,18,19,20], primarily focus on national and provincial scales, there remains a notable gap: a limited understanding of how these phenomena manifest in specific local municipalities, such as Musina, and how local coping strategies are implemented [7]. Existing studies often overlook how drought manifests at finer spatial scales and how local communities respond to recurring drought stress. In Musina Local Municipality, empirical research has been limited to the integration of climate data analysis with household-level assessments of drought impacts and coping strategies. This study seeks to address this gap by conducting a comprehensive spatiotemporal analysis of drought occurrence in Musina Local Municipality from 1991 to 2023, using long-term rainfall and temperature data, rainfall anomalies, and the SPEI. It also examines the livelihood impacts of drought on local communities and evaluates the coping strategies employed by households and institutions to manage drought-related risks. By integrating climatic analysis with socio-economic perspectives, this study provides a holistic understanding of drought dynamics and community resilience in one of South Africa’s most drought-prone municipalities.
The findings of this research contribute to improved drought risk reduction and climate adaptation planning by offering location-specific evidence on drought trends, impacts, and coping mechanisms. Such insights are critical for informing local planning, enhancing community resilience, and supporting sustainable livelihood strategies in Musina Local Municipality and similar regions.
The aim of the study is to determine the spatiotemporal dynamics and livelihood consequences of drought and evaluate community coping strategies in the Musina Local Municipality from 1991 to 2023.
2. Materials and Methods
2.1. Musina Local Municipality
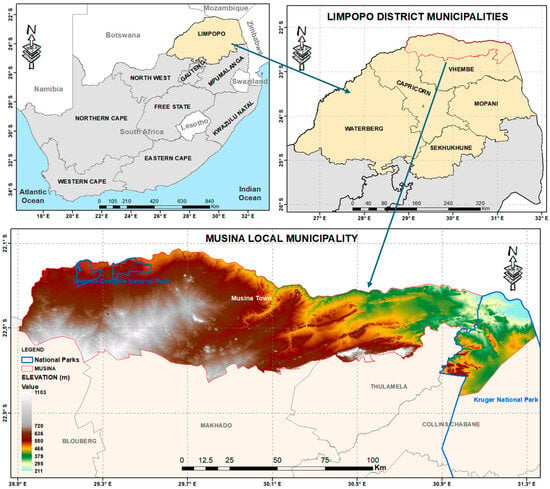
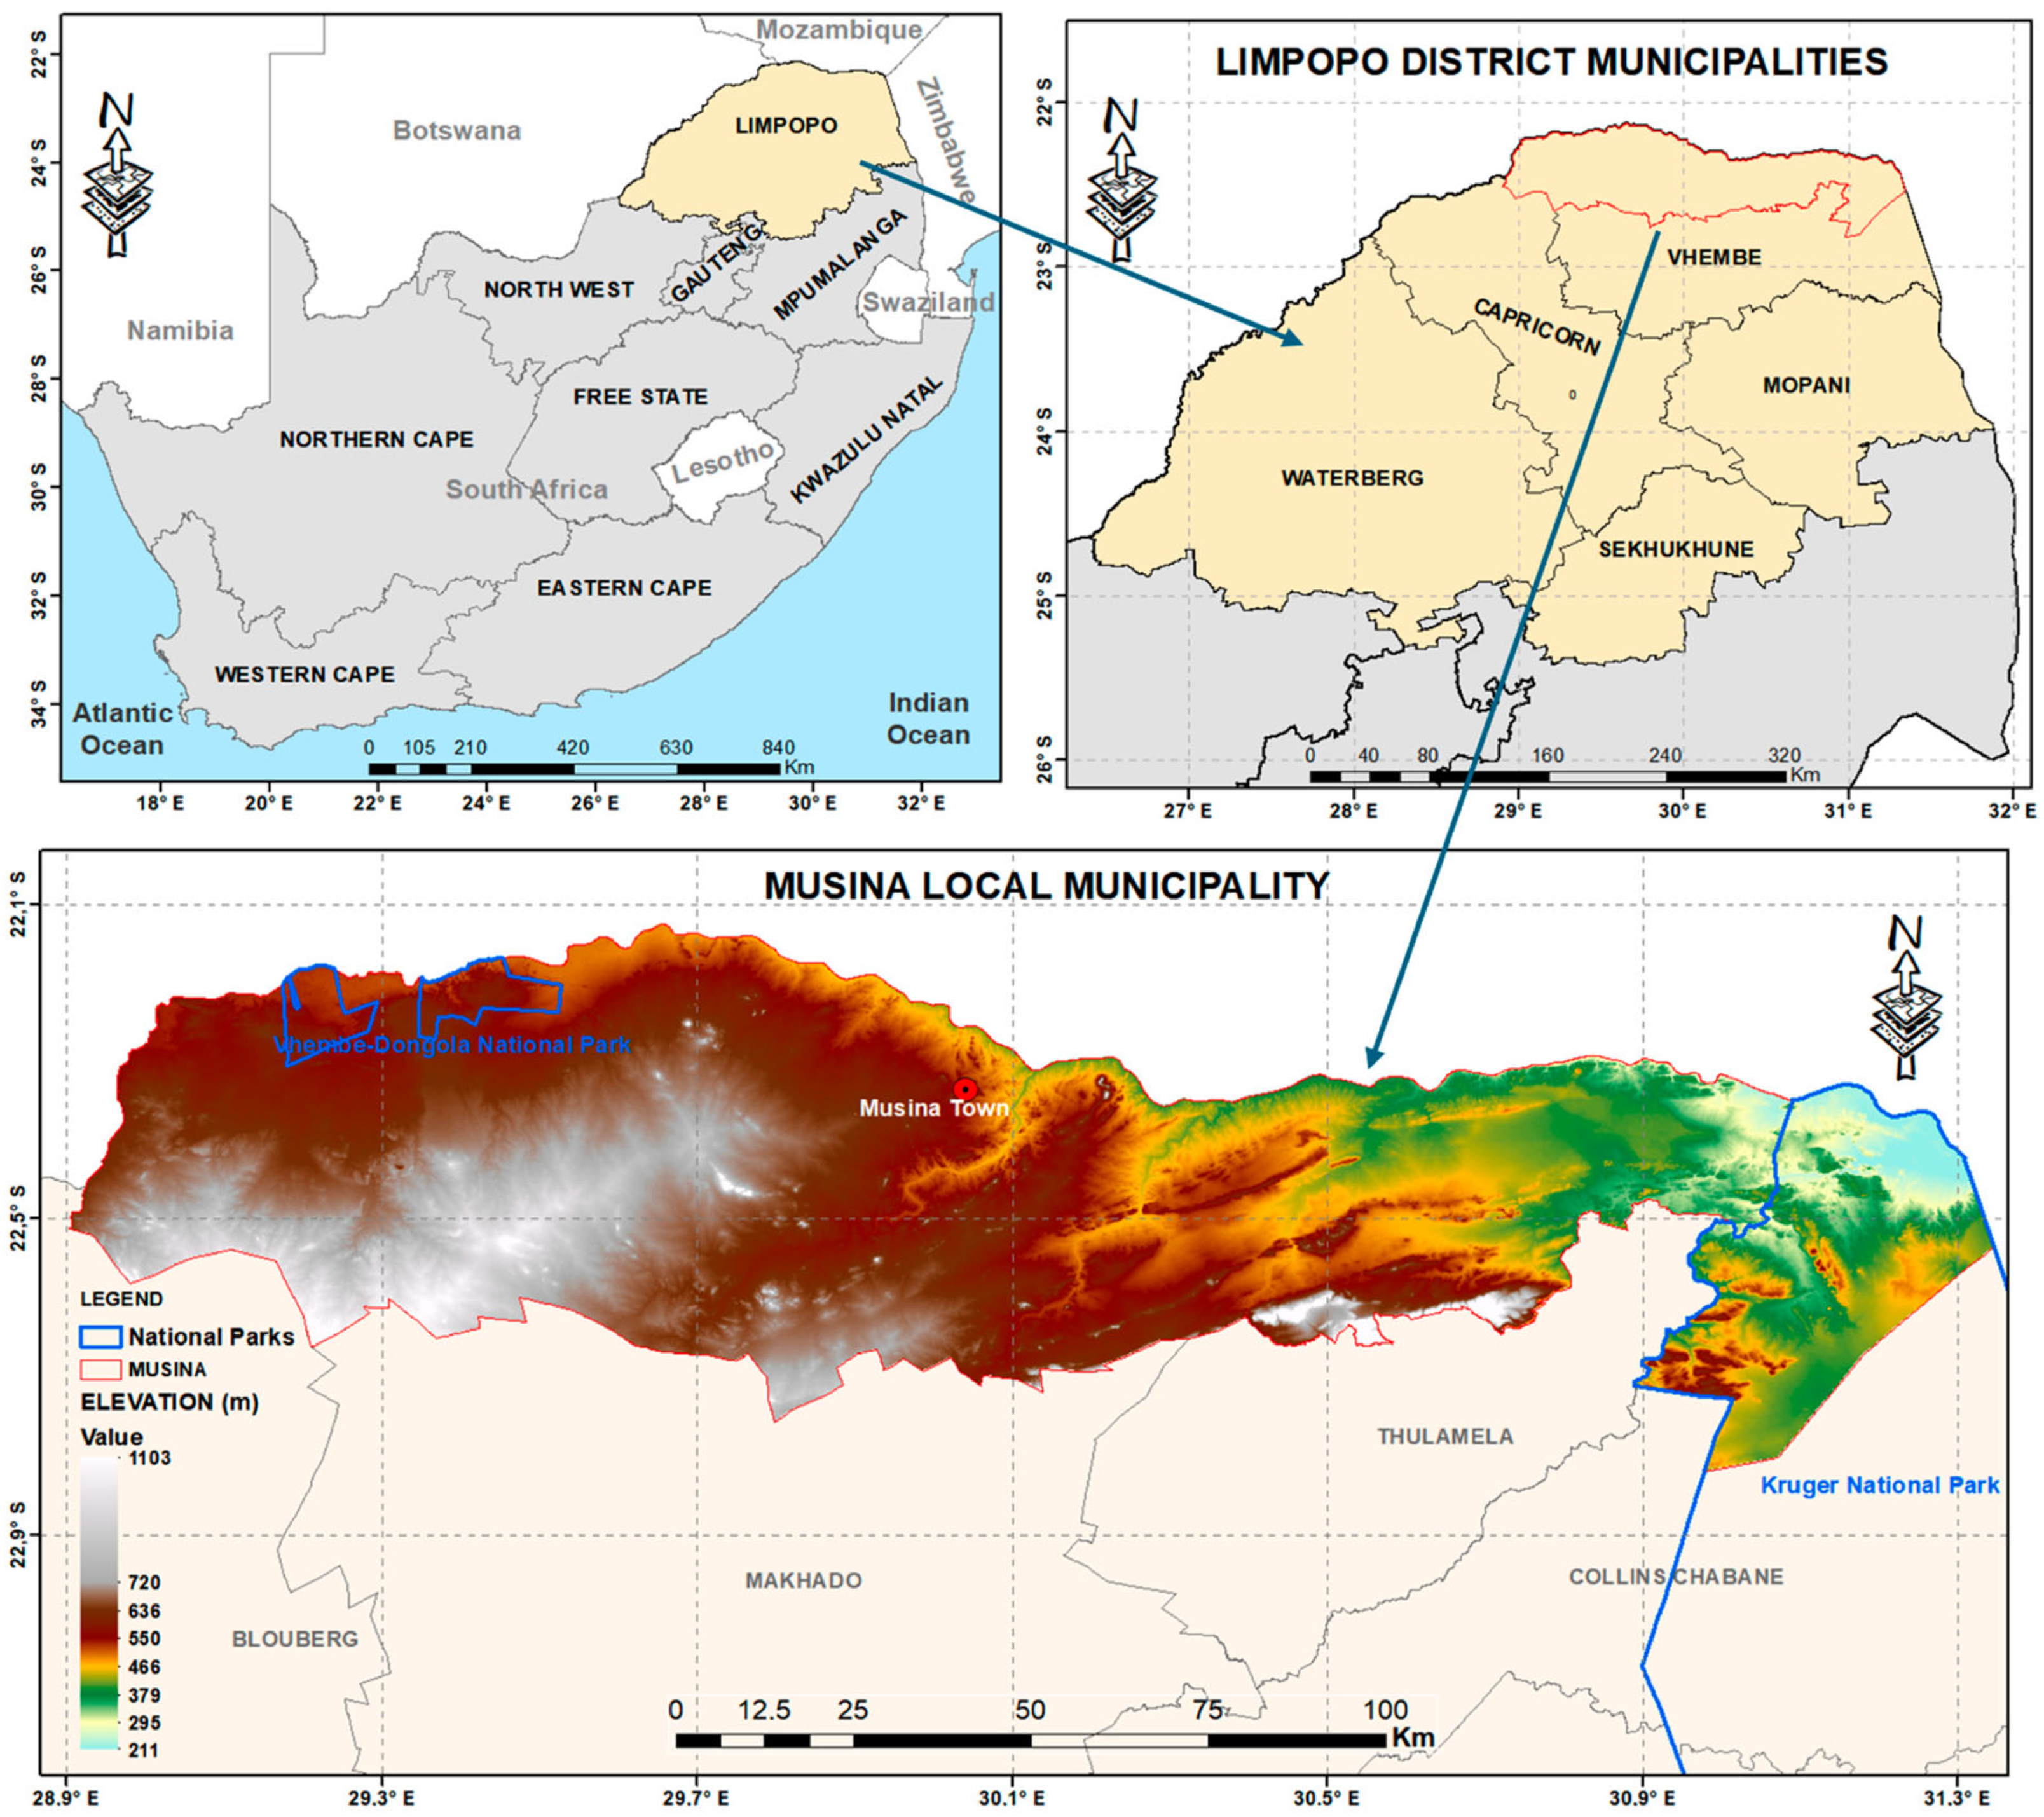
The study area is located in the northern part of Limpopo Province, in the Musina Local Municipality which borders Zimbabwe and is part of the Vhembe District (Figure 1). The municipality is predominantly rural and is characterized by a hot semi-arid (steppe) climate (Köppen climate classification BSh), with annual rainfall ranging from 250 to 400 mm, most of which occurs in summer (October–March) [21]. Musina is characterized by elevated temperatures that can rise to as high as 45 °C during summer and drop to as low as 22 °C during winter, with mean annual temperatures between 22 °C and 24 °C [22]. Musina, which is found in a hot semi-arid (BSh) climate, experiences low to moderate humidity that varies seasonally. During summer months, humidity rises slightly due to rainfall, averaging around 40% to 60%, but it can be sticky during thunderstorms or rain events. During winter, it drops significantly, often going below 40%, resulting in very dry conditions [23].
Figure 1.
Study area map of Musina Local Municipality in Vhembe District, Limpopo Province, South Africa.
According to [24], the population of Musina was approximately 132,000 in 2022. Agriculture, especially dry-land farming and livestock, is one of the key economic activities, despite the area’s limited water availability and high exposure to climate extremes. The region experiences droughts that have escalated in both frequency and intensity over the past two decades [25].
2.2. Sampling
The study employed convenience sampling, in which participants were selected based on their accessibility and ease of recruitment. Selection was influenced by factors, such as geographical proximity, availability at a given time, or willingness to take part in the study. This approach was considered appropriate because it allowed efficient access to community members directly or indirectly affected by drought within Musina Local Municipality under limited time and resource conditions [26]. Although convenience sampling enabled practical and rapid data collection, the method has limitations. As a non-probability sampling approach, it does not guarantee equal selection opportunities for all individuals and may introduce sampling bias [27,28]. Consequently, the findings may not fully represent the broader population of Musina Local Municipality. However, the approach was suitable for obtaining exploratory community-level insights into drought impacts and coping strategies in the area [27]. The target population for this study included residents in Musina who were directly or indirectly affected by drought. These groups provided diverse perspectives on how drought impacted livelihoods, food security, water availability, income levels, and overall well-being [29].
To determine the sample size for the study, an online sample-size calculator was used, with the total population of Musina Local Municipality estimated at approximately 132,000 residents in 2022. A 92% confidence level and an 8% margin of error, which are closer to the widely used 95% and 5%, respectively, were used. Using these parameters, the calculator applied the standard Cochran formula for determining sample size for proportions [27]:
where Z = 1.75 for 92% confidence level, p = 0.5 to maximize variability, and e = 0.08.
Substituting these values yields 119.63, which was rounded to 120 individuals as the final target sample size. Similar confidence levels and margins of error have been adopted in environmental and climate-related surveys in southern Africa, including vulnerability assessments conducted under resource-limited conditions [28,30,31], demonstrating the methodological acceptability of these parameters in community-based drought and livelihood research.
2.3. Rainfall and Temperature Data
The rainfall and temperature data were sourced from ERA5-Land through the Copernicus Climate Data Store (CDS) at cds.climate.copernicus.eu. The ERA5-Land provided a higher spatial resolution (9 km) and improved representation of land–atmosphere processes, which is essential for capturing local-scale climate variability in a heterogeneous, semi-arid environment such as Musina Local Municipality [6]. ERA5-Land integrates observations with a physically consistent land-surface model, yielding more reliable rainfall and temperature estimates. ERA5-Land data were selected to avoid gaps in meteorological station datasets. It combined satellite data with ground-based station measurements to provide an accurate and comprehensive record of precipitation, making it suitable for spatiotemporal drought analysis and for calculating drought indices such as the Standardized Precipitation Evapotranspiration Index, where accurate temperature-driven evapotranspiration is critical [8,32]. This made it an excellent source for areas where traditional weather station data may be sparse or unreliable, such as remote regions of Musina. The data gathered covered the period from 1991 to 2023 to maintain reliability. A minimum of 30 years was effective for climate pattern analysis [33,34]. Regular monitoring of temperature changes is vital to improving climate models and guiding planning for agricultural output and water resource management as global warming continues to threaten basic livelihoods [35,36,37]. Rainfall and temperature are the main drivers of drought, because deficits in rainfall determine the severity of meteorological drought, whilst extreme high temperatures drastically amplify evaporation rate [32]. Analyzing these variables was key to determining drought spatiotemporal patterns.
2.4. Questionnaires
Semi-structured questionnaires were designed to collect in-depth information on the impacts and coping strategies related to droughts in Musina. The semi-structured format allowed respondents to answer in their own words, yielding detailed, context-specific insights into their experiences and challenges [38]. The questionnaires were distributed to a diverse range of participants, including residents who were directly or indirectly affected by droughts. These individuals were selected using convenience sampling to ensure easy access to community members, given their availability [39]. The questionnaires included broad, semi-structured questions that encouraged respondents to describe their personal experiences with drought, the challenges they faced during drought periods, their coping mechanisms in response to drought events, and their perceptions of the long-term consequences of droughts. For example, it examined changes residents have noticed in farming, water availability, or food supply during droughts. The questionnaire was key in collecting data for both the impacts of drought on livelihoods and coping strategies employed by Musina’s residents.
2.5. Methods
2.5.1. Trend and Time-Series Trend Analysis
Trend and time-series analysis was essential for identifying long-term shifts in climate variables, such as declining rainfall or increased temperatures, which are critical indicators of climatic stress and drought intensification [40,41]. Detecting these trends provided empirical evidence of climate change and supported the understanding of how local drought conditions have evolved over time. In parallel, time-series analysis enabled the exploration of short- and long-term variability, seasonal and cyclical patterns, and anomalies in climatic conditions [16]. By decomposing rainfall and temperature data into trend, seasonal, and irregular components, the study revealed underlying patterns and the frequency of extreme events. The purpose of time-series analysis is to identify trend patterns and develop models to predict relationships of the investigated weather phenomena. Time-series analysis was used to attempt to visualize past rainfall and temperature data to predict future occurrences of droughts. The relationship can be expressed as:
where Yt = time series
Yt = Tt +St + Ct+ Rt
Tt = trend
St = seasonal
Ct = cyclical
Rt = random fluctuations.
The study used trend and time-series analysis to analyze the seasonal and cyclical patterns of temperature and rainfall in Musina Local Municipality. This analysis also assisted in calculating the SPEI when determining the frequency of droughts in the area.
2.5.2. Standardized Precipitation Evapotranspiration Index
The Standardized Precipitation Evapotranspiration Index (SPEI) was computed to assess drought variability in Musina Local Municipality. SPEI is based on the climatic water balance defined as the difference between precipitation (P) and potential evapotranspiration (PET). In this study, PET was estimated using the Penman–Monteith method which is more accurate and suitable for the semi-arid climate of Musina. The water balance (drought = P − PET) was aggregated over a 6-month time scale (SPEI-6) to capture seasonal water availability relevant to agricultural and hydrological processes. The aggregated series was then fitted to a log-logistic probability distribution following the approach of [42]. The cumulative probability was subsequently transformed into standardized values with a mean of zero and a standard deviation of one to obtain SPEI. The positive values indicate wet conditions, whereas the negative values indicate dry conditions. Values below −1, −1,5 and −2 represent moderate, severe, and extreme drought, respectively. The SPEI-6 index was used to quantify drought intensity and duration across the study period.
2.5.3. Anomaly Analysis
Anomaly analysis was utilized to detect and interpret deviations from long-term average climate conditions, particularly in rainfall. This method was crucial for identifying drought events, as droughts are characterized by significant negative anomalies in precipitation and vegetation health over time [43]. By calculating rainfall anomalies over a 10− to 30+ year period, the study determined the severity, frequency, and spatial distribution of droughts in Musina. These anomalies helped distinguish normal seasonal variability from true climatic extremes, enabling a more accurate spatiotemporal assessment of drought patterns. Furthermore, anomaly analysis supported early warning and adaptive planning by revealing emerging trends that were not apparent through raw data alone [44]. For rainfall anomalies, values below 0 indicate rainfall deficits or dry periods, with years above 0 indicating wetter periods; conversely, for temperature anomalies, values below 0 indicate temperature drops, with values above 0 indicating high temperatures, which contribute to drought conditions.
2.5.4. Questionnaire Analysis
Questionnaires were analyzed using both descriptive and inferential statistical methods in IBM SPSS Statistics Version 29.0.2.0, including the Chi-Square test and cross-tabulations, to gain a comprehensive understanding of how droughts affect residents and the coping strategies they employ. The findings were presented using pie charts and graphs to compare different demographic factors and the impacts of droughts. Descriptive statistics, such as frequencies and percentages, were used to summarize responses to questions on perceived drought impacts, agricultural (crop and livestock) losses, water shortages, and commonly used coping mechanisms. This provided a clear overview of the most affected areas, population segments, and dominant adaptation responses within Musina Local Municipality [40].
2.5.5. Cramér’s V Coefficient
Chi-Square tests were used to examine association between demographic variables and respondents’ perceptions of drought impacts and coping strategies in Musina Local Municipality. Since the Chi-Square test only indicates whether a statistically significant association exists, Cramér’s V was additionally calculated to determine the strength of the relationship between categorical variables. Cramér’s V was calculated using the following formula
where: V = Cramér’s V coefficient
= Chi-Square statistic
n = total sample size
k = the smaller number of rows or columns in the contingency table.
2.6. Limitations of the Study
2.6.1. Data Availability and Accuracy
One of the key limitations of this study was the availability and accuracy of historical climate data, particularly regarding local-scale precipitation and temperature records. While broader regional or national datasets were accessible, localized data for Musina was sparse or inconsistent, which could affect the precision of drought frequency analysis and spatial distribution mapping [45]. To mitigate the challenges posed by sparse and inconsistent local-scale precipitation records in Musina, this study employed the ERA5-Land dataset. The ERA5-Land provided a higher spatial resolution (9 km) and improved representation of land–atmosphere processes, which is essential for capturing local-scale climate variability in a heterogeneous, semi-arid environment such as Musina Local Municipality [6]. ERA5-Land integrates observations with a physically consistent land-surface model, yielding more reliable rainfall and temperature estimates. ERA5-Land data were selected to avoid gaps in meteorological station datasets. It combined satellite data with ground-based station measurements to provide an accurate and comprehensive record of precipitation, making it suitable for spatiotemporal drought analysis and for calculating drought indices such as the Standardized Precipitation Evapotranspiration Index, where accurate temperature-driven evapotranspiration is critical [8,32]. This made it an excellent source for areas where traditional weather station data may be sparse or unreliable, such as remote regions of Musina.
2.6.2. Confidence Level and Margin of Error
Although the sample size of 120 respondents was considered adequate for exploratory community-level analysis, the study adopted a 92% confidence level with an 8% margin of error due to practical and logistical constraints encountered during fieldwork. The municipality is characterized by geographically isolated and widely dispersed rural settlements which made data collection across all communities difficult and intensive. In addition, limited financial resources and time constraints restricted the ability to obtain a larger and more statistically representative sample. The selected confidence level and margin of error allowed the researchers to balance statistical reliability with the practical realities of conducting field research in remote rural areas. However, it is acknowledged that these values are below the 95% confidence threshold commonly preferred in high impact sustainability research. Consequently, the findings should be interpreted with caution and may not be fully generalizable to the entire population of Musina Local Municipality. Despite these limitations the study provides important insights into drought trends, livelihood impacts and coping strategies in one of South Africa’s drought-prone municipalities. The findings remain valuable for informing drought adaptation planning and future research in semi-arid rural communities.
2.6.3. Reliability of the Questionnaire
The questionnaire was developed based on the established literature and expert guidance on drought impacts and coping strategies. A formal reliability assessment using Cronbach’s Alpha was not conducted. This was primarily because the questionnaire consisted largely of demographic questions, categorical response items, and multiple-response questions rather than a standardized Likert-scale instrument designed to measure a single latent construct. Consequently, the internal consistency of the questionnaire could not be statistically evaluated. Future studies should incorporate validated multi-item Likert scales and conduct reliability analyses, such as Cronbach’s Alpha testing, to further strengthen the robustness and reproducibility of socio-economic assessments related to drought vulnerability and adaptation.
3. Results and Discussions
3.1. Climate Trends
3.1.1. Spatial Patterns of Precipitation and Temperature During Austral Summer Season
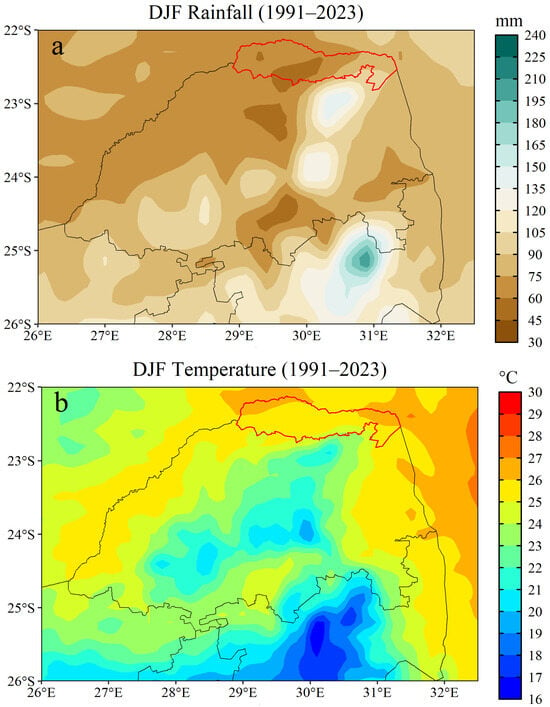
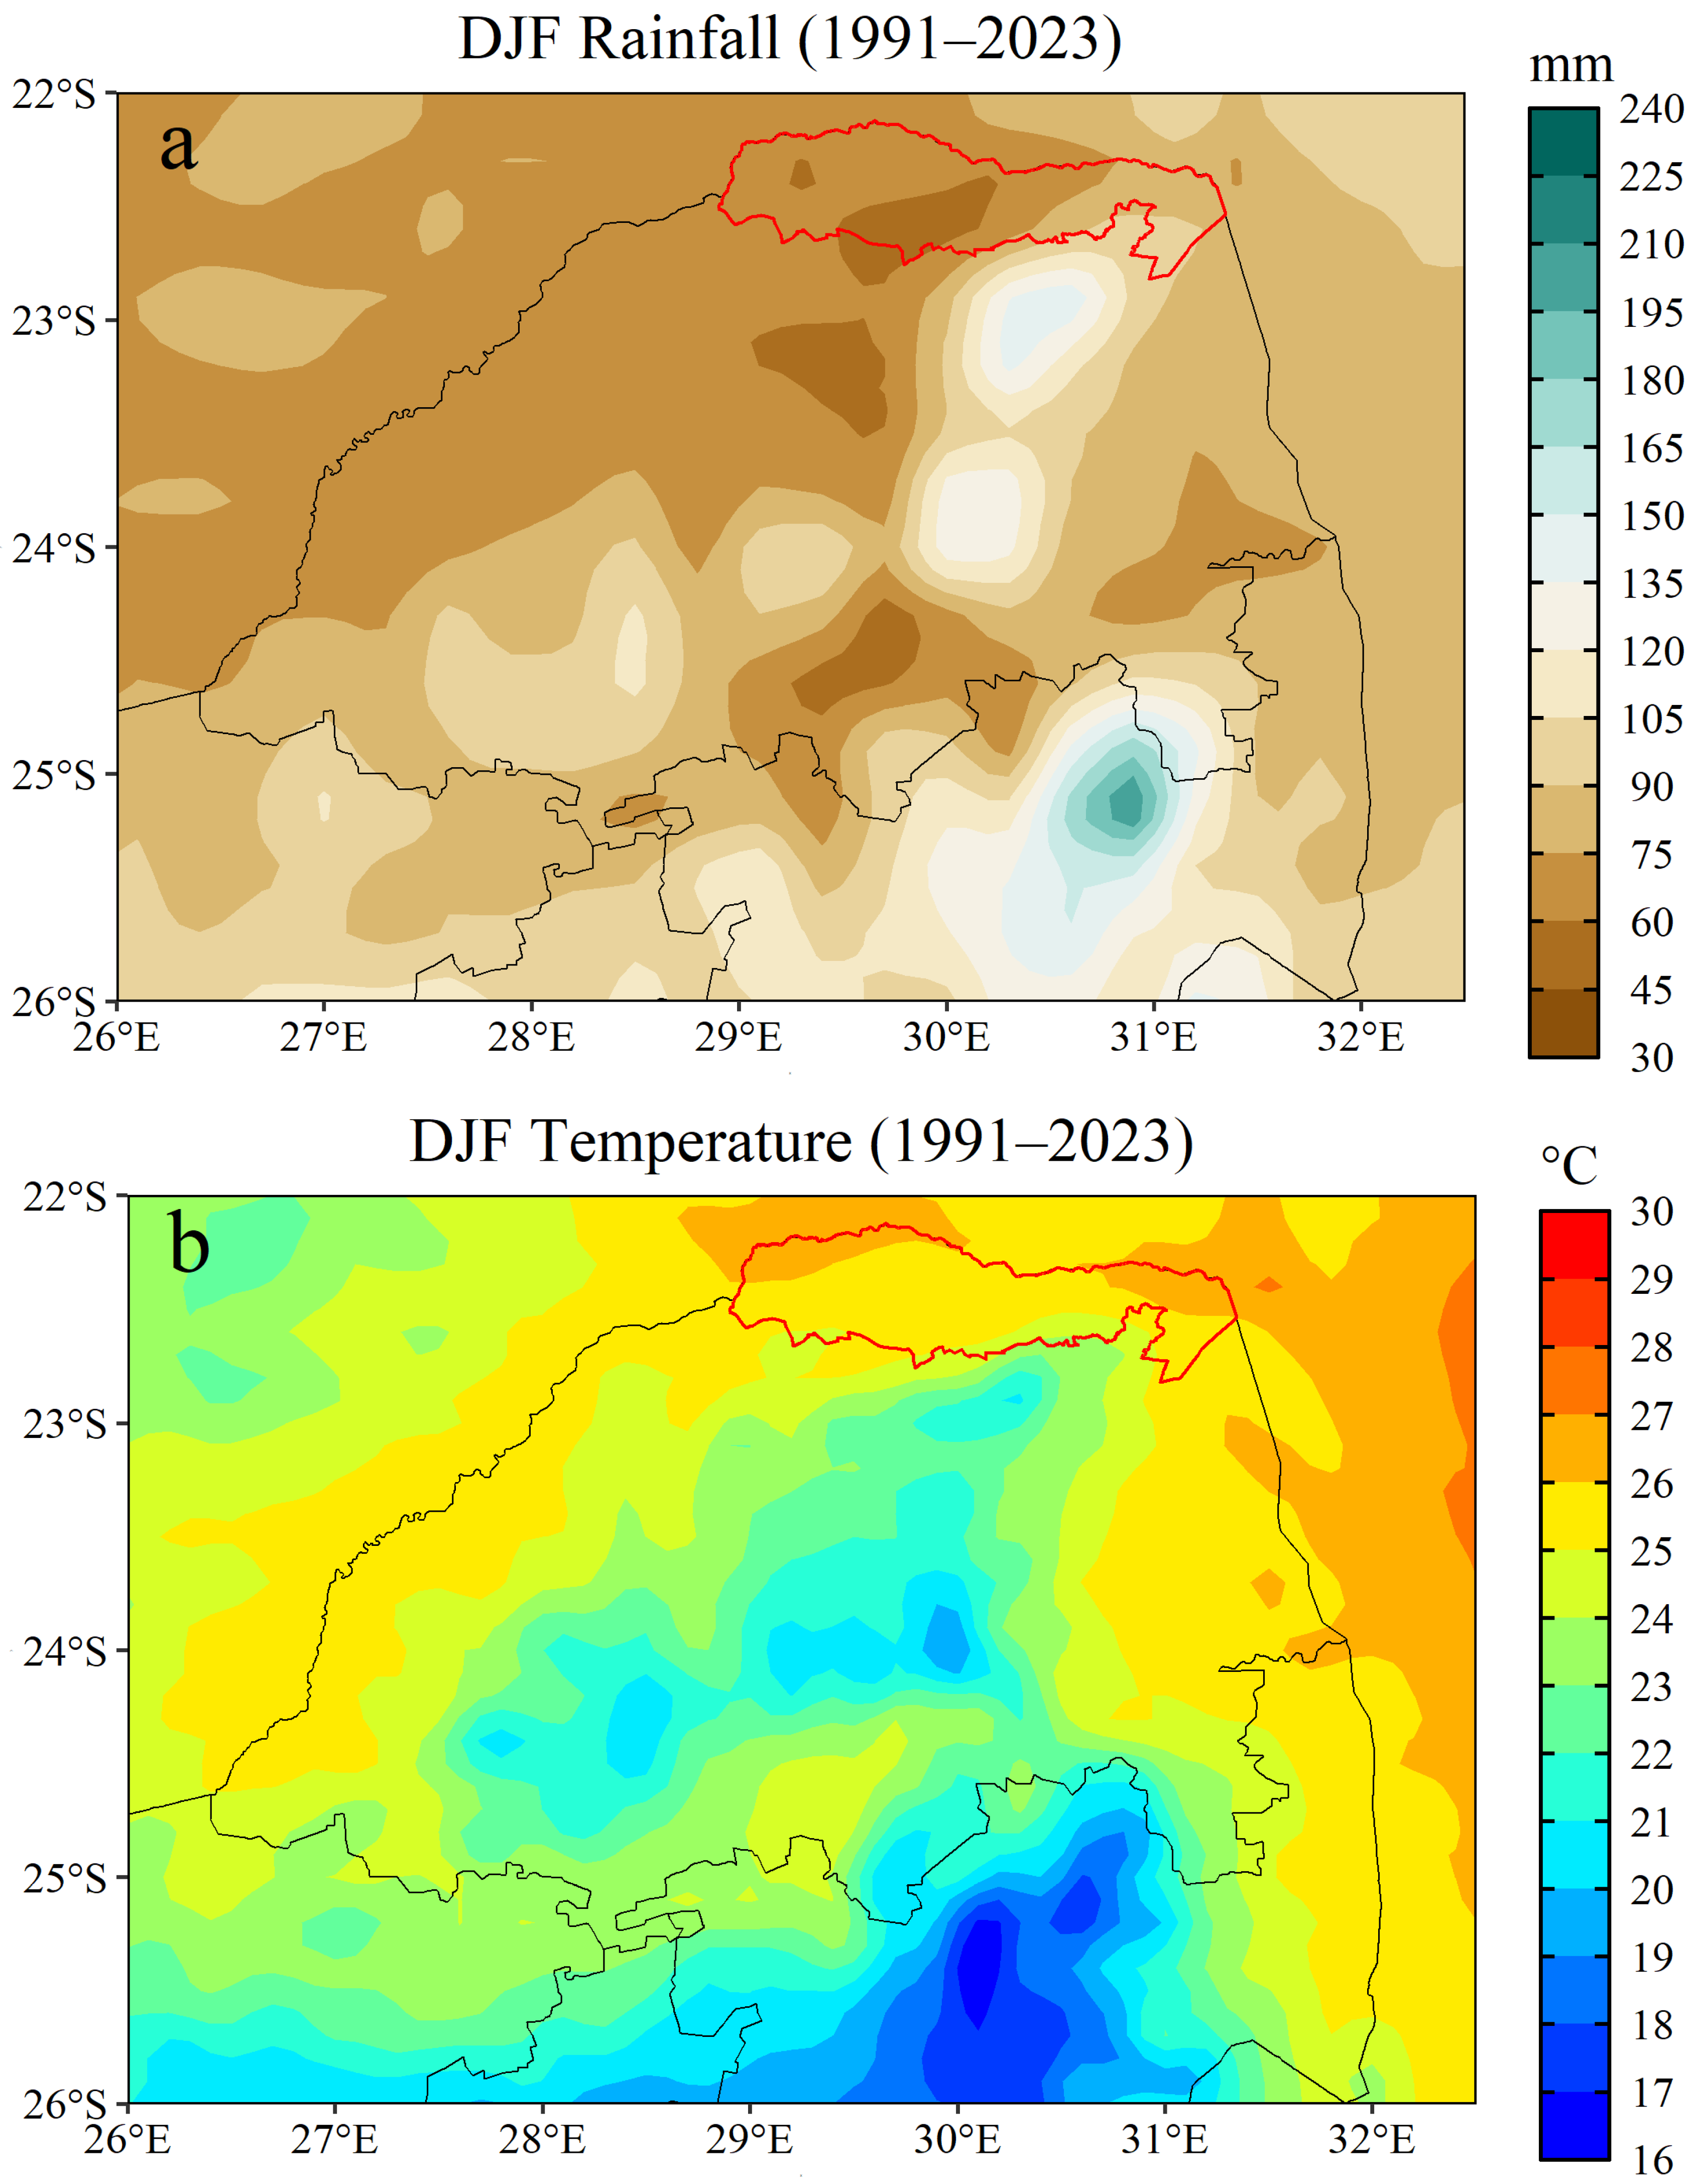
The spatial distribution of rainfall and temperature across Musina Local Municipality is shown in Figure 2. The spatial map (Figure 2a) shows that rainfall distribution in Musina Local Municipality is highly uneven, with the northwestern and central parts, which receive approximately 30 to 80 mm of rainfall averaged for summer months, consistently drier than the Southeastern fringes, which receive above 105 mm averaged per summer months of December, January, and February (DJF; Figure 2a). The minimum rainfall of 30 mm (Figure 2a) indicates extremely dry conditions characteristic of a hot semi-arid climate where water availability is insufficient to support reliable crop production without supplementary irrigation. The maximum rainfall of 135 mm represents the upper limit of Musina’s rainfall potential during the summer months (DJF; Figure 2a) but still falls within drought-prone thresholds threatening water availability [30].
Figure 2.
Spatial distribution of austral summer (DJF) climatological rainfall (a), temperature (b), across the study area, with the red polygon representing the boundary of Musina Local Municipality.
The minimum and maximum values of 30 mm and 135 mm, respectively, support previous findings that Musina lies in a semi-arid climate zone, where rainfall ranges between 40 and 200 mm during summer months (DJF) [46]. These results align with numerous studies [13,30] that state that the Limpopo Province, particularly Musina, is among the most drought-prone areas in South Africa due to its low and erratic rainfall. Such spatial patterns are crucial for identifying drought hotspots and can guide the allocation of adaptation resources more effectively, together with supporting the development of local coping mechanisms.
The spatial temperature map in Figure 2b shows that Musina experiences uniformly high temperatures, often exceeding 27 °C in summer due to its location. Musina lies in the far northern part of Limpopo (Figure 2b), near the Tropic of Capricorn, where solar radiation is strong year-round [47]. It is situated at a low elevation, which naturally results in hotter conditions compared to higher-lying regions. The temperature distribution maps thus underscore the dual stressors of heat and water scarcity in the Musina region.
3.1.2. Rainfall Temporal Dynamics: Mean Annual Cycle, Monthly Variability and Anomalies
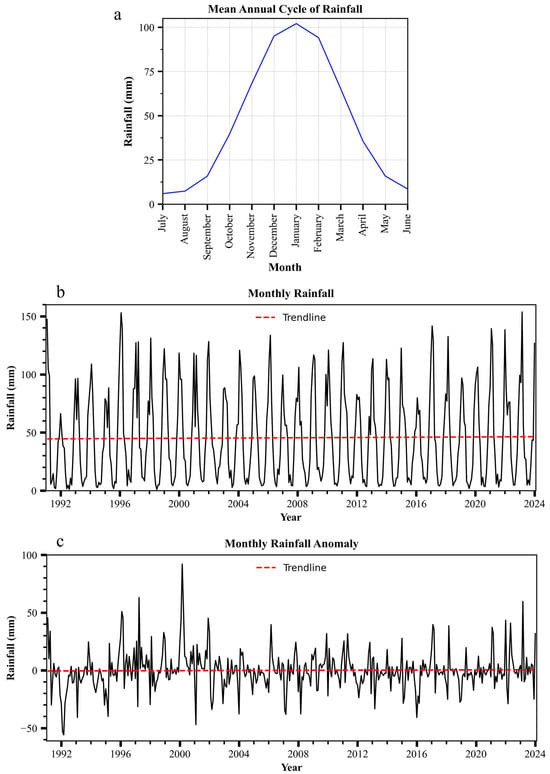
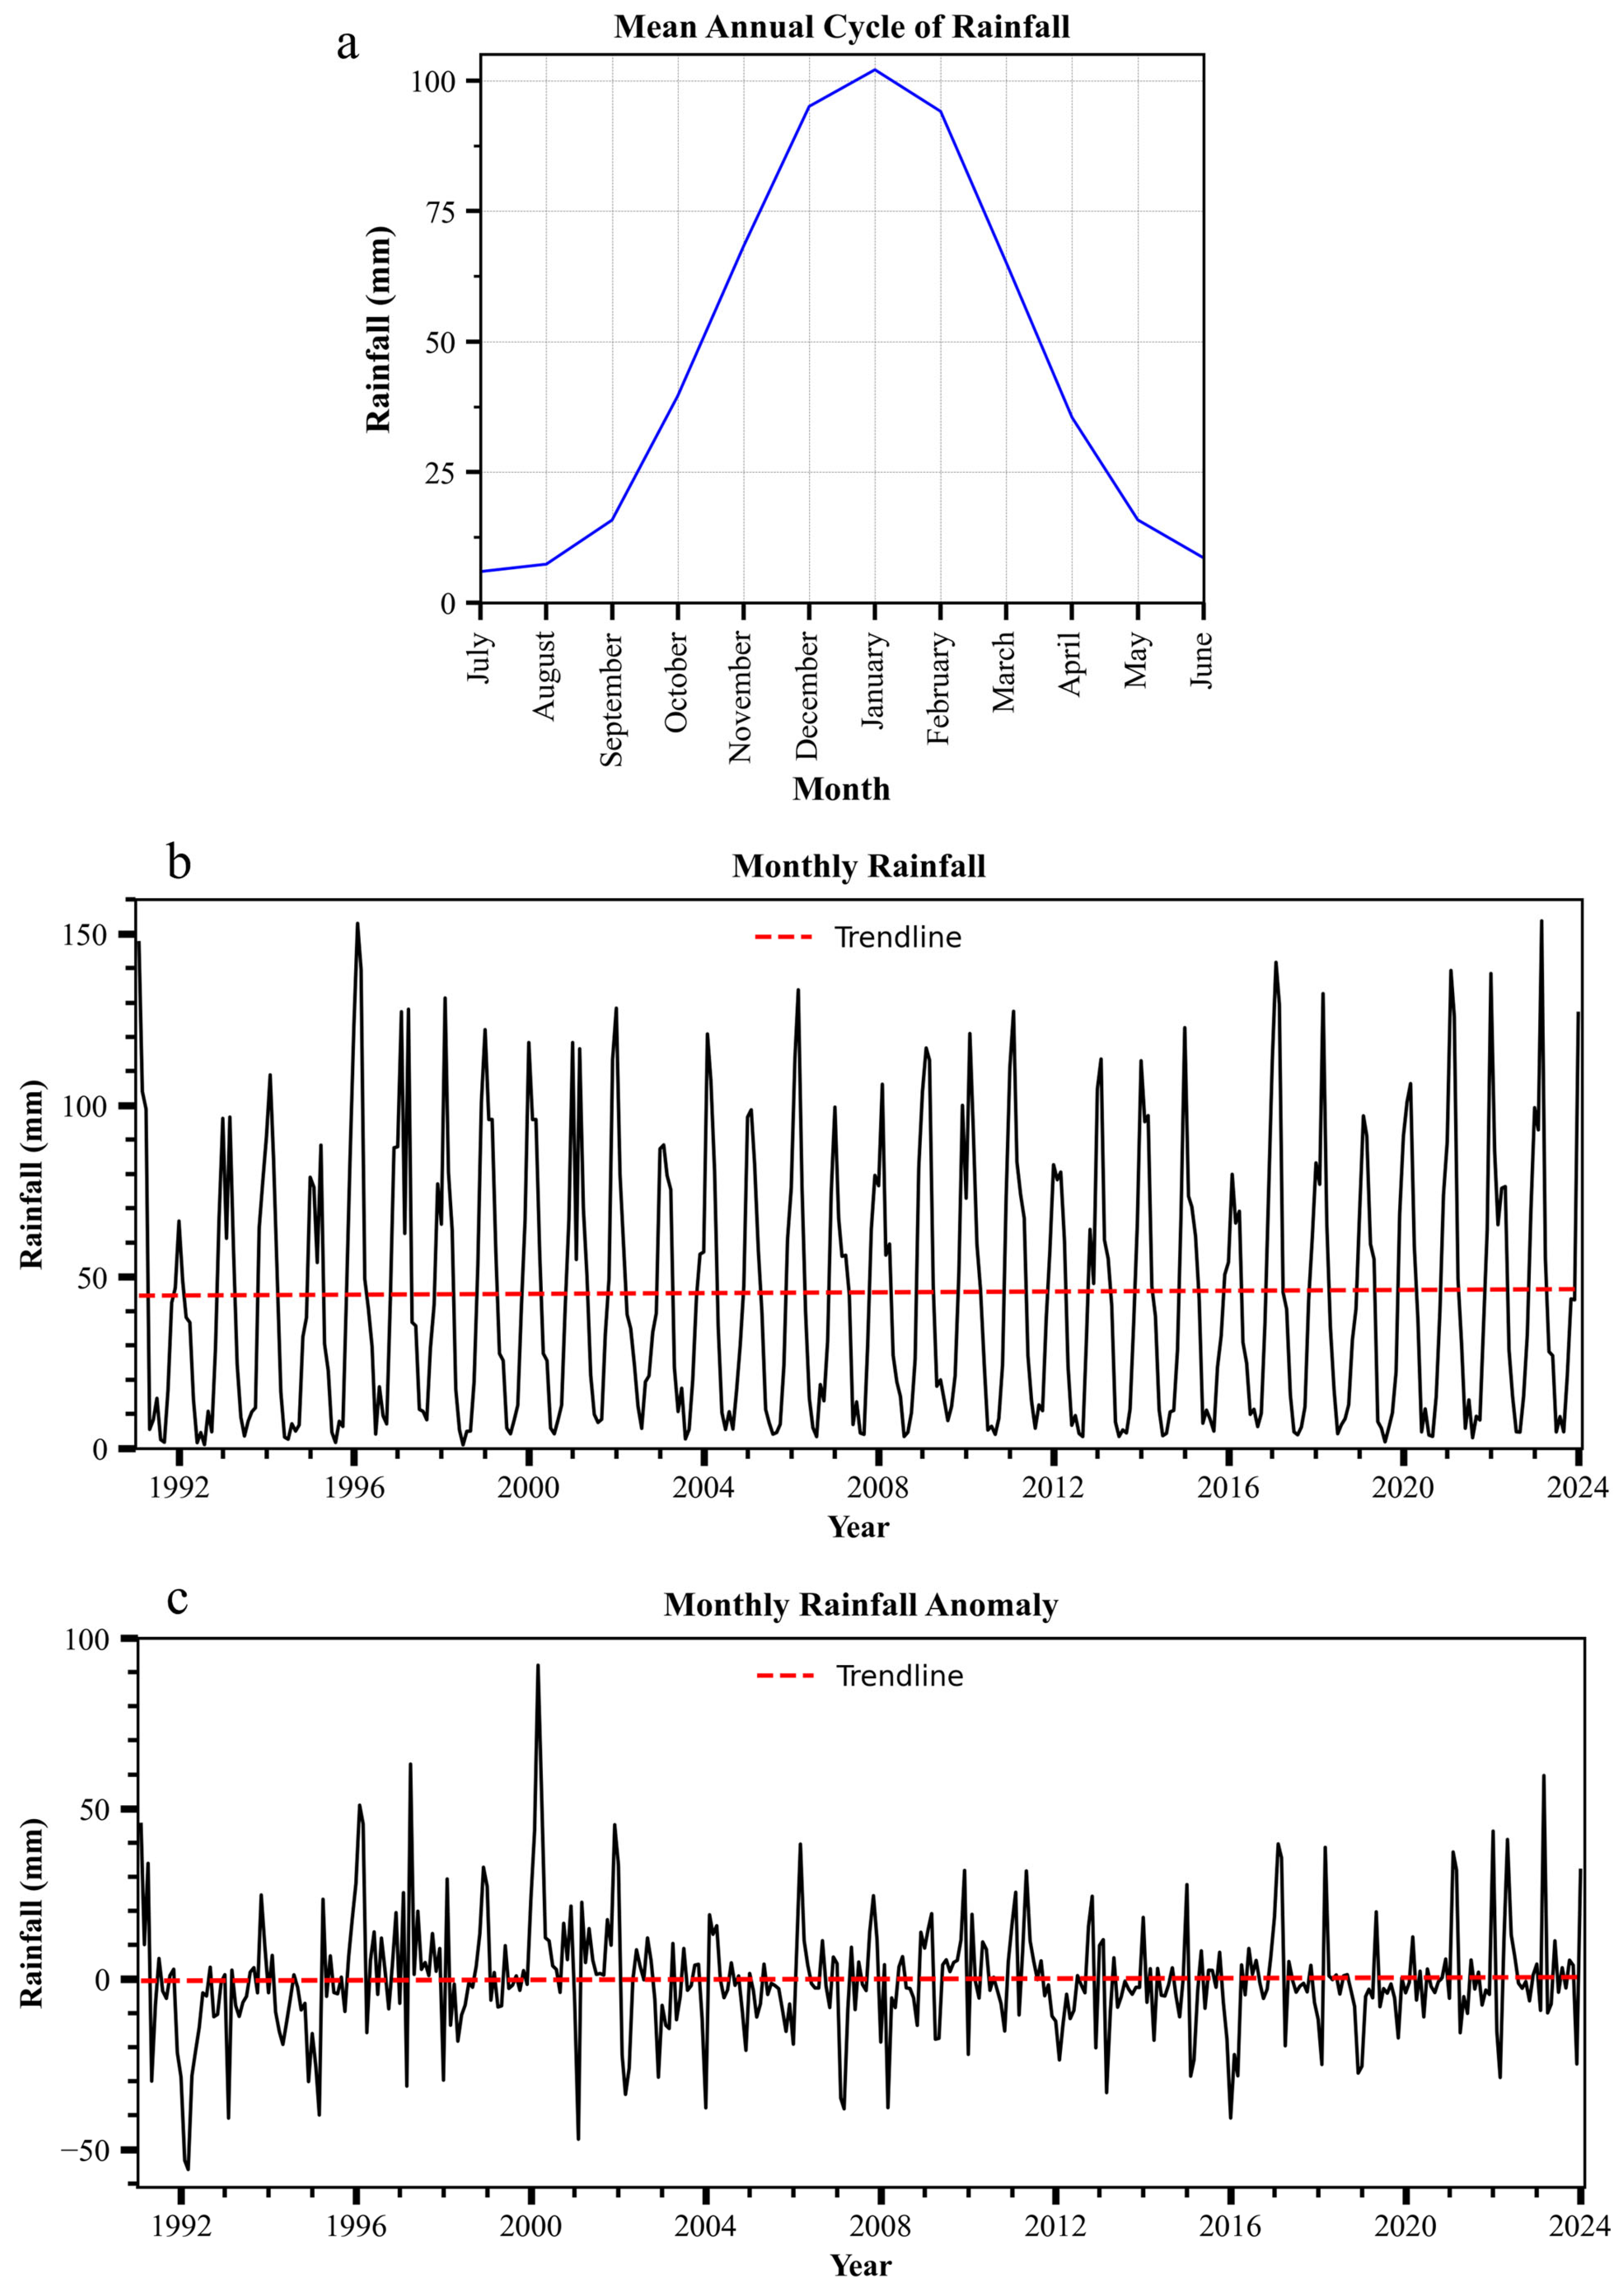
Figure 3a shows the mean annual rainfall cycle of Musina Local Municipality, in which precipitation is averaged for each month between 1991 and 2023. The mean annual rainfall cycle graph (Figure 3a) illustrates that most rainfall occurs from November to March, with minimal precipitation during winter months (June to August; JJA). The highest monthly rainfall values 90–105 mm occur during the austral summer months of December, January, and February (DJF) (Figure 3a), reflecting the dominance of convective summer rainfall associated with the southward migration of the tropical rain belt (18). The lowest monthly rainfall recorded was 5–10 mm during JJA; these extremely low values reflect the region’s strong dry season during winter. This seasonal concentration of rainfall coincides with the growing season, but any delay in rainfall can severely disrupt agricultural productivity.
Figure 3.
Rainfall mean annual cycle (a), monthly interannual variability (b), and anomalies (c).
The rainfall pattern makes Musina Local Municipality highly susceptible to agricultural droughts, particularly because most farmers rely on rain-fed agriculture [30,46]. This reinforces the recommendation for early planting and climate-smart irrigation techniques, such as drip systems, to mitigate crop losses during erratic seasons.
Figure 3b shows the interannual variability of rainfall in the Musina Local Municipality, highlighting year-to-year fluctuations relative to its long-term average. The MK results indicate a statistically insignificant increasing trend in rainfall (p-value = 0.712; Z = 0.368). In addition, Sen’s slope estimator indicates a slight increase in rainfall of 0.004 mm/month (0.04 mm/decade). Despite this weak upward trend, substantial interannual variability is evident, with pronounced drought periods in 1991 to 1990, 2003 to 2004, 2015 to 2016, and 2017 to 2019 standing out as extreme lows (Figure 3b). These findings are consistent with the existing literature [13,22,48], which identified these periods as major national and regional drought events, mostly driven by El Niño conditions [17,47].
Such pronounced variability underscores the high degree of climatic uncertainty in the region, which complicates reliable year-to-year planning for local communities. This variability is a defining characteristic of southern Africa’s climate and reflects its strong susceptibility to drought cycles driven by the ENSO [19].
Rainfall anomalies (Figure 3c) show deviations from normal precipitation in the Musina Local Municipality. These anomalies provide critical observations on drought severity across years. Notably, between 1991 and 1992, the lowest anomaly was recorded, marking the most severe drought in recent years. The 2015–2016 period also shows severe negative deviations from the long-term rainfall average, confirming that droughts are not only frequent but are also becoming more prolonged. This is consistent with global and regional studies showing a climate change-driven shift in both the frequency and intensity of droughts [1,47].
These negative anomalies illustrate that normal seasonal rainfall is no longer guaranteed and support the findings of [49], who argued that African droughts are worsening due to warming temperatures and erratic weather systems.
3.1.3. Temperature Temporal Dynamics: Mean Annual Cycle, Monthly Variability and Anomalies
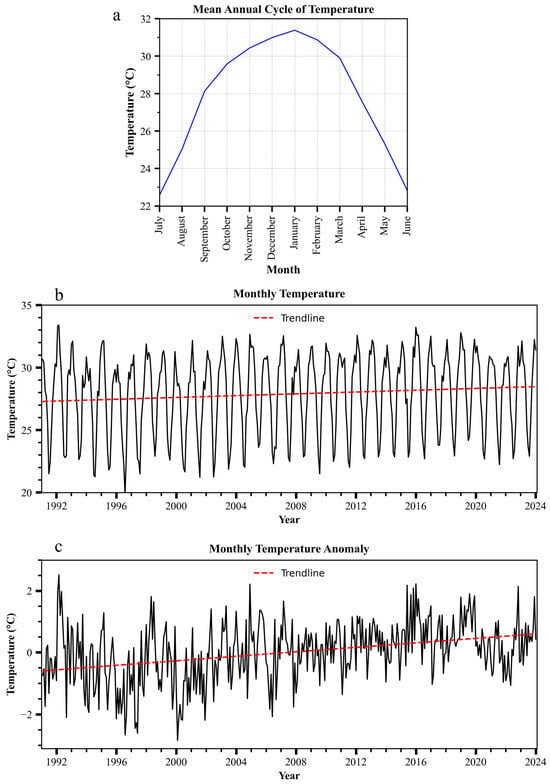
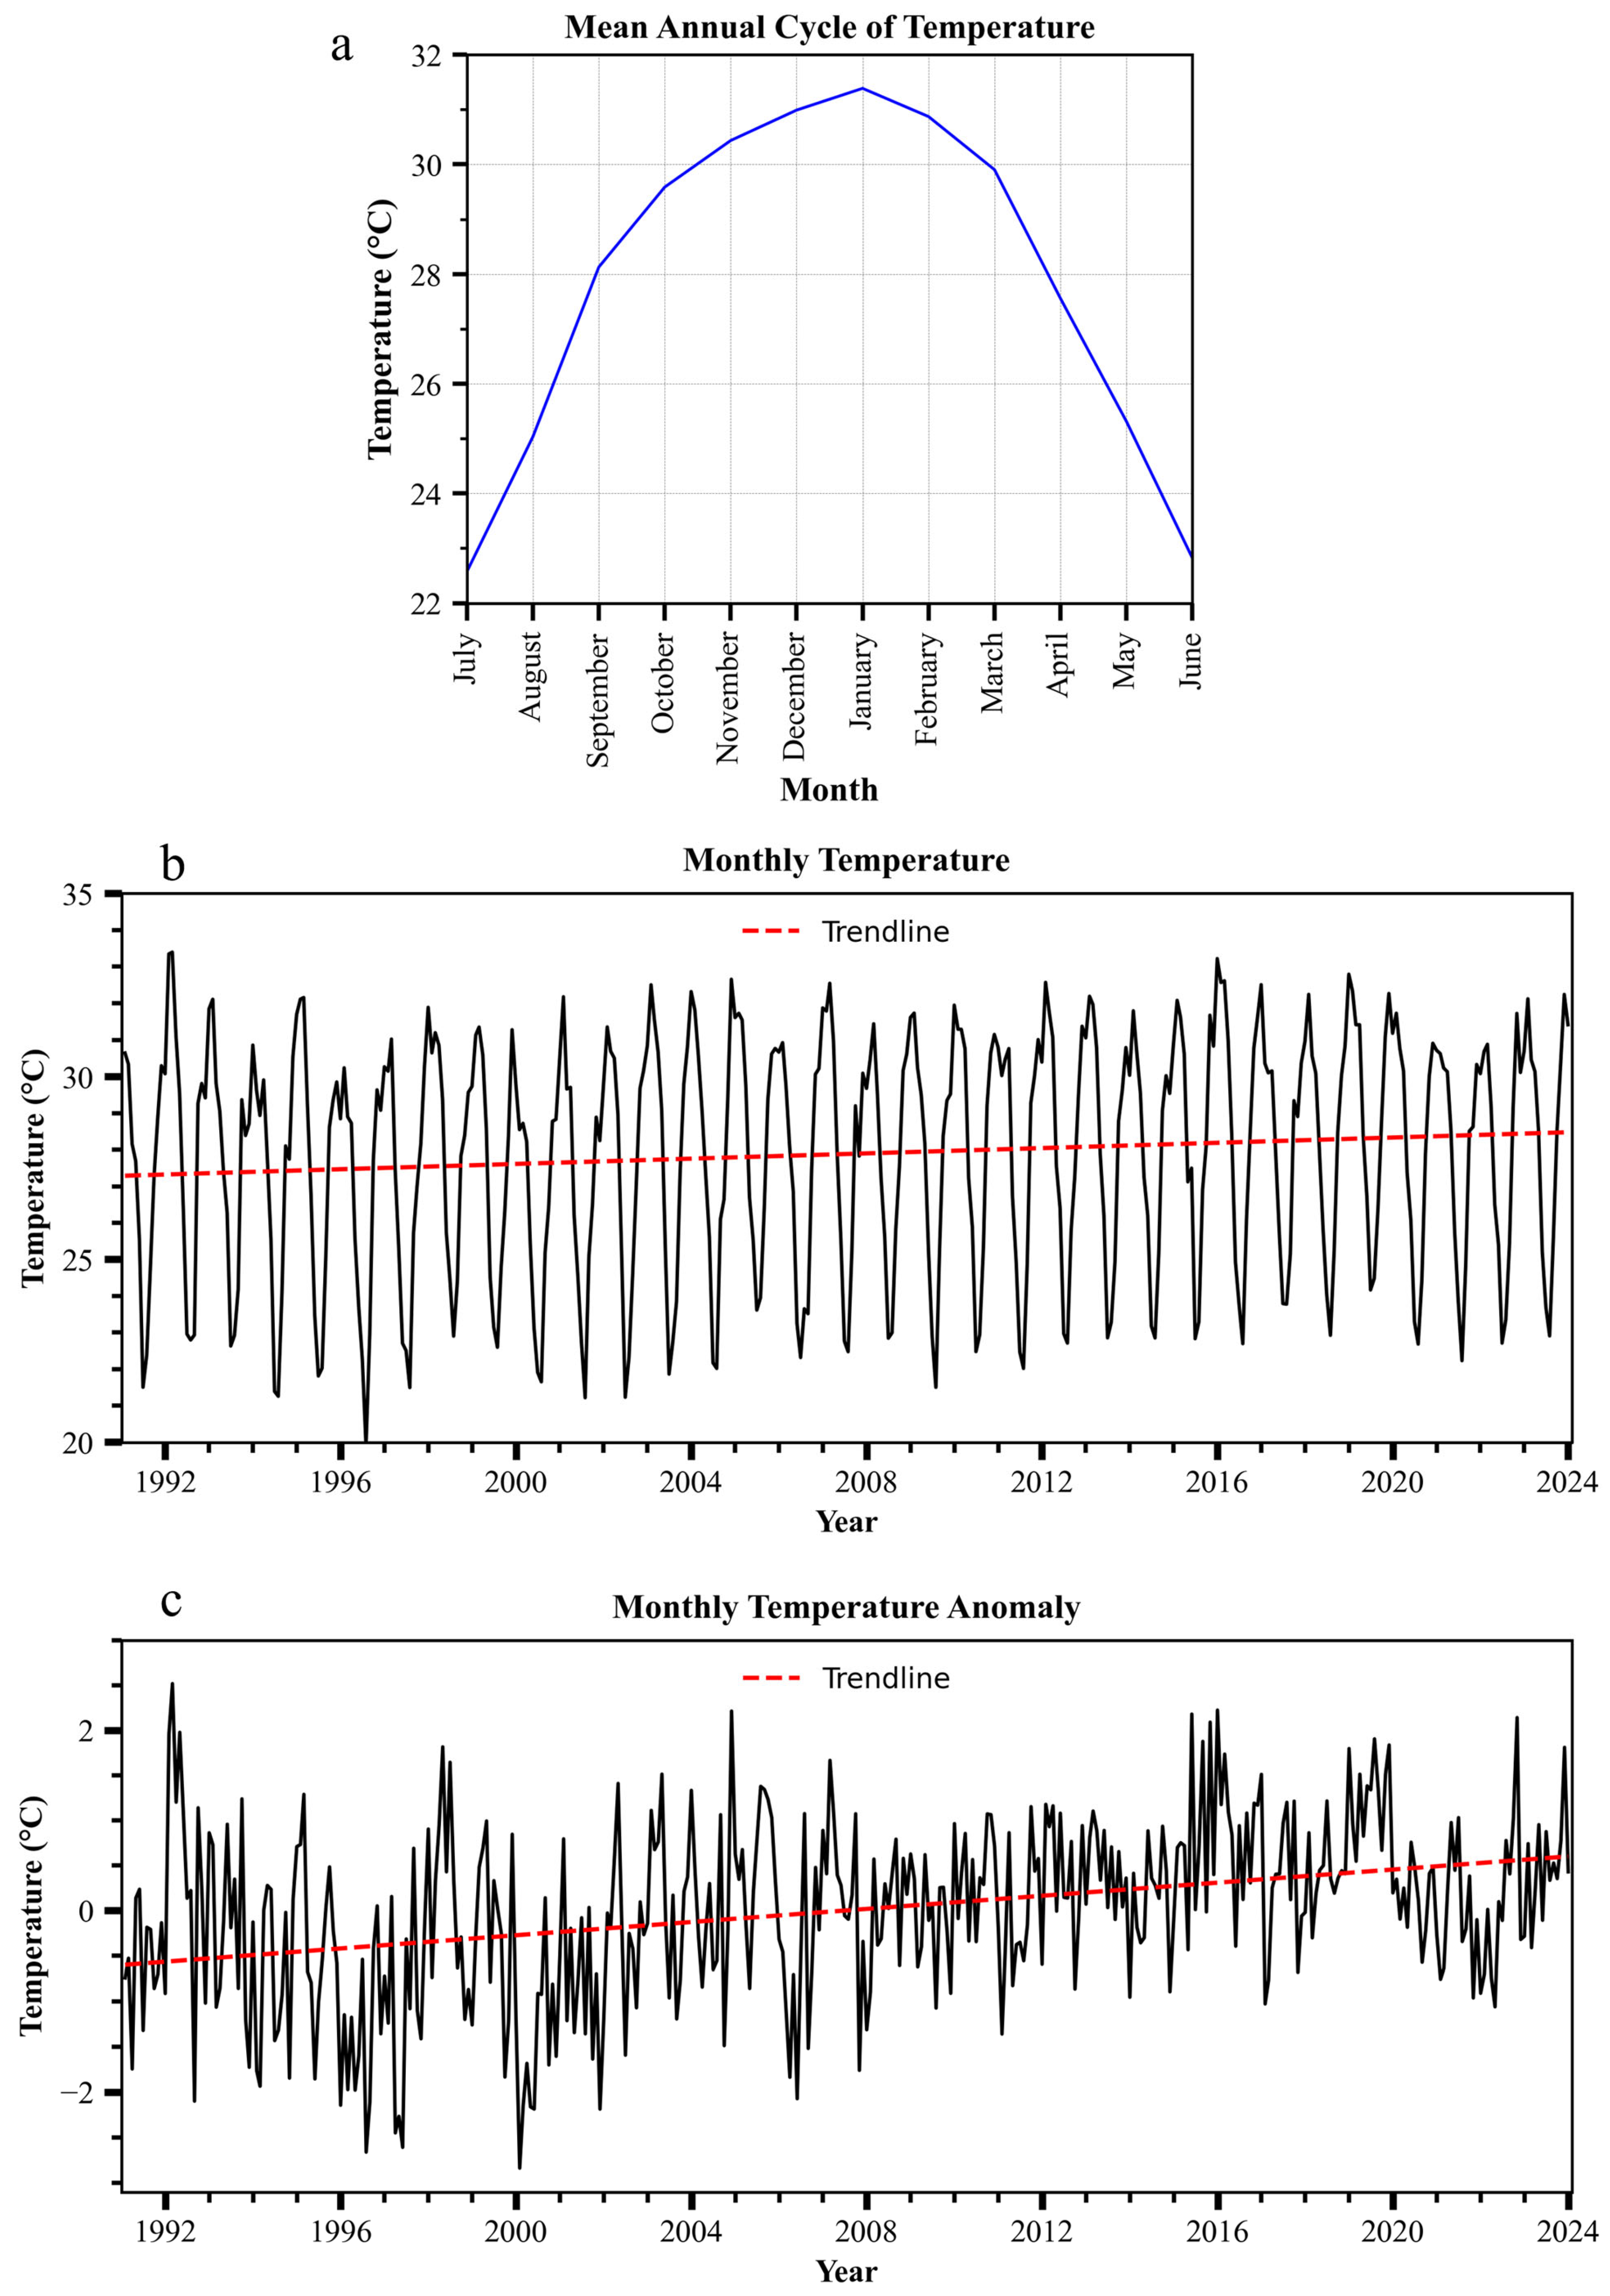
The mean annual cycle, interannual variability, and temperature anomalies are depicted in Figure 4. The graph in Figure 4a shows the mean annual temperature cycle of the Musina Local Municipality. The temperature pattern follows a predictable seasonal cycle, with clear peaks in the austral summer months and corresponding lows in the winter months. However, Figure 4a shows that even during these relatively cool winter months, temperatures drop only slightly, keeping these months relatively warm, illustrating that Musina’s climate provides little thermal relief. This supports findings from study [30], which noted that such consistently high temperatures place stress on both crops and livestock year-round. This supports previous studies [35,50] that documented rising temperature trends across the Province of Limpopo due to limited cloud cover and low humidity, resulting in more direct surface heating. These increasingly high temperatures exacerbate drought by increasing evapotranspiration and reducing soil moisture retention, thereby compounding the effects of low rainfall [51]. This trend further justifies the need for heat- or drought-tolerant crop varieties and agroecological practices that shield soils and plants from excessive heat exposure [13,52].
Figure 4.
Temperature mean annual cycle (a), monthly interannual variability (b), anomalies (c).
Figure 4b shows the interannual variability of temperatures in Musina. The results indicate a clear upward trajectory over the past three decades, as illustrated in the figure. The MK test reveals a statistically significant increasing trend in temperature (p-value = 0.018; Z = 2.363), confirming the onset of localized warming. Moreover, Sen’s slope estimator indicates an increase by 0.0029 °C/month (0.029/decade). In the 1990s, minimum temperatures averaged approximately 21 °C, reflecting relatively cooler conditions with less heat extremes. This increased to an average of 23 °C in the 2010s. Similarly, maximum temperatures increased from an average of 30 °C in the 1990s to 32 °C in the 2010s (Figure 4b). Although gradual, this increase has an accumulative effect on drought severity by enhancing evapotranspiration rates, as confirmed by [48]. Comparisons with earlier decades reported in the literature indicate that current temperatures are significantly above historical norms [53]. This warming pattern is consistent with global climate projections and is particularly concerning for arid zones such as Musina, where water resources are already limited, and residents frequently experience water shortages.
Figure 4c below shows that the anomalies of Musina Local Municipality pinpoint specific years, most notably 1997, 2000, and lastly 2006, where positive temperature spikes are aligned with the worst drought conditions. This direct overlap between heat waves and rainfall deficits confirms the compounded nature of modern drought events. Compound extremes are more dangerous than single climate events because they shorten recovery time and exacerbate socio-economic damage [54,55]. The anomaly graph thus reinforces the case for early-warning systems and multi-hazard planning in drought-affected municipalities such as Musina.
3.2. Temporal Evolution of Drought Events (1991–2023) Using SPEI
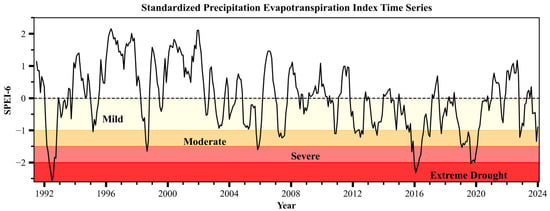
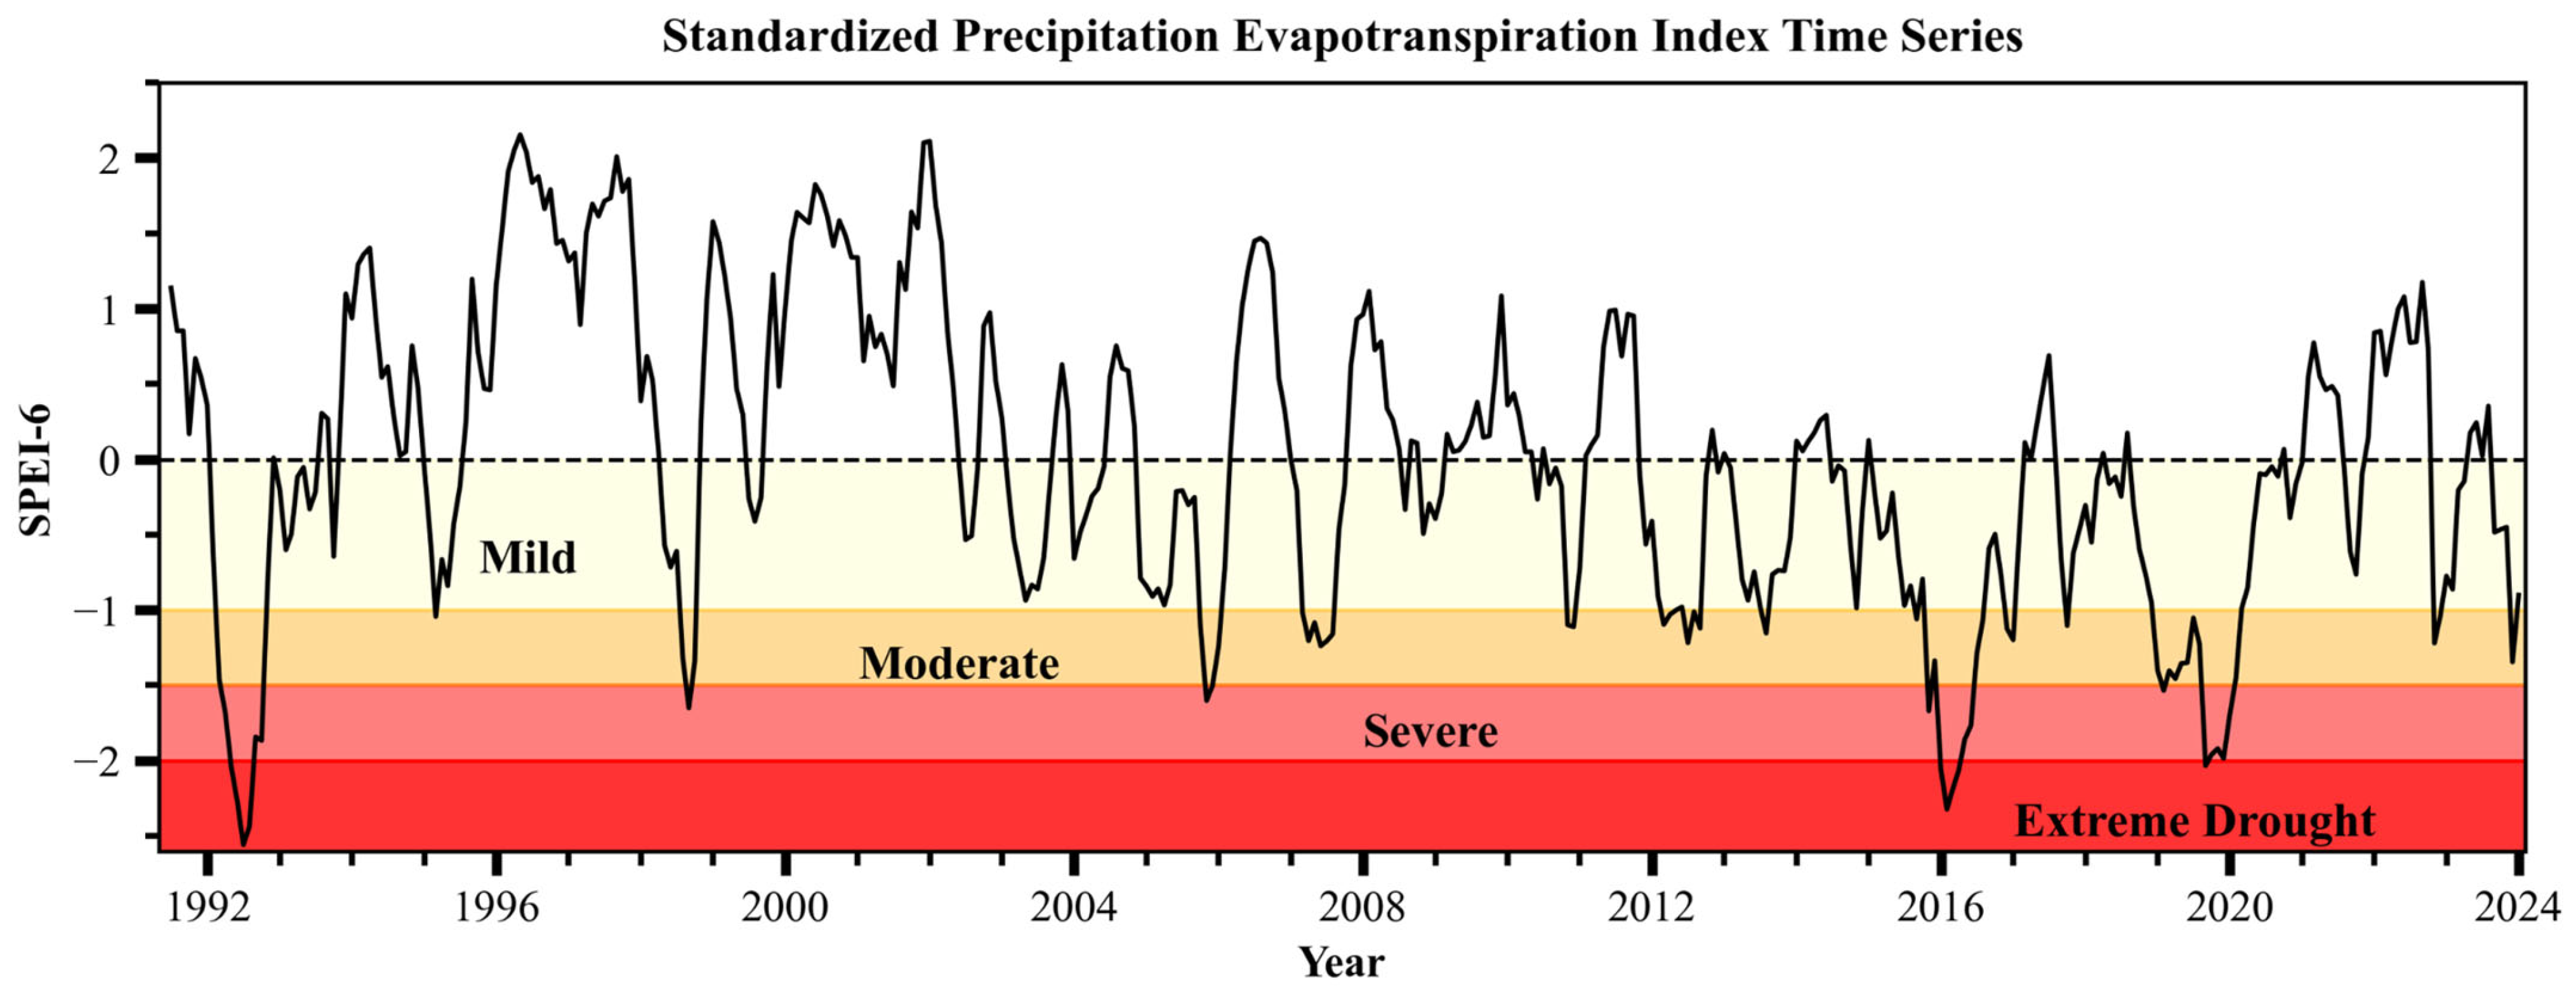
Figure 5 provides a comprehensive depiction of drought intensity, frequency, and duration using the SPEI. This index accounts for both precipitation deficits and temperature-driven evapotranspiration, making it particularly suited for semi-arid regions like Musina, where high temperatures significantly exacerbate drought conditions [48,55].
Figure 5.
The Standardized Precipitation Evapotranspiration Index (SPEI) from 1991 to 2023.
The results indicate that droughts in Musina Local Municipality have become increasingly frequent and intense over the 1991–2023 period. Analysis of the SPEI (Figure 5) shows recurrent moderate-to-severe drought conditions, with the most pronounced and intense drought events recorded during 1991–1992, 2015–2016, and 2019. In total, more than 14 drought events were identified over the study period, with individual drought episodes typically lasting between several months to multiple seasons (~3–12 months depending on severity). These years are characterized by strongly negative SPEI values, signaling prolonged rainfall deficits combined with elevated temperatures, with minimum temperatures increasing from 21 to 23 and average temperatures reaching peaks of 31 during the DJF months, thereby intensifying evapotranspiration. The increasing frequency of drought events, particularly in the latter part of the study period with shorter recovery periods, suggests that Musina is experiencing a shift from episodic droughts to more recurrent and persistent drought conditions. The SPEI values on the graph in Figure 5 indicate the severity and duration of drought or wet conditions over time.
The SPEI shows a time series that fluctuates around the zero line, with values below 0 indicating dry conditions (drought), values close to 0 representing normal climatic conditions and those above 0 indicating wet conditions. The further the SPEI value falls below zero the more severe the drought becomes; 0 to −0.99 indicates mild drought, −1 to −1.49 indicates moderate drought, −1.5 to −1.99 indicates severe drought with any value less than −2 indicating extreme drought. Notably, significant dips below −1 or −1.5 are observed in Figure 5 and correspond to moderate to severe droughts, while values below −2 signal extreme drought events. The most pronounced negative SPEI values correspond to well-known drought years in South Africa, particularly 1991 to 1992, 2016, and 2020, a pattern that strongly correlates with recorded El Niño-induced droughts [17,46]. The above highlighted drought events are linked with rainfall deficits and increased temperature, as evidenced by rainfall and temperature anomalies in Figure 3c and Figure 4c. There are certain years in which temperatures were evidently high with anomaly values below −2 in Figure 4c, such as 1996 and 2000, but the SPEI values in Figure 5 indicate wetter periods during these years, which suggests a non-linear relationship between temperature anomalies and drought occurrence. This shows that not all years with negative temperature anomalies will result in drought events, as high temperature can also increase atmospheric moisture and potentially contribute to above-normal rainfall, as observed in 2000 with a rainfall anomaly exceeding 90 mm (Figure 3c).
Severe droughts were also recorded as supported by the SPEI in Figure 5 with years such as 1998–1999, 2006, 2019–2020. Moderate droughts were recorded in 1995, 2007, 2011–2013 and 2017–2018. These support that droughts have become frequent over the years although they are not always extreme or severe, as mild droughts have also been recorded during 1993, 1994, 2003–2005, 2008–2009 and 2021. Overall, drought occurrence was higher in the period 2010–2023 (approximately 15 episodes) compared to 1991–2009 (approximately nine episodes), indicating a noticeable increase in reoccurrence within the study period. The varying drought intensities reflect the compounding effects of variable rainfall and steadily increasing temperatures [13]. Even in years with near-normal rainfall, higher temperatures reduce soil moisture and surface water availability, thereby exacerbating drought impacts. This pattern indicates that drought in Musina is no longer driven by rainfall deficits alone but is increasingly influenced by warming climatic conditions. Drought events have been frequent since 2010 to 2023 with about 15 drought episodes that occurred as compared to nine drought episodes that occurred between 1991 and 2009. This is also supported by the rainfall deficits shown by Figure 3c.
Under a warming climate, these findings signal a heightened risk of more severe, longer lasting, and compound drought events in the future. This trend threatens agricultural productivity, water security, and livelihood sustainability, as higher temperatures will continue to accelerate evapotranspiration and reduce the effectiveness of rainfall. The results, therefore, underscore the urgency of strengthening drought preparedness, early warning systems, and climate-resilient adaptation strategies, as future droughts are likely to occur more frequently, intensify faster, and have deeper socio-economic impacts in Musina Local Municipality [30]. These measures include a shift towards more drought-resilient crops, improved rainwater harvesting, and the exploration of alternative livelihoods that are less sensitive to climate variability [51,55].
3.3. Socio-Demographic Characteristics of Respondents (Age, Gender, Education and Occupation)
The distribution of respondents by gender and age indicates that about 61.67% were female, while the remaining 38.33% were male. This gender skew reflects women’s central role in household water management and food provision in rural areas of South Africa, such as Musina, which places them at the forefront of drought impacts [56,57]. Women are disproportionately affected because they bear responsibility for securing water and food for their families, a burden that becomes more difficult during prolonged droughts [30].
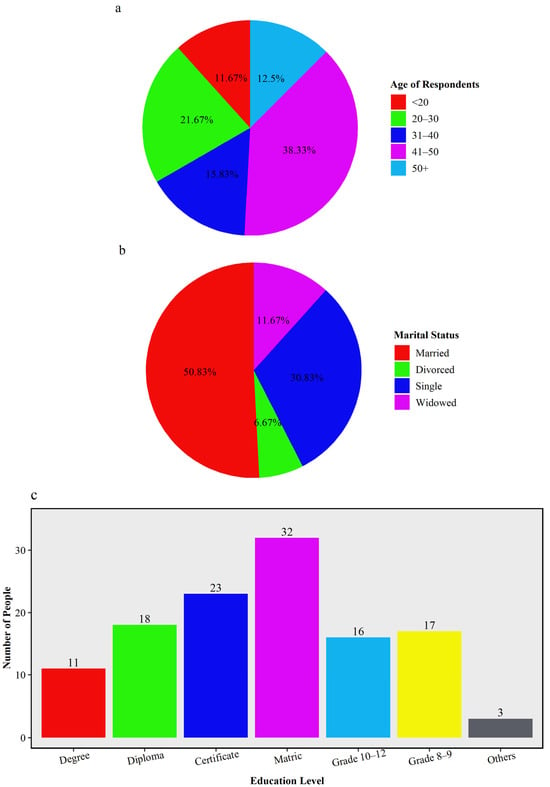
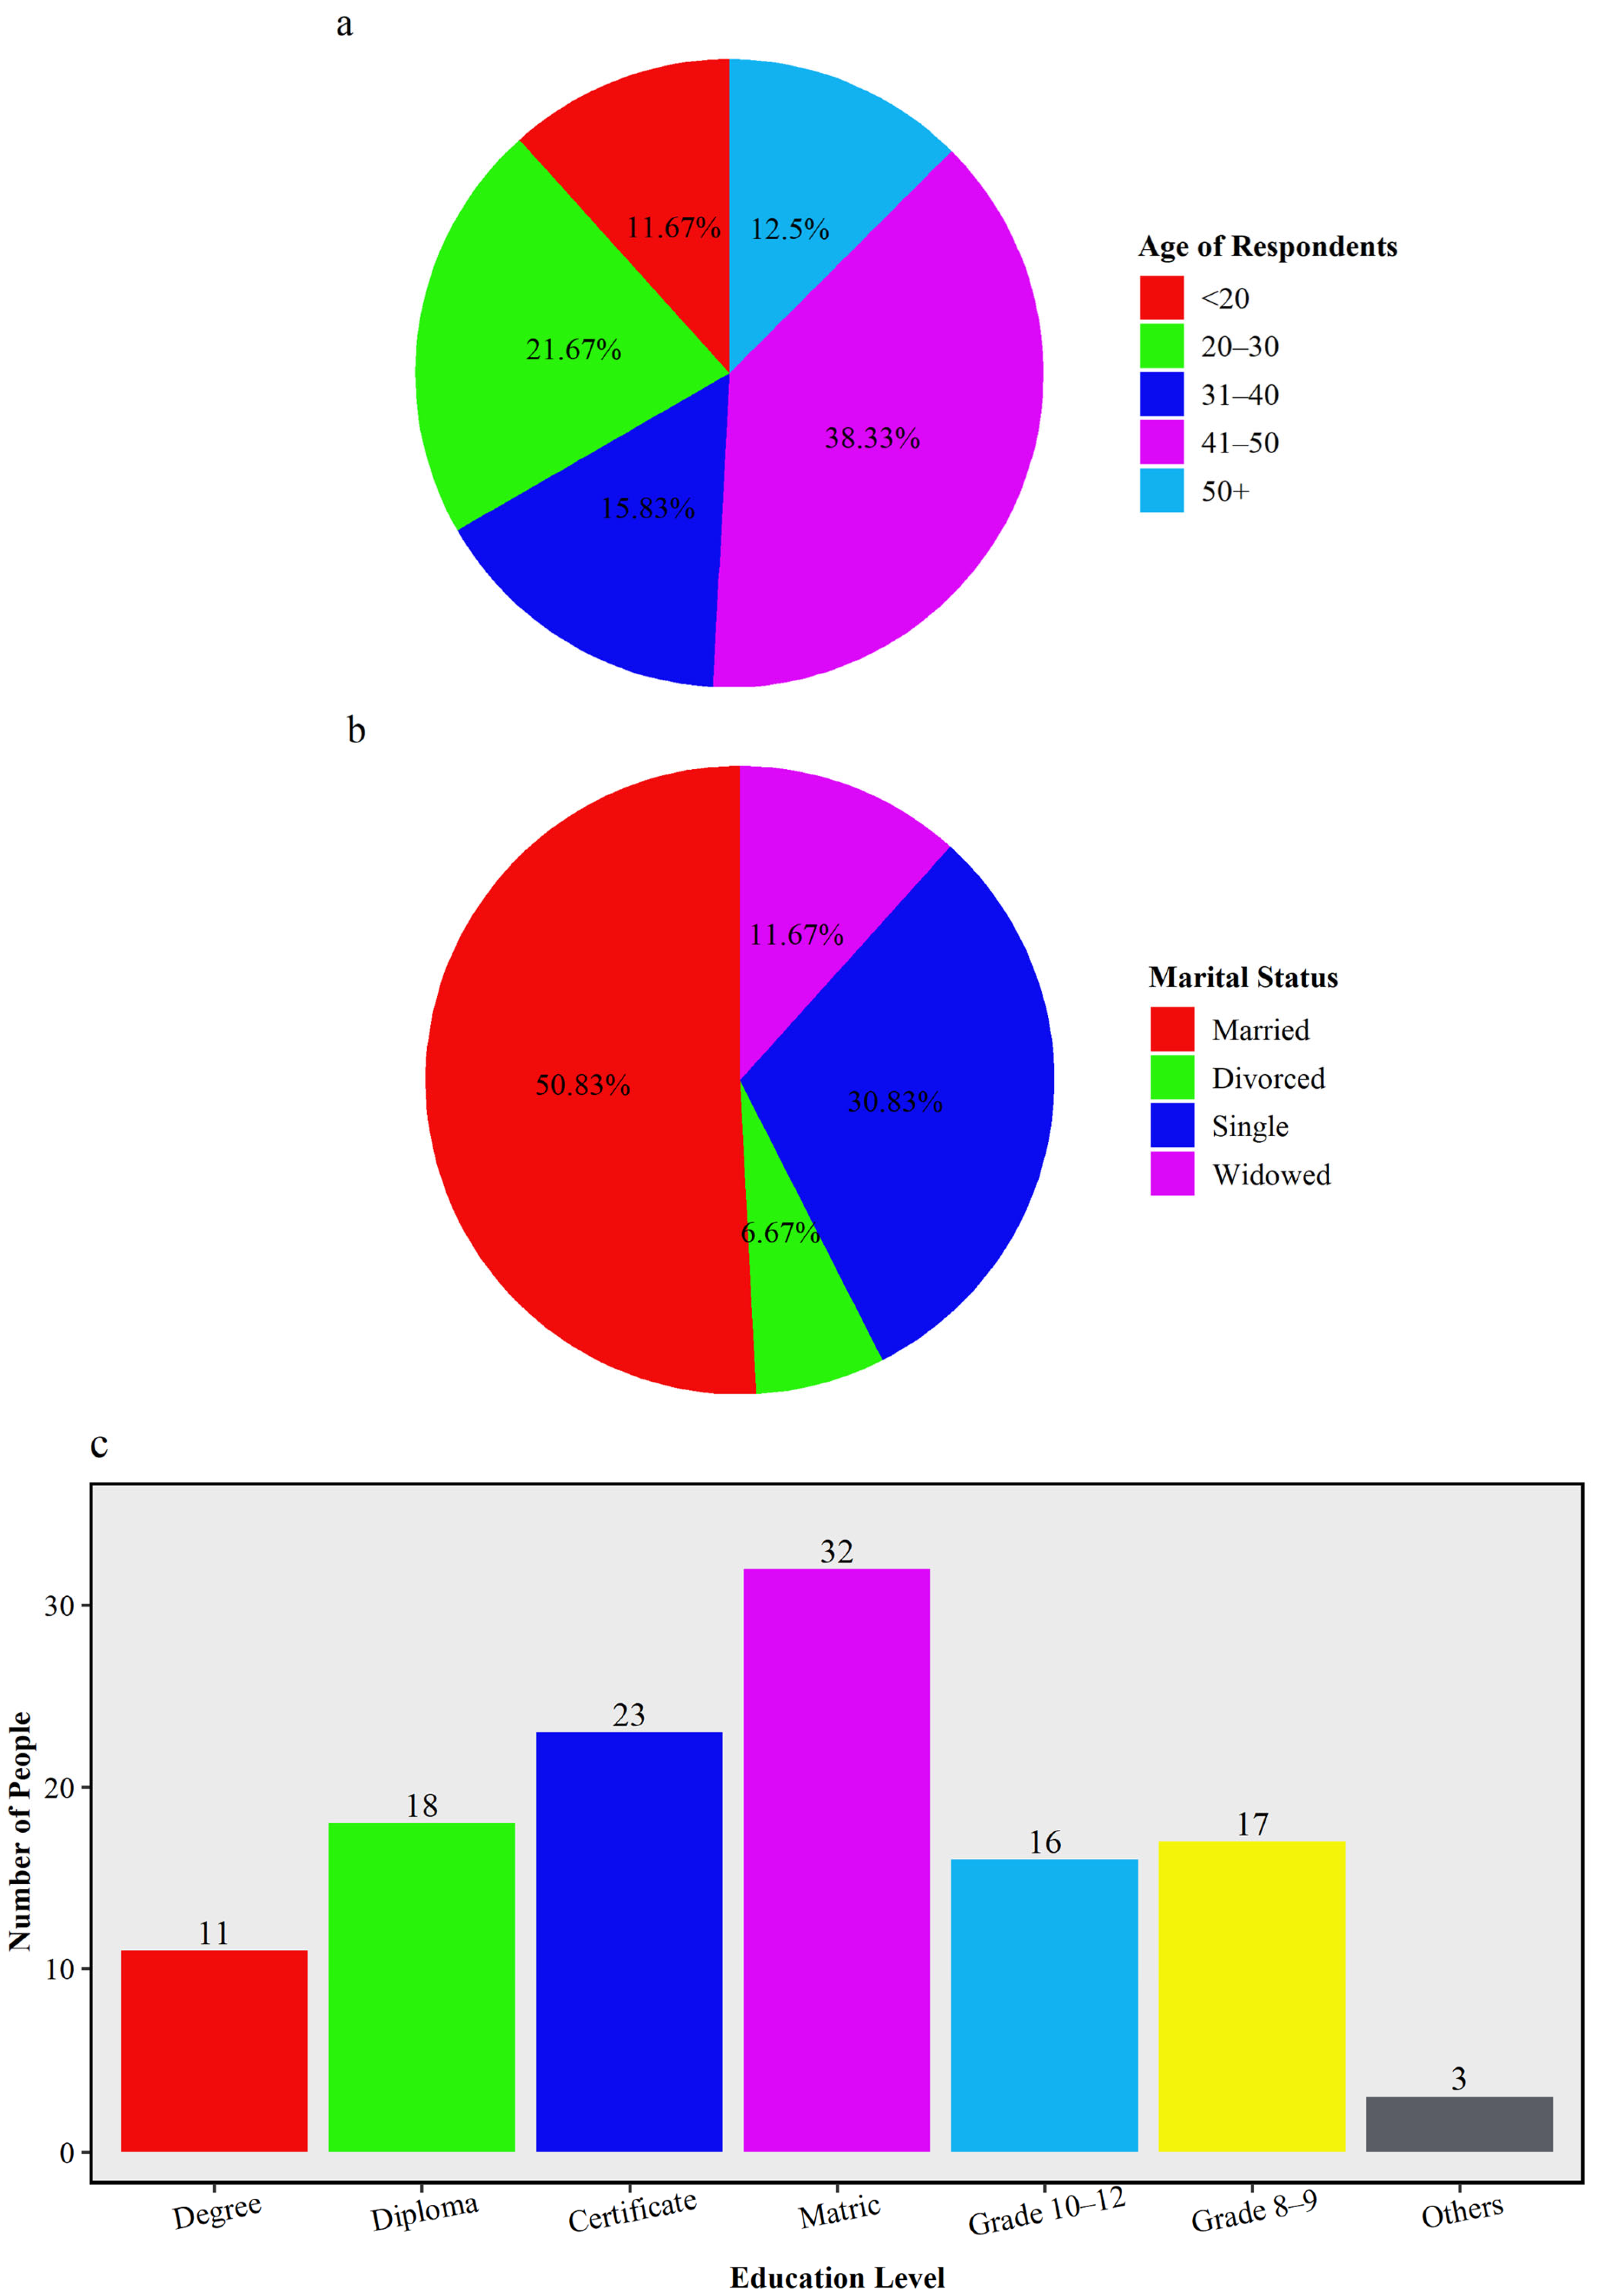
In terms of age, the largest group of respondents was between 41 and 50 years old, followed by those between 20 and 30 years old (Figure 6a). Only 12.50% of respondents were above 50 years of age. This suggests that most respondents or samples fall within the economically active age bracket, are highly engaged in agricultural activities, and are therefore most vulnerable to drought. Younger respondents (below 20), who accounted for fewer than 20%, were fewer in numbers, reflecting patterns in rural Limpopo, where many youths migrate to urban areas or centers for employment [58]. Adults in their 30s and 40s bear the brunt of drought’s effects as they support dependents, repay loans, and maintain small-scale farms amid high rainfall variability [59].
Figure 6.
Demographic characteristics of survey respondents in the region illustrating the distribution of (a) age of respondents, (b) marital status, (c) education level.
The marital status results in Figure 6b show that 50.83% of respondents were married, 30.83% were single, while the rest were either divorced (6.67%) or widowed (11.67%). The predominance of married households has important implications for drought vulnerability, as larger households with dependents require more basic needs such as food, water, and income. This strain intensifies during droughts, when agricultural production declines and market prices rise [15].
About 32 (26.66%) of the respondents completed secondary education while 52 (43.33%) of the respondents completed post-secondary qualifications (with a breakdown of 11 (9.16%) people who had degree qualifications, 18 (15%) people who had diploma qualifications and 23 (19.16%) people who had certificate qualifications) and the remaining 36 (30%) was accounted for in grade 10–12, grade 8–9 and Adult Basic Education and Training (Figure 6c). These results indicate that the majority of individuals in the Musina region have completed Matric (Grade 12), although only a few have continued their studies, and only a small portion have obtained the ABET certificate.
The relatively low percentage of tertiary graduates highlights challenges in accessing advanced climate knowledge and adaptation technologies. Previous studies show that education improves adaptive capacity, as educated residents who practice small-scale farming are more likely to adopt drought-tolerant crops, interpret forecasts, and diversify livelihoods [27].
3.4. The Influence of Demographic Characteristics on Drought Severity
The cross-tabulation showing how demographic factors influence drought impacts (Table 1) reveals that marital status had a p-value of 0.019. This value significantly affected perceptions of drought severity. Conversely, gender, age, education, and employment were not statistically significant, with p-values> 0.05. This indicates that household composition largely shapes how communities experience the effects of drought. Married respondents, who often have larger families, reported greater drought severity. This aligns with the study [25], which found that household size increases vulnerability during droughts because consumption needs rise even as production declines.
Table 1.
Cross-tabulation between demographic factors and severity of drought impacts.
Cramér’s V analysis was conducted to determine the strength of the relationships between demographic characteristics and perceptions of drought severity. The results indicated weak associations for all demographic variables. Marital status exhibited the strongest association with perceived drought severity (V = 0.263), followed by gender (V = 0.253), age (V = 0.225), employment status (V = 0.184), and education level (V = 0.161) (Table 2). Although marital status was the only variable that showed a statistically significant Chi-Square result (p = 0.019), the corresponding Cramér’s V value indicates that the strength of the association was weak. Overall, the findings suggest that demographic characteristics have a limited influence on perceptions of drought severity among respondents in Musina Local Municipality.
Table 2.
Determining the strength of relationships between categorical variables.
The strength of the association was interpreted as follows:
- 0.00–0.10 = Negligible association
- 0.10–0.30 = Weak association
- 0.30–0.50 = Moderate association
- Above 0.50 = Strong association
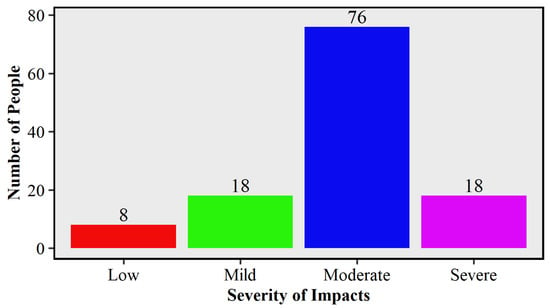
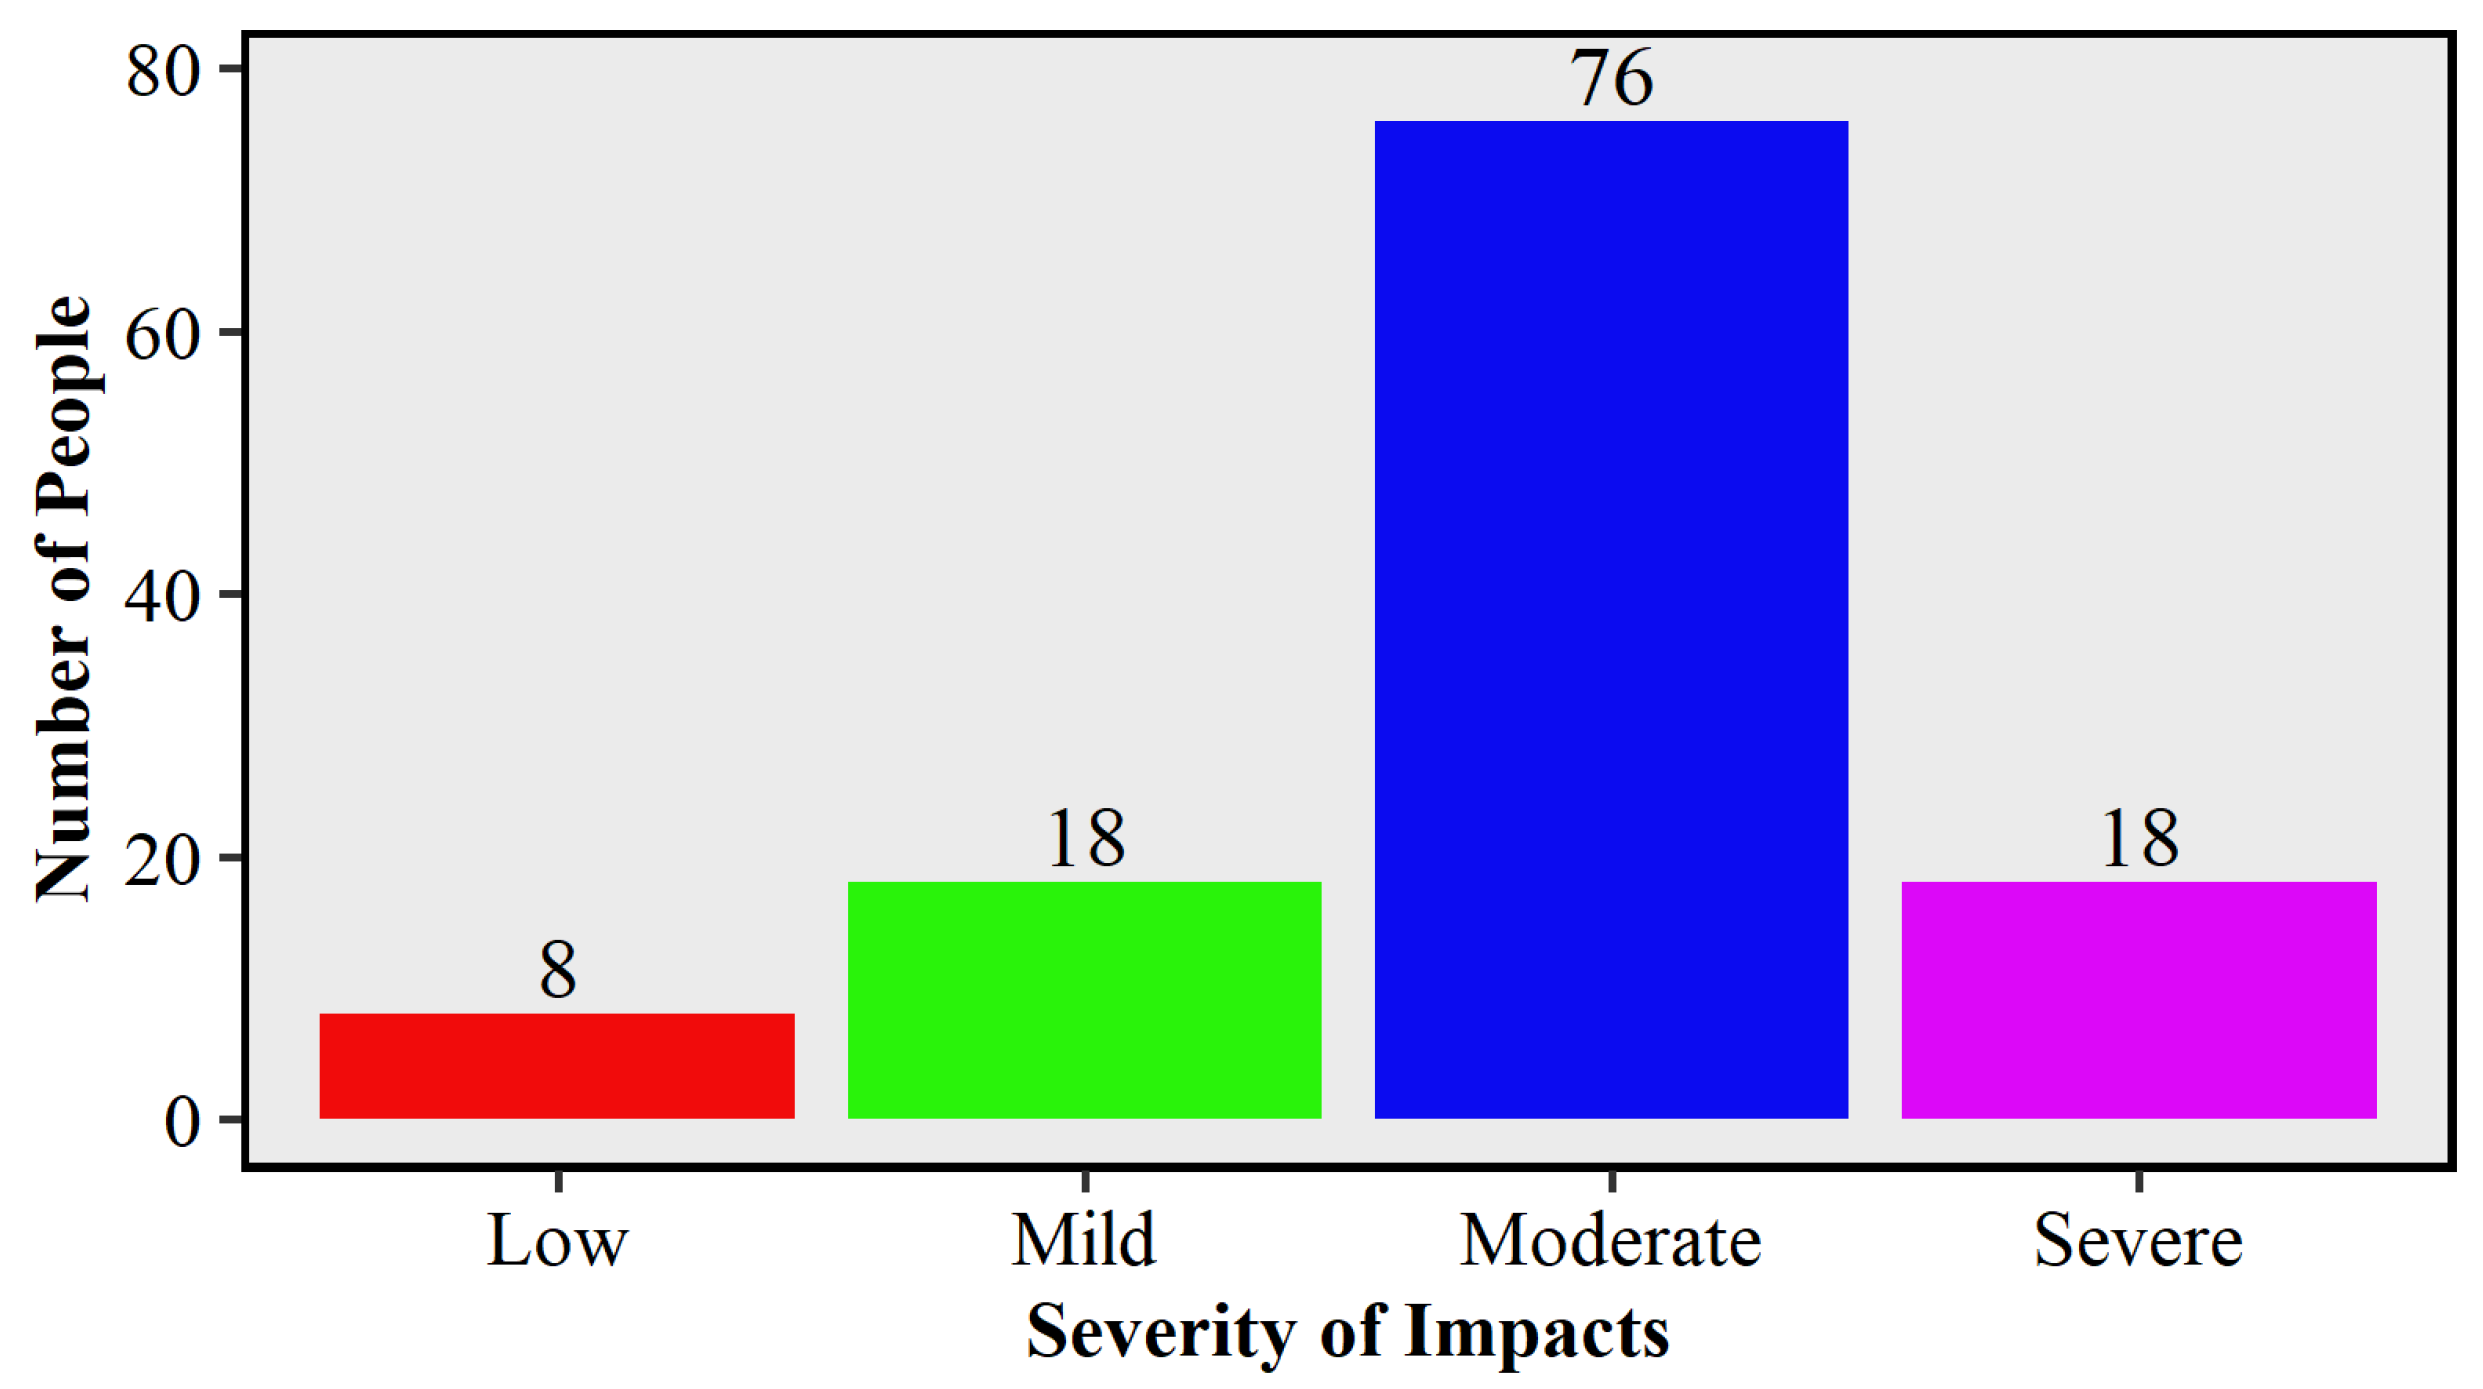
The results in Figure 7 revealed that 63% of respondents rated recent droughts as moderate, 15% as mild or severe, and 7% as low. This means that nearly 4 out of 5 respondents (78%) experience drought as moderate or severe. Such perceptions are consistent with climatic records showing that Musina endured prolonged drought episodes in 2015 to 2016 and 2017 to 2019 with evidence from Figure 5 in which the SPEI shows that these drought events have become frequent although not very severe with severe droughts being recorded only in 1998–1999, 2006 and 2019–2020, associated with El Niño conditions [17,45]. Majority indicated exposure to moderate droughts based on their socio-economic impacts such as loss of crops, and livestock and water shortages of which, in the SPEI graph in Figure 5, mild droughts were the most common compared to mild droughts with six mild drought events recorded in comparison to five moderate droughts. The findings confirmed that local communities perceived drought not as a periodic disruption but as a persistent and intensifying hazard, which resonates with [48] projections of more frequent extreme droughts under climate change.
Figure 7.
Drought severity level.
3.5. Socio-Economic Impacts of Droughts on Livelihoods
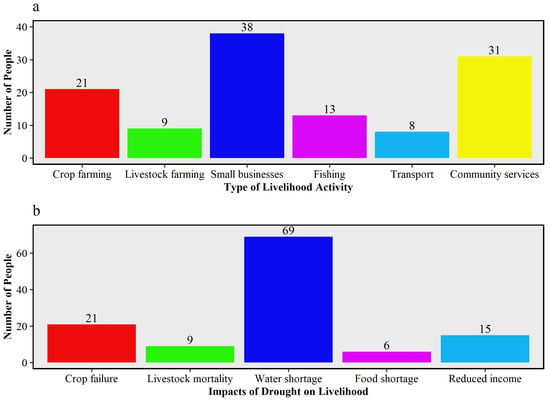
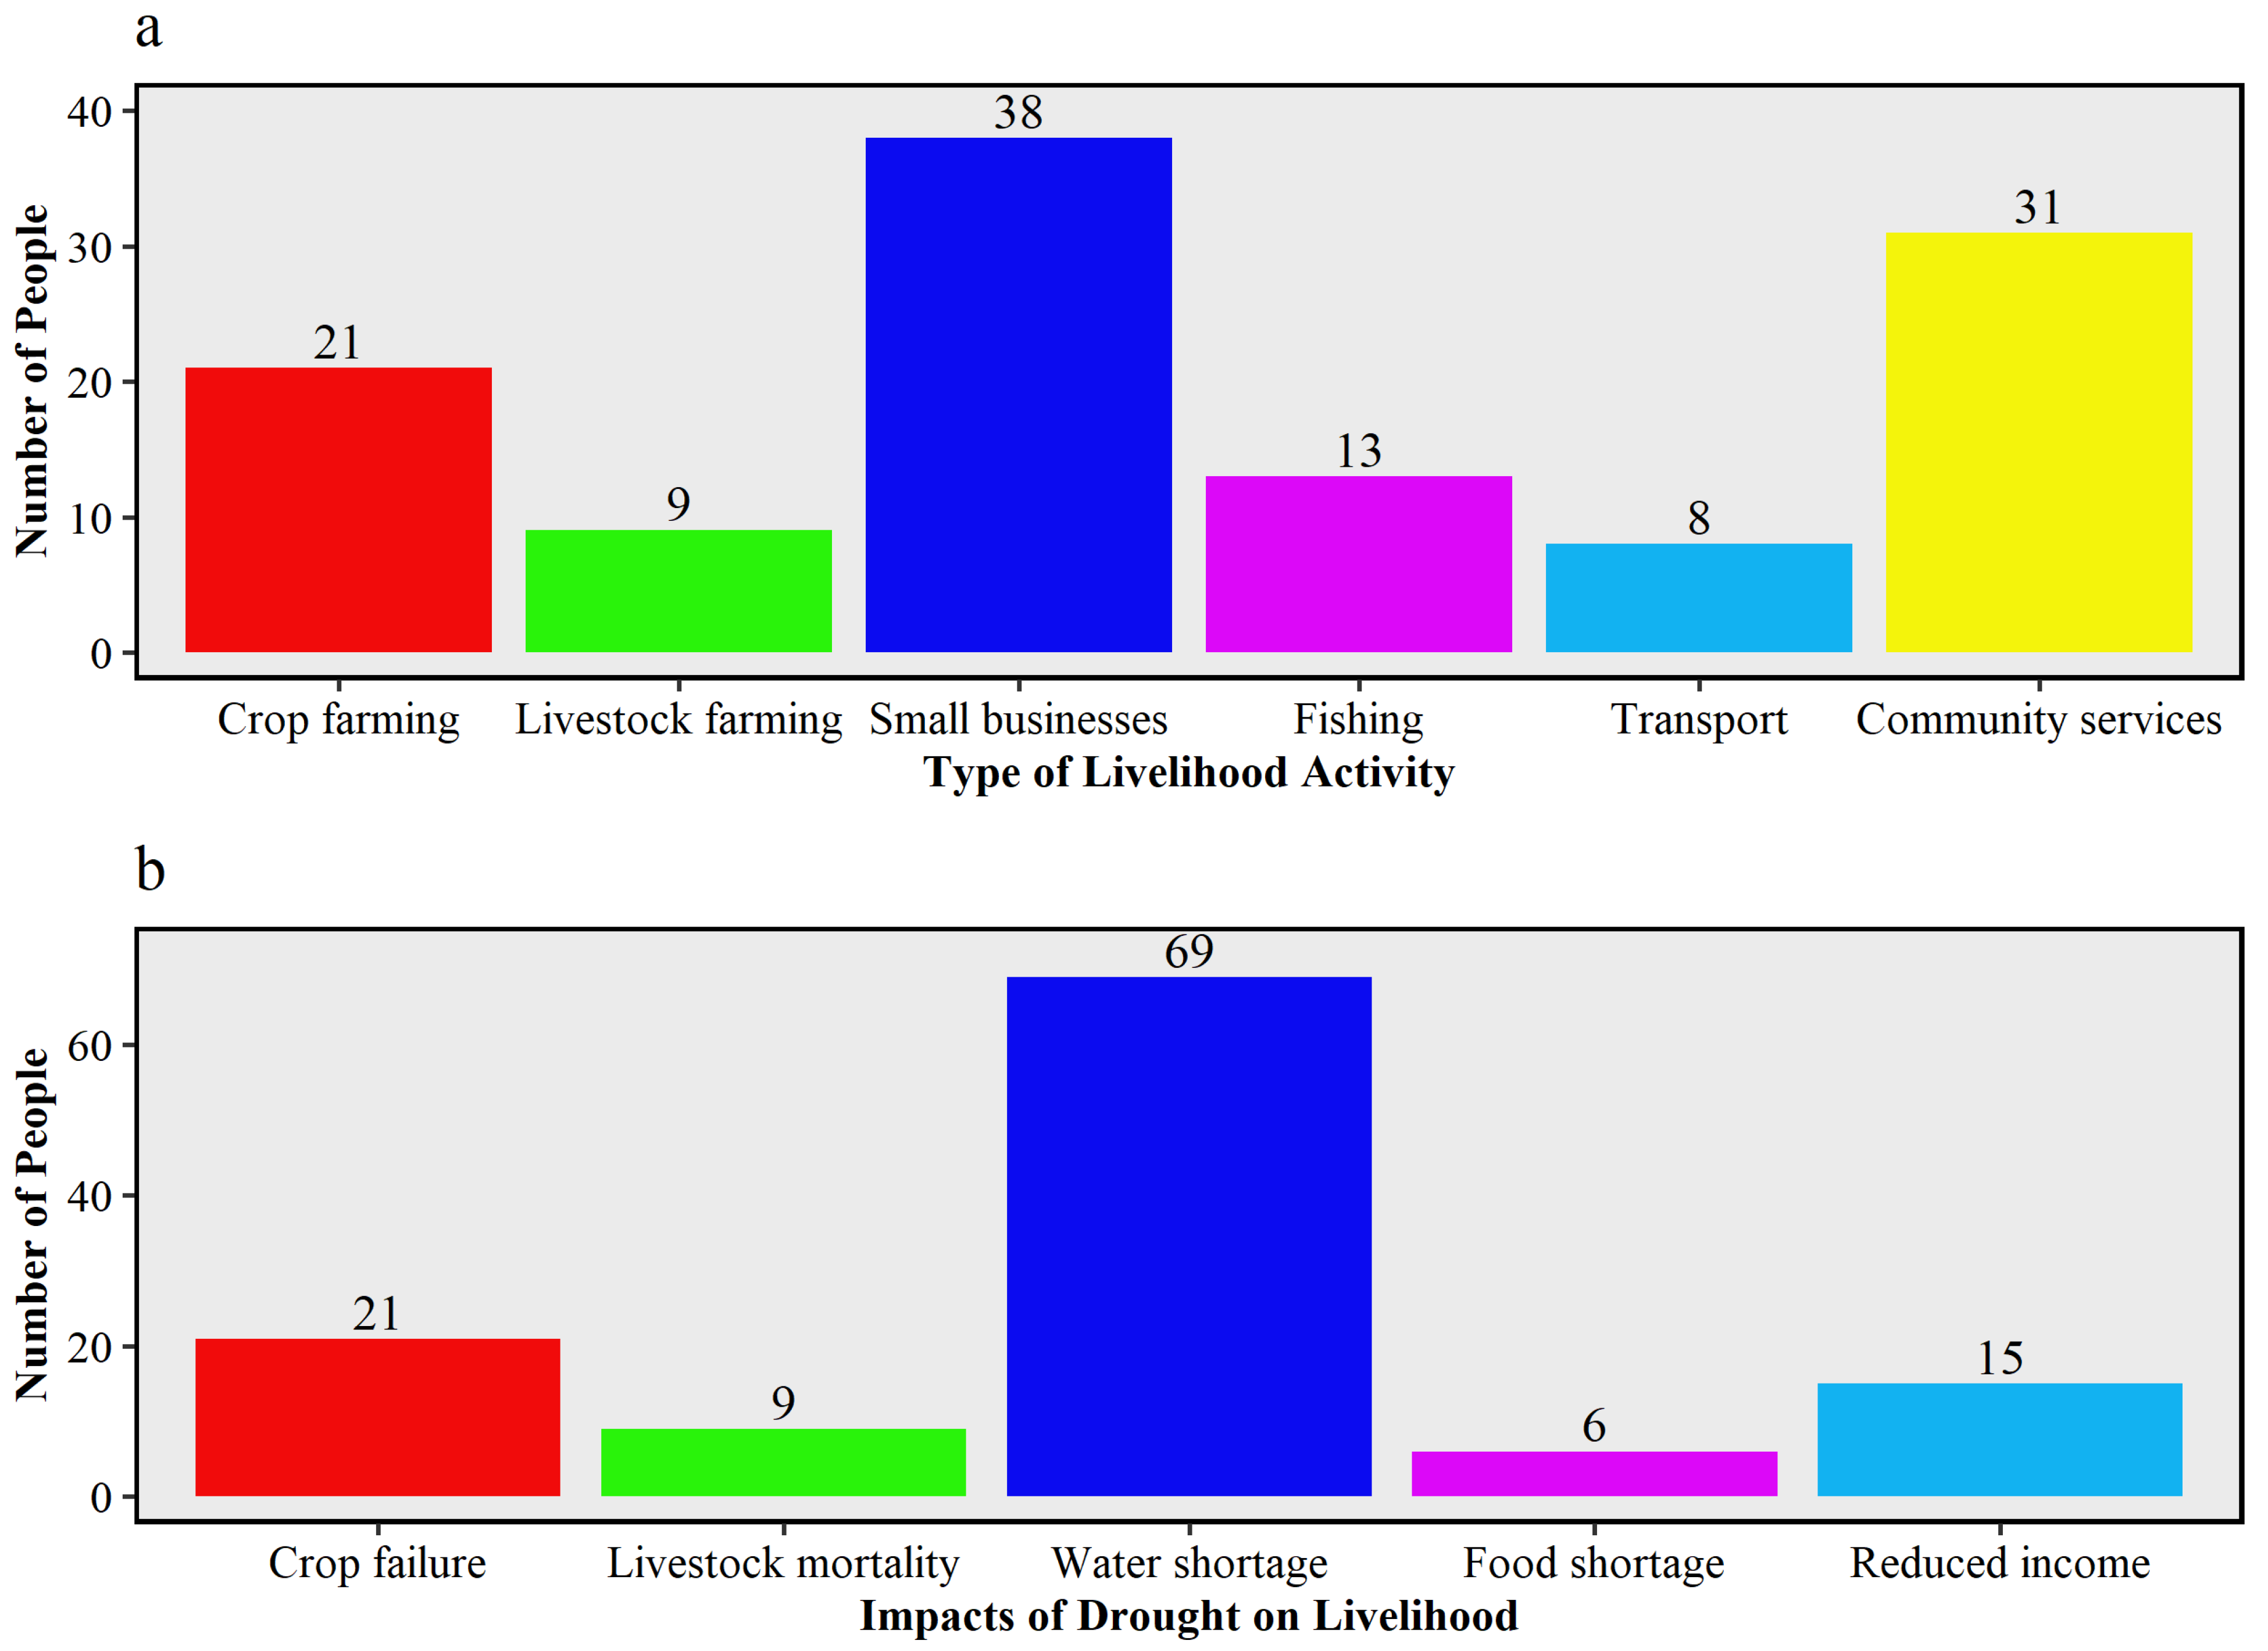
The survey revealed that 25% of respondents depend primarily on farming, either crop or livestock farming, and 31.67% on community services. About 25.83% depend on small businesses, especially informal businesses such as street vendors selling vegetables, and the remaining 17.5% indicated that they depend on the fishing or transport sector. This is shown in Figure 8a below. Musina’s economy is heavily dependent on mining and agriculture [60], but among the livelihood activities affected by drought, only agriculture and the informal sectors are highly climate-sensitive. These livelihood activities face more severe consequences than others, as the informal sector also depends on primary agricultural products [30]. Individuals who practice crop farming face declining yields due to erratic rainfall, while livestock farmers struggle with depleted land and water shortages, which exacerbate livestock mortality.
Figure 8.
Types of livelihood activities (a), impacts of drought on livelihood (b).
Exposure results (Figure 8b) indicate that 17.5% of households experienced reduced crop yields, 7.5% experienced livestock mortality, 57.5% experienced water shortages, and the remaining 17.5% experienced food insecurity or reduced income. The observed rainfall variability and frequent drought conditions have important socio-economic implications for Musina Local Municipality, where many households depend on rain-fed agriculture, livestock farming, and informal economic activities. Water scarcity is prevalent, indicating that reduced rainfall due to drought exacerbates water availability [13]. Most communities in Musina practice rainwater harvesting using 150 L drums and 20 L buckets, making rainwater a source of water for domestic use, but this practice is increasingly threatened by prolonged droughts. Water shortages (57.5%) not only reduce water available for domestic purposes but also lead to livestock mortality (7.5%) and reduced crop yields (17.5%). These water shortages are associated with the increasing minimum (from 21 °C to 23 °C), and maximum temperatures (34 °C) and temperature anomalies with an average of −1 °C which result in the loss of moisture on the surface.
This reported crop-related loss affecting 17.5% of the sampled population aligns with [61], who emphasized that Limpopo’s rain-fed agricultural systems are the most drought-sensitive. As is shown in Figure 8b, water shortages represent the most significant impact on households in Musina and directly affected crop yields. Livestock mortality also reflects prolonged dry spells that limit both water and grazing resources [28,62]. These impacts reinforce the socio-economic burden of drought, as agriculture supports both livelihoods and food security in Musina.
3.6. Household Coping Strategies in Response to Drought
3.6.1. Type of Coping Mechanism Strategies Adopted by Community Members
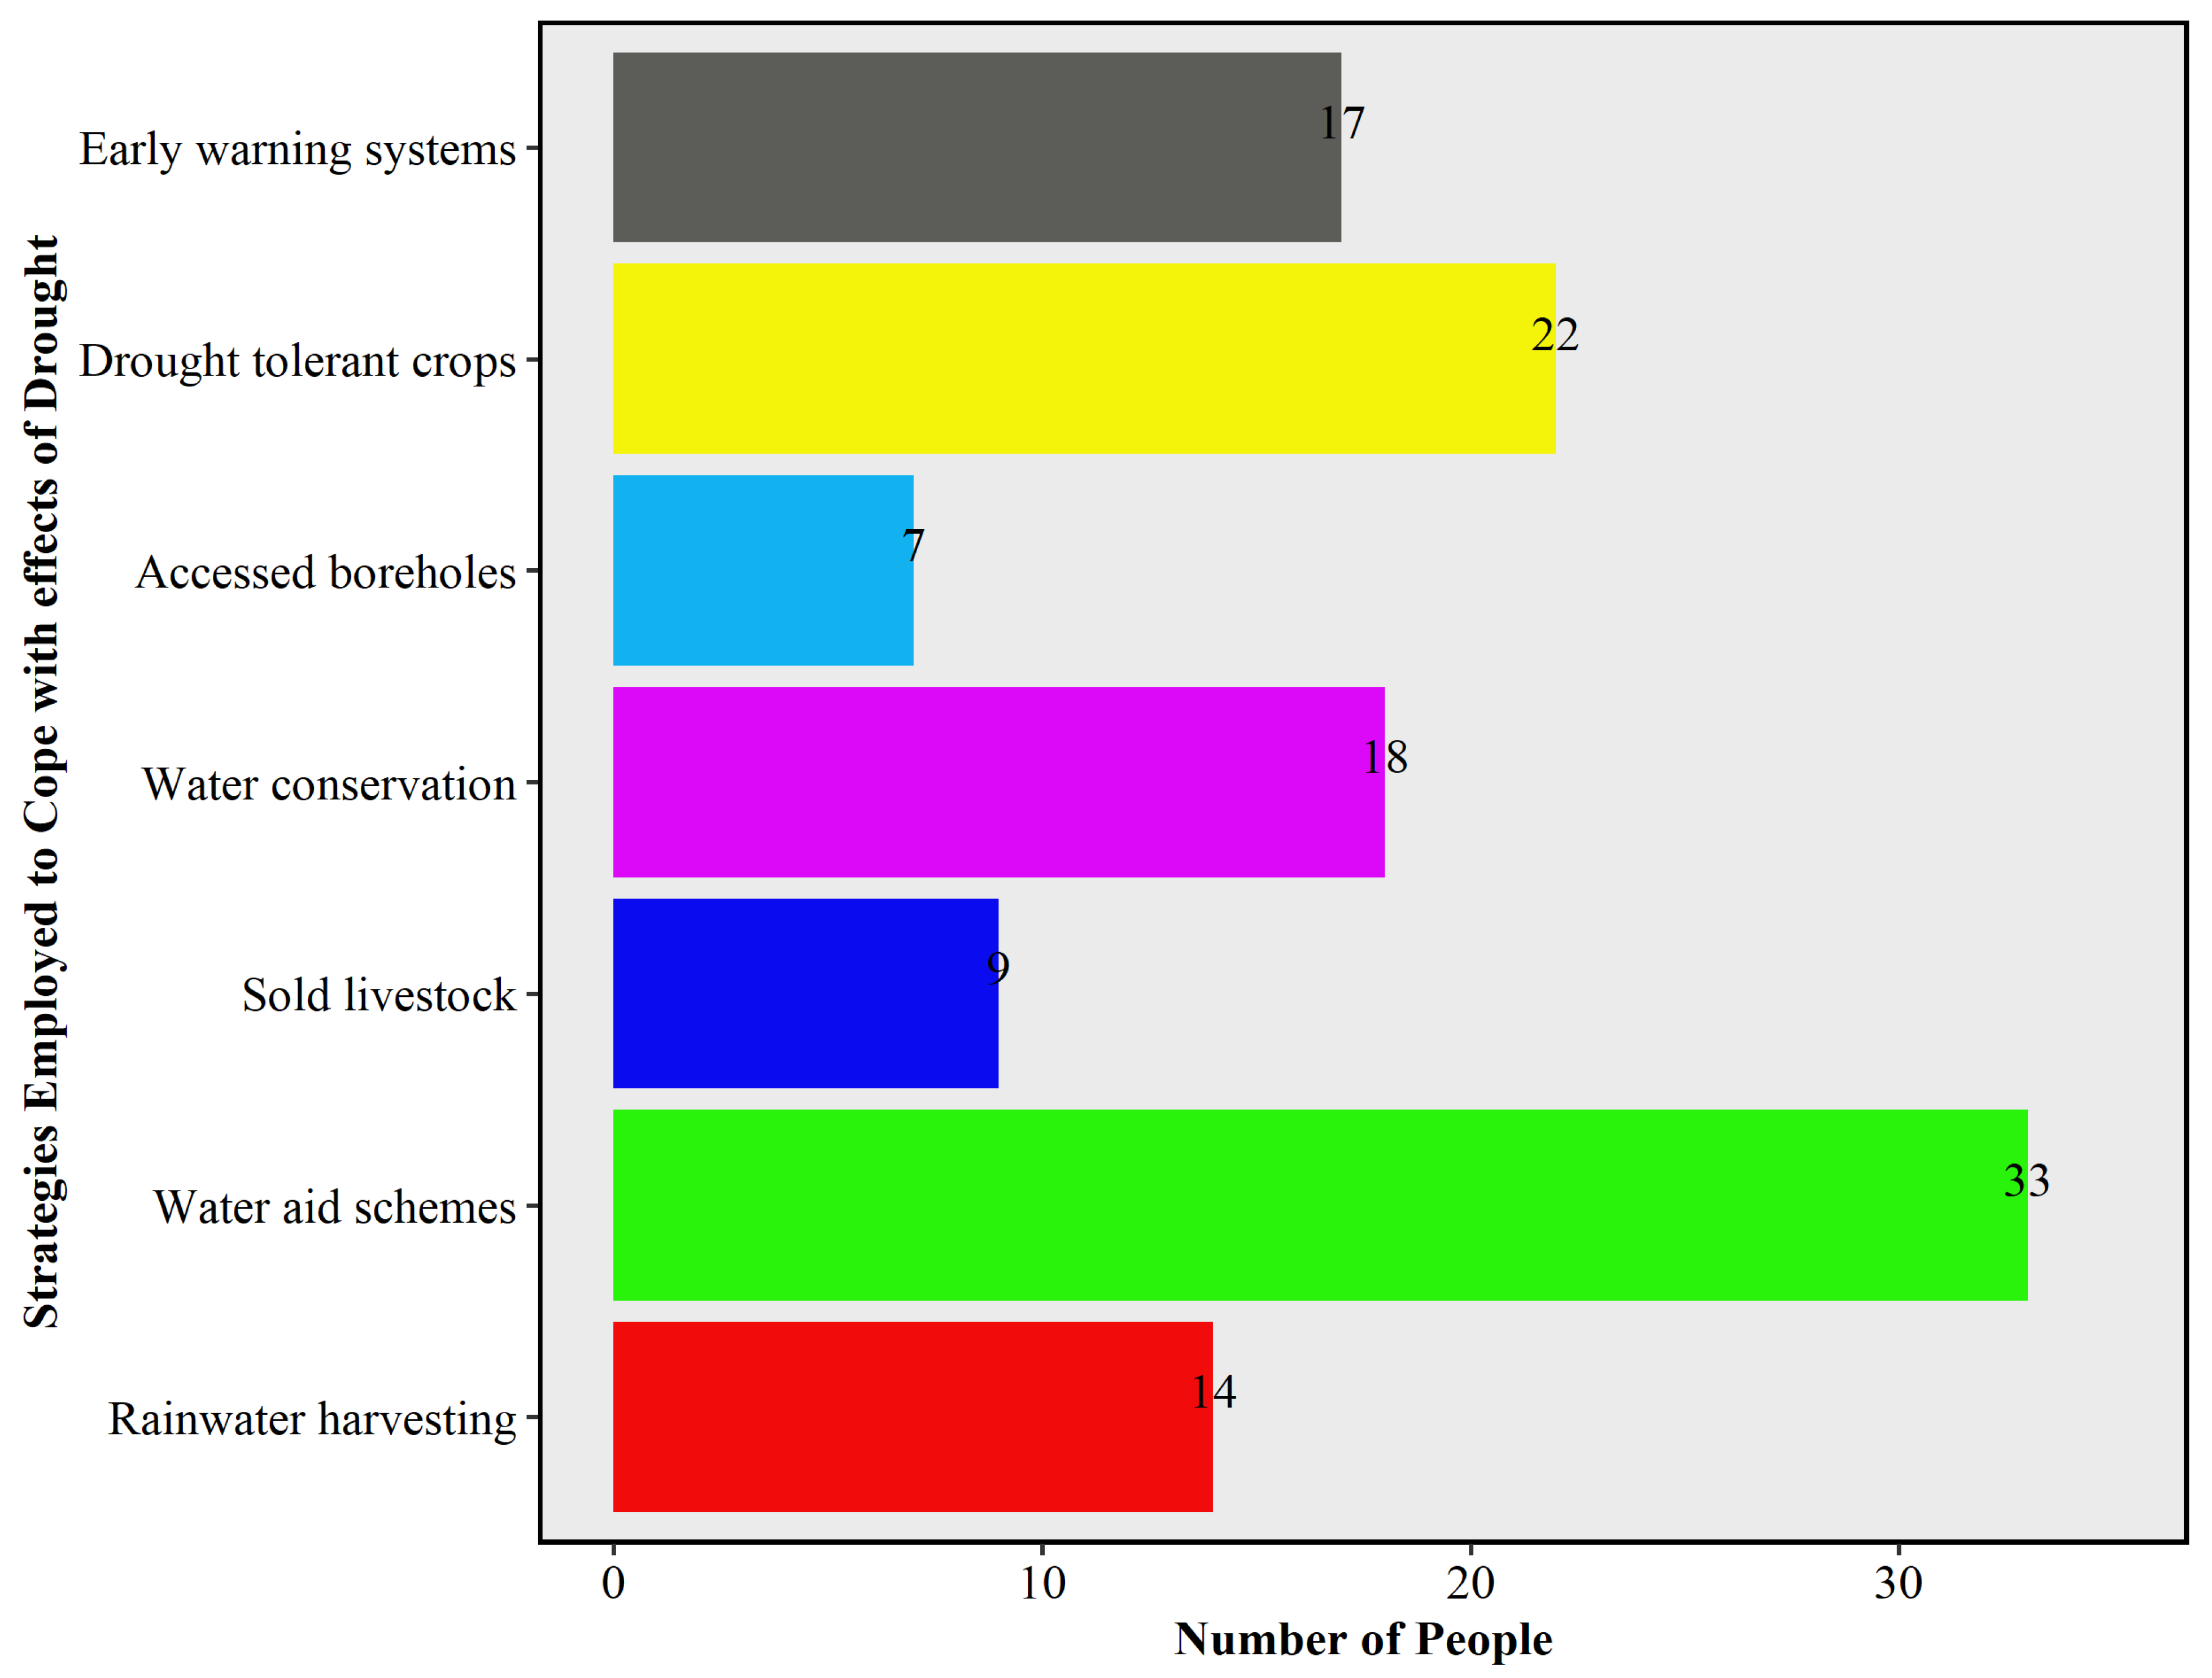
Figure 9 below outlines the coping strategies employed, showing that the most common strategies included were water aid schemes which constituted 27.5% of the coping strategies that the respondents of Musina Local Municipality employed during droughts. Drought tolerant crops constituted 18%, water conservation 15%, early warning systems 14.16%, and the remaining proportions included selling livestock, rainwater harvesting, and accessed boreholes. Water aid schemes are dominant in Musina, as most households face water shortages during droughts, making this an area of concern that requires immediate action.
Figure 9.
Coping strategies employed by communities.
These primarily short-term strategies reflect reactive rather than proactive adaptation; for example, selling livestock during droughts undermines food security and erodes household assets, leaving families poorer in the long run. Ref. [57] argue that in resource-limited communities, such coping strategies dominate because households lack access to advanced irrigation or resistant technologies, early warning weather forecasts or systems, and the knowledge needed to navigate climate-related phenomena. Another notable factor is that most of the coping strategies employed addressed water challenges or water scarcity (nearly 60% of responses). This supports the view that water scarcity is a national challenge, and drought events further exacerbate water availability constraints [13].
3.6.2. Assessment of Drought Relief Measures, Support Structures, and Forecasting Information
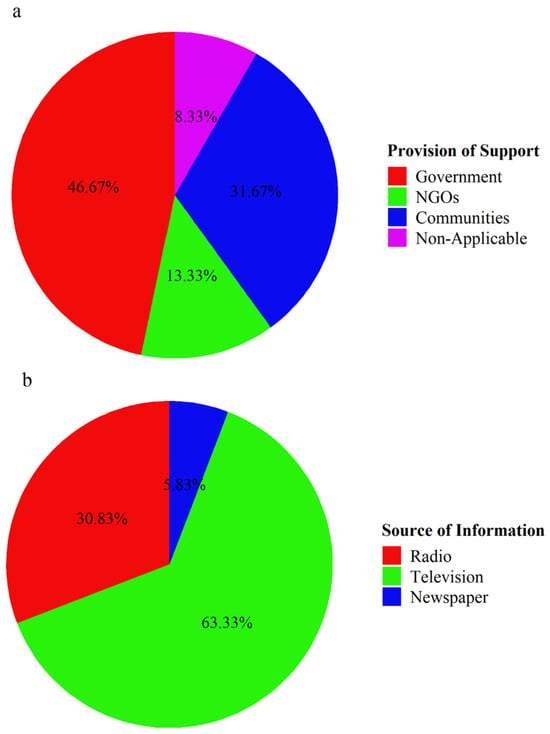
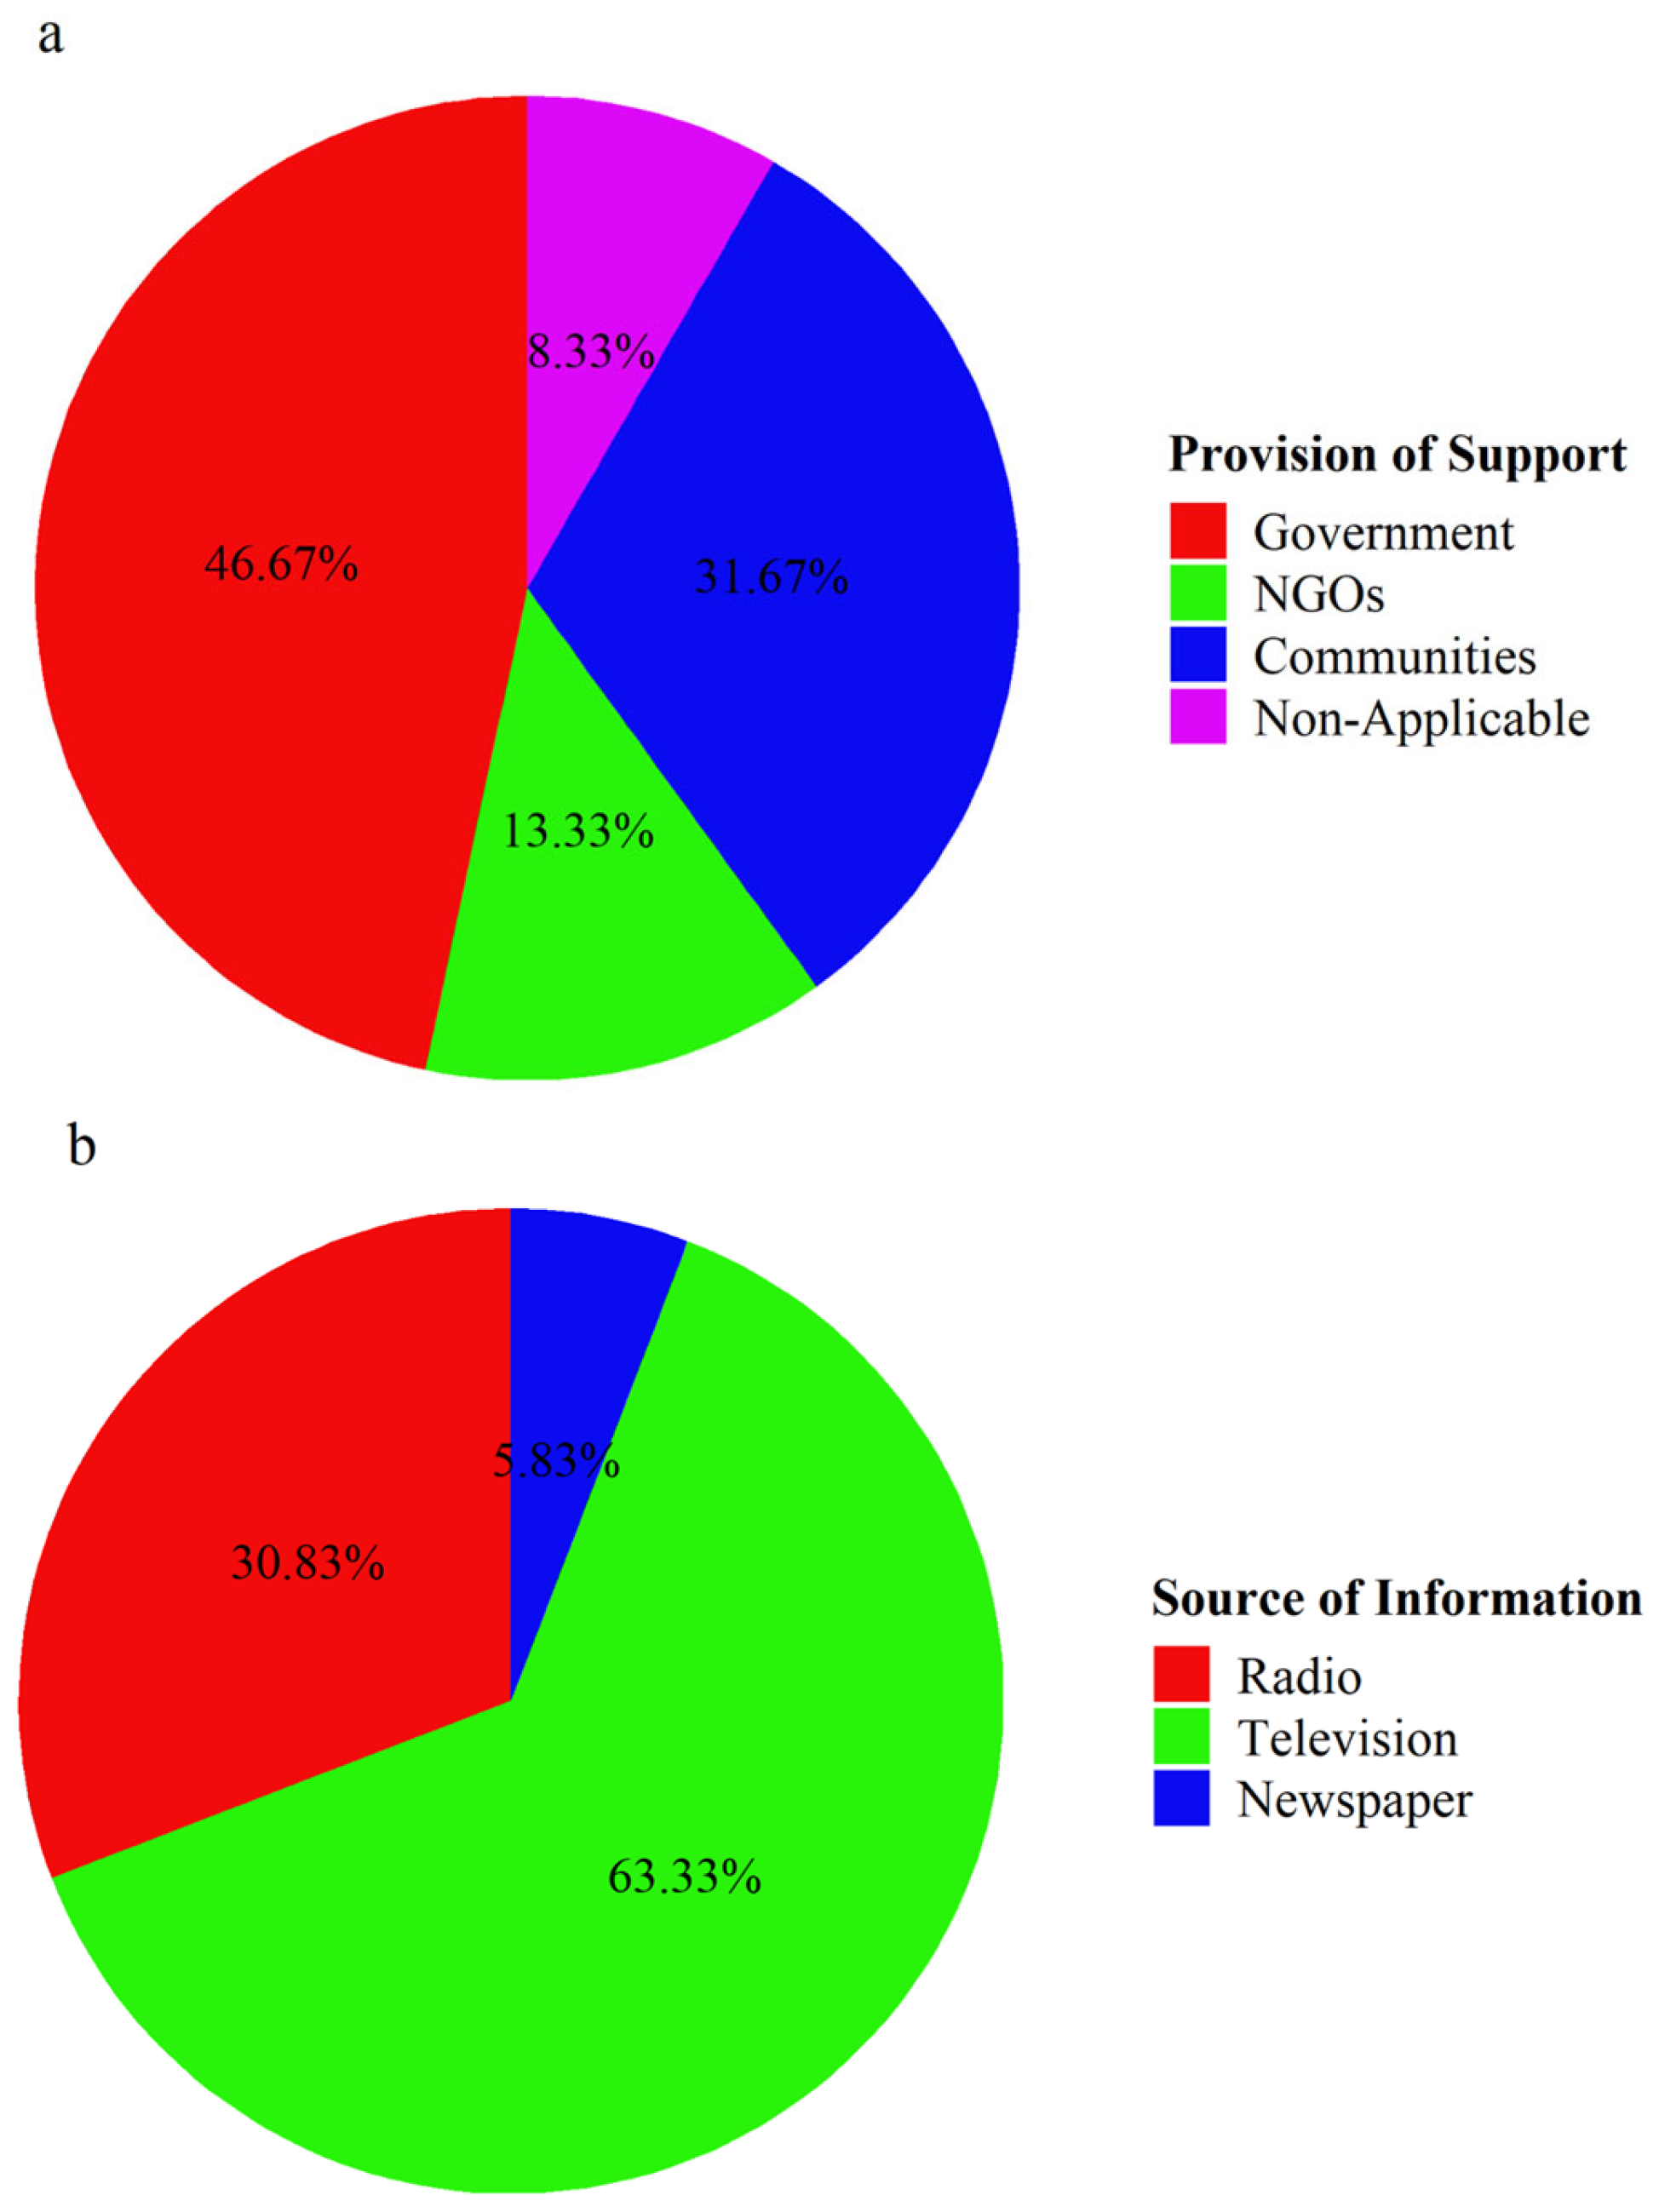
As seen in Figure 10a below, only 46.6% of respondents received government aid, 13.33% benefited from non-government organizations (NGOs), 31.627% were assisted or supported by their neighbors or the community, and 8.3% indicated that they were not supported or did not receive external assistance from any individual, entity, or government organization. This shows that most residents in Musina are heavily dependent on government aid during droughts due to insufficient funds. Only a few individuals or households did not rely on external support during droughts, usually those in the middle class who earn above R 20,000 monthly and have access to boreholes, which helps them during drought-induced water scarcity. This uneven coverage reflects gaps in the distribution of drought relief. Previous research has highlighted delays, inadequate funding, and mismanagement in South Africa’s drought relief systems [62].
Figure 10.
Provision of support during drought events (a), drought-related forecasts and early warning systems (b).
Drought-related forecasts in Figure 10b show that most people (98.33%) received such warnings or forecasts, with only a small percentage (1.67%) of respondents reporting no receipt. Of those who received these drought-related warnings, most relied on television (63.33%), followed by radio (30.83%) and newspapers (5.83%). This shows that in rural areas of Musina, the majority of people lack access to modern forecast systems available on mobile phones, as they still rely on traditional methods such as radio, television, and newspapers for forecasts, which constrains early preparedness [13].
3.6.3. Evolution of Drought Awareness and Future Support Strategies
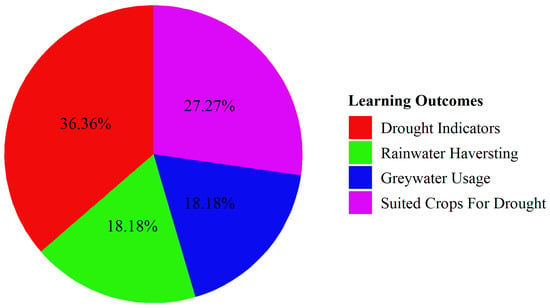
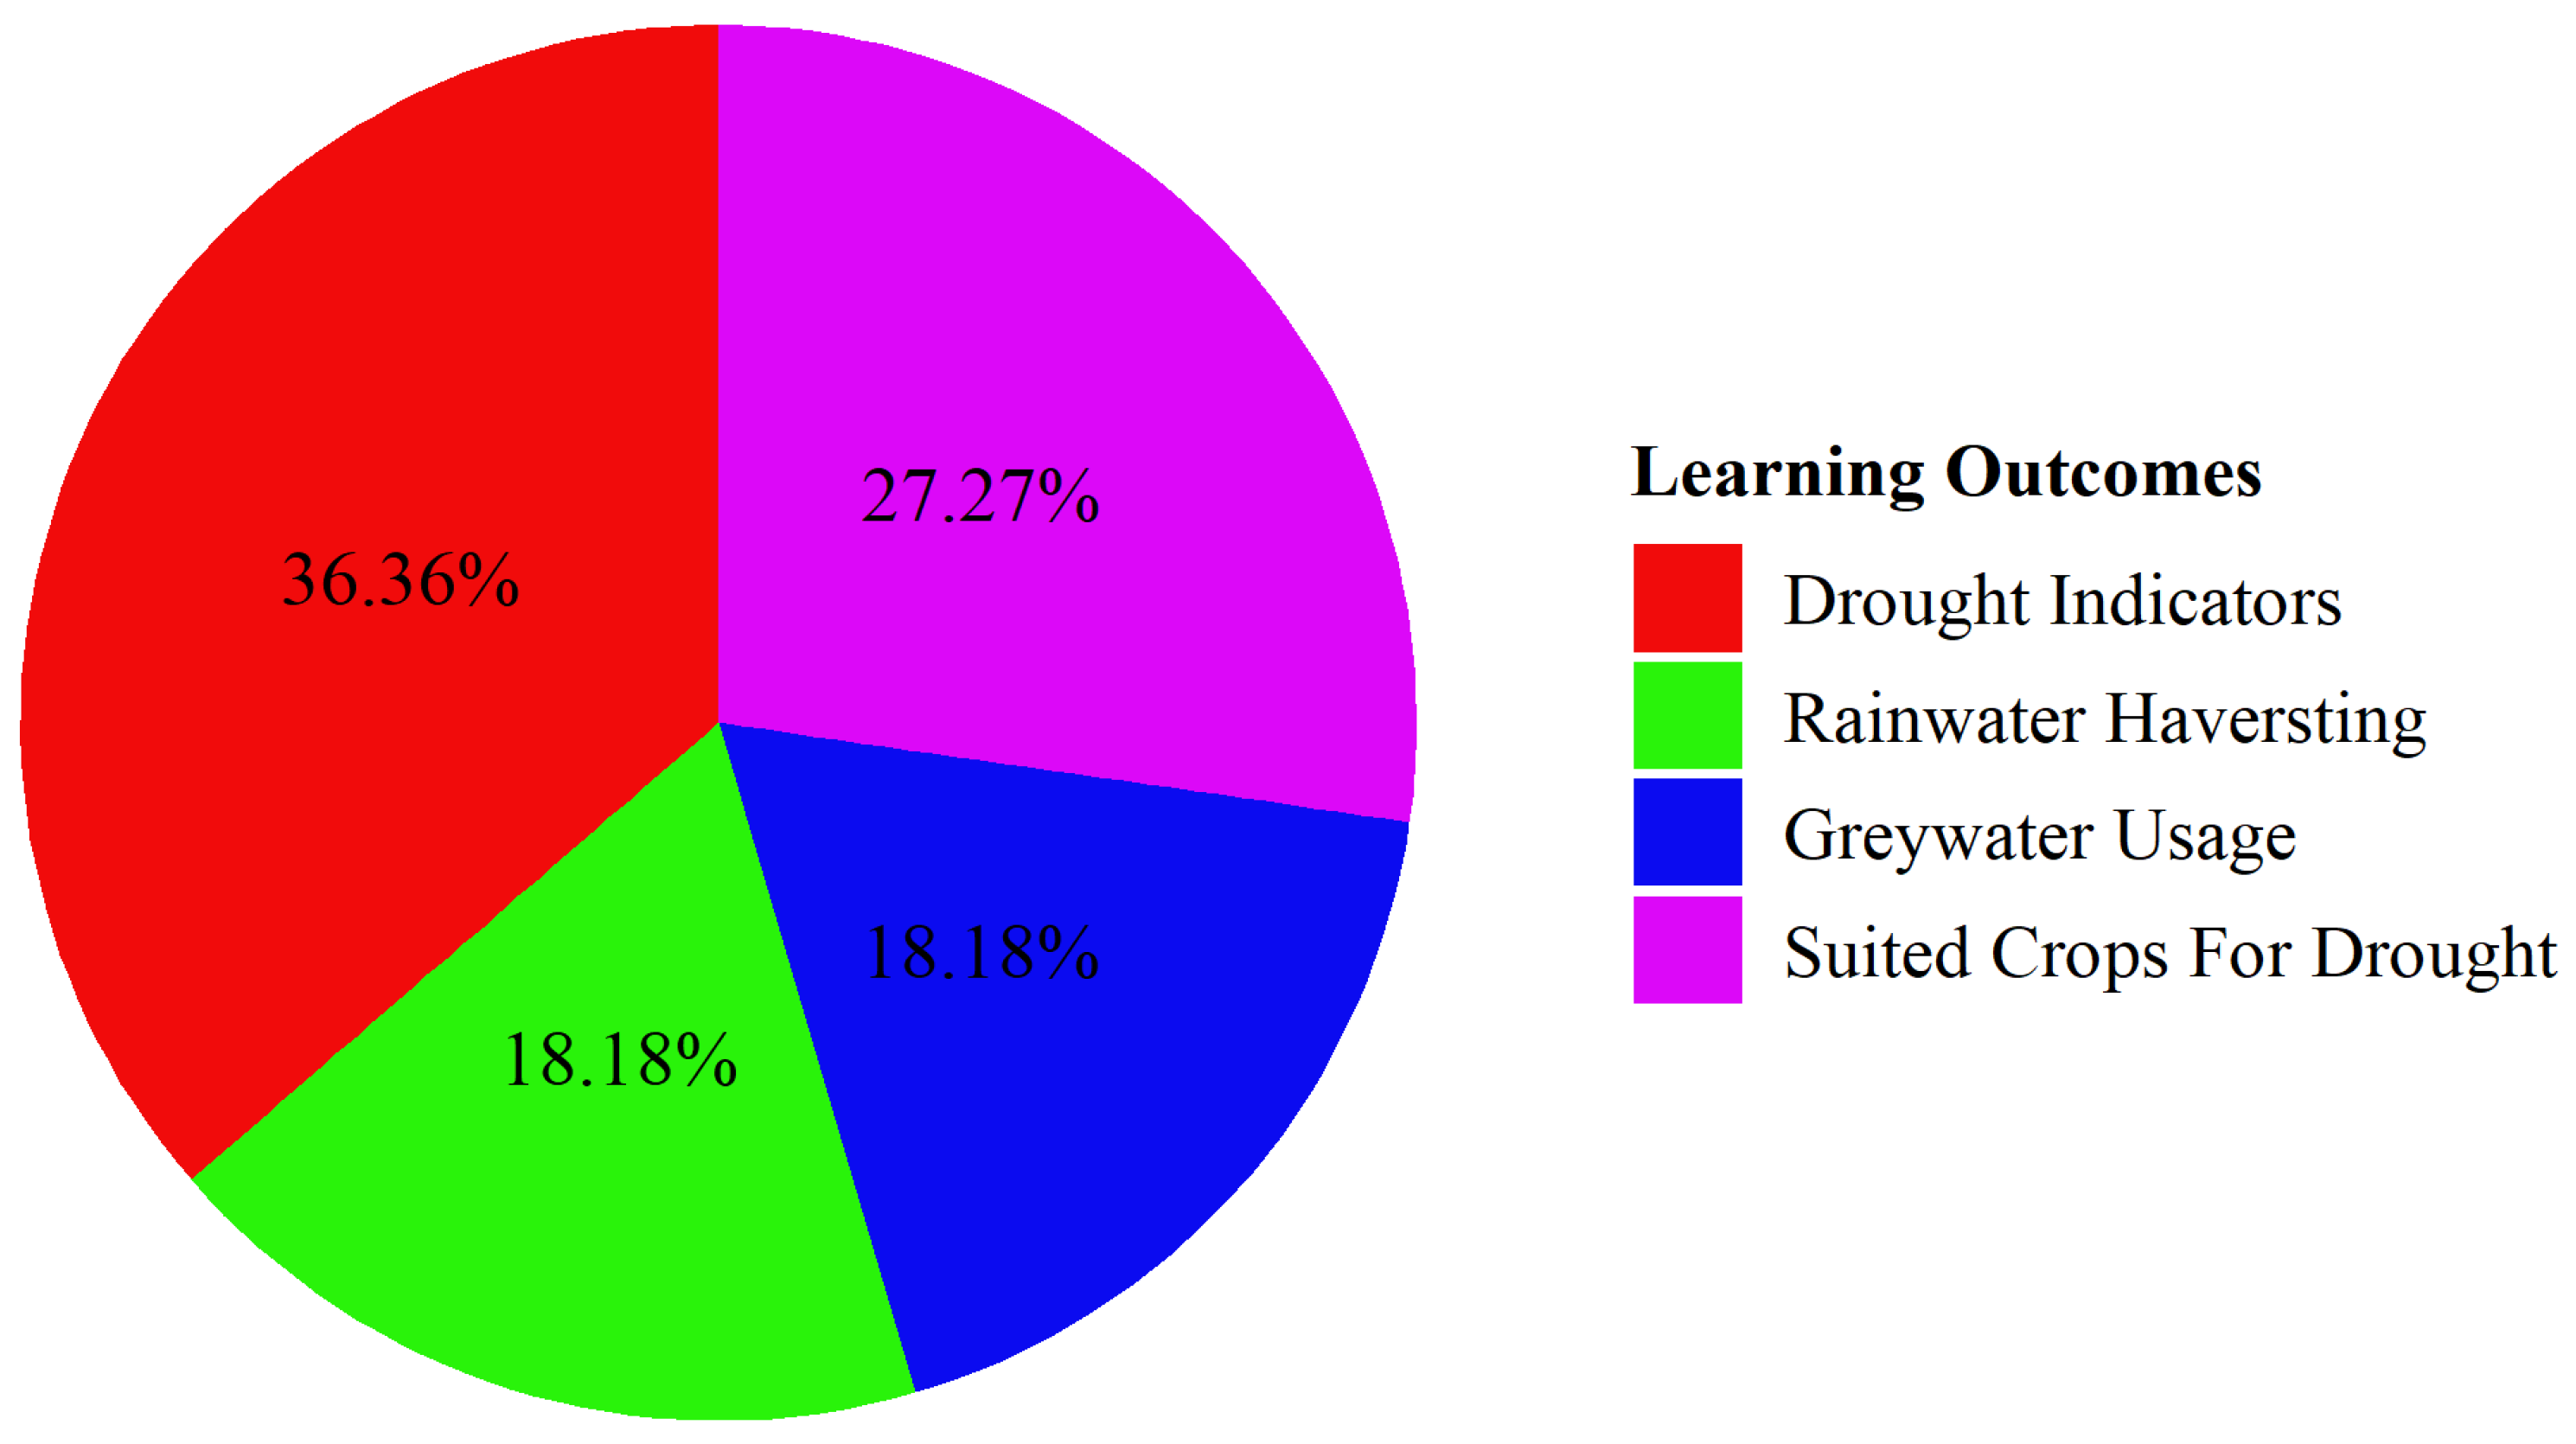
The pie chart in Figure 11 shows that 90.83% of respondents have not attended any drought awareness workshops or training, while 9.17% have attended at least one. Out of the few that have attended awareness workshops, 36.36% learnt about drought indicators such as delayed rain, dry boreholes, yellowing leaves, birds changing routes, and ants digging deeper as the water table drops during drought periods, and 27.27% of the respondents learned about the crops better suited for droughts, while the remaining 36.37% of respondents either learned about rainwater harvesting or gray-water usage. The high percentage of respondents who learned about drought indicators shows that most people were not aware, which led to less preparedness during drought periods [13]. This shows a strong need for awareness, aligning with [5], which stresses the importance of community-based education in strengthening drought resilience.
Figure 11.
Drought awareness workshops and learning outcomes.
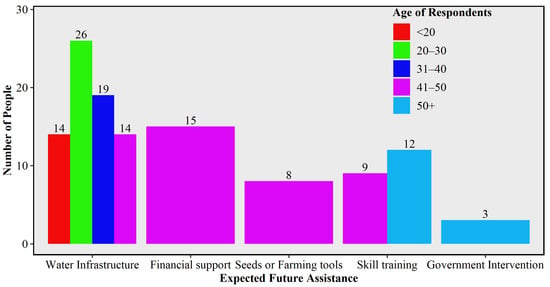
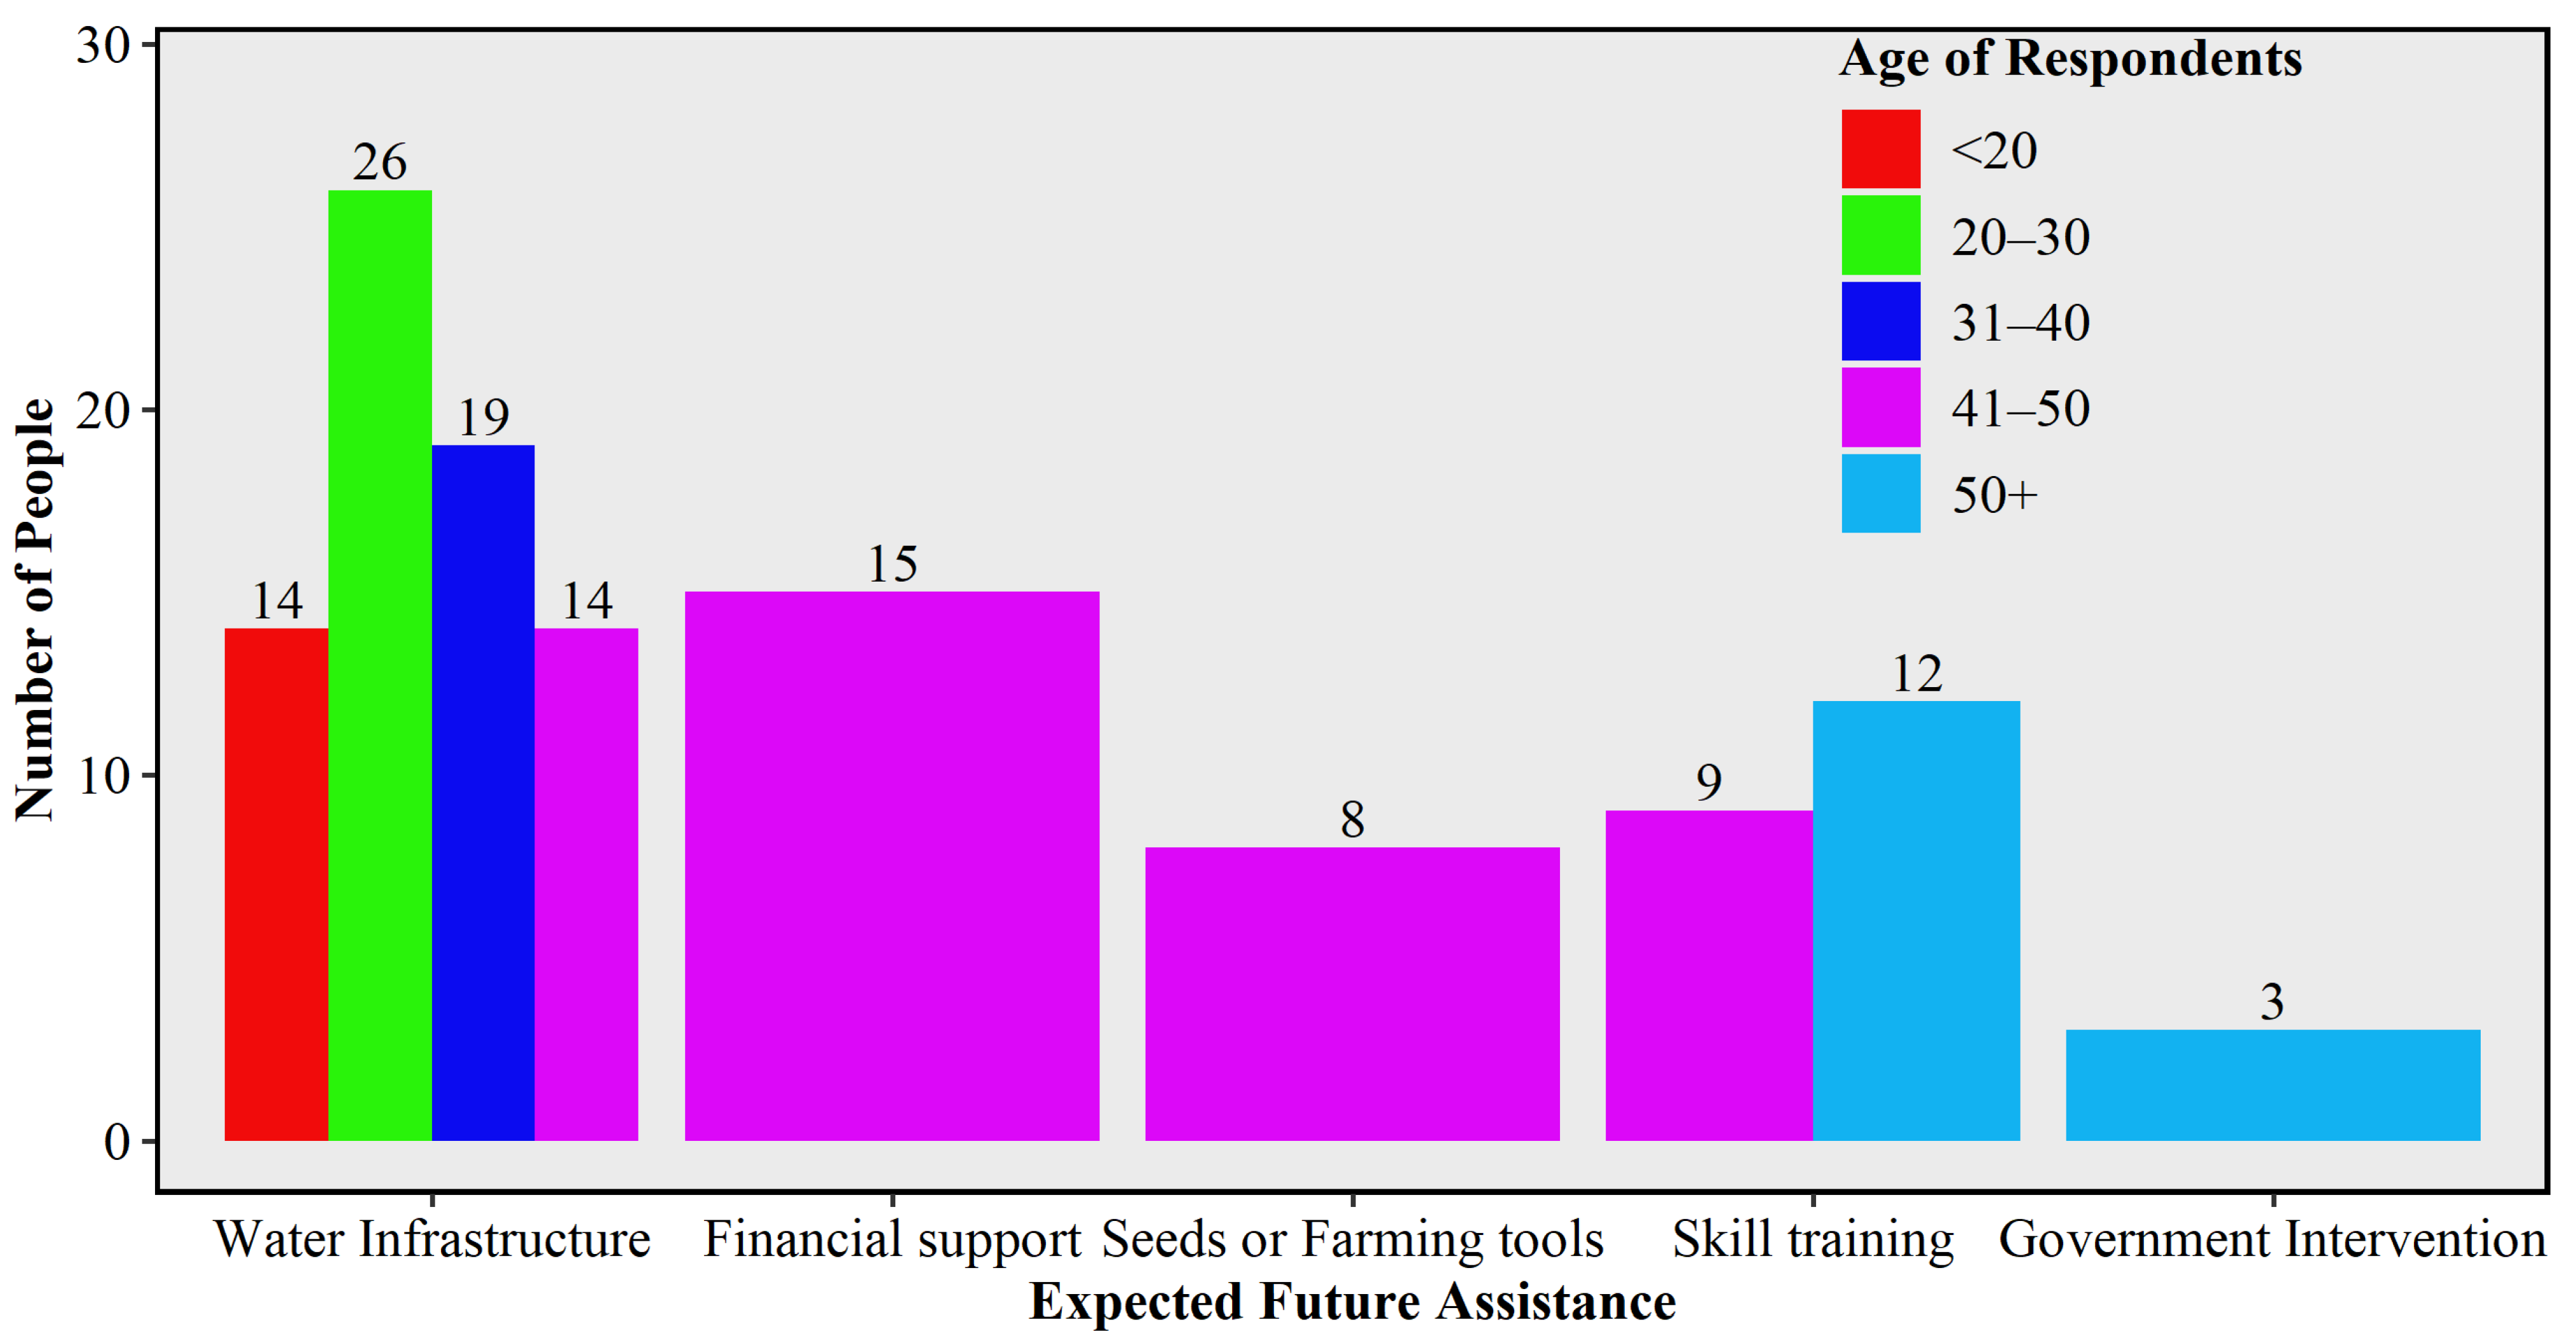
Figure 12 below shows that demographic composition, livelihood reliance, and adaptation responses are deeply interconnected. Middle-aged, married households relying on small-scale farming were the most affected and perceived droughts as increasingly severe. Coping was mainly reactive, through food rationing and social networks, while formal relief was inconsistent, and access to forecasts was limited. Most respondents indicated a need for water infrastructure in the future, further strengthening the view that Musina faces water challenges, and nearly 90% of respondents are severely affected by these challenges. This confirms that Musina communities remain highly vulnerable to recurrent drought, and resilience requires stronger investment in education, early warning dissemination, and reliable institutional support [27,46].
Figure 12.
Number of people, age, and expected future assistance.
4. Conclusions
This study investigated spatiotemporal drought trends and adaptation strategies in Musina Local Municipality from 1991 to 2023. The results depicted that the region is highly drought-prone, with rainfall patterns becoming more erratic and drought episodes more frequent in recent decades. The findings revealed that Musina has experienced increasingly frequent drought conditions, with more than 14–15 drought events recorded during the study period. Drought occurrence intensified after 2010, with approximately 15 drought episodes occurring between 2010 and 2023 compared to about nine episodes between 1991 and 2009. The extreme drought events were identified during 1991–1992 and 2016, as indicated by strongly negative SPEI values. Climatic analysis further showed that minimum temperatures increased from approximately 21 °C in the 1990s to 23 °C in the 2010s, while maximum temperatures increased from about 30 °C to 32 °C, contributing to increased evapotranspiration and drought severity. Rainfall remained highly variable, with summer rainfall ranging from 40 mm in the driest areas to 150 mm in relatively wetter parts of the municipality.
The socio-economic findings demonstrate that drought has significantly affected local livelihoods and water security. Among the 120 respondents surveyed, 63% perceived recent droughts as moderate, while 15% perceived them as severe. Water shortages were identified as the most significant impact, affecting 57.5% of households, followed by reduced crop yields (17.5%), food insecurity and reduced income (17.5%), and livestock mortality (7.5%). Furthermore, only 46.6% of respondents reported receiving government drought assistance, while 90.83% had never attended drought-awareness training workshops. Although communities have adopted coping strategies such as water aid schemes (27.5%), drought-tolerant crops (18%), water conservation practices (15%), and early warning systems (14.16%), vulnerability remains high due to persistent water scarcity, limited infrastructure, and increasing climate variability. The findings highlight that drought has significantly disrupted agricultural production, water supply, and local livelihoods, leaving many households vulnerable. At the same time, this study found that communities employ diverse adaptation strategies, including indigenous coping mechanisms, livestock management adjustments, and the adoption of climate-smart agricultural practices. However, these strategies are often limited by financial constraints, weak institutional support, and inadequate access to modern technologies.
Furthermore, building long-term resilience against drought in Musina requires an integrated approach that combines scientific research, traditional knowledge, effective governance, and community participation. Strengthening water infrastructure, promoting climate-smart agriculture, diversifying livelihoods, and enhancing education and awareness will not only reduce vulnerability but also help achieve broader Sustainable Development Goals (SDGs), such as zero hunger, clean water, and climate action [48].
The study contributes to the growing body of knowledge emphasizing the need for localized drought assessments that combine both climatic data and community perspectives [15,63,64]. By examining spatiotemporal drought trends and identifying coping measures, this research provides evidence-based insights to guide municipal planning and enhance Musina’s resilience.
Future studies should use higher-resolution climate and remote sensing data to capture localized drought patterns within Musina Local Municipality. Longitudinal and mixed-method approaches are recommended to assess how coping strategies evolve into long-term adaptation and to evaluate the effectiveness of the interventions, such as climate-smart agriculture, water infrastructure, and early warning systems. Integrating climate projections and community-based knowledge will further support proactive planning and strengthen drought resilience in semi-arid regions.
Author Contributions
Conceptualization, M.N., R.B.M. and T.M.; formal analysis and investigation, M.N.; writing—original draft preparation, M.N., R.B.M. and T.M.; writing—review and editing, K.H.N., T.N. and N.V.M.; supervision, T.M. and R.B.M. All authors have read and agreed to the published version of the manuscript.
Funding
This research was funded by the South African National Research Foundation, grant number PMDS241101278588.
Institutional Review Board Statement
The study was conducted according to the guidelines of the University of Venda and approved by its Research Ethics Committee under Project No: FSAE/23/GES/08 on 13 August 2025.
Informed Consent Statement
Informed consent was obtained from all subjects involved in the study.
Data Availability Statement
The data are available upon reasonable request from the authors.
Acknowledgments
This work was originally conceptualized from the Honors Research of M.N. at the University of Venda.
Conflicts of Interest
The authors declare no conflicts of interest.
References
- IPCC. Climate Change 2021: The Physical Science Basis. Contribution of Working Group I to the Sixth Assessment Report of the Intergovernmental Panel on Climate Change; Cambridge University Press: Cambridge, UK, 2021; Available online: https://www.ipcc.ch (accessed on 21 March 2025).
- Wilhite, D.A.; Glantz, M.H. Understanding the drought phenomenon: The role of definitions. Water Int. 1985, 10, 111–120. [Google Scholar] [CrossRef] [Scilit]
- Van Loon, A.F. Hydrological drought explained. WIREs Water 2015, 2, 359–392. [Google Scholar] [CrossRef] [Scilit]
- Sheffield, J.; Wood, E.F. Drought: Past Problems and Future Scenarios; Earthscan: London, UK, 2011. [Google Scholar]
- UNCCD (United Nations Convention to Combat Desertification). Global Land Outlook: Land Degradation and Drought; UNCCD: Bonn, Germany, 2018. [Google Scholar]
- Mohomi, T. Impacts Land Use/Land Cover Change on Boundary Layer Climate over Eastern South Africa. Master’s Thesis, North-West University, Potchefstroom, South Africa, 2022. [Google Scholar]
- Moeletsi, M.E.; Walker, S.; Landman, W. ENSO and implications on rainfall characteristics with reference to maize production in the Free State Province of South Africa. Phys. Chem. Earth Parts A/B/C 2011, 36, 715–726. [Google Scholar] [CrossRef] [Scilit]
- Mohomi, T.; Mbatha, N.B.; Boshoff, D.S.; Mbokodo, I.L.; Ndarana, T.; Bopape, M.J.M.; Chikoore, H. Attributing impacts of LULCC on the boundary layer climate of South Africa’s eastern escarpment. J. Earth Syst. Sci. 2024, 133, 178. [Google Scholar] [CrossRef] [Scilit]
- Du Plessis, J.A.; Kibii, J.K. Applicability of CHIRPS-based satellite rainfall estimates for South Africa. J. S. Afr. Inst. Civ. Eng. 2021, 63, 34–41. [Google Scholar] [CrossRef] [Scilit]
- DEA (Department of Environmental Affairs). Long-Term Adaptation Scenarios Flagship Research Programme (LTAS) for South Africa: Climate Trends and Scenarios for South Africa; Department of Environmental Affairs: Pretoria, South Africa, 2013.
- Kibii, J.K. Assessment of Seasonal and Annual Rainfall Trends and Variability in South Africa. Doctoral Dissertation, Stellenbosch University, Stellenbosch, South Africa, 2021. [Google Scholar]
- Mokgwathi, Z.J. Water scarcity, food production & dietary choices of rural populations in Limpopo Province: A study of Musina Local Municipality. Master’s Thesis, University of the Witwatersrand, Braamfontein, South Africa, 2018. [Google Scholar]
- Nembilwi, N. Vulnerability and Adaptation to Drought Hazards in Mopani District Municipality, South Africa: Towards Disaster Risk Reduction; University of Venda: Thohoyandou, South Africa, 2019. [Google Scholar]
- BusinessLive. Farmers in Bone-Dry Limpopo Urged to Sell Animals They Cannot Feed. 2024. Available online: https://www.businessday.co.za/bd/national/2024-10-08-farmers-in-bone-dry-limpopo-urged-to-sell-animals-they-cannot-feed/ (accessed on 27 December 2025).
- Nkamisa, M.; Ndhleve, S.; Nakin, M.D.V.; Mngeni, A.; Kabiti, H.M. Analysis of trends, recurrences, severity and frequency of droughts using standardised precipitation index: Case of OR Tambo District Municipality, Eastern Cape, South Africa. Jàmbá J. Disaster Risk Stud. 2022, 14, a1147. [Google Scholar] [CrossRef] [Scilit]
- Marumbwa, F.M.; Cho, M.A.; Chirwa, P.W. Analysis of spatio-temporal rainfall trends across southern African biomes between 1981 and 2016. Phys. Chem. Earth Parts A/B/C 2019, 114, 102808. [Google Scholar] [CrossRef] [Scilit]
- Baudoin, M.A.; Vogel, C.; Nortje, K.; Naik, M. Living with drought in South Africa: Lessons learnt from the 2015–2016 drought. Int. J. Disaster Risk Reduct. 2017, 23, 128–137. [Google Scholar] [CrossRef] [Scilit]
- Chikoore, H.; Jury, M.R. Intraseasonal variability of satellite-derived rainfall and vegetation over Southern Africa. Earth Interact. 2010, 14, 1–26. [Google Scholar] [CrossRef] [Scilit]
- Chikoore, H.; Jury, M.R. South African drought, deconstructed. Weather Clim. Extrem. 2021, 33, 100334. [Google Scholar] [CrossRef] [Scilit]
- Matimolane, S.W.; Strydom, S.; Mathivha, F.I.; Chikoore, H. Evaluating the spatiotemporal patterns of drought characteristics in a semi-arid region of Limpopo Province, South Africa. Environ. Monit. Assess. 2024, 196, 2–19. [Google Scholar] [CrossRef] [Scilit]
- South African Weather Service. Annual State of the Climate of South Africa 2021; South African Weather Service: Pretoria, South Africa, 2022.
- Pieterse, A.; Ludick, C.; Chilwane, L. Musina-Makhado SEZ: Climate Risk Profile Report; Centre for Environmental Rights (CER): Cape Town, South Africa, 2023. [Google Scholar]
- Curlewis, B.J.; Luus-Powell, W.J.; Potgieter, M.J.; Makhado, R.A. Terrain encountered along the browsing path of Tragelaphus strepsiceros in the Musina Nature Reserve, Limpopo Province. Trans. R. Soc. S. Afr. 2018, 73, 264–269. [Google Scholar] [CrossRef] [Scilit]
- Statistics South Africa. Census 2022: Statistical Release (Report No. P03014); Statistics South Africa: Pretoria, South Africa, 2023. Available online: https://census.statssa.gov.za/#/ (accessed on 29 April 2026).
- Mazibuko, S.M.; Mukwada, G.; Moeletsi, M.E. Assessing the frequency of drought/flood severity in the Luvuvhu River catchment, Limpopo Province, South Africa. Water SA 2021, 47, 172–184. [Google Scholar] [CrossRef] [Scilit]
- Taherdoost, H. Sampling methods in research methodology; how to choose a sampling technique for research. Int. J. Acad. Res. Manag. (IJARM) 2016, 5, 18–27. [Google Scholar]
- Oluwatayo, I.B.; Braide, T.M. Socioeconomic determinants of households’ vulnerability to drought in Western Cape, South Africa. Sustainability 2022, 14, 7582. [Google Scholar] [CrossRef] [Scilit]
- Muyambo, F.; Jordaan, A.J.; Bahta, Y.T. Assessing social vulnerability to drought in South Africa: Policy implication for drought risk reduction. Jàmbá J. Disaster Risk Stud. 2017, 9, 326. [Google Scholar] [CrossRef] [Scilit] [PubMed]
- Palinkas, L.A.; Howitz, S.M.; Green, C.A.; Wisdom, J.P.; Duan, N.; Hoagwood, K. Purposeful sampling for qualitative data collection and analysis in mixed method implementation research. Adm. Policy Ment. Health Ment. Health Serv. Res. 2015, 42, 533–544. [Google Scholar]
- Mpandeli, S.; Moeletsi, M.; Tatah, L.; Nyamwanza, A.; Moyo, M.; Hlahla, S.; Nethonzhe, T. Climate change adaptation through the water-energy-food nexus in southern Africa. Int. J. Environ. Res. Public Health 2018, 15, 2306. [Google Scholar] [CrossRef] [Scilit] [PubMed]
- Ogundeji, A.A.; Okolie, C.C. Perception and adaptation strategies of smallholder farmers to drought risk: A scientometric analysis. Agriculture 2022, 12, 1129. [Google Scholar] [CrossRef] [Scilit]
- Mahmoud, S.H.; Gan, T.Y.; Allan, R.P.; Li, J.; Funk, C. Worsening drought of Nile basin under shift in atmospheric circulation, stronger ENSO and Indian Ocean dipole. Sci. Rep. 2022, 12, 8049. [Google Scholar] [CrossRef] [Scilit] [PubMed]
- Guttman, N.B. Comparing the Palmer drought index and the standardized precipitation index. JAWRA J. Am. Water Resour. Assoc. 1998, 34, 113–121. [Google Scholar] [CrossRef] [Scilit]
- Mendlik, T.; Gobiet, A. Selecting climate simulations for impact studies based on multivariate patterns of climate change. Clim. Change 2016, 135, 381–393. [Google Scholar]
- Kruger, A.C.; Shongwe, S. Temperature trends in South Africa: 1960-2003. Int. J. Climatol. 2004, 24, 1929–1945. [Google Scholar] [CrossRef] [Scilit]
- Cai, X.; Zhang, X.; Noël, P.H.; Shafiee-Jood, M. Impacts of climate change on agricultural water management: A review. WIREs Water 2015, 2, 439–455. [Google Scholar] [CrossRef] [Scilit]
- Harris, I.; Osborn, T.J.; Jones, P.; Lister, D. Version 4 of the CRU TS monthly high-resolution gridded multivariate climate dataset. Sci. Data 2020, 7, 109. [Google Scholar] [CrossRef] [Scilit]
- Munyai, R.B. An Assessment of Community Flood Vulnerability and Adaptation: A Case Study of Greater Tzaneen Local Municipality, South Africa. Doctoral Dissertation, University of Venda, Thohoyandou, South Africa, 2017. [Google Scholar]
- Etikan, I.; Musa, S.A.; Alkassim, R.S. Comparison of convenience sampling and purposive sampling. Am. J. Theor. Appl. Stat. 2016, 5, 1–4. [Google Scholar] [CrossRef] [Scilit]
- Mhlanga-Ndlovu, N.; Nhamo, G. An assessment of Swaziland sugarcane farmer associations’ vulnerability to climate change. J. Integr. Environ. Sci. 2017, 14, 39–57. [Google Scholar] [CrossRef] [Scilit]
- Jain, S.K.; Kumar, V. Trend analysis of rainfall and temperature data for India. Curr. Sci. 2012, 102, 37–49. [Google Scholar]
- Vicente-Serrano, S.M.; Beguería, S.; López-Moreno, J.I. The response of vegetation to drought time-scales across global biomes. Proc. Natl. Acad. Sci. USA 2013, 110, 52–57. [Google Scholar] [PubMed]
- Gorjizade, A.; Hafshejani, L.D. Multiscale Drought Dynamics in a Semi-Arid region of Iran: A Reanalysis-Based Assessment Using Run Theory. Results Eng. 2026, 111575. [Google Scholar] [CrossRef] [Scilit]
- Naresh Kumar, M.; Raju, P.V.; Bhan, S.C. Agricultural drought monitoring using remote sensing and climate data: A case study of India. Remote Sens. Appl. Soc. Environ. 2020, 17, 100287. [Google Scholar] [CrossRef] [Scilit]
- Blamey, R.C.; Reason, C.J.C.; Tennant, W.J. The role of regional atmospheric circulation in the 2015/2016 drought over Southern Africa. Clim. Dyn. 2018, 50, 2153–2172. [Google Scholar]
- Moeletsi, M.E.; Walker, S. Rainy season characteristics of the Free State Province of South Africa with reference to rain-fed maize production. Water SA 2012, 38, 775–782. [Google Scholar] [CrossRef] [Scilit]
- Dai, A. Increasing drought under global warming in observations and models. Nat. Clim. Change 2013, 3, 52–58. [Google Scholar] [CrossRef] [Scilit]
- Shikwambana, S.; Malaza, N.; Ncube, B. Enhancing the resilience and adaptive capacity of smallholder farmers to drought in the Limpopo Province, South Africa. Conservation 2022, 2, 435–449. [Google Scholar] [CrossRef] [Scilit]
- Sikhwari, T. Variability and Long-Term Trends of Climate Extremes over the Limpopo. Doctoral Dissertation, University of Venda, Thohoyandou, South Africa, 2019. [Google Scholar]
- Masih, I.; Maskey, S.; Mussá, F.E.F.; Trambauer, P. A review of droughts on the African continent: A geospatial and long-term perspective. Hydrol. Earth Syst. Sci. 2014, 18, 3635–3649. [Google Scholar] [CrossRef] [Scilit]
- Held, I.M.; Soden, B.J. Robust responses of the hydrological cycle to global warming. J. Clim. 2006, 19, 5686–5699. [Google Scholar] [CrossRef] [Scilit]
- Mbokodo, I.L.; Bopape, M.J.M.; Ndarana, T.; Mbatha, S.M.; Muofhe, T.P.; Singo, M.V.; Xulu, N.G.; Mohomi, T.; Ayisi, K.K.; Chikoore, H. Heatwave variability and structure in South Africa during summer drought. Climate 2023, 11, 38. [Google Scholar] [CrossRef] [Scilit]
- Stringer, L.C.; Dougill, A.J.; Dyer, J.C.; Vincent, K.; Fritzsche, F.; Leventon, J.; Fleskens, L. Adaptation and development pathways for different types of farmers. Environ. Sci. Policy 2009, 12, 479–489. [Google Scholar]
- Nguyen, P.-L.; Min, S.-K.; Kim, Y.-H. Combined impacts of the El Niño–Southern Oscillation and Pacific Decadal Oscillation on global droughts assessed using the standardized precipitation evapotranspiration index. Int. J. Climatol. 2021, 41, E1645–E1662. [Google Scholar] [CrossRef] [Scilit]
- Sousa, P.M.; Blamey, R.C.; Reason, C.J.C.; Ramos, A.M.; Trigo, R.M. The “Day Zero” Cape Town drought and the poleward migration of moisture corridors. Environ. Res. Lett. 2018, 13, 124025. [Google Scholar] [CrossRef] [Scilit]
- Brempong, M.B.; Amankwaa-Yeboah, P.; Yeboah, S.; Owusu Danquah, E.; Agyeman, K.; Keteku, A.K.; Addo-Danso, A.; Adomako, J. Soil and water conservation measures to adapt cropping systems to climate change facilitated water stresses in Africa. Front. Sustain. Food Syst. 2023, 6, 1091665. [Google Scholar] [CrossRef] [Scilit]
- Adaawen, S.; Rademacher-Schulz, C.; Schraven, B.; Segadlo, N. Drought, migration, and conflict in sub-Saharan Africa: What are the links and policy options? Curr. Dir. Water Scarcity Res. 2019, 2, 15–31. [Google Scholar] [CrossRef] [Scilit]
- Drysdale, R.E.; Bob, U.; Moshabela, M. Socio-economic determinants of increasing household food insecurity during and after a drought in the district of iLembe, South Africa. Ecol. Food Nutr. 2021, 60, 25–43. [Google Scholar] [PubMed]
- Phaswana, R. An Analysis of Service Delivery Protests and Their Implications on the Economic Stability of Musina Municipality: 2007–2014. Doctoral Dissertation, University of Venda, Thohoyandou, South Africa, 2018. [Google Scholar]
- Orimoloye, I.R. Agricultural drought and its potential impacts: Enabling decision-support for food security in vulnerable regions. Front. Sustain. Food Syst. 2022, 6, 838824. [Google Scholar] [CrossRef] [Scilit]
- Mpandeli, S.; Nesamvuni, E.; Maponya, P. Adapting to the impacts of drought by smallholder farmers in Sekhukhune District in Limpopo Province, South Africa. J. Agric. Sci. 2015, 7, 115. [Google Scholar] [CrossRef] [Scilit]
- Pietersen, K. Post-Drought and Emergency Interventions: Towards Higher Water Security; No. 3005/1; Report; Water Research Commission (WRC): Pretoria, South Africa, 2021; p. 21. [Google Scholar]
- Nemukula, M.M.; Sigauke, C.; Chikoore, H.; Bere, A. Modelling Drought Risk Using Bivariate Spatial Extremes: Application to the Limpopo Lowveld Region of South Africa. Climate 2023, 11, 46. [Google Scholar] [CrossRef] [Scilit]
- Mohomi, T.; Stepanenko, V.; Medvedev, A.; Dhau, I.; Chikoore, H.; Bopape, M.J. Projections of extreme rainfall in South Africa using CMIP6 ISIMIP models. Clim. Dyn. 2026, 64, 125. [Google Scholar] [CrossRef] [Scilit]

Disclaimer/Publisher’s Note: The statements, opinions and data contained in all publications are solely those of the individual author(s) and contributor(s) and not of MDPI and/or the editor(s). MDPI and/or the editor(s) disclaim responsibility for any injury to people or property resulting from any ideas, methods, instructions or products referred to in the content. |
© 2026 by the authors. Licensee MDPI, Basel, Switzerland. This article is an open access article distributed under the terms and conditions of the Creative Commons Attribution (CC BY) license.