


Abstract
This study evaluates the temporal evolution and structural constraints on the ecological and environmental quality of urban human settlements in Shaanxi Province, China, from 2011 to 2024. An indicator system covering four dimensions—urban green spaces and landscaping, urban appearance and environmental hygiene, urban facilities, and urban water resources and atmospheric environment—was established. The entropy method, comprehensive evaluation model, and barrier degree model were applied to assess relative performance, with sensitivity analyses conducted by modifying the attributes of domestic waste collection volume and total domestic water consumption, and by excluding controversial indicators. The results show that the composite index increased from 0.1082 in 2011 to 0.8806 in 2024, indicating substantial improvement in relative performance rather than a direct measure of absolute environmental quality. Overall, green spaces, parks, municipal facilities and ecological water supply improved, while major atmospheric pollutant emissions declined considerably. However, domestic waste collection and water consumption increased alongside urban development. Sensitivity analysis confirmed the robustness of the overall upward trend but revealed that later-stage obstacle rankings were influenced by alternative attribute settings. Therefore, these indicators are interpreted as proxies for urban operational pressure rather than direct evidence of environmental degradation. The findings highlight the need to strengthen waste management, resource recovery, and water-use efficiency, providing methodological support for provincial-scale urban environmental assessment and governance.
1. Introduction
The quality of the urban human ecological environment is a key indicator of a city’s level of sustainable development and the well-being of its residents. As the process of urbanisation continues to advance, urban spatial expansion, population concentration, infrastructure development and pressure on resources and the environment are increasing simultaneously. Urban development is no longer merely characterised by growth in construction scale and total economic output but increasingly reflects comprehensive improvements in ecological and environmental quality, public service capacity, and the quality of life for residents [1]. A sound human settlement ecological environment not only improves residents’ daily living conditions but also enhances urban ecological resilience, boosts the efficiency of urban operations, and provides a fundamental foundation for high-quality regional development. Therefore, conducting a scientific evaluation of the quality of the urban human settlement ecological environment holds significant theoretical value and practical importance.
In terms of its essence, the quality of the urban living environment is not a reflection of a single ecological indicator or the standard of a single municipal facility but is instead constituted by a combination of factors such as the provision of ecological space, environmental sanitation management, infrastructure provision, resource utilisation, and pollution emission pressures [2]. Indicators such as urban green spaces, parks and ecological water use reflect a city’s ecological provision capacity; indicators such as road cleaning, domestic waste collection and public toilets reflect the standard of urban public environmental management; infrastructure such as water supply, gas supply and roads embodies the capacity to safeguard residents’ basic livelihoods; whilst indicators such as emissions of sulphur dioxide, nitrogen oxides, smoke (dust) and particulate matter reflect the environmental pressures arising from urban development. It is therefore evident that the assessment of the quality of the urban living environment requires a multi-dimensional approach, involving the establishment of a comprehensive, systematic and quantifiable evaluation framework.
In recent years, with the continued advancement of ecological civilisation and the new urbanisation strategy, urban ecological and environmental governance has gradually shifted from pollution control and infrastructure construction to a phase of comprehensive governance focusing on the optimisation of ecological spaces, the balanced allocation of public services and the efficient use of resources [3]. Traditional urban environmental assessments have largely focused on single aspects such as pollution emissions, green space area or infrastructure levels; whilst these can reflect certain facets of the urban ecological environment, they struggle to comprehensively reveal the overall changes in the quality of the urban living environment and its internal structural characteristics. It is therefore necessary to incorporate indicators such as ecological green spaces, environmental hygiene, urban facilities, water resource utilisation and atmospheric environmental pressures into a unified evaluation system in order to comprehensively identify temporal changes in the quality of the urban living environment and its key influencing factors.
Shaanxi Province, situated in north-western China, is a key inland province. It exhibits a certain degree of diversity in terms of its natural geographical conditions, resource and environmental foundations, and urban development patterns. In recent years, with the continuous advancement of urbanisation, Shaanxi has made significant progress in urban construction, landscaping, municipal facilities and ecological and environmental governance; however, issues such as the increase in domestic waste, rising water consumption and pressures on pollution control—all accompanying urban expansion—persist [4]. Data from Shaanxi Province indicate that relevant indicators of the urban living environment have undergone significant changes in recent years (Figure 1). On the one hand, the capacity to provide urban green spaces has continued to strengthen: the area of urban green spaces has increased from 28,200 hectares to 81,900 hectares; the number of parks has risen from 130 to 505; and the area of parks has grown from 3200 hectares to 12,400 hectares, reflecting the ongoing advancement of urban landscaping and the development of public ecological spaces. On the other hand, environmental pressure indicators have also undergone structural changes: sulphur dioxide emissions fell from 91.68 metric tonnes to 6.34 metric tonnes; nitrogen oxide emissions fell from 83.17 metric tonnes to 26.79 metric tonnes; and emissions of smoke (dust) and particulate matter fell from 46.34 metric tonnes to 11.77 metric tonnes, indicating that air pollution control measures have achieved some success. At the same time, however, the volume of domestic waste collected and transported increased from 4.2827 million tonnes to 7.2264 million tonnes, indicating that the expansion of urban operations continues to place pressure on domestic waste management. It is thus evident that changes in the quality of the urban living environment in Shaanxi Province cannot be explained by a single dimension, but rather represent a comprehensive process characterised by the coexistence of improved ecological provision, reduced pollution emissions and pressures arising from urban operations. Consequently, it is necessary to establish a multi-dimensional evaluation indicator system to conduct a systematic analysis of the quality of the urban living environment in Shaanxi Province and its temporal evolution.
Figure 1.
Changes in the ecological environment of Shaanxi Province. The blue dashed arrow indicates that the value in 2024 decreased compared with that in 2011, suggesting an improvement in pollution conditions. The gray dashed arrow indicates the overall study period from 2011 to 2024.
Against this background, this paper aims to construct an evaluation framework for the urban living environment in Shaanxi Province that is compatible with provincial-level annual statistical data, systematically identifying the phased changes in the comprehensive relative performance, internal structure and key constraining factors of the urban living environment in Shaanxi Province from 2011 to 2024, thereby providing a quantitative basis for provincial-level urban ecological governance and the optimisation of public environmental services. Specifically, an evaluation indicator system is constructed across four dimensions—urban green spaces and landscaping, urban appearance and environmental hygiene, urban facility standards, and urban water resources and atmospheric environment—with the statistical definitions, attributes and scope of application for each indicator clearly defined; the comprehensive index and subsystem indices for the urban living environment in Shaanxi Province during the study period are calculated, and their overall relative trends, inter-annual fluctuations and phased changes are analysed; the barrier index model is employed to identify the primary relative constraining indicators during different periods, examining whether there has been a structural shift in the priorities of urban human settlement ecological environment governance.
2. Research Overview
2.1. Overview of the Study Area
Shaanxi Province is situated in the inland heartland of China and the eastern part of the northwestern region; within the national regional development framework, it occupies a strategic location that bridges east and west and connects north and south (Figure 2). Shaanxi Province features a wide variety of landforms, with diverse natural ecological foundations, resource and environmental conditions, and urban development models [5]. This complex context implies that an assessment of the quality of the urban living environment in Shaanxi Province cannot focus solely on a single ecological factor, but must comprehensively consider multiple dimensions, including the provision of green spaces, environmental sanitation management, the provision of urban facilities, water resource utilisation and pressure from pollution emissions.
Figure 2.
Overview map of the study area in Shaanxi Province.
Viewed from the perspective of the province’s overall development process, Shaanxi’s level of urbanisation has been steadily rising in recent years, with continuous progress in urban construction, landscaping, municipal infrastructure, and environmental governance. Whilst urban expansion has improved the provision of public services and residents’ living conditions, it has also brought about issues such as increased domestic waste, rising domestic water consumption, the expansion of built-up areas and pressures on environmental governance [6]. Against the backdrop of urban development gradually shifting from scale expansion to quality enhancement, this paper focuses on how to identify, at the provincial level, the long-term changes, internal structure and key constraints affecting the quality of the urban living environment.
2.2. Theoretical Framework and Research Progress
Research into the human settlement environment stems from the interdisciplinary convergence of urban planning, architecture, geography, ecology and public health (Figure 3). The science of human settlements, as proposed by Asif Raihan, emphasises the systemic connections between nature, people, society, built structures and their supporting networks [7]. Wu Liangyong further proposed that the science of the human settlement environment should integrate natural systems, human systems, social systems, residential systems and supporting systems [8]. Accordingly, the urban human settlement ecological environment cannot be equated with natural ecological quality in the narrow sense, nor can it be characterised solely by a single type of indicator such as green space area, pollutant emissions or the number of municipal facilities; rather, it should be examined in terms of interrelated dimensions such as the provision of ecological space, public environmental services, infrastructure provision, resource consumption and pollution pressures.
Figure 3.
Conceptual diagram of the research framework for urban human ecological environments.
In the assessment of urban sustainability and the human settlement environment, multidimensional indicator systems have become a commonly used analytical framework. UN-Habitat’s Urban Prosperity Framework incorporates infrastructure, quality of life, environmental sustainability, equity and governance into a comprehensive evaluation of cities [9]; the European Union Joint Research Centre proposes that the construction of composite indicators should involve, in sequence, defining the theoretical framework, screening data, handling missing values, standardisation and weighting, aggregation, and conducting uncertainty or sensitivity analyses [10]. Relevant reviews further point out that there is as yet no uniform set of indicators for urban sustainability applicable to all regions and scales; the selection of indicators must be tailored to the research subject, spatial scale, policy objectives and data availability [11,12]. Consequently, this paper does not seek to establish a universal urban sustainable development index, but rather to construct a thematic evaluation system aligned with provincial statistical standards, focusing on annual changes in the urban human settlement and ecological environment of Shaanxi Province.
Existing empirical research has broadly taken three approaches. The first focuses on the built environment, public services and residents’ well-being. Xu et al., drawing on data from multiple countries, analysed the relationship between the urban living environment and adult mental health, demonstrating that built environment factors—such as the natural environment, facilities and transport—are closely linked to residents’ health [13]. The second category focuses on urban green infrastructure and ecosystem services. A systematic review by Korkou et al. indicates that green infrastructure possesses multiple functions, including climate regulation, stormwater management, biodiversity conservation, recreation and health promotion; therefore, its service functions should not be assessed solely on the basis of total green space area [14]. The third category focuses on remote-sensing-based ecological quality and spatial patterns. For example, Aizizi et al. assessed changes in ecological space and ecological quality within the urban agglomeration on the northern slope of the Tianshan Mountains; Zhang et al. applied remote-sensing information entropy and machine learning to regional ecological and environmental assessments; whilst Roy et al. utilised remote-sensing and GIS methods to evaluate urban environmental quality in India [15,16,17]. These studies have enhanced the spatial resolution of ecological quality assessments; however, they do not fully align with public environmental services—such as urban sanitation, water and gas supply, roads and public toilets—which are consistently reflected in provincial-level statistical data.
In terms of evaluation methods, the entropy method, principal component analysis, TOPSIS, coupled coordination models and spatiometrics have all been widely applied. The entropy method assigns weights based on the degree of variation in indicators within the sample, thereby reducing the subjectivity associated with relying solely on expert judgement [18]; the linearly weighted composite index converts information from different dimensions into comparable annual relative levels, whilst the barrier degree model identifies relative shortcomings based on indicator weights and the degree of deviation from the ideal state. As these methods are all established tools, this paper does not regard the use of a single method or their simple combination as a theoretical innovation. This paper adopts an analytical chain comprising ‘objective weighting—composite measurement—subsystem decomposition—obstacle diagnosis’ to enhance the reproducibility of annual evaluation results and the interpretability of policy recommendations. At the same time, entropy-based weights reflect the dispersion of information within the research sample rather than the intrinsic importance of the indicators; the degree of constraint reflects the relative level of constraint and cannot serve as a substitute for causal identification.
Research on Shaanxi Province and the Northwest region has largely focused on natural ecological quality, resource and environmental accounting, or socio-economic–ecological coupling. Wang et al. constructed a framework for natural resource asset and liability accounting using Shaanxi Province as a case study, with a focus on identifying resource assets, liabilities and government responsibilities [19]; Xiao et al. analysed the coupling and coordination between socio-economic and ecological environments, as well as their spatiotemporal variations, at the scale of the Loess Plateau [20]; Aizizi et al. focused on changes in ecological space and remote-sensing-derived ecological quality within the urban agglomeration on the northern slope of the Tianshan Mountains [15]; Guo et al. examined the spatial patterns and interactive relationships between human activities and the living environment on the Qinghai–Tibet Plateau [21]. These studies provide an important basis for resource and environmental governance in Shaanxi Province; however, their evaluation primarily centres on natural resources, ecological conditions or the coupling of human–land relationships, with little integration of urban green spaces, urban appearance and environmental sanitation, municipal facilities, water resource utilisation and air pollution pressures within a single annual evaluation framework.
In summary, existing research still offers scope for further development in three areas: firstly, there remains a certain degree of disconnection between ecological quality assessment and the evaluation of public environmental services, with urban appearance, environmental hygiene and the provision of daily amenities for residents receiving insufficient attention in some ecological assessments; secondly, whilst multi-period remote sensing assessments and cross-sectional comparisons of cities are relatively abundant, research on provincial-level trends across consecutive years and phase transitions based on a unified statistical framework is relatively scarce; thirdly, whilst some studies focus on composite scores, spatial differentiation or coupling states, there is insufficient discussion on how key constraints evolve across developmental stages and their policy implications. Accordingly, this paper delimits its research question as follows: given provincial-level statistical data, how can the quality of the urban living environment in Shaanxi Province be continuously measured, and how can structural shortcomings at different stages be identified?
2.3. Review of Comprehensive Research and Contributions of This Paper
Existing research on the urban living environment has established a relatively comprehensive conceptual framework and methodological toolkit; however, there are marked differences in the focal points of various research traditions. Research on urban sustainability indicators emphasises the integration of economic, social, ecological and governance dimensions, and is suitable for evaluating overall urban development performance; remote sensing-based ecological quality research highlights changes in land cover, vegetation, thermal environment and ecological space, and excels at revealing spatial heterogeneity, whilst research on the human settlement environment and health tends to explain quality of life primarily through the built environment, accessibility to facilities and residents’ perceptions [22,23,24,25,26]. The aforementioned studies collectively demonstrate that evaluation systems must serve clearly defined research questions, rather than simply increasing the number of indicators or mechanically combining models.
With regard to the Northwest region, existing research has effectively elucidated ecological spatial changes in ecologically fragile areas, socio-economic–ecological coupling, and the interrelationships between human activities and the living environment [15,19,20,21]; relevant resource and environmental studies in Shaanxi Province have also addressed the calculation of natural resource assets and liabilities [20]. However, these studies differ from the present study in terms of their evaluation subjects, data scales and policy objectives. To avoid summarising innovation merely as a matter of ‘differences in case regions’, this paper conducts a direct comparison with representative studies across five aspects: research subjects, temporal scales, indicator boundaries, methodological applications and policy implications, as shown in Table 1.
Table 1.
Direct comparison between representative studies on Shaanxi Province and the Northwest region and this paper.
Based on the above comparison, the contributions of this paper should be defined as follows. Firstly, in terms of the research subject, this paper evaluates the ‘quality of the urban human settlement ecological environment’, a concept situated between the narrow definition of natural ecological quality and the broad concept of urban sustainable development, with a focus on integrating urban green spaces, public environmental hygiene, basic infrastructure provision, and resource and pollution pressures. Secondly, in terms of the time scale, this paper utilises data from 14 consecutive years (2011–2024), for which the statistical scope has remained relatively stable, enabling not only a comparison of differences between the beginning and end of the period but also the identification of inter-annual fluctuations and phase transitions. Thirdly, regarding the indicator system, this paper organises 20 indicators according to the logic of ‘ecological supply—environmental services—infrastructure provision—resource and environmental pressures’, enabling urban operational pressures such as domestic waste, domestic water consumption and pollution emissions to be assessed alongside the provision of green spaces, environmental sanitation facilities and public infrastructure. Fourthly, regarding the application of methods, the entropy method is employed to enhance the reproducibility of weighting; composite and subsystem indices are used to describe structural changes; and the ‘obstacle degree’ is utilised to identify relative shortcomings. This combination of methods serves to address a single diagnostic problem rather than constituting an independent methodological innovation. Fifthly, in terms of policy implications, this paper links changes in key obstacle factors to the governance requirements of Shaanxi Province’s urban development—which is shifting from incremental construction towards improvements in quality, efficiency and balance—thereby deriving phased policy implications.
Consequently, the originality of this paper is best characterised as follows: within the context of Shaanxi Province, a thematic evaluation framework has been constructed based on consecutive annual statistical data, taking into account both ecological provision and urban public environmental services, and identifying structural shortcomings at different stages of development through subsystem decomposition and the transformation of impediment factors. This paper does not claim that the entropy method, composite indices or the constraint degree model are original in themselves, nor does it interpret the comprehensive evaluation results as strict causal effects. This clarification both acknowledges the widespread application of existing methods and more accurately illustrates the added value of this paper relative to previous research in Shaanxi Province.
In summary, existing research on urban living environments has developed various research approaches, including multi-indicator comprehensive evaluation, spatial pattern identification and the diagnosis of constraining factors; however, there remains scope for further expansion. On the one hand, some studies focus on single dimensions such as natural ecological quality, land use or infrastructure, whilst the comprehensive integration of green spaces, environmental sanitation services, urban facility provision, resource consumption and pollution emission pressures remains inadequate; on the other hand, some studies primarily conduct cross-sectional comparisons between cities or spatial units, with relatively limited attention paid to long-term time-series changes across the entire province and the phased shifts in constraining factors. Against this backdrop, this paper does not aim to identify regional differences within the province, but rather takes Shaanxi Province as a whole as the unit of evaluation, focusing on answering three questions: first, what overall trends in the quality of the urban human settlement ecological environment in Shaanxi Province emerged between 2011 and 2024; secondly, how the relative contributions of different subsystems to the overall changes have evolved; and thirdly, whether the key constraint indicators have shifted in line with the stages of urban development. To this end, this paper constructs an evaluation system comprising four dimensions: urban green spaces and landscaping; urban appearance and environmental hygiene; urban facility standards; and urban water resources and atmospheric environment. It employs the entropy method, a comprehensive evaluation index and a constraint degree model for analysis, thereby establishing an analytical framework that combines the measurement of the province’s overall level, the structural decomposition of subsystems and the identification of stage-specific constraints.
3. Construction of the Indicator System and Research Methods
3.1. Approach to Constructing the Indicator System
The quality of the urban human settlement ecological environment is a comprehensive outcome of ecological conditions, public environmental services, infrastructure provision, and resource and environmental pressures. Unlike assessments focusing on a single ecological component, urban human settlement evaluation should consider not only ecological supply factors, such as green spaces, parks and ecological water use, but also environmental services closely associated with residents’ daily lives, including road cleaning, domestic waste collection, public sanitation facilities, and municipal water and gas supply. Meanwhile, atmospheric pollution emissions and resource consumption pressures also exert important influences on urban ecological conditions. Based on statistical data from the Shaanxi Provincial Bureau of Statistics, this study establishes an evaluation indicator system following the framework of ‘objective layer—criterion layer—indicator layer’ (Figure 4).
Figure 4.
Logical diagram of the indicator system.
The objective layer is defined as the quality of the urban living environment in Shaanxi Province. The criterion layer comprises four dimensions: urban green spaces and landscaping, urban appearance and environmental hygiene, urban facility standards, and urban water resources and atmospheric environment. The indicator layer includes 20 secondary indicators covering green space provision, park development, urban greening, sanitation services, municipal infrastructure, water resources utilisation, and atmospheric pollution emissions.
Regarding indicator attributes, variables reflecting improvements in ecological provision, public services, or infrastructure capacity with increasing values are classified as positive indicators, whereas variables associated with resource consumption, pollution emissions, or environmental burdens are classified as negative indicators. Accordingly, emissions of sulphur dioxide, nitrogen oxides, and smoke (dust) and particulate matter are treated as negative indicators.
The indicators of domestic waste collection volume and total domestic water consumption require careful interpretation. An increase in domestic waste collection may represent either increasing waste generation or improved waste collection capacity and sanitation services. Similarly, rising domestic water consumption may reflect greater resource pressure, but may also result from population growth, urbanisation, improved living standards, and expanded public water supply. Therefore, these two indicators are regarded as proxy variables reflecting urban operational scale and environmental pressure rather than direct measures of ecological degradation.
Although both the number of public toilets and the number of public toilets per 10,000 people are related to sanitation facilities, they represent different evaluation dimensions. The former reflects the overall scale of sanitation infrastructure provision, whereas the latter indicates the relative service capacity based on population demand. However, their simultaneous inclusion may introduce potential information overlap. Therefore, correlation analysis and indicator-exclusion tests are further conducted to examine whether this classification affects the robustness of the evaluation results.
Due to the lack of continuous statistical data for more direct indicators, including per capita waste generation, harmless waste treatment rate, resource recovery rate, per capita water consumption, water-use efficiency and reclaimed water utilisation rate, the main model retains domestic waste collection volume and total domestic water consumption as proxy indicators. Sensitivity analyses are subsequently performed by modifying indicator attributes and excluding potentially controversial indicators to assess the stability and interpretative boundaries of the evaluation results.
3.2. Principles for Constructing the Indicator System
To ensure that the comprehensive evaluation results possess theoretical validity, statistical comparability and policy relevance, this study follows the principles of human settlement science, urban sustainability assessment and composite indicator construction [10,27,28,29,30].
First, the principle of theoretical relevance is adopted. Indicators should correspond closely to the conceptual boundaries of the urban human settlement’s ecological and environmental quality. This study focuses on ecological space provision, environmental hygiene services, urban facility supply, resource utilisation, and pollution pressures, while excluding broader socioeconomic indicators that are not relevant to ecological environmental assessment.
Second, the principles of systematicity, hierarchy and non-redundancy are followed. Urban human settlement ecological quality is a complex system influenced by multiple factors, including ecological provision, environmental services, infrastructure and environmental pressures. Therefore, this study establishes an indicator framework consisting of an objective layer, a criterion layer, and an indicator layer, allowing different dimensions to represent their specific functions. For indicators with similar statistical meanings, differences in scale and policy implications are taken into account. For example, the number of public toilets reflects the overall scale of sanitation infrastructure provision, whereas the number of public toilets per 10,000 people reflects population-based service availability. Although correlated, these indicators describe different aspects of facility supply and are retained to capture both infrastructure scale and service intensity.
Third, the principle of measurability and continuity is applied. Indicators should have clear statistical definitions, reliable data sources and continuous records throughout the study period. This study prioritises indicators available continuously from 2011 to 2024 in the Shaanxi Statistical Yearbook and official statistical publications, while excluding indicators with inconsistent definitions, substantial missing data or poor temporal comparability.
Fourth, the principles of comparability and scale adaptation are considered. Since indicators differ in units and magnitudes, normalisation and dimensionless transformation are required before comprehensive evaluation. For indicators strongly affected by population size, urbanisation or statistical coverage, per capita or intensity-based measures are preferred where possible. When aggregate indicators are retained due to data limitations, their proxy interpretation is clearly specified.
Fifth, the principle of clear attributes and consistent interpretation is followed. Indicator direction is determined by statistical significance, ecological mechanisms, and the evaluation scale rather than by numerical changes alone. For indicators involving both service capacity and environmental pressure, sensitivity analyses are conducted by adjusting attribute assumptions or excluding potentially controversial variables.
Sixth, the principle of robustness is incorporated. To examine whether conclusions depend on indicator settings or weighting methods, robustness tests are conducted by modifying the attributes of domestic waste collection volume and total domestic water consumption, excluding public toilet indicators, and replacing entropy weighting with equal weighting. Consistent trends, temporal phases and rankings across different scenarios indicate the reliability of the main conclusions, whereas changes in specific values or obstacle rankings are interpreted as model-dependent results.
3.3. Evaluation Indicator System
Based on the conceptual framework and construction principles, this study establishes an indicator system for evaluating the ecological and environmental quality of urban human settlements in Shaanxi Province (Table 2). The dimensions of urban green spaces and landscaping reflect the provision of ecological space and the basic ecological conditions of urban environments. Urban appearance and environmental hygiene represent the capacity for public environmental management and daily urban operation. Urban facility standards reflect the provision of basic living services and public infrastructure. Urban water resources and the atmospheric environment incorporate both water resource security, ecological water use and atmospheric pollution pressures. Within this framework, the number of public toilets represents the overall scale of sanitation infrastructure, whereas public toilets per 10,000 people reflect the relative service capacity based on population demand. Together, these four dimensions form a comprehensive evaluation framework. Detailed indicator definitions and data sources are presented in Table 3, with all data obtained from the Shaanxi Statistical Yearbook and related official statistical materials.
Table 2.
Evaluation indicator system for urban living environment quality in Shaanxi Province.
Table 3.
Original research data.
3.4. Data Sources and Pre-Processing
- (1)
- Data Pre-Processing
The study period covered 2011–2024, with Shaanxi Province as the spatial unit of analysis and each year as the temporal unit, resulting in a total of 14 annual observations. The raw data were sourced from the Shaanxi Provincial Bureau of Statistics and relevant annual statistical reports; the indicators used were all provincial-level aggregated data for Shaanxi Province, primarily comprising four categories: urban green spaces and landscaping, urban appearance and environmental hygiene, urban infrastructure standards, and urban water resources and atmospheric environment. Based on the aforementioned data structure, this study is able to identify relative changes across different years at the provincial level in Shaanxi, as well as the structural characteristics of each evaluation dimension; however, it cannot be used to determine spatial differences between the Guanzhong, Northern Shaanxi and Southern Shaanxi regions, or between individual prefectures and cities. Consequently, the subsequent results regarding the composite index, subsystem indices and the degree of obstruction are all restricted to a time-series evaluation at the provincial level in Shaanxi.
As there are differences in the units and orders of magnitude of the various indicators—for example, area-based indicators are expressed in ten thousand hectares or ten thousand square metres, ratio-based indicators in percentages, and emission-based indicators in ten thousand tonnes—direct weighted aggregation could lead to dimensional inconsistencies affecting the comprehensive evaluation results. Consequently, prior to calculating weights and conducting the comprehensive evaluation, this paper employs a range-standardisation method to convert the raw data into dimensionless form.
Let the number of evaluation years be and the number of indicators be . In this paper, and . Let denote the raw value of the th indicator in the th year, where and . To eliminate differences in units and orders of magnitude, this paper employs the range standardisation method to perform dimensionless processing on each indicator.
For positive indicators—where a higher value indicates a higher quality of the human settlement’s ecological environment—the normalisation formula is as follows:
For negative indicators—where a higher value indicates greater resource consumption, pollution emissions or environmental pressure—the normalisation formula is as follows:
In the formula, ‘’ represents the standardised indicator value, with a range of ‘’; ‘’ and ‘’ denote the maximum and minimum values of the ‘’th indicator during the study period, respectively. Following standardisation, all indicators are converted into unidirectional indicators, meaning that the higher the value of ‘’, the better the performance of the corresponding indicator in terms of the quality of the human settlement ecological environment.
If the maximum and minimum values of a particular indicator are equal within the study period, this indicates that the indicator exhibits no annual variation and cannot provide effective information for temporal differentiation. In such cases, the standardised value of that indicator may be uniformly set to 1, or it may be excluded from the weighting calculation. Given the characteristics of the data in this study, all indicators exhibit some degree of annual variation; therefore, standardisation can be performed directly.
It should be emphasised that the maximum and minimum values used for standardisation in this study are derived from the research sample covering the period 2011–2024. Consequently, the standardised values represent the position of a given year relative to the extremes of the sample within the study period, rather than the degree of attainment relative to external environmental standards, planning targets or ecological carrying capacity thresholds. When a standardised value is close to 1, this merely indicates that the year in question performed relatively well within the sample period; it should not be interpreted as having achieved an optimal, excellent or sustainable state. Should the study period be extended or new extreme values be included, the standardised results for existing years may also change.
- (2)
- Incorporating tests for redundancy and robustness
To test for potential information overlap among public toilet-related indicators, this study first calculated the Pearson correlation coefficients between the number of public toilets and the number of public toilets per 10,000 people; subsequently, the indicator for the total number of public toilets was removed, and the remaining 19 indicators were re-standardised by range, re-weighted by entropy, and re-calculated to derive a composite index. By comparing the composite indices, linear trend coefficients, phase-wise means and annual rankings between the baseline model and the model with the indicator removed, we assessed whether the total number of public toilets indicator substantially altered the study’s conclusions.
Based on the raw data from 2011 to 2024, the Pearson correlation coefficients for the two indicators are as follows:
As shown in the table below (Table 4), there is a strong positive correlation between the number of public toilets and the number of public toilets per 10,000 people, indicating that the two indicators do indeed contain some common information. However, after removing the number of public toilets and recalculating the weights, the composite indices for 2011 and 2024 were 0.1140 and 0.8748, respectively, consistent with the overall trend of the baseline model; the linear trend coefficient changed slightly from 0.0603 to 0.0589, whilst the relative order of the three phases remained unchanged. Spearman’s correlation coefficient for the annual rankings between the excluded model and the baseline model reached 0.9956, and the maximum absolute difference in the composite indices across all years was 0.0174. The above results indicate that there is a certain degree of statistical correlation between the indicators relating to public toilets; however, the inclusion of both indicators did not substantially alter the overall trend of the composite index or the assessment of the different phases.
Table 4.
Robustness comparison of public toilet quantity indicators before and after exclusion.
3.5. Determining Indicator Weights Using the Entropy Method
Indicator weighting is a key step in comprehensive evaluation. Although subjective methods such as the Analytic Hierarchy Process (AHP) and the Delphi method incorporate expert knowledge, they may be affected by subjective judgment. Objective methods such as principal component analysis also require suitable sample sizes and variable structures. Given that this study contains only 14 annual observations from 2011 to 2024 and focuses on temporal differences in indicator information, the entropy method is adopted.
The entropy method determines weights according to the degree of variation among indicators. Indicators with greater temporal variability provide more discriminatory information and receive higher weights, whereas indicators with limited variation contribute less to distinguishing annual differences. Therefore, entropy weights represent sample-based information content rather than direct measures of theoretical importance or policy priority.
However, entropy weighting is sensitive to the study period, indicator variability and extreme values. Indicators with greater dispersion may receive higher weights, even if they do not necessarily have greater ecological or social significance. Thus, entropy weights should be interpreted as statistical contribution measures rather than indicators of practical importance.
To avoid the occurrence of zero in the standardised values, which would affect subsequent logarithmic calculations, this paper applies a shift to the standardised matrix:
where is the shifted standardised value, and is a very small positive number, typically taken as . This adjustment does not alter the relative differences between indicators but prevents the occurrence of .
First, calculate the weight of the th indicator in the th year under that indicator:
Secondly, calculate the information entropy of the th indicator:
where is the information entropy of the th indicator, and is the adjustment coefficient, used to ensure that . When the variation in a particular indicator is small across years, its information entropy is high, indicating that the indicator provides little useful information; when the variation in a particular indicator is large across years, its information entropy is low, indicating that the indicator provides a great deal of useful information.
Next, calculate the coefficient of variation for the th indicator:
Finally, calculate the weight of the th indicator:
where is the weight of the jth indicator, and the following conditions are satisfied: ≥ 0 and = 1. The weights obtained via the entropy method are determined by the degree of dispersion of each indicator within the study sample, reflecting their contribution to distinguishing the relative states of different years; this allows for a relatively objective reflection of the extent to which each indicator contributes to the temporal changes in the quality of the urban living environment in Shaanxi Province.
3.6. Methodology for Calculating the Comprehensive Evaluation Index
The comprehensive evaluation index is used to compare the relative performance of different years between 2011 and 2024 under the established indicator system and standardised sample benchmarks. A higher index value indicates that the comprehensive performance of that year is higher than that of other years within the study period; a lower index value indicates that its relative performance is lower. This index cannot be used to determine the absolute ranking of the quality of the urban living environment in Shaanxi Province, nor can it be directly compared numerically with the results of studies from other regions that employ different study years, indicator systems or standardisation benchmarks.
After obtaining the standardised indicator values and indicator weights, a linear weighted comprehensive evaluation model is employed to calculate the comprehensive index of urban living environment quality in Shaanxi Province for each year. The formula for the comprehensive evaluation index is as follows:
where represents the comprehensive index of urban living environment quality in Shaanxi Province for the year ; represents the entropy weight of the th indicator; represents the standardised value of the th indicator for the year . The higher the value of , the higher the urban living environment quality in Shaanxi Province for that year; conversely, a lower value indicates relatively lower urban living environment quality.
In addition to the composite index, this paper further calculates the indices of each primary indicator subsystem to reveal the impact of different dimensions on changes in the quality of the urban living environment in Shaanxi Province. Let the set of secondary indicators included in the th primary indicator be ; then, the th year’s th subsystem index is as follows:
where represents the relative weight of the th indicator within its respective subsystem, calculated as
By calculating the urban green space and landscaping index, the urban appearance and environmental hygiene index, the urban facilities level index, and the urban water resources and atmospheric environment index, it is possible to further analyse the primary drivers of improvements in the quality of the human living environment in Shaanxi Province, as well as whether there is synchronous improvement or structural shortcomings between different subsystems.
To analyse the contribution of each primary indicator to the composite index, this paper calculates the contribution rate of the th subsystem to the comprehensive evaluation results for the year :
In the equation, ‘’ represents the contribution rate of the th subsystem to the composite index in the th year. This indicator can be used to determine whether improvements in the quality of the urban living environment in Shaanxi Province during different periods were primarily driven by the expansion of ecological green spaces, improvements in environmental hygiene, upgrades to infrastructure, or improvements in water resources and air quality.
3.7. Methodology for Time-Series Evolution Analysis
The focus of this study lies not only in calculating the composite index of urban living environment quality in Shaanxi Province, but also in revealing its relative temporal evolution within the research sample from 2011 to 2024. Therefore, building upon the calculation of the composite index, this study conducts an analysis covering inter-annual variations, overall changes, phase-specific changes, the degree of fluctuation and linear trends. It should be noted that the composite index used in this study is standardised using the maximum and minimum values of each indicator over the study period; its values reflect the relative position of different years within the sample period, rather than the absolute level of ecological and environmental quality.
Firstly, the inter-annual changes in the composite evaluation index are calculated to identify variations in overall relative performance between consecutive years:
In the formula, ΔCt represents the change in the composite index in year t relative to year t − 1; Ct and Ct−1 represent the composite evaluation indices for year t and year t − 1, respectively. When ΔCt > 0, this indicates that the comprehensive relative performance for that year, within the evaluation framework of this paper, has improved compared with the previous year; when ΔCt < 0, this indicates that the comprehensive relative performance has declined compared with the previous year. This change does not represent the magnitude of the increase or decrease in the absolute quality of the ecological environment.
Secondly, the overall change in the comprehensive evaluation index over the study period is calculated as follows:
where ΔC represents the difference between the composite indices at the end and the beginning of the study period. An overall change greater than 0 indicates that the composite relative performance in 2024 was higher than that in 2011; however, this should not be interpreted as meaning that the absolute quality of the ecological environment improved by the same proportion.
Thirdly, to analyse the characteristics of relative changes across different phases, this paper calculates the phase-average composite indices for the periods 2011–2015, 2016–2020, and 2021–2024, respectively. These phase averages are used to compare the relative positions of each phase within the study period and are not intended to classify the absolute grades of ecological and environmental quality.
To measure the relative degree of fluctuation in the composite index during the study period, the coefficient of variation was calculated as follows:
where CV denotes the coefficient of variation in the composite index, σC denotes the standard deviation of the composite index, and the horizontal line above C denotes the mean value of the composite index. A higher coefficient of variation indicates greater fluctuations in the relative performance of the composite index across different years; a lower coefficient of variation indicates relatively stable temporal changes.
Finally, to identify the overall direction of change in the composite index, a linear trend model is constructed:
where t denotes the time variable, α is the constant term, β is the trend coefficient, and εt is the random error term. When β > 0, this indicates that the overall relative performance of the comprehensive urban living environment in Shaanxi Province showed an upward trend during the study period; when β < 0, it indicates that the overall relative performance showed a downward trend. The trend coefficient reflects the relative direction of change within the sample period and does not represent the annual rate of change in the absolute quality of the ecological environment.
3.8. Obstacle Degree Model
The comprehensive evaluation index reflects the overall level of urban living environment quality in Shaanxi Province but cannot directly identify which indicators are the key factors constraining improvements in overall quality. To further identify the primary obstacles affecting the improvement of the living environment quality, this paper introduces the hindrance degree model. The hindrance degree model uses indicator weights and standardised deviation to jointly assess the extent to which a particular indicator hinders the comprehensive evaluation results and is suitable for diagnosing shortcomings in multi-indicator comprehensive evaluations.
First, let the factor contribution of the th indicator be defined as
where denotes the contribution of the th indicator for the comprehensive evaluation; in this paper, this is expressed using entropy weights.
Secondly, the deviation of the th indicator in year is calculated as follows:
where denotes the gap between the th indicator in year and the ideal state. Since all indicators have been converted to positive values following standardisation, the smaller the value of , the further the indicator is from the ideal level and the greater its deviation.
Finally, calculate the degree of obstruction for the th indicator in the th year:
where represents the degree of hindrance of the th indicator in the th year to the improvement of the urban living environment and ecological quality in Shaanxi Province. The larger the value of , the stronger the constraining effect of that indicator on the improvement of the comprehensive quality.
Furthermore, the degree of obstruction for the th primary indicator subsystem in the th year can be calculated as follows:
In the formula, ‘’ represents the degree of constraint for the th subsystem in year . By comparing the degrees of constraint across the four subsystems—urban green spaces and landscaping, urban environmental hygiene, urban infrastructure standards, and urban water resources and atmospheric environment—it is possible to identify the primary limiting factors affecting the improvement of urban living environment quality in Shaanxi Province during different periods. For example, if the barrier index of the urban water resources and atmospheric environment subsystem is high, this indicates that pressure on water resource utilisation or atmospheric pollution emissions remains a constraining factor; if the barrier index of the urban facility level subsystem is high, this indicates that there are still shortcomings in infrastructure and public service provision.
3.9. Sensitivity Analysis and Robustness Testing of Weighting Schemes
- (1)
- Sensitivity Analysis
To examine the impact of the attributes of domestic waste collection volume and total domestic water consumption on the comprehensive evaluation results, this study constructs five scenarios based on the main model:
Scenario S0 is the baseline scenario, in which both domestic waste collection volume and total domestic water consumption are set as negative indicators; Scenario S1 sets domestic waste collection volume as a positive indicator whilst maintaining total domestic water consumption as negative; Scenario S2 maintains the volume of domestic waste collected as a negative indicator whilst setting total domestic water consumption as a positive indicator; Scenario S3 sets both indicators as positive; Scenario S4 excludes both the volume of domestic waste collected and total domestic water consumption.
Under each scenario, indicator alignment, range standardisation and entropy weight calculations are performed anew, rather than simply changing the sign of a single indicator whilst retaining the original weights. On this basis, the opening and closing indices, linear trend coefficients, stage averages, annual rankings and key obstacle indicators are compared across scenarios. Spearman’s rank correlation coefficient is used to assess the degree of consistency between the annual rankings of different scenarios and those of the baseline scenario. The focus of the sensitivity analysis is not on determining the single, correct attribute for the two indicators, but rather on assessing the extent to which the overall time-series conclusions and obstacle diagnoses in this paper depend on the assumptions regarding the attributes of the indicators.
- (2)
- Robustness test of the weighting scheme
To test whether entropy-weighted scores exert a significant influence on comprehensive evaluation results due to differences in the variability of indicators, this study establishes an equally weighted control scenario. In the main model using the entropy method, the weights of each indicator are determined by the degree of dispersion from 2011 to 2024; in the equal-weighting scenario, all 20 secondary indicators are assigned a weight of 0.05. Both scenarios employ the same indicator directions and range-standardised results, with only the weighting scheme altered, to ensure that the comparison results primarily reflect the impact of the weighting method.
This paper compares composite indices, overall changes, linear trend coefficients, mean composite indices across the three phases, and annual rankings for the years 2011 and 2024 under the two weighting schemes, and uses Spearman’s rank correlation coefficient to measure the consistency of the annual rankings. At the same time, the maximum absolute difference in the annual composite indices under both schemes is calculated to assess the extent to which changes in the weighting scheme affect the index values.
4. Results of the Assessment of Urban Human Settlements’ Ecological and Environmental Quality in Shaanxi Province
Based on the established evaluation indicator system and research methodology, this paper conducts a comprehensive assessment of the quality of the urban living environment in Shaanxi Province from 2011 to 2024. The evaluation process first involved normalising and dimensionless processing of the 20 secondary indicators; subsequently, the entropy method was employed to determine the weights of each indicator. On this basis, the composite evaluation index, the indices of the primary indicator subsystems, and the degree of obstruction were calculated separately. It should be noted that the composite evaluation index is a relative index; its values reflect relative levels across different years within the study period, with higher values indicating a relatively higher quality of the urban living environment in that year.
In terms of data structure, the evaluation indicators for the quality of the urban living environment in Shaanxi Province from 2011 to 2024 generally exhibited significant temporal variations. Indicators such as urban green spaces, the number of parks, the area covered by road cleaning and maintenance, urban water and gas coverage rates, and total ecological water consumption have shown marked overall improvement; simultaneously, emissions of sulphur dioxide, nitrogen oxides, smoke (dust) and particulate matter have generally declined, indicating that pressure from atmospheric pollution emissions was significantly alleviated during the study period. These changes collectively form the basis for the temporal evolution of the quality of the urban living environment in Shaanxi Province.
4.1. Results of Indicator Weighting Calculations
Weights derived using the entropy method reflect the degree of dispersion and the ability to distinguish between time series for each indicator within the 2011–2024 study sample. Indicators that exhibit more pronounced variations across different years typically provide more information for distinguishing the relative states of different years and thus are assigned relatively higher weights; indicators with relatively stable variations are assigned relatively lower weights. It should be emphasised that the level of these weights should not be interpreted as a ranking of the indicators’ theoretical value, social significance, or policy priority.
The entropy-based weights in this paper range from 3.2885% to 6.5657%, with no single indicator exhibiting an extreme concentration of weight. The weights for the number of public toilets and the number of public toilets per 10,000 people are 5.0967% and 3.6802%, respectively (Table 5 and Figure 5). The former exhibits significant annual fluctuations and therefore receives a relatively higher time-series-differentiated weight; the latter controls for the influence of population size and better reflects the provision of public sanitation facilities per capita, but as it remained relatively stable over the study period, its entropy weight is lower. This result illustrates that whilst the entropy method can identify the degree of statistical variability, it cannot automatically identify the social explanatory power of an indicator. Therefore, it cannot be concluded on this basis that the number of public toilets is more important than the number of public toilets per 10,000 people.
Table 5.
Entropy weights of evaluation indicators for urban human settlements and ecological environment quality in Shaanxi Province.
Figure 5.
Entropy weights of evaluation indicators.
In terms of the weighting structure of the first-level indicators, urban green spaces and landscaping account for 26.62%, urban appearance and environmental hygiene for 21.83%, urban facility standards for 22.16%, and urban water resources and atmospheric environment for 29.39%. The weighting results indicate that the evaluation of urban living environment quality in Shaanxi Province is not dominated by a single dimension, but rather by the combined effects of ecological provision, environmental sanitation services, urban facility provision, and water resources and atmospheric environment. Among these, indicators with significant fluctuations—such as those relating to pollution emissions, ecological water use, and the expansion of green spaces and facilities—play a strong role in distinguishing the comprehensive evaluation results.
Looking at the secondary indicators, those with higher weights are primarily concentrated in two areas: firstly, indicators reflecting the pace of ecological development and infrastructure expansion, such as urban green space area, park green space area, number of parks, and total ecological water use; and secondly, indicators reflecting significant improvements in environmental pressure, such as sulphur dioxide emissions, nitrogen oxide emissions, and emissions of smoke (dust) and particulate matter. This indicates that changes in the quality of the urban living environment in Shaanxi Province stem not only from improvements in the supply capacity of ecological spaces and public facilities, but also from the realisation of achievements in pollution emission control.
4.2. Characteristics of the Temporal Evolution of the Comprehensive Evaluation Index
Based on standardised indicator values and entropy weights, this paper has calculated the comprehensive index of urban living environment quality in Shaanxi Province for the period 2011–2024 (Table 6 and Figure 6). The composite index rose from 0.1082 in 2011 to 0.8806 in 2024, representing an overall change of 0.7724, with a linear trend coefficient of 0.0603. This indicates that, under the indicator system and standardised benchmark of the sample period used in this study, the overall relative performance of Shaanxi Province’s urban living environment has generally trended upwards. It should be emphasised that the above figures are intended to reflect changes in relative standing between individual years within the study period; they should not be interpreted as indicating a 714.10 per cent improvement in the absolute quality of the ecological environment, nor do they imply that an absolute state of excellence or high quality had been achieved by 2024.
Table 6.
Comprehensive index and subsystem indices for urban living environment quality in Shaanxi Province, 2011–2024.
Figure 6.
Temporal evolution of the comprehensive index.
Viewed by phase, the mean composite indices for 2011–2015, 2016–2020, and 2021–2024 were 0.2379, 0.5236 and 0.8166, respectively. Based on their relative positions within the sample period, the three phases can be summarised as the ‘relatively low and gradually rising phase’, the ‘relatively accelerated rise accompanied by fluctuations phase’ and the ‘relatively high phase within the sample period’, respectively. This segmentation is used solely to describe the relative differences between the phases within the study period and does not constitute a classification of external environmental quality grades.
From 2011 to 2015, most indicators relating to green spaces, landscaping and infrastructure increased gradually; however, emissions of major air pollutants remained at relatively high levels within the study period, and the composite index rose overall. From 2016 to 2020, emissions of sulphur dioxide and nitrogen oxides fell significantly, and the rate of increase in the composite index accelerated; however, the index fell by 0.0149 in 2018 compared with 2017, indicating that changes in certain indicators had caused short-term fluctuations. From 2021 to 2024, indicators such as green spaces, landscaping, infrastructure provision and ecological water use remained at relatively high levels throughout the sample period, whilst key pollutant emission indicators generally remained at relatively low levels; consequently, the composite index remained at a relatively high level within the study period.
In terms of linear trends, the trend coefficient of the composite index is 0.0603, indicating an overall upward trend. When analysed by phase, the average composite index for 2011–2015 was 0.2379, rising to 0.5236 for 2016–2020, and further increasing to 0.8166 for 2021–2024. This indicates that the quality of the urban living environment in Shaanxi Province has undergone a process of improvement from a low baseline through structural adjustment, culminating in a stable and sustained rise to a higher level.
Specifically, the period from 2011 to 2015 constituted the foundational improvement phase. During this phase, there were increases in urban green space, park area, road cleaning and maintenance coverage, and the number of public toilets, with urban facilities gradually improving; however, air pollution emissions remained at a relatively high level, limiting the extent to which the composite index could rise. The period from 2016 to 2020 was characterised by both accelerated improvement and fluctuations. Pollution emission indicators showed significant improvement, with particularly marked decreases in sulphur dioxide and nitrogen oxide emissions, which made a significant contribution to the rise in the composite index; however, negative indicators such as the volume of domestic waste collected and the total volume of domestic water consumption increased in some years, causing some fluctuation in the composite index. The period from 2021 to 2024 represents a phase of sustained improvement at a relatively high level. Green spaces and landscaping, infrastructure provision and ecological water use continued to improve, whilst pollution emission pressures remained generally low, allowing the composite index to remain at a high level throughout the study period.
4.3. Evaluation Results of Primary Indicator Subsystems
To further reveal the structural sources of changes in the composite index, this study calculated the indices for four subsystems: urban green spaces and landscaping, urban environmental hygiene, urban facility standards, and urban water resources and atmospheric environment (Figure 7). The subsystem indices reflect the relative performance of the secondary indicators within each primary indicator, illustrating the key dimensions driving improvements in the quality of the urban human settlement ecological environment in Shaanxi Province.
Figure 7.
Subsystem indices of the ecological environment quality of urban human settlements.
4.3.1. Urban Green Spaces and Landscaping System
Urban green spaces and landscaping systems form the ecological foundation of the ecological environment quality of urban human settlements. Between 2011 and 2024, the area of urban green spaces in Shaanxi Province increased from 28,200 hectares to 81,900 hectares, whilst the area of park green spaces rose from 9100 hectares to 19,600 hectares. The number of parks rose from 130 to 505, and the area of parkland increased from 3200 hectares to 12,400 hectares. All these indicators show a significant upward trend, indicating that Shaanxi Province’s capacity to provide urban green space is continuously strengthening.
However, it should be noted that the greening coverage rate in built-up areas rose from 38.7% to 43.0%, a rate of increase that was relatively lower than the expansion in green space area and the number of parks. This indicates that whilst Shaanxi’s urban greening initiatives have achieved notable results in terms of overall expansion, the improvement in greening coverage rate—as a relative indicator—has been influenced by concurrent expansion of built-up areas. Consequently, future urban green space development should not focus solely on increasing the scale of green spaces but also on further optimising their spatial layout, improving accessibility, and enhancing ecological benefits per unit of land under development.
4.3.2. Urban Appearance and Environmental Sanitation System
The urban appearance and environmental sanitation system reflect the capacity of urban public environmental management and sanitation service provision. During 2011–2024, the area covered by road sweeping and cleaning services increased from 115.67 million m2 to 283. 24 million m2, specialised sanitation vehicles and equipment increased from 2009 to 7382, and the number of public toilets increased from 2816 to 6935, indicating substantial expansion in sanitation infrastructure and operational capacity.
Domestic waste collection and transport volume increased from 4.2827 million tonnes to 7.2264 million tonnes. However, this change may reflect multiple factors, including increased waste generation, population growth, expanded statistical coverage and improved collection capacity. Therefore, the increase cannot be directly interpreted as environmental deterioration. In the main model, this indicator is treated as a proxy for waste management pressure and assigned a negative attribute. Sensitivity analysis shows that its attribute setting influences subsystem evaluation and obstacle rankings in certain years. Thus, it is interpreted as an indicator of potential operational pressure rather than direct evidence of declining sanitation quality. A more comprehensive assessment requires additional indicators, such as per capita waste generation, harmless treatment and resource recovery rates.
4.3.3. Urban Infrastructure System
The urban infrastructure system reflects the capacity to ensure residents’ basic living standards. Between 2011 and 2024, the urban water supply coverage rate increased from 95.72% to 99.10%, the urban gas supply coverage rate rose from 92.09% to 98.88%, the per capita urban road area increased from 13.72 square metres to 18.11 square metres, and the per capita park and green space area rose from 11.41 square metres per person to 13.11 square metres per person. These changes indicate an overall improvement in Shaanxi Province’s urban infrastructure and public service provision capacity.
The standard of urban facilities systematically reflects the capacity to safeguard residents’ basic livelihoods. Urban water and gas coverage rates reflect the extent of basic service provision, whilst per capita urban road area, per capita park green space area and the number of public toilets per 10,000 people—when standardised by population—reflect, to a certain extent, residents’ relative access to public facilities. Among these, the number of public toilets per 10,000 people is better suited to accounting for changes in population size than the total number of public toilets; it is therefore of more direct significance when assessing the provision of public health services to residents.
Judging by the subsystem indices, the standard of urban facilities generally continued to improve over the study period, although the scope for further improvement in some indicators gradually narrowed towards the end. For example, urban water supply and gas supply coverage rates have already approached relatively high levels, leaving limited scope for marginal improvement; in contrast, the per capita area of park green space and the number of public toilets per 10,000 people better reflect the actual level of public ecological benefits and public services enjoyed by residents. Consequently, future efforts to optimise facilities should gradually shift the focus from quantitative expansion to improving per capita provision levels, the operational quality of facilities and service efficiency; furthermore, once geospatial data becomes available, the spatial accessibility and rational allocation of public toilets should be further evaluated.
4.3.4. Urban Water Resources and Atmospheric Environment Systems
Total domestic water consumption increased from 1.620 billion cubic metres to 2.120 billion cubic metres. This increase in total domestic water consumption may reflect an expansion in the scale of water resource consumption, or it may be related to urban population growth, rising living standards and improvements in public water supply coverage. The main model treats this as a proxy variable for negative pressure from a resource consumption perspective; however, sensitivity analysis indicates that altering the attribute of this indicator does not change the overall upward trend of the composite index, though it does affect specific composite index values and the subsequent ranking of obstacle levels. Consequently, this paper cannot conclude on this basis that the increase in total domestic water consumption is equivalent to a decline in water resource utilisation efficiency. Future studies should incorporate indicators such as per capita domestic water consumption, water loss rates in supply networks, water consumption per unit of GDP, and the utilisation rate of reclaimed water to conduct a more direct assessment of water resource pressure and utilisation efficiency.
Regarding atmospheric pollution emissions, sulphur dioxide emissions fell from 916,800 tonnes to 63,400 tonnes, nitrogen oxide emissions fell from 831,700 tonnes to 267,900 tonnes, and emissions of smoke (dust) and particulate matter fell from 463,400 tonnes to 117,700 tonnes. The decline in pollution emission indicators has significantly improved the standardised performance of the water resources and atmospheric environment subsystems, serving as a key factor in driving the improvement in the composite index. However, the total volume of domestic water consumption increased from 1.62 billion cubic metres to 2.12 billion cubic metres, indicating that pressure on water resources continues to rise as the city expands and living standards improve.
4.4. Characteristics of Changes and Relative Performance of Secondary Indicators
To analyse trends in each secondary indicator during the study period more intuitively, this paper compares representative indicators from 2011 and 2024 and examines the annual performance of different indicators using standardised heatmaps. Table 7 shows that most positive indicators increased during the study period, whilst negative pollution-emission indicators declined markedly, indicating that the improvement in the quality of the urban living environment in Shaanxi Province is supported by relatively clear data.
Table 7.
Changes in representative indicators of the urban living environment in Shaanxi Province, 2011–2024.
As can be seen from the standardised heatmap (Figure 8), indicators relating to green spaces and urban facilities generally exhibited higher standardised levels in the later period, indicating that these indicators continued to improve throughout the study period. Following negative standardisation, pollution emission indicators showed a marked increase in standardised values in the later period, reflecting the positive impact of reduced pollution emissions on the improvement of ecological and environmental quality. In contrast, negative indicators such as domestic waste collection volume and total domestic water consumption continued to exert some pressure in the later period, indicating that the pressures on resource consumption and waste management resulting from the expansion of urban operations cannot be overlooked.
Figure 8.
Standardised performance of indicators across the study period.
Overall, the improvement in the quality of the urban living environment in Shaanxi Province exhibits a ‘dual-drive’ characteristic: on the one hand, positive indicators such as ecological green spaces, public facilities and ecological water use have continued to rise, enhancing the level of urban ecological provision and public services; on the other hand, negative indicators related to air pollution emissions have declined significantly, reducing pressure on the urban ecological environment. However, the increase in domestic waste collection volumes and total domestic water consumption indicates that, during the course of urban development, attention must still be paid to the potential constraints on the quality of the human living environment posed by resource consumption and the growth of domestic waste.
4.5. Results of the Diagnosis of Obstacles
The ‘obstacle degree’ is a relative diagnostic result calculated jointly based on indicator weights, standardised deviations and indicator attributes; it is not an objective, fixed ranking of environmental risks. In particular, for indicators with dual statistical meanings, their obstacle degree is influenced by the setting of positive or negative attributes. Therefore, the obstacle degree results for the baseline scenario below should be interpreted in conjunction with the sensitivity analysis.
The comprehensive evaluation index reflects the overall level of urban living environment quality in Shaanxi Province, but it is difficult to determine directly which indicators are constraining improvements in quality. Consequently, based on the constructed impediment degree model, the primary impediment indicators and impediment subsystems for different time periods were further identified. Table 8 lists the top five indicators by impediment degree for 2011, 2015, 2020 and 2024, whilst Figure 9 and Figure 10 illustrate the evolution of impediment degrees within first-level subsystems and the primary impediment indicators for 2024, respectively.
Table 8.
Major obstacle indicators for urban living environment quality in Shaanxi Province in representative years.
Figure 9.
Degree of subsystem obstacles and their temporal variation.
Figure 10.
Top obstacle indicators in 2024.
Results from the baseline scenario indicate that the relative shortcomings in the early part of the study period were primarily concerned with green spaces, facility provision, ecological water use and pollution emissions; as the relative rankings of most pollution emission indicators improved over the sample period, the structure of obstacles changed in the later stages. Assuming that domestic waste collection volume and total domestic water consumption are used as proxy variables for negative pressures, the obstacle levels for both rose significantly in 2024.
However, sensitivity analysis reveals that the ranking of domestic waste collection volume and total domestic water consumption as obstacles in the latter part of the study period is highly dependent on their attribute settings. Consequently, this paper no longer categorises these two as unequivocally the primary ecological obstacles for Shaanxi Province in the latter part of the study period but rather regards them as signals of urban operational pressures that require further verification. By contrast, indicators such as the number of public toilets per 10,000 people, per capita park green space area and nitrogen oxide emissions still exhibit some room for relative improvement in the alternative scenarios.
Consequently, the policy significance of the obstacle index analysis lies primarily in highlighting indicators that may require priority attention, rather than directly proving a causal relationship between them and overall environmental quality. With regard to waste and domestic water consumption, data on generation intensity, treatment efficiency and consumption per capita should be further collected before assessing their actual environmental pressures.
4.6. Results of the Sensitivity Analysis of Indicator Attributes
Sensitivity analysis indicates (Table 9) that different settings for indicator attributes alter the specific values and magnitudes of change in the composite index; however, in all scenarios, 2011 represents the lowest value and 2024 the highest, with all linear trend coefficients being positive and the correlation coefficients with the annual ranking of the baseline scenario ranging between 0.9956 and 1.0000. Consequently, the basic assessment that Shaanxi Province’s overall relative performance has generally improved and will be higher in later periods than in earlier ones does not depend on the settings of any single attribute, such as domestic waste collection volume or total domestic water consumption, and thus demonstrates good directional robustness.
Table 9.
Sensitivity analysis of indicator attributes.
However, certain inter-annual fluctuations and the ranking of obstacle indicators are relatively sensitive to the attributes assigned. For example, under the baseline scenario, the composite index for 2018 decreased by 0.0149 compared with 2017; however, when the volume of domestic waste collected was set as a positive indicator, the index for 2018 increased by 0.0621 relative to 2017. This indicates that fluctuations in individual years are, to a certain extent, influenced by the statistical interpretation of waste collection volumes and should not be interpreted solely as a deterioration in actual ecological and environmental conditions.
The sensitivity of the obstacle degree results is even more pronounced. Under the baseline scenario, the obstacle degrees for domestic waste collection volume and total domestic water consumption in 2024 were 45.0641 per cent and 37.9657 per cent respectively, ranking first and second; when both indicators are set as positive, they no longer constitute the primary constraints in 2024, and the relative constraint rankings of indicators such as the number of public toilets per 10,000 people, nitrogen oxide emissions and per capita park green space area rise. Therefore, the conclusion that ‘domestic waste collection volume and total domestic water consumption are the primary constraints in the later period’ relies on the assumption that the indicators are pressure-oriented and cannot be stated as a definitive fact unaffected by model settings.
Overall, the conclusions of this paper regarding the general upward trend and phased changes are relatively robust, whilst those concerning the volume of domestic waste collected, total domestic water consumption and their rankings as obstacles are conditional. Subsequent analyses and policy interpretations should prioritise consideration of changes in the original indicators and be further validated using more direct indicators such as per capita waste generation, the rate of harmless waste treatment, the rate of resource recovery, domestic water consumption per capita, water consumption per unit of GDP and the rate of reclaimed water utilisation.
4.7. Results of the Robustness Analysis of the Weighting Scheme
Robustness tests of the weighting schemes indicate (Table 10) that, following the application of equal weights to the secondary indicators, the specific values of the composite index underwent certain changes; however, the overall time-series characteristics were highly consistent with the results obtained using the entropy method. Under the equal-weighting scenario, the composite index rose from 0.1135 in 2011 to 0.8745 in 2024, with a linear trend coefficient of 0.0597, which is close to the 0.0603 obtained using the entropy method. The mean composite indices for the three phases were 0.2460, 0.5399, and 0.8180, respectively; the later phases continued to rank higher than the earlier ones, and the order of the phases remained unchanged.
Table 10.
Comparison of comprehensive evaluation results under the entropy-weighted and equal-weighting scenarios.
The Spearman correlation coefficient for the annual rankings under the two weighting schemes was 1.0000, with the maximum absolute difference in the composite index across years being 0.0229; this indicates that changing the weighting method did not substantially alter the annual relative rankings or the overall upward trend. In 2018, the index was lower than in 2017 under both scenarios, but the decline was relatively smaller in the equally weighted scenario, indicating that the weighting method affects the magnitude of fluctuations in individual years without altering their fundamental trend.
This result demonstrates that the core conclusion of this paper—namely, that the overall relative performance of the urban living environment in Shaanxi Province has generally improved, with later periods of the study period outperforming earlier ones—exhibits good robustness under both entropy-weighted and equally weighted scenarios. However, the consistency between the two methods does not imply that entropy-weighted values can represent the social significance of the indicators. For indicators such as the number of public toilets per 10,000 people—which exhibit low variability but possess strong social explanatory power—a separate discussion should still be conducted in conjunction with the raw values, the meaning of the indicators and the results of the barrier index; their significance should not be judged solely on the basis of their entropy-weighted values.
4.8. Analysis of Results
Under the indicator system outlined in this paper and the standardised benchmark for the 2011–2024 sample period, the overall relative performance of Shaanxi Province’s urban living environment has shown an upward trend, with the composite index rising from 0.1082 to 0.8806 (Figure 11). This change indicates that, in the latter part of the study period, the province’s relative standing across most evaluation indicators was higher than in the earlier period; however, it cannot be concluded from this alone that Shaanxi Province’s urban living environment has attained a specific absolute quality level. Sensitivity analysis of indicator attributes shows that, regardless of whether the direction of changes in domestic waste collection volumes and total domestic water consumption is altered or whether these two indicators are excluded, the overall trend and annual rankings remain essentially stable; robustness analysis of weighting schemes further indicates that, when using the entropy method or the equal-weighting method for secondary indicators, the overall direction of the composite index, the sequence of phases and the annual rankings remain highly consistent. However, the sensitivity analysis also demonstrates that the weighting method affects the specific numerical values of the composite index and the amplitude of fluctuations in individual years, whilst the definition of indicator attributes significantly influences the ranking of certain barrier indicators. Therefore, the composite index is primarily used to describe overall relative changes; the entropy weight of a particular indicator should not be directly interpreted as its theoretical importance, nor should the ranking of barrier levels be interpreted as a definitive policy priority. Policy analysis should involve a comprehensive assessment based on changes in the original indicators, the social implications of those indicators, stable results across different weighting scenarios, and the limitations of the data scale.
Figure 11.
Analysis of the quality of the human settlement ecological environment in Shaanxi Province.
The raw data indicate that indicators such as urban green spaces, parks, environmental sanitation facilities, water and gas supply services, and water for ecological purposes have generally increased, whilst emissions of major atmospheric pollutants have fallen significantly. These changes in the indicators collectively account for the relative rise in the composite index. Sensitivity analysis further demonstrates that, regardless of whether the volume of domestic waste collection and the total volume of domestic water consumption are treated as positive, negative or excluded, the overall upward trend and annual rankings remain largely stable; consequently, the overall temporal assessment presented in this paper possesses a certain degree of robustness.
At the same time, the ranking of the later-stage constraint indicators is relatively sensitive to the attributes assigned to the two contentious indicators. Consequently, the volume of domestic waste collected and the total volume of domestic water consumption can only be interpreted as relative constraints under a pressure-oriented scenario; it cannot be concluded on this basis that improvements in waste collection capacity or increases in residents’ reasonable domestic water consumption have a negative impact on the living environment.
5. Discussion
5.1. Reasons for the Improvement in Human Settlements’ Ecological Environment Quality
The continuous improvement in the quality of the urban human settlement ecological environment in Shaanxi Province is primarily attributable to enhanced capacity for the provision of urban green spaces. Between 2011 and 2024, the area of urban green space increased from 28,200 hectares to 81,900 hectares, the number of parks rose from 130 to 505, and the area of parks grew from 3200 hectares to 12,400 hectares, indicating the continuous advancement of urban landscaping and greening in Shaanxi Province. Urban green spaces and parks not only improve the urban landscape but also serve to regulate the microclimate, purify the air, mitigate the urban heat island effect and provide recreational spaces; consequently, the expansion of green spaces is a vital foundation for enhancing the quality of the human living environment.
Improvements in urban infrastructure and public service standards have provided a stable foundation for enhancing the quality of the human living environment. During the study period, the urban water supply coverage rate rose from 95.72% to 99.10%, the urban gas supply coverage rate increased from 92.09% to 98.88%, the per capita urban road area expanded from 13.72 square metres to 18.11 square metres, and the per capita park green space area also saw an increase. This indicates that the basic living conditions of residents in Shaanxi Province have continued to improve, and the capacity of facilities such as water supply, gas, roads and park green spaces to meet residents’ needs has steadily strengthened. The improvement of infrastructure has enhanced the convenience of residents’ lives and the efficiency of urban operations and is a key factor in the rise in the comprehensive evaluation index.
The significant reduction in air pollutant emissions is a key environmental factor in the improvement of the quality of the human living environment. Between 2011 and 2024, sulphur dioxide emissions fell from 916,800 tonnes to 63,400 tonnes, nitrogen oxide emissions fell from 831,700 tonnes to 267,900 tonnes, and emissions of smoke (dust) and particulate matter fell from 463,400 tonnes to 117,700 tonnes. The reduction in pollutant emissions has directly improved the standardised performance of negative indicators, reflecting the significant achievements made by Shaanxi Province in energy structure adjustment, industrial pollution control and air pollution prevention and control. The reduction in pollutant emissions has not only improved air quality but also reduced health risks to residents.
Enhanced safeguards for ecological water use and improved environmental sanitation management capabilities have also collectively driven improvements in overall quality. The total volume of water allocated for ecological purposes increased from 210 million cubic metres to 790 million cubic metres, indicating strengthened water resource safeguards in urban ecological development. Concurrently, there were significant increases in the area covered by road cleaning and maintenance, the number of specialised vehicles and equipment for urban sanitation, and the number of public toilets, reflecting a continuous improvement in urban public environmental management capabilities. Shaanxi Province’s composite index rose from 0.1082 in 2011 to 0.8806 in 2024, indicating that this improvement was not driven by a single factor but rather resulted from the combined effects of the expansion of green spaces, the improvement of facilities, pollution reduction and environmental governance.
5.2. Sensitivity Analysis of Indicator Attributes, Weights, and Evaluation Boundaries
The sensitivity analysis distinguishes between the robustness of overall temporal trends and the sensitivity of specific obstacle rankings. Under different indicator attribute scenarios, the composite index consistently showed higher values in the later study period than in the earlier period, indicating that improvements in ecological provision, infrastructure development and pollution reduction were the main drivers of overall change. However, the rankings of domestic waste collection volume and total domestic water consumption among the later-stage obstacle indicators varied under different attribute settings, suggesting that these indicators should not be interpreted as unconditional ecological pressure variables.
This finding highlights the need to distinguish between total volume growth, environmental pressure intensity and governance capacity. Increased domestic waste collection may result from both higher waste generation and improved collection coverage, while increased domestic water consumption may reflect both greater resource demand and improved public service provision. Without supporting indicators such as per capita consumption, treatment efficiency and resource utilisation intensity, aggregate indicators may introduce scale effects. Therefore, these two indicators are retained primarily to represent changes in urban operational scale, while sensitivity scenarios are used to avoid excessive dependence on specific attribute assumptions.
Furthermore, the composite index developed in this study is a relative index based on the maximum and minimum values within the study period. An increase in the index indicates an improved relative position compared with other years, rather than a direct indication of absolute ecological quality or the achievement of a specific liveability standard. Therefore, policy interpretation should rely on the combined evidence of original indicators, temporal trends and robustness tests rather than the composite index alone.
The comparison between entropy weighting and equal weighting shows that annual rankings and phased characteristics remain highly consistent, indicating that the main temporal conclusions are relatively robust to weighting schemes. However, entropy weights represent differences in information contribution rather than theoretical or policy importance. Indicators with greater annual variation may receive higher weights even when their ecological or social significance is not necessarily greater. For example, the number of public toilets per 10,000 people better reflects residents’ access to sanitation services than the total number of public toilets, but its lower annual variation results in a smaller entropy weight. Therefore, the interpretation of public service indicators should consider their raw changes, per capita implications and constraint effects rather than relying solely on entropy weights.
5.3. Existing Issues
Although urban green space provision has improved considerably, its growth has not fully translated into equivalent improvements in residents’ ecological welfare. During the study period, urban green space area, park numbers and park area increased substantially; however, built-up area greening coverage increased only from 38.7% to 43.0%, and per capita park green space increased from 11.41 m2/person to 13.11 m2/person. This suggests that increasing green space quantity alone does not necessarily ensure improved accessibility, spatial balance, or utilisation efficiency. Future urban green development should therefore shift from expansion-oriented approaches towards improving spatial distribution and service effectiveness.
Domestic waste collection and transport volume continued to increase, indicating persistent pressure on urban sanitation systems. Although sanitation infrastructure, including road cleaning coverage, specialised vehicles and public toilets, expanded significantly, improvements in collection capacity alone cannot fundamentally reduce environmental burdens without progress in waste reduction, source separation, resource recovery and harmless disposal. Therefore, future management should focus not only on expanding sanitation facilities but also on improving the efficiency and sustainability of waste management systems.
Water resource pressure remains another important issue. During the study period, both surface water supply and ecological water allocation increased, reflecting improvements in water security and ecological investment. However, domestic water consumption also increased from 1.620 to 2.120 billion m3, indicating continued pressure from population concentration, urban expansion and rising living standards. Given the uneven distribution of water resources, industrial structures and development patterns within Shaanxi Province, balancing domestic demand, urban growth and ecological water requirements remains a key challenge.
The current statistical indicators provide limited information on the quality and accessibility of public services. Although the number of public toilets and the number per 10,000 people represent facility scale and per capita provision, respectively, they cannot reflect spatial distribution, service radius, operational status or actual accessibility. Provincial averages may also conceal inequalities between urban districts, suburban areas and densely populated communities. Future research should incorporate spatial data, population distribution and transport networks to develop more refined accessibility-based indicators.
Overall, the major constraints appear to have shifted from insufficient ecological space, infrastructure shortages and pollution emissions towards urban operational pressures, resource consumption and public service optimisation. By 2024, domestic waste collection volume, domestic water consumption, public toilets per 10,000 people, nitrogen oxide emissions and per capita park green space became the main constraint indicators. This suggests that future governance should move beyond simple expansion and pollution control towards resource efficiency, waste reduction, and improvements in public ecological service quality.
5.4. Comparison with Existing Research and Explanation of Differences
This study was further compared with previous research on urban green infrastructure, environmental health, public service governance and ecological environments in western China (Table 11). Existing studies generally demonstrate that urban environmental quality is determined by multiple interacting factors, including ecological space, pollution pressures, infrastructure and human activities.
Table 11.
Comparison of the main findings of this study with those of existing research.
Korkou et al. emphasised that the effectiveness of urban green infrastructure depends not only on green space quantity but also on spatial distribution, connectivity, accessibility, and public participation. This is consistent with the present study, which found that substantial increases in green space area were not fully reflected in improvements in greening coverage and per capita green space. Similarly, Xu et al. demonstrated that urban environmental exposure is shaped jointly by pollution, land use, greenness, and facility accessibility, supporting the multidimensional evaluation framework adopted in this study.
The findings are also consistent with previous research showing that ecological improvement, pollution control and infrastructure development collectively contribute to enhanced living environments. In this study, green spaces, sanitation facilities, municipal infrastructure and ecological water supply increased, while major atmospheric pollutant emissions declined, resulting in an overall upward trend in the composite index. However, because the index represents relative changes within the study period, this result should not be interpreted as evidence that Shaanxi Province has achieved a specific absolute environmental quality level.
Compared with remote sensing-based studies, which are effective at identifying spatial differences in land cover, ecological space, and urban expansion, this study incorporates statistical indicators related to sanitation services, public facilities, water utilisation, and pollution emissions, providing continuous annual information on provincial-scale environmental service changes. Nevertheless, statistical data cannot reveal whether facilities are spatially equitable or effectively utilised by different population groups. Therefore, the results represent changes in service provision scale and relative performance rather than direct improvements in residents’ satisfaction or welfare.
Differences between this study and spatially based research, such as that by Guo et al., mainly arise from differences in research scales and data sources. Studies based on spatial data can identify regional disparities and development–environment conflicts, whereas this study evaluates Shaanxi Province as an integrated unit and focuses on temporal evolution. In addition, the use of domestic waste collection volume and total domestic water consumption as proxy indicators means that their constraint rankings depend partly on the indicator definitions. Therefore, this study is better suited to identifying provincial-scale temporal trends and phased constraints rather than local environmental inequalities or causal effects of specific policies.
Overall, the findings are broadly consistent with previous research regarding the multidimensional nature of urban human settlement environments, the transition from green space expansion towards functional optimisation, and the coexistence of urban development and environmental pressures. Differences among studies primarily reflect variations in evaluation scale, indicator boundaries, data sources, and methodological approaches rather than contradictions in conclusions.
5.5. Policy Implications
Shaanxi Province should shift from expanding the quantity of urban environmental resources towards improving their quality and efficiency. Future green space development should emphasise accessibility, equity and ecological functionality, particularly through the provision of pocket parks, community green spaces and connected green infrastructure networks in densely populated and underserved areas.
Waste management policies should avoid interpreting increases in total waste collection volume as direct environmental deterioration, as such changes may reflect both rising waste generation and improved service capacity. Future monitoring should incorporate indicators such as per capita waste generation, waste sorting, harmless treatment and resource recovery rates, while promoting source reduction and recycling.
Similarly, increases in domestic water consumption should be evaluated alongside water-use efficiency indicators, including per capita consumption, leakage rates, reclaimed water utilisation and water-use intensity. Public services should transition from quantitative expansion to balanced allocation and refined governance, improving spatial equity, operational efficiency, and maintenance quality of facilities. Digital technologies should be further applied to enhance municipal management and environmental service provision.
6. Conclusions
This paper constructs an evaluation system for the quality of the urban living environment in Shaanxi Province based on four dimensions: urban green spaces and landscaping, urban appearance and environmental hygiene, urban facility standards, and urban water resources and atmospheric environment. It employs the entropy method, a comprehensive evaluation model and the barrier index model to analyse relative temporal evolution and structural shortcomings from 2011 to 2024.
Within a standardised framework using the maximum and minimum values of each indicator during the study period as reference points, the composite index rose from 0.1082 in 2011 to 0.8806 in 2024, with a linear trend coefficient of 0.0603. This indicates that the overall relative performance of the urban living environment in Shaanxi Province improved during the study period. This conclusion reflects changes in relative standing across different years within the sample period; it does not imply that the absolute quality of the ecological environment has improved by the same proportion, nor can it be used to conclude that an absolute state of excellence or sustainability had been achieved by 2024.
Looking at the raw indicators, there was an overall increase in urban green spaces, parks, environmental sanitation facilities, urban infrastructure and the supply of water for ecological purposes, whilst emissions of sulphur dioxide, nitrogen oxides, smoke (dust) and particulate matter fell significantly. These changes collectively form the primary statistical basis for the rise in the comprehensive relative performance. At the same time, the volume of domestic waste collected and the total volume of domestic water consumption have continued to rise; however, as both are influenced by changes in population size, the pace of urbanisation, the coverage of public services and governance capacity, this cannot be directly interpreted as a decline in environmental quality.
Sensitivity analysis indicates that, after altering the attributes of domestic waste collection volumes and total domestic water consumption—or excluding both indicators simultaneously—the overall upward trend of the composite index, as well as its phased changes and annual rankings, remain largely consistent, suggesting that the overall temporal conclusions possess a certain degree of robustness. However, the ranking of the main barrier indicators in the later stages is relatively sensitive to the attributes assigned to these two variables. Consequently, the volume of domestic waste collected and the total volume of domestic water consumption can only be regarded as relative constraints under pressure-oriented scenarios and should not be identified as definitive primary ecological barriers.
Future research should further incorporate indicators such as per capita domestic waste generation, the rate of safe waste disposal, the rate of resource recovery, per capita domestic water consumption, water consumption per unit of GDP, and the rate of reclaimed water utilisation, in order to mitigate the scale effects arising from total volume variables. At the same time, external environmental standards or policy target values could be introduced to construct an evaluation method with a fixed reference benchmark, thereby enhancing the applicability of the composite index in assessing absolute quality and facilitating cross-regional comparisons.
Author Contributions
Conceptualisation, W.Z. and L.H.; methodology, W.Z.; software, L.H.; validation, W.Z. and L.H.; formal analysis, L.H.; investigation, W.Z.; resources, W.Z.; data curation, L.H.; writing—original draft preparation, W.Z.; visualisation, L.H.; supervision, W.Z.; writing—review and editing, W.Z. and L.H. All authors have read and agreed to the published version of the manuscript.
Funding
The Humanities and Social Sciences Research Project of the Ministry of Education of China: Research on Cultural Genetics and Contemporary Remodelling of Landscape Formation of Han and Tang Villages (23XJC760003); the Shaanxi Provincial Social Science Foundation Project: Research on Survey Data Mining and Resource Value of Revolutionary Cultural Relics in Shaanxi (2023GM03); the Shaanxi Provincial Social Science Planning Project: Research on Evaluation Indicator System of Outstanding Popularisation Achievements in Social Sciences (2023ZD1825).
Institutional Review Board Statement
Not applicable.
Informed Consent Statement
Not applicable.
Data Availability Statement
The original contributions presented in this study are included in the article. Further inquiries can be directed to the corresponding author.
Acknowledgments
The authors would like to thank the editors and anonymous reviewers for their constructive comments and valuable suggestions.
Conflicts of Interest
The authors declare that there are no conflicts of interest regarding the publication of this paper.
References
- Bianchi, C.; Nasi, G.; Rivenbark, W.C. Implementing collaborative governance: Models, experiences, and challenges. Public Manag. Rev. 2021, 23, 1581–1589. [Google Scholar] [CrossRef] [Scilit]
- Wei, W.; Bao, Y.; Wang, Z.; Chen, X.; Luo, Q.; Mo, Y. Response of habitat quality to urban spatial morphological structure in multi-mountainous city. Ecol. Indic. 2023, 146, 109877. [Google Scholar] [CrossRef] [Scilit]
- Song, X.; Chen, F.; Sun, Y.; Ma, J.; Yang, Y.; Shi, G. Effects of land utilization transformation on ecosystem services in urban agglomeration on the northern slope of the Tianshan Mountains, China. Ecol. Indic. 2024, 162, 112046. [Google Scholar] [CrossRef] [Scilit]
- Li, C.; Chen, H.; Fang, Y. Influence Mechanism, Simulation, and Prediction of Urban Expansion in Shaanxi Province, China. Land 2025, 14, 1637. [Google Scholar] [CrossRef] [Scilit]
- Xie, H.; Huang, M.; Lei, W.; Wang, Y.; Ou, L. Quantitative analysis of big data for land resource classification and zoning at the township level in Northern Shaanxi. Big Data Res. 2024, 36, 100458. [Google Scholar] [CrossRef] [Scilit]
- Mahtta, R.; Fragkias, M.; Güneralp, B.; Mahendra, A.; Reba, M.; Wentz, E.A.; Seto, K.C. Urban land expansion: The role of population and economic growth for 300+ cities. npj Urban Sustain. 2022, 2, 5. [Google Scholar] [CrossRef] [Scilit]
- Raihan, A. Sustainable human settlements in the 21st century: A multidimensional review of challenges and solutions. Hum. Settl. Sustain. 2026, 2, 83–107. [Google Scholar] [CrossRef] [Scilit]
- Deng, Q.; Wang, Y.; Huang, H. Spatio-temporal Evolutionary Characteristics and Driving Factors of Rural Living Environment Quality in Sichuan Province. J. Agric. Resour. Environ. 2023, 40, 1111–1121. [Google Scholar] [CrossRef]
- Keshavarz, Y.; Jervekani, M.T.; Maroufi, F.; Kermani, M.Z. Sustainable human habitats development: A review on concepts, trends and events based on the experiences of successful cities in the world. J. Innov. Sustain. RISUS 2023, 14, 87–103. [Google Scholar] [CrossRef] [Scilit]
- Melchiorri, M. The global human settlement layer sets a new standard for global urban data reporting with the urban centre database. Front. Environ. Sci. 2022, 10, 1003862. [Google Scholar] [CrossRef] [Scilit]
- Gavaldà, O.; Gibbs, C.; Eicker, U. A Review of Current Evaluation Urban Sustainability Indicator Frameworks and a Proposal for Improvement. Sustainability 2023, 15, 15425. [Google Scholar] [CrossRef] [Scilit]
- Hamzah, N.F.; Hasim, M.S.; Ariff, N.R.M.; Adnan, H.; Yussof, F.N.M. Environmental sustainability initiatives (ESI) and smart cities components implementation (SCCI): A preliminary study on the selected city council in Malaysia. AIP Conf. Proc. 2023, 2881, 020003. [Google Scholar] [CrossRef] [Scilit]
- Xu, J.; Liu, N.; Polemiti, E.; Garcia-Mondragon, L.; Tang, J.; Liu, X.; Lett, T.; Yu, L.; Nöthen, M.M.; Feng, J.; et al. Effects of urban living environments on mental health in adults. Nat. Med. 2023, 29, 1456–1467. [Google Scholar] [CrossRef] [Scilit] [PubMed]
- Korkou, M.; Tarigan, A.K.; Hanslin, H.M. The multifunctionality concept in urban green infrastructure planning: A systematic literature review. Urban For. Urban Green. 2023, 85, 127975. [Google Scholar] [CrossRef] [Scilit]
- Aizizi, Y.; Kasimu, A.; Liang, H.; Zhang, X.; Zhao, Y.; Wei, B. Evaluation of ecological space and ecological quality changes in urban agglomeration on the northern slope of the Tianshan Mountains. Ecol. Indic. 2023, 146, 109896. [Google Scholar] [CrossRef] [Scilit]
- Zhang, H.; Liu, Y.; Li, X.; Feng, R.; Gong, Y.; Jiang, Y.; Guan, X.; Li, S. Combing remote sensing information entropy and machine learning for ecological environment assessment of Hefei-Nanjing-Hangzhou region, China. J. Environ. Manag. 2023, 325, 116533. [Google Scholar] [CrossRef] [Scilit] [PubMed]
- Roy, S.; Bose, A.; Majumadar, S.; Chowdhury, I.R.; Abdo, H.G.; Almohamad, H.; Al Dughairi, A.A. Evaluating urban environment quality (UEQ) for Class-I Indian city: An integrated RS-GIS based exploratory spatial analysis. Geocarto Int. 2022, 38, 2153932. [Google Scholar] [CrossRef] [Scilit]
- Gorgij, A.D.; Moayeri, M.M. Proposing a novel method for the irrigation water quality assessment, using entropy weighted method, entitled: “EIWQI”. Environ. Earth Sci. 2023, 82, 462. [Google Scholar] [CrossRef] [Scilit]
- Wang, W.; Li, G.; Kontoleon, A.; Ma, Y.; Guo, W. Natural resources balance sheets accounting: Theoretical framework and practice in the Shaanxi province of China. arXiv 2024, arXiv:2411.09869. [Google Scholar] [CrossRef] [Scilit]
- Xiao, Y.; Wang, R.; Wang, F.; Huang, H.; Wang, J. Investigation on spatial and temporal variation of coupling coordination between socioeconomic and ecological environment: A case study of the Loess Plateau, China. Ecol. Indic. 2022, 136, 108667. [Google Scholar] [CrossRef] [Scilit]
- Guo, C.; Zhang, H.; Dou, Y.; Kuang, W.; Bao, W. Patterns, synergies, and interactions between human activities and living environment on the Qinghai-Xizang Plateau. J. Geogr. Sci. 2026, 36, 341–362. [Google Scholar] [CrossRef] [Scilit]
- Quan, Z.; Huijuan, N.; Xiaoying, L. Evaluation of urban space livability in the urban area of Hefei based on production-living-ecological space. J. Resour. Ecol. 2024, 15, 338–350. [Google Scholar] [CrossRef] [Scilit]
- Huang, J.; Zhang, Y.; Zhang, J.; Qi, J.; Liu, P. Study on the ecological environment quality and its driving factors of the spatial transformation of production-living-ecological space in Baishan City. Sci. Rep. 2024, 14, 18709. [Google Scholar] [CrossRef] [Scilit] [PubMed]
- Du, W.; Wang, Y.; Qian, D.; Lyu, X. Process and Eco-Environment Impact of Land Use Function Transition under the Perspective of “Production-Living-Ecological” Spaces—Case of Haikou City, China. Int. J. Environ. Res. Public Health 2022, 19, 16902. [Google Scholar] [CrossRef] [Scilit] [PubMed]
- Li, K.; Zhang, B.; Xiao, W.; Lu, Y. Land Use Transformation Based on Production−Living−Ecological Space and Associated Eco-Environment Effects: A Case Study in the Yangtze River Delta Urban Agglomeration. Land 2022, 11, 1076. [Google Scholar] [CrossRef] [Scilit]
- Muyibul, Z.; Abulizi, M. Evolutionary characteristics of production, living, and ecological spaces and related environmental effects in Urumqi, Northwest China. Environ. Dev. Sustain. 2026, 28, 12533–12555. [Google Scholar] [CrossRef] [Scilit]
- Chen, S.; Shao, C.; Yu, H.; Gao, J. Navigating urban human settlement sustainability: A multi-indicator assessment based on sustainable development goal 11. J. Clean. Prod. 2024, 472, 143509. [Google Scholar] [CrossRef] [Scilit]
- Zhou, X.; Ao, R.; Zhu, Y.; Chen, J.; Shen, X.; Aihemaitijiang, Y. Urban human settlements’ resilience measurement and characteristics and their mechanism model in China. PLoS ONE 2023, 18, e0289754. [Google Scholar] [CrossRef] [Scilit] [PubMed]
- Fang, C.; Ma, H.; Bao, C.; Wang, Z.; Li, G.; Sun, S.; Fan, Y. Urban–rural human settlements in China: Objective evaluation and subjective well-being. Humanit. Soc. Sci. Commun. 2022, 9, 395. [Google Scholar] [CrossRef] [Scilit]
- Liu, Q.; Gong, D.; Gong, Y. Index system of rural human settlement in rural revitalization under the perspective of China. Sci. Rep. 2022, 12, 10586. [Google Scholar] [CrossRef] [Scilit] [PubMed]
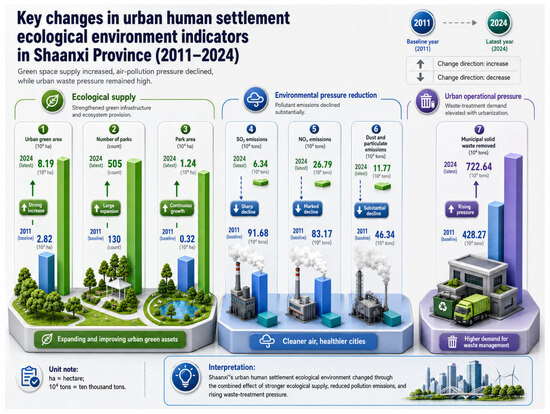
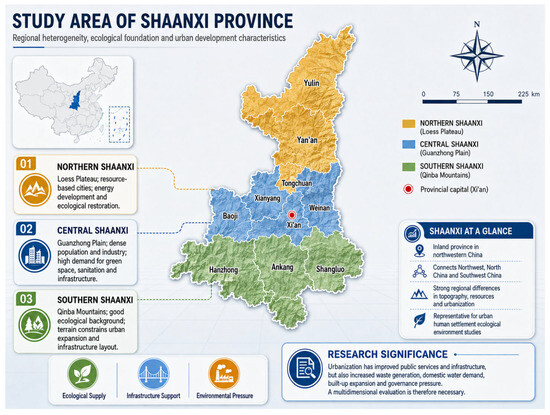
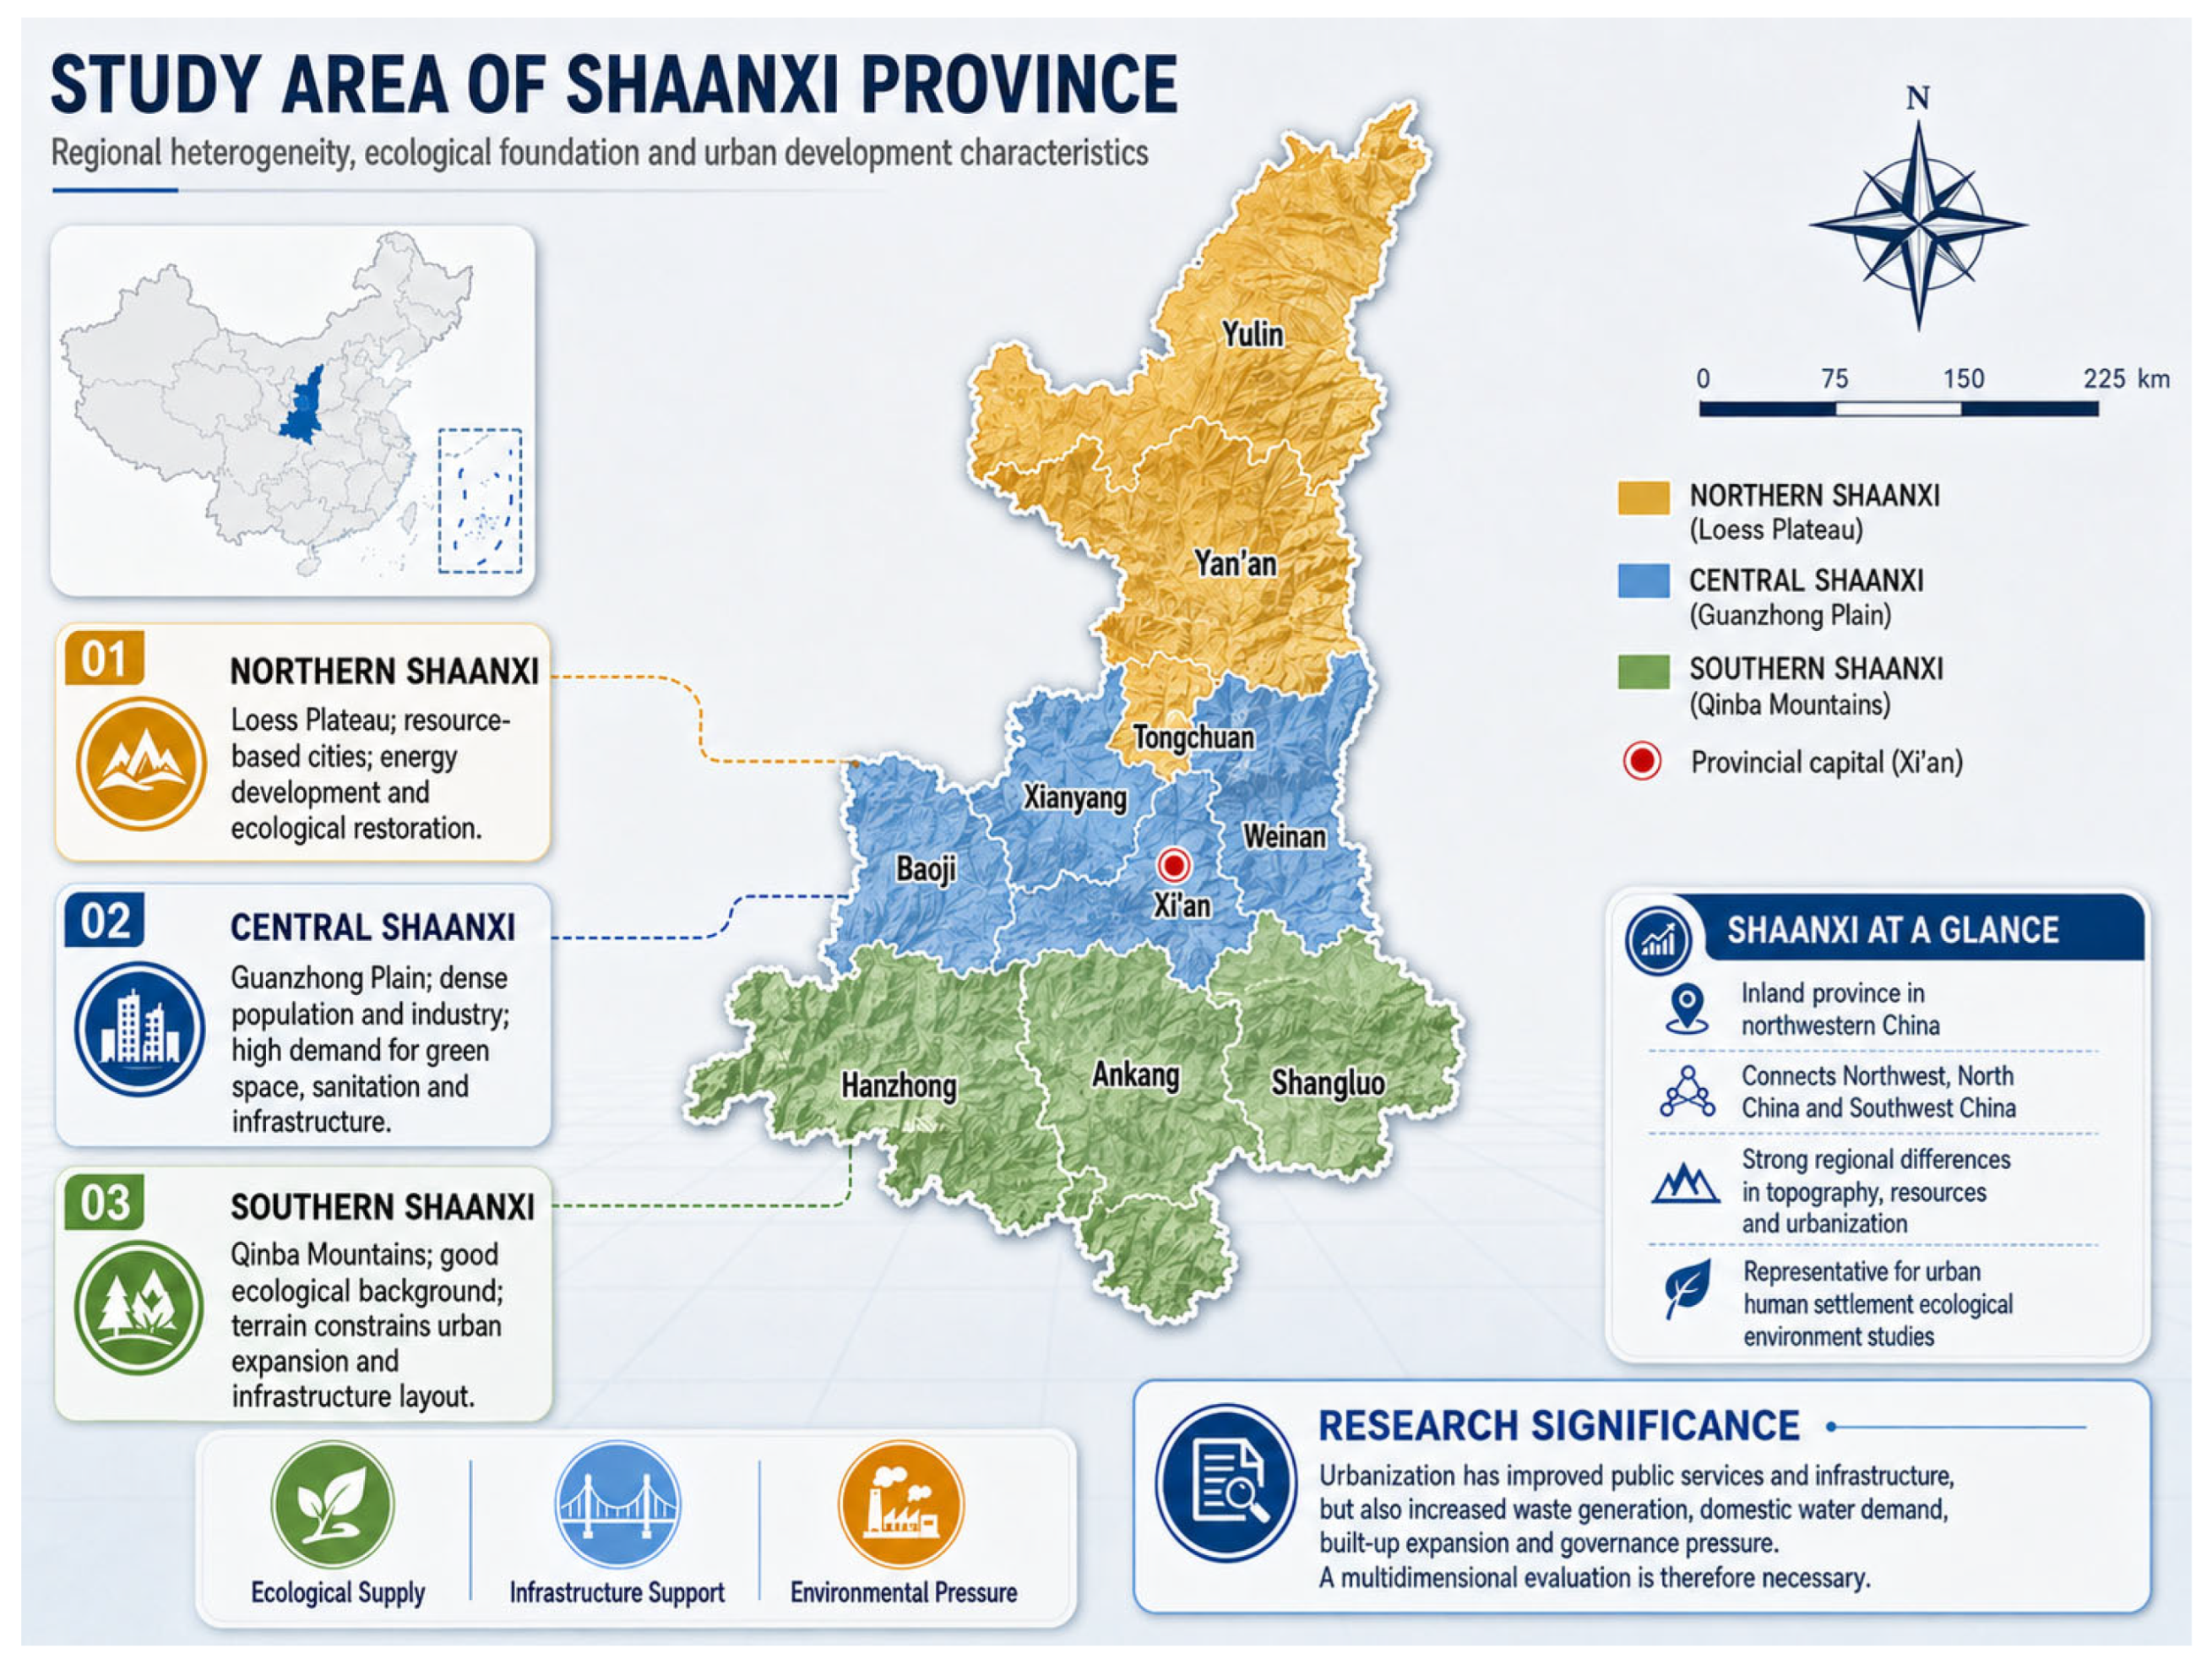
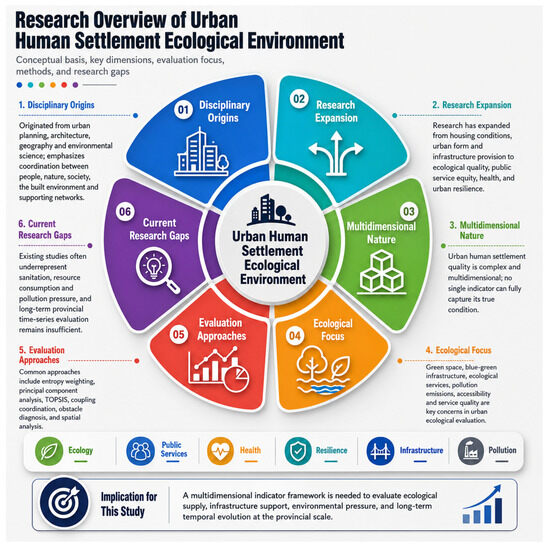
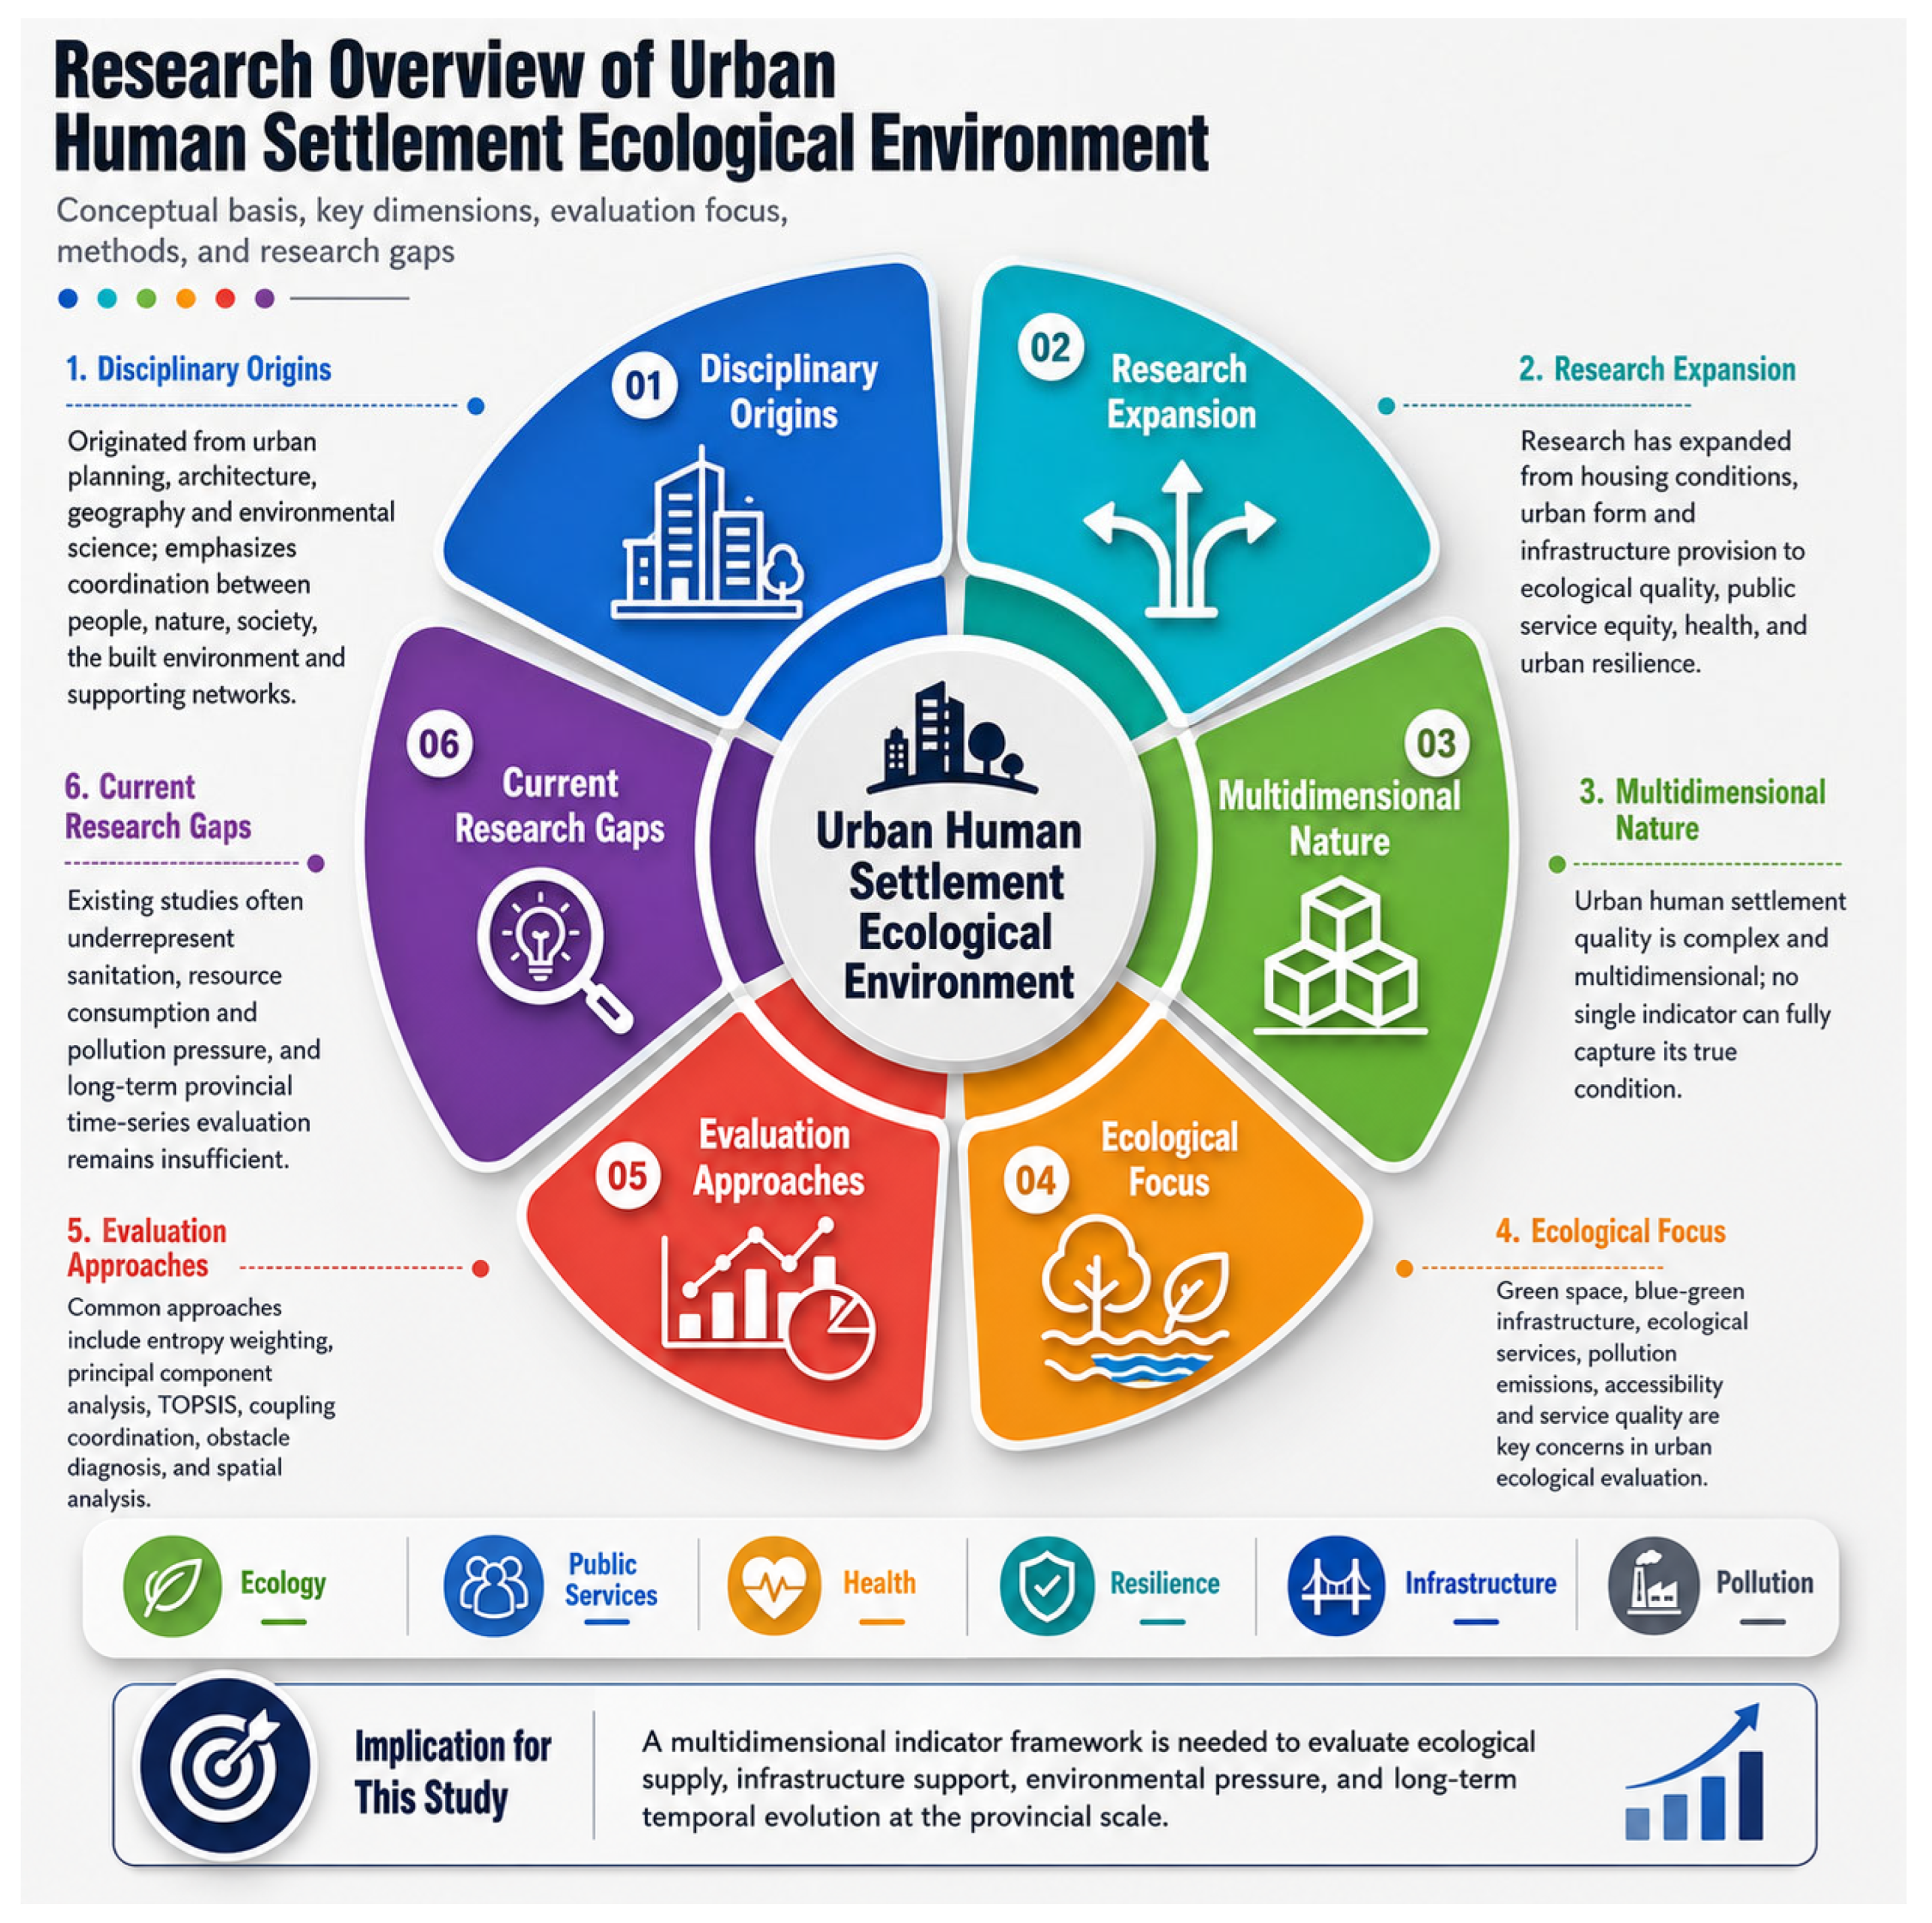
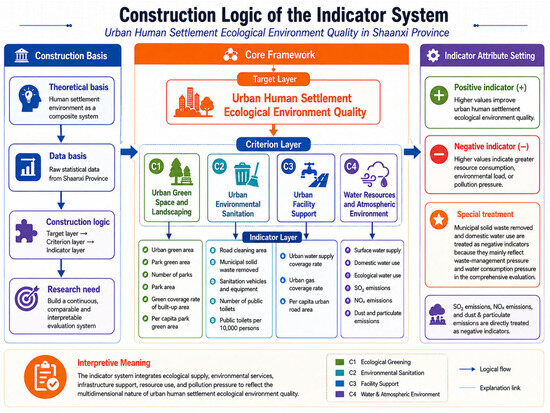
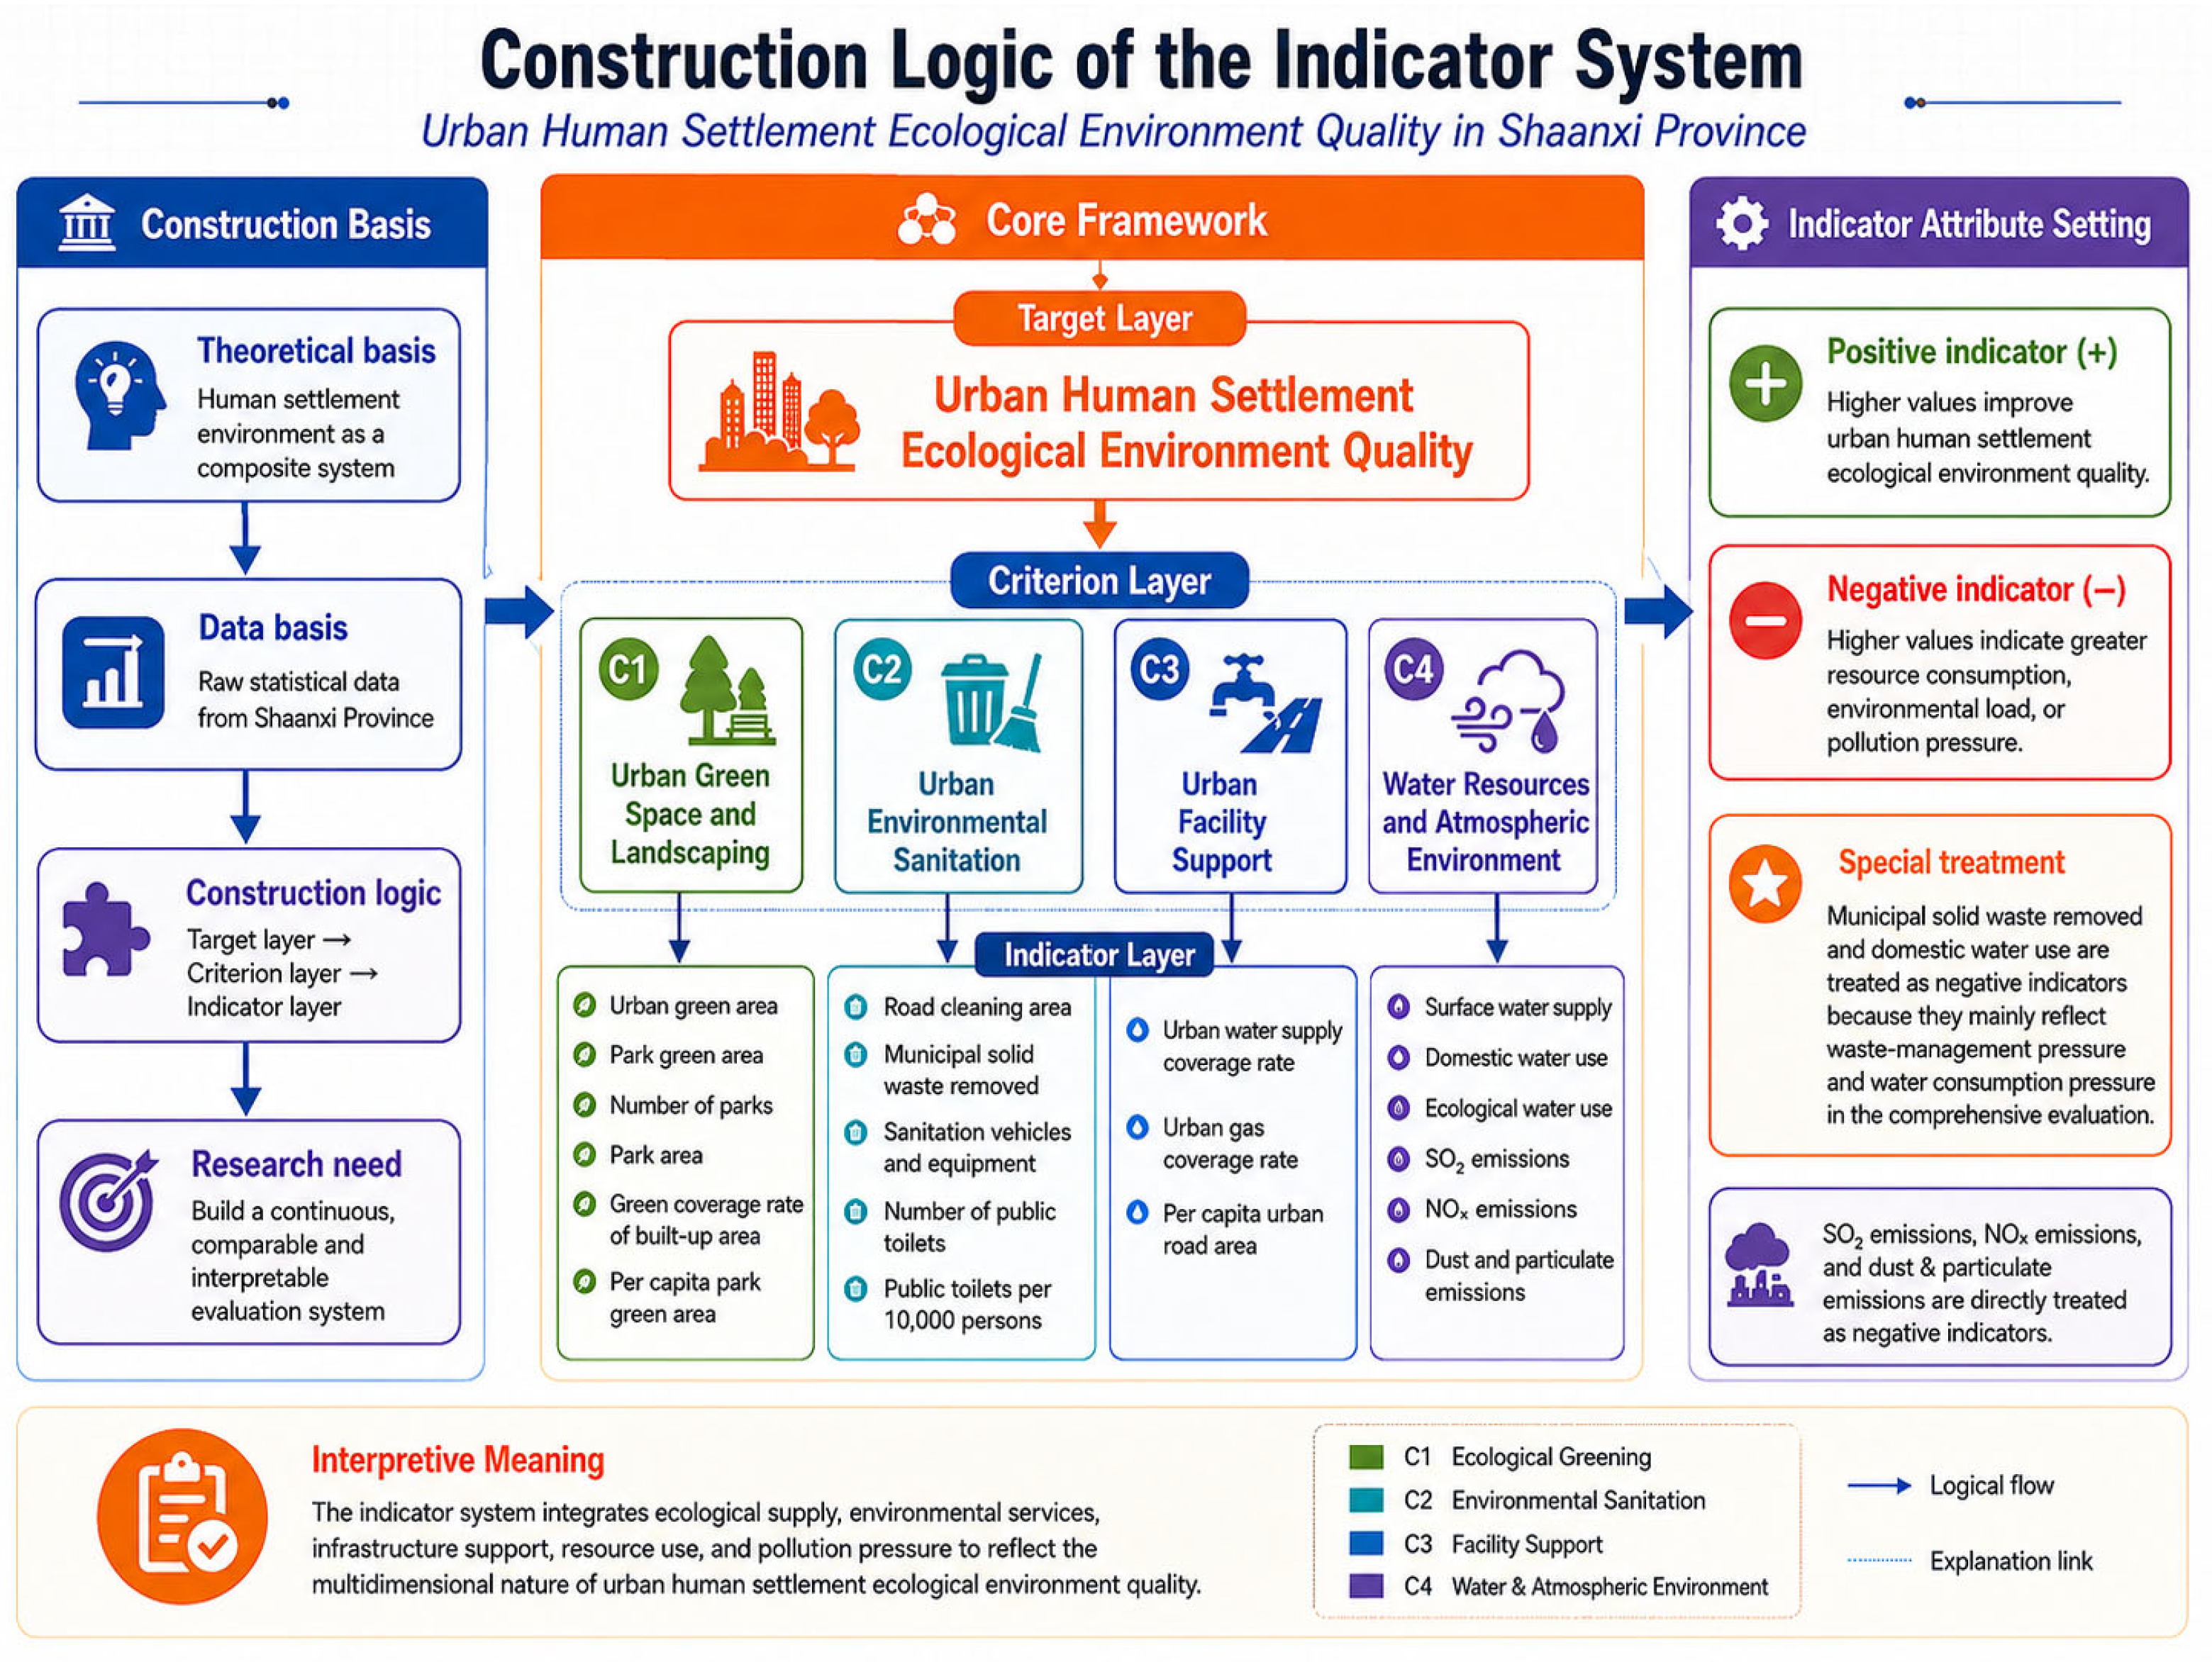
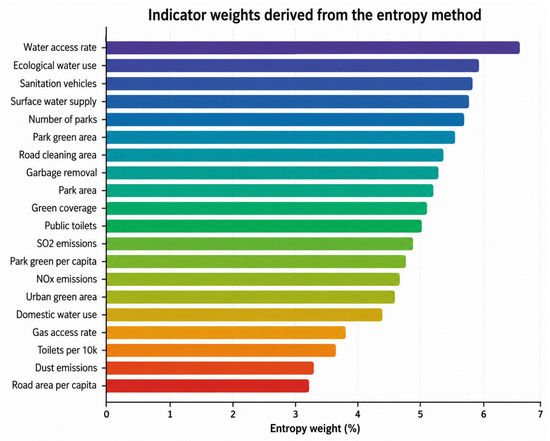
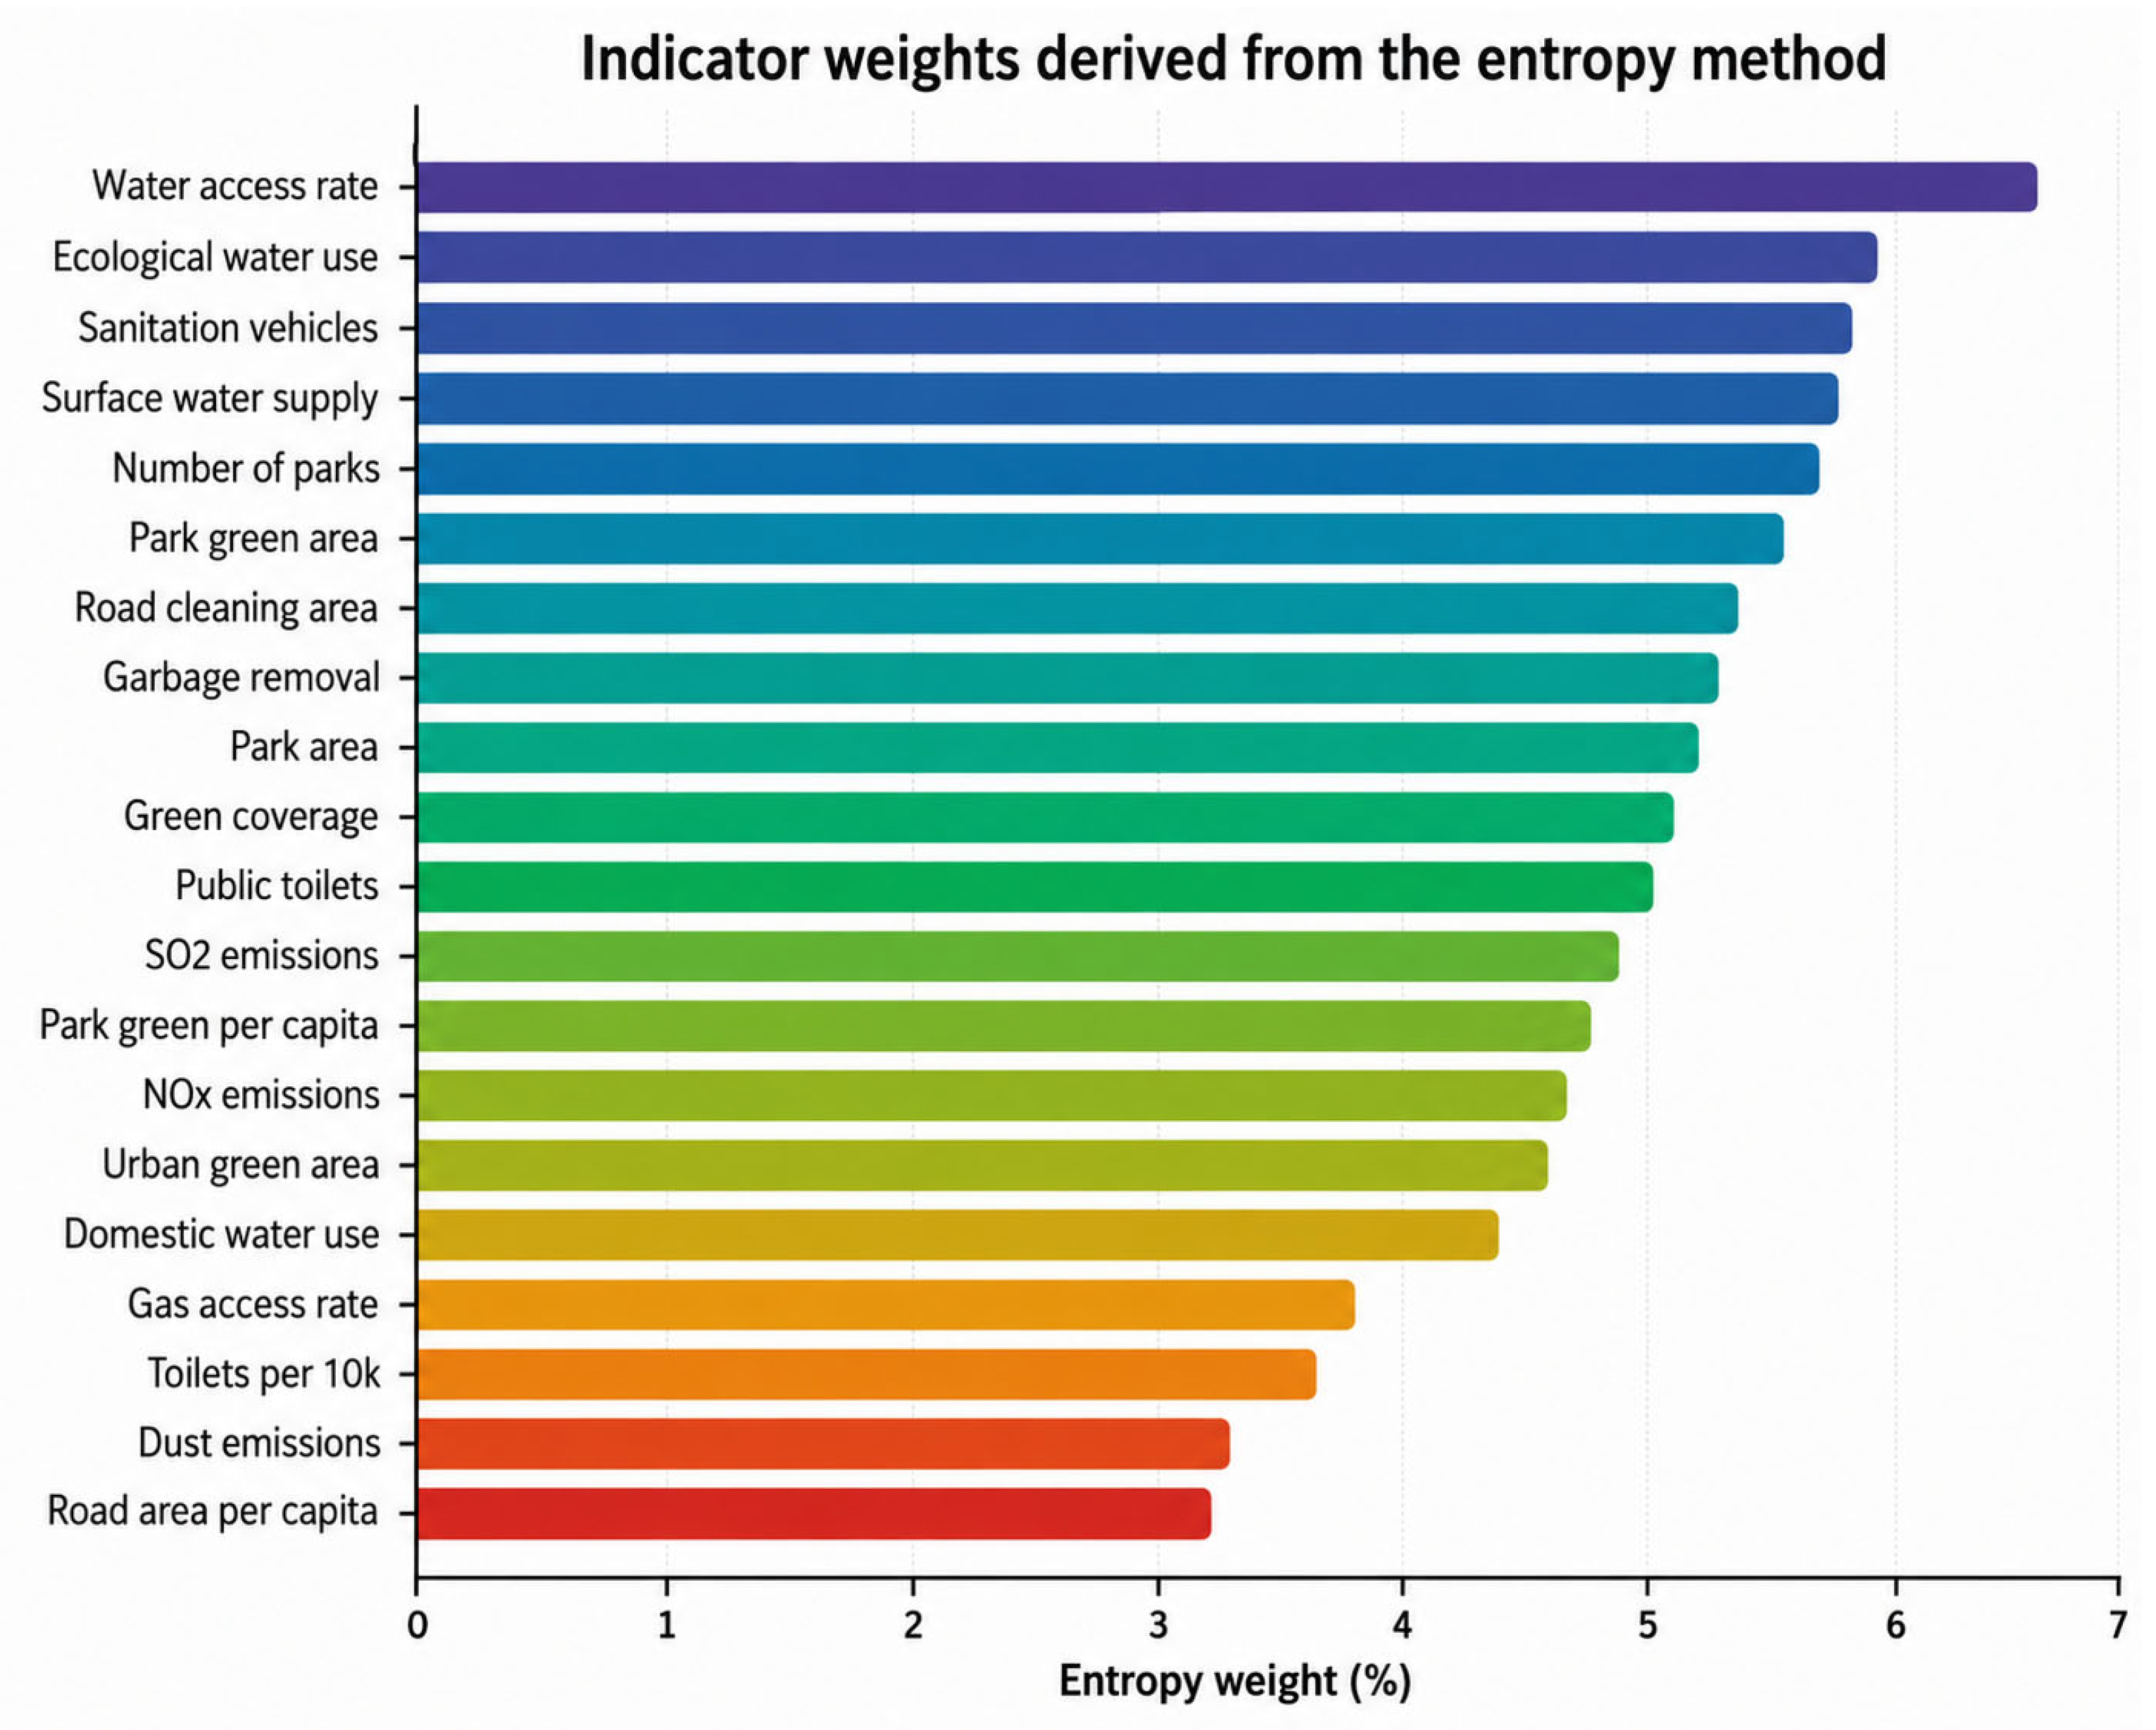
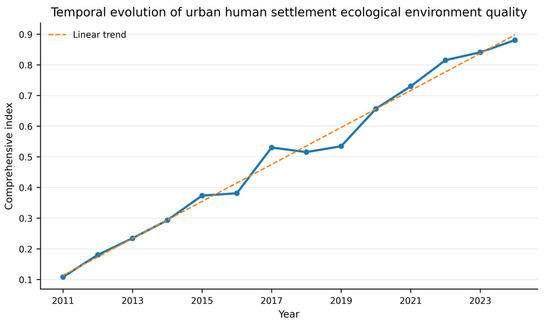
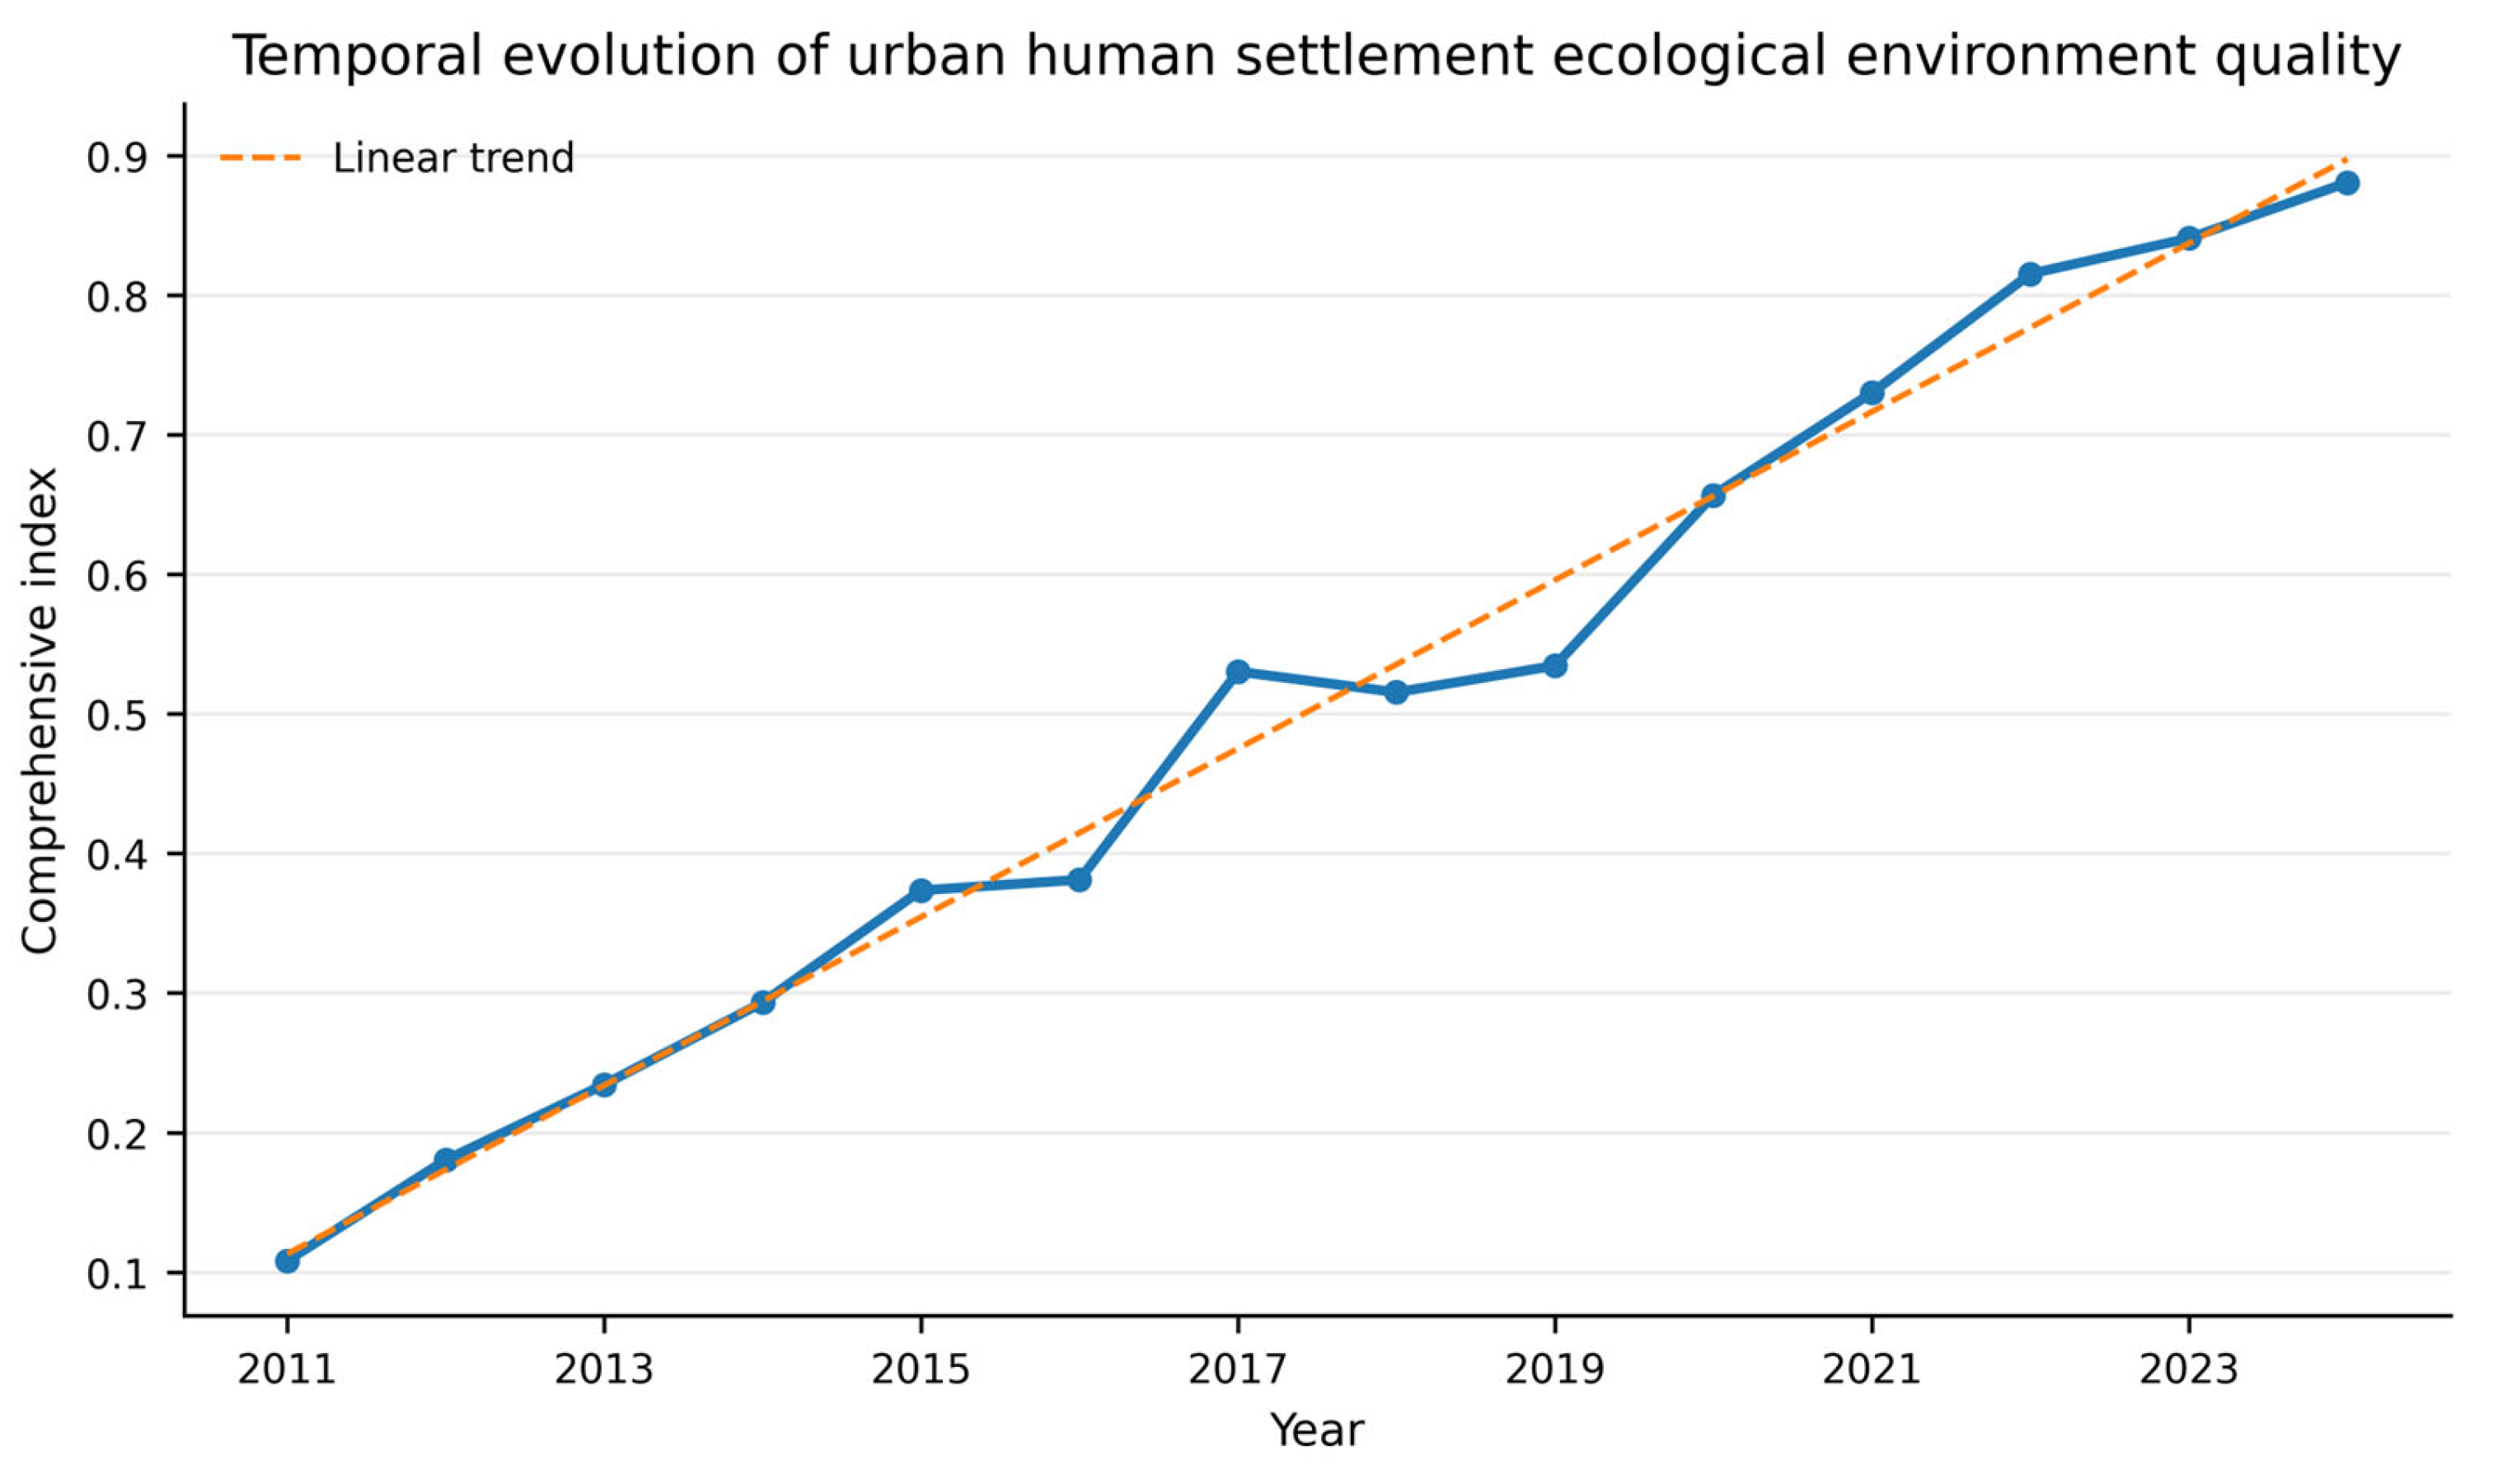
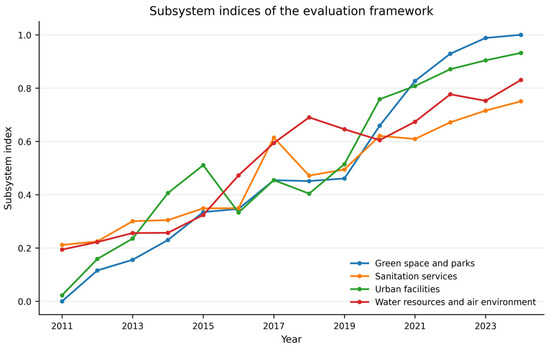
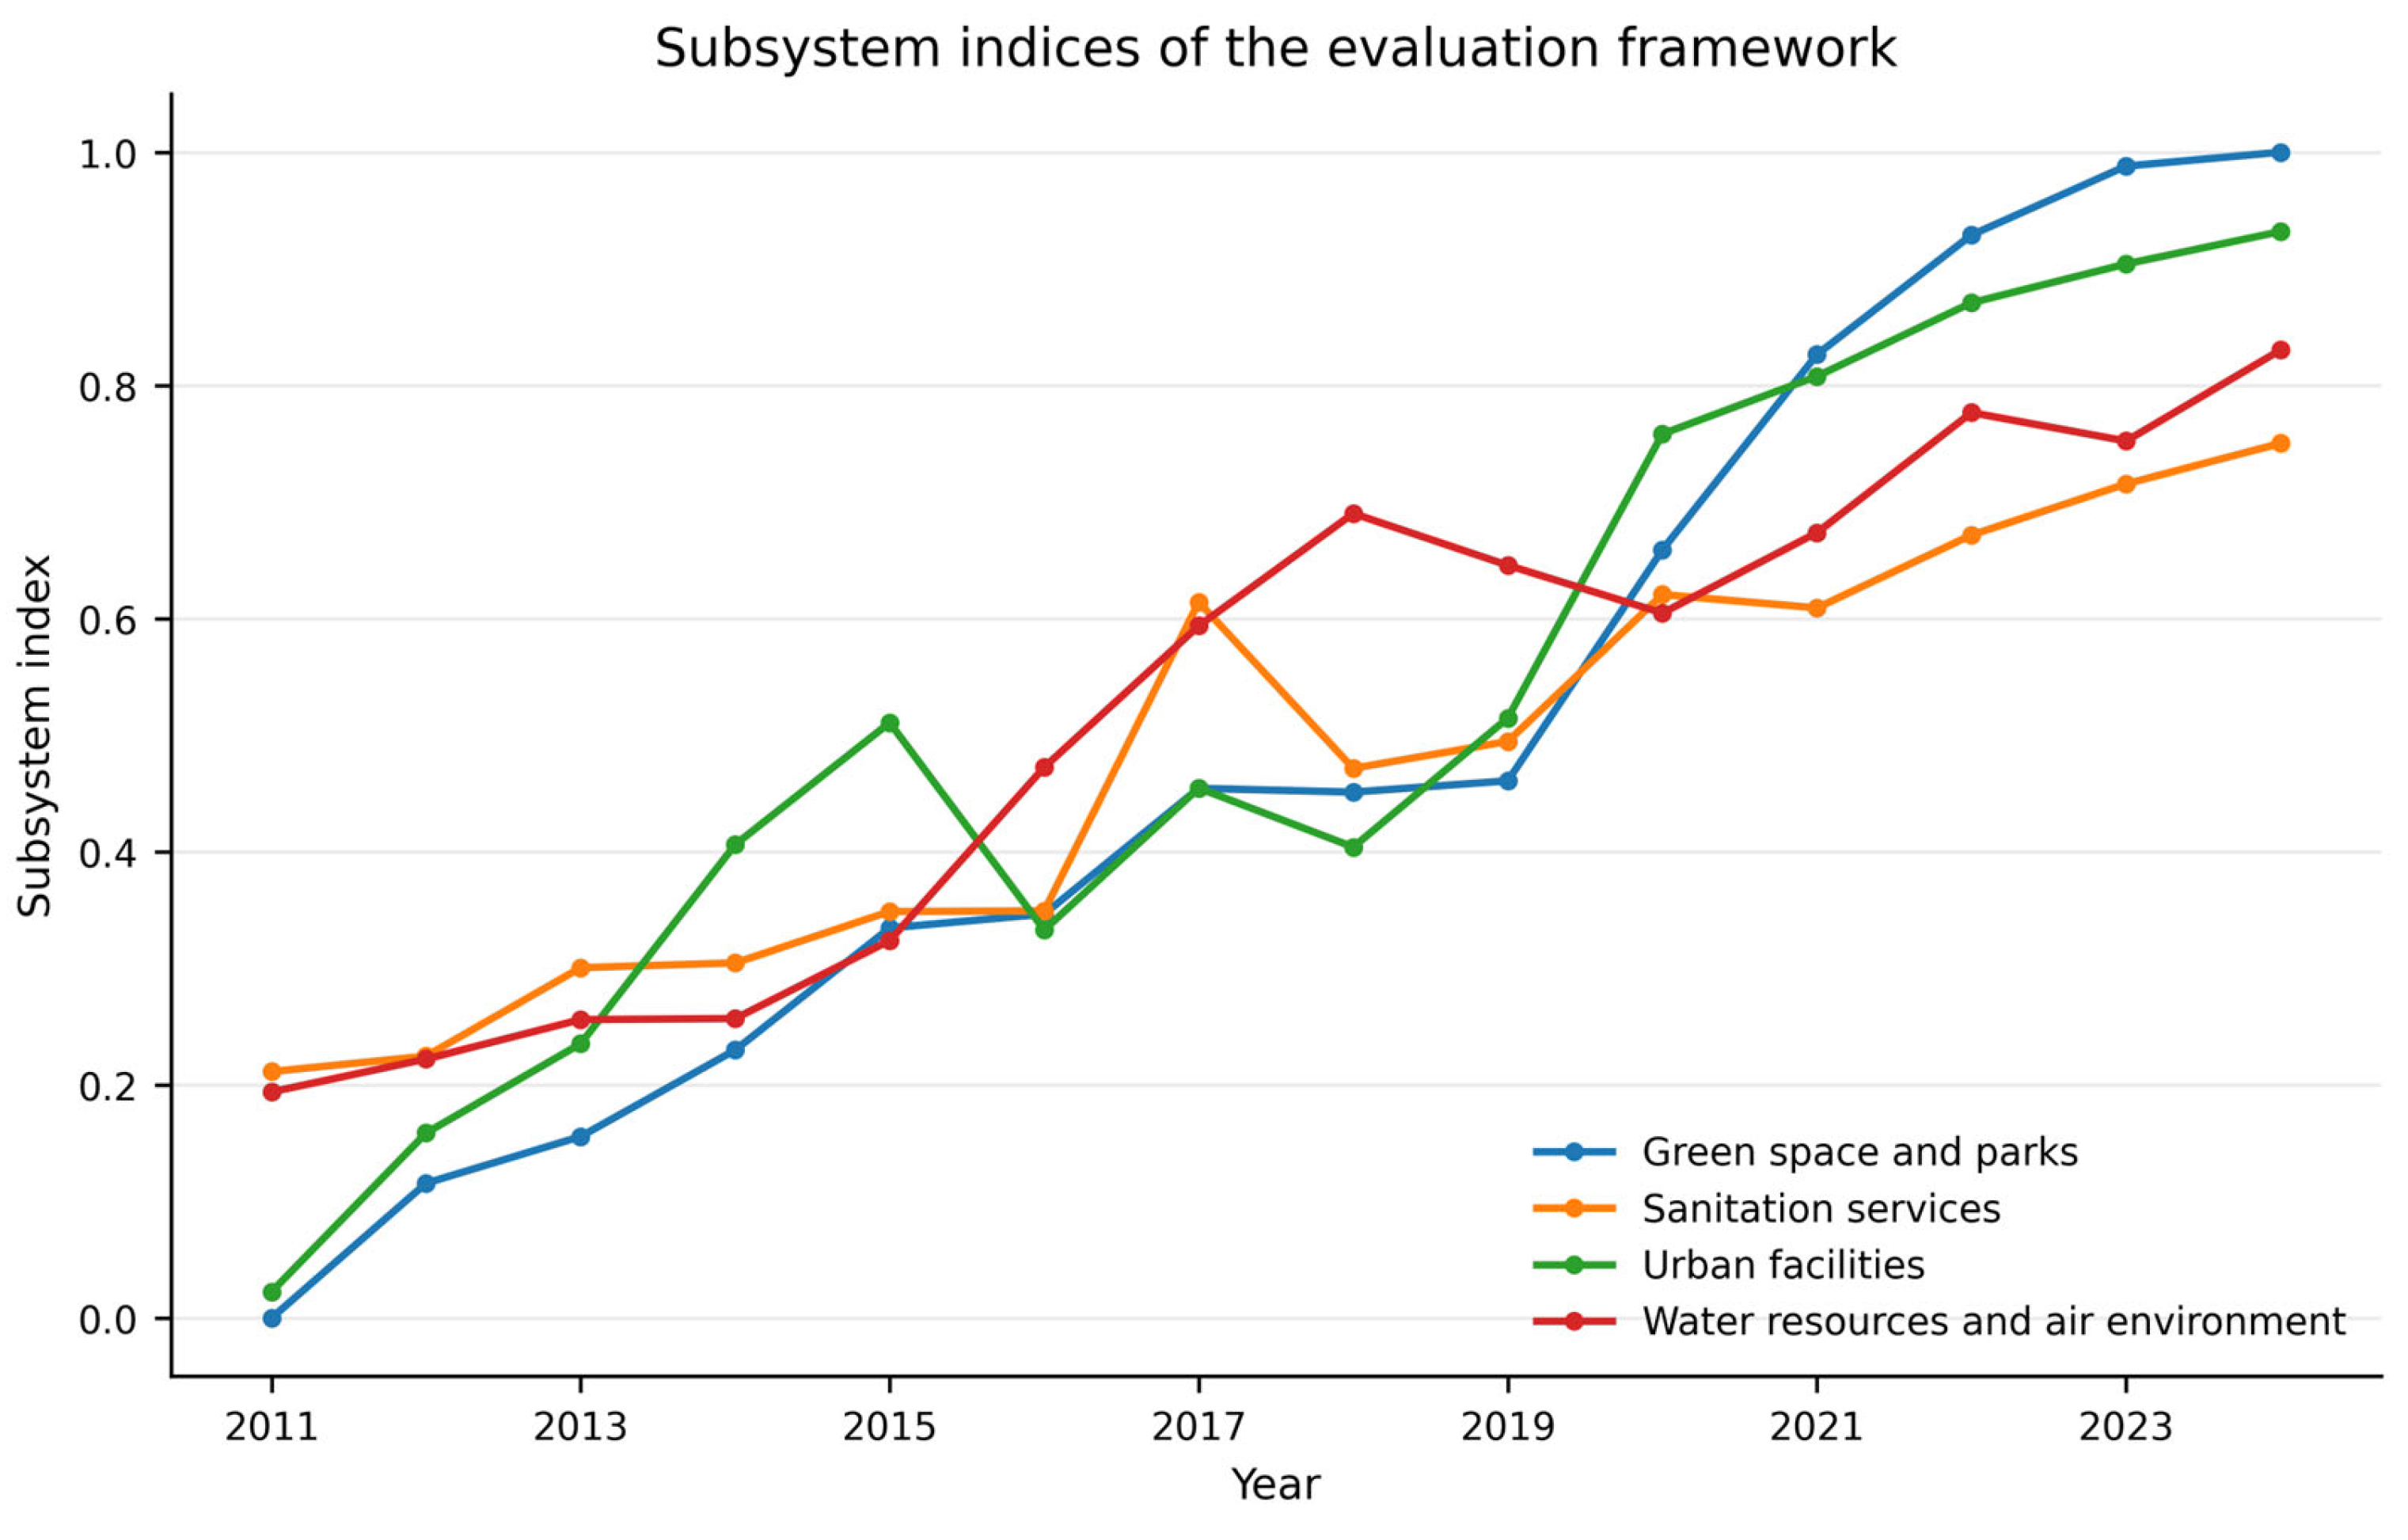
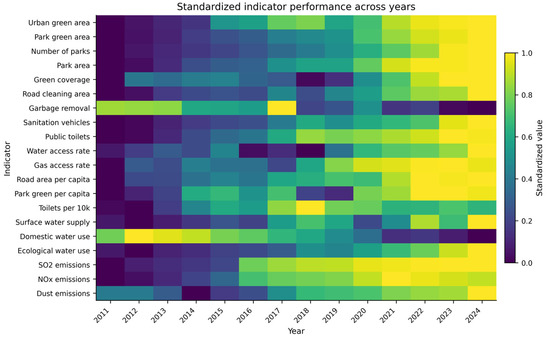
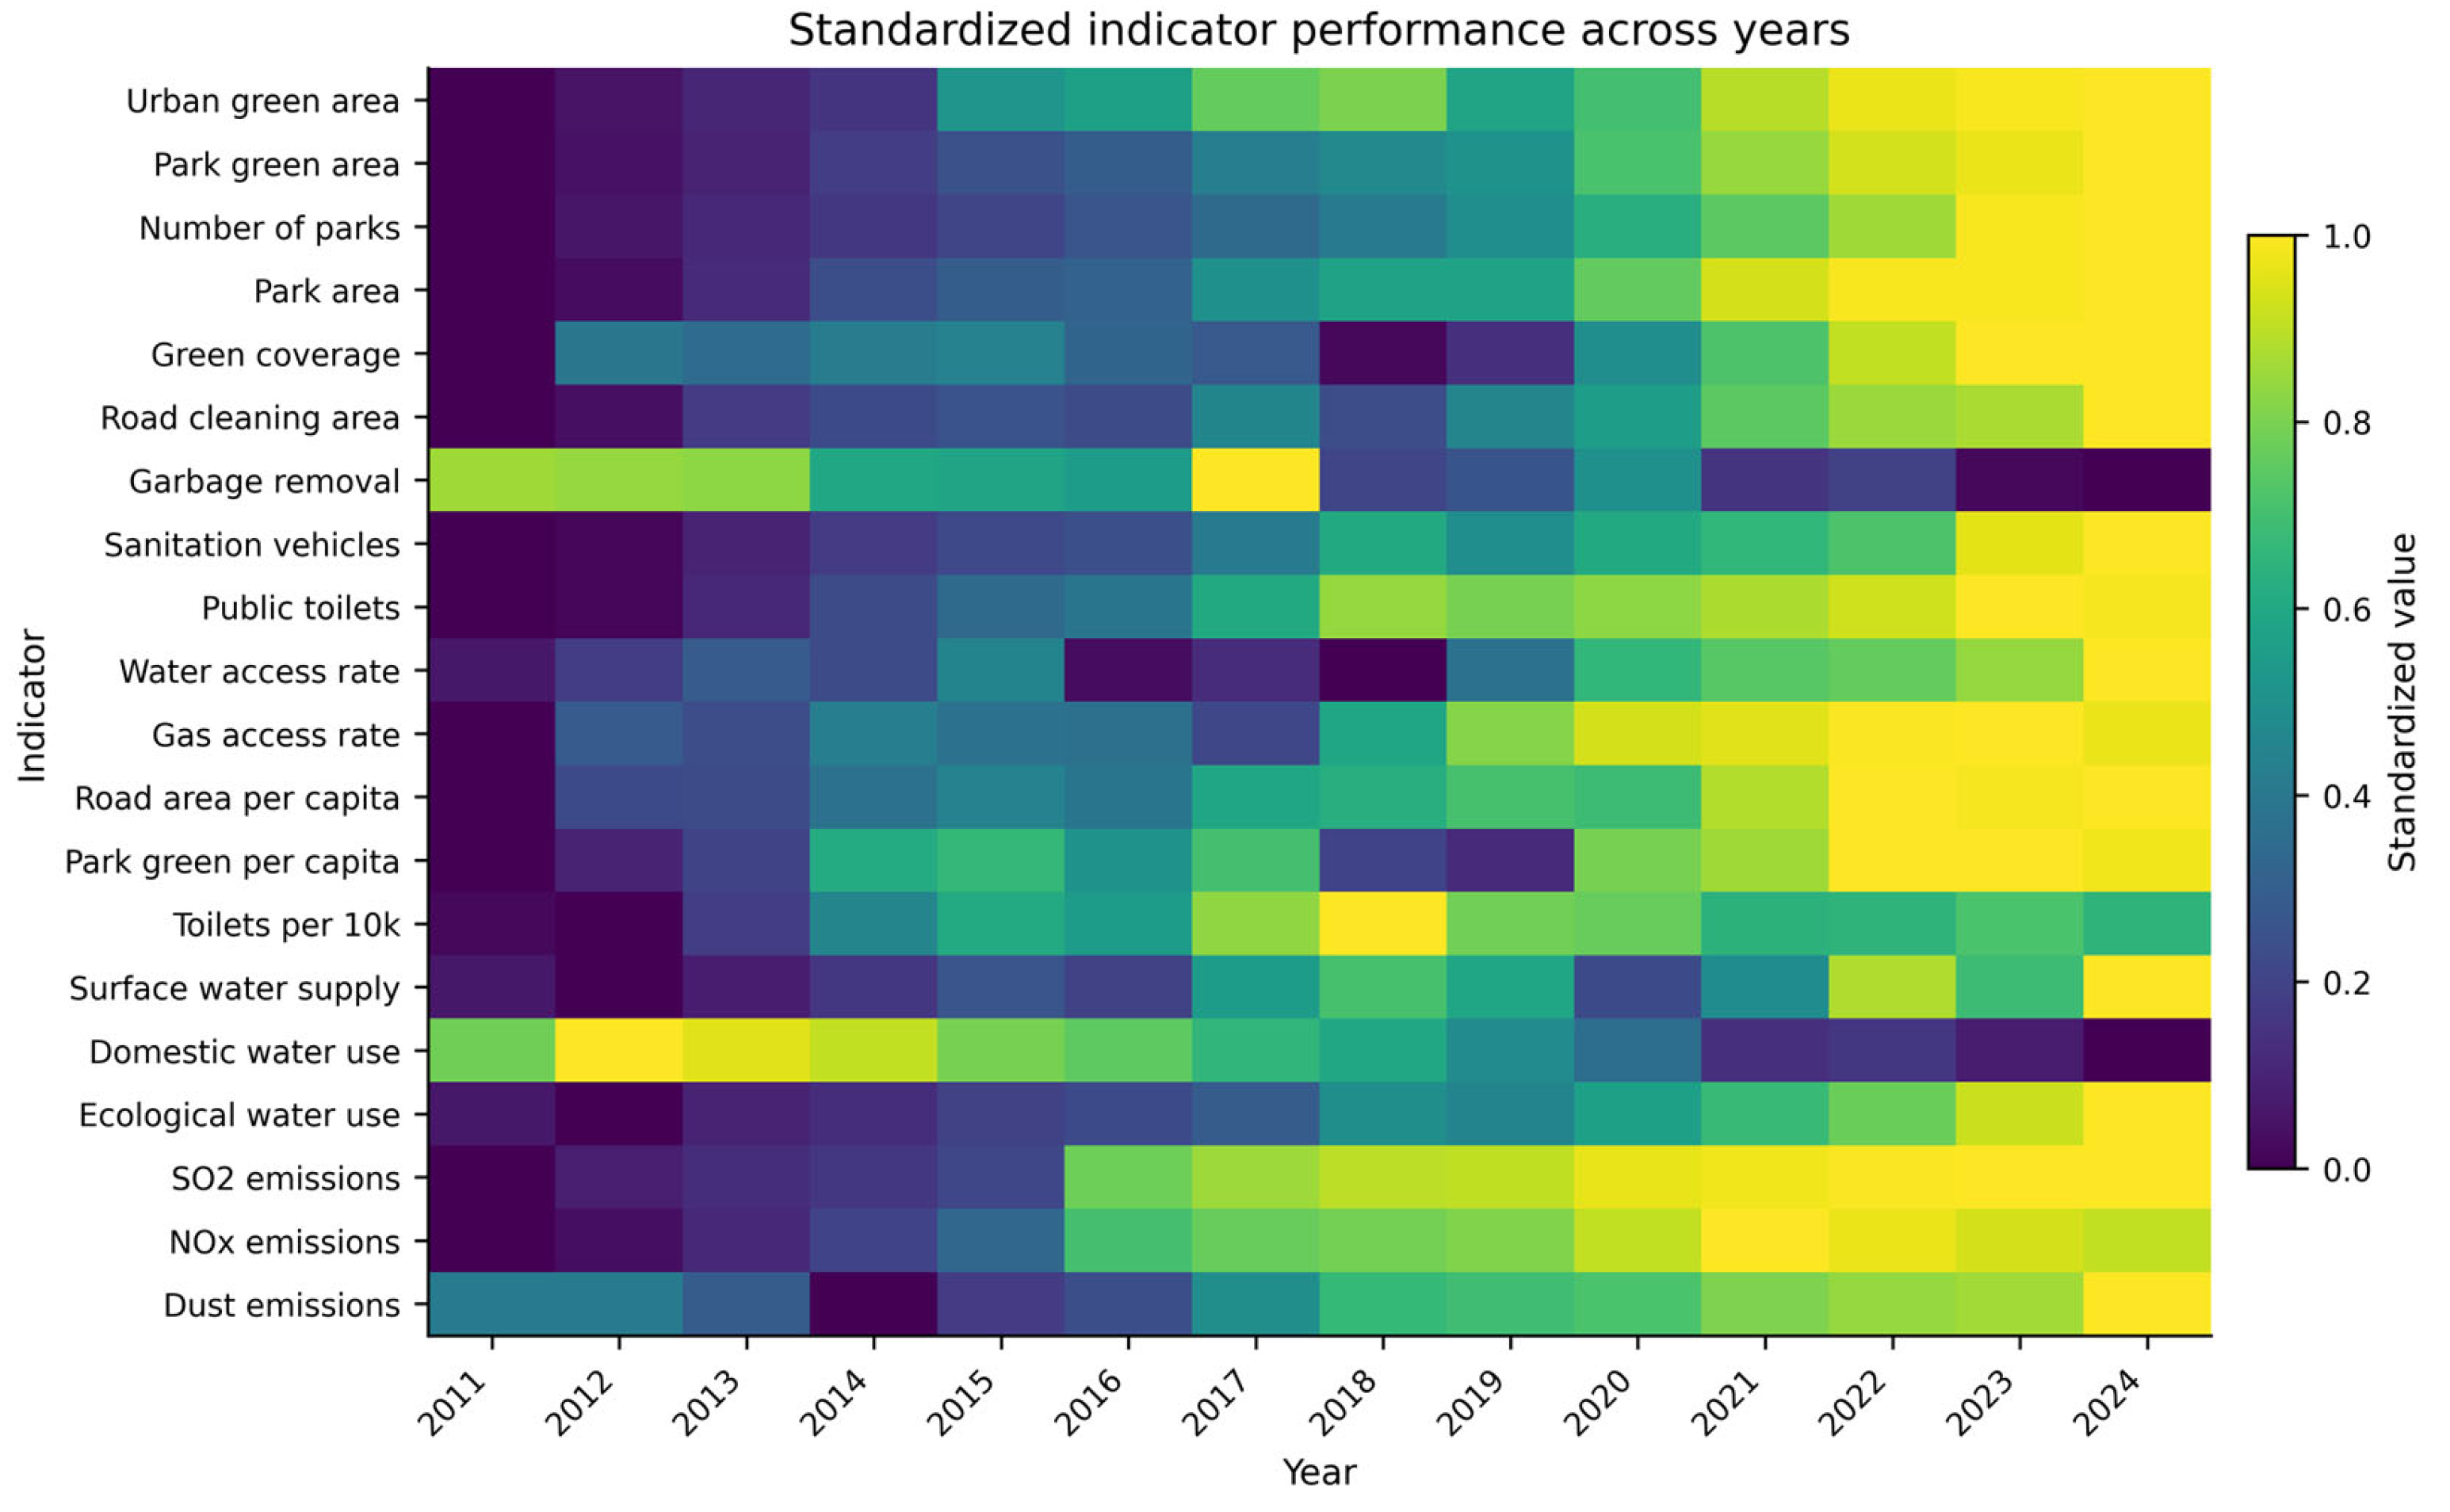
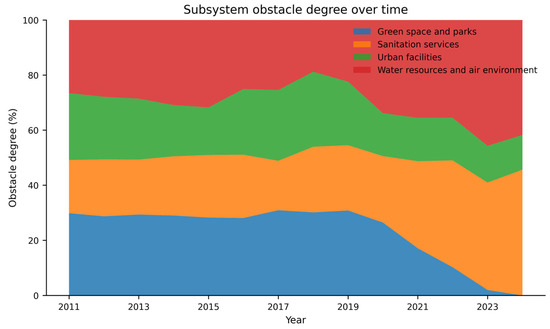
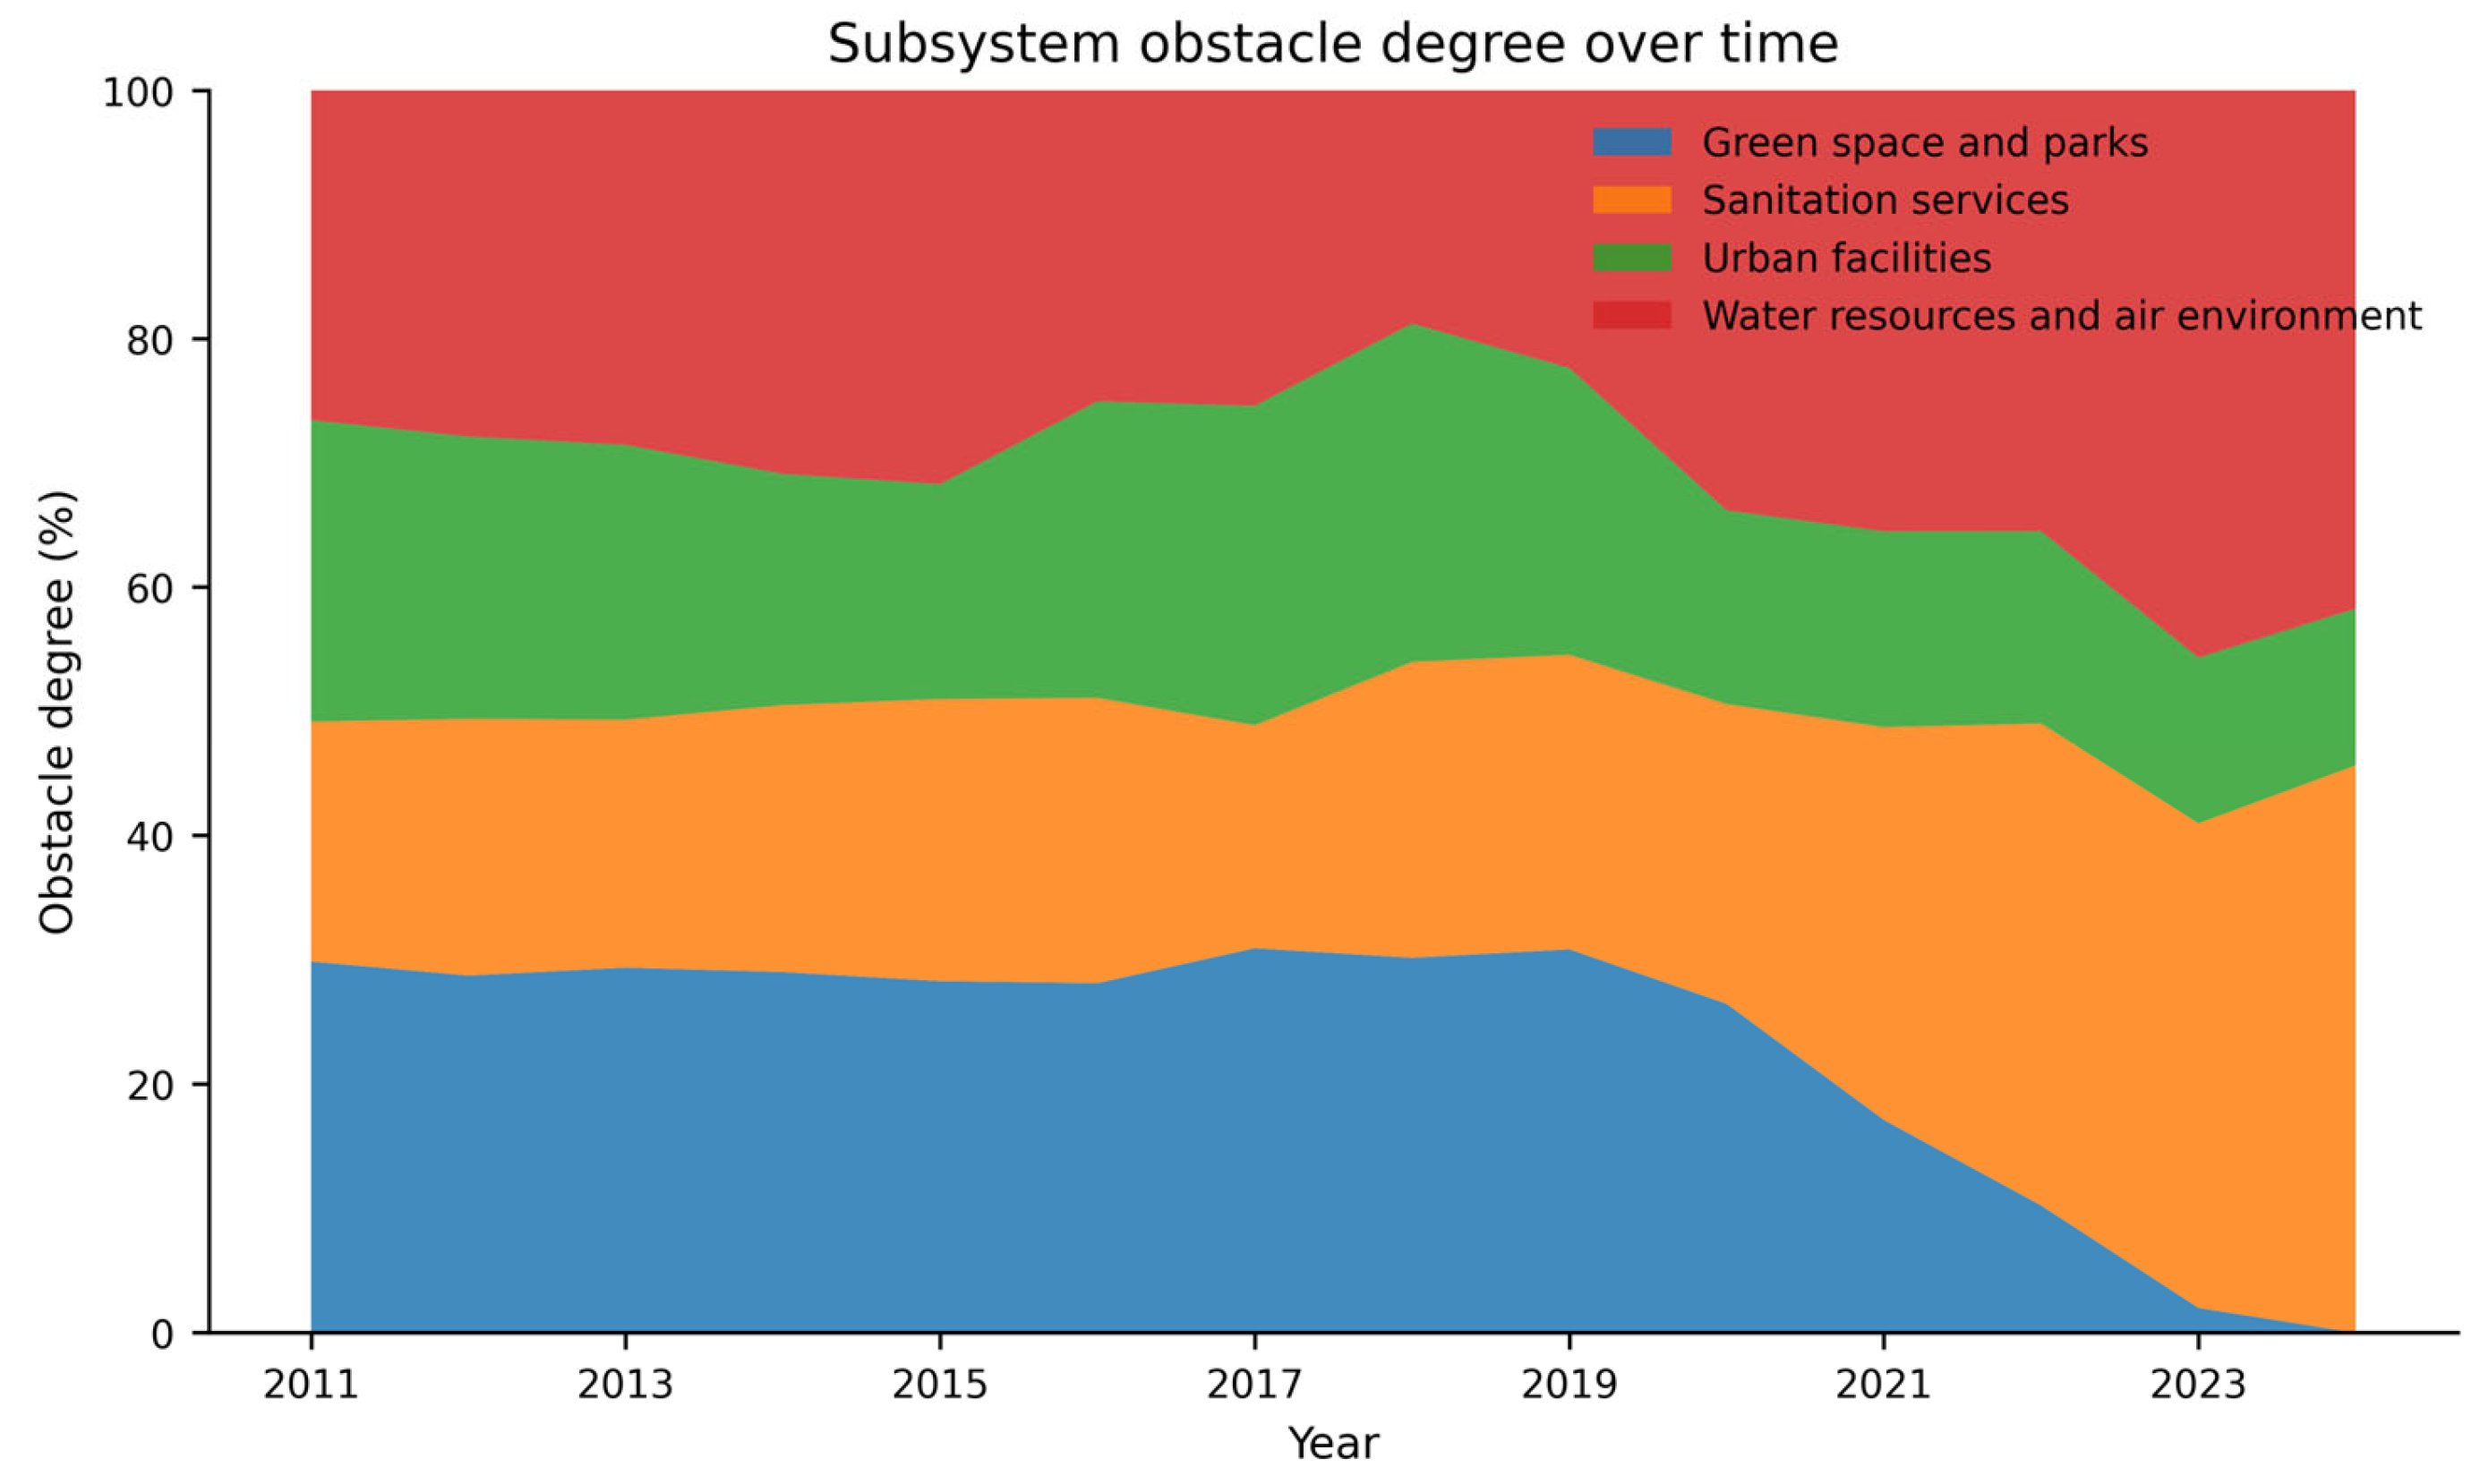
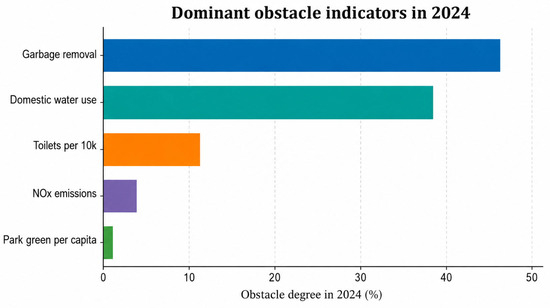
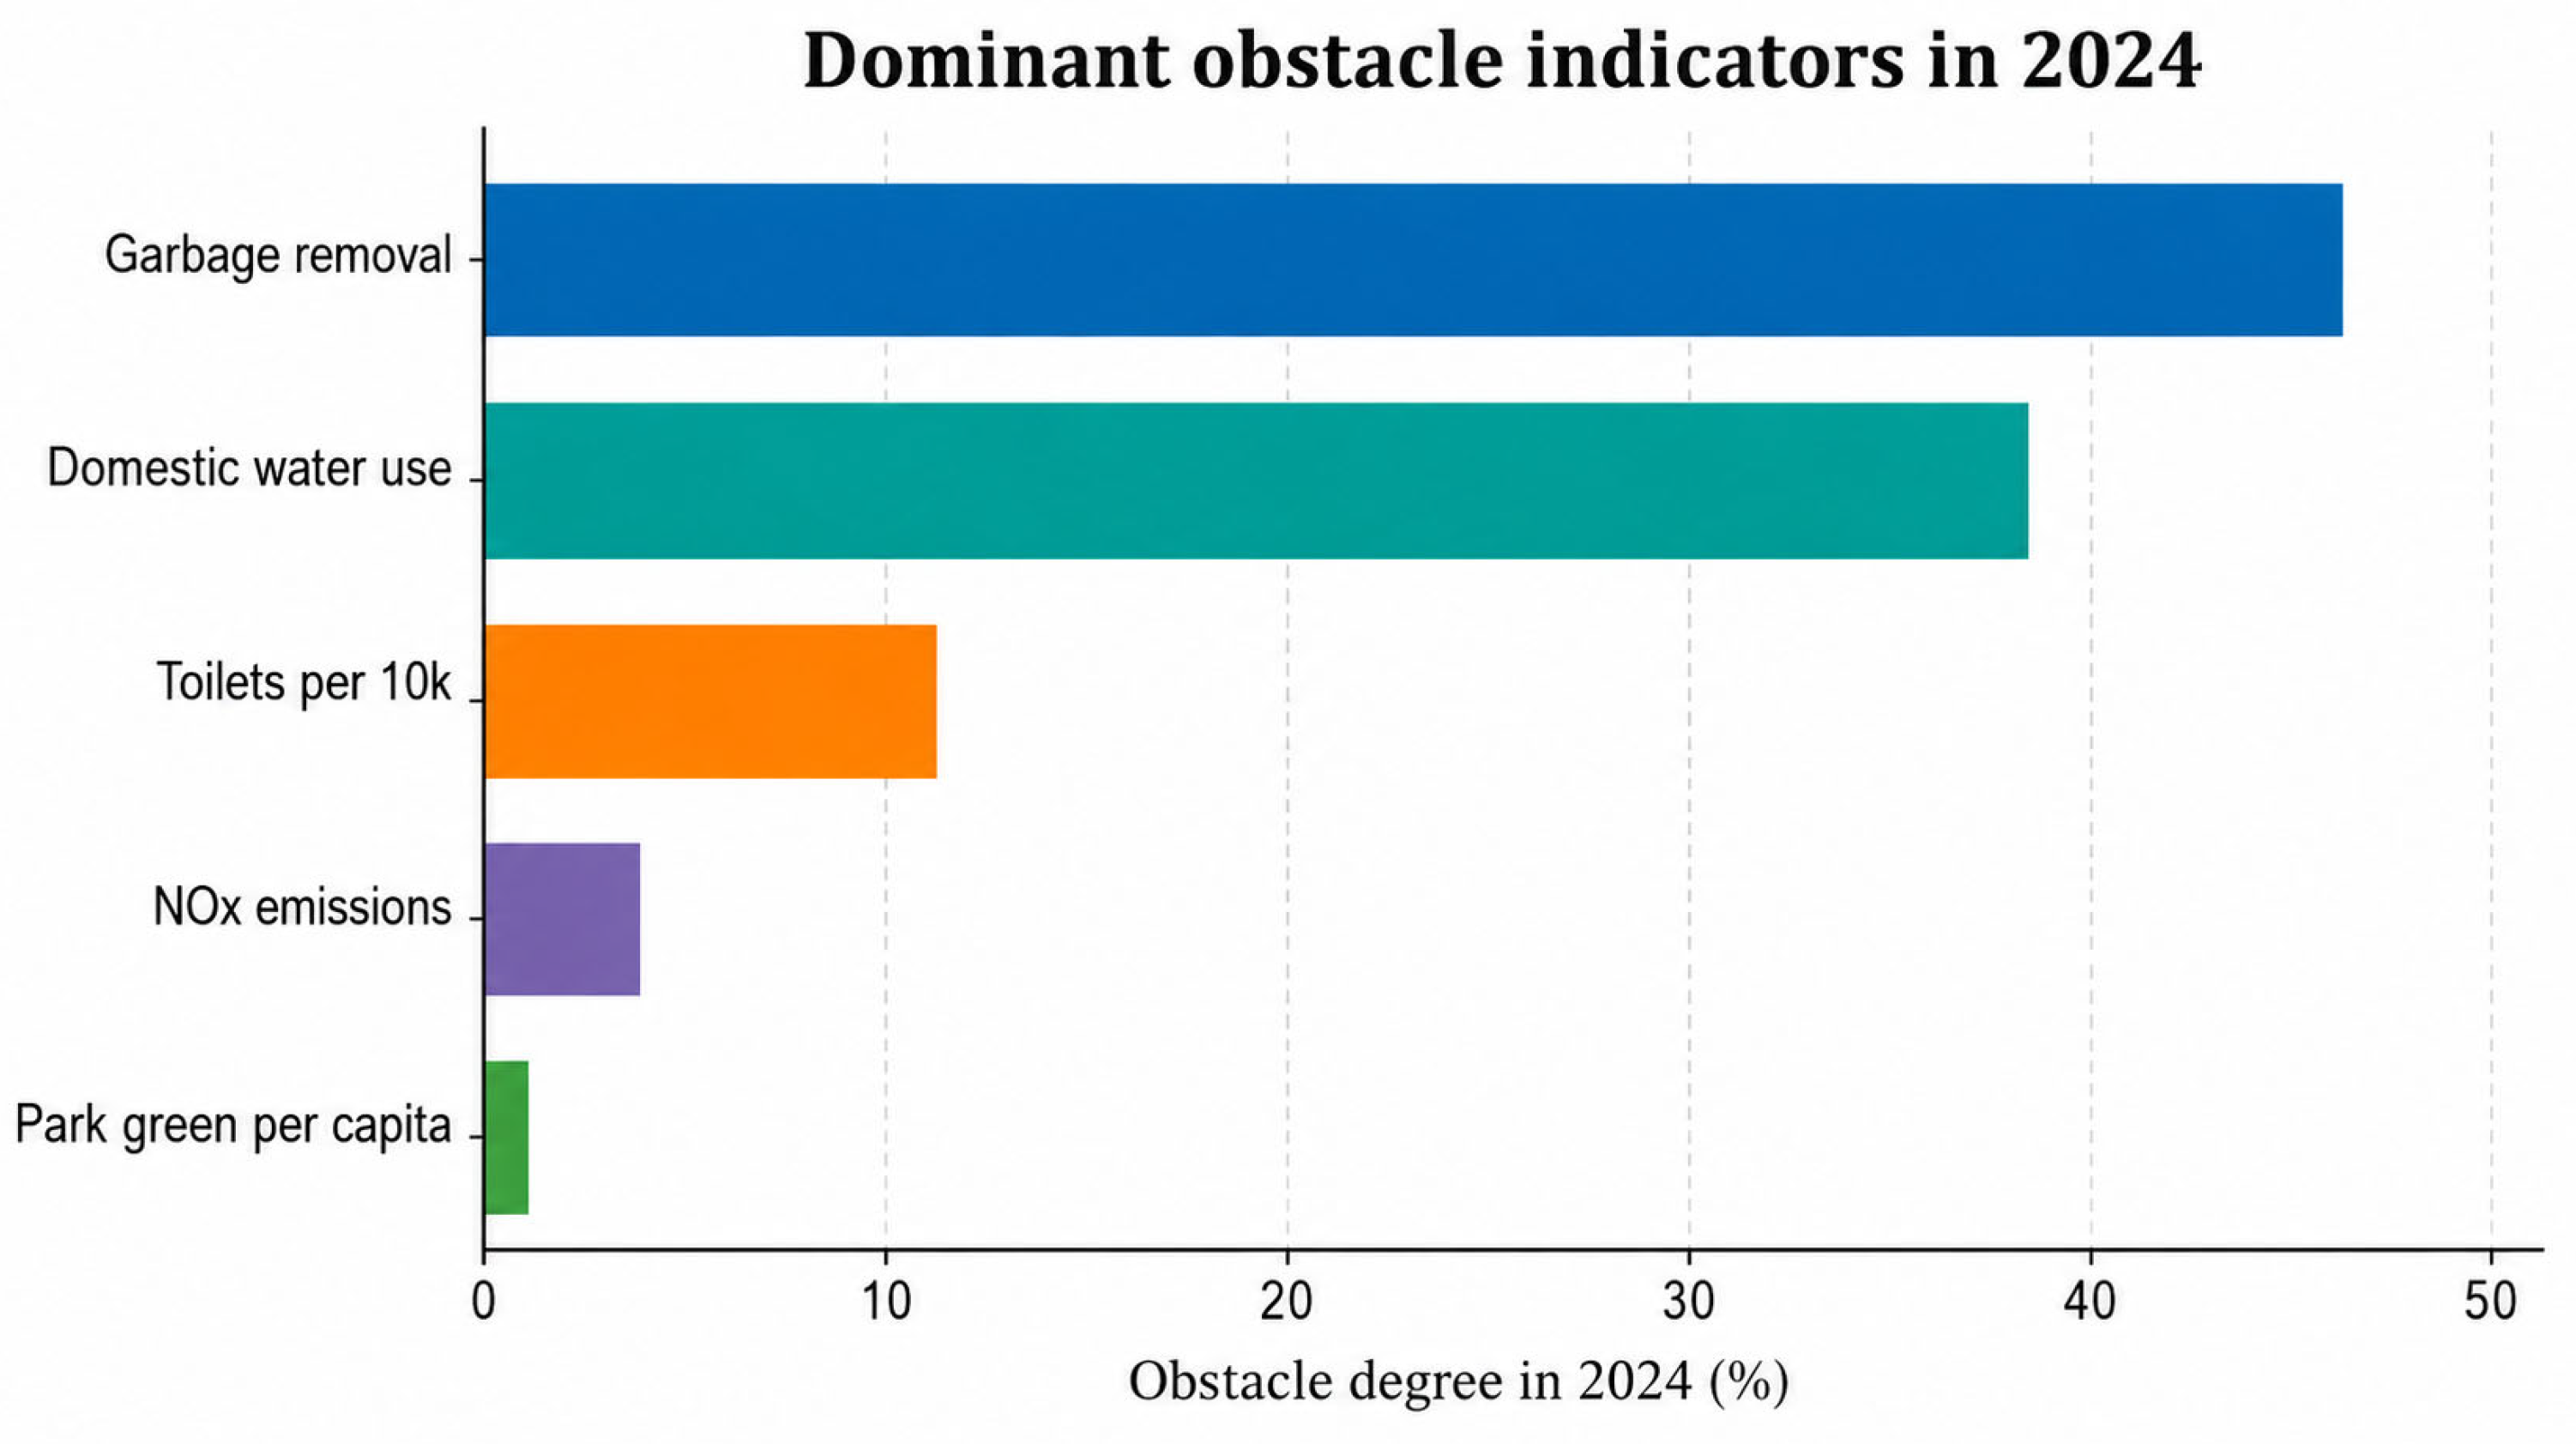
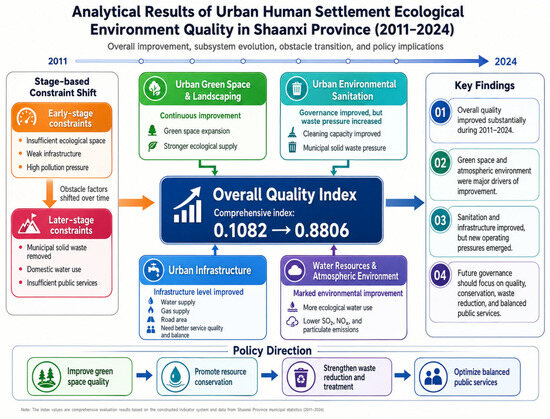
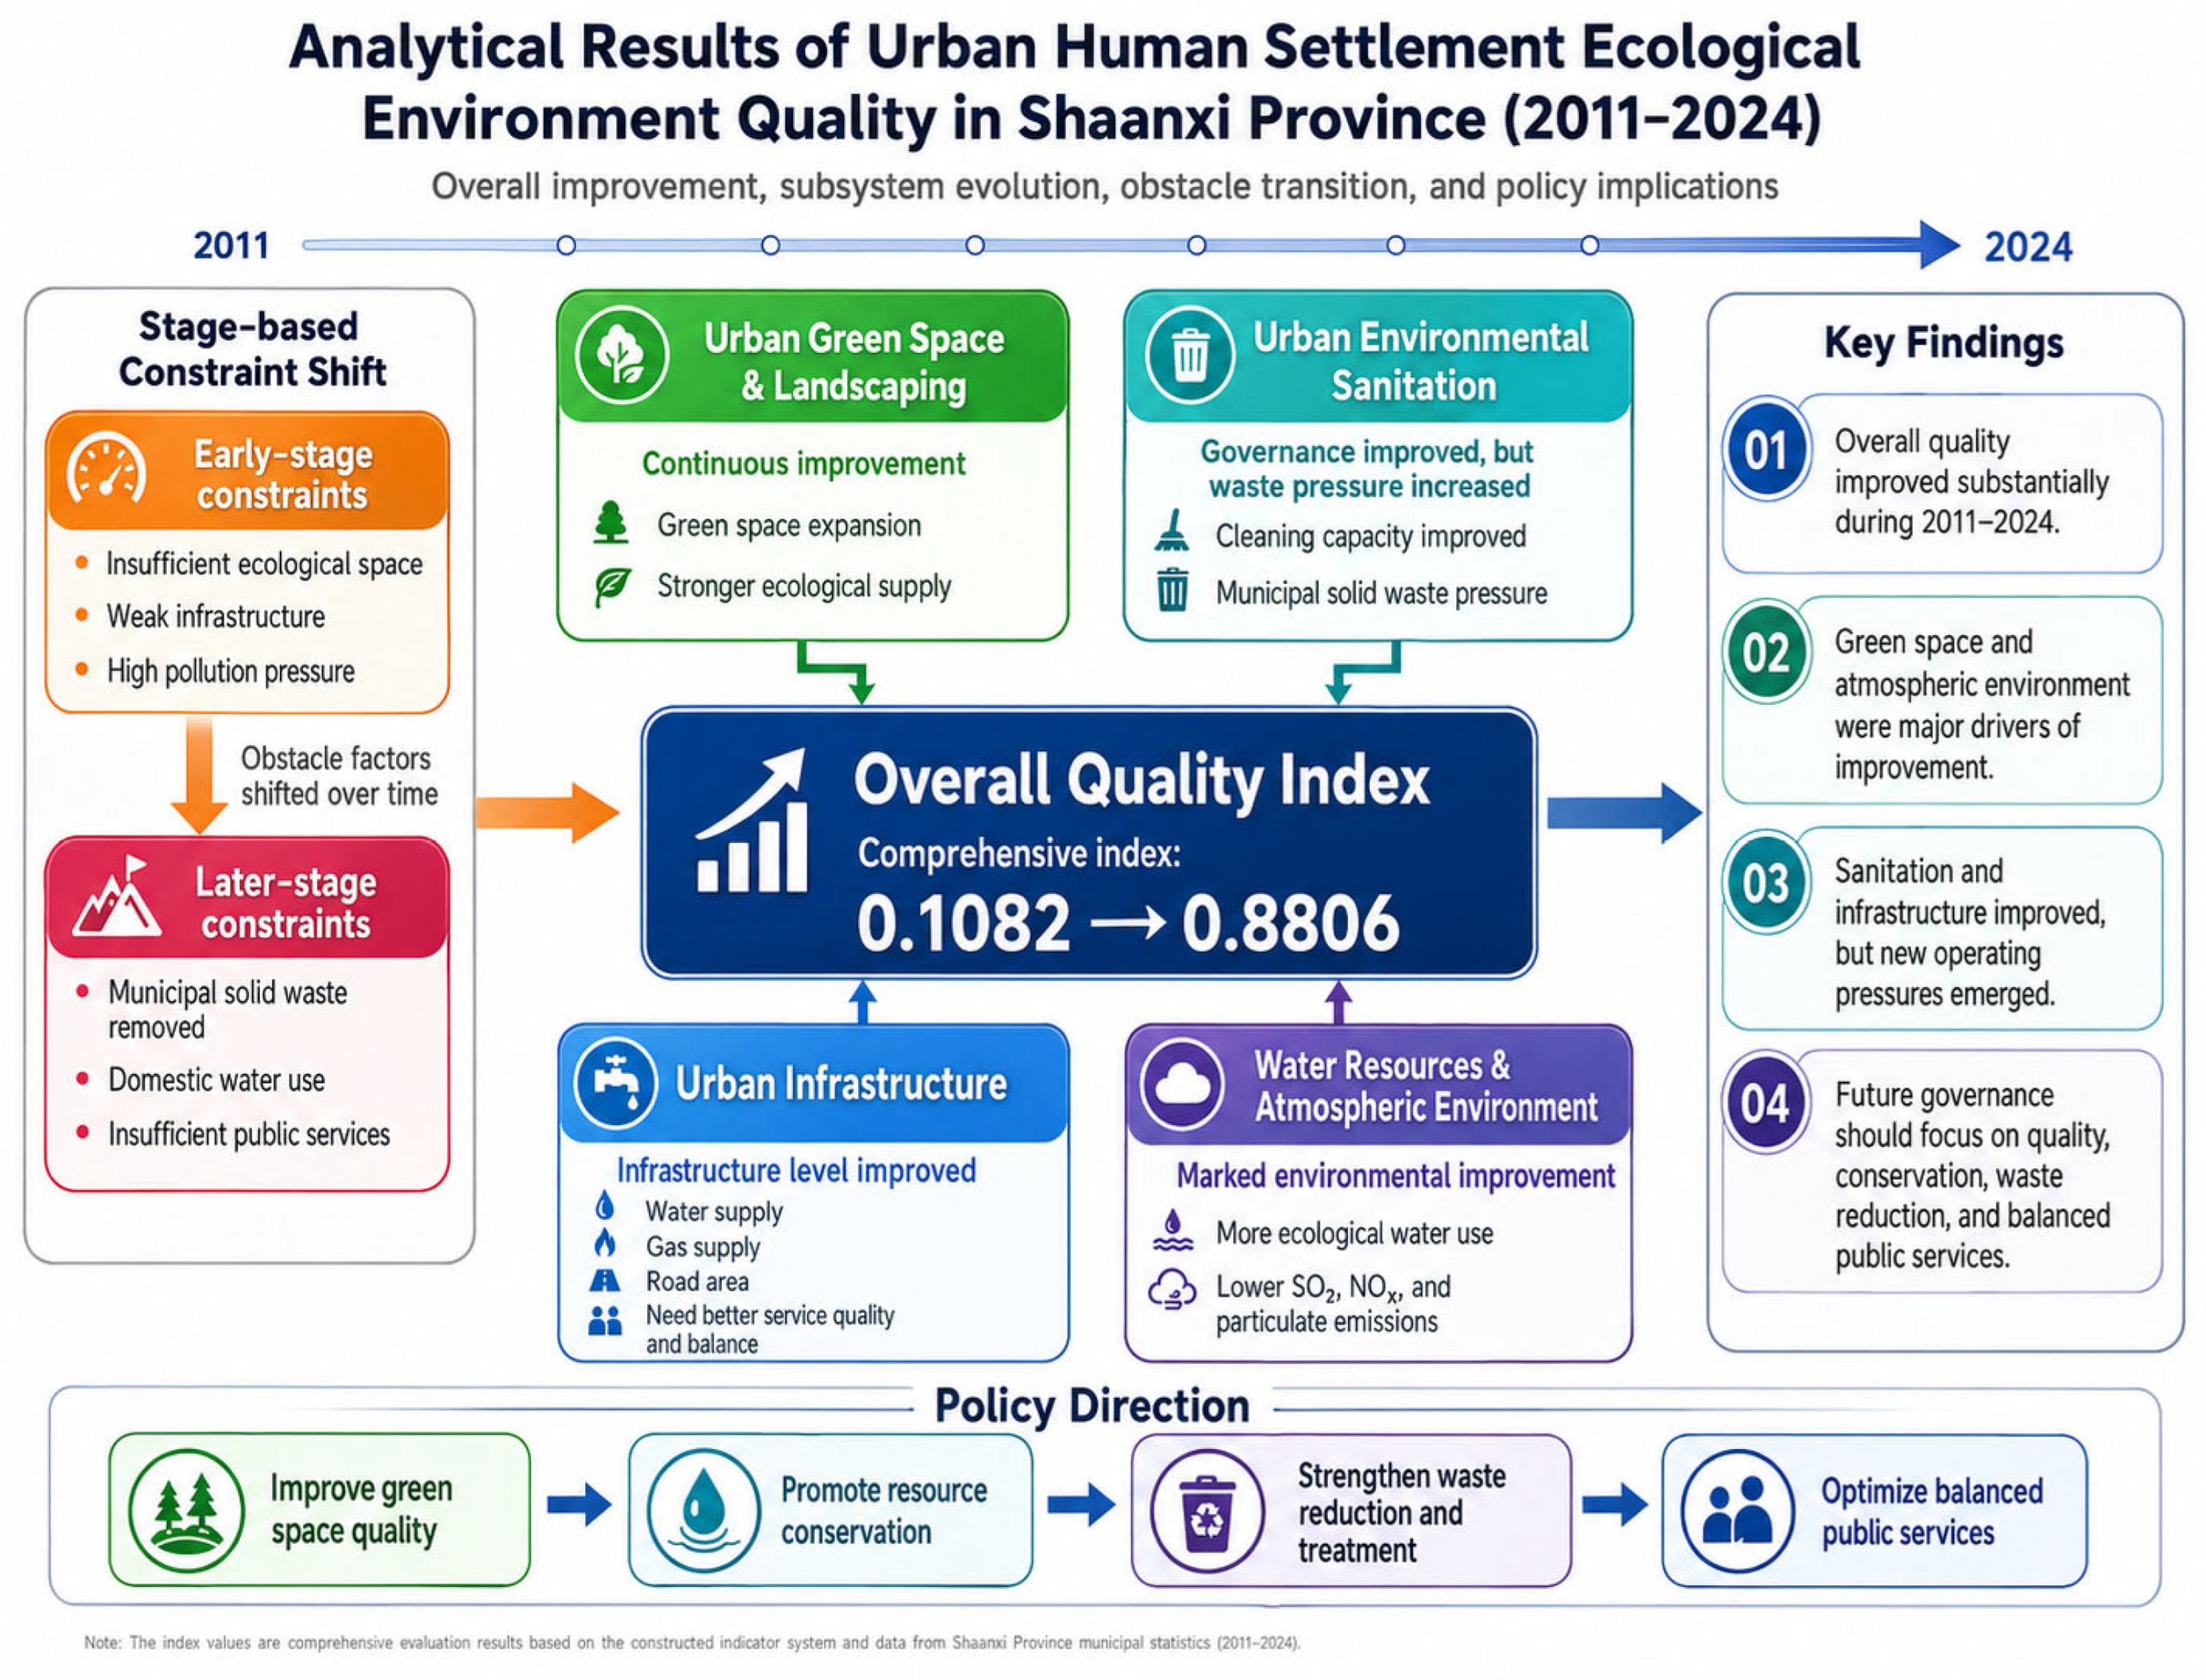

Disclaimer/Publisher’s Note: The statements, opinions and data contained in all publications are solely those of the individual author(s) and contributor(s) and not of MDPI and/or the editor(s). MDPI and/or the editor(s) disclaim responsibility for any injury to people or property resulting from any ideas, methods, instructions or products referred to in the content. |
© 2026 by the authors. Licensee MDPI, Basel, Switzerland. This article is an open access article distributed under the terms and conditions of the Creative Commons Attribution (CC BY) license.