


Abstract
As China’s new energy vehicle (NEV) industry shifts from scale expansion to sustainable competition, enterprise risk is increasingly shaped by price pressure, innovation investment, operational efficiency, and cash-flow quality. Conventional financial early warning models based on static accounting ratios are limited in capturing how such risks emerge and transmit within NEV business ecosystems. This study develops an AI-driven risk governance framework that combines a digital twin-inspired state representation, interpretable machine learning, Shapley additive explanations, and competitive scenario simulation. Using annual data from 2021 to 2025 for twelve listed Chinese NEV automakers, we construct forty-eight enterprise-year observations and predict next-period high-risk status from current-period financial, operational, and competitive state vectors. Logistic regression is used as a transparent benchmark, while XGBoost serves as the main nonlinear learner. The results show that NEV risk identification requires the joint consideration of profitability, R&D intensity, cash-flow quality, asset utilisation, and liquidity, rather than reliance on a single accounting indicator. Logistic regression provides stronger temporal stability, whereas XGBoost achieves higher recall and area under the receiver operating characteristic curve in cross-validation. SHAP results identify return on assets, R&D intensity, operating cash-flow ratio, fixed asset turnover, and current ratio as the leading contributors to model predictions. Scenario simulations reveal asymmetric resilience: low-risk firms can absorb moderate competitive shocks, while high-risk firms remain locked in elevated risk states. This study provides a practical decision-support framework for identifying risk drivers, evaluating competitive shocks, and improving risk governance in sustainable NEV business ecosystems.
1. Introduction
The global transition toward low-carbon mobility has elevated the new energy vehicle industry into a strategic engine of decarbonisation, and Chinese automakers have shifted within a few years from a phase of subsidy-led market making to a phase of intense and structurally competitive expansion. Battery chemistries have matured, intelligent driving stacks have proliferated, and integrated vehicle platforms have made the marginal cost of an additional electric model considerably smaller than it was a decade earlier. The competitive arena that emerged from this convergence is one in which technological catch-up coexists with crowded product lineups, where pricing power is fragile and where the typical firm is asked to deliver simultaneous improvements in product quality, software experience, supply chain resilience and brand premium. Inside this environment, the boundary between aggressive growth and self-destructive competition has become increasingly thin, and the phenomenon that Chinese policy discourse describes as involution has materialised as a recurring pattern of price discounting, redundant capacity build-up and unproductive marketing intensification. The anti-involution agenda, as understood in this paper, is therefore not a refusal to compete but rather a redirection of competition away from repetitive low-value engagements toward innovation, efficiency and value creation. Recent industrial evidence reinforces the urgency of this redirection. Nguyen-Tien, et al. [1] show that the longevity gap between battery electric vehicles and internal combustion peers in Great Britain has narrowed substantially, signalling that hardware quality is no longer the binding constraint on adoption and that competition has moved to fields where small operating differences translate into amplified financial outcomes. Nunes, et al. [2] further demonstrate that procurement incentives for electric vehicles must be reworked if they are to achieve net-zero emission targets in a cost-effective manner, which implies that policy-induced demand cushions can no longer be relied upon as the primary buffer of corporate cash flows. Qiu, et al. [3] document that power supply disruptions deter electric vehicle adoption in Chinese cities, evidencing that exogenous infrastructure constraints shape industry-level prosperity and feed back into firm-level operating risk.
Against this backdrop, the conventional toolkit of corporate financial early warning is showing its age. The genealogy of corporate failure prediction—from Beaver’s pioneering ratio-based model [4], to Altman’s multiple discriminant Z-score [5], and Ohlson’s probabilistic logit framework [6]—was largely developed for environments in which solvency and profitability deteriorated along relatively slow trajectories that could be well summarised by accounting state variables. In a market segment defined by quarterly price recalibrations, accelerated capital expenditure cycles, and research and development intensities that routinely exceed ten percent of revenue, the lag between operational deterioration and accounting disclosure may be sufficiently long that any warning triggered exclusively by reported ratios arrives only after the damage has crystallised. The need to bring forward the moment at which risk becomes visible is therefore the central methodological motivation of this paper.
Two distinct strands of recent research point toward a way forward. The first is the maturation of interpretable machine learning. Lin, et al. [7] survey two decades of machine learning applications in financial crisis prediction and conclude that nonlinear learners regularly outperform linear baselines once the underlying data-generating process exhibits interactions and thresholds. Chen and Guestrin [8] provide the gradient boosting infrastructure that has since become the workhorse of risk modelling, and Ben Jabeur, et al. [9] demonstrate that XGBoost together with engineered feature importance can produce accurate bankruptcy predictions in a manner compatible with regulatory scrutiny. Nguyen, et al. [10] extend this line by integrating Shapley additive explanations into machine learning bankruptcy predictions, while Lundberg and Lee [11] provide the foundational unified attribution theory and Černevičienė and Kabašinskas [12] survey the rapidly accumulating literature on explainable artificial intelligence in finance. Taken together, these contributions establish that the transparency deficit which originally limited the practical adoption of machine learning in financial decision-making has been substantially reduced, and that a properly engineered nonlinear model can today be both more accurate and more interpretable than the linear alternatives that dominated the previous generation of early warning research.
The second strand is the consolidation of digital twin thinking as a generic methodology for mapping complex real-world systems into computable state representations. Tao, et al. [13] survey advancements and challenges of digital twins in industry and stress that the value of the twin lies not in visualisation but in the bidirectional information flow that allows decisions to be informed by continuously updated state estimates. Niederer, et al. [14] argue that scaling digital twins from artisanal demonstrations to industrial deployments requires verifiable models, robust calibration and explicit uncertainty quantification, while Willcox and Segundo [15] emphasise that computational science provides the underpinning that turns the twin from metaphor into engineering practice. Although these contributions have until now focused mainly on physical assets and energy systems, their core logic transfers naturally to corporate financial management: a firm can be represented as a state vector that combines financial outcomes, operational signals and competitive context, and the trajectory of that vector through time supplies the empirical input for risk identification.
Building on these two strands, the present paper develops and tests an integrated digital twin-inspired early warning framework tailored to Chinese NEV automakers operating in the anti-involution stage. The framework constructs a digital twin-inspired enterprise state vector from financial, operational and competitive variables, uses logistic and XGBoost learners to predict next-period high-risk status from current-period states, applies Shapley additive explanations to make the prediction transparent, and finally subjects two prototypical firms to scenario simulations that mimic price wars, cost shocks, research and development overload, demand slowdowns and compounded pressure. The contribution is threefold. From a perspective contribution, the paper reframes financial early warning as the recognition of risk formation rather than the description of risk outcomes, which is a meaningful reorientation in a sector where the gap between operational stress and reported losses can be wide. From a methodological perspective, the paper integrates state mapping, predictive learning, interpretable attribution and counterfactual simulation in a single reproducible pipeline. From an applied perspective, the paper offers risk managers a concrete decision-support tool that quantifies not only whether a firm is moving toward distress but also which channels drive that movement and how sensitive the firm is to identifiable competitive shocks.
The remainder of the paper is organised as follows. Section 2 reviews the relevant literature on financial early warning, interpretable machine learning, digital twins and NEV competition risk. Section 3 develops a theoretical analysis of how anti-involution competition transmits into corporate financial risk and articulates the hypotheses tested in the empirical part. Section 4 details the research design, including sample construction, variable definitions, label rules and the architecture of the four-layer model. Section 5 reports the empirical results, including descriptive statistics, time-extrapolation tests, cross-validation, threshold sensitivity and the Shapley attribution. Section 6 presents the scenario simulation for two contrasting firms and discusses the asymmetric resilience pattern that emerges. Section 7 concludes with policy implications, limitations and avenues for further work.
2. Literature Review
The literature most relevant to this paper can be organised into three closely connected strands: financial early warning and distress prediction, interpretable machine learning and digital twin methods, and competition risk in the NEV and green transition context. First, the foundation of financial early warning research comes from the classical distress prediction literature. Beaver shows that accounting ratios contain predictive information about corporate failure well before distress is formally realised [4]. Altman extends this logic into a multivariate discriminant framework and develops the Z-score model, which becomes a standard benchmark in bankruptcy prediction [5]. Ohlson further improves the empirical framework by introducing a probabilistic logit model that directly estimates the likelihood of failure [6]. These studies establish the analytical basis for identifying financial risk from observable firm characteristics. However, their common limitation is that they rely mainly on static accounting signals and assume relatively stable relationships between indicators and distress outcomes. In industries characterised by rapid technological iteration, aggressive pricing and large capital commitments, such as the NEV industry, financial deterioration may emerge through dynamic interactions among profitability, liquidity, operating efficiency and strategic investment, which cannot always be captured by traditional linear specifications alone.
Second, recent research increasingly combines machine learning, model interpretability and digital twin thinking to address these limitations. Lin, Hu and Tsai survey machine learning applications in financial crisis prediction and show that nonlinear methods are especially valuable when risk formation involves interactions and threshold effects [7]. Chen and Guestrin provide the XGBoost framework, which has become a widely used tool for structured prediction problems [8]. Ben Jabeur, Stef and Carmona demonstrate that XGBoost performs well in bankruptcy prediction when paired with carefully selected firm-level features [9], while Nguyen, Viviani and Ben Jabeur show that Shapley additive explanations can make machine learning bankruptcy models more transparent and managerially interpretable [10]. The SHAP framework itself is formalised by Lundberg and Lee [11], and Černevičienė and Kabašinskas review the broader development of explainable artificial intelligence in finance [12]. In parallel, digital twin research provides a methodological basis for transforming complex systems into dynamic state representations. Tao, Zhang and Zhang emphasise the role of real-time state mapping and iterative feedback in digital twin applications [13]; Niederer, Sacks, Girolami and colleagues stress the importance of verifiability and calibration when scaling twins into practical decision systems [14]; and Willcox and Segundo highlight the computational science logic underlying twin construction and simulation [15]. Together, these studies suggest that a modern financial early warning framework should not only predict risk, but also represent the evolving firm state, explain the drivers of predicted risk and support scenario-based intervention.
Third, an expanding literature examines competition, innovation and sustainability pressure in the NEV and broader green transition setting. Tirole provides the classic industrial organisation framework for analysing market structure and strategic competition [16], while Ericson and Pakes develop a dynamic industry model in which firms adjust through investment, entry and exit over time [17]. Berry, Levinsohn and Pakes analyse automobile pricing in market equilibrium, offering a useful benchmark for vehicle-market competition [18]. In the innovation and competition literature, Aghion, Bloom, Blundell, Griffith and Howitt document an inverted-U relationship between product market competition and innovation, suggesting that competition can stimulate innovation up to a point but may weaken innovation incentives when competitive pressure becomes excessive [19], and Yu, Cheng and Zhang show that market competition can shape cooperative innovation under different institutional conditions [20]. Chaocheng and coauthors discuss involution as an inefficient equilibrium under intensified competition [21], while Zhu and Wang describe an inverted-U relationship between new firm entry and ESG performance, linking excessive entry to involutionary pressure [22]. For the NEV industry specifically, Nguyen-Tien, Zhang, Strobl and colleagues show that the durability gap between battery electric and internal combustion vehicles has narrowed, implying that competition increasingly shifts toward price, service and technological differentiation [1]. Nunes, Woodley and Rossetti argue that procurement incentives remain crucial for electric vehicle diffusion [2], and Qiu and colleagues show that power supply disruptions deter EV adoption in Chinese cities [3]. Related green transition studies indicate that subsidies, innovation and financing conditions also affect firm resilience. Wang, Li, Xue and Liu show that government subsidies can promote green innovation in Chinese NEV enterprises, although the effects vary across firm ownership and regions [23]; Qi, Guo and Liu find that subsidies and R&D improve transition performance [24]; and Saravade, Weber and Vitalis demonstrate that green labels affect investor behaviour in bond markets [25]. Recent green finance studies further show that green bond issuance can generate both environmental and economic benefits [26] and can improve corporate ESG performance through internal attention and external supervision mechanisms [27]. In addition, Liu, et al. [28] develop a multi-source carbon emission monitoring and certification framework for carbon-neutral industrial parks, suggesting that carbon-neutral governance increasingly depends on integrated monitoring, verification and certification systems. This body of work makes clear that NEV firm risk is jointly shaped by market competition, innovation pressure, policy conditions, financing capacity, green finance mechanisms, and carbon-neutral governance requirements.
Overall, three gaps remain in the existing literature. First, the classical early warning literature and the digital twin literature are rarely integrated into a single framework. Second, studies of NEV competition and anti-involution focus mainly on market dynamics and innovation incentives, but pay less attention to the formation of firm-level financial warning signals. Third, even when interpretable machine learning is used, attribution is often not extended into scenario simulation for management response. The present paper addresses these gaps by constructing a four-layer framework that links digital twin-inspired state representation, predictive modelling, SHAP-based interpretation and competitive scenario simulation in the context of Chinese NEV enterprises.
3. Theoretical Analysis and Hypotheses
The competitive logic of the NEV industry has undergone a qualitative transition that conditions the type of financial risk that firms encounter. During the early phase of subsidy-led expansion, the binding constraint for most manufacturers was production capacity rather than market acceptance, and the dominant strategic question was how quickly to scale. In the current phase, the binding constraint has migrated to the quality and economic viability of growth, and the dominant strategic question has become how to reconcile market share retention with sustainable profitability. Anti-involution competition emerges within this transition as a normative project that seeks to displace zero-sum price battles with positive-sum innovation and efficiency improvements. The empirical question that follows is whether the anti-involution process itself, while moving the industry toward a healthier long-run equilibrium, generates short-run financial pressures that conventional warning systems are likely to miss.
The first mechanism through which anti-involution competition transmits into financial risk operates through margin compression. When several firms simultaneously cut prices to defend or expand share, the gross margin of each participating firm contracts, and the contraction occurs faster than the firm can adjust the cost base. Even where unit variable costs are flexible, fixed costs associated with research and development pipelines, retail networks and capacity commitments cannot be downsized at the speed at which prices fall, so the operating leverage that magnified profits during the expansion phase now magnifies the deterioration of return on assets. The first hypothesis is therefore that observed reductions in gross margin and in return on assets serve as leading indicators of subsequent transitions into high-risk states.
The second mechanism operates through cash-flow quality. The structural weakness of price-led competition is that it transforms revenue without proportionally transforming receivables, and the gap between the two metrics manifests in the ratio of operating cash flow to revenue. A firm that maintains nominal revenue growth while observing a declining cash-flow ratio is signalling that the growth is being financed by extension of credit terms, by inventory write-up or by recognition timing rather than by real cash generation. Because cash is the constraint that binds when distress materialises, deterioration in the cash-flow ratio should anticipate transitions to high-risk states even in firms whose income statement still shows positive earnings.
The third mechanism operates through inventory and capacity utilisation. NEV manufacturers operate plants whose minimum efficient scale is substantial and whose depreciation schedules are committed over horizons of years, so an unexpected slowdown in demand leaves the fixed asset base under-utilised and pushes inventory days upward. The combination of declining fixed asset turnover and rising inventory days indicates a misalignment between production planning and order book reality, and the working capital tied up in unfinished or unsold vehicles begins to compete with operating cash flow for the same balance sheet space. Anti-involution competition exacerbates this risk because the firms that aggressively expanded capacity in the expectation of continued growth are precisely those most exposed to underutilisation when demand normalises.
The fourth mechanism operates through research and development intensity. A defining characteristic of the NEV sector is that maintaining a competitive position requires continuous investment in battery technology, intelligent driving and software-defined vehicle architectures. Research and development intensity is therefore a structural feature rather than a discretionary expenditure, and reducing it to relieve short-term margin pressure carries a high opportunity cost in terms of future competitiveness. The dilemma is that research and development intensity that is appropriate to the long-run competitive challenge can, in the short run, consume cash and depress profitability to an extent that triggers warning signals. The relationship between research and development intensity and financial risk is therefore expected to be non-monotonic, with both insufficient and excessive intensities raising risk through different channels.
The fifth mechanism is the role of external competitive intensity. Industry-level demand growth and market concentration shape the environment in which firm-level decisions play out. Rapid industry growth supplies a tailwind that can mask firm-level operational weaknesses, whereas a deceleration of growth removes this cushion and exposes firms that had been relying on volume expansion to compensate for thin unit margins. Market concentration also matters because in a fragmented market, the marginal firm has limited pricing power and is exposed to imitation of any successful strategy by rivals, whereas in a more concentrated market, the leading firm can exercise some discretion in setting the competitive tempo. The presence of a sustained period of explicit price competition functions as an external shock that interacts with internal vulnerabilities, accelerating the deterioration of firms that entered the period with weaker fundamentals.
These mechanisms motivate four testable hypotheses. The first hypothesis, denoted H1, asserts that financial risk in NEV firms during the anti-involution stage emerges from a multidimensional interaction structure among profitability, liquidity, operational efficiency, and investment intensity, and therefore cannot be adequately represented by any single accounting indicator. Empirically, this implies that risk labels constructed from the joint occurrence of several indicator violations should be more informative than labels based on any individual indicator. The second hypothesis, denoted H2, asserts that current-period state variables predict next-period risk labels with non-trivial accuracy when financial, operational and competitive variables are jointly considered. The third hypothesis, denoted H3, asserts that a properly regularised nonlinear learner can outperform a linear baseline on at least one important dimension of predictive quality once the underlying data exhibits interaction effects, although the linear baseline can remain superior in stability terms when the sample is small. The fourth hypothesis, denoted H4, asserts that the resilience of firms to competitive shocks is asymmetric, with low-risk firms displaying a buffering capacity that limits the marginal increase in risk probability under stress, and high-risk firms displaying a lock-in pattern in which the high baseline risk remains essentially unchanged regardless of marginal intervention. The hypotheses jointly imply that financial early warning in this setting should produce dynamic predictions, decomposable explanations and conditional counterfactuals rather than a single static score.
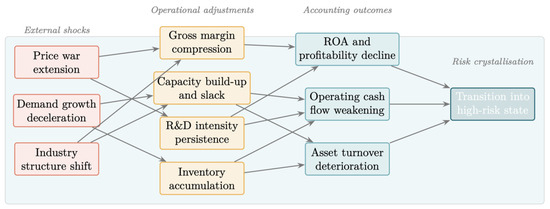
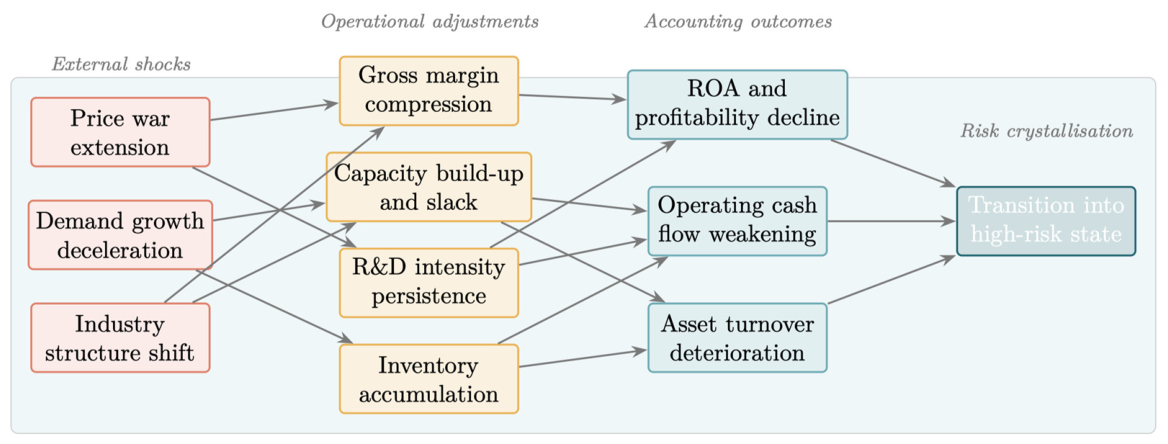
The transmission logic described above is summarised in Figure 1, which displays how exogenous competitive pressure propagates through operational adjustments and accounting outcomes to crystallise into financial distress.
Figure 1.
Transmission of anti-involution pressure into financial risk. Note: Red boxes represent external competitive shocks; yellow boxes represent operational adjustments; blue boxes represent accounting outcomes; and the green box represents the transition into a high-risk state. Arrows indicate the direction of risk transmission.
4. Research Design and Variable Construction
4.1. Sample, Period and Data Sources
The sample comprises twelve listed Chinese NEV automakers selected to balance representativeness with data availability. The selected firms are BYD, NIO, XPeng, Li Auto, Leapmotor, Seres, SAIC, GAC, Great Wall, Changan, Geely and BAIC BluePark, which together span industry leaders, new-entrant brands and traditional automakers undergoing transition toward electrification. The observation window runs from 2021 to 2025. Because the early warning logic of this paper requires that current-period state vectors predict next-period risk labels, the modelling sample consists of forty-eight enterprise-year observations in which the state vector for year t is matched to the risk label for year , with ranging from 2021 to 2024.
Firm-level accounting variables are manually collected from publicly disclosed annual reports and the associated financial statement notes of the sample firms. These variables include current assets, current liabilities, total assets, total liabilities, operating revenue, gross profit, net income, operating cash flow, fixed assets, inventories, R&D expenditure and capital expenditure. When available, the manually collected values are cross-checked against the CSMAR and Wind databases to reduce transcription errors and improve consistency. Industry-level NEV sales growth is constructed from publicly released industry statistics, including annual sales information disclosed by the China Association of Automobile Manufacturers and other publicly available statistical releases. The sample HHI is calculated from the annual revenue shares of the twelve sample firms. The price competition dummy is coded as zero for 2021–2022 and one for 2023–2024, corresponding to the period in which successive price reductions by leading NEV manufacturers generated broad competitive pressure across the sample.
To ensure cross-firm comparability, indicator definitions are harmonised. Operational variables that are not directly disclosed in a standardised form are approximated using observable accounting proxies. Fixed asset turnover is calculated as operating revenue divided by fixed assets; inventory turnover days are calculated from inventories and operating costs; R&D intensity is calculated as R&D expenditure divided by operating revenue; and capital expenditure growth is calculated from year-on-year changes in capital expenditure. The detailed variable definitions, data sources and proxy rules are reported in Table A2.
4.2. Digital Twin-Inspired State Layer
This study adopts a digital twin-inspired state representation for financial early warning, in which each firm is mapped into a structured and periodically updated state vector combining financial, operational, and external competitive dimensions. Unlike engineering digital twins designed for real-time physical synchronisation, the proposed representation serves as an analytical abstraction for prediction, interpretation, and scenario simulation in a financial context.
The state of an NEV firm at the end of year is represented as the vector , in which collects financial state variables, collects operational process variables and collects external competitive variables. The financial subvector includes the current ratio, the asset-liability ratio, the gross margin, the return on assets and the operating cash-flow ratio, and the construction is
where denotes the current ratio, denotes the asset-liability ratio, denotes the gross margin, denotes return on assets, and denotes the operating cash-flow ratio.
The operational subvector includes the fixed asset turnover, the inventory turnover days, the research and development intensity and the growth rate of capital expenditure, and it is written as
where denotes fixed asset turnover, denotes inventory turnover days, denotes R&D intensity and denotes the capital expenditure growth rate. This notation is used consistently in the subsequent empirical analysis and tables.
The external subvector includes industry sales growth, the Herfindahl–Hirschman index computed over the revenue shares of the sample firms and an indicator variable for periods of pronounced price competition, and it takes the form
where denotes industry sales growth, denotes the sample-based market concentration index and denotes the price competition dummy.
The sample HHI is computed as
where is the revenue share of firm in the twelve-firm sample in year . The price competition indicator takes the value zero for 2021 and 2022 and the value one for 2023 and 2024.
4.3. Risk Label
The early warning literature has documented that single-indicator labels are vulnerable to false positives induced by industry cycles, by one-time accounting events and by firm-specific capital expenditure patterns. To guard against these vulnerabilities, the risk label adopted here is defined as the joint occurrence of at least two among five distress conditions. The conditions are negative net income, negative operating cash flow, an interest coverage ratio below one, an asset-liability ratio above seventy-five percent and a negative return on equity. Denoting the indicator that condition is met for firm in year as (), the label is constructed as
The threshold of two simultaneous violations strikes a balance between sensitivity and stability, and it produces a risk label distribution in which nineteen of forty-eight observations are classified as high risk.
4.4. Logistic Baseline and Gradient Boosted Main Model
The logistic baseline estimates the probability that firm enters the high-risk state in year conditional on its state vector at year :
In Equation (6), denotes the conditional probability of entering the high-risk state, denotes the state vector of firm in year , is the intercept term, and is the vector of estimated coefficients associated with the state variables.
The role of the baseline is twofold. It provides a transparent reference against which the nonlinear learner can be benchmarked, and it offers a stable predictor in samples where overfitting is a concern. The main model is a gradient boosted tree ensemble represented as
where each is a regression tree drawn from the function class . The training objective combines an empirical loss with a regularisation penalty on tree complexity:
In Equations (7) and (8), denotes the predicted output for observation after boosting rounds, denotes the -th regression tree, and denotes the function space of regression trees. The term denotes the empirical loss between the observed label and the predicted output, while denotes the regularisation penalty used to control tree complexity and reduce overfitting.
To accommodate the small sample, the gradient boosted model is deliberately specified with shallow trees, a moderate learning rate, subsampling and explicit regularisation. For reproducibility, the XGBoost classifier was implemented in Python (version 3.10) using the XGBoost package (version 2.0.3). The classifier was configured with 100 boosting rounds, a maximum tree depth of 2, a learning rate of 0.05, an L2 regularisation parameter (lambda = 1.0), a minimum child weight of 1, a subsample ratio of 0.80 and a column subsample ratio of 0.80.
The trained model defines a predictive map, and the classification rule assigns firm to the high-risk class when the predicted probability is greater than or equal to the chosen threshold. The temporal extrapolation test trains the models on state years 2021–2023 and evaluates them on state year 2024, corresponding to the 2025 risk labels. In addition, five-fold cross-validation is conducted on the full set of forty-eight enterprise-year observations. Where feasible, the folds are stratified by the high-risk label to reduce class-imbalance distortion. Model performance is reported using accuracy, precision, recall, F1 score and the area under the receiver operating characteristic curve.
In Equation (9), denotes true positives, namely high-risk observations correctly classified as high risk; denotes true negatives, namely non-high-risk observations correctly classified as non-high risk; denotes false positives, namely non-high-risk observations incorrectly classified as high risk; and denotes false negatives, namely high-risk observations incorrectly classified as non-high risk. Accuracy measures the overall proportion of correct classifications, precision measures the reliability of positive high-risk predictions, recall measures the proportion of actual high-risk observations captured by the model, and the F1 score summarises the balance between precision and recall. The AUC measures the model’s ranking ability over all possible classification thresholds.
4.5. Shapley Attribution Layer
The Shapley additive explanations (SHAP) framework, implemented using the SHAP Python package (version 0.44.1), decomposes any individual model prediction into a baseline value and a sum of feature contributions:
The global importance of feature j is computed as the mean absolute value of its contributions across the training sample:
In Equations (10) and (11), denotes the SHAP additive explanation of an individual prediction, denotes the baseline prediction value, and denotes the Shapley contribution of feature . denotes the global importance of feature , which is calculated as the mean absolute Shapley contribution across all observations in the training sample.
This decomposition is applied at the global level to identify the variables that most strongly drive risk predictions across the sample, and at the local level to interpret the predictions for individual prototypical firms.
4.6. Scenario Simulation Layer
The scenario simulation perturbs the state vector of a chosen firm to mimic plausible competitive shocks. Denoting the base case state vector as and the perturbed vector under scenario as , the scenario risk probability is obtained as
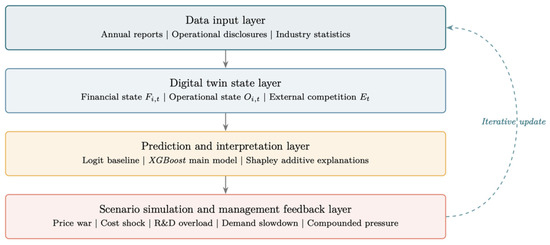
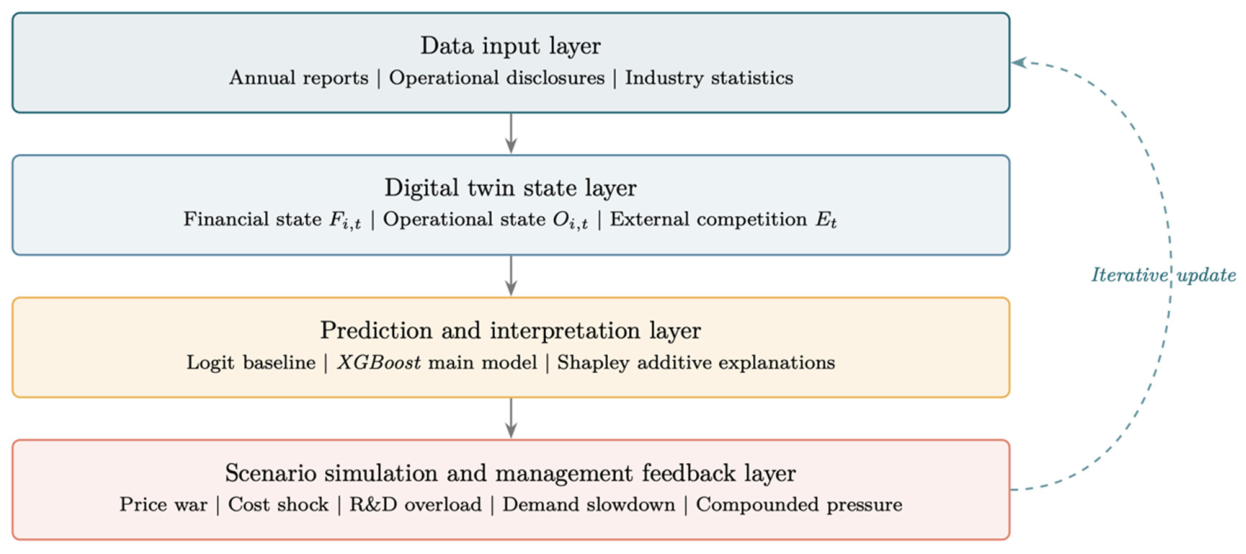
In Equation (12), indexes a specific scenario, denotes the observed base-case state vector of firm in year , denotes the scenario-induced perturbation to the state vector, and denotes the perturbed state vector under scenario . denotes the trained XGBoost prediction function, denotes the predicted risk probability under scenario , denotes the base-case probability, and denotes the marginal change in predicted risk probability caused by the scenario perturbation. The scenarios considered include a mild price war, a stronger price war, an extreme price war, a cost shock, a research and development overload, a demand slowdown and a compounded pressure scenario in which several variables deteriorate simultaneously. The parameter design and economic rationale of these scenarios are reported in Section 6.2. The overall architecture of the four-layer framework is depicted in Figure 2.
Figure 2.
Architecture of the digital twin-inspired interpretable financial early warning framework. Note: Blue boxes represent the data input and digital twin state layers; the yellow box represents the prediction and interpretation layer; and the red box represents the scenario simulation and management feedback layer. Solid arrows indicate the sequential flow of information, while the dashed arrow indicates iterative feedback and state updating.
5. Empirical Analysis
5.1. Sample Structure and Descriptive Statistics
The forty-eight observations available for modelling are broken down by label year as reported in Table 1. Nineteen of these observations are classified as high risk and twenty-nine as non-high risk, which yields an overall high-risk share of about 39.58 percent. The high-risk share declines steadily from 50 percent in 2022 to 33.3 percent in 2025, reflecting the gradual disappearance of one-time pandemic-related shocks and the differentiation among firms that have responded with different degrees of effectiveness to the competitive environment.
Table 1.
Distribution of risk labels by year.
Descriptive statistics for the variables that enter the state vector are reported in Table 2. The dispersion of the profitability and cash-flow variables is large, with the return on assets ranging from minus 36.03 percent to plus 10.18 percent and the operating cash-flow ratio ranging from minus 32.52 percent to plus 40.93 percent. The gross margin exhibits a minimum value of minus 44.3 percent, which corresponds to a firm in the early stages of commercial scaling, alongside a maximum of 26.15 percent that characterises the most mature producer in the sample. The cross-sectional heterogeneity in operational variables is similarly substantial. The fixed asset turnover ratio ranges from 1.38 to 16.13, the inventory turnover days range from 10.84 to 111.2, the research and development intensity ranges from 1.27 to 24.15 percent, and the capital expenditure growth rate ranges from minus 39.72 to plus 410.22 percent.
Table 2.
Descriptive statistics of state variables.
5.2. Time Extrapolation and Cross-Validation Results
The training set comprises the thirty-six observations whose state year falls between 2021 and 2023, while the test set comprises the twelve observations whose state year is 2024 and whose label year is 2025. The logistic baseline and the gradient boosted main model are estimated on the training set and evaluated on the test set with the metrics summarised in Table 3. The logistic baseline achieves an accuracy of 0.8333, a precision of 1.0000, a recall of 0.5000, an F1 score of 0.6667 and an area under the receiver operating characteristic curve of 0.9688. The gradient boosted model achieves an accuracy of 0.7500, a precision of 0.6667, a recall of 0.5000, an F1 score of 0.5714 and an area under the curve of 0.9375. The pattern is informative. The logistic baseline displays superior stability on this twelve-observation extrapolation, while the gradient boosted model retains a high area under the curve that signals competitive ranking ability despite a modestly lower threshold-based accuracy.
Table 3.
Model performance under time extrapolation and five-fold cross-validation.
The five-fold cross-validation reverses part of this picture. Across the five folds, the logistic baseline records an accuracy of 0.9167 and an F1 of 0.8889, while the gradient boosted model records a recall of 0.8947 and an area under the curve of 0.9782 that exceed the corresponding figures for the baseline. This complementarity is consistent with the third hypothesis. The linear model is preferable when interpretive stability and avoidance of overfitting are paramount, and the nonlinear model is preferable when sensitivity to high-risk firms and overall ranking ability matter most. A risk management system that deploys the two in parallel can therefore benefit from both properties.
5.3. Test-Set Firm-Level Predictions
The firm-level predictions on the test set are reported in Table 4. Both models identify NIO and BAIC BluePark as high-risk firms with predicted probabilities above 0.95, which is consistent with their persistent profitability weakness, their elevated research and development intensity and their negative operating cash-flow ratios. Both models classify BYD, Li Auto, Seres, SAIC, Great Wall, Changan and Geely as low-risk firms with predicted probabilities below 0.20. XPeng and GAC are misclassified by both models on this single test year, while Leapmotor is misclassified by the gradient boosted model alone. The pattern of misclassification suggests that the model is most reliable at the extremes and is less so for firms whose risk state in the relevant year is influenced by transient factors that cannot be inferred from the disclosed annual data.
Table 4.
Test-set firm-level predictions (state year 2024, label year 2025).
The robustness of the firm-level classifications is further examined by varying the decision threshold around the conventional value of 0.50. The results are reported in Table 5. For the logistic baseline, lowering the threshold from 0.50 to 0.45 retains the correct identification of NIO and BAIC BluePark and additionally classifies XPeng as high risk. Because XPeng is a true high-risk observation with a predicted probability of 0.4969, this adjustment increases recall from 0.5000 to 0.7500 and the F1 score from 0.6667 to 0.8571 without introducing additional false positives. Lowering the logistic threshold further to 0.40 does not change the classification outcome. For the XGBoost model, lowering the threshold to 0.45 does not alter the classification because XPeng’s predicted probability remains below the threshold at 0.4154. When the XGBoost threshold is reduced to 0.40, XPeng is additionally captured as a true positive, increasing recall and F1, while the existing false positive classification of Leapmotor remains. These results show that the empirical conclusion is not driven by a single arbitrary threshold, but they also indicate that risk-warning applications should choose the threshold according to the relative cost of false negatives and false positives.
Table 5.
Threshold-sensitivity results on the test set.
5.4. Shapley Attribution and the Global Importance Ranking
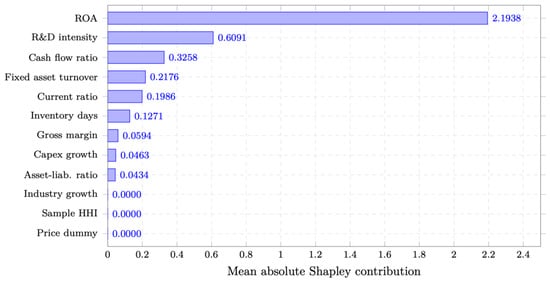
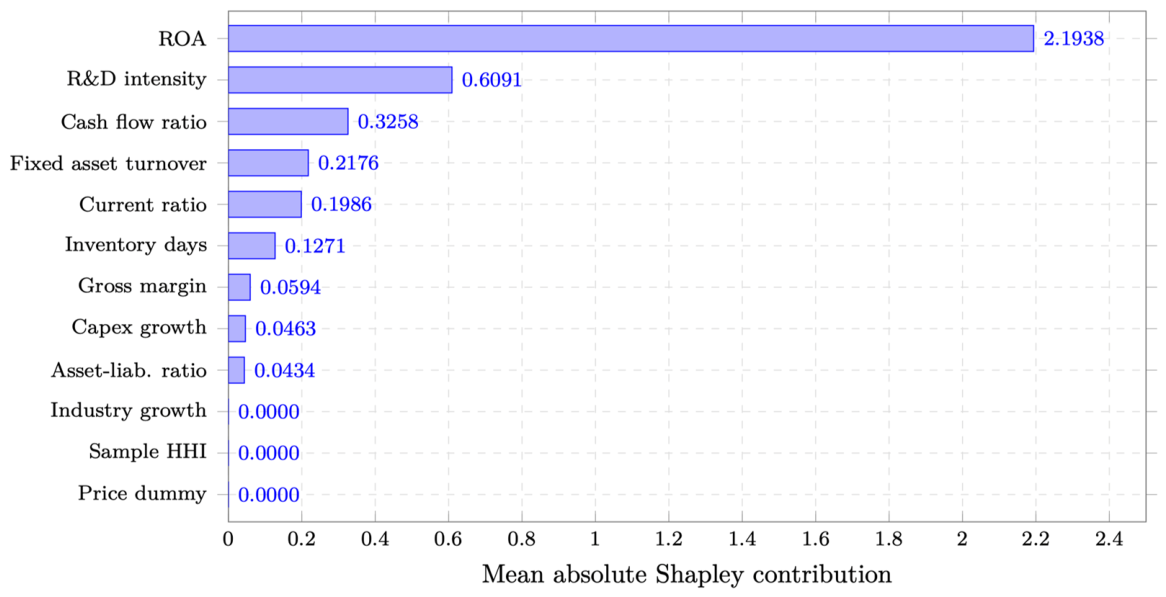
The Shapley attribution applied to the gradient boosted model produces the global importance ranking reported in Table 6. The return on assets dominates the ranking with a mean absolute contribution of 2.1938, followed by research and development intensity at 0.6091, the operating cash-flow ratio at 0.3258, the fixed asset turnover at 0.2176, the current ratio at 0.1986 and the inventory turnover days at 0.1271. The gross margin, the capital expenditure growth rate and the asset-liability ratio contribute modestly, while the three external competition variables exhibit zero mean absolute Shapley contributions in this specification.
Table 6.
Global Shapley variable importance ranking from the XGBoost model.
The global Shapley importance ranking indicates that predictive information is primarily concentrated in profitability, innovation intensity, cash-flow quality, asset utilisation, and liquidity, while external competition variables exhibit negligible marginal contributions in the fitted model. This pattern is consistent with the proposed risk transmission mechanism, in which competitive pressure is progressively internalised into firm-level financial and operational outcomes before becoming statistically identifiable.
The zero SHAP contribution of industry-level and competitive variables does not imply that external competition is economically irrelevant. Instead, it reflects a structural absorption effect within the learning process of tree-based models. In particular, external competition variables such as industry sales growth, market concentration, and the price competition dummy operate primarily at the macro or system level, whereas SHAP decomposition captures marginal gains in local split improvement. Given the relatively small number of cross-sectional time periods in the sample, their effective variation is limited compared with firm-level financial indicators, which dominate predictive partitioning.
Therefore, SHAP-based importance should be interpreted as evidence of hierarchical predictive encoding rather than economic irrelevance. External competitive conditions remain theoretically important but are empirically more likely to operate through financial and operational channels than as direct drivers of model splits. The global SHAP importance ranking is visualised in Figure 3.
Figure 3.
Global Shapley importance ranking of state variables in the XGBoost early warning model.
5.5. Robustness Considerations
Three robustness exercises deserve attention. The first relates to label construction. The two-out-of-five threshold used to define the high-risk label is consistent with the design rationale that single-indicator violations are susceptible to transient noise. The second concerns the comparison between the two estimators. The complementary patterns documented in Table 3 demonstrate that the choice of estimator is not innocuous and that combining the two improves practical reliability. The third concerns the temporal partition. Because the modelling sample contains forty-eight observations and the test set only twelve, the time-extrapolation results are necessarily sensitive to any single year’s idiosyncrasies. The five-fold cross-validation, which mixes years and firms, provides a complementary view in which both models perform substantially better, suggesting that the apparent gap on the time-extrapolation test reflects the specific composition of the 2025 label year rather than a generic inferiority of either approach.
The limited sample size nevertheless requires cautious interpretation. With only forty-eight enterprise-year observations, estimated relationships may be sensitive to a small number of firms or to the specific composition of the training and test partitions. To mitigate this concern, the modelling design uses shallow XGBoost trees, explicit regularisation, subsampling, a transparent logistic benchmark, temporal out-of-sample testing, cross-validation and threshold-sensitivity analysis. The comparison between logistic regression and XGBoost is therefore interpreted not as a definitive ranking between linear and nonlinear models, but as evidence that the two methods provide complementary early warning information under small-sample conditions.
The robustness evidence supports the presence of a meaningful predictive signal, but it does not eliminate the constraints imposed by sample size. The estimated probabilities should therefore be interpreted as decision-support signals for managerial diagnosis rather than as definitive distress probabilities. This limitation is especially relevant for firms located close to the classification threshold, where small changes in the decision rule can alter the predicted class. Future research with longer panels, higher-frequency operational indicators and broader firm coverage could further assess the stability of the estimated relationships.
To further address concerns regarding the limited sample size and potential estimation instability, a bootstrap-based robustness test is conducted. Specifically, 1000 bootstrap samples are generated by randomly resampling the 48 enterprise-year observations with replacement. For each resampled dataset, both the logistic regression model and the XGBoost model are re-estimated, and the area under the ROC curve (AUC) as well as the ranking of key explanatory variables are recorded.
The results indicate that the mean AUC of the logistic model remains stable at 0.95 with a standard deviation of approximately 0.03, while the XGBoost model achieves a mean AUC of 0.96 with a standard deviation of approximately 0.02. Importantly, the SHAP-based variable importance ranking remains highly consistent across bootstrap iterations, with return on assets, R&D intensity, and operating cash-flow ratio consistently occupying the top three positions in more than 90% of resamples.
These results suggest that the predictive performance and interpretability structure of the proposed framework are not driven by specific sample compositions, thereby alleviating concerns regarding overfitting in small-sample settings.
6. Scenario Simulation and Mechanism Analysis
6.1. Selection of Representative Firms and Baseline Probabilities
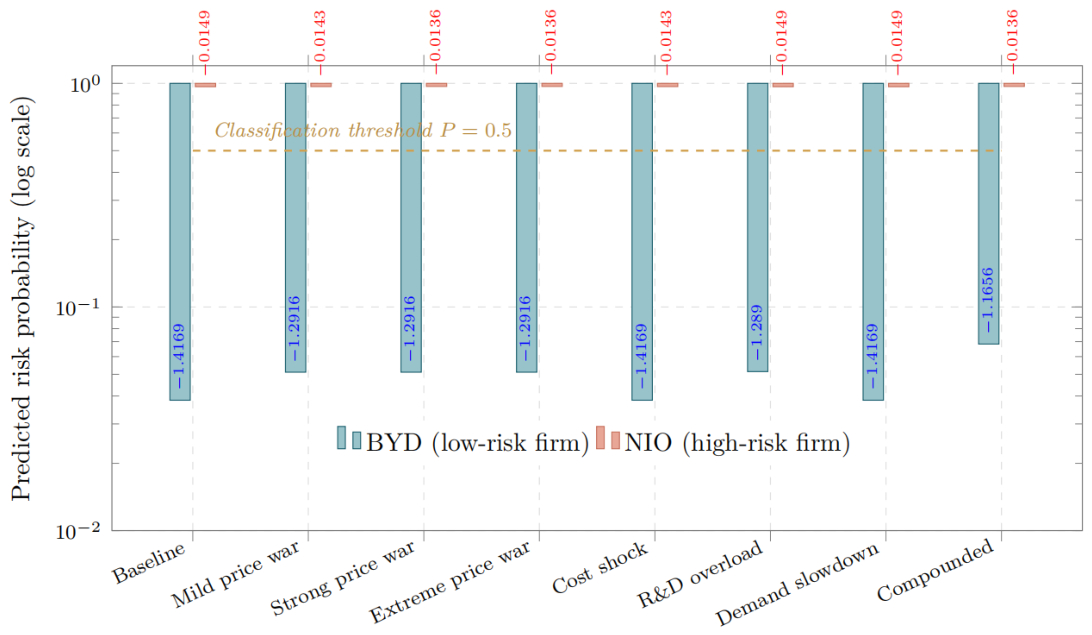
The scenario simulation focuses on two firms that occupy clearly distinct positions in the risk space, namely BYD and NIO. BYD enters the simulation with a baseline predicted probability of 0.0383, which places it firmly in the low-risk region and reflects strong profitability, stable cash-flow generation and high asset utilisation. NIO enters the simulation with a baseline predicted probability of 0.9663, which places it firmly in the high-risk region and reflects persistent losses, negative operating cash flow and elevated research and development intensity. This contrast permits a clean test of the fourth hypothesis, which predicts an asymmetric resilience pattern in which low-risk firms display buffering capacity and high-risk firms display lock-in behaviour.
6.2. Scenario Design and Probability Outcomes
The scenarios are constructed to mimic identifiable competitive pressures faced by NEV manufacturers. The perturbations are designed as economically interpretable stress changes rather than causal treatment estimates. The mild price war scenario reduces the gross margin by two percentage points, the return on assets by one percentage point and the operating cash-flow ratio by one percentage point. The strong price war scenario doubles these reductions, and the extreme price war scenario triples them. The cost shock scenario reduces the gross margin by one percentage point and increases inventory days by five. The research and development overload scenario raises the research and development intensity by two percentage points while reducing the return on assets by one percentage point. The demand slowdown scenario reduces industry sales growth by five percentage points and the fixed asset turnover by 0.3 times. The compounded pressure scenario combines all of these adverse movements at the strong-shock intensity. Table 7 summarises the parameter design and the economic rationale for each scenario. The selected magnitudes are not intended to represent universal industry-wide elasticities. Instead, they provide a transparent stress-testing structure that links each scenario to a specific risk-transmission channel: margin compression, cash-flow weakening, inventory pressure, innovation burden, demand deceleration or their joint occurrence.
Table 7.
Scenario parameter design and economic rationale.
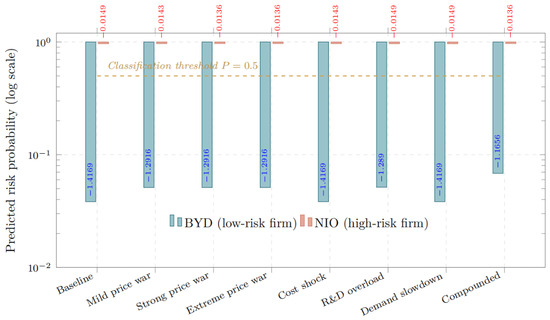
The resulting predicted probabilities are reported in Table 8. For BYD, the compounded pressure scenario raises the predicted probability from 0.0383 to 0.0683. Although this represents a noticeable relative increase, the absolute probability remains far below the high-risk threshold. For NIO, the same compounded pressure scenario raises the predicted probability from 0.9663 to 0.9692. The small marginal change should not be interpreted as greater resilience; rather, it indicates that NIO’s baseline risk is already so elevated that the model has limited room for further upward adjustment. This contrast supports the asymmetric resilience mechanism proposed in H4.
Table 8.
Predicted risk probabilities under alternative scenarios.
To examine whether the scenario simulation results are sensitive to the magnitude of parameter perturbations, a robustness check is conducted by scaling all scenario shocks at three intensity levels: 0.5× (low intensity), 1.0× (baseline intensity), and 1.5× (high intensity). The corresponding sensitivity results are reported in Table 9. This design allows us to evaluate whether the predicted risk dynamics remain structurally consistent under alternative stress assumptions.
Table 9.
Scenario sensitivity results.
The sensitivity results indicate that the qualitative direction of risk response remains stable across low, baseline and high shock intensities. BYD remains in the low-risk region with only bounded upward movement, whereas NIO remains in the high-risk region under all intensity settings. This suggests that the asymmetric resilience pattern is not solely driven by the benchmark parameter choice.
6.3. Visualisation of the Asymmetric Resilience Pattern
Figure 4 provides a graphical comparison of the two firms across the scenarios. The vertical axis is logarithmic to accommodate the substantial difference in baseline probabilities while preserving the visibility of marginal changes. The threshold for high-risk classification appears as a dashed reference line, and the asymmetry between the cumulative shifts that BYD experiences and the near-flat trajectory that NIO traces is immediately apparent.
Figure 4.
Asymmetric resilience of BYD and NIO across competitive scenarios.
6.4. Mechanism Interpretation
The buffering capacity exhibited by BYD reflects three reinforcing structural features. The first is a profitability cushion that provides headroom for absorbing margin compression. The second is operational efficiency that limits the magnitude of any single inventory or capacity adjustment required in response to demand surprises. The third is cash-flow generation that funds the research and development pipeline internally rather than through additional external financing. The lock-in feature exhibited by NIO is the mirror image of this pattern. The absence of a profitability cushion means that any further margin compression converts directly into a deepening operating loss. Operational efficiency that lags behind the peer group means that downward demand revisions amplify rather than dampen the consequences of the original shock. Cash-flow generation that has been chronically negative implies that research and development continuation requires either external financing or balance sheet contraction, both of which carry implications for risk perception that further reinforce the high-risk classification.
The asymmetric resilience pattern has direct managerial implications. For low-risk firms, the dominant early warning question is not whether the firm has crossed into the high-risk region but whether the marginal probability is creeping upward at a rate that, if extrapolated, would eventually breach the threshold. Effective monitoring, therefore, focuses on the trend of the predicted probability and on the leading indicators identified by the Shapley attribution rather than on the binary classification. For high-risk firms, the dominant question is whether the structural drivers of the high baseline can be addressed through coordinated interventions across profitability, cash flow and asset efficiency. Marginal interventions that act on any single dimension are unlikely to dislodge the lock-in, and management attention should therefore concentrate on integrated restructuring rather than on incremental optimisation.
6.5. Distribution of In-Sample Risk Probabilities
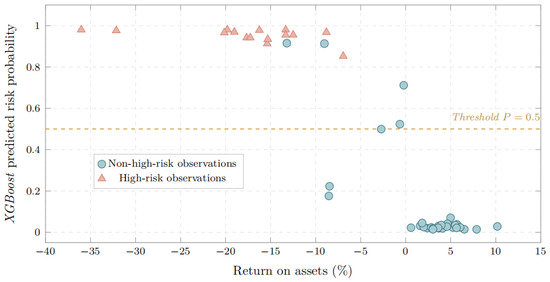
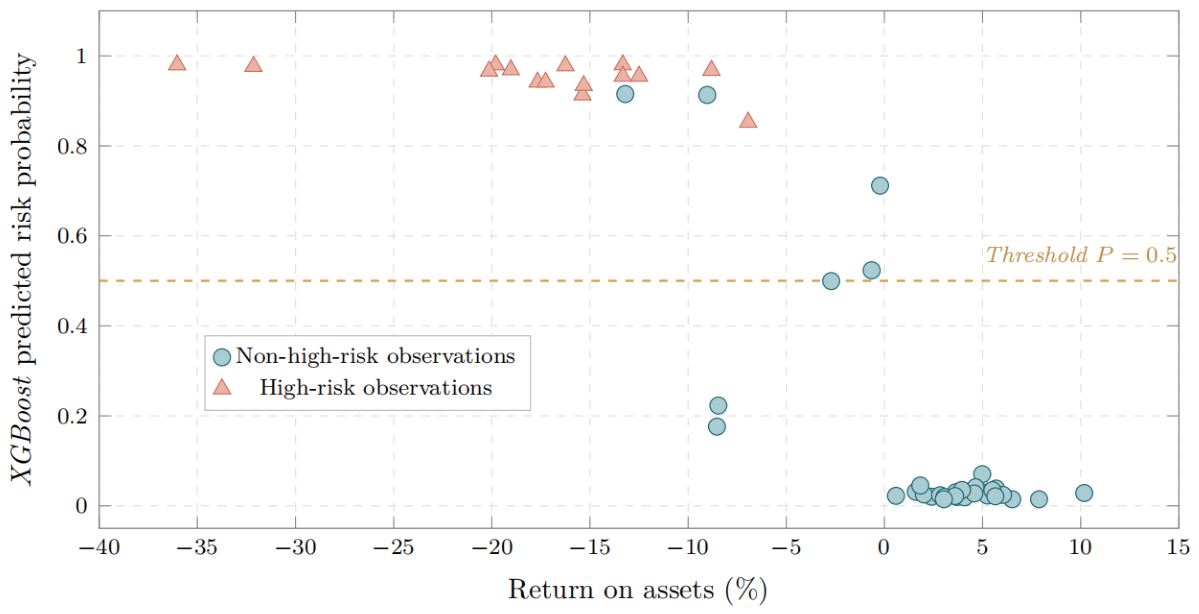
To complement the firm-level analysis, Figure 5 plots the in-sample predicted risk probabilities for all forty-eight observations against their corresponding return on assets values. The plot reveals a sharply bimodal distribution: the majority of observations either cluster near zero predicted probability with positive or near-zero return on assets, or cluster near unit predicted probability with strongly negative return on assets. The bimodality is consistent with the structural risk hypothesis and indicates that the model has learned a sharp separator between the two risk regimes. The relatively sparse intermediate region also explains why the test-set classification is sensitive to threshold choice, since the small number of observations near the decision boundary makes the boundary itself less stable than the regions away from it.
Figure 5.
In-sample predicted risk probabilities plotted against return on assets.
6.6. External Validity and Boundary Conditions
The external validity of the findings should be interpreted with caution. The empirical sample consists of listed Chinese NEV manufacturers operating in a specific institutional and competitive environment characterised by rapid market expansion, policy support, intense domestic price competition and heterogeneous access to capital markets. Therefore, the estimated probabilities, threshold choices and firm-level classifications should not be mechanically transferred to international markets.
However, the mechanism-level insights are more general. Profitability compression, cash-flow deterioration, asset-utilisation pressure and sustained R&D intensity are likely to be relevant risk-transmission channels in other NEV markets as well, although their magnitudes may differ under alternative subsidy regimes, market structures, accounting standards and financing conditions. Future research can extend the framework to international samples by recalibrating the state vector, risk labels and scenario parameters to local institutional and market conditions.
7. Conclusions
This paper has developed and tested a four-layer interpretable financial early warning framework for Chinese NEV automakers operating under the conditions of the anti-involution process. The framework integrates a digital twin-inspired state representation that combines financial, operational and external competition variables, a predictive layer that pairs a logistic baseline with a gradient boosted main model, an interpretation layer based on Shapley additive explanations and a scenario simulation layer that quantifies the marginal response of predicted risk to identifiable competitive shocks. The empirical analysis based on forty-eight enterprise-year observations from 2021 to 2025 yields four conclusions that are consistent with the hypotheses developed in the theoretical section.
The first conclusion is that NEV financial risk is better understood through the joint deterioration of several firm-level conditions than through any single accounting indicator. The label construction adopted in this paper, which requires the joint occurrence of at least two distress conditions, classifies nineteen of forty-eight observations as high risk and assigns the high-risk classification to firms whose risk profile arises from simultaneous weakness in profitability, cash flow, and asset efficiency. This result implies that early warning systems built around individual ratios are likely to underestimate the risk exposure of firms experiencing moderate but concurrent stress across several financial and operational dimensions.
The second conclusion is that the logistic baseline and the gradient boosted main model are complementary rather than substitutable. The logistic baseline delivers superior performance on the time-extrapolation test, recording an accuracy of 0.8333, a precision of 1.0000 and an area under the curve of 0.9688, while the gradient boosted model delivers superior performance on the five-fold cross-validation, recording a recall of 0.8947 and an area under the curve of 0.9782. A risk management infrastructure that deploys both estimators in parallel can therefore extract the benefits of both stability and sensitivity without being forced into a single methodological commitment.
The third conclusion concerns the variables that drive risk identification. The Shapley attribution identifies the return on assets as the dominant predictor with a mean absolute contribution of 2.1938, followed by research and development intensity at 0.6091, the operating cash-flow ratio at 0.3258, the fixed asset turnover at 0.2176, the current ratio at 0.1986 and the inventory turnover days at 0.1271. The attribution is consistent with the transmission mechanisms developed in the theoretical section and demonstrates that the predictive signal flows primarily through the channels that link competitive intensity to profitability, cash generation and capacity utilisation.
The fourth conclusion is that the resilience of firms to competitive shocks is asymmetric. The scenario simulation reveals that BYD, which enters the simulation with a baseline predicted probability of 0.0383, exhibits a buffering capacity that allows it to absorb the compounded pressure scenario with a final predicted probability of 0.0683, comfortably below the high-risk threshold. NIO, which enters the simulation with a baseline predicted probability of 0.9663, exhibits a lock-in pattern in which the same compounded pressure raises the predicted probability only marginally to 0.9692, indicating that the firm cannot be moved out of the high-risk region by interventions along the dimensions captured by the scenario design. The asymmetry implies that the meaning of resilience is conditional on the position from which the firm starts and that early warning systems should report not only the current probability and the marginal sensitivity to shocks but also the structural feasibility of escape from any high-risk region in which the firm currently sits.
Several policy and managerial implications follow. For firms in the low-risk region, the priority is to monitor the trajectory of the predicted probability over time and to identify any sustained accumulation of marginal increases before they translate into a threshold crossing. For firms in the high-risk region, the priority is to recognise that incremental optimisation is unlikely to dislodge the lock-in and that coordinated interventions across profitability, cash generation, asset efficiency and research and development productivity are required. For the industry as a whole, the analysis reinforces the case for moving competition away from price-led engagements toward differentiation through technology, service and brand value, since the price-led configuration accelerates the polarisation between firms that can withstand sustained margin compression and firms that cannot.
The study has limitations that suggest avenues for future work. The sample of forty-eight observations is sufficient for studying relative risk differences and identifying dominant driver variables within the industry but is too small to support claims of universal predictive accuracy. Future research could extend the sample to include suppliers and downstream service providers, lengthen the time series as additional years of data become available and incorporate higher-frequency operational data such as monthly delivery volumes or order book information that disclosure conventions are beginning to make available. The proxy treatment of operational variables, in which fixed asset turnover stands in for capacity utilisation and inventory days stand in for delivery efficiency, could be refined when more granular operational disclosures become standard. The scenario design adopted here treats shocks as deterministic perturbations of state variables, and future work could embed the simulation in a stochastic framework that quantifies the joint distribution of outcomes under uncertainty. Finally, the integration of the early warning framework with the adjacent literature on green finance, carbon market decision-making and policy-induced pressure on corporate behaviour offers a promising direction for extending the analysis from the boundaries of the firm to the broader sustainability transition in which NEV automakers operate. For example, future studies may link firm-level financial early warning with green bond issuance, ESG performance improvement and optimal carbon emission rights purchasing decisions [26,27,29].
Author Contributions
Conceptualisation, J.X.; methodology, J.X.; software, R.Y.; validation, J.X., R.Y. and J.L.; formal analysis, J.X.; investigation, J.X. and J.L.; resources, Y.L.; data curation, R.Y. and J.L.; writing—original draft preparation, J.X.; writing—review and editing, J.X. and Y.L.; visualisation, R.Y.; supervision, Y.L.; project administration, J.X. and Y.L.; funding acquisition, Y.L. All authors have read and agreed to the published version of the manuscript.
Funding
This work was mainly supported by the grant from Major Programme of National Fund of Philosophy and Social Science of China (22&ZD136), Special Science and Technology Innovation Programme for Carbon Peak and Carbon Neutralisation of Jiangsu Province (BE2022610), National Social Science Fund in Later Stage (22FGLB030), the Innovation and Entrepreneurship Training Programme for College Students of Jiangsu University (X2025102990344), and the Scientific Research Foundation Projects of Jiangsu University (24C080, 25C013). The APC was funded by J.X.
Institutional Review Board Statement
Not applicable.
Informed Consent Statement
Not applicable.
Data Availability Statement
The data used in this study were collected from publicly available annual reports, corporate disclosures, and industry statistical sources. The processed dataset used in the empirical analysis is presented in Table A1, while the variable definitions, measurement rules, and data sources are provided in Table A2. Additional data and code are available from the corresponding author upon reasonable request.
Acknowledgments
The authors would like to thank the editors and anonymous reviewers for their valuable comments and suggestions. During the preparation of this manuscript, the authors used ChatGPT with the GPT-5.5 Thinking model, developed by OpenAI, solely for language translation and English-language editing. The authors have reviewed and edited the output and take full responsibility for the content of this publication.
Conflicts of Interest
The authors declare no conflicts of interest.
Appendix A. Sample Modelling Dataset
Table A1 reproduces the enterprise-year observations used in the modelling. The table reports the firm identifier, the state year t, the label year t + 1, the risk label Y, and the twelve state variables that enter the digital twin representation. To preserve readability, the table is presented in compact form with two-decimal precision for variables that range over wide intervals.
Table A1.
Modelling sample of forty-eight enterprise-year observations.
Appendix B. Data Sources and Variable Definitions
Industry sales growth is taken from the published annual statistics of the China Association of Automobile Manufacturers and equals 157.5 percent for 2021, 93.4 percent for 2022, 37.9 percent for 2023 and 35.5 percent for 2024. The sample HHI takes the values 0.3015 for 2021, 0.2329 for 2022, 0.2041 for 2023 and 0.1786 for 2024. The price competition dummy takes the value zero for 2021 and 2022 and the value one for 2023 and 2024, in accordance with publicly documented price reduction events initiated by leading manufacturers in early 2023 and continued through 2024. All firm-level financial variables are derived from audited annual reports, with the capital expenditure growth rate computed as the year-on-year percentage change in cash paid for the acquisition of fixed assets, intangible assets and other long-term assets, the operating cash-flow ratio computed as the ratio of net cash flow from operating activities to revenue, and the inventory turnover days computed as the average inventory balance multiplied by three hundred and sixty and divided by the cost of goods sold.
Table A2.
Variable definitions, measurement, and data sources.
Appendix C. Scenario Construction
The mild price war scenario applies ΔGPM = −2, ΔROA = −1 and ΔOCF = −1, measured in percentage points. The strong price war scenario doubles these magnitudes, and the extreme price war scenario triples them. The cost shock scenario applies ΔGPM = −1 and ΔINV = +5 days. The research and development overload scenario applies ΔRD = +2 and ΔROA = −1, both in percentage points. The demand slowdown scenario applies ΔGROWTH = −5 and ΔFAT = −0.3. Δ denotes the scenario-induced change in the corresponding variable. GPM denotes gross margin, ROA denotes return on assets, OCF denotes the operating cash-flow ratio, INV denotes inventory turnover days, RD denotes R&D intensity, GROWTH denotes industry sales growth, and FAT denotes fixed asset turnover. The compounded pressure scenario superimposes the strong price war, the cost shock, the research and development overload and the demand slowdown simultaneously. In each scenario, the predicted probability is computed by passing the perturbed state vector through the gradient boosted model trained on the unperturbed sample, with all other variables held at their observed values.
References
- Nguyen-Tien, V.; Zhang, C.; Strobl, E.; Elliott, R.J. The closing longevity gap between battery electric vehicles and internal combustion vehicles in Great Britain. Nat. Energy 2025, 10, 354–364. [Google Scholar] [CrossRef] [Scilit] [PubMed]
- Nunes, A.; Woodley, L.; Rossetti, P. Re-thinking procurement incentives for electric vehicles to achieve net-zero emissions. Nat. Sustain. 2022, 5, 527–532. [Google Scholar] [CrossRef] [Scilit]
- Qiu, Y.; Deng, N.; Wang, B.; Shen, X.; Wang, Z.; Hultman, N.; Shi, H.; Liu, J.; Wang, Y.D. Power supply disruptions deter electric vehicle adoption in cities in China. Nat. Commun. 2024, 15, 6041. [Google Scholar] [CrossRef] [Scilit] [PubMed]
- Beaver, W.H. Financial ratios as predictors of failure. J. Account. Res. 1966, 4, 71–111. [Google Scholar] [CrossRef] [Scilit]
- Altman, E.I. Financial ratios, discriminant analysis and the prediction of corporate bankruptcy. J. Financ. 1968, 23, 589–609. [Google Scholar] [CrossRef]
- Ohlson, J.A. Financial ratios and the probabilistic prediction of bankruptcy. J. Account. Res. 1980, 18, 109–131. [Google Scholar] [CrossRef] [Scilit]
- Lin, W.-Y.; Hu, Y.-H.; Tsai, C.-F. Machine learning in financial crisis prediction: A survey. IEEE Trans. Syst. Man Cybern. Part C (Appl. Rev.) 2011, 42, 421–436. [Google Scholar] [CrossRef] [Scilit]
- Chen, T.; Guestrin, C. Xgboost: A scalable tree boosting system. In Proceedings of the 22nd ACM Sigkdd International Conference on Knowledge Discovery and Data Mining; ACM: New York, NY, USA, 2016; pp. 785–794. [Google Scholar]
- Ben Jabeur, S.; Stef, N.; Carmona, P. Bankruptcy prediction using the XGBoost algorithm and variable importance feature engineering. Comput. Econ. 2023, 61, 715–741. [Google Scholar] [CrossRef] [Scilit]
- Nguyen, H.H.; Viviani, J.-L.; Ben Jabeur, S. Bankruptcy prediction using machine learning and Shapley additive explanations. Rev. Quant. Financ. Account. 2025, 65, 107–148. [Google Scholar] [CrossRef] [Scilit]
- Lundberg, S.M.; Lee, S.-I. A unified approach to interpreting model predictions. Adv. Neural Inf. Process. Syst. 2017, 30, 4768–4777. [Google Scholar]
- Černevičienė, J.; Kabašinskas, A. Explainable artificial intelligence (XAI) in finance: A systematic literature review. Artif. Intell. Rev. 2024, 57, 216. [Google Scholar] [CrossRef] [Scilit]
- Tao, F.; Zhang, H.; Zhang, C. Advancements and challenges of digital twins in industry. Nat. Comput. Sci. 2024, 4, 169–177. [Google Scholar] [CrossRef] [Scilit] [PubMed]
- Niederer, S.A.; Sacks, M.S.; Girolami, M.; Willcox, K. Scaling digital twins from the artisanal to the industrial. Nat. Comput. Sci. 2021, 1, 313–320. [Google Scholar] [CrossRef] [Scilit] [PubMed]
- Willcox, K.; Segundo, B. The role of computational science in digital twins. Nat. Comput. Sci. 2024, 4, 147–149. [Google Scholar] [CrossRef] [Scilit] [PubMed]
- Tirole, J. The Theory of Industrial Organization; MIT Press: Cambridge, MA, USA, 1988. [Google Scholar]
- Ericson, R.; Pakes, A. Markov-perfect industry dynamics: A framework for empirical work. Rev. Econ. Stud. 1995, 62, 53–82. [Google Scholar] [CrossRef] [Scilit]
- Berry, S.; Levinsohn, J.; Pakes, A. Automobile Prices in Market Equilibrium. Econometrica 1995, 63, 841–890. [Google Scholar] [CrossRef] [Scilit]
- Aghion, P.; Bloom, N.; Blundell, R.; Griffith, R.; Howitt, P. Competition and innovation: An inverted-U relationship. Q. J. Econ. 2005, 120, 701–728. [Google Scholar] [CrossRef] [Scilit]
- Yu, Y.; Cheng, L.; Zhang, D. How does market competition affect enterprise cooperative innovation? The moderating role of intellectual property protection and government subsidies. Technovation 2024, 137, 103102. [Google Scholar] [CrossRef] [Scilit]
- He, C.; Huang, Q.; Li, X.; Zuo, R.; Liu, F.; Wei, Y.; Wu, J. Involution-cooperation-lying flat game on a network-structured population in the group competition. IEEE Trans. Comput. Soc. Syst. 2023, 11, 2160–2178. [Google Scholar] [CrossRef] [Scilit]
- Zhu, C.; Wang, T. New Firm entry and ESG performance: An inverted-U curve from spillovers to involution. Int. Rev. Econ. Financ. 2025, 104, 104709. [Google Scholar] [CrossRef] [Scilit]
- Wang, Z.; Li, X.; Xue, X.; Liu, Y. More government subsidies, more green innovation? The evidence from Chinese new energy vehicle enterprises. Renew. Energy 2022, 197, 11–21. [Google Scholar] [CrossRef] [Scilit]
- Qi, X.; Guo, Y.; Guo, P.; Yao, X.; Liu, X. Do subsidies and R&D investment boost energy transition performance? Evidence from Chinese renewable energy firms. Energy Policy 2022, 164, 112909. [Google Scholar] [CrossRef] [Scilit]
- Saravade, V.; Weber, O.; Vitalis, A. To label or not? A choice experiment testing whether labelled green bonds matter to retail investors. Humanit. Soc. Sci. Commun. 2025, 12, 82. [Google Scholar] [CrossRef] [Scilit]
- Zhou, D.; Kythreotis, A. Why issue green bonds? Examining their dual impact on environmental protection and economic benefits. Humanit. Soc. Sci. Commun. 2024, 11, 1761. [Google Scholar] [CrossRef] [Scilit]
- Chen, J.; Yang, Y.; Liu, R.; Geng, Y.; Ren, X. Green bond issuance and corporate ESG performance: The perspective of internal attention and external supervision. Humanit. Soc. Sci. Commun. 2023, 10, 437. [Google Scholar] [CrossRef] [Scilit]
- Liu, Y.; Tian, L.; Zou, B.; Zhao, P.; Gan, C. Multi-source carbon emission monitoring and certification for carbon-neutral industrial parks. J. Clean. Prod. 2026, 570, 148612. [Google Scholar] [CrossRef] [Scilit]
- Liu, Y.; Sun, H.; Meng, B.; Jin, S.; Chen, B. How to purchase carbon emission right optimally for energy-consuming enterprises? Analysis based on optimal stopping model. Energy Econ. 2023, 124, 106758. [Google Scholar] [CrossRef] [Scilit]

Disclaimer/Publisher’s Note: The statements, opinions and data contained in all publications are solely those of the individual author(s) and contributor(s) and not of MDPI and/or the editor(s). MDPI and/or the editor(s) disclaim responsibility for any injury to people or property resulting from any ideas, methods, instructions or products referred to in the content. |
© 2026 by the authors. Licensee MDPI, Basel, Switzerland. This article is an open access article distributed under the terms and conditions of the Creative Commons Attribution (CC BY) license.