


Abstract
Growing interest in sustainable urban mobility has intensified research into the factors shaping the adoption of smart bicycle technologies, yet cross-national comparative evidence remains scarce. This study examines user perceptions, mobility habits and willingness to adopt innovative e-bike technologies in Italy and Poland through a structured questionnaire grounded in the Bicycle Smartness Level (BSL) framework. Descriptive statistics and inferential tests were applied to identify exploratory differences between the two survey samples across mobility behavior, perceived barriers, technology utility and willingness to pay. Results reveal that, in these samples, Italian respondents display stronger car dependency and rate safety-related cycling barriers (traffic hazards, lack of infrastructure and road user insecurity) significantly higher than Polish respondents do. In contrast, respondents in the Polish sample attribute significantly greater utility to comfort and performance-oriented smart technologies such as monitoring systems and adaptive gear shifting. In both samples, willingness to pay a price premium converges in the €0–200 range and navigation and safety technologies are universally valued. These descriptive and exploratory findings suggest that smart cycling adoption pathways may differ across contexts: in the Italian sample, perceived road safety and infrastructure gaps appear to be central barriers, whereas in the Polish sample affordability emerges as a particularly relevant condition for adoption, with implications for policy aligned with Sustainable Development Goal (SDG) 11 and the EU Declaration on Cycling.
1. Introduction
Cycling is increasingly promoted across Europe as a pillar of sustainable urban mobility, contributing to reduced greenhouse gas emissions, improved public health, and lower urban congestion [1,2]. The focus on sustainable cycling aims to achieve SDG 11 “Sustainable Cities and Communities” of the United Nations 2030 Agenda [3], which aims to achieve safe, accessible, and sustainable transport (Target 11.2), reduction of urban environmental impacts (Target 11.6), and inclusiveness and accessibility. The European Union has formalized this ambition through the EU Declaration on Cycling [4], that recognizes the bicycle as a mode of transport in its own right and calls for safe and continuous infrastructure, integration with public transport, inclusion and accessibility, and its Road Safety Policy Framework 2021–2030, which commits to halving road deaths and serious injuries by 2030 in line with Vision Zero [5]. Yet despite these policy commitments, cyclists remain among the most vulnerable road users: in 2024, 1926 cyclists were killed on EU roads, and the number of cyclist deaths decreased by only 8% over the decade 2014–2024, compared to a 31% reduction for pedestrians and 19% for vehicle occupants over the same period [5]. Serious injuries among cyclists increased by 12% over the same period, compounding concerns about the safety implications of growing cycling activity [5]. These trends underscore a fundamental tension: as governments actively encourage modal shift towards cycling for environmental and health reasons, the structural conditions required to make cycling safe have not kept pace.
The rapid diffusion of electric bicycles (e-bikes) has intensified this challenge. E-bike sales in the EU grew from approximately 588,000 units in 2010 to over 4.5 million in 2020 [5], and 5.1 million in 2023 [6], and deaths among e-bike users have increased in all countries that distinguish between bicycle types, while deaths among conventional bicycle users have generally declined [5]. E-bikes are disproportionately popular among older riders, a group already overrepresented in cyclist fatalities (i.e., people aged 65 and over account for half of all cyclist deaths in the EU [5]), raising further questions about the intersection of technology adoption, physical vulnerability, and road safety.
In parallel with these trends, the cycling sector is experiencing a wave of technological innovation. The Bicycle Smartness Level (BSL) framework, proposed by Kapousizis et al. [7], classifies bicycles into six levels of smartness, from traditional models (BSL 0) to fully connected, infrastructure-integrated intelligent systems (BSL 5), drawing on the automation levels defined by SAE for autonomous vehicles [8] and on the smartness dimensions proposed by Alter [9]. Technologies covering these levels include GPS navigation and route planning, incident detection and emergency notification, anti-collision sensors, monitoring systems, intelligent driver assistance and adaptive cruise control, and Bike-to-Everything (B2X) communication systems. While these innovations hold potential to enhance both safety and comfort, their adoption is far from uniform: awareness, perceived utility, and willingness to pay vary considerably across user groups and national contexts [10,11,12,13,14].
Smart cycling mobility can be seen as a strategic intersection between digital innovation and sustainable urban mobility. It would therefore become a key factor in achieving SDG 11 and aligning local urban transformations with the European Green Deal and the EU Strategy for Sustainable and Smart Mobility. The smart cycling mobility can be a key factor in the pursuit of sustainable mobility, given that the transport sector is still a major source of emissions, and ‘soft’ solutions (active mobility) are needed alongside electrification.
Understanding the factors that shape user acceptance of smart cycling technologies is, therefore, a pressing research priority. The Technology Acceptance Model (TAM) identifies perceived usefulness and perceived ease of use as key determinants of technology acceptance. Later extensions of technology acceptance theory, including UTAUT2, further emphasize the role of hedonic motivation, price value, habit, and user experience in shaping behavioral intention [15,16]. Applied to cycling, these dimensions intersect with infrastructural realities, mobility habits, and cultural attitudes toward road safety. Bikeability, defined as the extent to which an urban environment supports cycling as a viable, attractive, and safe mode of transport, emerges from the interaction among network structure, environmental quality, and the subjective perceptions of potential users [16]. Recent work integrating GIS-based spatial analysis with survey-based perception data in the Mediterranean context of Catania confirms that safety-related concerns, inadequate infrastructure, and the mismatch between planned and experienced cycling conditions are the primary obstacles to cycling adoption in high-motorization cities [17]. These findings reinforce the broader evidence that perceived safety, rather than infrastructure provision alone, is the dominant determinant of cycling behavior [18,19].
This perspective is further supported by recent research on subjectively safe cycling infrastructure, which shows that perceptions of safety strongly influence cycling choices and can guide urban design aimed at increasing active travel [20]. These studies point to the need for analyses that simultaneously capture objective conditions and user attitudes.
Comparative evidence on the acceptance of smart cycling technology remains limited, particularly regarding how perceived safety, cycling habits, and cost sensitivity interact across different European mobility contexts [21,22]. Most existing studies focus on single national contexts or generic active-travel populations rather than on the specific profiles of current and potential e-bike users [23,24]. These cross-country studies on smart e-bike acceptance have shown that behavioral intention is shaped by perceived usefulness, perceived safety, and country-specific factors, confirming that technology adoption must be interpreted in light of the surrounding mobility culture and infrastructure conditions. However, direct comparative evidence focusing simultaneously on mobility habits, perceived barriers, perceived usefulness of smart bicycle technologies, and willingness to pay remains scarce.
This study addresses that gap through an explorative comparative empirical analysis of user perceptions, mobility habits, and willingness to adopt smart bicycle technologies in Italy and Poland, two EU member states sharing a common European policy framework but differing markedly in cycling culture, infrastructure provision and road safety outcomes.
Italy records 60% of cyclist deaths from car collisions, among the highest in the EU, and has a national target to reduce cyclist deaths by 45% by 2030 compared to 2019 [5]. Poland, by contrast, achieved a 6% average annual reduction in cyclist deaths between 2014 and 2024 [5] and exhibits higher rates of daily cycling and bicycle ownership. These differences make the two countries a particularly revealing comparative case for examining how national context shapes technology acceptance.
The data were collected using a validated structured questionnaire grounded in the BSL framework and analyzed using descriptive statistics and inferential tests. The study investigates three research questions: (i) whether mobility habits and cycling barriers differ between the Italian and Polish samples; (ii) whether perceived usefulness of smart bicycle technologies varies across the two contexts; and (iii) whether willingness to pay represents a relevant constraint for the adoption of smart-equipped bicycles.
2. Materials and Methods
2.1. Theoretical Framework
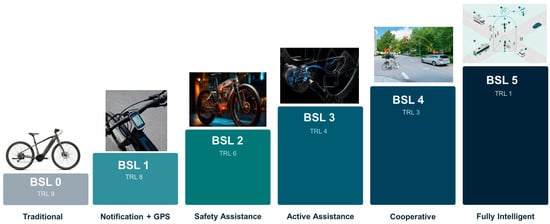
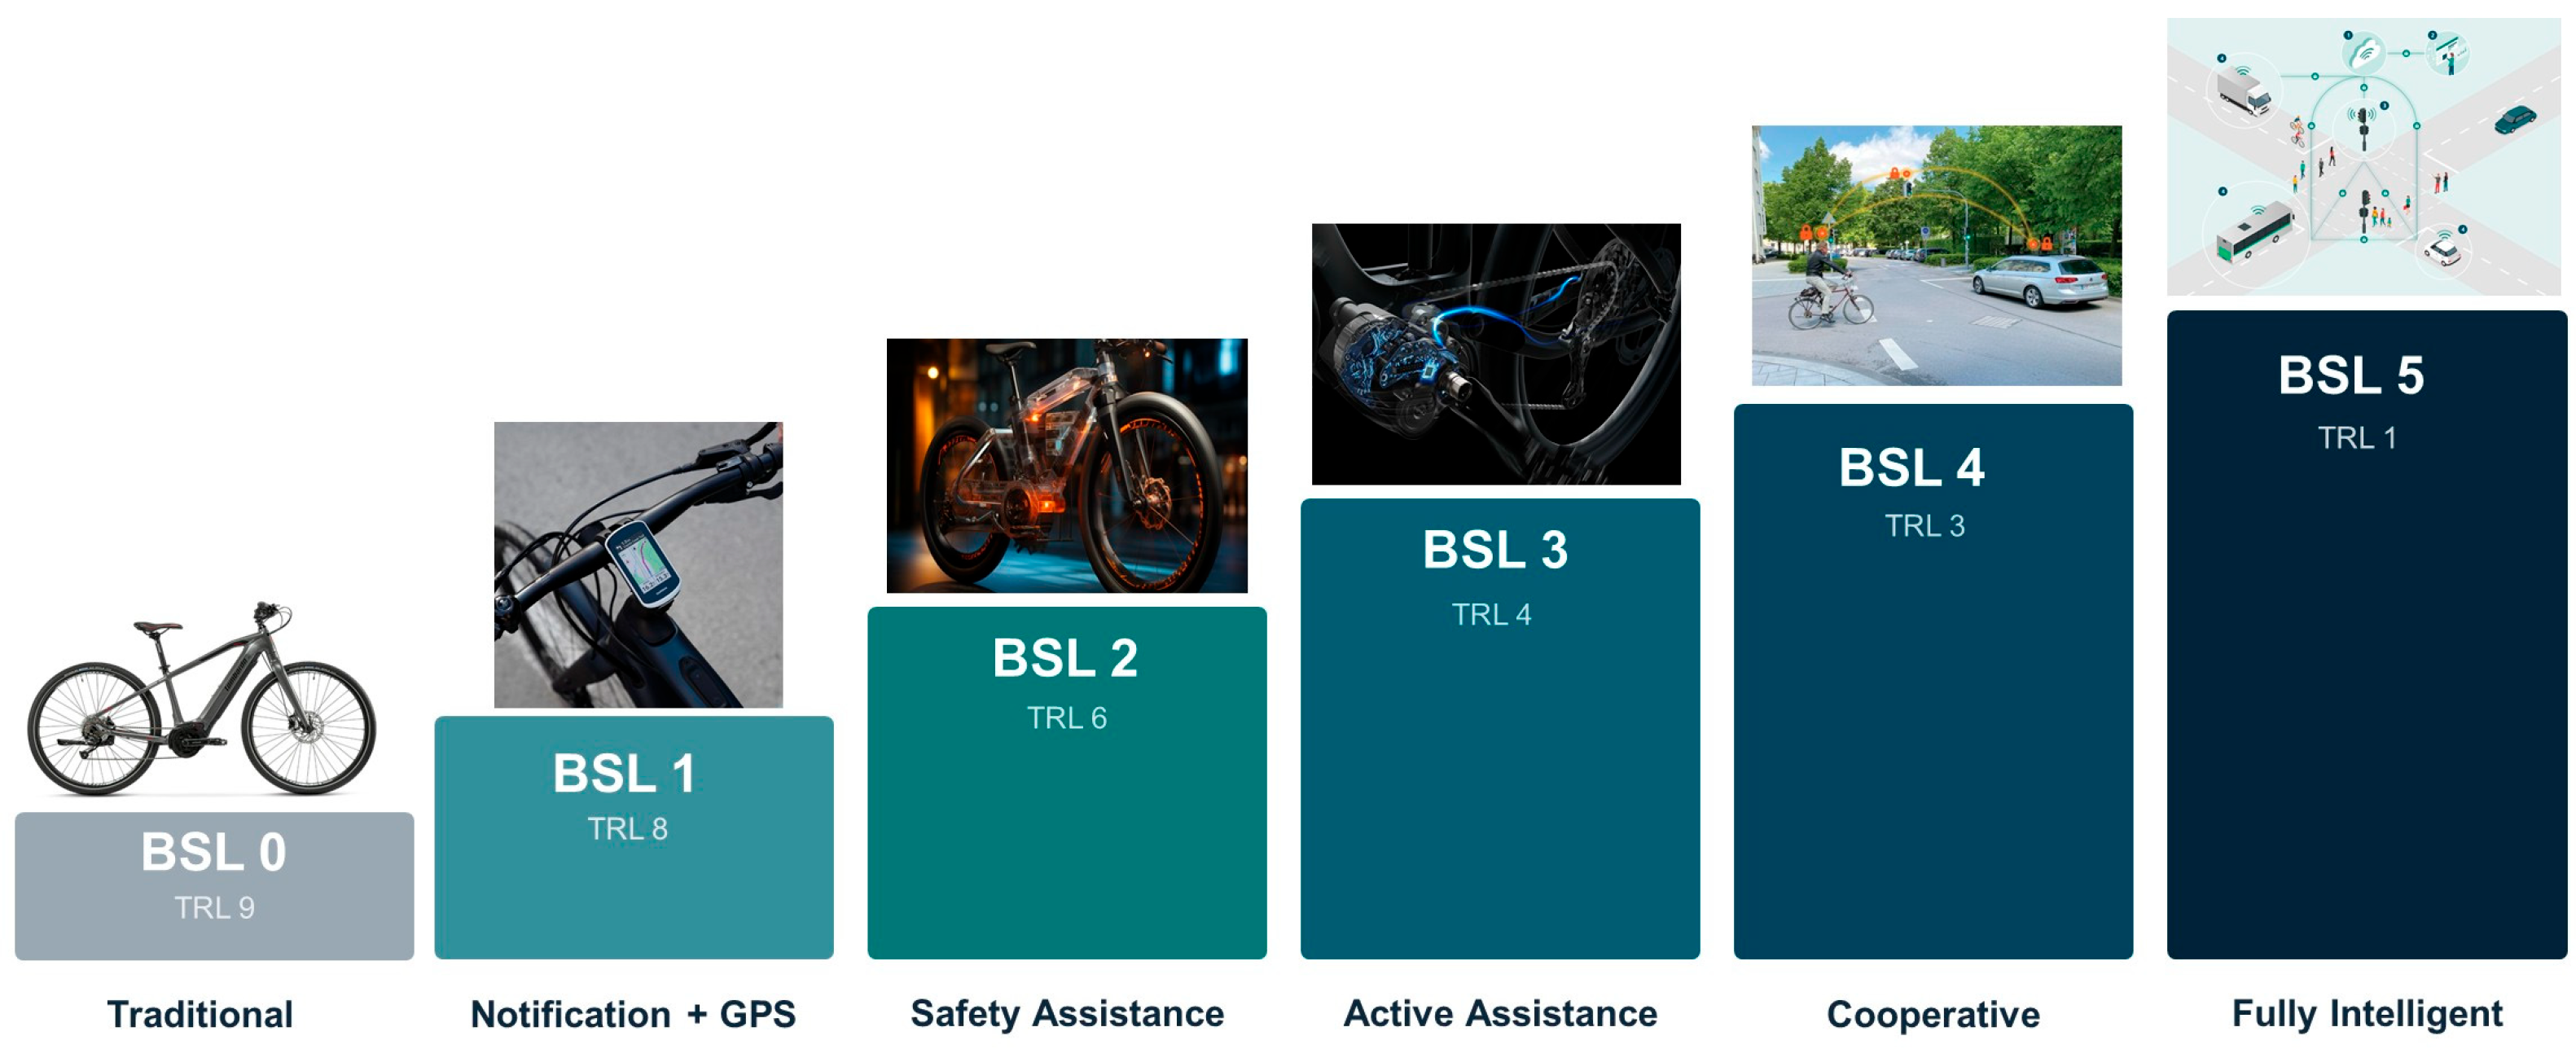
The survey instrument and the analytical interpretation of results are grounded in the Bicycle Smartness Level (BSL) framework developed by Kapousizis et al. [7], which classifies bicycles into six levels of technological sophistication, from BSL 0 (traditional bicycles with no technological assistance) to BSL 5 (fully connected intelligent bicycles integrated with urban traffic management systems) (Figure 1).
Figure 1.
Bicycle Smartness Level Framework (our elaboration on [7]).
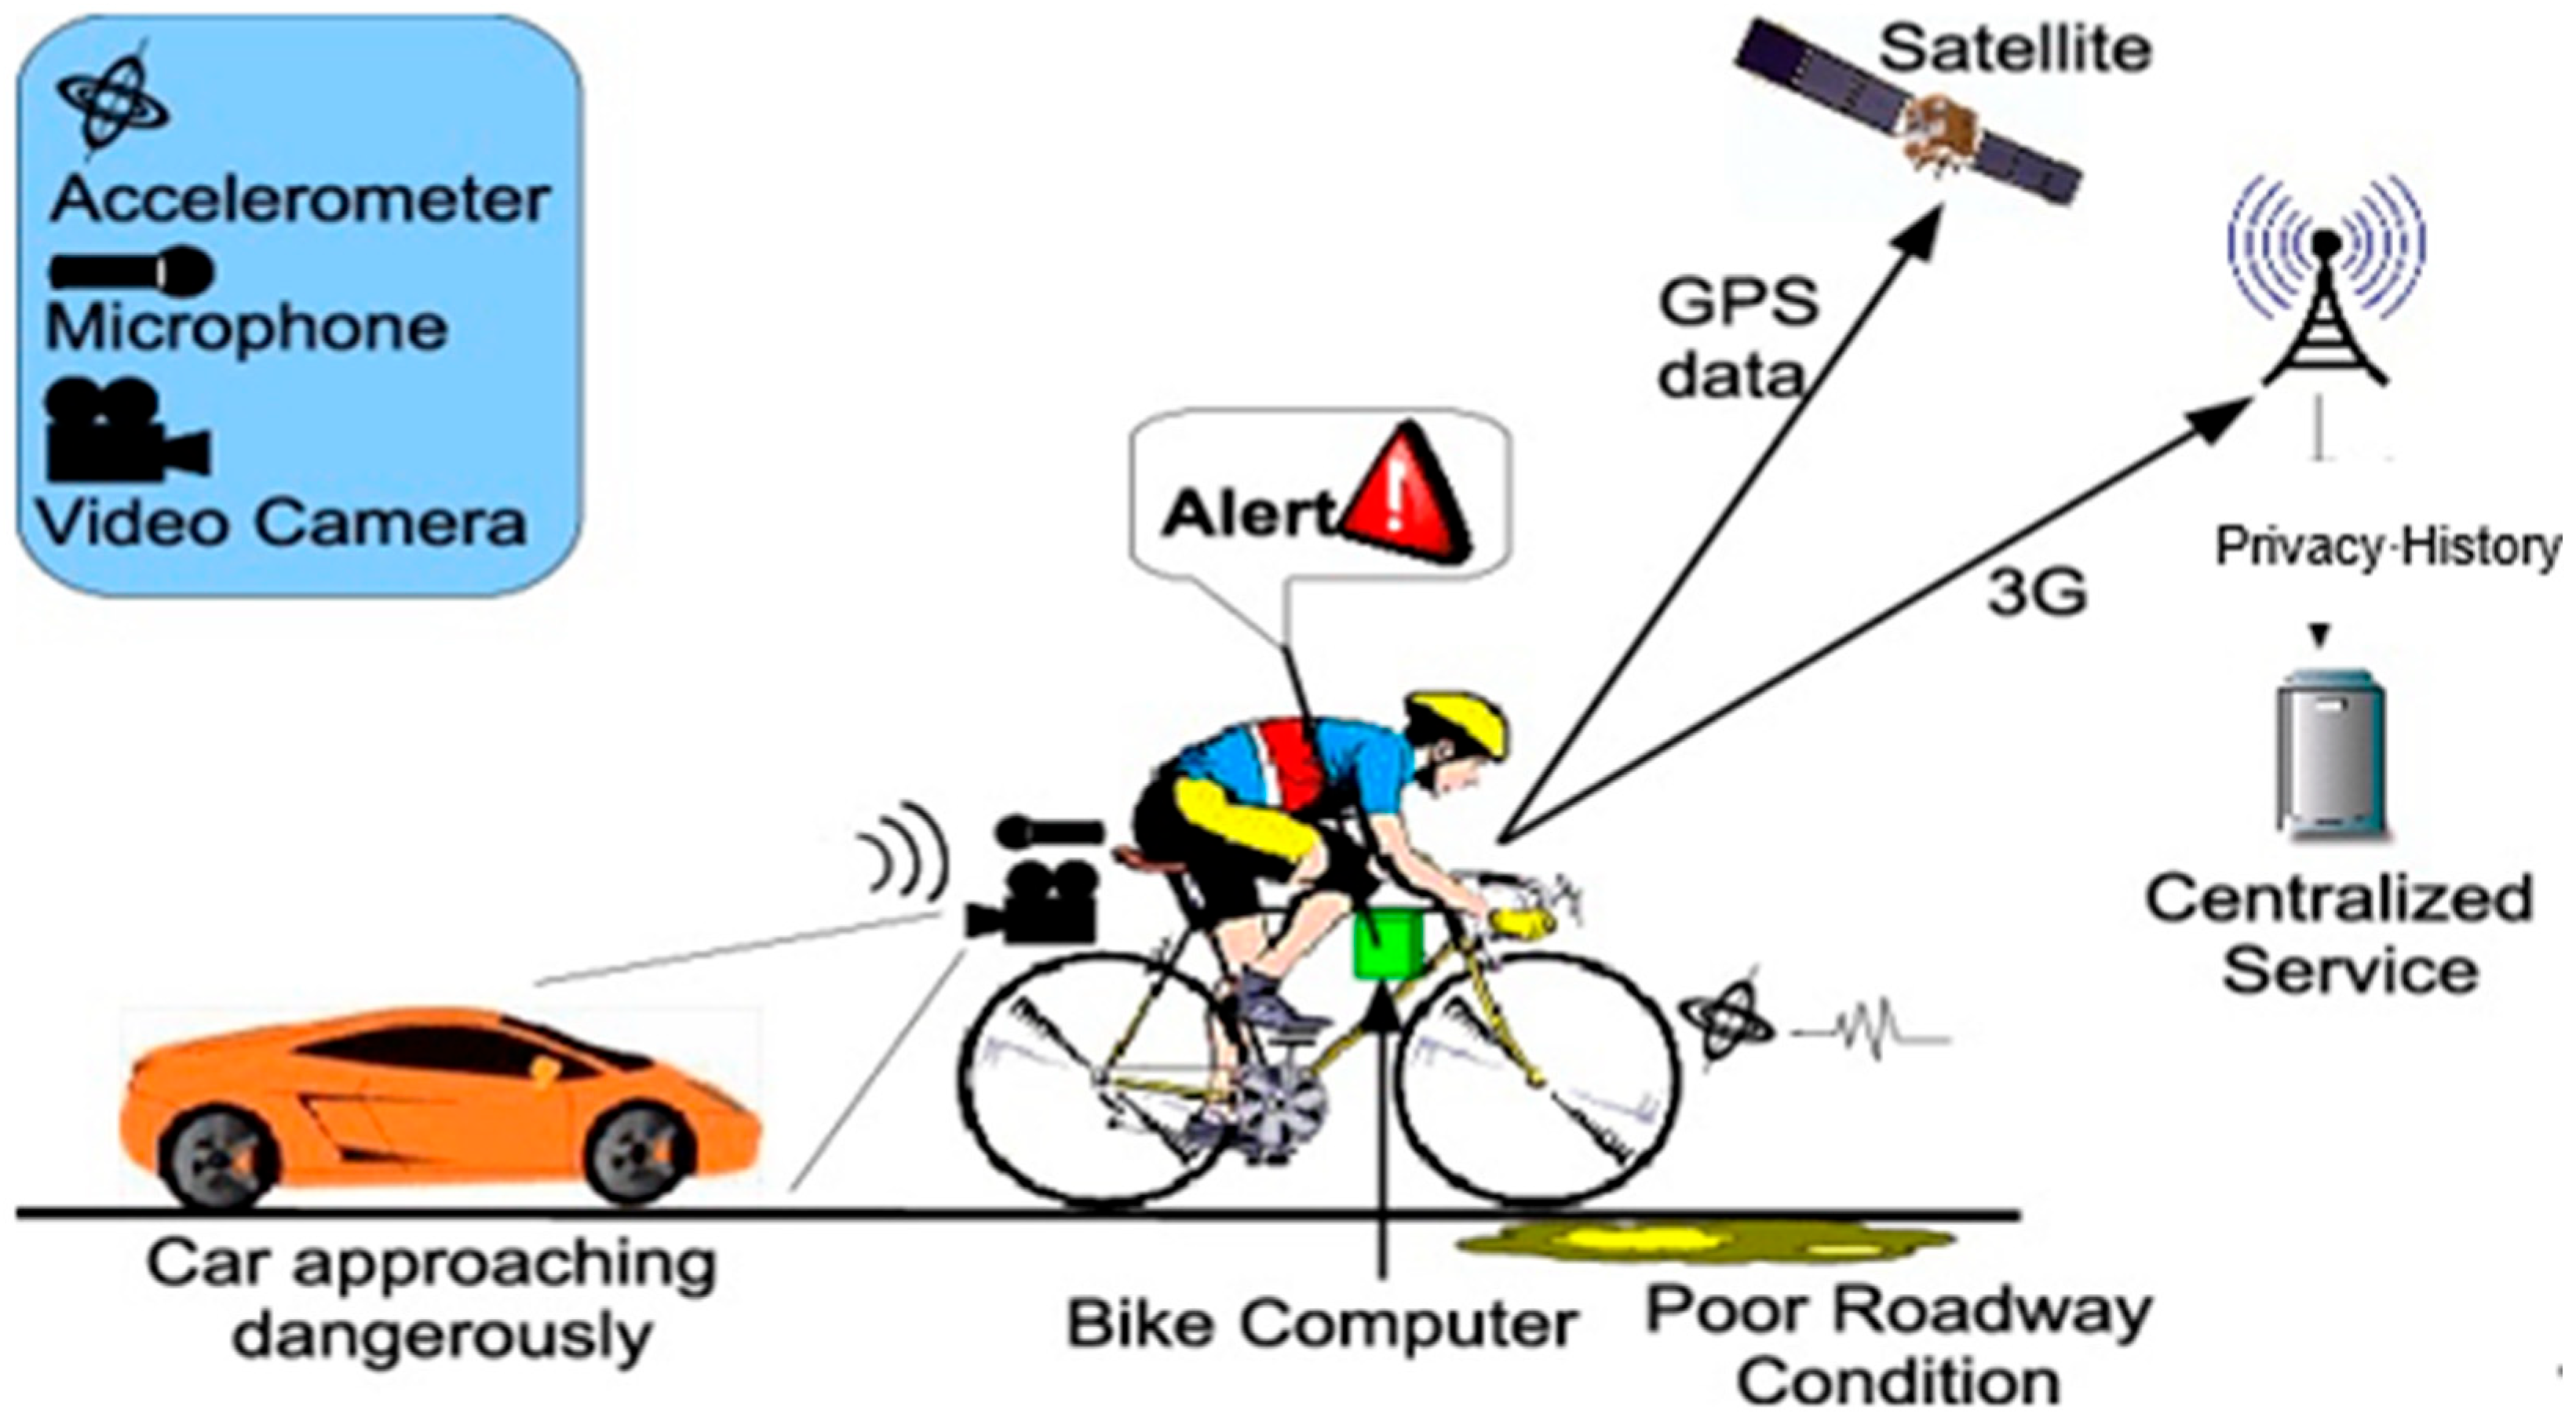
The BSL framework draws on the SAE automation levels for autonomous vehicles [8] and on Alter’s smartness dimensions [9], providing a structured reference for assessing the maturity and user acceptance of specific cycling technologies. For each BSL level, a corresponding Technology Readiness Level (TRL) is identified, ranging from TRL 9 (commercially established) for BSL 0 to TRL 1 (mainly theoretical) for BSL 5. The six technology categories assessed in Question 16 of the questionnaire (navigation systems, incident detection, anti-collision technologies, monitoring systems, intelligent driver assistance, and adaptive gear shifting, Figure 2) span BSL levels 1 through 4 and correspond to technologies at TRL stages ranging from well-established (TRL 8) to prototype (TRL 3).
Figure 2.
Technologies and integrated systems of e-bikes (Source: Author elaboration).
2.2. Research Design and Survey Instrument
This study adopts a cross-national comparative design using a structured, self-administered questionnaire. The survey instrument was originally developed and validated in the context of a prior study on smart cycling technology acceptance conducted in Italy [17] and subsequently administered without modification to a Polish sample by a collaborating research team at the Gdańsk University of Technology. The use of an identical questionnaire in both national contexts ensures the comparability of responses and constitutes the methodological foundation of the cross-national analysis.
The questionnaire was designed to collect data across three thematic domains: (i) travel habits and transport mode preferences; (ii) awareness of and propensity toward technological innovation in cycling; and (iii) socio-demographic characteristics. It comprised 24 items organized into closed-ended questions, Likert-scale rating items, and multiple-choice questions allowing for more than one response. The Likert scales adopted a five-point format ranging from 1 (not at all/useless) to 5 (extremely/essential), consistent with established practice in transport behavior and technology acceptance research [3,11,23,25,26,27].
The questionnaire was structured around three main analytical blocks. The first block (Questions 1–8) investigated vehicle ownership, public transport subscription, sharing mobility use, trip frequency by purpose, modal choice, and main trip distance. The second block (Questions 9–19) examined the factors influencing daily transport mode choice, current bicycle use, barriers to cycling, incentives for greater adoption, awareness of e-bike technologies, perceived usefulness of integrated smart systems, the potential of technology as a cycling incentive, preferred innovative technologies, and willingness to pay a price premium. The third block (Questions 20–24) collected socio-demographic data, including gender, age, place of residence, employment status, and level of education. The full questionnaire structure is consistent with that reported in [17]. Although the two surveys were conducted approximately one year apart (2025 in Italy, 2026 in Poland), the constructs examined (i.e., established mobility habits, structural cycling barriers, and attitudes toward emerging technologies) are slow-moving, and neither country experienced major policy shocks, infrastructural changes, or shifts in e-bike pricing during the intervening period. The temporal offset, due to research constrains, is therefore unlikely to have materially affected the cross-national comparison, though it is explicitly acknowledged as a limitation.
2.3. Data Collection
Given the exploratory nature of the study and the recruitment strategy adopted, the following two samples are intended to provide comparative insights into respondents operating in different mobility contexts and cycling environments in Italy and Poland. Accordingly, the results are interpreted in light of these methodological characteristics, and the findings are discussed as exploratory evidence.
The Italian survey was administered in 2025 via Google Forms and disseminated through multiple channels to ensure a heterogeneous and non-probabilistic sample. Distribution relied on the FIAB Catania network (Italian Federation for the Environment and Cycling), email dissemination, QR code deployment, and word-of-mouth strategies. This approach enabled the collection of a heterogeneous convenience sample, including both cycling-engaged respondents reached through the association network and members of the general public less familiar with cycling as a daily transport mode. Data collection was carried out in full compliance with applicable privacy regulations; participation was voluntary and anonymous. A total of 56 valid responses were obtained.
The Polish survey was administered in 2026 using the same Google Forms instrument, translated from Italian into Polish, by the research team at the Gdańsk University of Technology. Dissemination followed an equivalent multi-channel approach targeting both cycling-engaged populations and the general public. Participation was voluntary and anonymous, in compliance with applicable data protection regulations. A total of 69 valid responses were obtained. The two samples were recruited through different non-probability recruitment channels and should therefore be regarded as exploratory samples drawn from distinct sampling frames. Given the differences in recruitment procedures and the modest sample sizes, neither sample can be considered statistically representative of its respective national urban population. Consequently, any observed between-group differences should be interpreted with caution, as they may reflect characteristics of the specific sampling frames and urban contexts included in the study rather than broader national patterns. The implications of these limitations are examined through the comparability analysis presented in Section 3 and are consistent with the exploratory framing adopted throughout the manuscript.
2.4. Data Analysis
This section presents the comparative findings from two parallel surveys administered in Italy (n = 56) and Poland (n = 69) using the same questionnaire. Accordingly the study’s exploratory design and non-probabilistic sampling approach, the results highlight patterns, differences, and associations emerging from the surveyed groups and provide exploratory evidence on cycling behaviors, perceived barriers, and technology acceptance across the two analyzed national contexts. Data were analyzed using Python 3.11.5 with the SciPy library. Each subsection combines a descriptive account of the frequency distributions with inferential statistical tests to assess the significance of inter-country differences. For ordinal Likert-scale variables, the Mann–Whitney U test (MWU) was applied [28,29], reported alongside the rank-biserial correlation r as effect size (|r| < 0.10 negligible, 0.10–0.29 small, 0.30–0.49 medium, ≥0.50 large). For categorical variables, Pearson chi-square (χ2) was used. The significance threshold is α = 0.05.
Given the exploratory, hypothesis-generating purpose of the study and the limited sample sizes, inferential tests were used to flag candidate inter-country differences rather than to confirm hypotheses, and no formal correction for multiple comparisons was applied. In total, 15 Mann–Whitney U tests (one on weekly cycling frequency, seven on cycling barriers, six on the perceived usefulness of smart technologies, and one on willingness to pay) and seven Pearson chi-square tests (on gender, age, employment, public transport subscription, daily bicycle use, technology awareness, and technology as a cycling incentive) were conducted, supplemented by two Fisher’s exact tests as small-sample robustness checks. Accordingly, the significant differences reported below are interpreted jointly with their effect sizes and should be read as exploratory signals warranting confirmation in larger, probability-based samples.
3. Results
3.1. Socio-Demographic Profile and Mobility Habits
3.1.1. Gender Distribution
The gender composition of the two samples is broadly comparable (Table 1). Female respondents represent 62.5% of the Italian sample (n = 35) and 58.0% of the Polish sample (n = 40). A chi-square test confirms that the difference is not statistically significant (χ2(1) = 0.109, p = 0.741), indicating that both samples share a similar gender profile. In this regard, gender composition is unlikely to explain the main cross-country differences observed in this sample.
Table 1.
Characteristics of respondents (*).
The two samples differ markedly in age and occupational composition (Table 1). The Italian sample is older and professionally established—78.6% are over 50 and 41.1% are teachers or academics, with no students—whereas the Polish sample is substantially younger, with 60.9% aged 18–35 and 49.3% students. Both samples are predominantly urban (83.9% and 87.0%, respectively), although the Italian respondents are concentrated within a single metropolitan area (Catania and its surrounding municipalities) while the Polish respondents are more geographically dispersed across several cities. These compositional differences are directly relevant to the interpretation of the cross-country comparisons, since age and occupational status are themselves associated with mobility habits, cycling propensity, and openness to technological innovation; the comparative findings should therefore be read as conditional on sample composition rather than as differences attributable to national context alone.
Before comparing attitudes and behaviors across the two samples, their socio-demographic comparability was assessed on four dimensions: age, employment status, residence type, and weekly cycling frequency (Table 2).
Table 2.
Socio-demographic comparability of the two samples (*).
The two samples differ significantly in age (χ2 = 74.2, df = 3, p < 0.001) and in employment composition (χ2 = 47.5, df = 5, p < 0.001), the Italian sample being older and dominated by teaching and professional occupations, and the Polish sample younger and student-dominated. By contrast, the samples are statistically comparable in residence type, being predominantly urban in both cases (Fisher’s exact p = 0.80), and in overall weekly cycling frequency (Mann–Whitney U = 2080, p = 0.43).
The two groups are therefore broadly matched on urbanization and cycling intensity while differing markedly in age and occupational profile—a configuration that must be borne in mind when interpreting the comparisons that follow, since age and occupation are themselves associated with mobility attitudes and technology acceptance.
3.1.2. Vehicle Ownership
Substantial differences emerge in vehicle ownership patterns between the two survey samples. In the Italian one, private car ownership is notably high: 86% of respondents own one or two cars, and only 2% own none. The Polish sample shows a broader distribution, with 71% owning one or two cars and a higher share (9%) owning no car, suggesting marginally greater reliance on alternative modes. Bicycle ownership patterns diverge considerably. In the Polish sample, 38% of respondents own three or more bicycles, nearly double the Italian figure of 20%, while only 7% own no bicycle at all, compared with 16% in Italy. This may reflect a deeper-rooted cycling culture in Poland, consistent with the higher bicycle ownership rates and shorter trip distances observed in the Polish sample.
3.1.3. Public Transport Use
Public transport subscription rates differ markedly and significantly between the two survey samples. Only 10.7% of Italian respondents (n = 6) hold a bus or metro pass, compared to 34.8% in Poland (n = 24). This difference is statistically significant (χ2(1) = 8.542, p = 0.004, **). This may reflect differences in the urban mobility contexts from which the two samples were selected. Specifically, this result points out the well-documented structural weakness of public transport in Southern Italy and the stronger integration of public transit in Polish urban centers.
3.1.4. Trip Frequency and Modal Choice by Purpose
For home–work commuting, Italian respondents show a higher frequency: 75% commute three or more times per week, compared to 39% in Poland. Polish respondents report a higher share of non-commuters (39% ‘never’ vs. 13% in Italy), possibly reflecting a greater prevalence of remote or hybrid working arrangements or a different age-occupational composition. Shopping and errands show moderate trip frequencies in both samples, while leisure travel is broadly similar across the two survey samples.
The car or motorcycle remains dominant in both survey samples for commuting and shopping, though the share is considerably higher in the Italian sample (71%) than in the Polish sample (45%). In Poland, the modal split is more diversified: public transport accounts for 13% of commuting trips and 20% of school/university trips, figures that are negligible in Italy (2% each). Shared mobility services are used by up to 17% of Polish respondents for leisure and school trips, whereas they are virtually absent in the Italian sample. Bicycle use for leisure trips is the one domain where Italy approaches Polish levels (38% vs. 19%), although Poland’s overall cycling modal share is higher when aggregated across all purposes.
3.2. Cycling Behavior, Barriers, and Incentives
3.2.1. Current Bicycle Use
Daily bicycle use was reported by 31.9% of Polish respondents (n = 22) and 19.6% of Italian respondents (n = 11). Although this represents a 12-percentage-point difference between the two samples, the chi-square test was not statistically significant (χ2(1) = 1.796, p = 0.180), likely reflecting the small subgroup sizes. Similarly, Fisher’s exact test did not indicate a significant difference (p = 0.15). Consequently, while the observed proportion of daily bicycle users was higher in the Polish sample, the available data do not provide sufficient statistical evidence to conclude that the two samples differ in daily bicycle use.
The finding is nevertheless directionally consistent with the higher bicycle ownership and shorter trip distances observed in the Polish sample.
3.2.2. Barriers to Cycling
Non-cyclist respondents were asked to rate seven barriers on a 1–5 scale (1 = not at all discouraging, 5 = extremely discouraging). MWU tests reveal that safety-related barriers are perceived significantly more severely in Italy (Table 3).
Table 3.
Barriers to cycling (*).
Effect sizes are reported alongside p-values so that the magnitude, and not only the statistical significance, of each difference is considered, a particularly important safeguard given the modest sample sizes.
The largest difference is recorded for traffic hazards: the Italian mean (4.02 ± 1.23) far exceeds the Polish mean (2.51 ± 1.36), with a large effect size (p < 0.001, ***). Lack of infrastructure and insecurity regarding other road users also differ significantly, with Italian respondents rating both considerably higher.
By contrast, individual-level barriers, such as purchase price, physical effort, comfort, and travel time, show no significant inter-country difference (all p > 0.10), suggesting that the principal obstacle to cycling in Italy is the perceived road environment rather than personal or economic factors. In the Polish sample, the more uniform distribution of barrier ratings across all categories suggests a more balanced, less safety-dominated cycling-deterrence profile.
3.2.3. Incentives for Greater Bicycle Adoption
Both samples identify improving road safety and cycling infrastructure as the most effective incentives for greater bicycle use (Table 4). In the Italian sample, road safety improvement is cited by 84.1% of respondents, substantially more than in Poland (51.0%), consistent with the higher perceived severity of traffic-related barriers documented in the previous question. The demand for improved cycling infrastructure is highly valued in both samples, with very similar shares in Italy (65.9%) and in Poland (63.3%), with a negligible gap between the two survey samples. Secure bicycle parking is valued by 45.5% of Italian and 34.7% of Polish respondents, while e-bike purchase subsidies attract moderate interest in both samples (IT 36.4%, PL 30.6%). Improving bike-sharing systems receives the lowest endorsement overall, though slightly more support in Poland (26.5%) than in Italy (18.2%).
Table 4.
Incentives for greater bicycle use (multiple answers allowed; % of total sample) (*).
3.3. Awareness and Willingness to Adopt Smart Bicycle Technologies
3.3.1. Awareness of E-Bike Technological Innovations and Perceived Usefulness of Integrated Technologies
Exactly half of Italian respondents (50.0%, n = 28) report familiarity with technological innovations applied to e-bikes (GPS tracking, adaptive speed control, anti-collision systems, assisted braking, etc.), compared to 33.3% in Poland (n = 23). The chi-square test is not significant (χ2(1) = 2.898, p = 0.089, ns). All respondents rated six categories of smart bicycle technology on a 1–5 scale (1 = useless, 5 = essential; Table 5). The results reveal a consistent pattern: Polish respondents rate most technologies significantly higher than Italian respondents. In Italy, the modal response across all categories is ‘moderately useful’ (rating 3), indicating a cautious or undecided stance consistent with lower familiarity. In Poland, the modal response shifts to ‘very useful’ (rating 4) across most categories, suggesting that more regular cyclists place greater practical value on smart cycling features. Four of the six comparisons are statistically significant, with three at p ≤ 0.001. The largest effects are observed for monitoring systems (p < 0.001, ***, mean IT = 2.84 vs. PL = 3.57) and adaptive gear shifting (p < 0.001, ***, mean IT = 2.66 vs. PL = 3.35), both comfort- and performance-oriented technologies. Intelligent driver assistance (p = 0.006, **) and navigation systems (p = 0.018, *) also differ significantly. Incident detection and anti-collision technologies show no significant inter-country differences, with both samples rating them around the ‘moderately useful’ midpoint, suggesting they represent a shared baseline of interest regardless of cycling frequency.
Table 5.
Perceived usefulness of smart bicycle technologies (*).
3.3.2. Most Interesting Technologies
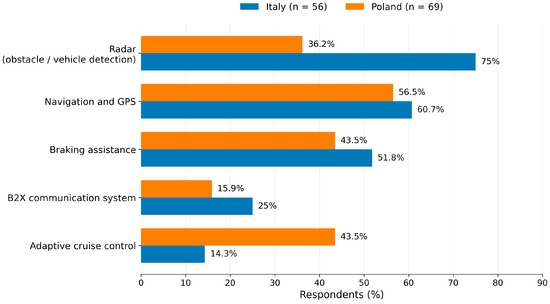
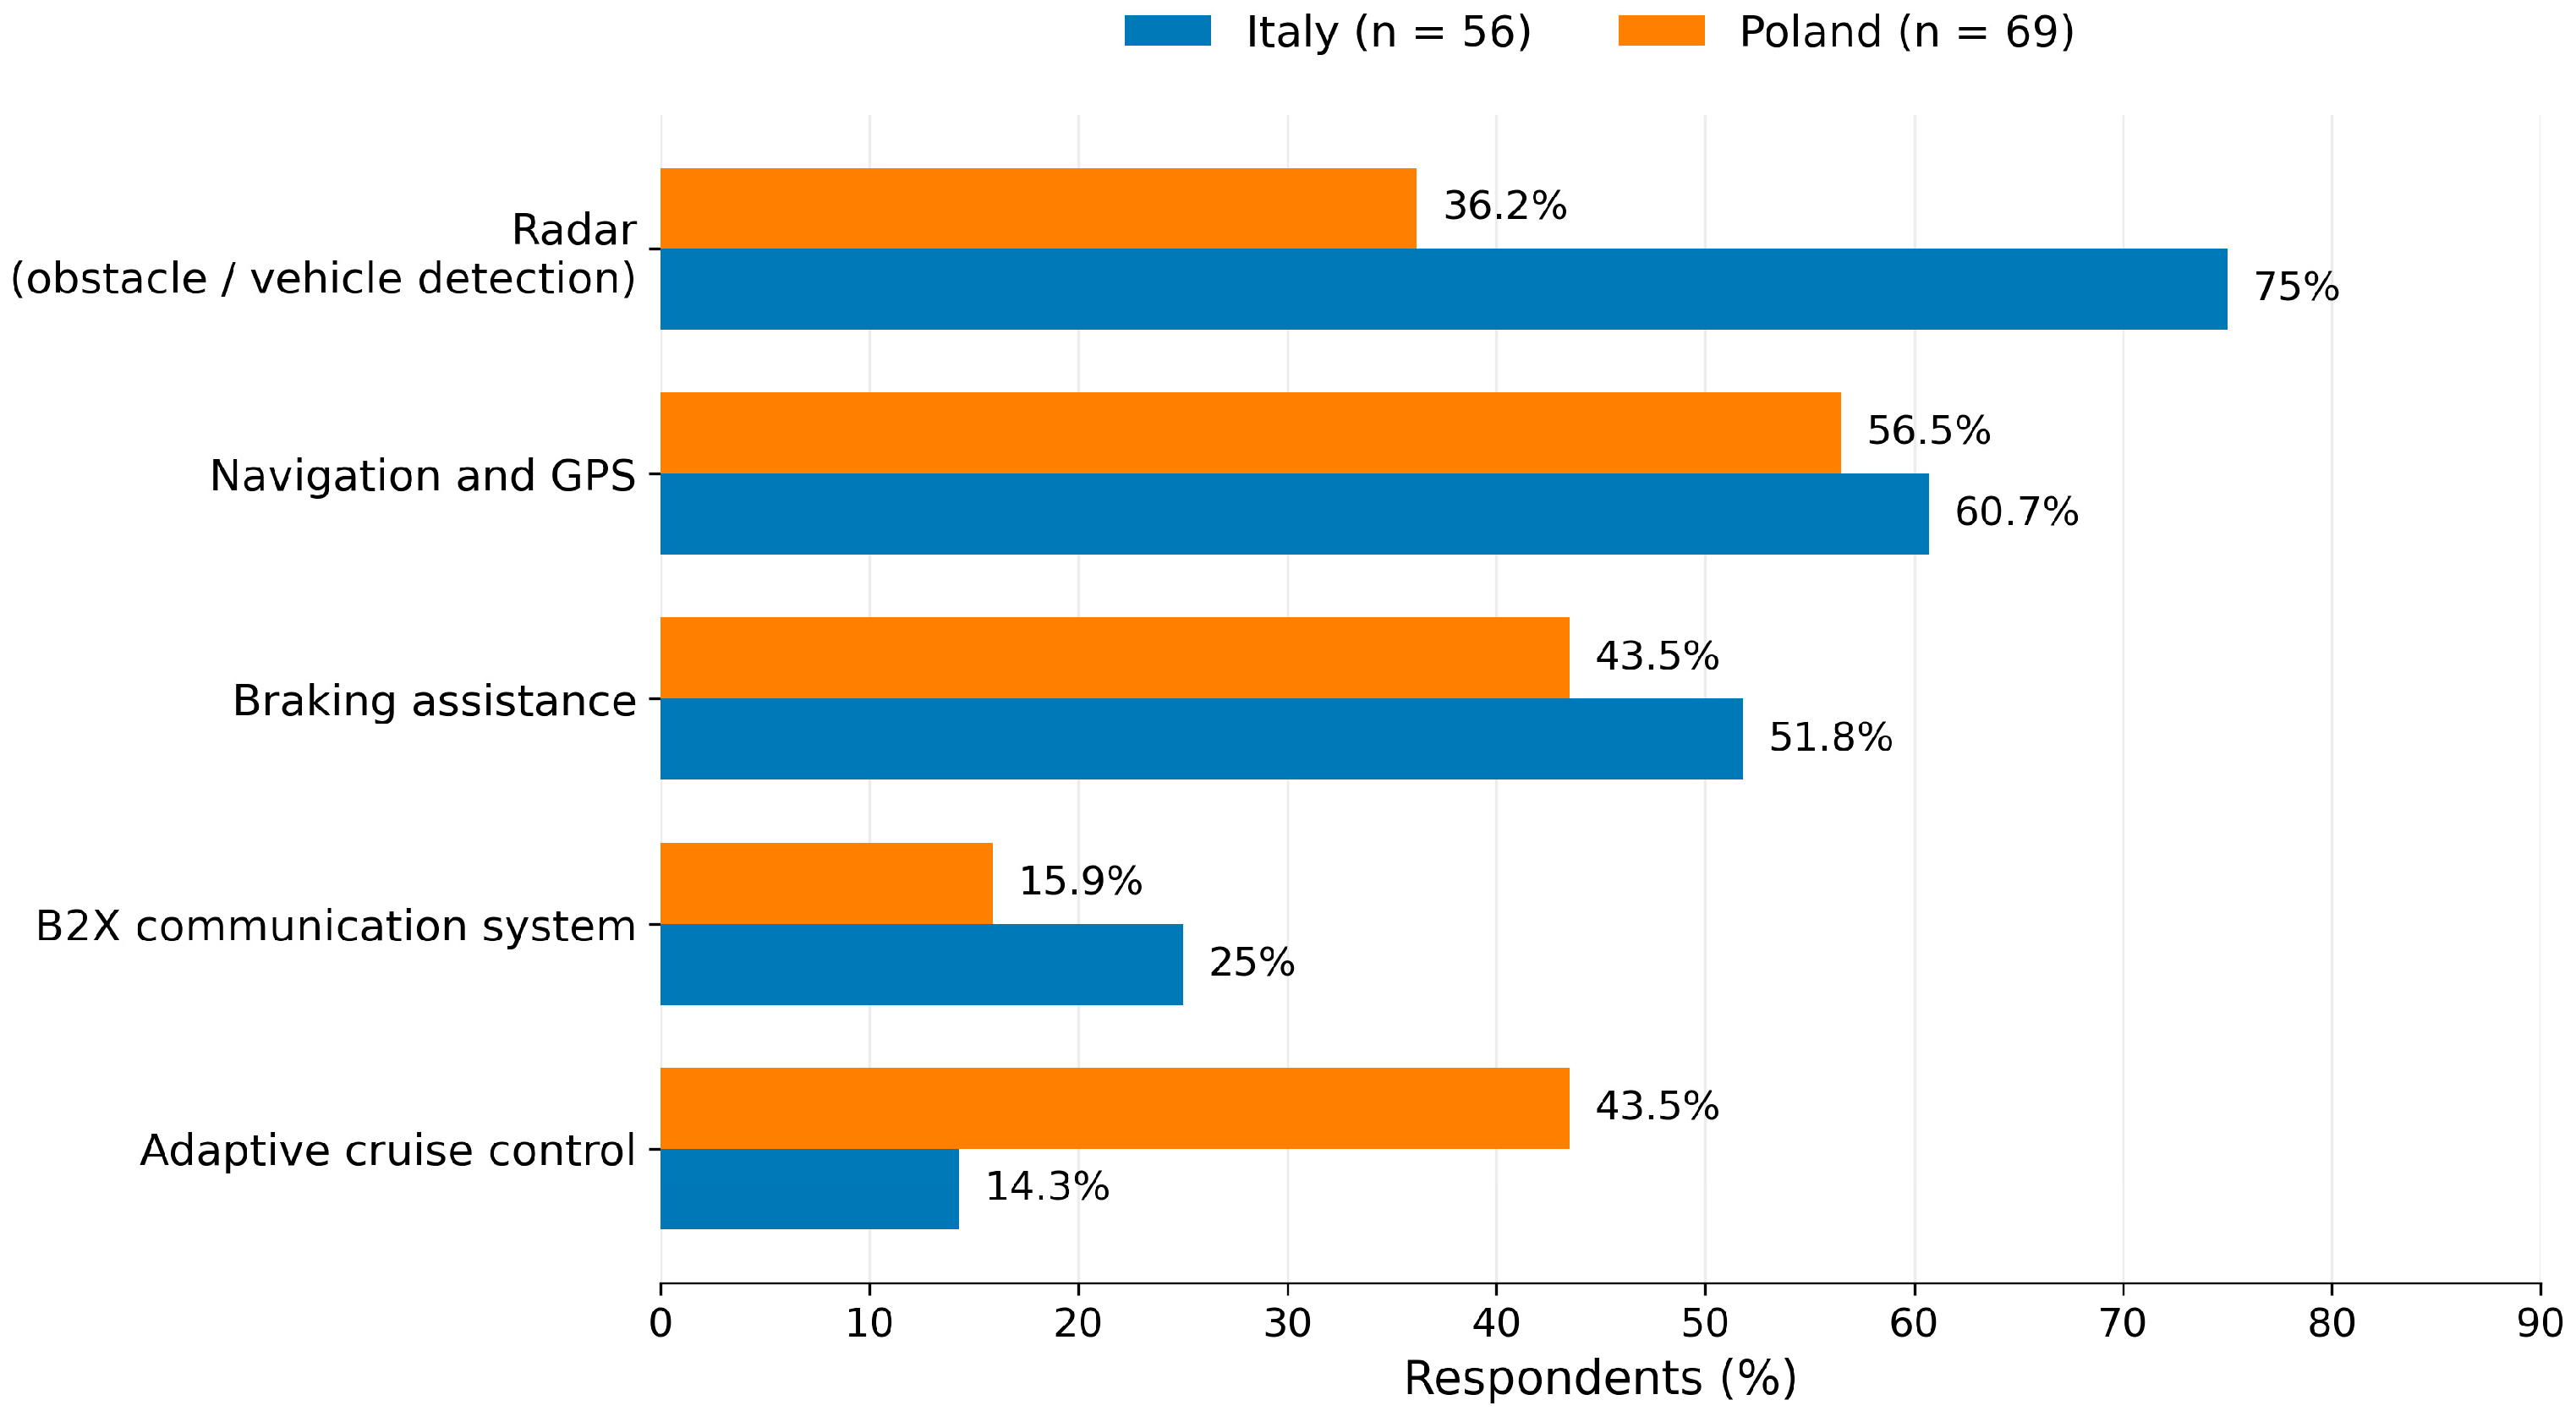
When asked to identify the most appealing innovative technologies (multiple answers allowed), Italian and Polish respondents display different priority profiles (Figure 3). Italian respondents show the strongest interest in radar systems for obstacle and vehicle detection (75.0%), followed by navigation and GPS systems (60.7%) and braking assistance (51.8%). This preference hierarchy is dominated by safety technologies, consistent with the high safety-related barriers previously reported. In Poland, navigation and GPS systems lead (56.5%), but the preference profile is more balanced: braking assistance and adaptive cruise control both attract 43.5%, considerably higher than in Italy (51.8% and 14.3%, respectively), while radar interest is much lower (36.2%). This suggests that Polish respondents, being more regular cyclists with lower safety concerns, give greater relative weight to comfort and convenience technologies alongside safety-critical ones.
Figure 3.
Interest in innovative smart bicycle technologies. (*) Our elaboration on the collected data.
3.3.3. Technology as an Incentive for Cycling and Willingness to Pay
Respondents were asked whether innovations in smart technology could incentivize greater bicycle use. The chi-square test reveals a significant difference in the distribution of responses (χ2(2) = 11.083, p = 0.004, **). In Italy, 44.6% respond ‘yes, definitely’ and 35.7% ‘yes, but only if the cost were affordable’, while 19.6% prefer other modes regardless. In Poland, the pattern is reversed: unconditional acceptance is much lower (21.7%), while cost-conditional acceptance dominates (65.2%), and only 13.0% prefer other modes.
Overall, approximately 80% of Italian respondents and 87% of Polish respondents recognize technology’s potential as a cycling incentive, but the nature of that acceptance differs significantly. Italian respondents are more unconditionally enthusiastic; Polish respondents predominantly condition adoption on affordability. This implies that in the Italian sample, technological innovation per se may drive uptake, whereas in the Polish one, cost reduction mechanisms (i.e., subsidies, financing schemes, or economies of scale) represent the critical enabling factor.
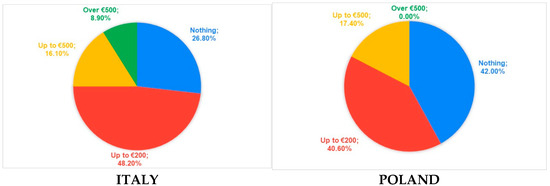
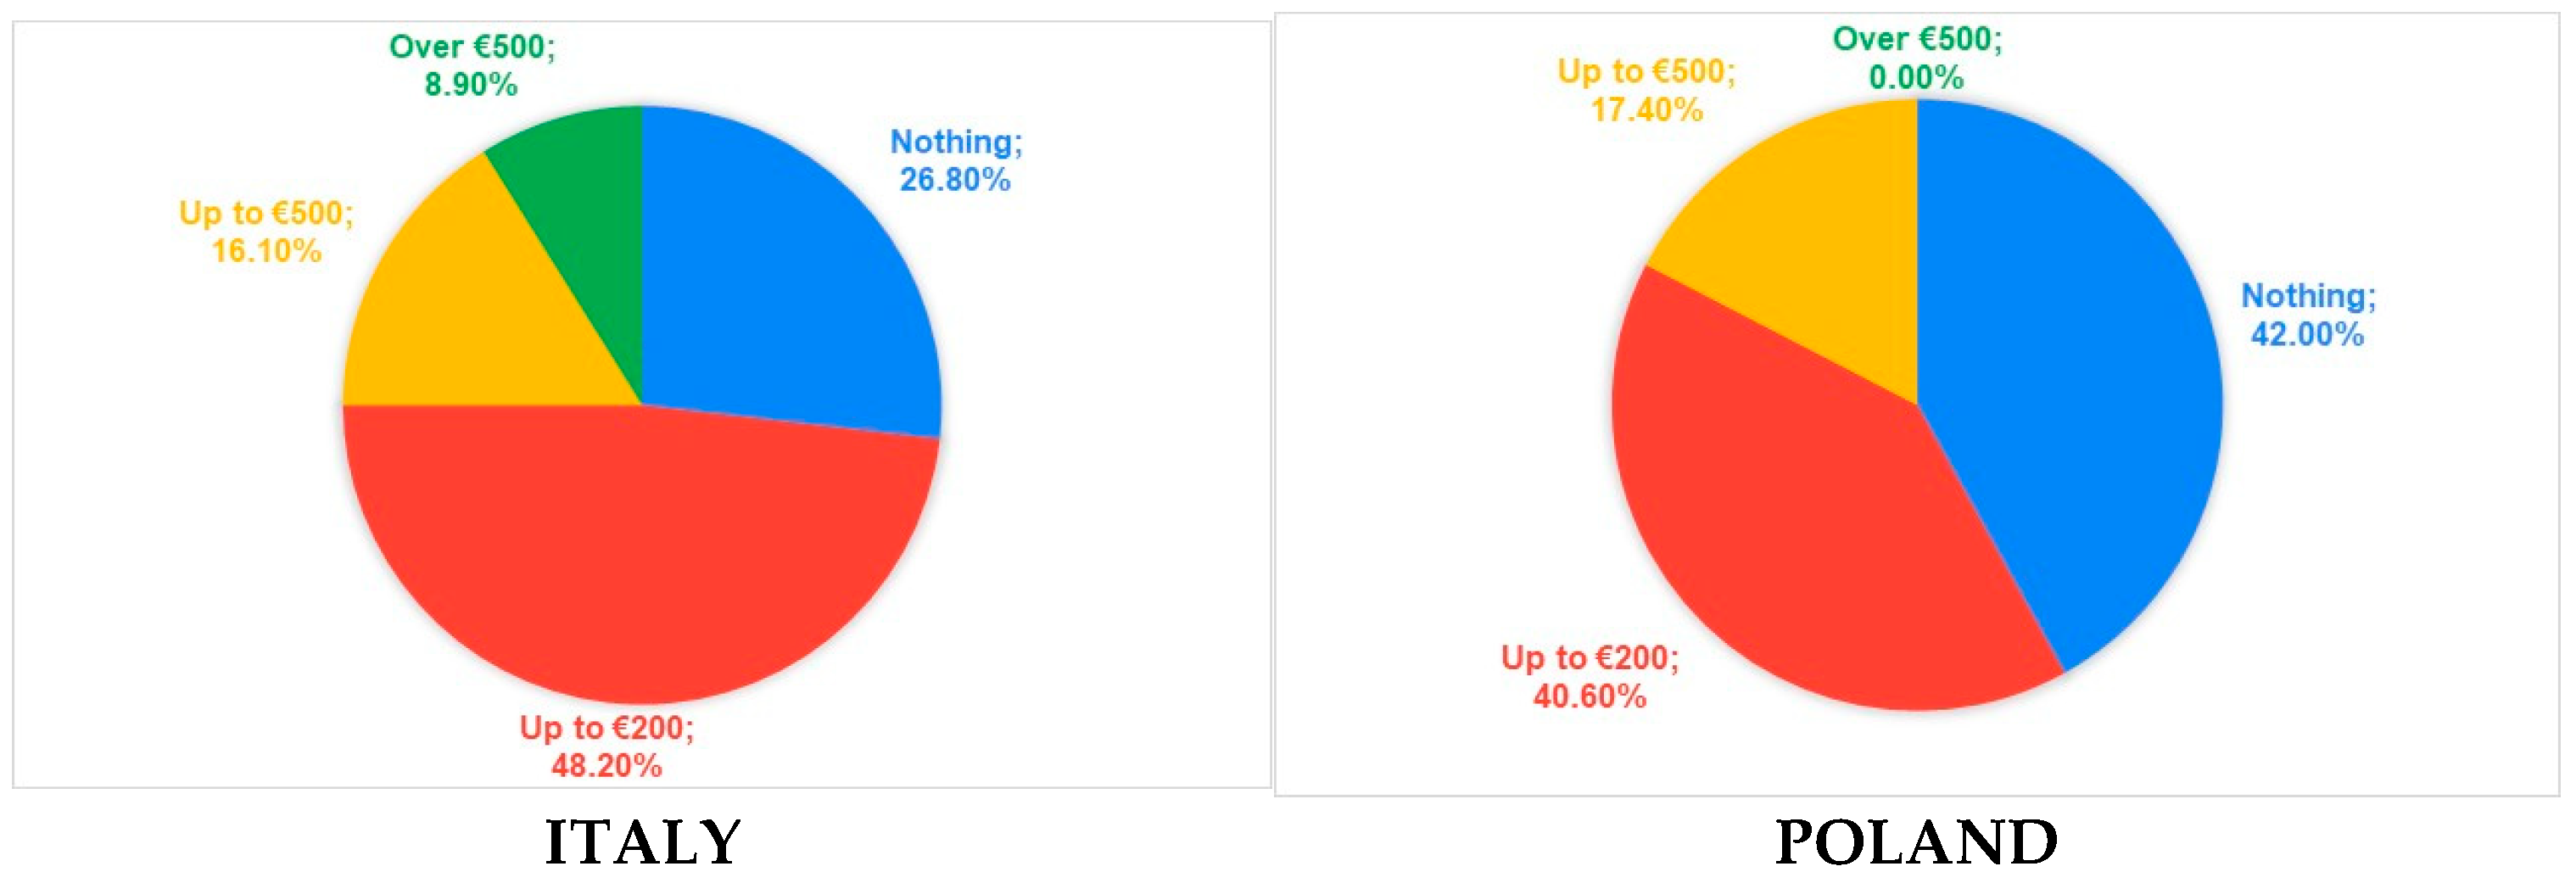
Willingness to Pay (WTP) for a smart-equipped bicycle is limited in both survey samples, with the modal response in the €0–200 range. In Italy, 48.2% are willing to pay up to €200 extra, 16.1% up to €500, and 8.9% over €500, while 26.8% decline to pay any extra. In Poland, 40.6% accept up to €200, 17.4% up to €500, no respondent accepts over €500, and 42.0% would pay nothing extra. The distribution of responses is shown in Figure 4.
Figure 4.
Willingness to pay a price premium for smart-equipped bicycles by country. (our elaboration on the collected data).
The MWU test does not reach statistical significance (p = 0.056), indicating that the ordinal WTP distributions are not significantly different at the α = 0.05 level. However, the substantially higher share of ‘nothing extra’ in Poland (42.0% vs. 26.8%) and the complete absence of WTP above €500 in the Polish sample are substantively noteworthy and corroborate the strong cost sensitivity. Together, these findings suggest that €200 represents a practical adoption ceiling in both markets, with Poland exhibiting a sharper threshold. To examine whether attitudes toward smart e-bike technologies varied with respondent age, Spearman rank correlations were computed separately for each country between age band and two outcomes: the mean perceived usefulness of the integrated e-bike technologies (Question 16) and the stated willingness to pay a premium for a technologically equipped bicycle (Question 19) (Table 6).
Table 6.
Spearman rank correlations between respondent age and attitudes toward smart e-bike technologies, by country (*).
Perceived usefulness showed no significant association with age in either country (Italy: ρ = −0.07, p = 0.63; Poland: ρ = −0.12, p = 0.33), indicating that the appreciation of the functional value of these technologies was broadly shared across age groups.
Willingness to pay, by contrast, was significantly and negatively associated with age in the Polish sample (ρ = −0.29, p = 0.014): younger Polish respondents were willing to pay more for a technologically equipped bicycle, with the mean willingness-to-pay category declining from the 18–35 group through to respondents aged over 50, who on average reported no willingness to pay a premium.
No significant age gradient emerged in the Italian sample (ρ = −0.00, p = 0.98); this null result should, however, be interpreted with caution, since the Italian sample was strongly concentrated in the over-50 age group (44 of 56 respondents), leaving limited age variance with which to detect such an effect.
4. Discussion
4.1. Safety, Cycling Maturity, and Affordability as Adoption Drivers
This study set out to examine whether and how the two surveyed urban samples, recruited from distinct sampling frames in Italy and Poland, differ in the perception and acceptance of smart bicycle technologies among current and potential cyclists; the two EU member states share a common policy framework under the EU Declaration on Cycling [4] and the Vision Zero ambition [5], yet differ substantially in their cycling cultures, mobility infrastructures, and road safety profiles. The results suggest that these differences are not merely incidental but reflected in users’ attitudes, barriers, and technology preferences, with implications for both research and practice.
The most consistent and statistically robust finding across our two samples concerns the role of perceived safety as a barrier to cycling in the Italian sample. Traffic hazards, lack of infrastructure, and insecurity regarding other road users are all rated significantly more severely by Italian respondents than by Polish respondents (all p < 0.01, medium-to-large effect sizes), and road safety improvement is cited as the primary cycling incentive by 84.1% of the Italian sample. This pattern aligns with the macro-level evidence reported in the ETSC PIN Flash 50 [5], which places Italian respondents among the countries with the highest share of cyclist deaths resulting from collisions with motor vehicles (60%), and with the findings of Cafiso et al. [30] and Torrisi et al. [17] on the determinants of perceived cycling risk in the Mediterranean urban context. Together, these results suggest that contexts characterized by high car dependence, perceived safety concerns, and inadequate cycling infrastructure, such as the Italian context analyzed here, the adoption of smart cycling technologies, however promising in principle, is unlikely to drive significant modal shift unless preceded or accompanied by structural improvements to the road environment. The survey highlights a car-oriented culture in both Italy and Poland, albeit with slight differences attributable to regional specificities. It is clear that the choice of transport mode can vary depending on the quality of infrastructure, the availability of vehicles, but also—and above all—on cultural factors [31]. Indeed, cultural and structural barriers have a significant impact on mobility habits. In Northern European countries, as various studies have shown, the bicycle ranks second among the preferred modes of transport [31]. In other European countries, however, there is a high level of car dependency among citizens, attributed both to a car-oriented culture and to limited infrastructure, [32,33,34,35] as well as to the limited effectiveness of public transport. Technology cannot substitute for infrastructure; it can only complement it once a minimum threshold of perceived safety is reached. In Poland, the picture is different in important ways. Polish respondents cycle more frequently, own more bicycles, and report fewer safety-related barriers, consistent with the country’s average annual reduction of 6% in cyclist deaths between 2014 and 2024 [5,36] and with the greater development of urban cycling networks in cities such as Gdańsk [37]. Importantly, Polish respondents attribute significantly higher practical value to smart cycling technologies, particularly those enhancing comfort and performance (monitoring systems, adaptive gear shifting, and intelligent driver assistance) rather than exclusively safety-critical features. This finding is consistent with TAM-based predictions [17]: users who are already comfortable cycling are better positioned to evaluate the added value of technological enhancements beyond basic safety, and their assessments are therefore more differentiated and more favorable.
Taken together, these patterns are consistent with a sequential pathway in which cycling maturity shapes perceived safety, which in turn shapes the valuation of smart technologies. Greater cycling experience and exposure, reflected in the higher cycling frequency, bicycle ownership, and lower safety-related barriers observed in the Polish sample, may attenuate the perception of cycling as a hazardous activity. As perceived risk recedes, the evaluative frame for smart technologies appears to shift: users who no longer regard safety as the binding constraint are better positioned to appreciate the incremental value of comfort- and performance-oriented features, whereas users for whom perceived risk remains salient, as in the Italian sample, continue to prioritize safety-critical technologies. This interpretation is coherent with TAM-based reasoning, in which perceived usefulness is contingent on the user’s experience and on the salience of the need the technology addresses.
It must be emphasized, however, that the cross-sectional and exploratory design supports associational rather than causal inference. The proposed pathway is therefore advanced as a plausible mechanism consistent with the observed data, not as a demonstrated causal sequence. Alternative explanations cannot be excluded: the direction of influence may be partly reversed, with prior interest in specific technologies encouraging more frequent cycling, and unobserved contextual factors may jointly drive both perceived safety and technology valuation, acting as confounders rather than as links in a single causal chain.
The implication is that cycling maturity may increase the perceived usefulness of smart bicycle technologies, particularly when these technologies are framed not only as safety devices but also as tools improving comfort, performance, and the overall riding experience. Cost sensitivity emerges a key cross-national moderator of technology acceptance. Although 80–87% of respondents in both survey samples acknowledge the potential of smart technologies as a cycling incentive, the nature of that acceptance differs between the two samples: Italian respondents are more unconditionally enthusiastic (44.6% “yes, definitely”), while Polish respondents predominantly condition adoption on affordability (65.2% “yes, but only if the cost were affordable”). Willingness to pay converges in the €0–200 range in both samples, with no Polish respondent willing to pay more than €500. These findings reinforce the argument that the current commercial positioning of smart e-bikes, which typically retail at price points well above conventional bicycles, represents a significant barrier to mass adoption, and that public subsidy schemes, tax incentives, and shared ownership models may be important levers for diffusion, particularly in price-sensitive markets. The perception of safety also significantly influences willingness to pay, as noted in other studies [38,39]. This is consistent with the broader evidence on e-bike adoption cited in Kapousizis et al. [7,16,21], which identified a willingness to pay of approximately €248 for smart bicycle technologies, and with the EU funding priorities for cycling infrastructure and active mobility investments outlined in the Declaration on Cycling progress report [4].
The contrast between the two outcomes is informative. The perceived usefulness of smart e-bike technologies appears to be largely independent of age, suggesting that their functional appeal is recognized across generations. Willingness to pay for them varies: in the Polish sample, it declines significantly with age, consistent with the interpretation that younger users are not only more receptive to technological innovation but also more prepared to bear its costs. This divergence between recognizing usefulness and willingness to pay for it reinforces the distinction, central to technology-acceptance reasoning, between perceived usefulness and actual adoption intention, and suggests that affordability, rather than perceived value, may be the binding constraint on uptake among older, more price-sensitive users. The absence of an equivalent gradient in the Italian sample is most plausibly attributable to its narrow age range rather than to a genuine absence of the effect, and the question therefore warrants re-examination in more age-balanced samples.
4.2. Implications for Smart Cycling Policies and Technology Adoption
Before drawing out the policy implications, it is important to delimit what the present study can and cannot support. The survey provides descriptive, cross-sectional evidence on how perceived barriers, safety perceptions, and the valuation of smart e-bike technologies are distributed and associated within two specific urban samples. It does not, by design, establish that particular interventions would cause changes in cycling behavior, nor that the patterns observed would hold at national scale. The policy directions discussed below are therefore offered as interpretive hypotheses, consistent with the BSL framework and with prior evidence, rather than as conclusions demonstrated by our data.
Taken together, these findings contribute to the growing body of literature on cross-national variation in cycling behavior and technology acceptance [40,41,42,43], by providing exploratory comparative evidence on how perceived safety, cycling maturity, and affordability interact in shaping smart cycling acceptance. They also carry potential implications for the design of national and European cycling policies. The EU Declaration on Cycling [4] and SDG 11 [25] provide a common normative framework, but the pathways to smart cycling adoption are likely to be context-dependent: infrastructure and road safety investment appear to be necessary complements to technology promotion in contexts like Southern Italy, while cost reduction mechanisms and targeted subsidies may represent important enabling conditions in markets like Poland where cycling is already culturally embedded.
From a policy perspective, these results suggest that smart cycling strategies should not focus exclusively on technological innovation. In contexts where perceived traffic risk remains high, smart technologies should be integrated with measures aimed at improving road safety, continuity of cycling infrastructure, and protection from motorized traffic. In contexts where cycling is already more common, technology-oriented incentives may be more effective if they address affordability and demonstrate the practical value of smart features for everyday cycling [44,45].
From a market and technology-development perspective, the results indicate that users may recognize the usefulness of smart bicycle technologies while remaining unwilling to absorb a substantial price premium. This gap between perceived usefulness and willingness to pay suggests the relevance of public subsidies, leasing schemes, shared ownership models, and integration with bike-sharing or mobility-as-a-service platforms.
Concrete precedents indicate that such investment can yield rapid and measurable results even in car-oriented Mediterranean settings. In Seville, the construction between 2006 and 2011 of a continuous, segregated, and homogeneous network of cycle paths raised cycling from approximately 0.5% to around 6% of all urban trips within five years, while the crash risk per cyclist declined as cycling volumes grew, in line with the safety-in-numbers hypothesis [46]. This experience is particularly instructive for the high-motorization Southern European context represented by the Italian sample, in which the perceived road environment, rather than personal or economic factors, emerged as the principal deterrent to cycling, since it demonstrates that targeted, protected infrastructure can shift both behavior and the perception of safety within a short time horizon.
On the affordability side, financial incentive schemes offer complementary evidence. Sweden’s 2018 national e-bike subsidy, covering 25% of the purchase price up to a fixed ceiling, increased e-bike sales by roughly 70%, with around two-thirds of recipients reporting that they would not have purchased an e-bike without it and with an observed substitution of cycling for car use [47]. Evidence of this kind suggests that targeted purchase subsidies can meaningfully lower the adoption threshold in price-sensitive markets, such as the Polish sample, where willingness to pay for technologically enhanced bicycles was particularly constrained. At the same time, the same evaluations caution that the economic case for such schemes rests not on carbon savings alone but on their combined health, congestion, and market-stimulation benefits, and that rigorous longitudinal assessments of their effectiveness remain comparatively scarce, a caveat consistent with the exploratory framing of the present study. At the national level, Italy’s Ecobonus scheme for low-emission and active-mobility vehicles represents a domestic instance of this lever.
Taken together, these findings also bear on the environmental sustainability rationale that motivates smart cycling, although only tentatively. To the extent that smart e-bike technologies lower the perceived effort- and safety-related barriers to cycling, they may facilitate a modal shift away from private motorized transport and thereby support the reductions in transport-related greenhouse gas emissions targeted by the EU Sustainable and Smart Mobility Strategy and the European Declaration on Cycling [4]. The subsidy evidence reviewed above, in which increased e-bike uptake was accompanied by an observed substitution of cycling for car use [48], is consistent with such environmental co-benefits, alongside associated health, congestion, and accessibility gains. These implications should, however, be read with the same caution as the rest of the analysis: the present study captures stated perceptions and willingness to pay rather than realized travel behavior or emissions outcomes, and any modal shift or decarbonization benefit would materialize only if adoption were achieved at a scale well beyond that represented by these two exploratory samples.
4.3. Limitations and Future Research
Several limitations of this study must be acknowledged. First and most importantly, the sample sizes, while adequate for exploratory comparative analysis, are relatively small, particularly for the Italian sample. Moreover, the recruitment strategy was non-probabilistic; therefore, the findings should not be interpreted as statistically representative of the Italian and Polish populations. This limits statistical power for subgroup analyses that would enrich the interpretation of the results. The non-significant chi-square result for daily bicycle use (p = 0.180), despite a 12-percentage-point gap between the two survey samples, is a direct consequence of this limitation and illustrates the risk of Type II errors in underpowered comparisons.
Secondly, the survey’s cross-sectional design captures attitudes and perceptions at a single point in time and cannot establish causal relationships between variables. The finding that Polish respondents attribute higher utility to smart technologies, for instance, is consistent with a cycling experience effect, but the survey design does not allow this interpretation to be confirmed. Longitudinal studies or natural experiments, for example, tracking technology acceptance before and after the introduction of a subsidized e-bike scheme, would provide stronger causal evidence. In particular, the hypothesized pathway linking cycling maturity, perceived safety, and the valuation of smart technologies could be tested directly through mediation analysis on larger, probability-based samples, with perceived safety modeled as a mediator between cycling experience and perceived usefulness. Longitudinal or quasi-experimental designs would help establish the direction of these relationships and distinguish genuine experience effects from selection effects.
Third, the questionnaire was administered in the native language. While the instrument was designed to be linguistically simple and the Likert-scale format is relatively robust to translation effects, minor differences in the interpretation of individual items across language versions cannot be ruled out, and this should be noted as a caveat when comparing specific percentage distributions. Despite these limitations, the study makes a meaningful contribution by providing the comparative empirical analysis of smart cycling technology acceptance between Italy and Poland, grounded in the BSL framework [7] and validated against macro-level road safety evidence [5]. The findings open several productive avenues for future research. Extending the comparative design to additional EU member states, particularly contrasting Northern European high-cycling countries with Southern and Eastern European low-cycling contexts, would allow the national context effects identified here to be tested more rigorously and would support the development of typologies of smart cycling adoption readiness across Europe. Future research should therefore integrate objective, GIS-based bikeability and infrastructure indicators [17] with observed risk assessments [18] and the survey-based perception data used here, so that the independent contributions of actual infrastructure quality and perceived safety to smart cycling acceptance can be properly disentangled. Finally, as BSL 4 and BSL 5 technologies approach commercial readiness, replication studies that track the evolution of awareness, utility perceptions, and willingness to pay over time will be essential for monitoring whether the cost barrier identified in this study recedes as smart cycling technologies mature and scale.
A further limitation concerns the exclusively perception-based nature of the data. The analysis relies on respondents’ subjective assessments of cycling barriers, safety, and the usefulness of technology and does not incorporate objective, georeferenced measures of infrastructure provision or bikeability. As a consequence, the design cannot fully disentangle the effect of perceived conditions from that of the actual infrastructure available in each context: the more severe safety-related barriers reported by Italian respondents may reflect genuinely poorer or more discontinuous cycling infrastructure, a stronger subjective sensitivity to risk, or, most plausibly, a combination of the two. It should be noted, however, that perceived safety is itself a behaviorally decisive construct, shown to govern cycling uptake more strongly than infrastructure provision alone [18,19], so that the perceptions captured here are of direct relevance to mobility behavior and policy independently of the underlying objective conditions. Moreover, the macro-level road-safety evidence used as an external reference [5] is broadly consistent with the subjective patterns observed—Italy’s high share of cyclist fatalities from collisions with motor vehicles and Poland’s sustained reduction in cyclist deaths mirror the respective barrier profiles—suggesting that the reported perceptions are not free-standing but align with objective safety outcomes at the national level.
An additional limitation concerns the demographic composition of the two samples. As shown in the descriptive statistics, the Italian and Polish respondents differ substantially in characteristics such as age and occupational status. These differences may have influenced the reported attitudes toward cycling, perceptions of barriers, and evaluations of smart cycling technologies. For example, age has been associated with variations in technology acceptance, risk perception, and travel behavior, while occupational status may affect mobility needs, trip purposes, income constraints, and willingness to adopt new technologies. Consequently, some of the cross-sample differences observed in this study may reflect demographic composition effects rather than differences attributable solely to national context. Given the limited sample sizes, it was not possible to conduct sufficiently powered stratified or multivariate analyses to isolate the independent contribution of these factors. Future studies should seek to improve comparability through quota sampling, matching procedures, or multivariate modeling that controls for demographic characteristics such as age, occupation, gender, income, and cycling experience.
The cross-sample contrasts reported in this study are interpreted as exploratory patterns that may reflect the sampling frames and urban contexts sampled rather than as differences between Italy and Poland as such. The two cities differ in cycling culture, infrastructure, and topography, and these contextual factors are confounded with nationality in the present design. The findings should therefore be read as hypotheses about how sampling frame and urban context shape cycling attitudes and technology acceptance, to be confirmed in studies with strengthened representativeness; for example, through quota sampling on age and occupation, harmonized recruitment channels across countries, or the deliberate matching of urban contexts of comparable size and cycling maturity.
5. Conclusions
Smart cycling can be seen as a key strategy in the transition towards sustainable urban mobility, as it links digital innovation, active mobility and policy programs aimed at climate change mitigation. Within the framework of SDG 11 “Sustainable Cities and Communities” and, in particular, Target 11.2, which calls for safe, affordable, accessible, and sustainable transport systems for all, cycling represents a low-emission and inclusive mobility [48] option capable of improving urban accessibility whilst reducing environmental externalities.
This study provided exploratory comparative evidence on the acceptance of smart bicycle technology in two survey samples from Italy and Poland. By jointly considering mobility habits, perceived cycling barriers, perceived usefulness of smart technologies, and willingness to pay, the analysis highlights that smart cycling adoption is shaped by the interaction between safety conditions, cycling familiarity, and affordability.
Three main conclusions can be drawn. First, in the Italian sample, perceived traffic risk and inadequate cycling infrastructure emerge as central barriers, suggesting that smart bicycle technologies should be framed as complementary to road safety and infrastructure improvements rather than as stand-alone solutions. Second, in the Polish sample, the higher perceived usefulness of comfort- and performance-oriented technologies suggests that greater cycling familiarity may increase the perceived value of smart features. Third, willingness to pay remains limited in both samples, suggesting that affordability is likely to be a decisive factor in the wider diffusion of smart-equipped bicycles.
In achieving SDG 11 “Sustainable Cities and Communities”, sustainable mobility policies, in general, and those relating to cycling and smart mobility, in particular, will undoubtedly be key factors for success. Indeed, e-bikes are emerging as a strategic transport alternative because they are environmentally friendly, require minimal effort to reach a suitable speed and tackle inclines, and offer shorter journey times than traditional bicycles [15].
In this context, the integration of smart technologies (such as sensor-based infrastructure, data-driven traffic management, and digital mobility platforms) further amplifies the potential of cycling by improving safety, efficiency, and user experience, thereby supporting a modal shift from private motorized transport to active modes. This aligns closely with the European Union’s Sustainable and Smart Mobility Strategy, which targets a substantial reduction in transport-related greenhouse gas emissions and promotes a systemic transition towards multimodal, zero-emission mobility systems. Moreover, recent policy developments, including the EU Urban Mobility Framework and the 2024 European Declaration on Cycling, explicitly recognize cycling as a key pillar of urban transport planning, emphasizing the need for integrated infrastructure, enhanced connectivity with public transport, and inclusive mobility solutions.
According to some authors [49], smart cycling should be regarded as a socio-technical system that requires careful coordination between digital innovation, spatial planning and social inclusion. According to this approach, therefore, cycling mobility can contribute to achieving the objectives of SDG 11 “Sustainable Cities and Communities”, not only by reducing emissions and improving urban health outcomes, but also by addressing key social aspects linked to the social dimension of sustainability, such as accessibility, data governance and spatial justice [50], that are central to the transitions towards sustainability in European cities.
The results suggest that the adoption of smart cycling cannot be interpreted solely as a matter of technological readiness. It also depends on the mobility context in which technologies are introduced, the perceived safety of cycling environments, and the economic accessibility of smart-equipped bicycles. Future research should test these findings on larger and more diverse samples and integrate perception-based data with objective measures of cycling infrastructure and bikeability.
Author Contributions
Conceptualization, G.P. and L.S.; methodology, G.P., L.S. and V.T.; formal analysis, G.P. and L.S.; data curation, G.P., L.S. and J.W.; visualization, G.P. and V.T.; writing—original draft preparation, G.P.; writing—review and editing, L.S., V.T. and J.W.; supervision, L.S.; project administration, G.P. and L.S.; funding acquisition, G.P. and L.S. All authors have read and agreed to the published version of the manuscript.
Funding
This research was funded by the DEC–24/1/2023/IDUB/13b/Ag grant under Argentum Triggering Research Grants–Excellence Initiative-Research University’ for the Gdańsk University of Technology and by the PNRR National Centre for HPC, Big Data and Quantum Computing, Mission 4 Component 2, Investment 1.4, CUP E63C22001000006.
Institutional Review Board Statement
Ethical review and approval were waived for this study by Institution Committee as per Italian and Polish legislation and institutional practice, formal ethics committee approval is required for clinical, biomedical, or interventional research involving human participants, whereas anonymous, non-interventional social science surveys are exempt from this requirement. The data collected were fully anonymous and therefore fall outside the scope of personal data under the General Data Protection Regulation (GDPR, Recital 26).
Informed Consent Statement
Informed consent for participation was obtained from all subjects involved in the study.
Data Availability Statement
The data presented in this study are available on request from the corresponding author. The data are not publicly available as they form part of an ongoing research project.
Conflicts of Interest
The authors declare no conflicts of interest.
References
- Torrisi, V.; Sturiale, L.; Ignaccolo, M.; Inturri, G.; Migliore, M. The Role of Environmental Awareness in Transport Mobility Behaviour: Evidence from Survey-Based Approach in Catania (Italy). In International Conference on Computational Science and Its Applications; Lecture Notes in Computer Science; Springer Nature: Cham, Switzerland, 2026; Volume 15898, pp. 67–86. [Google Scholar]
- Nordfjærn, T.; Egset, K.S.; Mehdizadeh, M. “Winter is coming”: Psychological and situational factors affecting transportation mode use among university students. Transp. Policy 2019, 81, 45–53. [Google Scholar] [CrossRef] [Scilit]
- United Nations. Transforming Our World: The 2030 Agenda for Sustainable Development; Department of Economic and Social Affairs: New York, NY, USA, 2015.
- EUR-Lex 32024C02377; European Declaration on Cycling. European Union: Brussels, Belgium, 2024.
- Carson, J.; Jost, G.; Meinero, M. Improving the Safety of Cycling in Europe. In PIN Flash 50; European Transport Safety Council (ETSC): Brussels, Belgium, 2026. [Google Scholar]
- CONEBI. BIMP-Nike Industry & Market Profile, 2025. Available online: https://www.conebi.eu/industry-market-reports/ (accessed on 15 May 2026).
- Kapousizis, G.; Ulak, M.B.; Geurs, K.; Havinga, P.J. A review of state-of-the-art bicycle technologies affecting cycling safety: Level of smartness and technologies readiness. Transp. Rev. 2023, 43, 430–452. [Google Scholar]
- SAE J3016; Taxonomy and Definitions for Terms Related to Driving Automation Systems for On-Road Motor Vehicles. Society of Automotive Engineers (SAE): Warrendale, PA, USA, 2018.
- Alter, S. Making Sense of Smartness in the Context of Smart Devices and Smart Systems. Inf. Syst. Front. 2020, 22, 381–393. [Google Scholar]
- Kamargianni, M.; Polydoropoulou, A. Hybrid choice model to investigate effects of teenagers’ attitudes toward walking and cycling on mode choice behavior. Transp. Res. Rec. 2013, 2382, 151–161. [Google Scholar] [CrossRef] [Scilit]
- Prati, G.; Puchades, V.M.; De Angelis, M.; Pietrantoni, L.; Fraboni, F.; Decarli, N.; Guerra, A.; Dardari, D. Evaluation of user behavior and acceptance of an on-bike system. Transp. Res. Part F 2018, 58, 145–155. [Google Scholar] [CrossRef] [Scilit]
- MacArthur, J.; Dill, J.; Person, M. Electric Bikes in North America: Results of an Online Survey. Transp. Res. Rec. 2014, 2468, 123–130. [Google Scholar] [CrossRef] [Scilit]
- Sun, Q.; Feng, T.; Kemperman, A.; Spahn, A. Modal shift implications of e-bike use in the Netherlands: Moving towards sustainability? Transp. Res. Part D Transp. Environ. 2020, 78, 102202. [Google Scholar] [CrossRef] [Scilit]
- Oliveira, F.; Nery, D.; Costa, D.G.; Silva, I.; Lima, L. A Survey of Technologies and Recent Developments for Sustainable Smart Cycling. Sustainability 2021, 13, 3422. [Google Scholar] [CrossRef] [Scilit]
- Venkatesh, V.; Thong, J.Y.L.; Xu, X. Consumer acceptance and use of information technology: Extending the unified theory of acceptance and use of technology. MIS Q. 2012, 36, 157–178. [Google Scholar] [CrossRef] [Scilit]
- Kapousizis, G.; Ulak, B.; Geurs, K.; Havinga, P. Assessing potential uptake and willingness to pay for smart bicycle technologies affecting cycling safety. A stated preference survey among e-bike users in the Netherlands. J. Cycl. Micromobility Res. 2026, 7, 100111. [Google Scholar] [CrossRef] [Scilit]
- Torrisi, V.; Sturiale, L.; Pappalardo, G. Towards a Multidimensional Assessment of Urban Bikeability: Integrating GIS and User Perception. In Computational Science and Its Applications–ICCSA 2026 Workshops. ICCSA 2026; Lecture Notes in Computer Science; Gervasi, O., Ed.; Springer: Cham, Switzerland, 2027; Volume 16765. [Google Scholar] [CrossRef] [Scilit]
- Cafiso, S.; Pappalardo, G.; Stamatiadis, N. Observed Risk and User Perception of Road Infrastructure Safety Assessment for Cycling Mobility. Infrastructure 2021, 6, 154. [Google Scholar] [CrossRef] [Scilit]
- Jannah, A.N.; Moridpour, S.; Tay, R.; Du, B. Cyclist safety in the digital age: A review of advanced warning technologies. Accid. Anal. Prev. 2025, 217, 108069. [Google Scholar] [CrossRef] [Scilit] [PubMed]
- Gössling, S.; McRae, S. Subjectively safe cycling infrastructure: New insights for urban designs. J. Transp. Geogr. 2022, 101, 103340. [Google Scholar] [CrossRef] [Scilit]
- Kapousizis, G.; Sarker, R.; Ulak, M.B.; Geurs, K. User acceptance of smart e-bikes: What are the influential factors? A cross-country comparison of five European countries. Transp. Res. Part A Policy Pract. 2024, 185, 104106. [Google Scholar] [CrossRef] [Scilit]
- Sun, Q.; Zhao, J.; Spahn, A.; Verbong, G. Pathway towards sustainability or motorization? A comparative study of e-bikes in China and the Netherlands. Glob. Environ. Chang. 2023, 82, 102735. [Google Scholar] [CrossRef] [Scilit]
- Porcheron, M.; Clark, L.; Nicholson, S.; Jones, M. Cyclists’ Use of Technology While on Their Bike. In Proceedings of the CHI ’23, Hamburg, Germany, 23–28 April 2023; ACM: New York, NY, USA, 2023. [Google Scholar]
- Dimauro, G.A.; Cafiso, S.; Di Graziano, A.; Zito, F.; Pappalardo, G. A Simulation Framework for Synthetic Data Generation and Safety Assessment at Intersections. Safety 2026, 12, 22. [Google Scholar] [CrossRef] [Scilit]
- Simsekoglu, Ö.; Klöckner, C.A. Factors related to the intention to buy an e-bike: A survey study from Norway. Transp. Res. F Traffic Psychol. Behav. 2019, 60, 573–581. [Google Scholar] [CrossRef] [Scilit]
- Rérat, P.; Marincek, D.; Ravalet, E. How do e-bikes compete with the other modes of transport? Investigating multiple dimensions of a modal shift. Appl. Mobil. 2024, 10, 85–98. [Google Scholar] [CrossRef] [Scilit]
- Song, H.; Yin, G.; Wan, X.; Guo, M.; Xie, Z.; Gu, J. Increasing bike-sharing users’ willingness to pay: A study of China based on perceived value theory and structural equation model. Front. Psychol. 2022, 12, 747462. [Google Scholar] [CrossRef] [Scilit] [PubMed]
- Mann, H.B.; Whitney, D.R. On a test of whether one of two random variables is stochastically larger than the other. Ann. Math. Stat. 1947, 18, 50–60. [Google Scholar] [CrossRef] [Scilit]
- Cohen, J. Statistical Power Analysis for the Behavioral Sciences, 2nd ed.; Lawrence Erlbaum Associates: Hillsdale, NJ, USA, 1988. [Google Scholar]
- Stamatiadis, N.; Cafiso, S.; Pappalardo, G. A comparison of bicyclist attitudes in two urban areas in USA and Italy. Adv. Intell. Syst. Comput. 2019, 879, 272–279. [Google Scholar] [CrossRef] [Scilit]
- Fiorello, D.; Martino, A.; Zani, L.; Christidis, P.; Navajas-Cawood, E. Mobility Data across the EU 28 Member States: Results from an Extensive CAWI Survey. Transp. Res. Proc. 2016, 14, 1104–1113. [Google Scholar] [CrossRef] [Scilit]
- Ferretto, L.; Bruzzone, F.; Nocera, S. Pathways to active mobility planning. Res. Transp. Econ. 2021, 86, 101027. [Google Scholar] [CrossRef] [Scilit]
- Pisoni, E.C. Active mobility versus motorized transport? User choices and benefits for the society. Sci. Total Environ. 2022, 806, 150627. [Google Scholar] [CrossRef] [Scilit] [PubMed]
- Scerri, K.; Martinez, L.; Betancur Arenas, J.; Keserü, I.; Attard, M. Understanding the Barriers and Facilitators of Planning and Implementing Active Mobility Interventions in Brussels and Malta. Cities Health 2025, 1–18. [Google Scholar] [CrossRef] [Scilit]
- Fonseca, F.; Ribeiro, P.; Neiva, C. A Planning Practice Method to Assess the Potential for Cycling and to Design a Bicycle Network in a Starter Cycling City in Portugal. Sustainability 2023, 15, 4534. [Google Scholar] [CrossRef] [Scilit]
- Pyra, M. Safety of Cyclists in Poland in the Context of European Road Traffic. Sustainability 2024, 16, 3682. [Google Scholar] [CrossRef] [Scilit]
- Okraszewska, R.; Kijewska, K.; Wachnicka, J.; Mikusova, M. Evaluating the convenience and safety effects of bicycle lanes in Gdańsk. Arch. Civ. Eng. 2022, 67, 415–432. [Google Scholar] [CrossRef]
- Riga, D.; Pileri, P. Emotional Well-Being and Environmental Restorativeness in Slow Travel: Experiential Qualities and Motivational Possibilities. Sustainability 2026, 18, 3895. [Google Scholar] [CrossRef] [Scilit]
- Biassoni, F.; Lo Carmine, C.; Perego, P.; Gnerre, M. Choosing the Bicycle as a Mode of Transportation, the Influence of Infrastructure Perception, Travel Satisfaction and Pro-Environmental Attitude, the Case of Milan. Sustainability 2023, 15, 12117. [Google Scholar] [CrossRef] [Scilit]
- Pfaender, F.; Mahdjoub, M.; Ostrosi, E. A Data-Driven Framework for Sustainability and Ergonomic Design of Urban Cycling Networks in the Métropole Européenne de Lille. Sustainability 2025, 17, 9321. [Google Scholar] [CrossRef] [Scilit]
- Smith, M.L.; Fu, X. When Bike Lanes Are Not Enough: The Role of Connected Low-Stress Cycling Infrastructure on Cycle Commuting in Urban Aotearoa New Zealand. Cities 2025, 156, 105526. [Google Scholar] [CrossRef] [Scilit]
- Menendez, M.; Ambühl, L. Implementing Design and Operational Measures for Sustainable Mobility: Lessons from Zurich. Sustainability 2022, 14, 625. [Google Scholar] [CrossRef] [Scilit]
- Behrendt, F. Cycling the Smart and Sustainable City: Analyzing EC Policy Documents on Internet of Things, Mobility and Transport, and Smart Cities. Sustainability 2019, 11, 763. [Google Scholar] [CrossRef] [Scilit]
- Davis, F.D. Perceived usefulness, perceived ease of use, and user acceptance of information technology. MIS Q. 1989, 13, 319–340. [Google Scholar] [CrossRef] [Scilit] [PubMed]
- Krishnan, D.; Srinivasan, D.; Balasubramanan, V.; Prabagaranae, N.; Mertens, J.S.; Cafiso, S.; Galluccio, L.; Morabito, G.; Pappalardo, G. Driving Style Profiling Using Deep Autoencoders for Safety Applications in Urban and Highway Scenarios. In Proceedings of the 2024 IEEE International Symposium on Measurements & Networking (M&N), Rome, Italy, 2–5 July 2024; IEEE: New York, NY, USA, 2024. [Google Scholar] [CrossRef] [Scilit]
- Marqués, R.; Hernández-Herrador, V.; Calvo-Salazar, M.; García-Cebrián, J.A. How infrastructure can promote cycling in cities: Lessons from Seville. Res. Transp. Econ. 2015, 53, 31–44. [Google Scholar] [CrossRef] [Scilit]
- Anderson, A.; Hong, H. Welfare Implications of Electric-Bike Subsidies: Evidence from Sweden; NBER Working Paper No. 29913; National Bureau of Economic Research: Stockholm, Sweden, 2022. [Google Scholar]
- Cardullo, P.; Kitchin, R. Being a ‘citizen’ in the smart city: Up and down the scaffold of smart citizen participation in Dublin, Ireland. GeoJournal 2019, 84, 1–13. [Google Scholar] [CrossRef] [Scilit]
- McFarlane, C. Assemblage and critical urbanism. City 2011, 15, 204–224. [Google Scholar] [CrossRef] [Scilit]
- Legacy, C. Is there a crisis of participatory planning? Plan. Theory 2017, 16, 425–442. [Google Scholar]

Disclaimer/Publisher’s Note: The statements, opinions and data contained in all publications are solely those of the individual author(s) and contributor(s) and not of MDPI and/or the editor(s). MDPI and/or the editor(s) disclaim responsibility for any injury to people or property resulting from any ideas, methods, instructions or products referred to in the content. |
© 2026 by the authors. Licensee MDPI, Basel, Switzerland. This article is an open access article distributed under the terms and conditions of the Creative Commons Attribution (CC BY) license.