


Abstract
Urban green space (UGS) with multidimensional attributes provides crucial ecosystem services and public health benefits. However, there is no systemic knowledge on how these diverse UGS attributes meet needs with different socio-economic and demographic characteristics. This study conducts a meta-analysis of the existing UGS case studies from the Web of Science database to reveal the knowledge breadth, depth and applicability for future research and practice in UGS. We evaluated how 75 socio-economic and demographic indicators shape 73 UGS indicators across 48 global case studies using a combination of relational analysis, meta-analytical effect and spatiotemporal distribution. The relation analysis reveals significant imbalances of UGS knowledge across attributes (Accessibility, security and amenities) and users’ characteristics (e.g., age), the meta-analytical effect size analysis indicates that many associations have not yet received consistent and conclusive empirical support for direct application to UGS planning and design, and the spatiotemporal analysis indicates that the concentration of the sampled studies in China and the United States further constrains the external applicability of the synthesized evidence. These findings recognize the multidimensional nature of UGS and the need for context-sensitive consideration and highlight the urgency of developing a unified assessment framework to improve knowledge discovery and applicability in UGS planning for urban sustainability.
1. Introduction
“Cities should not just be places to live but places to live well” [1]. Globally, urban areas account for only 2% of the global land use area, but about half of the global population lives in cities and the number is continuously increasing [2,3,4]. Rapid urbanization has segregated cities and the natural environment [5]. Urban green space (UGS) has emerged not only to conserve the ecosystems in the urban environment, but also to meet human needs such as sports, education and social interaction [6,7]. Designing and improving the UGSs to adaptively meet the growing needs of urban population has become a global challenge.
Urban green spaces (UGSs), encompassing parks, gardens, waterfronts, historic landscapes, and native vegetation corridors, are integral to urban ecosystems and public health [8,9]. Diverse UGS attributes required to meet individual human needs have been identified, including spatial accessibility [10,11], legibility [12], perceived safety [13,14], personal space and privacy [15], vegetation richness [16], and place attachment [17]. Additional attributes also include such as space for social interaction [18], educational engagement [19], esthetic value [20], recreation [21], and cultural services [22,23,24]. Understanding how UGS provision attributes are shaped (perceived) by their users is essential for developing inclusive and context-sensitive green space planning and design. Increasing case studies have investigated how these individual UGS attributes were perceived and satisfied by diverse users with different socio-economic and demographic characteristics. There were particular focus on income, education, gender, occupation type, health status, marital structure, and vulnerable population [4,25]. However, there is no systemic knowledge on how these diverse UGS attributes are associated with different socio-economic and demographic characteristics and how these interactions (associations) are distributed across urban contexts. In addition, while these empirical case studies provide very insightful knowledge about how a certain UGS meets a certain group’s needs, they often focused on an overly specific level with a lot of details for their findings to be generalized thus hindering the development of general guidelines for a wide range of application [4,25,26]. Some recent research has attempted to address this gap by proposing adaptive management frameworks for UGS, such as a case study in South East Queensland, Australia [27]. However, such frameworks remain region-specific and still highlight the lack of globally generalizable evidence.
This study conducts a meta-analysis of the existing case studies on how UGS meets users’ needs to reveal the knowledge pattern in this field for future research and practice in UGS. We take the Web of Science database over the past 30 years when the majority of UGS studies have been conducted as the data source. Specifically, this meta-analytical synthesis is guided by three research questions: (1) How broad is the existing UGS knowledge base in terms of the reported relationships between UGS attributes and socio-economic and demographic characteristics? (2) How deep is the existing quantitative evidence, as assessed through a meta-analysis of standardized effect sizes for statistically significant relationships? (3) What is the potential applicability scope of this evidence based on the spatial and temporal distribution of the selected case studies?
2. Methods
2.1. Collection of Global UGS Case Studies
This study focused on UGS case studies with the following characteristics: (1) a clear, identifiable spatial location; (2) indicators to characterize the attributes of the UGS and indicators to reflect the socio-economic and demographic development of its user groups and the surrounding regions, and (3) qualitative and/or quantitative analysis of their relationships. To ensure the scientific rigor and level of details for each UGS case study, we collected them from the Web of Science (WoS) database. The WoS, provided by Clarivate, is a journal index system comprising peer-reviewed, high-impact journals recognized worldwide and is widely regarded as an authoritative source of scientific literature [28,29]. In defining the search strategy, we first identified “urban green space” [8,30] as the initial search term. To ensure the most comprehensive coverage of relevant urban green environments, we included additional keywords representing diverse forms of open green spaces in cities such as “Public Park” [26,31], “Community Garden” [32], “Urban Forest” [33], and “Urban Open Space” [34]. Regarding the temporal scope, we set 1995 as the starting point, as the field of UGS design is relatively nascent and main UGS research emerged in 1995. The search was limited to publications in English and restricted to the document type “article”. This strategy was adopted to improve data quality and comparability, but it may exclude non-English, regional, and gray literature UGS studies. Review articles were excluded because they generally synthesize existing studies rather than provide primary empirical case data and directly extractable UGS–socio-demographic relationships.
A total of 123,305 articles were initially retrieved. We then conducted a manual screening based on the following inclusion criteria: the study must focus explicitly on green spaces within urban contexts, have clearly defined geographical location(s), and focus on the UGS indicators and socio-economic and demographic indicators. As a result, 505 articles were selected. We further refined our selection by requiring that each study explicitly examine the relationships between socio-economic and demographic indicators (e.g., income level, elderly population, tourist density) and UGS attributes (e.g., accessibility, facility activity level, road condition). This criterion excluded a large number of studies that only described ecological functions or general benefits of UGS without linking them to measurable socio-economic indicators. As a result, only 48 case studies met all three layers of criteria, ensuring the most consistent comparability and practical value (shown by Supplementary Table S1). To assess the robustness of this filtering, we cross-checked the inclusion process through independent screening from two researchers, reaching high consistency in study selection. The purpose of this strict filtering is to ensure that the selected studies could directly inform practice by linking concrete socio-economic indicators with UGS attributes.
2.2. The UGS Indicators and Socio-Economic and Demographic Indicators
We combined the deductive and inductive approaches to select the UGS, socio-economic and demographic indicators. The grouping of socio-economic and demographic attributes as well as UGS attributes in this study was not only based on the contexts of these indicators and attributes in the selected case studies but also referenced by relevant established theories. Environmental justice theory highlights systemic inequities in green space distribution, making income and housing indicators central to accessibility research [35,36]. Social determinants of health emphasize how education, employment, and health conditions shape both exposure to and benefits from UGS [37]. Environmental psychology and safety theories, such as Newman’s Defensible Space Theory [38], explain why gender and age groups perceive and use UGS differently depending on visibility and surveillance. Theories of spatial perception, including Lynch’s Urban Image Theory [39] and Gibson’s Affordance Theory [40], suggest that clarity and legibility of space mediate the relationship between population composition and UGS usability. Finally, community cohesion theories underscore why marital status, ethnicity, and population density affect social interactions within green spaces [41,42]. These theoretical foundations provide a solid basis for synthesizing the relationships between socio-economic characteristics and UGS indicators in this study.
We first collected the information of socio-economic characteristics and UGS indicators from the 48 case studies. A total of 75 socio-economic and demographic indicators and 73 UGS indicators were identified (Table 1). There existed a certain degree of similarity in some indicators adopted across the case studies. However, it is important to note that even when indicators share similar names, they often represent different constructs and measurement approaches within the context of their respective studies; therefore, to avoid information loss due to indicator merging or structural reinterpretation, we kept the original meaning of each indicator.
Table 1.
Categories of UGS indicators and socio-economic and demographic indicators.
Drawing from extensive empirical evidence and theoretical frameworks [4,30,43], we classified socio-economic and demographic indicators into ten thematic groups: age (11 indicators), economic (14), gender (3), education (4), occupation and employment status (8), population vulnerability (12), race and origin (14), marital status (2), health level (2), and population density (5). Economic and educational factors are widely recognized as key social determinants of green space access, with low-income and less-educated groups consistently facing greater barriers [19,30]. Race constitutes a critical category for analyzing spatial justice, as ethnic minority groups are often structurally excluded from access to high-quality green environments [43]. Population with vulnerability, such as housing insecurity and unemployment, captures the lived disadvantages of marginalized populations and has shown to profoundly influence both green space accessibility and perceived safety [44]. Likewise, gender and age shape green space use patterns via safety perceptions, particularly among women, children, and the elderly [13,14]. Occupation and employment status affect green space access by shaping time availability, economic stability, and patterns of occupational segregation, which together determine both exposure to and reliance on public open spaces [45]. Although marital status and health level have been less frequently studied, they offer valuable insights into users’ social embeddedness and physical condition, both of which influence interactions with UGS systems [46]. Lastly, population density determines the competitive access to and demand pressure on UGSs, especially in high-density urban cores. By organizing indicators into these meaningful categories, the framework enables a multidimensional investigation of how these socio-economic and demographic indicators influence different UGS designs [24,30].
Regarding the UGS attributes, they were classified into three UGS attribute groups: accessibility (19 indicators), amenities (32), and security (22). This three-category classification was intended to organize heterogeneous indicators according to their dominant role in users’ direct UGS experience. Some indicators with multiple meanings were assigned based on their primary function in the original studies; for example, “Internet accessibility” was grouped under security because it supports information access, communication, and emergency response, while “value of microclimate adjustment” was grouped under amenities because it reflects environmental comfort and experiential benefits. Although ecological value is a critical dimension of UGS, it operates largely as an indirect benefit (e.g., climate regulation, biodiversity support) rather than an immediate determinant of individual use and perception. As such, it was beyond the scope of this study, which aimed to prioritize those attributes most salient to users’ direct experiences. Accessibility captures physical and perceived ease of reaching green spaces, which is a foundational prerequisite for any subsequent engagement [10,11]. Security addresses both actual safety conditions and users’ subjective sense of it, a critical determinant of green space usability, especially for vulnerable groups [13,14]. Notably, although lighting is widely recognized as a critical component of perceived safety, none of the 48 case studies that met our strict inclusion criteria included lighting as an explicit indicator. As a result, lighting was absent from the security group in this analysis. Amenities reflect the availability, diversity, and quality of recreational and ecological functions that fulfill users’ basic and higher-order needs [8,20].
2.3. Measuring the Breadth and Depth of UGS Case Studies
We assessed the 48 UGS case studies from the two dimensions of knowledge breadth and knowledge depth. Knowledge is widely recognized as a network, with nodes in the network being heterogeneous concepts and the relational links between nodes being the flow of knowledge [47,48,49]. In this study, we defined two types of nodes: socio-economic and demographic indicators and UGS indicators. Every link connecting the two node types denotes an established relationship. We systematically extracted all reported relationships between socio-economic and demographic indicators and UGS indicators from the main text, tables, figures, and appendices of the case studies. These relations were categorized into qualitative vs quantitative. Details of the statistically significant quantitative indicator pairs, including source studies, original effect estimates, Hedges’ g values, and conversion procedures, are provided in Supplementary Table S3. The sources of conceptual/qualitative but statistically untested indicator pairs are listed in Supplementary Table S4. The qualitative relationships were primarily obtained from conceptual analysis, while quantitative relationships came from a detailed statistical analysis. We further grouped the quantitative relationships into significantly positive, significantly negative, and statistically non-significant to further differentiate the relationships, which imply different influences of socio-economic and demographic indicators on UGS indicators.
The breadth of the knowledge for each case study was quantified by the total number and diversity of reported relationships between socio-economic and demographic indicators and UGS indicators, regardless of their statistical significance. This provided an overview of how comprehensively each study engaged with the potential multidimensional influences. Then, we estimated the standardized effect sizes only for statistically significant positive and negative relationships reported in 13 quantitative case studies; the remaining case studies contributed to the breadth analysis but not to the effect size analysis. Among those relationships identified above, those qualitative relationships and those statistically non-significant relationships in the quantitative studies were excluded in this in-depth analysis. Given the substantial variation in analytical models, statistical methods, and reported outcomes across these studies, direct comparison of original effect sizes was not feasible. Thus, standardizing effect sizes is essential to ensure that differences in study design, measurement scales, and reporting practices do not obscure the underlying patterns of influence between different indicator combinations. To overcome this challenge, all reported relationships were standardized into a common metric (Hedges’ g), which adjusts for sample size bias and enables robust cross-study comparability [50]. Following the standardization process, we constructed three impact effects meta-analysis models, each corresponding to one UGS indicator category (accessibility, security and amenities). In these models, each standardized effect size was used to describe the direction and relative magnitude of each reported relationship, rather than to provide an absolute ranking of impact strength across studies.
2.4. Analyzing the Temporal and Spatial Development of UGS Case Studies
To analyze the potential applicability scope of the identified knowledge above, we further examined the temporal and spatial distributions of the 48 UGS case studies. We first mapped the geographical distribution of all the case studies to visually present the global spatial concentration. By tracking publication years and the range of indicator dimensions covered, we further analyzed temporal trends of the case studies. This approach allowed us to identify regional research trajectories, thematic gaps, and the uneven spatial and temporal development of UGS knowledge across different socio-political contexts.
3. Results
3.1. Knowledge Breadth of the UGS Case Studies
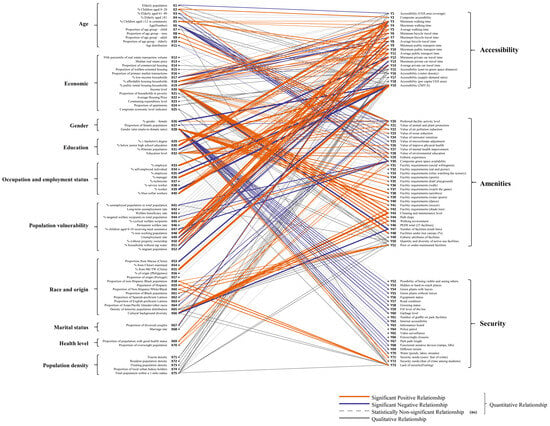
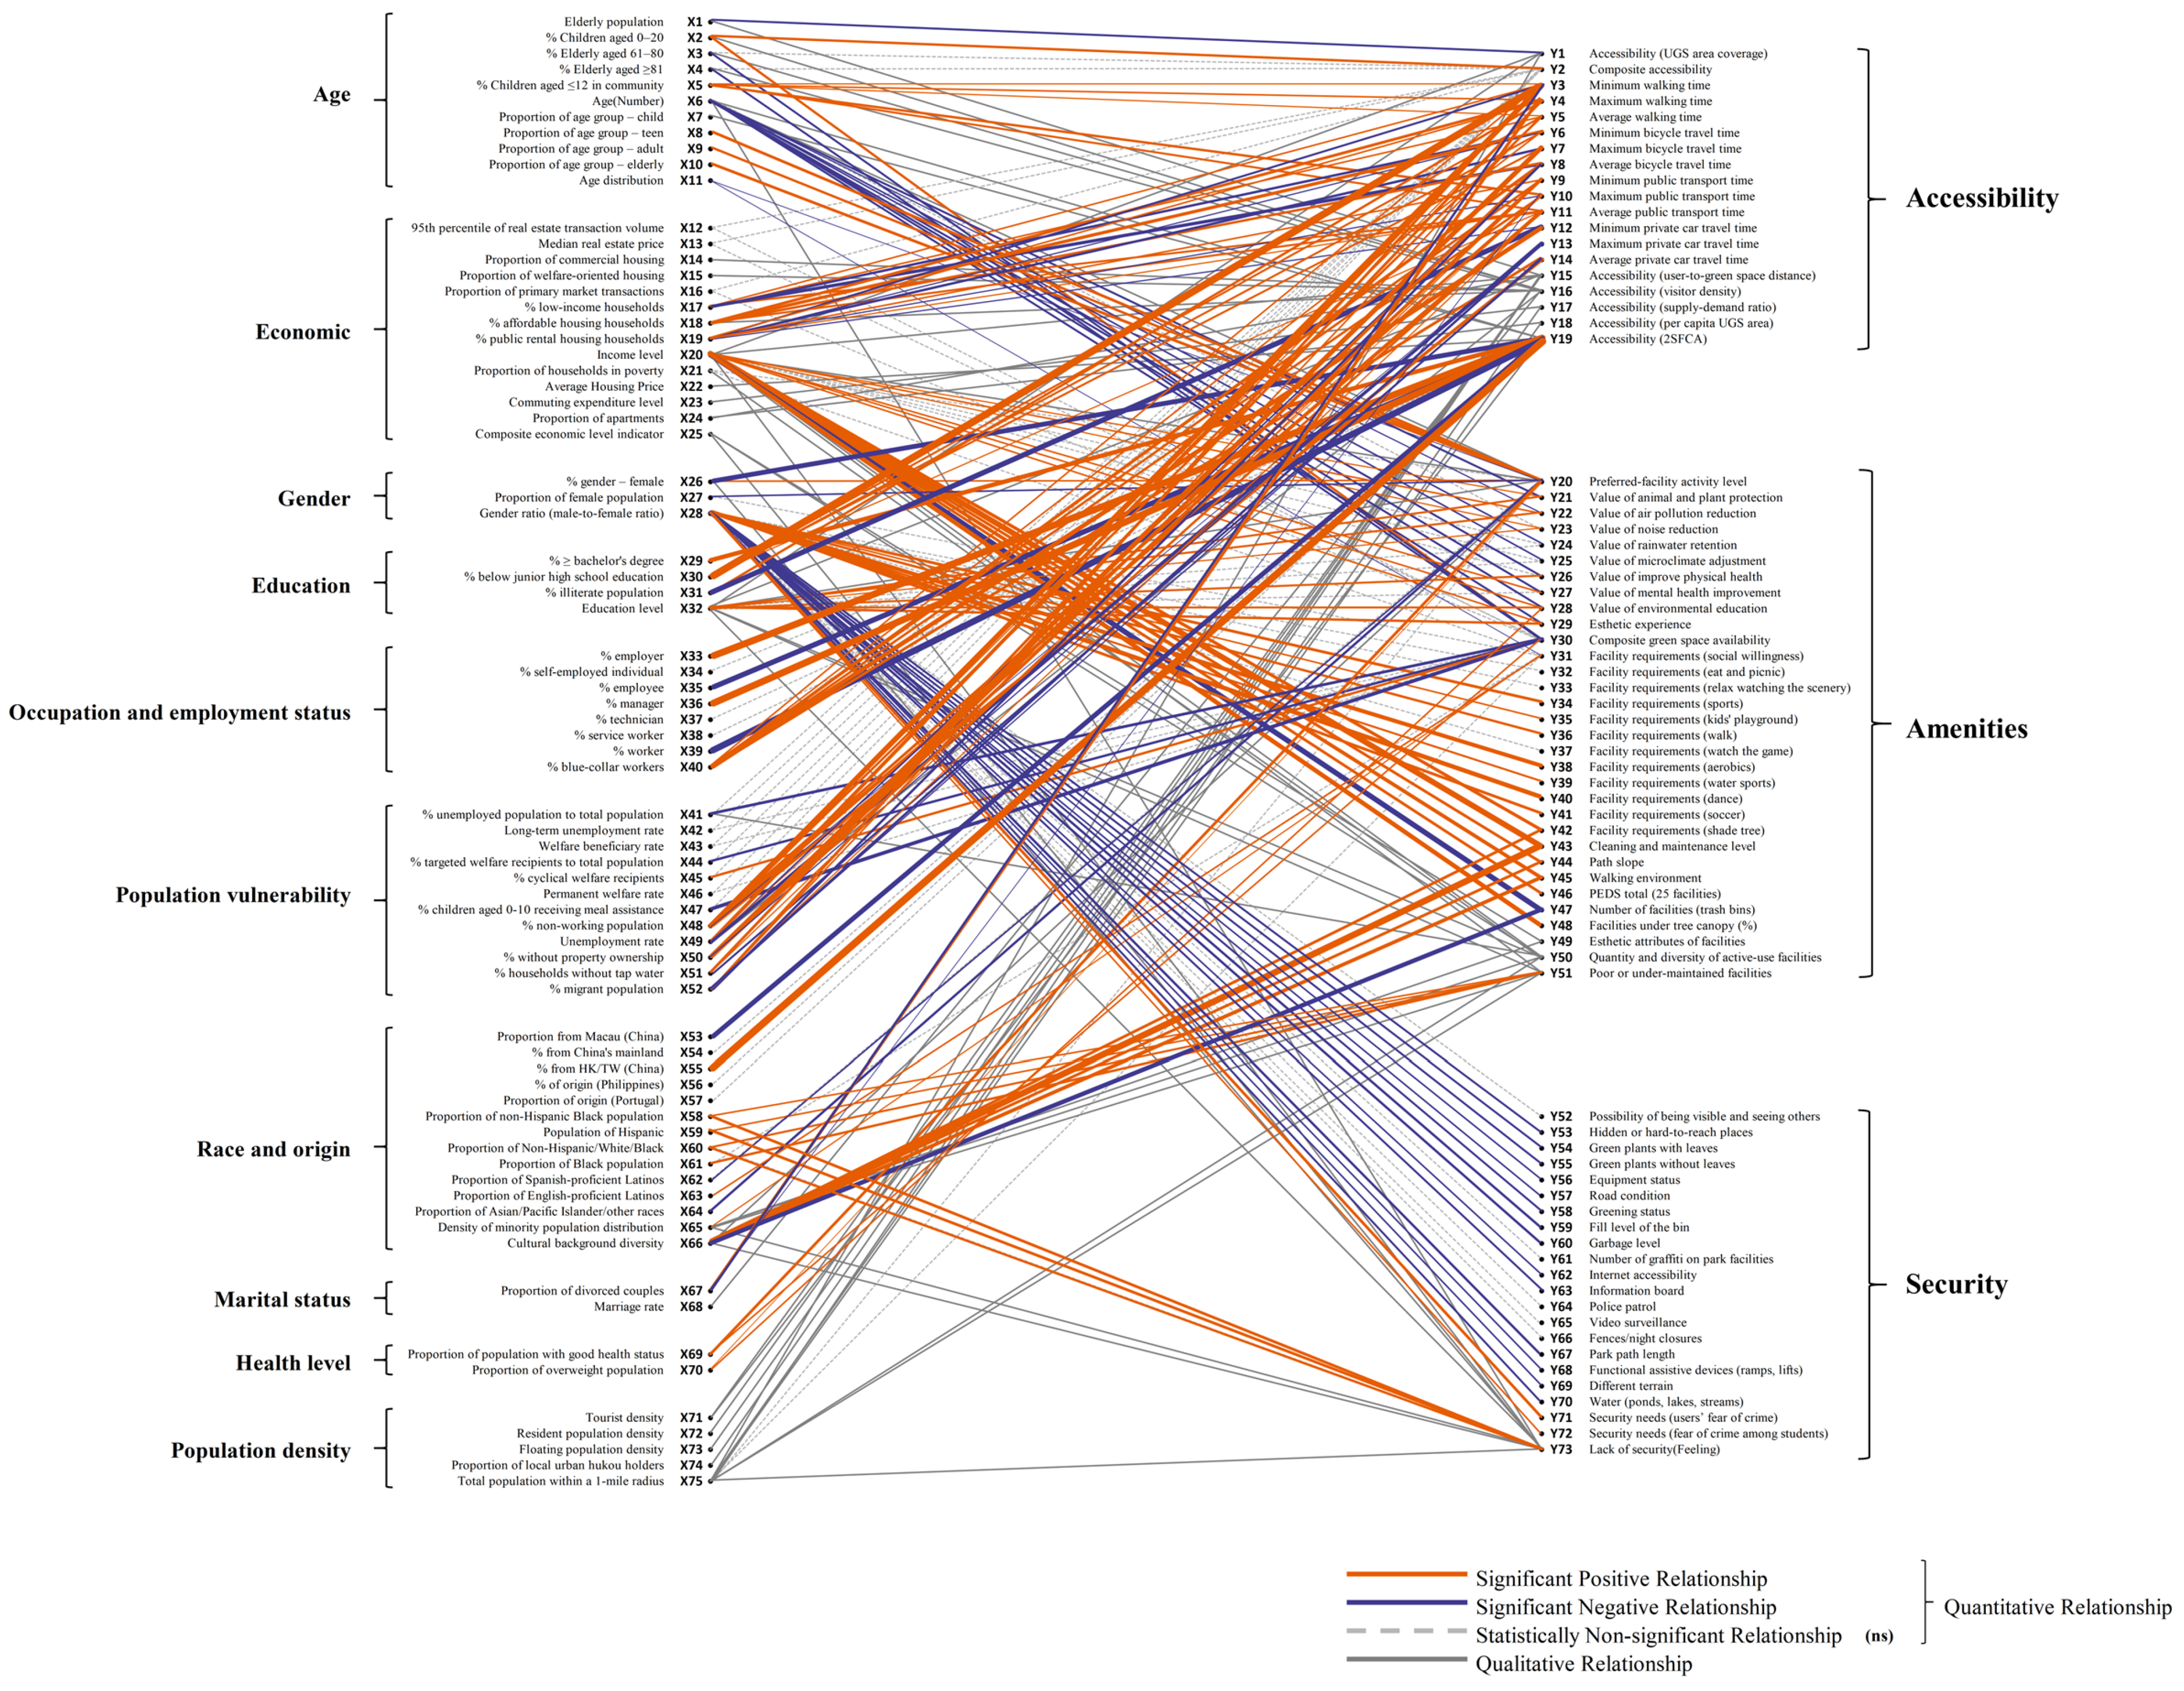
The knowledge breadth from the selected 48 case studies characterized by the number and diversity of the links between socio-economic and demographic indicators and UGS indicators is shown in Figure 1. A total of 75 socio-economic and demographic indicators across 10 socio-economic categories and 73 UGS indicators across three UGS categories, totaling 148 nodes, were identified. Among the socio-economic and demographic indicators, the most widely represented groups are economic (14 indicators), race and origin (14 indicators), population vulnerability (12 indicators), and age (11 indicators). These are followed by occupation and employment status (eight indicators), population density (five indicators), and education (four indicators). The least represented groups are gender (three indicators), marital status (two indicators), and health level (two indicators). On the UGS side, amenities dominate with 32 indicators, followed by security (22 indicators) and accessibility (19 indicators). The model contains 258 links representing relationships between indicators. Of these, 156 are statistically significant links, including 99 positive relationships (orange lines) and 57 negative relationships (blue lines), 49 statistically non-significant relationships (black gray lines) and the other 53 conceptual (qualitative) but statistically untested (gray dash lines).
Figure 1.
Relations between socio-economic and demographic indicators and UGS indicators included in the selected case studies.
To facilitate concise reporting, the following abbreviations are adopted in the results: significantly positive (+), significantly negative (−), statistically non-significant (ns), and qualitative relationships without statistical testing (qual). These notations are used consistently in the subsequent sections. Among the 10 socio-economic and demographic groups, the “gender ratio (male-to-female ratio)” from “gender” (31 links), “income level” from “economic” (22), “education level” from “education” (15), “age (number)” from the “age” group (12), “density of minority population distribution” from “race and origin” (9), and “total population within a 1-mile radius” from “population density” (9), “% blue-collar workers” from “occupation and employment status” (7), comprising over 40% of the total links studied. Indicators in the age category are predominantly associated with UGS accessibility and amenities, with 14 documented relationships for accessibility (6+, 1−, 2 ns, 5 qual) and 18 for amenities (4+, 12−, 1 ns, 1 qual). A single qualitative link is noted for security. This pattern reveals a bifurcation in age-related effects on UGS design. Indicators in the economic category show the strongest alignment with accessibility and amenities. There are 29 relationships with accessibility (10+, 7−, 3 ns, 9 qual) and 27 with amenities (12+, 1−, 8 ns, 6 qual). Only two qualitative links are identified with security. Indicators in the gender category are primarily linked to amenities and security too, with 13 relationships for amenities (8+, 1−, 4ns) and 22 for security (2+, 14−, 5 ns, 1 qual). A single significantly negative relationship exists with accessibility. This concentration of negative relationships in the security dimension illustrates a profound gendered disparity in UGS experiences. Indicators in the education category are mainly associated with accessibility and amenities. The group shows 10 links with accessibility (7+, 1−, 2 qual) and 12 with amenities (6+, 3 ns, 3 qual), with only one qualitative relationship tied to security. Occupation and employment status category is exclusively linked to accessibility, with 14 relationships (9+, 2−, 3ns). No links are observed with amenities or security. Indicators in population vulnerability group are strongly tied to accessibility and to a lesser extent, amenities. A total of 33 relationships are identified with accessibility (17+, 8−, 7 ns, 1 qual), and eight with amenities (1+, 3−, 3 ns, 1 qual). No links exist for security. Indicators in race and origin category are mainly linked to amenities, with 20 documented relationships (9+, 3−, 4 ns, 4 qual). For accessibility, there are five relationships (1+, 1−, 3ns), and for security, five relationships (2+, 1 ns, 2 qual). Marital status category exhibits only four relationships, all related to accessibility (1+, 2−, 1 qual), with no links to amenities or security. Health level category is exclusively connected to amenities, with four significantly positive relationships. No relationships are observed for accessibility or security. Indicators in population density category show qualitative or statistically weak associations. For accessibility, nine relationships are qualitative; for amenities, two are non-significant and two are qualitative. One qualitative relationship is observed with security.
Among the three UGS indicator groups, the most frequent studies are accessibility (120 links), amenities (106), and security (32). This indicates that, within user-centered green space research, accessibility has been the most prominent research focus, while security has received much less attention. Among the 120 relationships of accessibility, there are 51 significantly positive, 23 significantly negative, 18 statistically non-significant, and 28 qualitative associations. Significantly positive relationships are predominantly concentrated in “population vulnerability” (17), “economic” (10 lines), and “occupation and employment status” (9). Negative relationships are also led by “population vulnerability” (8) and “economic” (7), while non-significant results are most frequently observed in “population vulnerability” (7). The largest number of qualitative associations stems from “economic” and “population density” (each with nine lines). Amenities, encompassing features such as facility provision, environmental quality, and recreational opportunities, represent the most conceptually diverse dimension in terms of UGS indicators. However, the overall links are sparser. Across 106 documented relationships, 44 are significantly positive, 20 are significantly negative, 25 are statistically non-significant, and 17 are qualitative. Positive associations are predominantly linked to “economic” (12) and “race and origin” (9), while significantly negative relationships are heavily concentrated in “age” (12). Non-significant associations again center around “economic” (8), and qualitative relationships are also most common in the “economic” category (6). Security, broadly encompassing personal safety, crime risk, and perceived safety within green spaces. It emerges as the most underexplored. Of the 32 total relationships, only four are significantly positive, 14 are significantly negative, six are statistically non-significant, and eight are qualitative. Positive effects are distributed between “gender” (2) and “race and origin” (2), while negative associations overwhelmingly originate from “gender” (14). Non-significant relationships also cluster within the “gender” category (5), and qualitative associations are split evenly between “Economic” and “Race and origin” (two links each).
3.2. Knowledge Depth of the UGS Case Studies
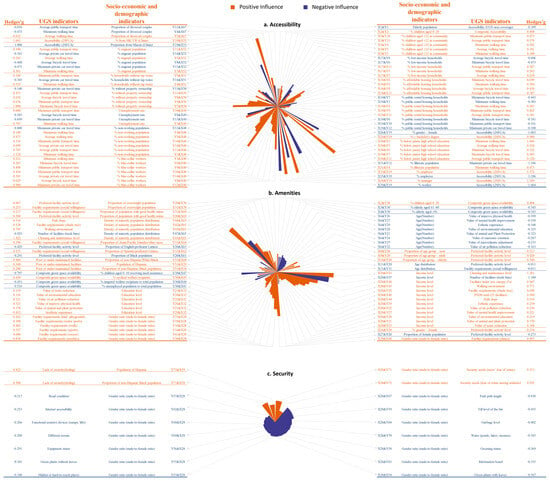
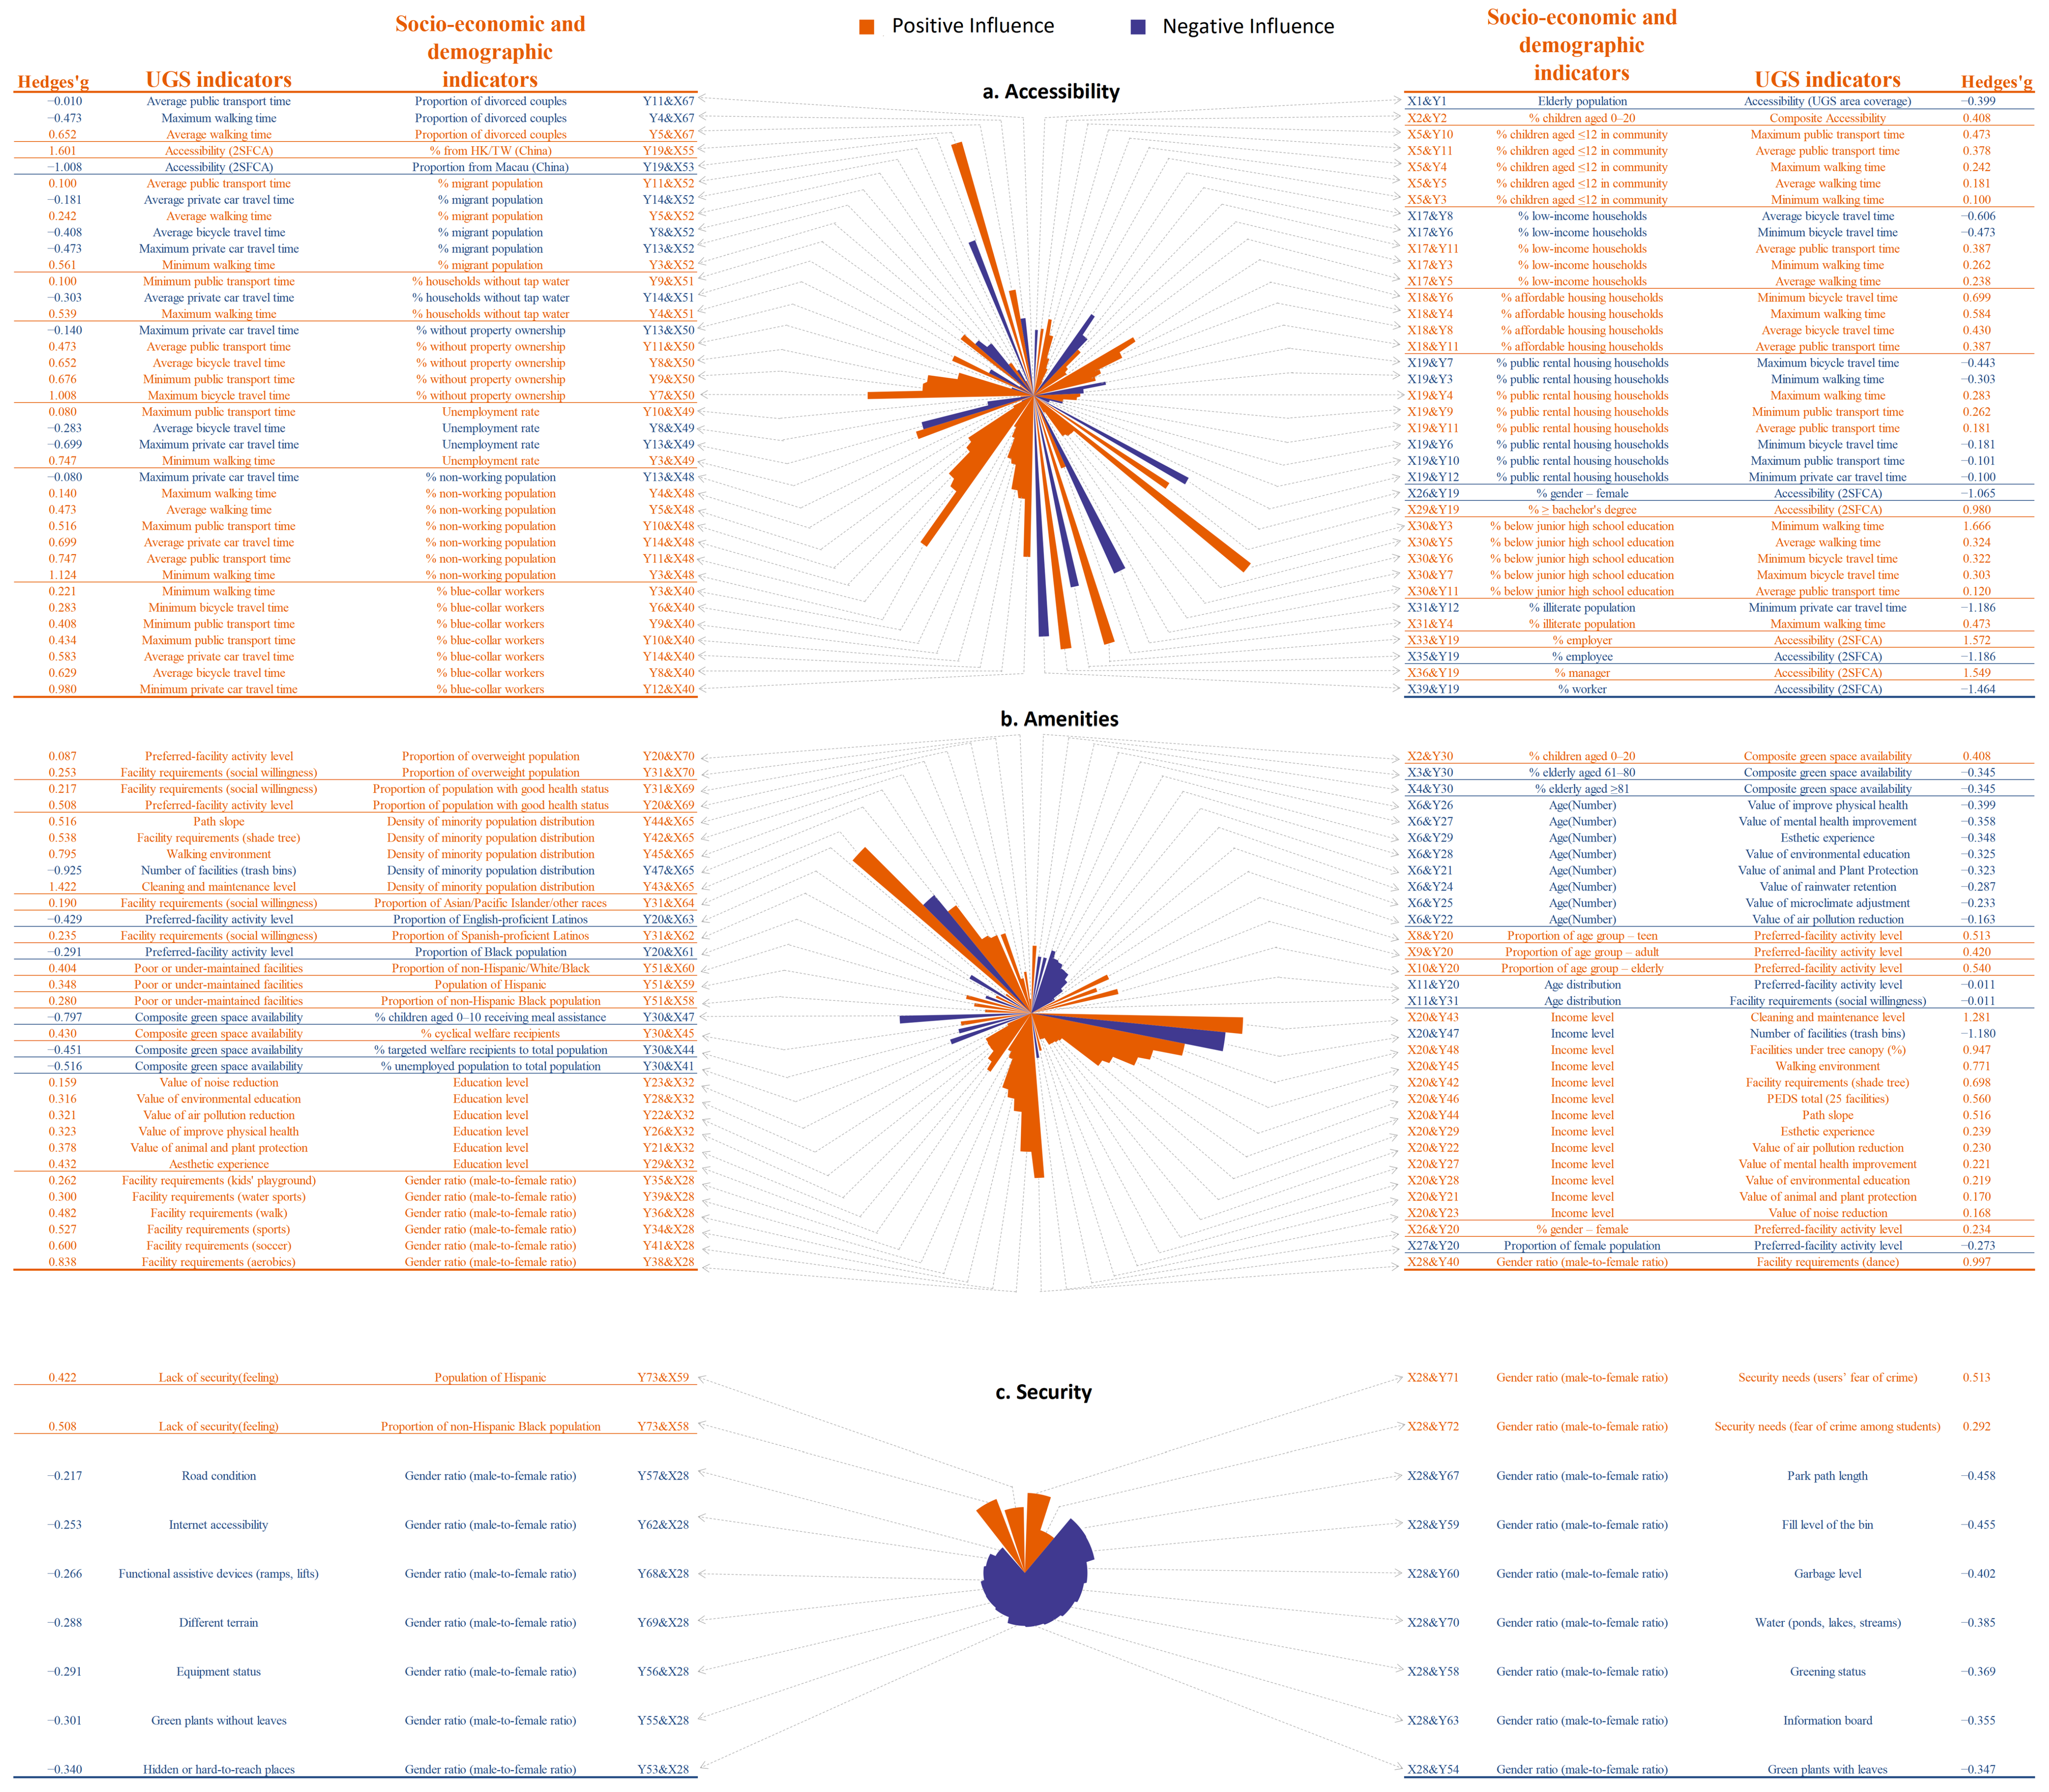
The knowledge depth was assessed by constructing three impact effect models based on the 13 quantitative case studies with statistically significant effect estimates (Figure 2). The socio-economic and demographic indicator groups exhibit a positive impact on accessibility include “age”, “economic”, “education”, “occupation and employment status”, “population vulnerability”, “race and origin”, and “marital status” (Figure 2a). Within the age dimension, the indicators that show a positive impact on accessibility include “% children aged 0–20” (X2) and “% children aged ≤12 in community” (X5). The influence scope of “% children aged ≤12 in community”, with five documented relationships, exceeds that of “% children aged 0–20”, which has only one. Further, the impact model shows that the influence strength of “% children aged ≤12 in community” (X5 and Y10, g = 0.47) is greater than that of “% children aged 0–20” (X2 and Y2, g = 0.41). In the economic dimension, three indicators contribute to ten positive relationships with accessibility. These include “% low-income households” (x17), “% affordable housing households” (x18), and “% public rental housing households” (x19). “% affordable housing households”, with four associated relationships, ranks above both “% low-income households” and “% public rental housing households,” which are each linked to three relationships. In terms of influence strength, “% affordable housing households” (X18 and Y6, g = 0.7) exhibits a stronger effect than both “% Low-income households” (X17 and Y11, g = 0.39) and “% public rental housing households” (X19 and Y4, g = 0.28). Within the education dimension, three indicators are associated with positive relationships with accessibility. These include “% ≥ bachelor’s degree” (X29), “% below junior high school education” (X30) and “% illiterate population” (X31). In terms of influence scope, “% below junior high school education” with five documented relationships, surpasses both “% ≥ bachelor’s degree” and “% illiterate population”, which are each associated with one. Regarding effect size, “% below junior high school education” (X30 and Y3, g = 1.67) demonstrates the strongest influence, followed by “% ≥ bachelor’s degree” (X29 and Y19, g = 0.98) and “% illiterate population” (X31 and Y4, g = 0.47). Within the occupation and employment status dimension, three indicators are positively associated with accessibility. These include “% employer” (X33), “% manager” (X36) and “% blue-collar workers” (X40). In terms of influence scope, “% Blue-Collar Workers” ranks highest with seven documented relationships, while both “% manager” and “% employer” are each associated with one. When comparing influence strength, “% employer” (X33 and Y19, g = 1.57) demonstrates the strongest effect, slightly higher than “% manager” (X36 and Y19, g = 1.55), followed by “% blue-collar workers” (X40 and Y12, g = 0.98). In the population vulnerability dimension, five indicators show positive relationships with accessibility. These are “% non-working population” (X48), “unemployment rate” (X49), “% without property ownership” (X50), “% households without tap water” (X51), and “% migrant population” (X52). Regarding influence scope, “% non-working population” has the most connections with six relationships, followed by “% without property ownership” with four, “% migrant population” with three, and both “unemployment rate” and “% households without tap water” with two each. In terms of effect size, “% non-working population” (X48 and Y3, g = 1.12) again ranks highest, followed by “% without property ownership” (X50 and Y7, g = 1.01), “unemployment rate” (X49 and Y3, g = 0.75), “% migrant population” (X52 and Y3, g = 0.56), and “% households without tap water” (X51 and Y4, g = 0.54). For both the race and origin and the marital status dimensions, only a single indicator in each group shows a positive relationship with accessibility. In the former, “% from HK/TW (China)” (X55 and Y19, g = 1.6) demonstrates a strong effect, while in the latter, “proportion of divorced couples” (X67 and Y5, g = 0.65) reflects a more moderate influence.
Figure 2.
The influence of socio-economic and demographic indicators on UGS attribute indicators: accessibility (a), amenities (b), and security (c) (refer to Supplementary Table S2 for detailed influence coefficients).
In Figure 2a, the socio-economic and demographic indicator groups that exhibit a negative impact on accessibility include “age”, “economic”, “gender”, “education”, “occupation and employment status”, “population vulnerability”, “race and origin”, and “marital status”. Within the “age”, “gender”, “education”, and “race and origin” dimensions, only one indicator in each dimension shows a negative relationship with accessibility. These are “elderly population” (X1 and Y1, g = −0.40), “% gender—female” (X26 and Y19, g = −1.06), “% illiterate population” (X31 and Y12, g = −1.19), and “proportion from Macau (China)” (X53 and Y19, g = −1.01), respectively. In the economic dimension, two indicators are negatively associated with accessibility. These include “% low-income households” (X17) and “% public rental housing households” (X19). In terms of influence scope, “% public rental housing households” ranks higher with five relationships, compared to two for “% low-income households.” However, in terms of influence strength, “% low-income households” (X17 and Y8, g = −0.61) exerts a greater negative effect than “% public rental housing households” (X19 and Y7, g = −0.44). Within the occupation and employment status dimension, two indicators exhibit negative relationships with accessibility. These are “% employee” (X35) and “% worker” (X39). As each indicator is associated with only one negative relationship, they share the same influence scope. When comparing effect sizes, “% worker” (X39 and Y19, g = −1.46) has a stronger impact than “% employee” (X35 and Y19, g = −1.19). In the population vulnerability dimension, five indicators contribute to negative associations with accessibility. These are “% non-working population” (X48), “unemployment rate” (X49), “% without property ownership” (X50), “% households without tap water” (X51), and “% migrant population” (X52). In terms of influence scope, “% migrant population” ranks highest with three relationships, followed by “unemployment rate” with two. The remaining three indicators are each linked to only one relationship. Regarding standardized effect size, “unemployment rate” (X49 and Y13, g = −0.70) shows the largest negative effect, followed by “% migrant population” (X52 and Y13, g = −0.47), “% households without tap water” (X51 and Y14, g = −0.30), and “% without property ownership” (X50 and Y13, g = –0.14). Although “% non-working population” is also statistically negatively associated with accessibility (X48 and Y13, g = −0.08), its effect size is very small, indicating a weak practical influence. In the marital status dimension, only one indicator—“proportion of divorced couples” (X67) is negatively associated with accessibility. It is linked to two relationships, with the strongest effect observed in X67 and Y4 (g = −0.47).
According to Figure 2b, the socio-economic and demographic indicator groups that exhibit a positive influence on amenities include “age”, “economic”, “gender”, “education”, “population vulnerability”, “race and origin” and “health level”. In the age dimension, four indicators are positively associated with amenities. These include “% children aged 0–20” (X2), “proportion of age group—teen” (X8), “proportion of age group—adult” (X9), and “proportion of age group—elderly” (X10). Each of these indicators is linked to only one positive relationship, resulting in equal influence scope. When ranked by effect size, “proportion of age group—elderly” (X10 and Y20, g = 0.54) demonstrates the strongest influence, followed by “proportion of age group—teen” (X8 and Y20, g = 0.51), “proportion of age group—adult” (X9 and Y20, g = 0.42), and “% children aged 0–20” (X2 and Y30, g = 0.41). Within the economic, education, and population vulnerability dimensions, only one socio-economic and demographic indicator in each is positively associated with amenities. These are “income level” (12 relationships), “education level” (six relationships), and “% cyclical welfare recipients” one relationship), respectively. In terms of maximum effect size, “income level” (X20 and Y43, g = 1.28) ranks highest, followed by “education level” (X32 and Y29, g = 0.43) and “% cyclical welfare recipients” (X45 and Y30, g = 0.43). In the gender dimension, two indicators are positively associated with amenities. These are “% gender—female” (X26) and “gender ratio (male-to-female ratio)” (X28). Regarding influence scope, “gender ratio (male-to-female ratio)” has seven relationships, significantly more than “proportion of gender—female,” which is associated with only one. In terms of effect size, “gender ratio (male-to-female ratio)” (X28 and Y40, g = 1.00) ranks higher than “% gender—female” (X26 and Y20, g = 0.23). Within the race and origin dimension, six indicators contribute to positive relationships with amenities. These include “proportion of Non-Hispanic black population” (X58), “population of Hispanic” (X59), “proportion of non-Hispanic/White/Black” (X60), “proportion of Spanish-Speaking Latino” (X62), “proportion of Asian/Pacific Islander/other Races” (X64), and “density of minority population distribution” (X65). In terms of influence scope, “density of minority population distribution” has the most relationships, with four, while all other indicators are each associated with one. When ranked by influence strength, “density of minority population distribution” (X65 and Y43, g = 1.42) shows the strongest effect, followed by “proportion of Non-Hispanic/White/Black” (X60 and Y51, g = 0.40), “population of Hispanic” (X59 and Y51, g = 0.35), “proportion of Non-Hispanic Black population” (X58 and Y51, g = 0.28), “proportion of Spanish-speaking Latino” (X62 and Y31, g = 0.24), and “proportion of Asian/Pacific Islander/other races” (X64 and Y31, g = 0.19). In the health level dimension, two indicators are positively associated with amenities. These are “proportion of population with good health status” (X69) and “proportion of overweight population” (X70). Each of these indicators is linked to two relationships, indicating equal influence scope. When comparing effect sizes, “proportion of population with good health status” (X69 and Y20, g = 0.51) exhibits a stronger influence than “Proportion of Overweight Population” (X70 and Y31, g = 0.25).
In Figure 2b, the socio-economic and demographic indicator groups that exhibit a negative impact on amenities include “age”, “economic”, “gender”, “population vulnerability” and “race and origin”. In the age dimension, four indicators show negative associations with amenities. These include “% elderly aged 61 to 80” (X3), “% elderly aged ≥81” (X4), “age (number)” (X6), and “age distribution” (X11). In terms of influence scope, “age (number)” is the most extensively linked, with eight relationships, followed by “age distribution” with two, and both elderly population indicators with one each. Regarding influence strength, “age (number)” (X6 and Y27, g = −0.36) has the strongest effect, followed by “% elderly aged 61 to 80” (X3 and Y30, g = −0.35), “% elderly aged ≥ 81” (X4 and Y30, g = −0.35), and “age distribution” (X11 and Y20, g = −0.01). Within the economic and gender dimensions, only one indicator in each is negatively related to amenities. These are “income level” (X20 and Y47, g = −1.18) and “proportion of female population” (X27 and Y20, g = −0.27), respectively. In the population vulnerability dimension, three indicators are negatively associated with amenities. These include “% unemployed population to total population” (X41), “% targeted welfare recipients to total population” (X44), and “% children aged 0 to 10 receiving meal assistance” (X47). Each indicator is linked to only one UGS-related variable within the amenities category. Ranked by effect size, “% children aged 0 to 10 receiving meal assistance” (X47 and Y30, g = −0.80) shows the strongest influence, followed by “% unemployed population to total population” (X41 and Y30, g = −0.52) and “% targeted welfare recipients to total population” (X44 and Y30, g = −0.45). Within the race and origin dimension, three indicators show negative relationships with amenities. These are “proportion of black population” (X61), “proportion of English-speaking Latino” (X63), and “density of minority population distribution” (X65). Each is associated with only one UGS indicator. In terms of influence strength, “density of minority population distribution” (X65 and Y47, g = −0.93) ranks highest, followed by “proportion of English-speaking Latino” (X63 and Y20, g = −0.43) and “proportion of Black Population” (X61 and Y20, g = −0.29).
According to Figure 2c, the socio-economic and demographic indicator groups that demonstrate a positive influence on security include “gender” and “race and origin”. Only the gender group exhibits a negative association with security. For positive relationships, the strongest effects are observed for “gender ratio (male to female ratio)” (X28 and Y71, g = 0.513) within the gender group and “proportion of non-Hispanic Black population” (X58 and Y73, g = 0.508) within the race and origin group. For the negative relationship, “gender ratio (male to female ratio)” (X28 and Y67, g = −0.46) shows a moderate negative effect on security.
3.3. The Spatiotemporal Differences in the UGS Case Studies
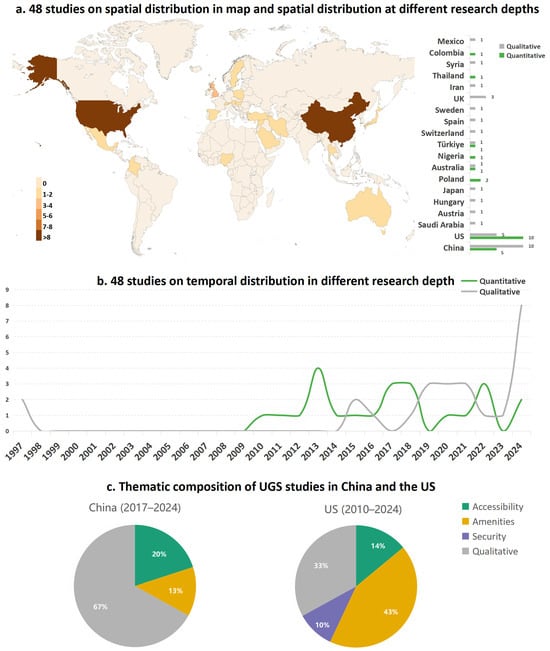
The 48 case studies are distributed across 19 countries (Figure 3a). Among them, China and the United States stand out as the most extensively studied nations, with each hosting more than eight publications. Most other countries contributed fewer than three studies, and their spatial coverage remains fragmented. While the United States and China each include both qualitative and quantitative research, other countries exhibit single-mode study patterns. For example, only qualitative studies were conducted in Mexico, Syria, Iran, the United Kingdom, Sweden, Spain, Switzerland, Japan, Hungary, Austria, and Saudi Arabia. In contrast, exclusively quantitative studies were identified in Colombia, Thailand, Nigeria, and Poland. Australia and Turkey are the only other countries to contribute both types of studies, albeit with only one each. This underscores the relatively concentrated nature of comprehensive research, with China and the United States remaining the only countries exhibiting both a high volume and diversity of study types.
Figure 3.
(a) The spatial distribution and (b) temporal trends of the 48 UGS case studies; (c) the thematic compositions of UGS case studies in China and the United States as the two most studied countries.
Figure 3b illustrates the temporal trends in qualitative and quantitative studies from 1997 to 2024. Early studies were largely qualitative and sporadic, with a long dormant period until the early 2010s. Quantitative studies began emerging around 2010 and peaked in 2013. Qualitative research surged after 2017, showing a steep upward trajectory and peaking in 2024, suggesting a growing interest in user perspectives and interpretative approaches in recent years. In contrast, the number of quantitative studies remained stable but relatively limited during the same period.
The two countries with the highest number of studies—China and the United States are further examined (Figure 3c). Thematic patterns between China and the United States diverge notably. For China, UGS research from 2017 to 2024 is predominantly qualitative (67%), with only 20% focusing on accessibility and 13% on amenities. No studies addressed security. In contrast, the United States studies from 2010 to 2024 are more evenly distributed: 43% focus on amenities, 33% are qualitative, 14% on accessibility, and 10% on security. This indicates that UGS studies in the United States adopt a broader thematic scope with more balanced methodological approaches, while China’s research remains primarily qualitative and thematically concentrated.
4. Discussion and Implications
This study conducted a meta-analytical synthesis of global case study research on UGS. It collected 48 case studies from an initial pool of 505 peer-reviewed studies in WoS, measured the breadth and depth of their knowledge on the relationships between UGS attributes and socio-economic and demographic indicators, and examined their temporal and spatial scopes. Key findings and implications are discussed below.
The relation distribution between the UGS metrics and potentially associated socio-economic and demographic indicators reveals significant imbalances of UGS knowledge across UGS attributes and users’ characteristics (Figure 1). A total of 75 socio-economic and demographic indicators across 10 socio-economic categories, and 73 UGS indicators across three UGS categories were identified. Among three UGS attributes, amenities dominate with 32 indicators encompassing features such as facility provision, environmental quality, and recreational opportunities, followed by security (22 indicators) and accessibility (19 indicators). The relationship model contains 258 links representing relationships between UGS attributes and the socio-economic indicators, in which accessibility receives the most empirical attention (120 relationships), 106 for amenities and just 32 for security. The 120 links for accessibility mainly come from “population vulnerability” (33), “economic” (29), “age” (15), “occupation and employment status” (14), “education” (10), “population density” (9), and “race and origin” (5). Of the 106 links for amenities, 27 links come from “economic”, 20 from “race and origin”, 18 from “age”, 13 from “gender”, 12 from “education”, and eight from “population vulnerability”. Of the 32 links for security broadly encompassing personal safety, crime risk, and perceived safety within green spaces, “gender” overwhelmingly dominate with 22 links, then “race and origin” (five links). The absence of lighting as an explicit security indicator further suggests a specific blind spot in empirical UGS research. This omission may reflect a fragmented research landscape in which UGS studies often focus on accessibility, facilities, vegetation, and perceived safety, whereas lighting is more commonly examined in street design, transport, crime prevention, or built environment research. Thus, lighting remains insufficiently operationalized as a measurable UGS safety indicator and should be more systematically examined in future studies. While “economic” such as “% public rental housing households” and “income level” has the numerous links with accessibility and amenities, “population vulnerability” and “population density” specifically associated with accessibility, “race and origin” and “economic” associated with amenities and “gender” for security are understandable, this imbalanced focus could narrow the analytical landscape and neglect some important social dimensions like marital status and health level, underscoring the need that more comprehensively reflects the match of UGS attributes with diverse socio-economic and demographic contexts.
The relationship model reveals that many reported associations have not yet received consistent, quantifiable empirical support. Of the total 258 links, 156 are statistically significant, while 49 are statistically non-significant and 53 are conceptual or qualitative. This does not imply the absence of relationships, but indicates that a substantial share of the evidence remains difficult to compare or directly generalize across studies. Among 156 significant links, 74 (e.g., “population vulnerability”, “economic”, and “occupation and employment status”) are for accessibility, 64 (e.g., “economic”, “race and origin” and “age”) for amenities, and 18 (e.g., “gender” and “race and origin”) for security. The finding imply that the relationship between “economic” and “education” indicators and security highlights an under-theorized dimension; the exclusive association of “occupation and employment status” with accessibility and complete absence of associations with amenities and security points to a narrowly constructed understanding of occupational dynamics; the consistent yet understudied connections between “race and origin” and security highlight the racialization of security experiences in green spaces and warrant more focused intersectional investigation; the limited number of relationships associated with marital status reveals its marginalization within UGS research; the weak and often qualitative associations observed for “population density” underscore the necessity of developing more nuanced, context-sensitive approaches; the strong negative correlation between “age” indicators and amenity perception suggests that existing UGS designs may inadequately address the needs of older adults; and the lack of engagement from “economic” and “population vulnerability” indicators with security reflects a conceptual blind spot in understanding how intersecting social disadvantages shape security experiences. This finding is consistent with the findings of Wolch et al. [30] and Wolff et al. [21].
The meta-analytical impact effect analysis further reveals that there are only few of consistent and conclusive findings which can be directly applicable to UGS planning and design. The meta-analytical results for accessibility reveal a clear pattern: “Education” shows the strongest positive influence (g = 1.67), followed closely by “Race and origin” (g = 1.60) and “Occupation and employment status” (g = 1.57) (Figure 2a). Meanwhile, it is noted that the “occupation and employment status” group also records the most pronounced negative effect (g = −1.46). The relatively large standardized effect sizes associated with education and occupation and employment status may reflect broader socio-spatial mechanisms rather than only individual awareness of UGS benefits. Education and occupation can shape residential location, transport options, time availability, and the ability to navigate public service systems, thereby influencing actual access to UGS [37]. The strong racial and ethnic effects further point to persistent structural inequities in the use of UGS, which is consistent with environmental justice perspectives on the uneven distribution of urban environmental benefits [30]. For planners and policymakers, this means that interventions must address not only where parks are located, but also the socio-economic barriers, ethnic segregation, and everyday mobility constraints that mediate who is actually able to access them. The meta-analytical findings for amenities point to “race and origin” as the most influential factor (g = 1.42) (Figure 2b). Positive contributions also come from “gender” (g = 1.00), “age” (g = 0.54), “education” (g = 0.43) and “population vulnerability” (g = 0.43). On the negative side, the strongest disadvantage stems from the “economic” status (g = −1.18), with “race and origin” (g = −0.93) and “population vulnerability” (g = −0.80). These results suggest that amenity experiences are mediated by deep socio-economic and demographic divides. The prominence of race and ethnicity reflects how cultural preferences, discrimination, and historical patterns of neighborhood development shape access to quality facilities. Gendered differences may reflect variation in perceived suitability or inclusiveness of amenities, while education and age effects underscore the importance of life stage and knowledge in shaping how amenities are valued. Conversely, the sharp negative impact of economic disadvantage suggests that affordability, neighborhood disinvestment, and lack of targeted provision remain significant obstacles for lower-income populations. Taken together, these findings resonate with theories of environmental justice in exposing uneven access to environmental benefits, but it also highlights the need to integrate perspectives from community cohesion and social determinants of health. For urban planners, this implies that ensuring equitable amenities requires addressing structural inequities linked to ethnicity, income, and vulnerability, rather than assuming that simply increasing the number of facilities will translate into universal benefits. For security (Figure 2c), the analysis shows that only a limited set of socio-demographic factors exert a significant influence: “gender” (g = 0.51) and “race and origin” (g = 0.51). Yet gender also exhibits a moderate negative effect (g = −0.46), underscoring its dual and context-dependent role. These results suggest that perceptions of safety in UGS are particularly sensitive to social identity markers. Racial and ethnic influences may arise from experiences of discrimination, neighborhood segregation, or unequal exposure to policing and surveillance in public spaces. These findings resonate with Defensible Space Theory, which emphasizes surveillance and territorial control. For planning, this implies that improving safety in UGS requires giving attention to cultural diversity, and gender-sensitive design. While the three attributes of UGS are considered at same time, fewer consistent and conclusive findings could be applied in practice. These findings recognize the multidimensional nature of UGS and the need for context-sensitive consideration, but urgently require a unified assessment framework for efficiently improving the knowledge discovery.
The effect size patterns in Figure 2 also suggest practical directions for more targeted UGS planning and management. For accessibility, planners should identify underserved groups through fine-grained improvements in pedestrian connections, public transport links, entrance placement, and barrier-free routes. For amenities, management should improve not only facility provision, but also maintenance, shade, seating, recreational diversity, and culturally inclusive spaces in socially vulnerable neighborhoods. For security, greater attention should be given to groups with different safety perceptions by improving visibility, lighting, route clarity, surveillance, and the maintenance of hidden or poorly managed areas. These interventions can help address unequal accessibility, amenity experience, and perceived safety, while their broader applicability should be interpreted together with the spatiotemporal evidence discussed below.
The spatial configuration of current UGS research (Figure 3a) indicates a marked geographical imbalance in the global knowledge base, with most cases concentrated in China and the United States. This imbalance may partly reflect asymmetries in research capacity and funding [51]. As a result, the lived experiences and environmental realities of cities across much of Africa, South Asia, and Latin America remain underrepresented, which constrains the development of more globally inclusive UGS design frameworks. Temporal trends (Figure 3b) further illustrate the irregular evolution of methodological depth in UGS research, indicating that UGS research still lies in the early stage. A closer examination of the two most prolific countries (Figure 3c) further reveals divergent research trajectories and different foci [51,52]. These findings indicate that the WoS-indexed empirical evidence synthesized in this study is geographically uneven, which limits the external generalizability of the resulting knowledge map. Addressing this fragmentation calls for deliberate efforts to expand empirical research in understudied regions, invest in methodological development for diverse contexts, and encourage cross-national collaborations that bridge epistemic divides. The divergent thematic patterns between China and the United States also have implications for international UGS planning. Rather than treating findings from one national context as directly transferable, planners should consider which UGS dimensions are represented in the underlying evidence. For example, evidence dominated by accessibility may offer limited guidance for amenity quality or security concerns, while more balanced thematic coverage can better support multidimensional UGS assessment. Cross-context learning therefore requires attention not only to where studies are conducted, but also to what dimensions of UGS they actually examine.
These findings also provide practical implications for spatial environmental justice in UGS planning. Rather than translating the identified relationships into universal design rules, planners should interpret them according to local socio-demographic and spatial contexts. In high-density urban contexts, such as many Chinese cities, UGS planning should move beyond uniform area-based provision and pay greater attention to fine-grained accessibility, service pressure, and the needs of socially vulnerable groups. In socio-spatially segregated contexts, such as many U.S. cities, planning should further consider disparities in access, amenity quality, maintenance, perceived safety, and culturally inclusive facilities in underserved neighborhoods. Such context-sensitive strategies can better link UGS provision with socio-demographic inequality and support more equitable urban sustainability.
Our approach innovatively assesses the breadth, depth, and spatial-temporal scope of the existing knowledge in UGS for future research and practices in UGS. It should be noted that this study has several limitations. First, relying solely on WoS English-language journal articles may introduce database and language biases; therefore, the knowledge map mainly reflects WoS-indexed empirical UGS research rather than the complete global UGS knowledge base. The limited number of case studies inevitably raises concerns about representativeness, highlighting the need for future reviews to adopt broader criteria, triangulate across multiple databases, or integrate gray literature. However, it may represent the knowledge status of UGS research. Second, although Hedges’ g was used to standardize reported effects, heterogeneity in model specifications, variable measurements, and sample characteristics means that these values should be interpreted as relative descriptive indicators rather than absolutely comparable impact rankings.
5. Conclusions
This study synthesized 48 WoS-indexed UGS case studies and identified 75 socio-economic and demographic indicators, 73 UGS indicators, and 258 reported links between them. The findings show clear imbalances in both knowledge breadth and depth: security remains the most under-researched UGS dimension, while factors such as education and race and origin show relatively large but context-dependent standardized effect sizes. Many associations have not yet received consistent and quantifiable empirical support for direct generalization to UGS planning and design, and the geographical concentration of the sampled WoS-indexed studies in China and the United States further limits the external generalizability of the synthesized evidence. These findings highlight the need for a more unified and context-sensitive assessment framework to improve knowledge discovery and applicability in UGS planning and design.
Supplementary Materials
The following supporting information can be downloaded at: https://www.mdpi.com/article/10.3390/su18136905/s1.
Author Contributions
Conceptualization, H.Z. and Y.W.; Methodology, H.Z., Y.W. and S.W.; Formal analysis, Y.W., S.W. and K.Y.; Investigation, H.Z.; Writing—original draft, H.Z. and Y.W.; Writing—review & editing, H.Z., Y.W., S.W. and K.Y.; Visualization, H.Z. and Y.W. All authors have read and agreed to the published version of the manuscript.
Funding
This research received no external funding.
Institutional Review Board Statement
Not applicable.
Informed Consent Statement
Not applicable.
Data Availability Statement
The original contributions presented in this study are included in the article/Supplementary Materials. Further inquiries can be directed to the corresponding author.
Conflicts of Interest
The authors declare no conflict of interest.
References
- Rogers, R. Cities for a Small Planet; Basic Books: New York, NY, USA, 2008. [Google Scholar]
- Seto, K.C.; Shepherd, J.M. Global urban land-use trends and climate impacts. Curr. Opin. Environ. Sustain. 2009, 1, 89–95. [Google Scholar] [CrossRef] [Scilit]
- Semeraro, T.; Pomes, A.; Del Giudice, C.; Negro, D.; Aretano, R. Planning ground based utility scale solar energy as green infrastructure to enhance ecosystem services. Energy Policy 2018, 117, 218–227. [Google Scholar] [CrossRef] [Scilit]
- Lee, A.C.K.; Maheswaran, R. The health benefits of urban green spaces: A review of the evidence. J. Public Health 2010, 33, 212–222. [Google Scholar] [CrossRef] [Scilit] [PubMed]
- Richards, D.R.; Law, A.; Tan, C.S.Y.; Shaikh, S.F.E.A.; Carrasco, L.R.; Jaung, W.; Oh, R.R.Y. Rapid urbanisation in Singapore causes a shift from local provisioning and regulating to cultural ecosystem services use. Ecosyst. Serv. 2020, 46, 101193. [Google Scholar] [CrossRef] [Scilit]
- Jennings, V.; Bamkole, O. The relationship between social cohesion and urban green space: An avenue for health promotion. Int. J. Environ. Res. Public Health 2019, 16, 452. [Google Scholar] [CrossRef] [Scilit] [PubMed]
- Tzoulas, K.; Korpela, K.; Venn, S.; Yli-Pelkonen, V.; Kaźmierczak, A.; Niemela, J.; James, P. Promoting ecosystem and human health in urban areas using green infrastructure: A literature review. Landsc. Urban Plan. 2007, 81, 167–178. [Google Scholar] [CrossRef] [Scilit]
- Gupta, K.; Kumar, P.; Pathan, S.K.; Sharma, K.P. Urban neighborhood green index—A measure of green spaces in urban areas. Landsc. Urban Plan. 2012, 105, 325–335. [Google Scholar] [CrossRef] [Scilit]
- Lopes, M.N.; Camanho, A.S. Public green space use and consequences on urban vitality: An assessment of European cities. Soc. Indic. Res. 2012, 113, 751–767. [Google Scholar] [CrossRef] [Scilit]
- Coombes, E.; Jones, A.P.; Hillsdon, M. The relationship of physical activity and overweight to objectively measured green space accessibility and use. Soc. Sci. Med. 2010, 70, 816–822. [Google Scholar] [CrossRef] [Scilit] [PubMed]
- Van Herzele, A.; Wiedemann, T. A monitoring tool for the provision of accessible and attractive urban green spaces. Landsc. Urban Plan. 2003, 63, 109–126. [Google Scholar] [CrossRef] [Scilit]
- Taylor, N. Legibility and aesthetics in urban design. J. Urban Des. 2009, 14, 189–202. [Google Scholar] [CrossRef] [Scilit]
- Maas, J.; Spreeuwenberg, P.; van Winsum-Westra, M.; Verheij, R.A.; Vries, S.; Groenewegen, P.P. Is green space in the living environment associated with people’s feelings of social safety? Environ. Plan. A Econ. Space 2009, 41, 1763–1777. [Google Scholar] [CrossRef] [Scilit]
- Zhao, J.; Huang, Y. Physical characteristics of urban green spaces in relation to perceived safety. J. Urban Plan. Dev. 2021, 147, 05021032. [Google Scholar] [CrossRef] [Scilit]
- Lis, A.; Iwankowski, P. Why is dense vegetation in city parks unpopular? The mediative role of sense of privacy and safety. Urban For. Urban Green. 2021, 59, 126988. [Google Scholar] [CrossRef] [Scilit]
- Lis, A.; Zalewska, K.; Pardela, Ł.; Adamczak, E.; Cenarska, A.; Bławicka, K.; Brzegowa, B.; Matiiuk, A. How the amount of greenery in city parks impacts visitor preferences in the context of naturalness, legibility and perceived danger. Landsc. Urban Plan. 2022, 228, 104556. [Google Scholar] [CrossRef] [Scilit]
- Middleton, J.; Samanani, F. Whose city? Which sociality? Urban Geogr. 2022, 43, 777–783. [Google Scholar] [CrossRef] [Scilit] [PubMed]
- Rasidi, M.H.; Jamirsah, N.; Said, I. Urban green space design affects urban residents’ social interaction. Procedia-Soc. Behav. Sci. 2012, 68, 464–480. [Google Scholar] [CrossRef] [Scilit]
- Derr, V. Urban green spaces as participatory learning laboratories. Proc. Inst. Civ. Eng.-Urban Des. Plan. 2018, 171, 25–33. [Google Scholar] [CrossRef] [Scilit]
- Collins, C.; Haase, D.; Heiland, S.; Kabisch, N. Urban green space interaction and wellbeing—Investigating the experience of international students in Berlin during the first COVID-19 lockdown. Urban For. Urban Green. 2022, 70, 127543. [Google Scholar] [CrossRef] [Scilit] [PubMed]
- Wolff, M.; Mascarenhas, A.; Haase, A.; Haase, D.; Andersson, E.; Borgström, S.T.; Kronenberg, J.; Łaszkiewicz, E.; Biernacka, M. Conceptualizing multidimensional barriers: A framework for assessing constraints in realizing recreational benefits of urban green spaces. Ecol. Soc. 2022, 27, 17. [Google Scholar] [CrossRef] [Scilit]
- Ko, H.; Son, Y. Perceptions of cultural ecosystem services in urban green spaces: A case study in Gwacheon, Republic of Korea. Ecol. Indic. 2018, 91, 299–306. [Google Scholar] [CrossRef] [Scilit]
- Selanon, P.; Chuangchai, W. The importance of urban green spaces in enhancing holistic health and sustainable well-being for people with disabilities: A narrative review. Buildings 2023, 13, 2100. [Google Scholar] [CrossRef] [Scilit]
- Corazon, S.S.; Gramkow, M.C.; Poulsen, D.V.; Lygum, V.L.; Zhang, G.; Stigsdotter, U.K. I would really like to visit the forest, but it is just too difficult: A qualitative study on mobility disability and green spaces. Scand. J. Disabil. Res. 2019, 20, 1–13. [Google Scholar] [CrossRef] [Scilit]
- James, P.; Banay, R.F.; Hart, J.E.; Laden, F. A review of the health benefits of greenness. Curr. Epidemiol. Rep. 2015, 2, 131–142. [Google Scholar] [CrossRef] [Scilit] [PubMed]
- Blanck, H.M.; Allen, D.; Bashir, Z.; Gordon, N.; Goodman, A.; Merriam, D.; Rutt, C. Let’s go to the park today: The role of parks in obesity prevention and improving the public’s health. Child. Obes. 2012, 8, 423–428. [Google Scholar] [CrossRef] [Scilit] [PubMed]
- Zheng, H.; Wei, Y.; Yang, K.; Wu, S. An assessment framework for adaptive management of urban green space in South-east Queensland, Australia. Cities 2024, 168, 106423. [Google Scholar] [CrossRef] [Scilit]
- Tao, Y.; Tao, Y. Integrating aesthetic education in quality education: A bibliometric analysis of sustainable development perspectives. Sustainability 2024, 16, 855. [Google Scholar] [CrossRef] [Scilit]
- Han, Y.; Liang, Y. Scientific knowledge map study of therapeutic landscapes and community open spaces: Visual analysis with citespace. Sustainability 2023, 15, 15066. [Google Scholar] [CrossRef] [Scilit]
- Wolch, J.R.; Byrne, J.; Newell, J.P. Urban green space, public health, and environmental justice: The challenge of making cities ‘just green enough’. Landsc. Urban Plan. 2014, 125, 234–244. [Google Scholar] [CrossRef] [Scilit]
- Bazrafshan, M.; Tabrizi, A.M.; Bauer, N.; Kienast, F. Place attachment through interaction with urban parks: A cross-cultural study. Urban For. Urban Green. 2021, 61, 127103. [Google Scholar] [CrossRef] [Scilit]
- Guitart, D.; Pickering, C.; Byrne, J. Past results and future directions in urban community gardens research. Urban For. Urban Green. 2012, 11, 364–373. [Google Scholar] [CrossRef] [Scilit]
- Pauleit, S.; Vasquéz, A.; Maruthaveeran, S.; Liu, L.; Cilliers, S.S. Urban green infrastructure in the global south. In Urban Ecology in the Global South. Cities and Nature; Springer: Cham, Switzerland, 2021; pp. 107–143. [Google Scholar] [CrossRef] [Scilit]
- Asadpour, H.; Razmara, M.; Heidari, A.A.; Taghipour, M. Privacy, patterns, and factors in urban open spaces (Case study: Jannat Park in Shiraz City). MEGARON/Yıldız Tech. Univ. Fac. Archit. E-J. 2022, 17, 195–208. [Google Scholar] [CrossRef] [Scilit]
- Bullard, R.D. Dumping in Dixie: Race, Class, and Environmental Quality; Westview Press: Boulder, CO, USA, 1990. [Google Scholar]
- Schlosberg, D. Reconceiving environmental justice: Global movements and political theories. Environ. Politics 2004, 13, 517–540. [Google Scholar] [CrossRef] [Scilit]
- Marmot, M. Social determinants of health inequalities. Lancet 2005, 365, 1099–1104. [Google Scholar] [CrossRef] [Scilit] [PubMed]
- Newman, O. Defensible Space: Crime Prevention Through Urban Design; Macmillan: New York, NY, USA, 1972. [Google Scholar]
- Lynch, K. The Image of the City; MIT Press: Cambridge, MA, USA, 1960. [Google Scholar]
- Gibson, J.J. The Ecological Approach to Visual Perception; Houghton Mifflin: Boston, MA, USA, 1979. [Google Scholar]
- Putnam, R.D. Bowling Alone: The Collapse and Revival of American Community; Simon and Schuster: New York, NY, USA, 2000. [Google Scholar]
- Gehl, J. Life Between Buildings: Using Public Space; Island Press: Washington, DC, USA, 2011. [Google Scholar]
- Jennings, V.; Larson, L.; Yun, J. Advancing sustainability through urban green space: Cultural ecosystem services, equity, and social determinants of health. Int. J. Environ. Res. Public Health 2016, 13, 196. [Google Scholar] [CrossRef] [Scilit] [PubMed]
- Seeland, K.; Nicolè, S. Public green space and disabled users. Urban For. Urban Green. 2006, 5, 29–34. [Google Scholar] [CrossRef] [Scilit]
- Wang, L.; Shen, L.; Liu, H. Working hours influence preferences of residents for micro features of small urban green spaces. Sci. Rep. 2024, 14, 23948. [Google Scholar] [CrossRef] [Scilit] [PubMed]
- Groenewegen, P.P.; van den Berg, A.E.; de Vries, S.; Verheij, R.A. Vitamin G: Effects of green space on health, well-being, and social safety. BMC Public Health 2006, 6, 149. [Google Scholar] [CrossRef] [Scilit] [PubMed]
- Wu, S.; Wei, Y.; Wang, X. Structural gaps of water resources knowledge in global river basins. Hydrol. Earth Syst. Sci. 2021, 25, 5381–5398. [Google Scholar] [CrossRef] [Scilit]
- Chen, C. CiteSpace II: Detecting and visualizing emerging trends and transient patterns in scientific literature. J. Am. Soc. Inf. Sci. Technol. 2006, 57, 359–377. [Google Scholar]
- Wagner, C.S.; Roessner, J.D.; Bobb, K.; Klein, J.T.; Boyack, K.W.; Keyton, J.; Rafols, I.; Börner, K. Approaches to understanding and measuring interdisciplinary scientific research (IDR): A review of the literature. J. Informetr. 2011, 5, 14–26. [Google Scholar] [CrossRef] [Scilit]
- Borenstein, M.; Hedges, L.V.; Higgins, J.P.; Rothstein, H.R. A basic introduction to fixed-effect and random-effects models for meta-analysis. Res. Synth. Methods 2010, 1, 97–111. [Google Scholar] [PubMed]
- Ren, J.; Ma, Y. Research progress and prospects of green development from the perspective of geography. Prog. Geogr. 2020, 39, 1196–1209. [Google Scholar] [CrossRef] [Scilit]
- Zhang, R.; Zhang, C.-Q.; Cheng, W.; Lai, P.C.; Schüz, B. The neighborhood socioeconomic inequalities in urban parks in a high-density City: An environmental justice perspective. Landsc. Urban Plan. 2021, 211, 104099. [Google Scholar] [CrossRef] [Scilit]

Disclaimer/Publisher’s Note: The statements, opinions and data contained in all publications are solely those of the individual author(s) and contributor(s) and not of MDPI and/or the editor(s). MDPI and/or the editor(s) disclaim responsibility for any injury to people or property resulting from any ideas, methods, instructions or products referred to in the content. |
© 2026 by the authors. Licensee MDPI, Basel, Switzerland. This article is an open access article distributed under the terms and conditions of the Creative Commons Attribution (CC BY) license.