


Abstract
Assessing the sustainability of urban development, including road changes, is increasing from year to year and requires clear indicators for robust decision-making tools to gain knowledge across regions. This study conducts the selection of transportation routes over a longer period as an example to evaluate the sustainability of historical official routes in achieving economically cost-efficient operation and maintenance. Official ways in the Qiantang River Basin connected the Jiangnan region, the economic center of China, with surrounding provinces were assessed. During the past six hundred years, the official road network in this area gradually simplified, evolving from valley roads to river banks, which covered longer distances. However, this transformation lacks a systematic explanation. By applying the analytic hierarchy process (AHP) with geographic information system (GIS), quantitative analysis was gained and the results are as follows: (1) Among the influencing factors, the weights of transportation cost and population related to economic needs are 39.54% and 29.52% respectively, with a combined total of 69.06%. (2) The official road network is often designed for governing the people, but in places such as the Qiantang River Basin, economic logic superseded political imperatives, becoming the dominant factor in reshaping the official ways. (3) In the pre-industrial era characterized by limited technological capacity, the physical environment had a greater impact on economic costs, ultimately reshaping the spatial configuration of official route networks. Overall, the evolution of official routes reflects the decline in their military-political function, driven by sustained peace and long-term decline in strategic position. The evolution of the official ways in the Qiantang River Basin reveals the importance of economic benefits in road selection.
1. Introduction
Sustainable road selections reflect a state’s efficiency-oriented approach to resource allocation. As vital carriers of the evolution of human civilization, roads and transportation networks have continuously undergone dynamic adjustments in both form and function. The reasons for such change have always been widely related to the needs of people [1,2]. It is generally believed that taking the shortest route is the goal when choosing a road [3]. However, when we studied road changes in Zhejiang Province, China, in the past 600 years, such changes did not follow this principle. This prompts us to examine the profound driving mechanisms behind road changes in historical periods from multiple dimensions—including economic, social, environmental, and demographic factors—in order to reveal the intrinsic logic underlying the evolution of transportation networks at that time.
Obviously, this is a multi-criteria decision-making research topic, which naturally leads to the application of analytic hierarchy process (AHP) to solve the above problem. AHP has now developed into one of the leading theories in the field of multi-criteria decision-making and is widely used, such as in road selection [4,5,6,7,8,9,10,11]. Its main idea is to decompose complex problems into several levels and factors, compare and judge the importance between two indicators, establish a judgment matrix, and calculate the maximum eigenvalue and corresponding eigenvector of the judgment matrix to obtain the weight of different scheme importance levels, providing a basis for the selection of the best scheme [4]. This method effectively aligns with the natural tendency of humans to make relative judgments when faced with multiple options, rather than imposing an abstract, counterintuitive analytical model.
In the recent decade, AHP used for road selection, especially combining AHP and geographic information system (GIS), has received increasingly much more attentions [12,13,14,15,16,17,18,19,20,21,22,23]. The advantage of GIS is the visualization of geographic data. Road selection requires weighing multiple factors, and the AHP-GIS model combines the advantages of multi-angle analysis and visualization. It not only accommodates various influencing factors to achieve a more comprehensive analysis but also displays the optimal road location based on this foundation.
Many researchers prioritize various factors related to importance as the primary evaluation criteria for assessing road selection. Some emphasize the importance of engineering [10], while others consider transportation [12], environment [13], society [18], commuter perspectives [14], land use [9,20], and economic aspects, etc. Among numerous factors, the economy plays a crucial role in evaluating road choices [16,21]. They found and pointed out that the state of economic impact is the most critical factor. Great attention has been paid to maintenance costs, construction costs, and investments related to the economy [21]. In recent years, much more attentions were paid to sustainability of road changes related to economic factors’ rank priority [15,17,22].
The improvement of road traffic capacity significantly shortens the transportation time of goods, reduces enterprise operating costs, and enhances regional industrial competitiveness. This is a widely recognized common understanding that economic costs play an important role in road changes. For example, in the evaluation of road maintenance priority by Nautiyal and Sharma [19], it was found that road surface condition is the primary factor, with a weight ratio of 56.4%, and the proportion of socio-economic facilities along the road is 26.2%, ranking second, reflecting the importance of the economic value of the road. When planning the roads in the old city area, Maserrat et al. [6] found that the dominant factor was the dilapidated urban structure with a weight ratio of 26.83%, which means an increase in economic costs, and demolition cost is the secondary, accounting for 23.69%. Planning roads in hydrological and ecological sensitive areas, Long et al. [21] considered the proportion of forest roads as the primary factor and mileage maintenance costs as the secondary factor. Hosseini considers village distance as the dominant factor and infrastructure distance as the secondary dominant factor in forest road design, both of which are related to the economy [16]. For the above research work, researchers naturally strengthened their consideration of economic factors, and their research emphasized the economic value of roads. However, although the above studies have focused on the main factors of economic costs, they are all based on the urgent road selection issues that need to be addressed locally, but lack case studies on the fundamental reasons for long-term road changes.
In China, the main roads constructed by the state in the past were called official ways; these routes were the lifeblood of the nation and were equipped with postal institutions along the way [24]. Routes equipped with courier stations were designated as courier ways, while those serving urgent deliveries were designated as delivery ways; in practice, the two types of routes sometimes overlapped. Beyond information transmission and envoy reception, courier stations and urgent deliveries also enabled grassroots governance, reflecting the extension of state authority into local society [25]. Official way routes were shaped by a combination of natural, demographic, economic, and political factors, often exhibiting distinct historical continuity across dynasties [26]. At the same time, changes in official ways constituted a historical norm. In particular, political, military, and economic factors directly drove changes in the routes of official ways. The continuous strengthening of central authority led to the gradual expansion and increasing grid-like organization of the courier route network [27]. In strategically important areas, official route selection often prioritized administrative efficiency over disadvantages in distance or terrain [28]. Military campaigns or suppression activities could also lead to the development of new routes or elevate the status of existing routes [29]. Immigration drives economic development could prompt governments to establish new official ways [30,31], while former courier stations and courier ways were sometimes abolished, for example, if war led to a sharp decline in population and an economic recession [32]. Natural factors, including major hydrological, ecologic and climatic changes, also reshaped the routes of official ways [33,34,35].
The above views are implanted in traditional historical research ideas, which mainly rely on qualitative analysis to examine the factors influencing road changes and, by focusing on dominant factors but lacking quantitative determinations, tend to overlook secondary ones. For this reason, we chose to use analytical hierarchy process technology with quantitative analysis to quantify road changes and to identify the correlation using the weighting method. AHP aims to rank the relative priorities of various influencing factors, quantifying their importance, which means simultaneously considering both dominant and non-dominant factors [4].
Therefore, Qiantang River Basin was selected as the study area because it typically serves as a hub connecting China’s economic core with surrounding provinces and has been the most developed region in China since the Sui (begins from 581 AD) and Tang (618–907 AD) dynasties. Hangzhou is located at the confluence of the Qiantang River and the Beijing–Hangzhou Grand Canal, and its millennium-long prosperity stems from a transportation configuration characterized as a “dual hub of water and land.” In terms of water transport, the Qiantang River functioned as the east–west artery, conveying products from western Zhejiang and neighboring provinces to Hangzhou, while the Beijing–Hangzhou Grand Canal served as the north–south artery, facilitating exchange with North China. Land transportation relied on post roads leading to western Zhejiang as vital links, extending westward from Hangzhou to connect the two prefectures of Yanzhou and Quzhou and further reaching Jiangxi and Fujian Provinces. Yanzhou and Quzhou, which constitute the study area of this paper, are located in western Zhejiang. Since the Sui dynasty (581–618 AD), the excavation of the Grand Canal made the Yanzhou, Jinhua, and Quzhou prefectures located within the Qiantang River Basin key transit points for north–south transportation [36]. During the Southern Song Dynasty (1127–1276 AD), Yanzhou functioned both as a military barrier for the Southern Song capital Lin’an (the historical name of Hangzhou) and as a supply base for the capital’s resources [37]. Consequently, the western Zhejiang region received comprehensive attention from the state. At this time, the “Lanjiang Land Route” along the Qiantang River and the “Meiling Land Route” located in the valley area were both official land roads connecting Yanzhou and Quzhou. Also, the “Meiling Land Route” was additionally designated as the tribute route through which southwestern indigenous groups entered the capital, highlighting its dual political and economic value [38]. Since the Southern Song dynasty, Hangzhou developed into a major city in southeastern China, where economic vitality and population concentration flourished, earning it the reputation of the “City of Heaven” described by Marco Polo—an achievement inseparable from the contributions of the western Zhejiang region. However, in the Ming Dynasty (1368–1644 AD), the Meiling Land Route gradually became a private way rather than an official way.
This study focuses on the changes in the transportation network of the Qiantang River Basin over the past 600 years via the AHP-GIS model. The purpose of this study is to analyze the factors influencing road changes using data in the literature, to assign weights to each influencing factor using the analytic hierarchy process (AHP), to visualize the data using GIS and calculate the comprehensive cost surface, and, finally, to identify the road with the lowest comprehensive cost and compare it with the official roads of the Ming Dynasty. The findings indicate that Yanzhou and Quzhou were connected to the economic core regions; the construction of official roads was guided by economic efficiency rather than prioritizing political control. The results reveal the underlying logic of the evolution of ancient transportation networks—namely, that economic rationality constituted the central criterion in route selection.
2. Materials and Methods
2.1. Study Area
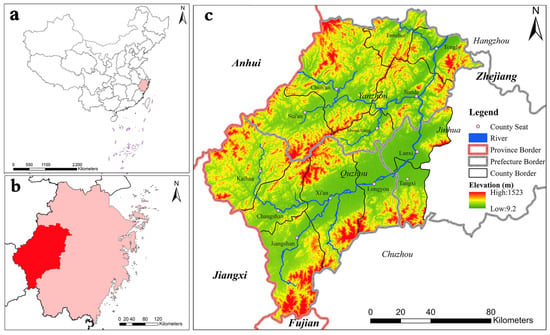
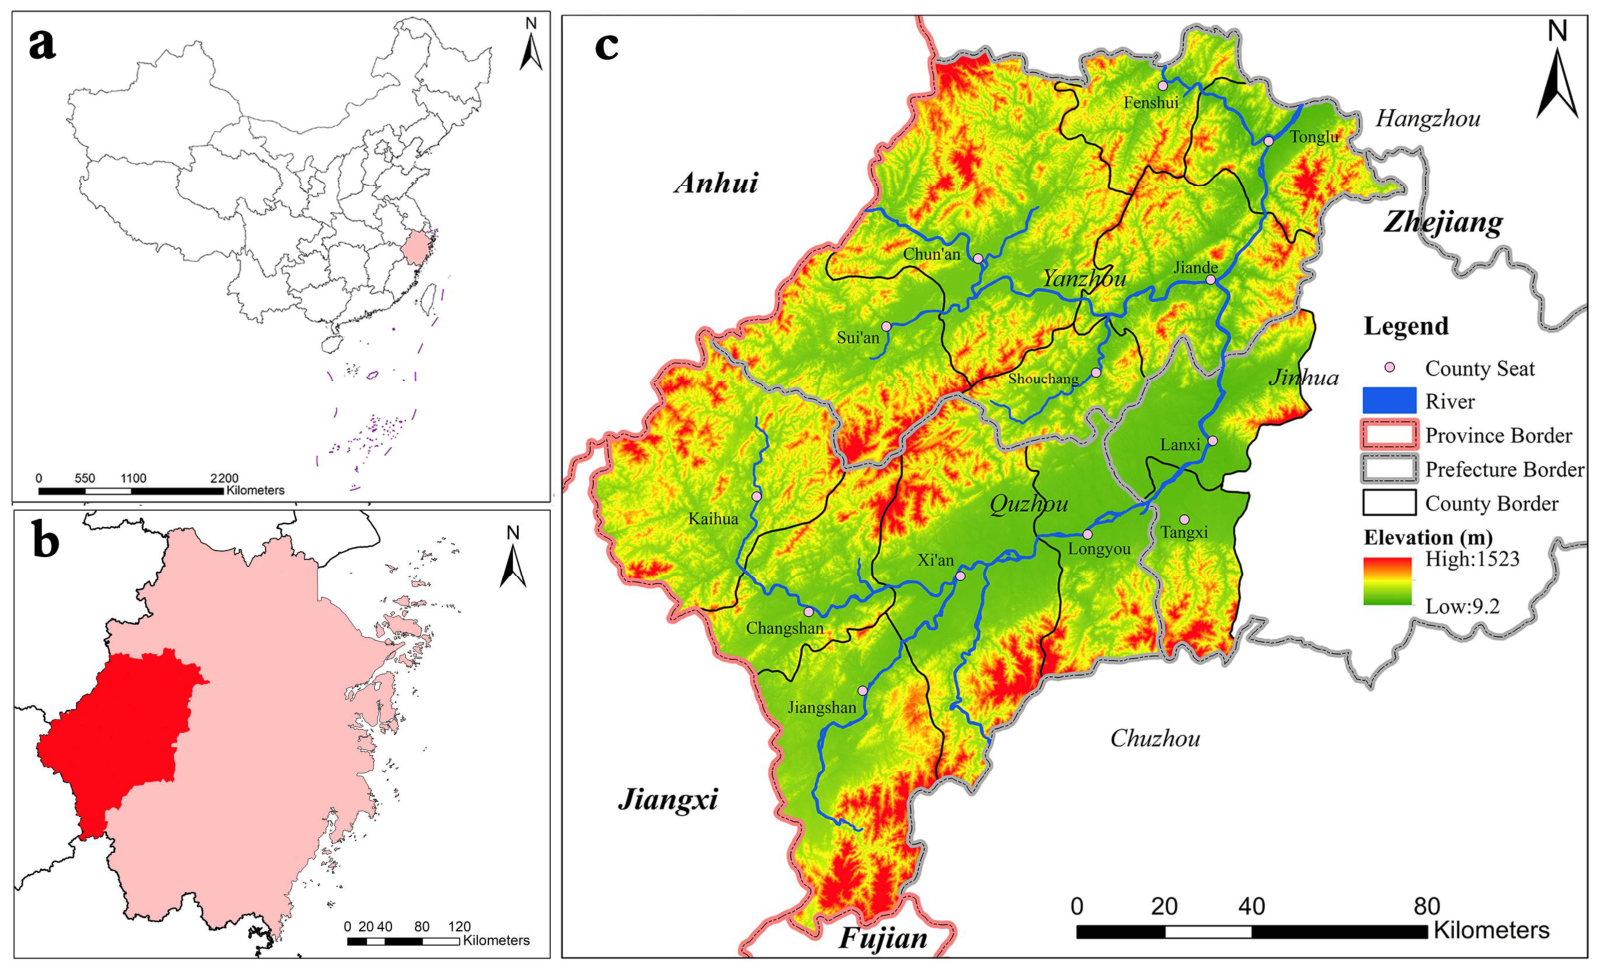
Figure 1 shows the study area, which is along the two official ways, covering the past six hundred years from the Song Dynasty (960–1279 AD) to Yuan Dynasty (1271–1368 AD), Ming Dynasty (1368–1644 AD), and Qing Dynasty (1644–1912 AD). In the Ming Dynasty, the area included the whole of Yanzhou Prefecture, the whole of Quzhou Prefecture, and Tangxi County and Lanxi County of Jinhua Prefecture, located in western Zhejiang Province (Figure 1b), Southeast China (Figure 1a).
Figure 1.
The study area: (a) the relative position of Zhejiang Province (in rose pink) in China; (b) the relative position of the study area (in fire red) in Zhejiang Province; (c) the place names and administrative divisions of the study area during the Ming Dynasty.
Figure 1c is drawn according to the data that comes from the 1911 Chinese administrative boundary on the CHGIS website (see Supplementary Figures S1–S4). Based on the waterway in Supplementary Figure S4, the waterway direction and path of Figures S1–S3 studied at that time were reconstructed.
Geographically, it lies between 118°1′43.08″ E and 119°58′23.52″ E and between 28°14′28.38″ N and 30°2′48.48″ N, with a minimum elevation of 9.2 m and a maximum elevation of 1523 m, covering a total area of 20,041.95 km2. The region is predominantly mountainous and hilly, though the southern counties of Xi’an, Longyou, Tangxi, and Lanxi feature more extensive plains (Figure 1c). Among these, the main channel of the Qiantang River traverses seven counties within the region: Kaihua, Changshan, Xi’an, Longyou, Tangxi, Lanxi, and Jiande; moreover, its section from Jiande to Lanxi is also known as the Lanjiang. These administrative divisions correspond to present-day Jiande, Tonglu, and Chun’an of Hangzhou; the entire territory of Quzhou; and Wucheng District and Lanxi of Jinhua.
2.2. Analytical Hierarchy Process
This research employs the analytic hierarchy process (AHP) to conduct a weighting analysis of factors influencing major road alterations. While conducting the AHP procedure, the following steps are undertaken: first, based on Saaty’s 1–9 rating scale listed in Table 1, pairwise comparisons are made between different indicators within the same level to identify each indicator’s relative importance [4]; subsequently, priority weights for each factor are calculated and vertically stacked for decisions at each level; finally, consistency is verified. The specific steps are as follows [4]:
Table 1.
The fundamental scale according to Saaty.
First, pairwise comparisons of each factor yield a priority matrix:
Next, the product of the elements in each row of the priority matrix is calculated to obtain Mi, and the nth root of Mi is then computed to derive Later, is normalized to yield Wi, as shown in the following formula:
After that, we compute the maximum eigenvalue λmax of the priority matrix:
where denotes the i-th element of the vector AW.
Finally, the matrix consistency is evaluated. The consistency index CI is calculated using the following formula:
Next, we calculate the consistency ratio CR:
Among these, RI is the average consistency index, whose value is related to the number of rows in the matrix (Table 2). When CR < 0.1, the preference matrix is consistent.
Table 2.
RI values for average consistency indicators.
When multiple target layers are involved, the weight of each sub-target is calculated using the following formula:
Here, K represents the number of sub-objectives, wij represents the weight of each sub-objective, and vj represents the ranking value under each sub-objective.
It is noticed that data layers were constructed using open-access databases and documents, with additional information derived from archival documents within these databases. The data used and their sources are summarized in Supplementary Information Table S1.
2.3. GIS-Based Route Reconstruction and Evolution Maps
After marking the nodes, we employed the LCP (least cost path) model to reconstruct the ancient official ways and simulate roads based on the total cost surface and terrain, respectively. Using the ArcGIS software, the LCP model operates on the principle that connecting raster pixels incurs a cost, with the general cumulative cost formula defined as follows:
where Costi denotes the unit cost per distance unit traversed by the road through the i-th pixel, and Distancei represents the actual distance traversed by the road when passing through the i-th pixel. Moreover, LCP route’s cell size is 30 × 30 and its connectivity is 8-neighbor.
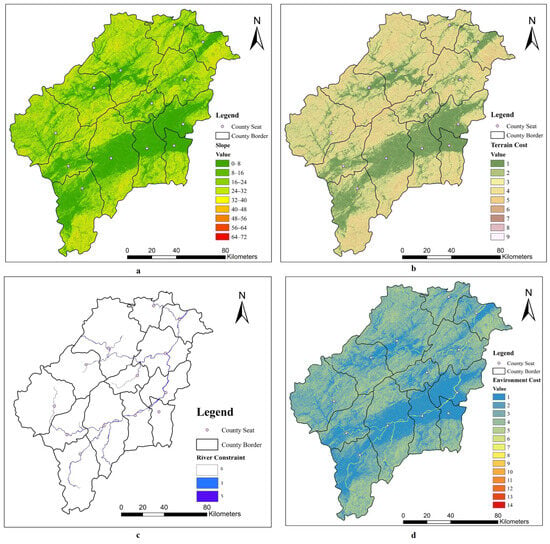
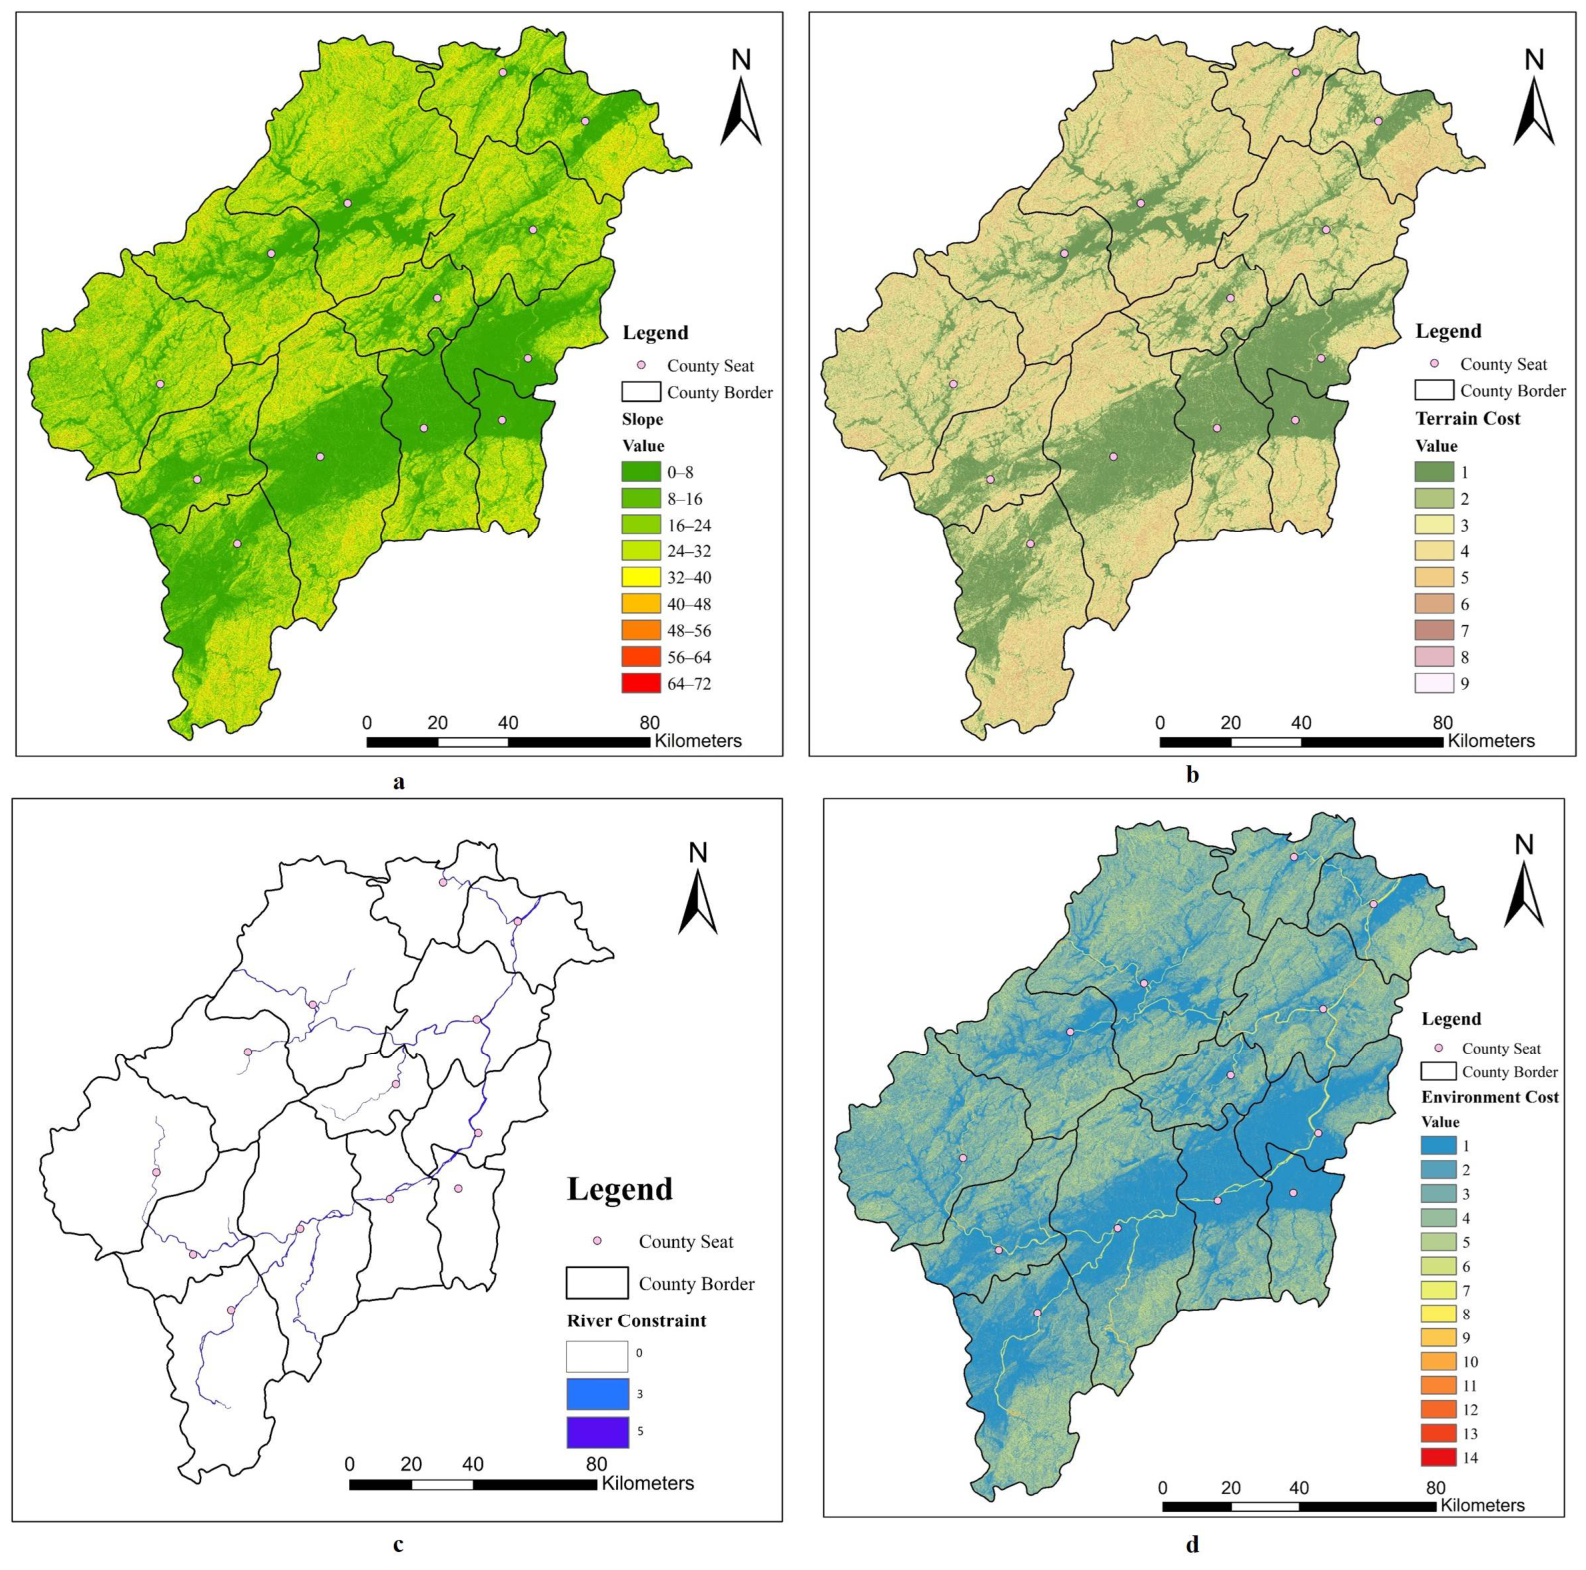
To reconstruct the routes more accurately, an ArcGIS 10.5 Spatial Analyst module was employed to reclassify the terrain and incorporate rivers as a constraint. The resulting “environment cost” layer (Figure 2) served as the basis for the official route reconstruction procedure.
Figure 2.
Cost surface with constraint: (a) Slope; (b) Terrain Cost; (c) River Constraint; (d) Environment Cost.
A slope analysis was performed on the DEM (Digital Elevation Model) data, while the slope data were then categorized into nine classes using the equal-interval method, and a terrain cost layer was generated from the slope layer via reclassification (Figure 2a). Given that the operation of official roads involved travel between nodes rather than unidirectional movement, the cost surface exhibits isotropic characteristics. Next, the river layer was converted to raster format and aligned with the study area; the Raster Calculator was then used to assign a value of 5 to river areas and 0 to non-river areas (Figure 2b). A low value was assigned because, although rivers posed obstacles, official roads still had to cross them. Finally, the terrain cost layer and the river constraint layer were summed using the Raster Calculator to produce the environment cost layer (Figure 2d). Environment cost is a combination of topography and rivers, reflecting the impact of the natural environment on road selection, expressed as:
Environment cost = [Terrain Cost] + [River Constraint]
In this context, lower cost values represent gentler slopes (e.g., a slope of 0–8 degrees has a cost value of 1, and so on), while in Figure 2d, lower cost values indicate that a node with a gentle slope is located in a land area. Moreover, the resolution of DEM is 30 × 30, and its coordinate system is Xian 1980 Degree GK CM 117E.
2.4. Influencing Factors and Weighting Process
Official ways were government-selected routes designed to meet the needs of information transmission and local administration. Meanwhile, ensuring the effective operation of postal services and governance required sustained investment in their long-term maintenance. Considering the regional conditions, the factors influencing road evolution include transportation cost, population, and delivery efficiency.
In the work, the transportation cost is defined as a multidimensional metric encompassing not only the expense of goods transport but also the comprehensive social costs of road infrastructure. Given that official ways in ancient China were maintained by governments to facilitate governmental information communication, official travel, and tribute transport, the selection of a route dictated the long-term maintenance efforts and overall road quality. Therefore, this work incorporates maintenance efforts and construction costs—both heavily influenced by topographical constraints—into a broader cost framework, reflecting the geographic deterministic nature of road selection and related costs.
Population was also a crucial factor influencing the normal operation of the postal system. Following the abolition of the station household system in the Ming Dynasty, the government shifted the burden of postal service to local residents through mandatory labor assignments [39,40]. Especially in areas distant from warfare, where demand for delivery was lower, the reforms were fully implemented. Therefore, the population sustained the normal operation of the postal institutions.
Delivery efficiency refers to the speed and effectiveness of transmitting information and government orders along official roads. According to the article “Efficiency of equine express postal systems”, appropriately shortening the distance between courier stations is conducive to the full utilization of post horses and improves the delivery efficiency [41]. Su Tongbing also pointed out that the roads with high density of urgent deliveries had faster delivery speed of official documents [40]. In addition, the natural environment also directly affects delivery efficiency. In this model, it represents the functional urgency of the road, directly correlating with the specific military and political priorities of the Ming administration.
Accordingly, we conducted a weighted analysis of four key factors: transportation costs, population, delivery efficiency and distance to water courier way. Based on the literature data, transportation costs (C1), population (C2), delivery efficiency (C3) and distance to water courier way (C4) were selected as evaluation indicators (Table 3). These indicators were organized into a hierarchical framework encompassing both water and land transportation modes.
Table 3.
Evaluation criteria.
Following the method described above, seven experts were invited to perform pair-wise comparisons and scoring for the four criteria. A consistency check was then conducted, and the results showed that six of the seven expert matrices met the consistency requirements, and the priority is shown in Table 4. The final weights were calculated by averaging the results from the six valid matrices, resulting in the following priority order: transportation costs (C1, 0.3954) > population (C2, 0.2952) > distance to water courier way (C4, 0.2475) > delivery efficiency (C3, 0.0620).
Table 4.
Criteria priority ranking (using separate and joint opinions of experts).
2.5. Indicator of the Distance to Water Courrier Way
Given the shift in the main official route from the land valley to the river bank, the distance between the two may have become a crucial indicator. Thus, a four-factor matrix is also presented in Table 4.
As transportation costs were constrained by spatial physical conditions such as topography and distance, official ways were primarily distributed along natural corridors, and a rational route selection ensured the stable operation of the postal system over a prolonged period.
The weights of the four factors, including transportation cost, population, distance to water courier way, and delivery efficiency, with the scoring of six experts were determined to be 39.54%, 29.52%, 24.75%, and 6.20%, respectively. While verifying the consistency of the matrix, its conditional consistency ratio (CR, Equation (5)) was calculated, and the six CR values obtained were 0.0489, 0.060, 0.043, 0.039, 0.077, and 0.056, all of which were less than 0.10, reflecting the effectiveness of the scoring.
3. Results
3.1. Restoration of Land Official Ways
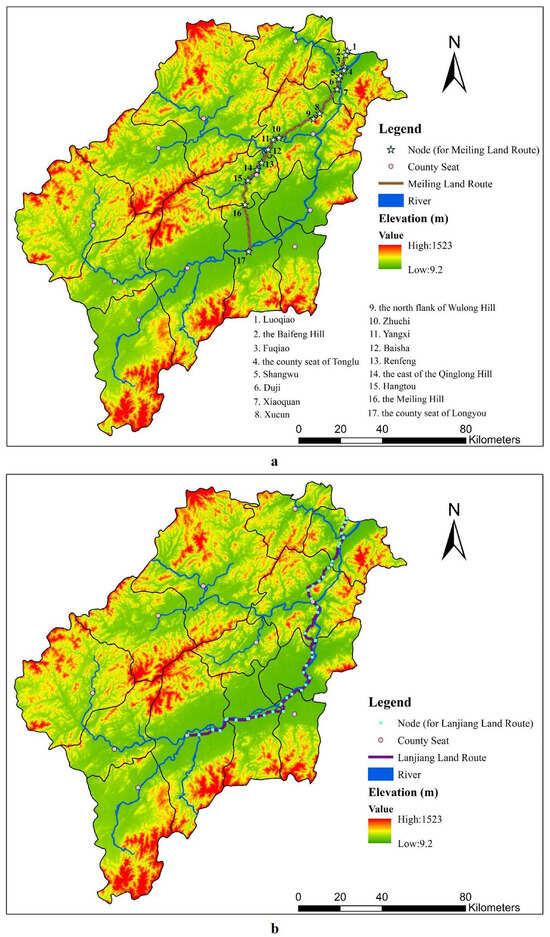
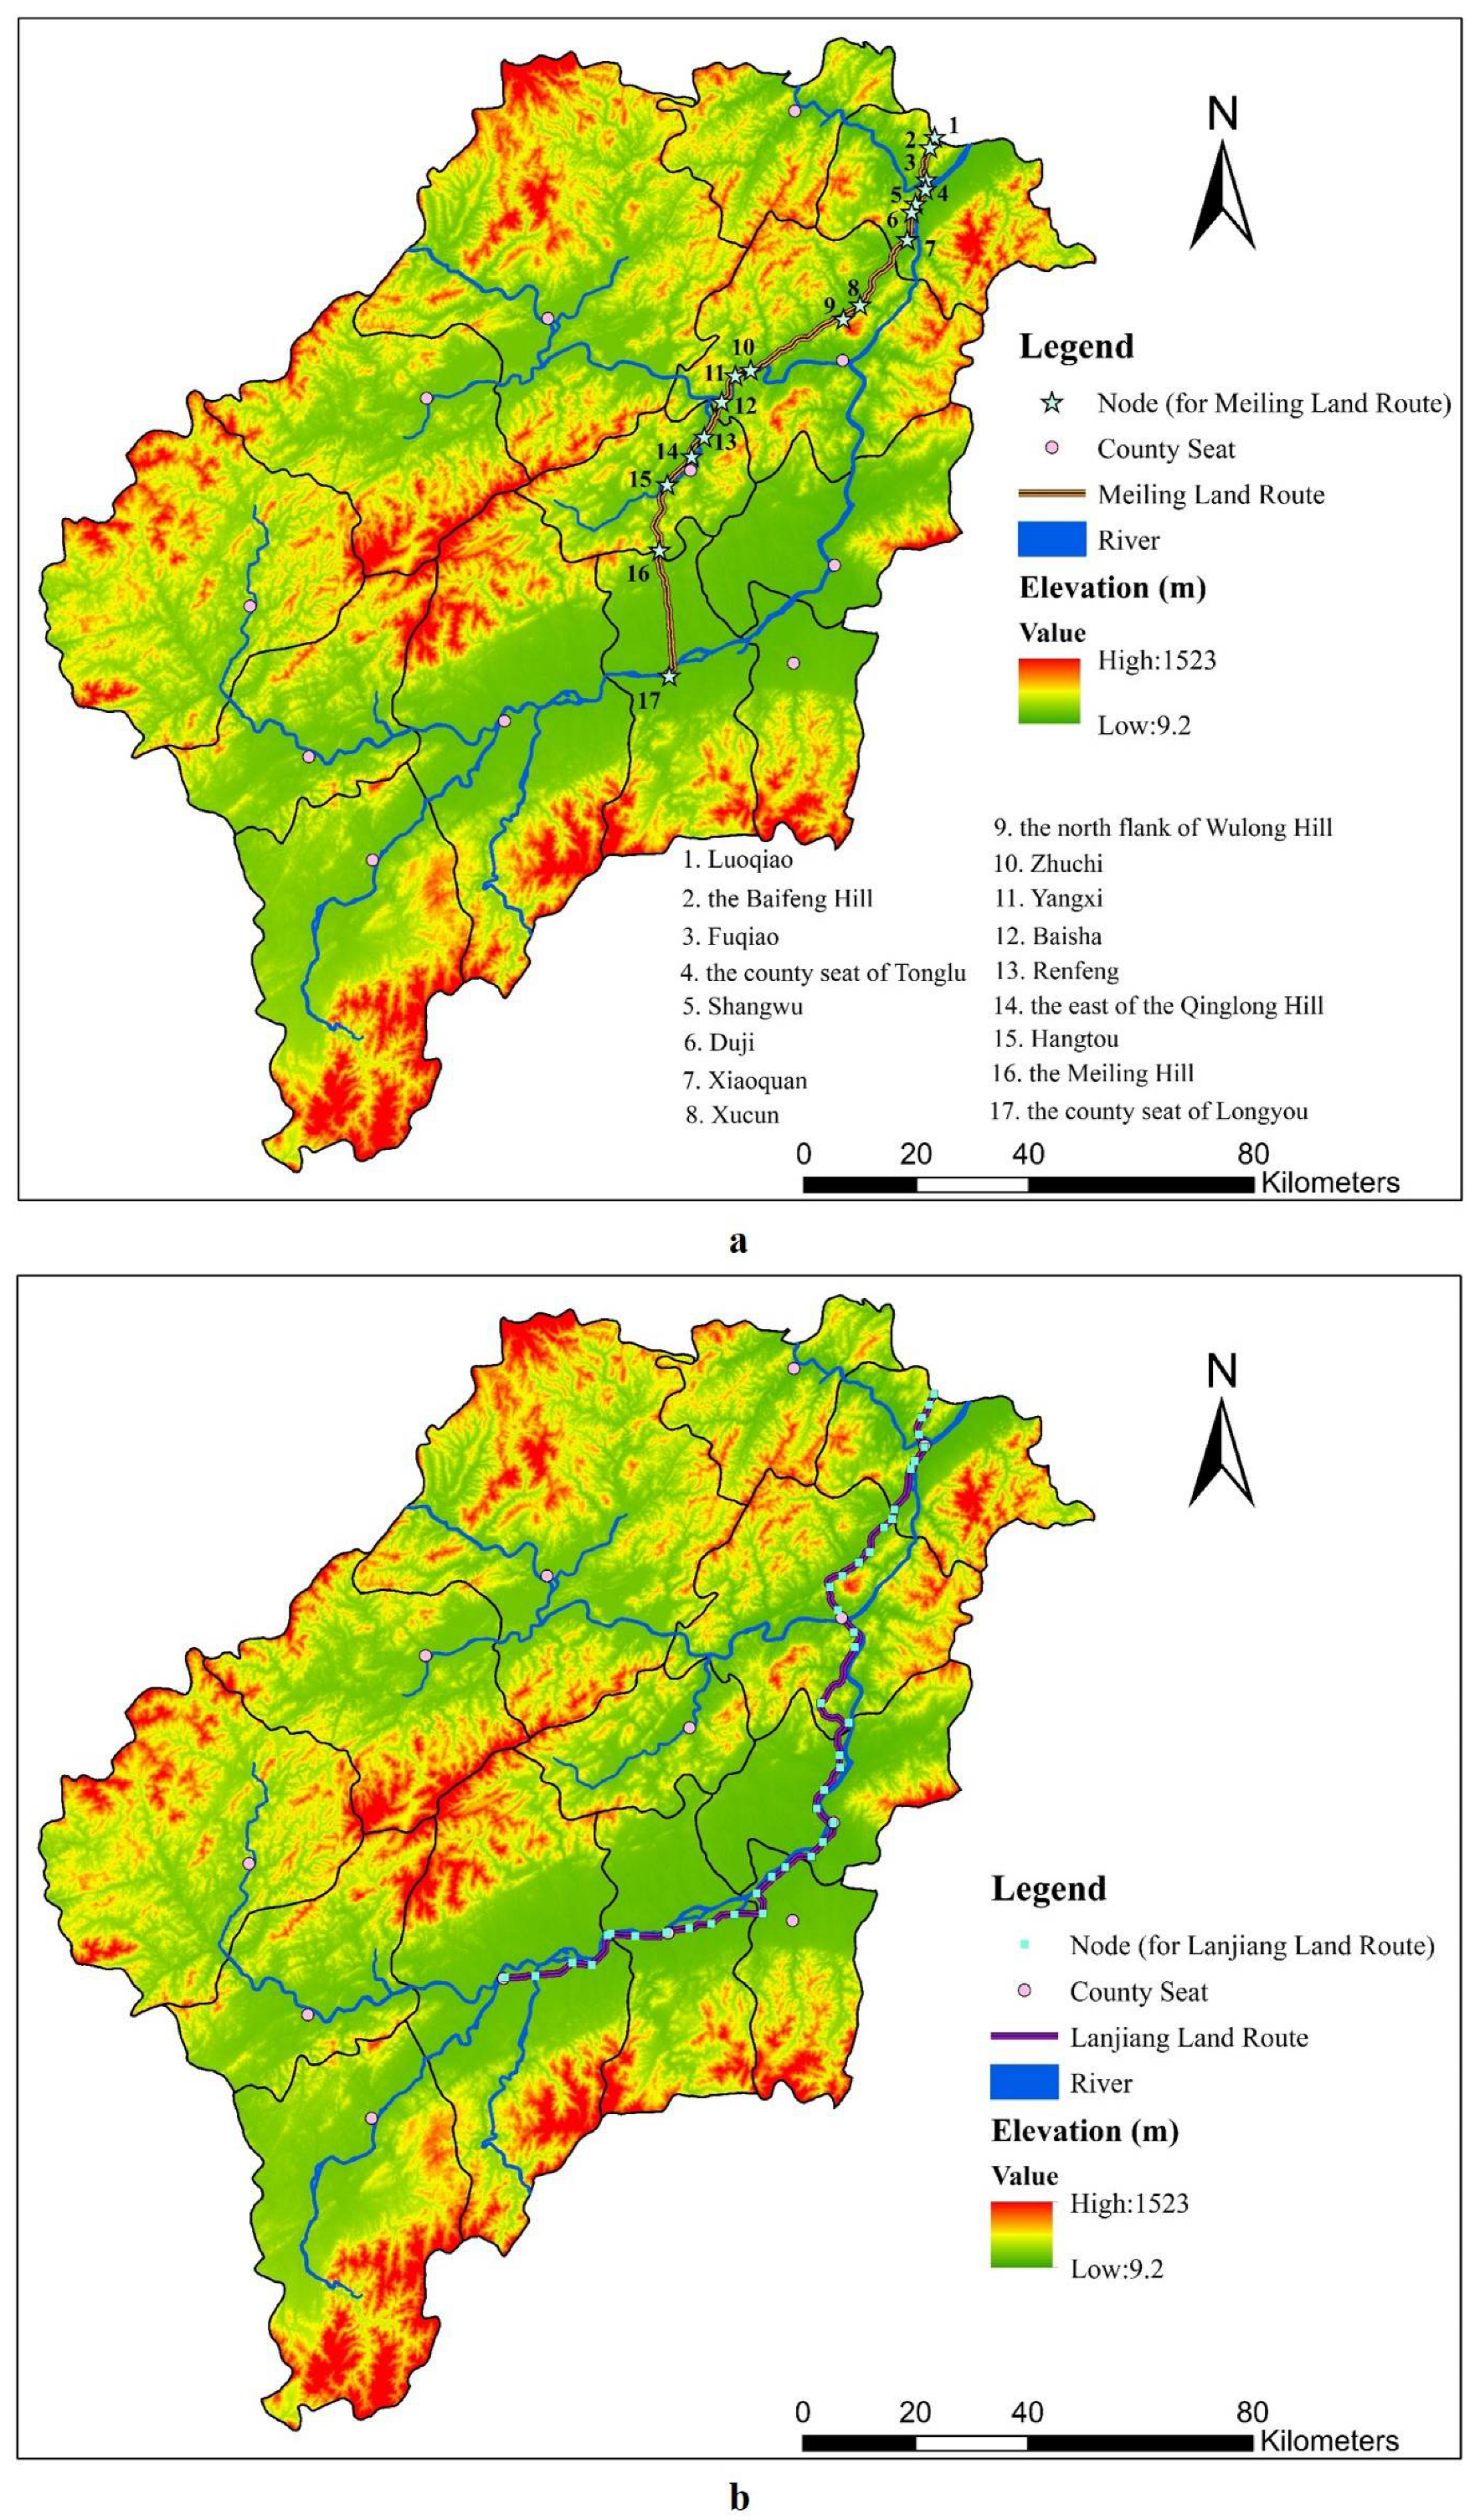
The reconstruction of the “Meiling Land Route” and the “Lanjiang Land Route” is shown in Figure 3. The reconstructed nodes of the Meiling Land Route, from northeast to southwest, are Luoqiao, the Baifeng Hill, Fuqiao, the county seat of Tonglu, Shangwu, Duji, Xiaoquan, Xucun, the north flank of Wulong Hill, Zhuchi, Yangxi, Baisha, Renfeng, the east of the Qinglong Hill, Hangtou, the Meiling Hill, and the county seat of Longyou. Among these, Xucun and Zhuchi were courier stations during the Southern Song Dynasty that were separately located on courier ways to Hangzhou and Quzhou; these names are still preserved today. The reconstruction of the Lanjiang Land Route was based on the demand for urgent deliveries during the Ming Dynasty: the northeast and west routes of Tonglu County, the east and south routes of Jiande County, the west and south routes of Lanxi County, the east and west routes of Tangxi County, all deliveries for Longyou County, and the east routes of Xi’an County. After completing point annotation, slope calculations and reclassification were performed on the DEM (Digital Elevation Model) data. Finally, based on the reclassification results, the least cost paths were calculated to analyze the shortest distances between points, generating the routes as the “Meiling Land Route” and the “Lanjiang Land Route.” The northern sections of both followed identical routes, traversing the valleys of Tonglu and Jiande Counties to reach the seat of Yanzhou Prefecture. Divergence occurred at the point where the routes diverged: one road proceeded southwest from Yanzhou to Quzhou, while the other headed south to Quzhou. The restoration of the Lanjian land route involves 41 nodes.
Figure 3.
Reconstructed map of land routes: (a) the Meiling Land Route; (b) the Lanjiang Land Route.
In Figure 3a, the values in the schematic diagram are from Supplementary Table S2 and Figures S5 and S7. That is to say, the nodes along Meiling shown in Table S2 are depicted in Figure 3a. The nodes of Meiling in Table S2 are shown in Figure S5, while the nodes of Lanjiang in Table S3 are shown in Figure S6. The data in Figure 3b comes from Supplementary Figure S6, Tables S3 and S4. Supplementary Figure S6 illustrates the contribution of nodes of the Lanjiang Land Route.
By integrating county-level topographical features, road alignments, and postal systems from the Southern Song and Ming dynasties (see Supplementary Information Table S1 for data sources), relevant nodes (Supplementary Figure S7) were identified and mapped via ArcGIS 10.5. Using the least cost path (LCP) model and based on the Environment Cost (Figure 2d), the Meiling Land Route and the Lanjiang Land Route connecting Yanzhou to Quzhou were reconstructed. Notably, because official land ways typically favored flat, broad terrain and governments often retained the postal institutions of preceding dynasties following regime change, the absence of Southern Song Chihou deliveries and cartographic records permitted the restoration of official land ways based on the distribution of urgent deliveries during the Ming Dynasty.
The preface section of the Yanzhou Tujing (Illustrated Gazetteer of Yanzhou) from the Chunxi era of the Southern Song Dynasty contains maps of various counties within Yanzhou. Among these, a road was drawn on the maps of Jiande, Tonglu, and Shouchang counties—this is the “Meiling Land Route” (Supplementary Figure S7). On these maps, rivers are depicted with parallel solid lines, mountain ranges are rendered in a realistic style, and this major thoroughfare is represented as a dashed line. Based on the bridge section of the Jingding Yanzhou Xuzhi and the prefectural boundary section of the Qiandao Lin’an Zhi, Cao Jiaqi identifies this land route as the Yanzhou courier way that existed during the Southern Song Dynasty [37]. Based on the specific topography present, this major route entered Yanzhou from the Baifeng Hill in Tonglu County, followed the valley to the Tonglu County seat, and then extended southwest along the river bank, leaving Tonglu at Xiaoquan; after entering northeastern Jiande County, this courier route continued southwest, first running west along the north flank of Ren’an Mountain (now called Wulong Hill), and then along the north bank of the river to Renfeng Township in Shouchang County. It subsequently followed the river past Qinglong Hill to the county seat of Shouchang, before extending southwest via Hangtou and Meiling Hill into Longyou County.
3.2. Land Official Ways in Different Eras
3.2.1. Routes in the Southern Song and Yuan Dynasties
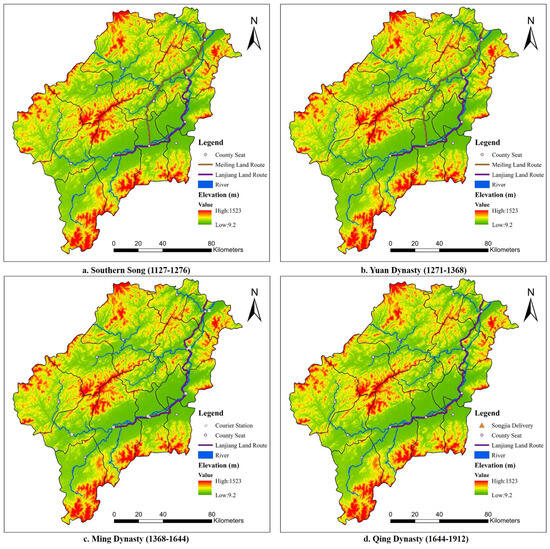
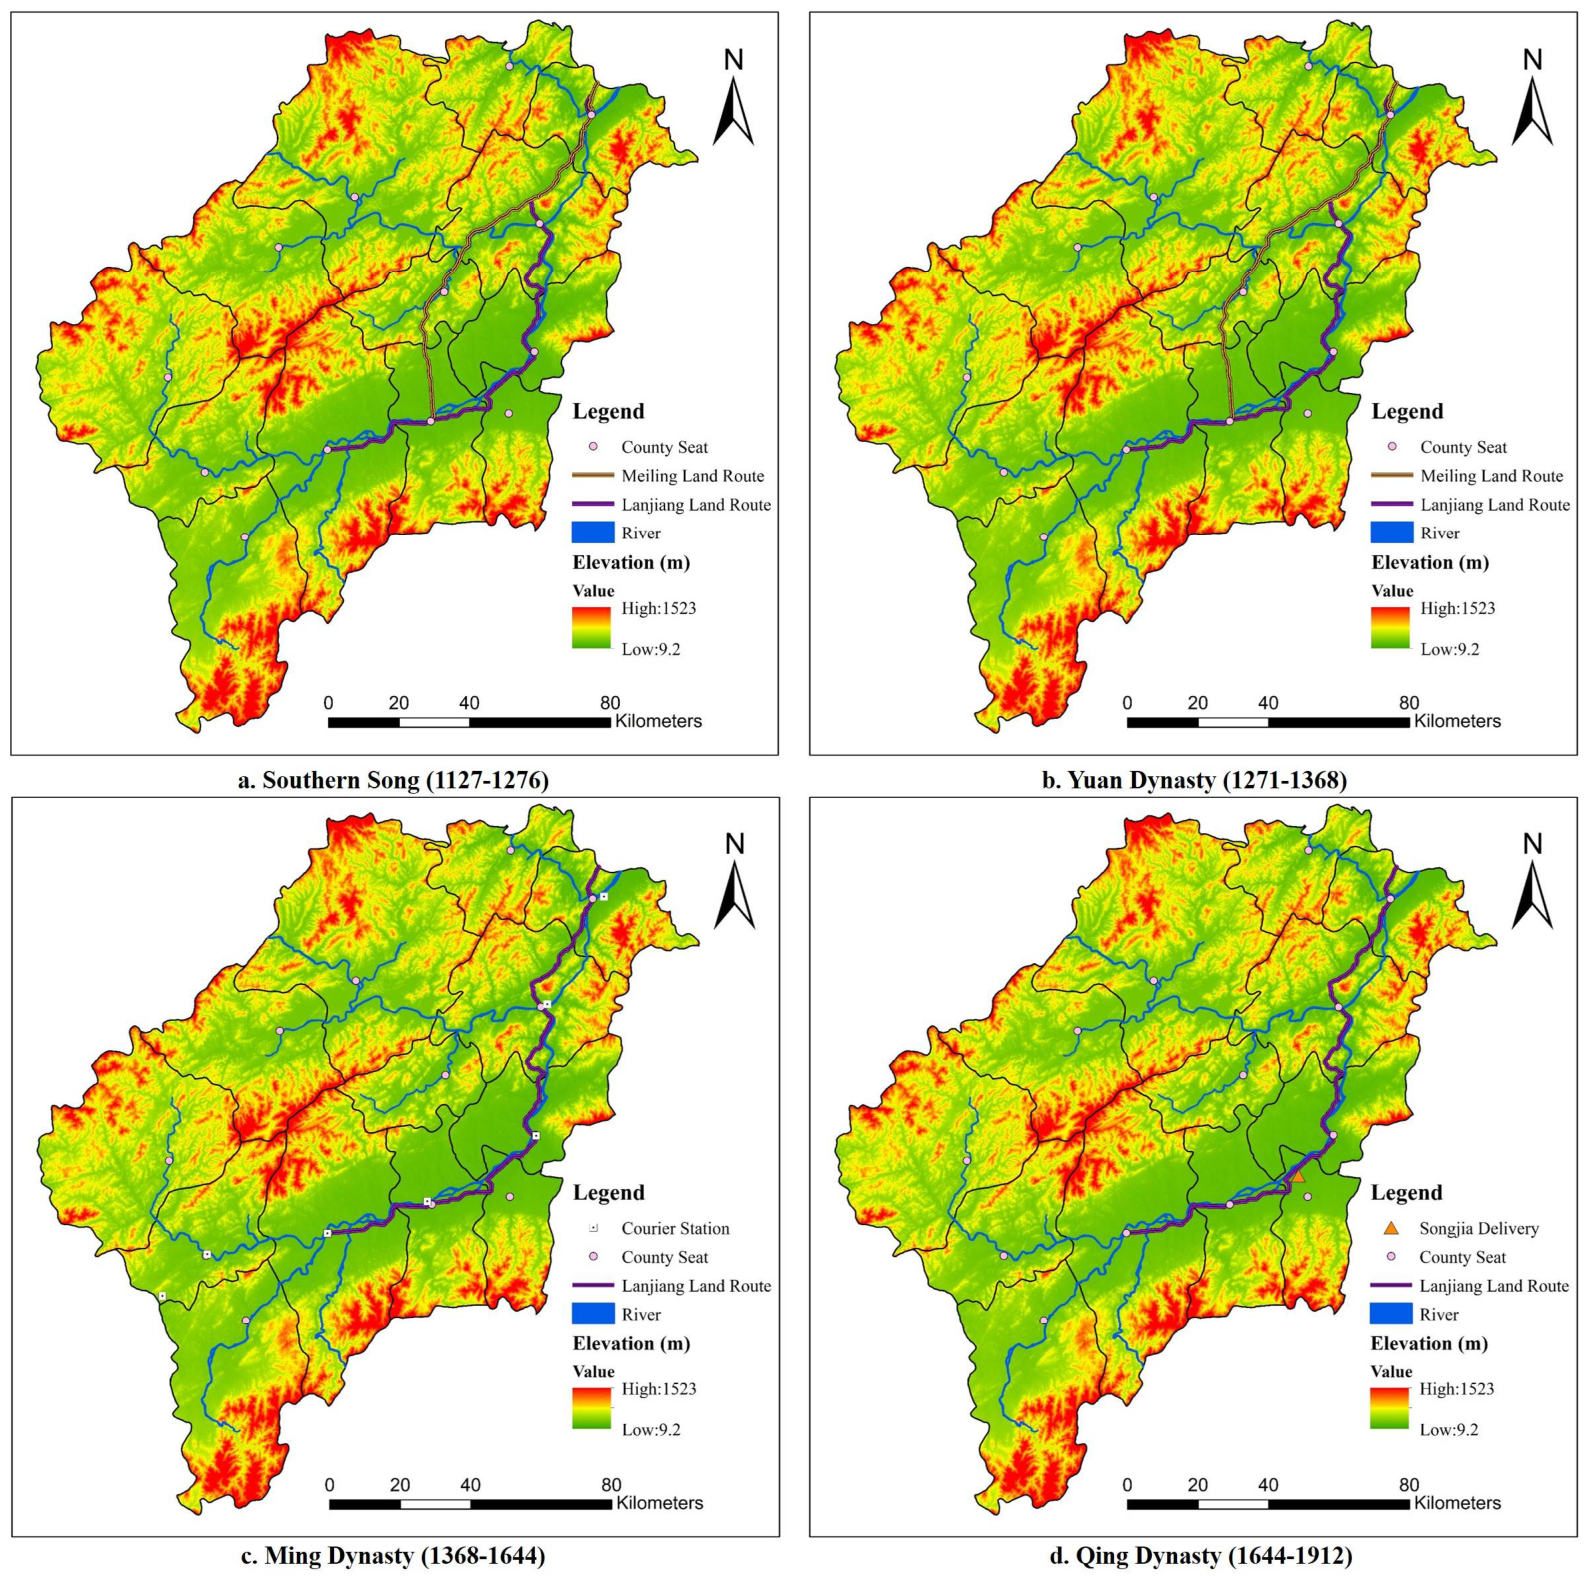
During the Song and Yuan dynasties, the land official route from Yanzhou to Quzhou remained stable (Figure 4). The data in Figure 4c is from Supplementary Table S5. After the establishment of the Southern Song Dynasty, Hangzhou became the provisional capital. Yanzhou and Quzhou emerged as key corridors linking the political center with surrounding provinces, acquiring substantial transportation and military significance. During the early Yuan Dynasty, to reduce the distance required for grain transport, the central government abandoned coastal shipping and excavated the Grand Canal linking Beijing and Hangzhou [42]. With the connection of the Jizhou River and the Tonghui River, the Qiantang River Basin became linked to Beijing through a continuous inland waterway.
Figure 4.
Maps of official land way routes in different periods: (a) the Southern Song Dynasty (1127–1276); (b) the Yuan Dynasty (1271–1368); (c) the Ming Dynasty (1368–1644); (d) Qing Dynasty (1644–1912).
During the Southern Song Dynasty, each county in Yanzhou Prefecture was equipped with courier stations (see Table S1 of Supplementary Information for data sources). In Jiande County (see Table S1 of Supplementary Information for data sources), the Xucun Courier Station was located 12.5 km (25 li) north of the county seat along the courier way to Lin’an Prefecture (1 li equals 500 m or 1/2 km; Hangzhou was called Lin’an in the Southern Song), the Zhuchi Courier Station lay 15 km (30 li) west of the county seat along the courier way to Quzhou, and the Sanhe Courier Station was located 25 km (50 li) south of the county seat, situated on the courier way to Wuzhou (i.e., Jinhua Prefecture). Notably, Sanhe, located at the junction of Jiande and Lanxi along the Qiantang River, indicates the presence of a courier route along the main stream of the Qiantang River. These historical records indicate the existence of two land-based official ways from Yanzhou to Quzhou: one that ran southwestward through the Meiling Hill and another that ran southward along the banks of the Qiantang River, namely the “Meiling Land Route” and the “Lanjiang Land Route”.
During the Yuan Dynasty, both the “Meiling Land Route” and the “Lanjiang Land Route” served as courier ways. According to Xijinzhi [43], “Hangzhou (land route), 35 km (70 li) due west to Fuyang, 30 km (60 li) to Xincheng, 30 km (60 li) to Tonglu, 22.5 km (45 li) to Anren, Jiande, (southwest) to Changshan, Yushan,” while “Hangzhou (water route), Fuyang, Tonglu, due south (water route), 45 km (90 li) to Lanxi, Wuxi” [43]. Anren lies at the border of Jiande and Tonglu Counties, northeast of Xucun, adjacent to Xiaoquan. Combining topography (Figure 1) with the term “southwest,” it is evident that this land route entered Yanzhou Prefecture from Tonglu County and proceeded into Jiande County, before proceeding southwest into Shouchang County, before finally proceeding to Changshan County of Quzhou Prefecture. This route aligns with the direction of the “Meiling Land Route.” According to the records in the Yongle Encyclopedia, most courier stations along the main stream of the Qiantang River were equipped with horses and boats [44], indicating that local courier routes were both water- and land-based. In summary, the courier routes from Yanzhou to Quzhou during the Yuan Dynasty remained consistent with those during the Southern Song Dynasty.
3.2.2. Significant Transformation of the Ming Dynasty
After the establishment of the Ming Dynasty, the routes of the official ways from Yanzhou to Quzhou gradually shifted towards the main corridor of the Qiantang River.
At that time, the main corridor of the Qiantang River continued to serve as an inter-prefectural route between Yanzhou and Quzhou. In the study area, courier stations (Figure 4c) were distributed along this corridor (see Table S1 of Supplementary Information for data sources), while Shouchang County, located in a remote valley, lacked such facilities. During the Ming Dynasty, Hangzhou, Jinhua, Yanzhou, and Quzhou Prefectures formed part of the “Southeast Highway to Zhangzhou,” which connected them directly to the capital, Nanjing, and other regions nationwide via integrated water systems, including the Qiantang River, the Grand Canal, and the Yangtze River. The Zhejiang segment of this major official way entered Jiaxing Prefecture via the Grand Canal, passed through Hangzhou Prefecture, and then followed the Qiantang River through Yanzhou, Jinhua, and Quzhou Prefectures, finally leaving the region in Changshan County and crossing mountain valleys into Jiangxi Province [45]. In addition, delivery ways between Yanzhou and Quzhou followed the main stream of the Qiantang River, with numerous urgent deliveries established along the Lanjiang Land Route (see Tables S1 and S3 of Supplementary Information for data sources). Thus, during the Ming Dynasty, the Lanjiang Land Route continued to maintain its important traffic position and functioned as both a courier way and a delivery way.
Meanwhile, the Meiling Land Route was no longer designated as the official way between Yanzhou and Quzhou. Along this route, the section from Baifeng in Tonglu to the Shouchang County seat served as a delivery route, while the section from Shouchang to Longyou became a private way [37,38], indicating a marked decline in its transportation significance compared to during the Yuan Dynasty.
3.2.3. Qing Dynasty Maintained the Road Network of the Ming Dynasty
The road network of the early Qing Dynasty maintained the alignments established during the Ming Dynasty. There were minimal changes to the road network during the late Qing period. The only alteration involved shifting a location, specifically Point 28, from Qingyang delivery to Songjia delivery, a distance of merely a few thousand meters (about 3 km, see Figure 4d). The other points remained significantly unchanged, preserving the road alignments of the Ming era. This modification is detailed in Table S3 of the Supplementary Information and illustrated by the corresponding point in Figure S6 of the Supplementary Information.
Compared to the Southern Song and Yuan Dynasties, the Ming Dynasty witnessed a reshaping of the official land routes from Yanzhou to Quzhou. While the banks of the Qiantang River’s main stream remained official ways, the Meiling Land Route, particularly the section from Shouchang to Longyou, was downgraded to a private way and was no longer maintained by the government. This transportation configuration persisted for more than five centuries, lasting until the late 19th century.
3.3. Suitability Analysis of the Reconstruction and Evolution of Official Ways
3.3.1. Cost Surface Maps and Route Location Analysis
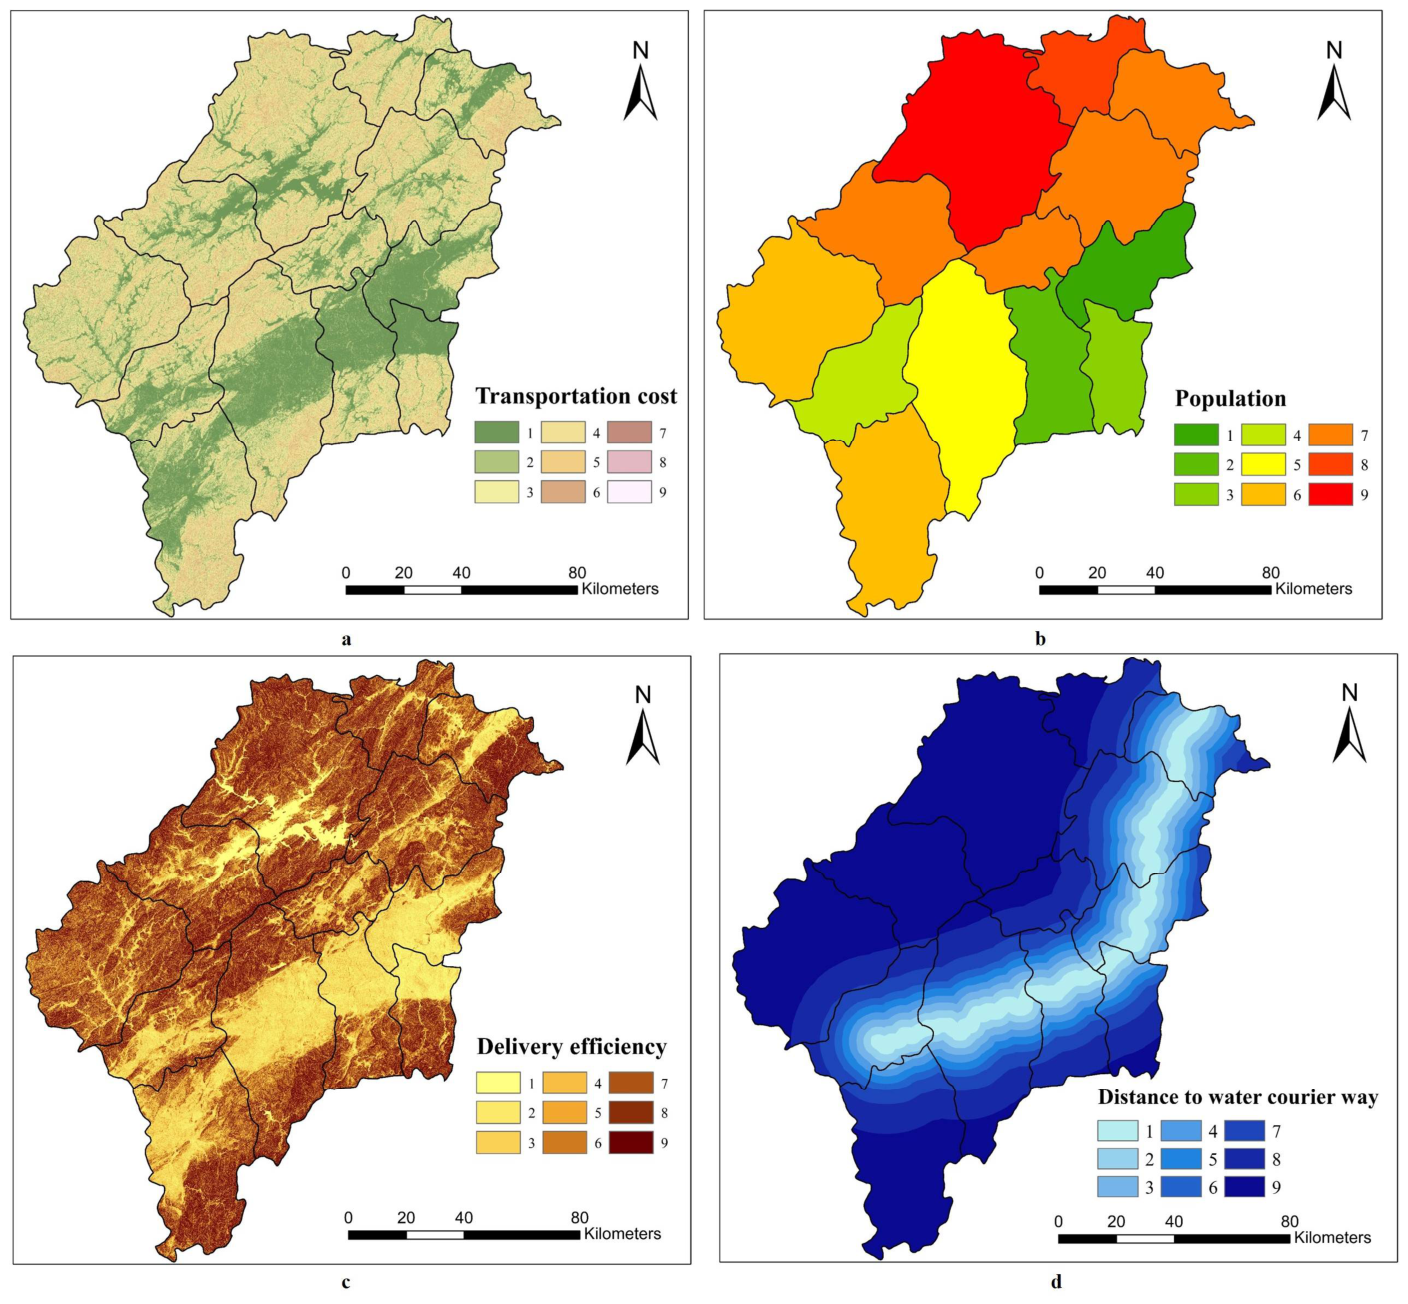
Transportation costs encompass the expenses associated with the construction and maintenance of official roads. By using AciGIS 10.5 Spatial Analyst, cost surface maps were generated and shown in Figure 5 (reclassification criteria for each criterion are in Table S7). As illustrated in Figure 5a, it is obvious that the lower cost value of the transportation represents the flatter terrain displayed in the nine layers. This result aligns clearly with the DEM data and the slope layer (Figure 2a), reflecting the fact that the slope layer was reclassified during the generation of the cost surface map for this factor.
Figure 5.
Cost surface maps of each criterion: (a) transportation cost; (b) population; (c) delivery efficiency; (d) distance to water courier way.
The population was closely related to the effective function of official routes. During the early Ming Dynasty, personnel for courier stations and urgent deliveries were recruited from local male landholders. Therefore, to minimize disruptions to agricultural production, the population influenced the placement of postal institutions, with more populous areas supporting a higher density of postal institutions. As shown in Figure 5b for the population cost, the seven counties along the main Qiantang River corridor—namely, Tonglu, Jiande, Lanxi, Tangxi, Longyou, Xi’an, and Changshan—with higher population densities than adjacent counties situated along tributaries were equipped for a higher density of urgent deliveries. Population data for each county in the study area were adopted from 1552 to 1572 (see Table S6). During these two decades (mid-Ming Dynasty), not only were the administrative boundaries fixed, but each county also recorded population data.
Delivery efficiency is represented by estimated transmission speed. Based on the previously mentioned slope layer, we use the Raster Calculator function and Tobler’s hiking function to calculate the walking speed in various areas within the study range [46]:
However, the slope needs to be converted to radians for the calculation:
The values in the speed layer are segmented into nine ranges through natural breaks (see Figure S8 of the Supplementary Information). The speed layer is then reclassified, with faster speeds resulting in lower costs, generating a cost surface map related to delivery efficiency (Figure 5c).
Besides transportation cost, population cost and delivery cost, we incorporated DEM data and utilized the Euclidean distance function to calculate the actual distance along the water courier way (see Figure S9 of the Supplementary Information). Based on the Euclidean distance, the relevant cost surface has been drawn, where lower cost values indicate closer distances. Among them, the area with a cost of 1 is within 2500 m of this waterway, as this is the distance a person can walk in half an hour [47]. Figure 5d shows the distance to water courier way.
3.3.2. The Impact of Waterways
As shown in Figure 5, the cost surface for each criterion indicates that costs are lower along the Qiantang River main corridor. Moreover, the impact of the water courier way on the evolution of official roads cannot be ignored, even though its weighting is lower than that of transportation cost and delivery efficiency.
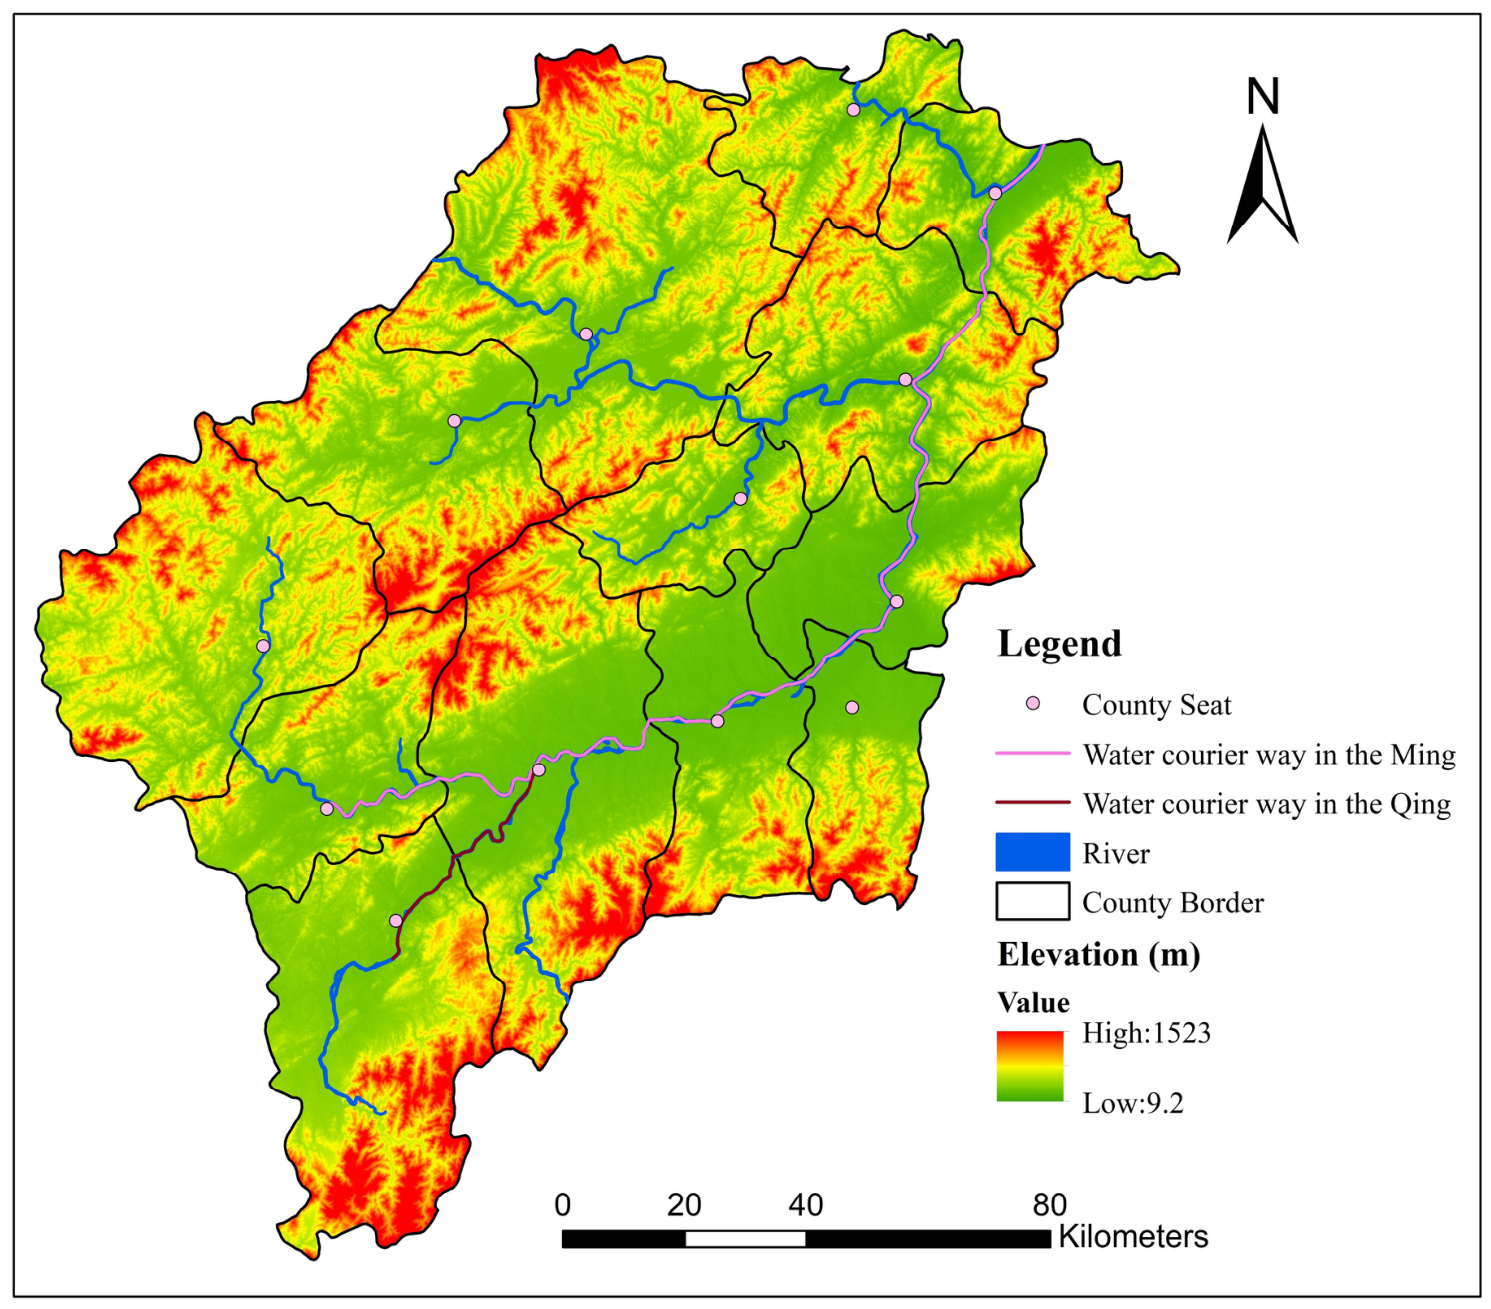
The distance to the water courier way reflects the social value of the official road. As mentioned earlier, between 1127 and 1368, there were two courier routes in the study area: the Meiling Land Route and the Qiantang River waterway. However, this situation changed in the late 14th century, when the Qiantang River waterway became the only courier route (Figure 6) in the region. From the late 14th century to the end of the 19th century, the main channel of the Qiantang River has been part of the road from the capital to the Fujian Province, making it extremely important [45,48]. This water courier way started in Hangzhou Prefecture, followed the Qiantang River into Yanzhou Prefecture, passed through Tonglu, Jiande, Lanxi, Tangxi, Longyou, Xi’an, and Changshan Counties, then landed in the county seat of Changshan, switched to a land courier way, and finally entered the Jiangxi Province. Since the mid-17th century, after leaving Xi’an, the route has been rerouted to land at Jiangshan County and finally entered the Fujian Province. The “water courier way” had the following impact on the official ways. Firstly, the riverbanks provided convenient docking points for courier boats and facilitated the loading and unloading of goods. Secondly, due to the influence of monsoons, the Qiantang River section within the study area had two hydrological disadvantages: the dry season, which lasted from October through March of the following year, and the fact that some river sections had shallow shoals and swift currents [49,50,51]. As a result, the riversides serve as a substitute, such as some courier stations being equipped with horses, especially in Jinhua and Quzhou. Thirdly, local delivery services would opt to use the courier routes, and the network of urgent delivery points along these routes was denser [40].
Figure 6.
Map of water courier ways.
It is worth noting that the sensitivity value for “distance to water courier route” is relatively high at −5.30%, indicating that changes in this criterion would lead to changes in official ways. However, over the past five hundred years, the water courier route east of the Quzhou Prefecture seat remained stable. Consequently, the official routes from Yanzhou to the Quzhou Prefectural seat also remained stable, and this did not affect the decisive role of economic factors in shaping road changes.
3.4. Cost–Benefit-Based Road Reconstruction
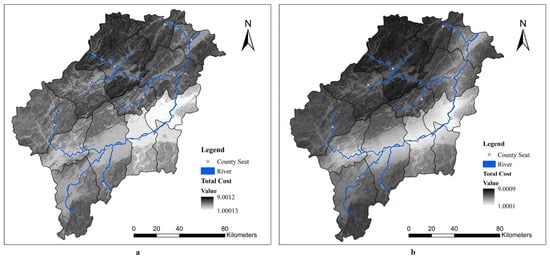
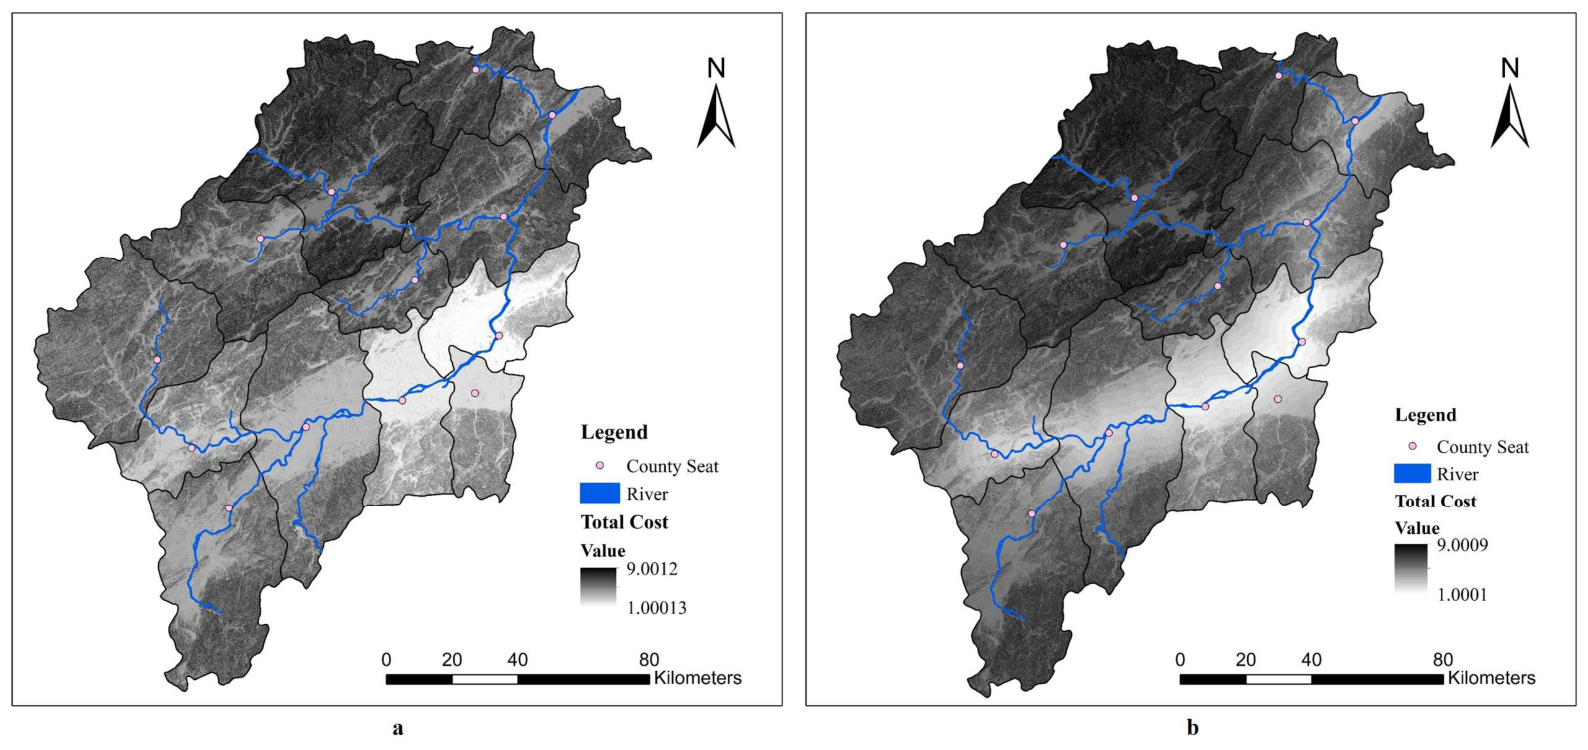
After completing these steps, the Raster Calculator was used to compute land route suitability by applying the weight values. By multiplying C1, C2, and C3 by their respective weights and summing the results, the weighted raster was aggregated to generate Figure 7a, which represents the overall suitability for land routes. In Figure 7a, it can be seen that higher values of Land Suitability indicate dense population and flat terrain, meaning the area is more suitable for constructing official ways; lower values indicate sparse population and rugged terrain, making it unsuitable for official way construction.
Figure 7.
Land suitability map (a) and the total cost surface map (b). Lower values indicate more suitable settings for the official road.
Considering the distance to water courier way, cost surfaces are regenerated (see Figure 7b), a weighted sum of the layers was performed by combining the weights of each criterion and using the Raster Calculator. The total cost layer (Figure 7b) was generated and the formula is as follows:
As can be seen in Figure 7b, compared to the area along the tributary in Shouchang County (Figure 1c), the costs in the area along the main stream of the Qiantang River are significantly lower. Furthermore, the “Matthew effect” regarding costs is more pronounced, indicating that this area is more suitable for the road alignment.
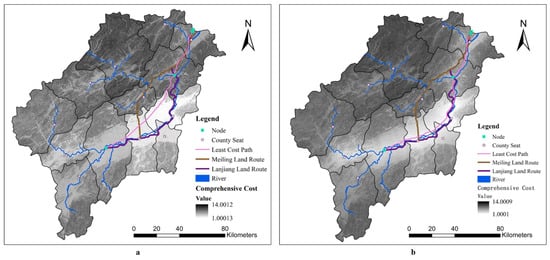
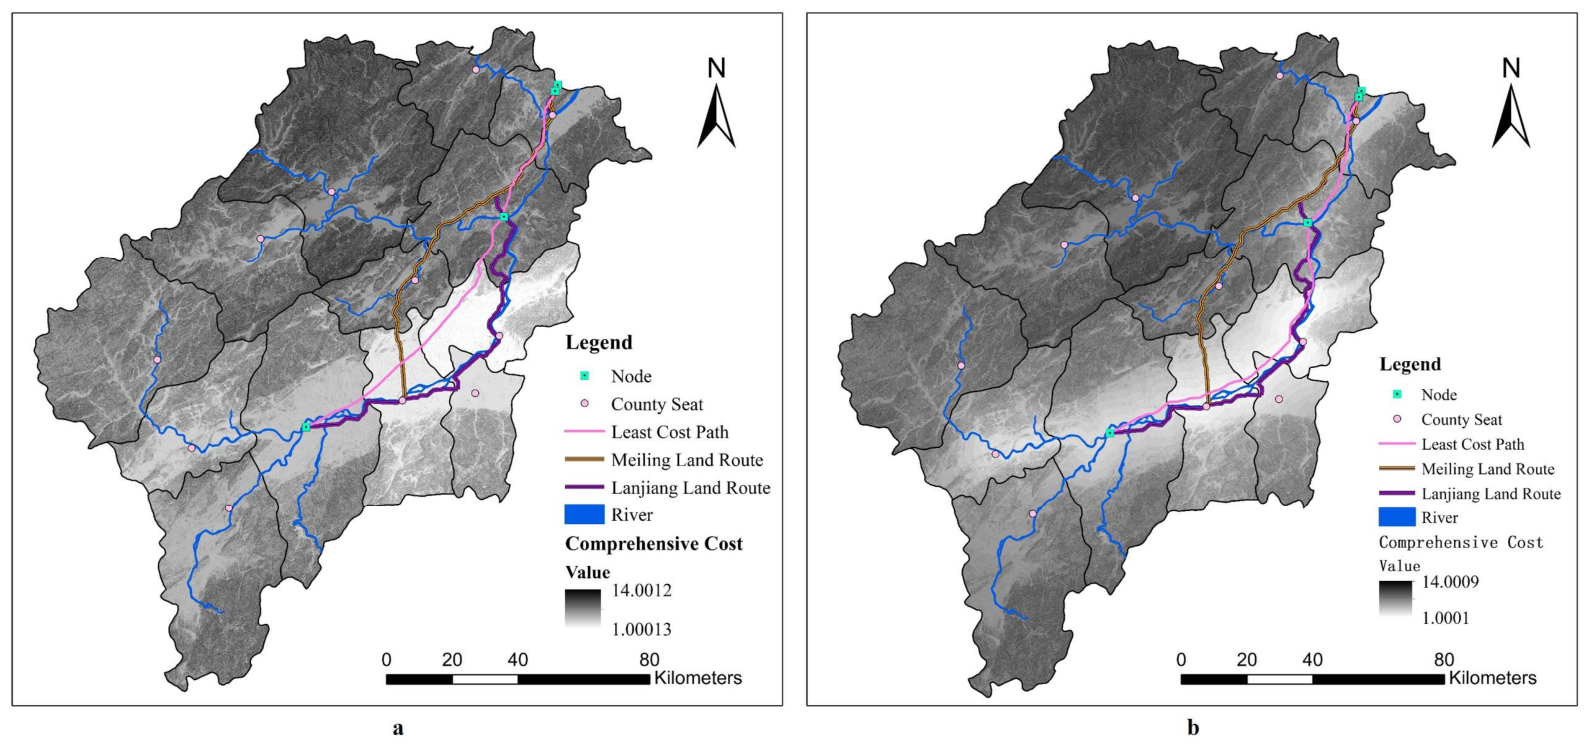
In Figure 8a, lower cost values indicate denser populations and flatter terrain between cities, which reduce the cost of constructing official ways. Subsequently, considering the function of delivery ways connecting prefectural seats, nodes were selected: Luoqiao and Baifeng on the Hangzhou–Yanzhou border, as well as the prefectural seats of Yanzhou and Quzhou. The LCP route was generated via the cost connectivity function, tracing areas with the lowest land cost. This LCP route corresponds to the northern sections of both the Meiling Land Route and Lanjiang Land Route, while its southern segment follows the banks of the Qiantang River through Lanxi and Tangxi counties into Quzhou Prefecture, consistent with the Lanjiang Land Route. On the one hand, these areas were characterized by relatively flat terrain and dense populations; on the other hand, their proximity to the Qiantang River waterway—which at the time constituted part of the principal route linking the capital with southeastern China—enabled the Lanjiang Land Route to maintain its transportation significance. In contrast, the Meiling Land Route, characterized by more rugged terrain, a smaller population, and greater distance from the Qiantang River waterway—the national transportation artery—was unable to sustain its transportation significance.
Figure 8.
The least cost path created via the AHP-GIS model, comprehensive cost (a) and comprehensive cost with Distance factor (b).
Considering the function of official ways connecting prefectural seats, four nodes were selected: Luoqiao and Baifeng on the Hangzhou–Yanzhou border, as well as the prefectural seats of Yanzhou and Quzhou. Then, we applied the LCP model, based on the comprehensive cost surface, and the least cost path was generated (Figure 8a).
By incorporating the additional factor of the distance to water courier way as a fourth constraint to examine resulting changes in the route, it was found that the water courier way aligns more closely with the overland route along the riverbank. The formula is as follows:
3.5. Route Consistency Verification
Based on a multifactorial analysis shown in Figure 7 and Figure 8b, the cost values along the Qiantang River main channel are lower, reflecting its flat terrain, denser population, and riverine location. In contrast, the cost values along the Meiling Land Route are higher. This contrast led to the official routes shifting toward the Qiantang River, while the Lanjiang Land Route maintained its status as a transportation corridor.
Combining ArcGIS 10.5 Analysis Tools, we assessed the consistency between the least cost path and two official roads. In this section, the least cost path is abbreviated as LC, the Lanjiang Land Route is abbreviated as LR, and the Meiling Land Route is abbreviated as MR.
First, using the Multiple Ring Buffer function, we create a 2000 m buffer for LC. Then, using the Intersect function, we calculate the lengths of LR and MR that fall within the buffer zone, as well as the proportion of these lengths to their respective total lengths. In the result, 38.67% of the Lanjing Land Route are within this buffer zone, and 20.70% of the Meiling Land Route are within this buffer zone.
4. Discussion
4.1. The Commonalities and Heterogeneities Behind Road Evolution
By applying more accuracy analysis with four factors, including distance to waterways, the result further confirms that economic drivers remain the primary influence on road changes. Transportation, population, and delivery efficiency account for 39.54%, 29.52%, and 24.75% of the impact, respectively, while the distance effect accounts for 6.2%. Notably, transportation and population factors directly related to economic benefits constitute 69.06% of the total influence. Although the distance effect represents an insignificant portion at 6.2%, it signifies a meaningful shift toward waterways due to their superior transport capacity. This trend further reflects a prioritization of economic efficiency and underscores the critical role of economic and social sustainability in infrastructure development. This finding is consistent with some studies, which collectively emphasize the importance of economics in road selection [6,16,19,21].
In this article, transportation cost is the factor with the highest weight, reflecting the impact of the external environment on economic costs, which is a combination of the two. The achievement of this study confirms for the first time that economic costs play a significant role in road changes, especially over a longer period. This work is also in line with recent considerations of economic costs in road selection. Searching for Web of Science with AHP, GIS, and Road, until February 2026, there were 976 studies in total. Of them, using the term “Economic” in the topic section for further quantitative analysis, there are 210 papers of this type. Road selection is the subject of this work, and the literature search results have shown a strong continuity in their annual distribution, in terms of quantity, and a fluctuating upward trend. This also fully illustrates all of this.
Moreover, in this work, the proportion of factors related to economic costs is extremely high, which is determined by the characteristics of the times. First, in the mountainous areas of western Zhejiang during the Ming Dynasty, the terrain’s influence on costs was amplified, forcing the road network to be simplified and ultimately laid out only along the low-cost riverbanks. Secondly, unlike Zahra Maserrat, who applied technology to counter the limitations of the physical environment [6], and unlike Long Chen and others, who prioritized ecology to protect the local environment [21], the planning of official routes during the Ming Dynasty faced absolute external natural constraints. In the pre-industrial era of technological backwardness, the terrain directly affected the difficulty and cost of road construction and maintenance, forcing people to choose the most economically rational paths.
Population is the secondary factor in this study. Nautiyal Akhilesh and Sharma Sunil considered the socio-economic facilities along rural roads as the secondary factor [19]. Hosseini Seyed Ata Ollah, when planning forest roads, considered the distance to villages as the primary factor and the distance to infrastructure as the secondary factor [16]. These conclusions are also similar to those of this study. However, the emphasis on human factors along the route in these two studies is aimed at making the planned roads serve regional development; in contrast, in the work, the population needs to serve the normal operation of the official ways. This logic of “determining roads by service” is the unique social driving force behind the simplification of ancient road networks.
In summary, the simplification of the official route network from Yanzhou to Quzhou is not only a result of the infrastructure’s high pursuit of economic cost but also a product of the natural environment and the centralized mobilization system of the pre-industrial era.
4.2. Calibration of the AHP-GIS Model in Ancient Route Restoration
In recent years, the cost connectivity function has been increasingly applied in historical transportation geography, using DEM data to reconstruct ancient roads by identifying the least cost path with nodes. However, with a low density of nodes, accurate route reconstruction requires additional GIS-based functions [52]. That is, accuracy depends on a higher density of nodes. For example, Dong Jianfei restored routes for the Korean envoys in the Ming Dynasty using a large number of courier station sites [47]. Accordingly, four nodes were selected: the prefectural seats of these two prefectures, and Luoqiao and the Baifeng Hill on the Yanzhou–Hangzhou boundary.
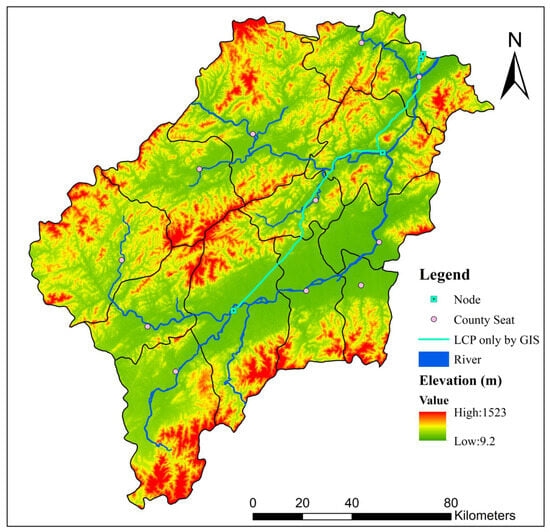
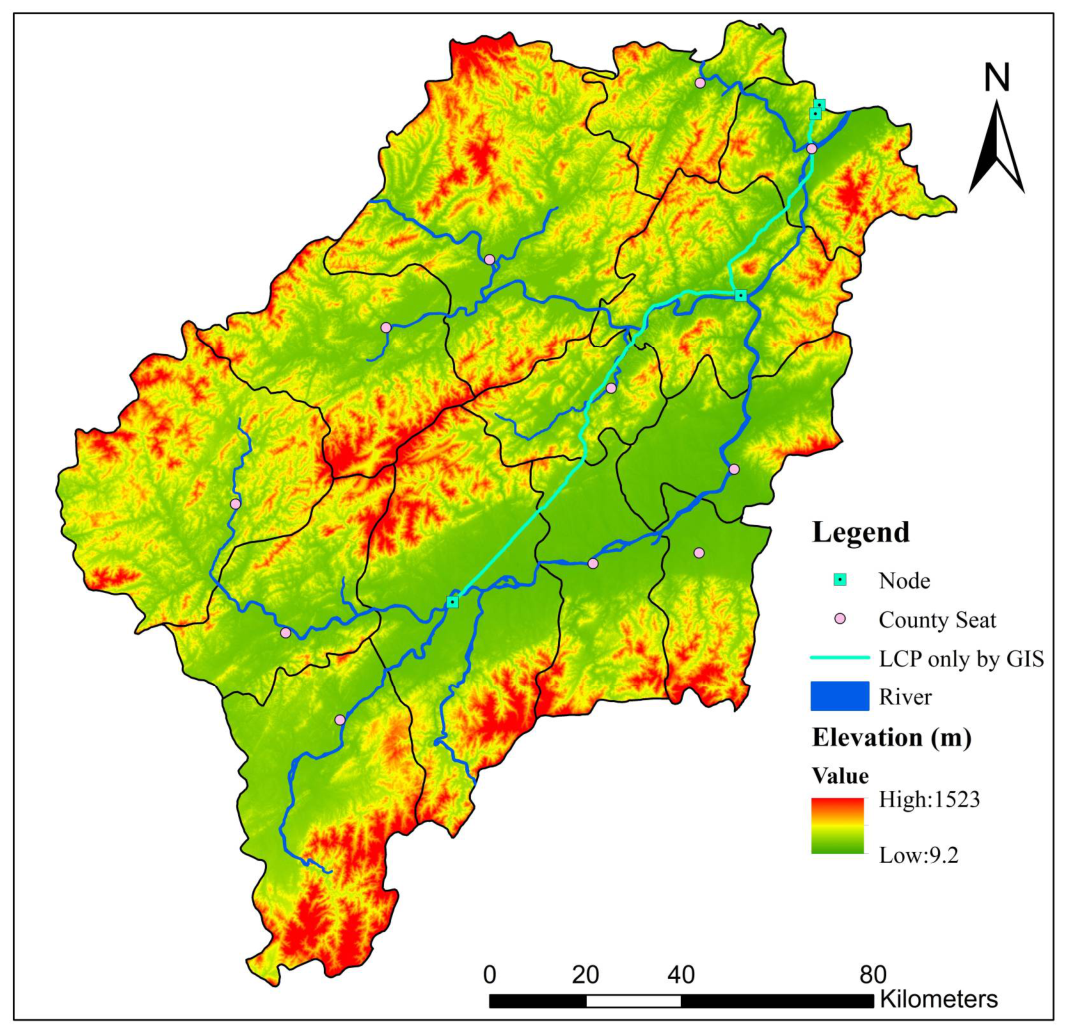
As shown in Figure 9, if only terrain-based GIS analysis is applied and the analytic hierarchy process (AHP) is not used, the resulting least cost path diverges westward after departing Yanzhou Prefecture seat, before extending southwestward toward Shouchang County seat and entering Quzhou via the Meiling Hill. This trajectory is similar to that of the Meiling Land Route, failing to accurately restore Ming Dynasty-era conditions. Using the AHP-GIS model, the path generated is basically consistent with the Lanjiang Land Route, making it consistent with historical conditions during the Ming Dynasty.
Figure 9.
The paths determined only using GIS and without using the AHP-GIS model.
It demonstrates that the AHP-GIS model—by integrating social factors such as population, economy, and politics with topographical constraints—more accurately reconstructs historical route alignments and highlights that minimizing comprehensive cost, instead of shortest distance alone, governed route selection, providing a verifiable analysis path for the composite historical phenomenon.
4.3. Deficiencies and Prospects
This study employed the AHP-GIS model to reveal multi-dimensional changes in the southern transportation hub. However, first, this study does not deeply explore the impact of waterways on pipeline changes; second, the model used in this study is relatively simple and does not incorporate the impact of waterways into the evaluation criteria.
The scope for future research includes two primary directions. Firstly, we intend to develop more sophisticated evaluation criteria and employ diverse methodological approaches beyond the AHP-GIS model to investigate historical transportation dynamics. Secondly, we will integrate the findings of ancient route restoration with the protection of surrounding cultural heritage, fostering a holistic approach to the conservation of historical corridors.
5. Conclusions
5.1. Conclusion
This study applies the AHP–GIS model to reconstruct route alignments, using the spatial evolution of roads in the Qiantang River Basin during the past sixty decades as a case study. The findings highlight the decisive role of economic demand in the selection of official ways and reveal how the physical environment dictated road configurations through economic cost constraints in ancient time. Yanzhou and Quzhou are the typical southern hubs connecting economically important areas, but the reason why their official road system can be maintained for a long time is due to the optimization of economic costs in spatial layout, rather than political needs for official control purposes. This provides a reference for the site selection of cross-regional transportation corridors today—the vitality of strategic infrastructure depends on its sustainability in operating costs, rather than simply political functions. It also powerfully demonstrates the role of economic factors in route selections, overriding the principle of simply seeking the shortest path. In fact, traffic conditions involve stochastic parameters that follow specific patterns and exhibit reproducible characteristics; for instance, road traffic flow patterns vary significantly depending on the time of year or month [53].
This prioritization ultimately led to the gradual simplification of the local official route network. Specifically, 39.54% transportation cost and 29.52% population, both associated with economic considerations, accounted for 69.06%. Therefore, land routes along the Qiantang River retained their transport significance due to these economic advantages, serving as the primary trunk line there until the abolition of the traditional postal system in the late 19th century.
The significance of this work is twofold. Methodologically, it applies the AHP-GIS model to the evolution of roads related to the economy, addressing previous studies’ gaps; theoretically, it can point out that the underlying structure of any sustainable physical network must be rooted in the continuous optimization of operational efficiency, which reflects the sustainability.
5.2. Perspective
During a relatively long period, studying the changes in roads can accurately reflect the important and crucial role played by economic value, especially in reducing logistics costs and improving circulation efficiency. Activating the rural economy and the annual transportation of agricultural products directly helps farmers increase their income. At the same time, the changes and construction of roads have promoted free movement, and efficient road networks have accelerated production factors such as population, capital, information, and technology. Flowing between urban and rural areas and regions, promoting the formation of a unified market, driving industrial agglomeration and urbanization, forming industrial corridors along official roads, attracting enterprise layout, and driving employment and investment, this has been the case throughout the past and present, and at home and abroad, which can be further deeply surveyed.
Supplementary Materials
The following supporting information can be downloaded at: https://www.mdpi.com/article/10.3390/su18136876/s1, Figure S1. Administrative division map of the research area. Figure S2. Elevation profile map of the study area. Figure S3. Topography and River Overview of the Study Area. Figure S4. The map of Zhejiang Province of 1937. Figure S5. The contributation of nodes of the Meiling Land Route. Figure S6. The contributation of nodes of the Lanjiang Land Route. Figure S7. The depiction of the Meiling land route on ancient Southern Song maps. Figure S8. The map of hiking speed. Figure S9. Distance to water courier way based on the Euclidean distance function. Table S1. Data sources utilized in this study. Table S2. Names of nodes along the Meiling land route. The order is from north to south. These nodes are labeled based on the place name information in Figure S7. Table S3. Names of nodes along the Lanjiang land route. The order is from north to south. The node names were based on Table S4. Table S4. The list of urgent deliveries in the Ming Dynasty. Table S5. The list of courier stations in the Ming Dynasty. Table S6. Population data of each county from 1552 to 1572. Table S7. Reclassification criteria. The order is from north to south. These nodes are labeled based on the place name information in Figure S7 [54,55,56,57,58].
Author Contributions
Conceptualization, J.F.; methodology, G.Q.; software, S.X. and G.Q.; validation, Z.W.; investigation, S.X.; resources, Z.W.; writing—original draft, S.X.; writing—review and editing, Z.W. and P.J.; visualization, S.X.; supervision, J.F. and P.J. All authors have read and agreed to the published version of the manuscript.
Funding
This work is supported by the Zhejiang University Earth Science Fund (Grant No. 207400-520866/040) and the Key Project of the National Social Science Fund of China (Grant No. 24AGL001).
Institutional Review Board Statement
Not applicable.
Informed Consent Statement
Not applicable.
Data Availability Statement
The datasets presented in this article are not readily available because the original contributions presented in this study are included in the article/Supplementary Materials; further inquiries can be directed to the corresponding authors. Requests to access the datasets should be directed to Shiyi Xie (22038023@zju.edu.cn).
Conflicts of Interest
The authors declare no conflict of interest.
References
- Wang, C.; Ducruet, C.; Wang, W. Evolution, accessibility and dynamics of road networks in China from 1600 BC to 1900 AD. J. Geogr. Sci. 2015, 25, 451–484. [Google Scholar] [CrossRef] [Scilit]
- Weber, J. Route change on the American freeway system. J. Transp. Geogr. 2018, 67, 12–23. [Google Scholar] [CrossRef] [Scilit]
- Grujic, Z.; Grujic, B. Optimal Routing in Urban Road Networks: A Graph-Based Approach Using Dijkstra’s Algorithm. Appl. Sci. 2025, 15, 4162. [Google Scholar]
- Cui, G. Operations Research, 1st ed.; China Statistics Press: Beijing, China, 1995; pp. 296–300. [Google Scholar]
- Kazama, V.S.; Dalla, A.P.; Goncalves, R.C.; Arce, J.E.; Oliveira-Nascimento, K.A.; DeArmond, D. Global review on forest road optimization planning: Support for sustainable forest management in Amazonia. For. Ecol. Manag. 2021, 492, 119–159. [Google Scholar] [CrossRef] [Scilit]
- Maserrat, Z.; Alesheikh, A.A.; Jafari, A.; Charandabi, N.K.; Shahidinejad, J. A Dempster–Shafer Enhanced Framework for Urban 675 Road Planning Using a Model-Based Digital Twin and MCDM Techniques. ISPRS Int. J. Geo-Inf. 2024, 13, 302. [Google Scholar]
- Lan, P. The Research on GIS Application in Flood-Disaster People Transfer Scheme Designer. Master’s Thesis, Huazhong University of Science and Technology, Wuhan, China, 2023. [Google Scholar]
- Pellegrini, M.; Grigolato, S.; Cavalli, R. Spatial Multi-Criteria Decision Process to Define Maintenance Priorities of Forest Road Network: An Application in the Italian Alpine Region. Croat. J. For. Eng. 2013, 34, 31–42. [Google Scholar]
- Hayati, E.; Abdi, E.; Majnounian, B.; Makhdom, M. Application of Sensitivity Analysis in Forest Road Networks Planning and Assessment. J. Agric. Sci. Technol. 2013, 15, 781–792. [Google Scholar]
- Yakar, F.; Celik, F. A highway alignment determination model incorporating GIS and Multi-Criteria Decision Making. KSCE J. Civ. Eng. 2014, 18, 1847–1857. [Google Scholar] [CrossRef] [Scilit]
- Effat, H.A.; Hassan, O.A. Designing and evaluation of three alternatives highway routes using the Analytical Hierarchy Process and the least-cost path analysis, application in Sinai Peninsula, Egypt. Egypt. J. Remote Sens. Space Sci. 2013, 16, 141–151. [Google Scholar]
- Feng, G.; Su, G.; Sun, Z. Optimal route of emergency resource scheduling based on GIS. In Proceedings of the 3rd International Workshop on the Use of GIS in Emergency Management (EM-GIS), Redondo Beach, CA, USA, 7–10 November 2017; pp. 1–5. [Google Scholar] [CrossRef] [Scilit]
- Gumus, S. An Evaluation of Stakeholder Perception Differences in Forest Road Assessment Factors Using the Analytic Hierarchy Process (AHP). Forests 2017, 8, 165. [Google Scholar] [CrossRef] [Scilit]
- Farooq, A.; Xie, M.; Stoilova, S.; Ahmad, F.; Guo, M.; Williams, E.J.; Gahlot, V.K.; Yan, D.; Mahamat Issa, A. Transportation Planning through GIS and Multicriteria Analysis: Case Study of Beijing and Xiong’an. J. Adv. Transp. 2018, 2018, 2696037. [Google Scholar] [CrossRef] [Scilit]
- Grassi, Y.S.; Díaz, M.F.; Rossit, D.A. Review of indicators and multi-criteria decision-making methods for assessing the sustainability of urban mobility. Front. Future Transp. 2026, 7, 1759314. [Google Scholar] [CrossRef] [Scilit]
- Hosseini, S.A.O.; Moghadasi, P.; Fallah, A. Forest Road Network Design based on Multipurpose Forestry Management in Hyrcanian Forest. J. Environ. Sci. Manag. 2019, 22, 13–20. [Google Scholar] [CrossRef] [Scilit]
- Lee, J.H.; Lim, S.Y. An Analytic Hierarchy Process (AHP) Approach for Sustainable Assessment of Economy-Based and Community-Based Urban Regeneration: The Case of South Korea. Sustainability 2018, 10, 4456. [Google Scholar] [PubMed]
- Song, Y.; Thatcher, D.; Li, Q.; McHugh, T.; Wu, P. Developing sustainable road infrastructure performance indicators using a model-driven fuzzy spatial multi-criteria decision making method. Renew. Sustain. Energy Rev. 2021, 138, 110538. [Google Scholar]
- Nautiyal, A.; Sharma, S. Condition Based Maintenance Planning of low volume rural roads using GIS. J. Clean. Prod. 2021, 312, 127649. [Google Scholar] [CrossRef] [Scilit]
- Drazic, S.; Danilovic, M.; Ristić, R.; Stojnić, D.; Antonic, S. Evaluation of Morphometric Terrain Parameters and Their Influence on Determining Optimal Density of Primary Forest Road Network. Croat. J. For. Eng. 2023, 44, 301–312. [Google Scholar] [CrossRef] [Scilit]
- Long, C.; Pang, Y.; Wang, Z. Study of the Sustainability of a Forest Road Network Using GIS-MCE. Forests 2023, 14, 2410. [Google Scholar] [CrossRef] [Scilit]
- Rivero Gutiérrez, L.; De Vicente Oliva, M.A.; Romero-Ania, A. Managing Sustainable Urban Public Transport Systems: An AHP Multicriteria Decision Model. Sustainability 2021, 13, 4614. [Google Scholar] [CrossRef] [Scilit]
- Zhang, Y.; Mofei, L. Research on the Selection of Green Lanes for Ecotourism in Frontier Rural Areas-Taking Daur Manchu Township of Kunhe in Heihe City as an Example. Chin. Landsc. Archit. 2024, 40, 101–107. [Google Scholar]
- Wang, Z. Collection of Ancient Chinese Transportation Culture, 1st ed.; China Social Sciences Press: Beijing, China; pp. 141, 156–164.
- Mu, Y.; Pan, C. “Post Road” and “Nationalization”—On the East Haixi Water and Land Route During Ming Dynasty. J. Guangxi Minzu Univ. 2017, 39, 13–19. [Google Scholar]
- Yang, F. A Preliminary Study of Liao-Jin History, 1st ed.; Gansu Culture Publishing House: Lanzhou, China, 2023; p. 352. [Google Scholar]
- Dong, H. A discussion of transportation of post stations in Tianshanbeilu. Tri. Soc. Sci. Xinjiang 2021, 6, 102–109. [Google Scholar]
- Chen, J.; Lan, Y. “The Gravitational Pull of Langzhong”: How Administrative Status Shaped the Course of Shu’s Official Ways. J. Sichuan Norm. Univ. 2021, 48, 199–208. [Google Scholar]
- Xiao, Z. Historical Evolution of the Main Transportation Routes on the Liaohe Plain. Knowledge 2009, 6, 59–64. [Google Scholar] [CrossRef]
- Nong, R. Spatial Evolution Characteristics of Official Roads in Southern Fujian Province Based on LCP Model. Master’s Thesis, Huaqiao University, Quanzhou, China, 2023. [Google Scholar]
- Li, Z. The change and optimization of the northern section of Jinniu Road. Collect. Essays Chin. Hist. Geogr. 2004, 19, 47–58. [Google Scholar]
- Song, X.; Pei, X.; Zhang, X. Study on Geographical Spatial Characteristics and Historical Evolution of Gansu Post Station in Qing Dynasty. Lib. Inf. Serv. 2024, 68, 88–105. [Google Scholar]
- Chen, L. Flood and the Vicissitudes of the Ancient Transportation Path in Yellow River Valley. Areal Res. Dev. 2010, 29, 138–143. [Google Scholar]
- Han, C.; Xiao, A. Traffic route change of the Silk Road in east part of southern Tianshan mountain in historic times. J. Chang’an Univ. (Soc. Sci. Ed.) 2019, 21, 69–76. [Google Scholar]
- Xiong, H.; Han, C. The Relationship Between Traffic Line Change and the Environment of Southern Tarim Basin in Historical Period. Hum. Geogr. 2006, 92, 40–44. [Google Scholar]
- Ni, Z. The Research about Administrative Region, Cities and Transportation of Muzhou from Six Dynasties to Tang Song. Master’s Thesis, Zhejiang University, Hangzhou, China, 2016. [Google Scholar]
- Cao, J. Transport and Politics in the Song Dynasty, 1st ed.; Zhonghua Shuju Press: Beijing, China, 2017; pp. 122–127, 138–139. [Google Scholar]
- Gu, Y.; Yunnan Provincial Library (Eds.) Zhaoyu Zhi (Manuscript No. 11), 1st ed.; Guangxi Normal University Press: Guilin, China, 2024; pp. 55–56. [Google Scholar]
- Wu, S. The Ming Dynasty Military Postal Relay System and the Relay Post Personnel. Res. Ming Dyn. 2022, 39, 71–100. [Google Scholar]
- Su, T. Mingdai Yidi Zhidu, 1st ed.; Editorial Board of Chinese Series in Taiwan: Taipei, China, 1969; pp. 7–9, 184–191. [Google Scholar]
- Minetti, A. Efficiency of equine express postal systems. Nature 2003, 426, 785–786. [Google Scholar] [CrossRef] [Scilit] [PubMed]
- Chen, Q. The Complete Works of Chen Qiaoyi, 1st ed.; People’s Publishing House: Beijing, China, 2018; pp. 779–781. [Google Scholar]
- Li, Z. (Proofread and Annot); Proofreading and Annotation of ‘Xijizhi-Tianxiazhanming’, 1st ed.; Sanqin Press: Xi’an, China, 2017; pp. 311–313. [Google Scholar]
- Yao, G.; Xie, J. (Ming Dynasty); Yongle Encyclopedia; High-Definition Image Database of the Yongle Encyclopedia; National Library of China Publishing House: Beijing, China, 2023; Volume 19422, pp. 15b, 16b–17a. Available online: https://yongle.shidianguji.com/introduction?page_from=yongle_home_page (accessed on 27 July 2025).
- Anonymous. (Ming Dynasty); Liudong de Zhongguo: Huanyu Tongqu; Yang, Z., Ed.; Nanjing Publishing House: Nanjing, China, 2019; pp. 1–12. [Google Scholar]
- Tobler, W. Three Presentations on Geographical Analysis and Modeling; Technical Report; NCGIA, University of California: Santa Barbara, CA, USA, 1993; pp. 1–25. [Google Scholar]
- Dong, J.; Xi, Q.; Han, D.; Gao, Y. A study on China and Korea diplomatic rout and the Korea post house along the rout in Ming dynasty. Archit. J. 2019, 20, 183–187. [Google Scholar]
- Jiangshan Transportation Chronicle Editorial Committee. Jiangshan Transportation Chronicle; Zhejiang People’s Publishing House: Hangzhou, China, 1993; p. 1.
- Quzhou Transportation Bureau Historical Office. Quzhou Transportation Chronicle; The Ocean Press: Beijing, China, 1992; pp. 247–251.
- Jinhua Transportation Chronicle Editorial Committee. Jinhua Transportation Chronicle; The Ocean Press: Beijing, China, 1997; pp. 349–352.
- Hangzhou Transportation Chronicle Editorial Committee. Hangzhou Transportation Chronicle; The Ocean Press: Beijing, China, 2003; pp. 395–400.
- Jedwab, R.; Storeygard, A. Economic and Political Factors in Infrastructure Investment: Evidence from Railroads and Roads in Africa 1960–2015. Econ. Hist. Dev. Reg. 2019, 34, 156–208. [Google Scholar] [CrossRef] [Scilit]
- Macioszek, E.; Kurek, A. Road traffic distribution on public holidays and workdays on selected road transport network elements. Transp. Probl. 2021, 16, 127–138. [Google Scholar] [CrossRef] [Scilit]
- Zhejiang Provincial Bureau of Surveying (Ed.) Zhejiang Historical Atlas (Volume II), 1st ed.; China Map Press: Beijing, China, 2001; pp. 598–599.
- Miu, C.; Xu, J. (Eds.) Integrated Collection of Yanzhou Historical Documents, 1st ed.; Hangzhou Publishing House: Hangzhou, China, 2020; Volume 1, pp. 17–21, 216–218, 252–254, 304–309, 331–333. [Google Scholar]
- Wang, M.; Lu, F. (Wanli) Jinhua Prefectural Gazetteer, 1st ed.; Chengwen Publishing Co., Ltd.: Taipei, China, 1973; pp. 337–342, 600–617. [Google Scholar]
- Lin, Y.; Ye, B. (Tianqi) Quzhou Prefectural Gazetteer, 1st ed.; Chengwen Publishing Co., Ltd.: Taipei, China, 1973; pp. 678–690. [Google Scholar]
- Yang, T. (Kangxi) Quzhou Prefectural Gazetteer, 1st ed.; Chengwen Publishing Co., Ltd.: Taipei, China, 1973; pp. 390–392, 1479–1480. [Google Scholar]

Disclaimer/Publisher’s Note: The statements, opinions and data contained in all publications are solely those of the individual author(s) and contributor(s) and not of MDPI and/or the editor(s). MDPI and/or the editor(s) disclaim responsibility for any injury to people or property resulting from any ideas, methods, instructions or products referred to in the content. |
© 2026 by the authors. Licensee MDPI, Basel, Switzerland. This article is an open access article distributed under the terms and conditions of the Creative Commons Attribution (CC BY) license.