1. Introduction
Power system state estimation is a core function of distribution management systems and energy management systems, and its estimation results directly affect the operational monitoring and control capability of power systems [
1]. With the continuous expansion of power system scale and complexity, power system state estimation is gradually shifting from a static calculation problem under single-source measurements to a collaborative perception and fusion estimation problem under multi-source heterogeneous measurements [
2].
In this paper, the studied system is specified as a renewable-integrated distribution network rather than a main transmission grid or an isolated microgrid. Compared with traditional transmission-level state estimation, distribution-network state estimation is more affected by limited measurement coverage, heterogeneous data sources, asynchronous sampling, user-side load fluctuations, and the uncertainty introduced by distributed renewable generation. These characteristics make state estimation in renewable-integrated distribution networks more vulnerable to missing measurements, communication delays, data-quality differences, and weak observability. Therefore, this work focuses on multi-source state estimation for renewable-integrated distribution networks under heterogeneous SCADA, PMU, and AMI measurements.
In this paper, sustainable energy systems mainly refer to distribution-network operating systems under high penetration of renewable energy and distributed resources. Compared with traditional power systems, such systems face more significant operational variability, measurement heterogeneity, and data uncertainty in state estimation. On the one hand, the output of distributed renewable energy resources is strongly affected by meteorological conditions, leading to more frequent changes in nodal power injections and voltage states. On the other hand, multi-source measurement devices such as SCADA, PMU, and AMI exhibit significant differences in sampling frequency, measurement accuracy, communication delay, and data integrity, making unified and reliable state estimation more difficult. In addition, limited measurement coverage in distribution networks, missing measurements, abnormal data, and communication delays may further reduce system observability. Therefore, state estimation for sustainable energy systems should not only improve estimation accuracy but also ensure physical consistency, data credibility, and operational reliability.
In traditional power system state estimation, extensive studies have been conducted on weighted least squares, phasor measurement unit (PMU)-based measurement correction, and dynamic filtering methods. For example, the parameter configuration of weighted least squares estimators has been reasonably analyzed to improve the accuracy of traditional models [
3]. A linear Bayesian improvement method was proposed to enhance the bias resistance of state estimation under PMU measurements [
4]. For state tracking in dynamic scenarios, a robust cubature Kalman filter was introduced into dynamic state estimation under multi-rate measurements [
5]. The performance of fractional-order extended Kalman filtering in nonlinear time-varying environments was investigated [
6]. In addition, a robust particle filtering method was developed to improve the robustness of state estimation [
7]. Although these methods have achieved certain progress, their adaptability remains limited in complex dynamic scenarios.
Recent studies on inverter-based power systems and isolated AC microgrids have shown that robust observers, asynchronous sliding-mode observers, and resilient distributed fault-tolerant control are essential for maintaining operational reliability under actuator faults, saturation constraints, and communication uncertainty [
8,
9]. These studies further indicate that power systems with high renewable energy penetration require estimation and control methods that explicitly consider physical constraints, system dynamics, and data uncertainty. Unlike the above studies, which mainly focus on system control and fault tolerance, this paper focuses on the multi-source heterogeneous measurement state estimation problem in renewable-integrated distribution networks. It uses topology information, physical constraints, and reference measurements provided by the digital twin to guide DDPM-based missing-measurement completion and improves the reliability of the final state estimation results through a credibility-aware fusion mechanism.
With the continuous integration of new sensing devices, data-driven state estimation methods have gradually become a research hotspot. Existing studies have summarized the development of power system state estimation under multi-source data conditions and pointed out that multi-source heterogeneous measurement fusion is becoming an important direction for improving system situational awareness [
2]. On this basis, overhead line sensors have been introduced to expand the information sources of state estimation and improve system observability [
10]. With the improvement of sensing conditions, researchers have further employed deep learning methods to directly model the complex nonlinear relationship between measurements and system states [
11]. A deep statistical solver was constructed for distribution system state estimation [
12], while physics-informed graphical learning was combined with Bayesian averaging to improve model stability and trustworthiness in complex dynamic scenarios [
13]. Meanwhile, deep multi-fidelity Bayesian data fusion was used to enhance state inference and observability under limited real-time measurements [
14].
Furthermore, in the broader field of integrated energy systems, data-driven modeling and closed-loop intelligent optimization have also received extensive attention. Hybrid policy-based reinforcement learning has been used to study adaptive energy management in energy transmission-constrained island groups, improving dynamic decision-making capability in complex energy scenarios [
15]. Deep reinforcement learning has also been applied to multi-energy transaction optimization in energy Internet systems, enhancing coordinated scheduling among multiple energy carriers [
16]. On this basis, an interpretable hybrid deep reinforcement learning method was proposed for energy management in low-carbon community energy systems, improving both online optimization capability and interpretability [
17]. These studies indicate that complex energy systems are gradually evolving from traditional static analysis toward data-driven modeling and closed-loop intelligent optimization. This trend also provides important inspiration for introducing digital twin technology and intelligent generative models into state estimation with multi-source heterogeneous measurements.
Although existing studies have made progress in state estimation improvement and data-driven modeling, two main limitations remain under multi-source heterogeneous measurement conditions. First, the quality of missing-data recovery and the generalization ability of models are still limited in complex dynamic scenarios. Second, existing methods make insufficient use of real-time topology, equipment operation mechanisms, and cyber–physical consistency information, making it difficult to fully guarantee the accuracy and trustworthiness of state estimation results. Therefore, improving data completion, physical consistency constraints, and trustworthy multi-source fusion in complex scenarios remains an urgent problem.
To address these challenges, digital twin technology provides a new research perspective for state estimation with multi-source heterogeneous measurements. A digital twin refers to a high-fidelity virtual model constructed in digital space that evolves synchronously with physical entities or processes. By integrating physical mechanisms, real-time measurements, and historical operating data, it enables dynamic mapping and accurate representation of the operating state of physical systems [
18]. Digital twins have the advantages of high-precision virtual simulation, real-time cyber–physical synchronization, and collaborative modeling based on both physical models and data-driven methods [
19], thereby supporting prediction, verification, and optimization of complex systems [
20]. It should be noted that, in this study, the digital twin is not implemented as a field-deployed real-time operational platform. Instead, it is used as a simulation-driven model-based reference layer to provide reference states, reference measurements, and virtual–real consistency information for state estimation. Owing to these advantages, digital twins have been widely applied in complex scenarios such as healthcare systems [
21], supply chains [
22], and intelligent transportation [
23]. However, although digital twins have shown great potential in complex system modeling and online optimization, their application in power system state estimation with multi-source heterogeneous measurements remains relatively limited. In particular, systematic research is still lacking in missing-data completion, cyber–physical consistency verification, and trustworthy multi-source data fusion [
24].
Based on the above considerations, this paper combines digital twins with data-driven state estimation. A denoising diffusion probabilistic model (DDPM) is used to achieve high-quality missing-measurement completion [
25]. Meanwhile, cyber–physical consistency verification and trustworthy multi-source data fusion mechanisms are incorporated to construct a high-trust state estimation method for multi-source heterogeneous measurement scenarios. The proposed method aims to improve the accuracy, robustness, and trustworthiness of state estimation in complex dynamic environments.
Therefore, the proposed method does not directly evaluate carbon emissions or environmental performance. Instead, it improves the observability, robustness, and credible state estimation capability of renewable-integrated distribution networks from the perspective of operational state awareness, thereby supporting the safe and reliable operation of sustainable energy systems.
The main contributions of this paper are summarized as follows.
A four-layer model-based digital twin reference framework is built for state estimation with multi-source heterogeneous measurements under simulation settings. The framework links physical sensing, digital twin reference mapping, AI-based data completion, and estimation feedback, so that measurement information, simulated topology updates, and estimation results can interact within a simulation-based cyber–physical feedback procedure.
A self-supervised DDPM is used to recover missing measurements under the guidance of digital twin reference measurements. Available measurements, real-time topology, twin reference values, and physical constraints are incorporated into the denoising process, which helps the generated pseudo-measurements remain consistent with feasible power system operating states.
A credibility-based fusion strategy is designed for measured and generated data. Timeliness, data integrity, measurement accuracy, and virtual–real consistency are jointly considered when assigning fusion weights, reducing the impact of low-quality data on the final state estimation result.
The remainder of this paper is organized as follows.
Section 2 constructs the overall four-layer digital twin state estimation framework based on a cyber–physical closed loop.
Section 3 presents the physically constrained self-supervised DDPM guided by digital twins, including its training and generation mechanisms.
Section 4 establishes a multi-source heterogeneous data credibility evaluation and weighted fusion method incorporating digital twin-based cyber–physical verification.
Section 5 presents the state estimation algorithm and simulation results.
Section 6 concludes the paper and discusses future research directions.
2. Four-Layer Model-Based Digital Twin Reference Framework for State Estimation
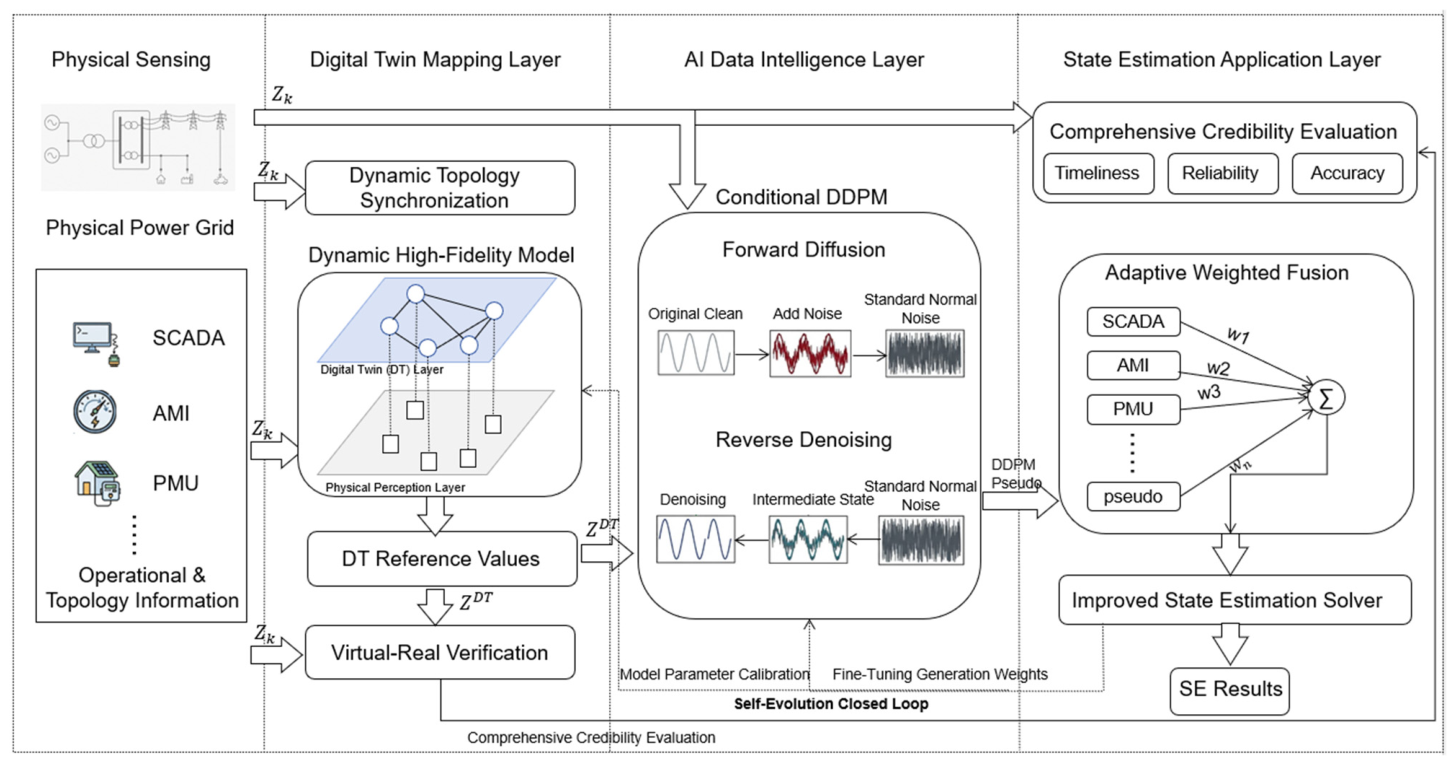
Figure 1 shows the proposed four-layer model-based digital twin reference framework for state estimation under simulation settings. The framework consists of four tightly coupled layers from bottom to top: the physical sensing layer, the digital twin mapping layer, the AI data intelligence layer, and the state estimation application layer.
2.1. Physical Sensing Layer
The physical sensing layer is located at the bottom of the framework and is responsible for sensing the operating states of physical power system entities. This layer integrates various measurement systems with different performance characteristics to overcome the limitations of a single data source in terms of coverage or accuracy. When switching operations or topology changes occur in the physical power grid, this layer can immediately capture state variation signals. These real-time physical contexts are not only used to define the physical constraints of state estimation but are also injected into the AI data intelligence layer as conditional inputs, ensuring that the completed pseudo-measurement data strictly conform to the topology rules of the power grid.
Before entering the DDPM missing-measurement completion module and the multi-source fusion module, SCADA, PMU and AMI measurements are first time-aligned according to the state estimation period . The PMU high-frequency data is aggregated by the nearest timestamp matching or moving average method, the SCADA data is aligned by zero-order holding or linear interpolation, and the AMI data is maintained in the adjacent estimation window as a quasi-static load prior. The aligned measurements are uniformly mapped to the time index k, and the timeliness weight is calculated according to the delay for subsequent credibility fusion.
2.2. Digital Twin Mapping Layer
The digital twin mapping layer is located above the physical sensing layer and serves as the key logical hub for cyber–physical interaction. Based on the real-time topology and measurement data obtained from the physical layer, this layer constructs a model-based reference representation of the power system under simulation settings and converts it into physical prior knowledge that can be used by algorithms. Its main functions are as follows.
In this simulation study, the digital twin layer is implemented as a model-based reference layer rather than a fully deployed real-time operational digital twin system in an actual distribution network. Specifically, the layer is constructed based on the MATPOWER test system, simulated topology information, equipment parameters, and generated measurement configurations. It provides topology-synchronized reference states and reference measurements for DDPM-based missing-measurement recovery and virtual–real consistency verification under simulation settings. Therefore, the term digital twin in this paper mainly refers to a simulation-driven digital twin approximation that provides physical prior information and reference measurements, rather than a complete engineering-level digital twin platform with real-time field deployment.
From the perspective of the simulation implementation, PMU, SCADA/RTU, AMI, and switching-state information are represented by simulated measurement configurations and topology data. After data cleaning, time alignment, and format standardization, the measurement data and switching states are mapped to the nodes, branches, loads, and generation units in the model-based digital twin reference layer. The topology synchronization module updates the network topology, admittance matrix, and measurement functions according to the simulated topology settings. The mechanism simulation module then generates digital twin reference states and reference measurements based on the updated network model. Through this process, the operating-state information in the simulated physical system is mapped into digital reference elements, providing a basis for subsequent physical constraint generation, virtual–real consistency verification under simulation settings, missing-measurement completion, and state estimation feedback.
The digital twin in this paper is different from the traditional offline simulation. Traditional simulation is usually based on fixed topology and given parameters for single or offline calculation. In the simulation framework of this paper, the digital twin reference model is driven by simulated topology information, measurement data, equipment parameters, and operating constraints, and is updated according to the measurement refresh cycle, simulated switching-state changes, and state estimation feedback. The digital twin layer provides state references, reference measurements, physical constraints, and virtual–real consistency information for the DDPM-based missing-measurement completion process. Therefore, the digital twin in this paper should be understood as a dynamic model-based reference layer for state estimation under simulation settings, rather than as a field-deployed operational digital twin platform.
The digital twin engine adopts a physical model based on AC power flow and state estimation, which is driven by real-time topology , equipment parameter , load/power injection, operation constraints and observed measurements. Its output includes digital twin state reference , reference measurement and physical feasible region . The digital twin model is dynamically updated with the measurement refresh cycle and topological events. In the simulation of this paper, its update cycle is consistent with the state estimation cycle. The branch parameters are given by the test system, and the load and injection power are corrected according to the multi-source measurement. When the virtual and real deviation exceeds the set threshold, it triggers parameter correction or fusion weight adjustment.
2.2.1. Dynamic Topology Synchronization and Physical Constraint Generation
The digital twin mapping layer synchronizes simulated topological switching information and generates physical mechanism constraints according to the updated grid structure according to updated grid structures, including node voltage amplitude limitation and node power balance equations, as expressed in Equation (1):
where
denotes the voltage amplitude of node
;
and
represent the minimum and maximum allowable voltage limits of node
, respectively;
refers to the node index;
is the set of all nodes in the power system;
indicates that the constraints apply to every node within the system;
represents the line power flowing from node
to its adjacent node
;
denotes the set of neighbor nodes directly connected to node
;
is the net outflow power from node
to all adjacent nodes;
and
represent the generation power and load power of node
, respectively. These dynamic physical constraints are injected into the upper AI data intelligence layer in real time, serving as physical guidance constraints for the reverse denoising process of the DDPM to guarantee the physical consistency of generated synthetic data.
2.2.2. Cyber–Physical Verification and Credibility Benchmark
The digital twin mapping layer uses the simulated reference values generated by the mechanism engine as benchmarks to establish a cyber–physical alignment and correction mechanism. By comparing the residuals between simulated physical measurements and digital twin reference values, the system can evaluate the error level of multi-source heterogeneous data in each estimation period, providing objective inputs for the subsequent AHP-based data credibility evaluation system.
2.2.3. Feedback-Based Adjustment Interface Under Simulation Settings
When the overall state estimation error exceeds the preset threshold, the mapping layer dynamically updates the coupling index
and drives the AI layer to fine-tune the data generation strategy, supporting feedback-based adjustment of the generation strategy under simulated topology-changing conditions. The coupling degree calculation formula is defined as:
where
denotes the coupling index at operating instant k;
is the active-power measurement Jacobian matrix;
extracts the diagonal part of a matrix;
denotes the Frobenius norm; and
is a small positive constant used to avoid division by zero. A larger
indicates stronger off-diagonal coupling among the measurement variables.
The coupling index is constructed based on the off-diagonal elements of the active power measurement Jacobian matrix and can therefore reflect the coupling strength among system variables. When topology switching occurs, the network admittance matrix and the measurement Jacobian matrix change accordingly, and the coupling index also changes. To reduce the influence of measurement noise on the coupling index, this paper adopts a moving-window smoothing and threshold-triggering mechanism. Only when the coupling index exceeds the threshold over several consecutive estimation periods will constraint-weight adjustment or model fine-tuning be triggered, thereby avoiding false triggering caused by instantaneous noise.
2.3. AI Data Intelligence Layer
The AI data intelligence layer is responsible for measurement completion and data reconstruction in the proposed framework. It uses real-time measurements from the physical sensing layer as conditional inputs and applies a conditional DDPM to generate missing or insufficient measurements through the reverse denoising process. The digital twin mapping layer provides topology information and physical constraints, such as voltage limits and power balance equations, to guide the generation process. With these constraints, the generated pseudo-measurements are more likely to remain within feasible operating ranges rather than being determined only by the learned data distribution. In addition, the self-supervised training strategy allows the model to learn missing-data recovery patterns from available historical measurements. When the estimation error changes under topology-switching or abnormal operating conditions, feedback from the state estimation layer can be used to adjust the generation process and improve its adaptability.
2.4. State Estimation Application Layer
The state estimation application layer integrates real-time measurements with the pseudo-measurements generated by the AI data intelligence layer to obtain the final system state. In this layer, the quality of different data sources is first evaluated according to timeliness, data credibility, measurement accuracy, and virtual–real consistency. Based on the evaluation results, adaptive fusion weights are assigned to the available measurements, and a standardized measurement vector is formed for the subsequent state estimation process. The estimation calculation is carried out using a dynamic decoupled least squares method. When the coupling degree of the system increases, additional compensation terms are introduced to reduce the influence of model mismatch and strong coupling on the estimation results. The state estimation layer feeds estimation residuals, voltage limit violations, power imbalance, and virtual–real deviations back to the digital twin mapping layer. Based on this feedback, the digital twin layer updates the reference states, reference measurements, and coupling indicators, and transfers the updated physical priors to the AI data intelligence layer. The AI layer preferentially adjusts the DDPM conditional inputs and constraint weights according to the feedback results, rather than retraining the model in every estimation cycle. Only when the virtual–real deviation or estimation residual continuously exceeds the threshold is small-step online fine-tuning triggered.
To clarify the distinction between the state space and the measurement space, the main symbols used in the proposed framework are summarized in
Table 1.
3. Physics-Constrained Self-Supervised DDPM Guided by Digital Twin
3.1. Denoising Principle of the DDPM
The DDPM mainly consists of two parts: the forward diffusion process and the reverse denoising process. Its core idea is to map the original data to a Gaussian noise distribution through gradual noise addition, and then use a parameterized network to learn the reverse denoising process, so as to realize the reconstruction and generation of the original data distribution.
3.1.1. Forward Diffusion Process of Standard DDPM
Let the original sample be
. The forward diffusion process of DDPM is essentially a Markov chain, whose goal is to gradually push the original data distribution to the standard normal distribution by injecting Gaussian noise step by step. The forward diffusion at step
can be expressed as
where
is the data distribution,
is the noisy sample at the previous diffusion step,
denotes the DDPM diffusion step,
is the noisy sample at step
,
is the identity matrix, and
denotes a Gaussian distribution. The coefficient
is determined by the predefined noise schedule
, namely
denotes the Gaussian noise injected at diffusion step t:
To avoid iterative computation from
to
during training, it is necessary to directly express
as a closed-form function of
. Expanding
from Equation (3), we have:
According to the property that the linear combination of independent Gaussian variables still follows a Gaussian distribution, the noise terms in Equation (5) can be merged into an equivalent Gaussian noise term with variance
Continuing to recursively expand back to
, we obtain
is the index of diffusion steps in the cumulative product. Then, the closed-form expression of forward diffusion is obtained:
Equation (10) gives the reparameterized sampling form of , which can be used to directly sample noisy samples at any time step during the training phase.
3.1.2. Reverse Denoising Process of Standard DDPM
The forward diffusion gradually perturbs the original sample
into approximate Gaussian noise
, while the reverse denoising process starts from
and gradually recovers the original data distribution. Since the true reverse distribution
is difficult to obtain directly, DDPM uses a parameterized Gaussian distribution to approximate it:
is the parameterized reverse transition distribution; θ denotes neural network parameters;
is the learned reverse mean;
is the reverse sampling standard deviation. Given
, the true reverse posterior can be expressed by Bayes’ formula:
Since all terms in the forward diffusion process are Gaussian distributions, Equation (12) still corresponds to a Gaussian posterior:
where
and
denote the posterior mean and variance of the true reverse process.
From the closed-form expression of forward diffusion:
It can be seen that if the noise term
can be estimated,
can be indirectly recovered. Therefore, DDPM uses a neural network
to predict the noise and substitutes it into the reverse mean to obtain:
Then, the reverse sampling process is:
Set
when
. In the training phase, the network parameters are updated by minimizing the mean square error between the true noise and the predicted noise:
The expectation is taken over the original sample , diffusion step , and Gaussian noise ; denotes the Euclidean norm. This loss function makes the model learn the denoising direction at each diffusion step by constraining the predicted noise to approximate the true noise.
3.2. Conditional Modeling and Self-Supervised Training for Measurement Completion
The standard DDPM above is suitable for unconditional data generation, while the power system measurement completion problem is a typical conditional generation task, i.e., inferring missing measurements using known measurements. Based on the conditional DDPM framework, this paper further introduces mechanism information provided by digital twins to enhance the physical consistency and scenario adaptability of the measurement completion process.
Let the multi-source measurement vector at time
be
, including SCADA, PMU, AMI and other data. To adapt to the actual missing-measurement scenario, a random mask matrix
is used to divide the complete sample into the conditional observation part and the generation target part:
where
denotes the Hadamard product,
represents the retained known observations, and
represents the target measurements that are artificially masked and need to be recovered by the model. In this way, even if the actual missing labels are unknown, the “known–missing” mapping relationship can be constructed based on complete historical samples to realize self-supervised training.
In the self-supervised training phase, this paper uses a fixed 20% random masking rate to construct training samples. Specifically, for the complete historical measurement vector, 80% of the measurements are randomly retained as conditional observations , and the remaining 20% of the measurements are used as target measurements to simulate missing measurements and train the completion ability of DDPM. The fixed masking rate can make the model learn the missing-measurement recovery law while retaining sufficient condition information, so as to take into account the training stability and reconstruction accuracy. Under the 20% random measurement masking condition, the pseudo-measurements generated by DDPM supplement the missing-measurement information and are combined with the retained physical measurements to form a more complete measurement input for subsequent fusion and state estimation.
Forward diffusion is applied to the target measurement
, then
The corresponding reverse process is characterized by the conditional probability:
This means that the model relies not only on the current noise state but also on the known measurements
as conditional constraints in each denoising step, so as to ensure that the generated results are consistent with existing observations. The training objective can be written as
where
is the noisy target measurement at diffusion step
, and
is the original target measurement.
denotes the conditional noise prediction loss. Compared with the unconditional DDPM, the essential difference of the conditional DDPM is that the network no longer learns a simple “noise-to-data” mapping, but a “noise-to-target measurement under conditional measurement constraints” mapping. Therefore, it is more suitable for pseudo-measurement completion and data reconstruction scenarios in power systems.
3.3. Embedding of Physical Constraints Guided by Digital Twin
The conditional DDPM can complete missing measurements using known measurements, but it may still generate pseudo-measurements that do not conform to the power grid operation mechanism in scenarios such as topology switching, measurement anomalies or high missing rates. To this end, this paper introduces a digital twin guidance mechanism to embed real-time topology, reference measurements and physical constraints into the reverse denoising process.
Suppose that the digital twin mapping layer generates the twin state reference value at the current moment based on the real-time topology
, equipment parameters
and conditional observations
:
and obtains the reference measurement through the measurement function:
It should be emphasized that is a state-space reference generated by the digital twin layer, whereas is the corresponding reference measurement in the measurement space. The nonlinear measurement function maps the digital twin state reference from the state space to the measurement space. Therefore, the DDPM-based recovery process in this paper is still performed in the measurement space, and the model generates target measurements or pseudo-measurements rather than final state variables.
Then, the noise prediction network can be extended to:
Accordingly, the reverse mean guided by digital twin is:
The candidate target measurement is obtained by reverse sampling:
To ensure that the generated results meet the power grid operation constraints, the physical feasible domain at time
is defined as
and the candidate denoising results are projected and corrected at each step:
where
denotes the real-time grid topology at time
,
represents the equipment and operating parameters, and
is the known conditional measurement vector.
is the digital twin mapping function, and
denotes the state reference generated by the digital twin.
is the nonlinear measurement function of the power system,
is the corresponding digital twin reference measurement vector, and
represents the target part of the reference measurement corresponding to the missing measurements.
is the noisy target measurement at diffusion step t,
is the digital twin-guided noise prediction result, and
is the corresponding reverse denoising mean.
denotes the candidate target measurement before physical projection,
is the reverse sampling standard deviation, and
is the standard Gaussian noise used in reverse sampling. Ck denotes the feasible physical domain at time k.
and
are the active and reactive power balance mismatches at node
, while
and
are the allowable mismatch thresholds.
denotes the apparent power flow of branch i-j, and
is the corresponding branch capacity limit.
is the projection operator. The projection operation acts on the generated target measurement subset in the measurement space. It does not directly estimate the final system state x, nor does it interpret the DDPM output as a state variable. Instead, it corrects the candidate missing-measurement vector
into a physically feasible measurement vector
under the feasible domain
. The final state variable x is obtained later by the state estimation solver using the fused measurement vector.
The physical projection operator is implemented as a constrained least-squares correction problem. Its objective is to keep the DDPM-generated candidate measurements as unchanged as possible while making the corrected measurements satisfy node voltage upper/lower limits, relaxed nodal power balance constraints, and line capacity constraints. The problem can be numerically solved by constrained quadratic programming or sequential quadratic programming. Since the projection acts only on the generated target missing-measurement subset rather than on the complete state space, its computational cost is lower than that of full nonlinear state optimization. For large-scale systems, linearized constraints, regional decomposition, and parallel solution strategies can be combined to further improve computational efficiency.
The above formula shows that the proposed method introduces known measurements, digital twin reference measurements, real-time topology and physical feasible domain constraints simultaneously in the reverse denoising process, thereby improving the physical consistency of pseudo-measurement generation.
3.4. Training Objective and Dynamic Adjustment Mechanism
Integrating conditional noise prediction, physical constraints and digital twin consistency requirements, this paper constructs the total loss function:
where
,
and
represent the conditional noise prediction loss, physical-constraint loss and digital twin consistency loss, respectively.
The physical-constraint loss is defined as
The digital twin consistency loss is
where
denotes the target measurements generated by the DDPM,
corresponds to the target part of reference measurements derived from the digital twin model, and
refers to the weight matrix for different types of measurements.
To adapt to dynamic virtual–real deviations under variable operating conditions, a virtual–real deviation indicator is formulated to quantify the synchronization error between the physical power grid and its digital twin counterpart:
where
represents the observed measurements generated by the digital twin, and
is a minimal positive constant to avoid division by zero. Based on the calculated virtual–real deviation
, the weight coefficients of physical constraints and digital twin consistency constraints are dynamically updated throughout the model training process:
where
and
denote the dynamically adjusted weights of the physical-constraint loss and the digital twin consistency loss, respectively.
and
are their initial weights, while
and
denote the corresponding upper bounds.
and
are sensitivity coefficients that control the responses of the two constraint weights to the virtual–real deviation. These parameters are used to balance data reconstruction accuracy, physical feasibility, and digital twin consistency. Specifically, when the virtual–real deviation increases under abnormal or switched grid topologies, the model adaptively raises the weights of the physical-constraint loss and the digital twin consistency loss, thereby strengthening the physical plausibility and generation credibility of the reconstructed missing measurements. In contrast, under steady and normal operating conditions, lower constraint weights are adopted to preserve the data-distribution learning capability of the DDPM, ensuring a balance between data-driven fitting performance and physical mechanism compliance.
These parameters do not directly determine the final state estimation results; rather, they regulate the balance between data-driven reconstruction capability and physical constraint strength. In this paper, the parameter settings are determined by jointly considering validation-set error, physical-constraint violations, and generated-measurement stability. Sensitivity analysis shows that the model error changes only slightly when these parameters are adjusted within a reasonable range, indicating that the proposed method has a certain degree of robustness to hyperparameters.
4. Multi-Source Heterogeneous Data Credibility Evaluation and Weighted Fusion Method with DT Virtual–Real Calibration
To avoid ambiguity in the credibility-aware fusion process, the terminology used in this section is clarified as follows. Credibility refers to the comprehensive credibility score obtained by weighted aggregation of multiple data-quality indicators. Integrity/reliability refers to the completeness of measurement data and the reliability of data acquisition and communication, mainly reflecting missing data, abnormal data, and communication failures. Measurement accuracy refers to the measurement error level of different devices. Virtual–real consistency refers to the consistency between physical measurements or generated pseudo-measurements and digital twin reference measurements. Trustworthiness is used only as a general description of the overall reliability of the proposed framework, rather than as an independent credibility indicator.
After high-confidence pseudo-measurement generation was completed by the digital twin-guided DDPM, reliable evaluation and fusion of multi-source heterogeneous data including SCADA, PMU, AMI, and generated pseudo-measurements are still required. Since various types of data differ significantly in sampling cycle, transmission delay, measurement accuracy, and anti-disturbance capability, fixed weights or unified measurement variances fail to suppress the adverse impacts of low-quality data on state estimation. To address this issue, this paper constructs a multi-source heterogeneous data credibility evaluation system integrated with digital twin virtual–real calibration, and develops an adaptive weighted fusion method, so as to provide high-confidence standardized measurement profiles for subsequent power system state estimation.
4.1. Construction of Multi-Source Heterogeneous Data Credibility Evaluation Indicators
Let the measurement vector of the
-th data source at time
be
, and the corresponding digital twin reference measurement be
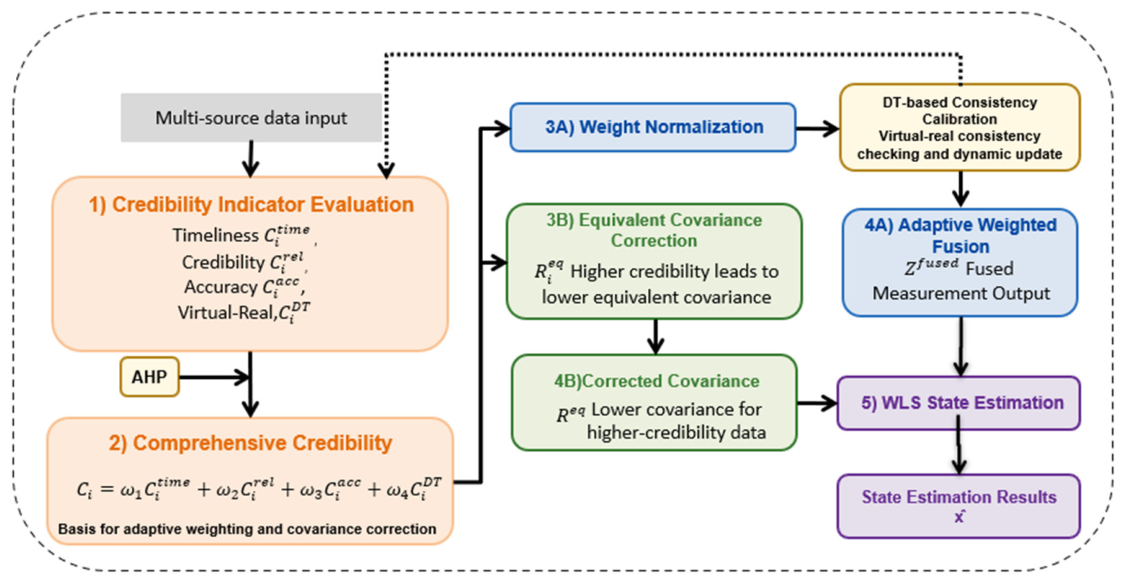
. Considering the dynamic characteristics and virtual–real consistency of measured data, four dimensions, including timeliness, integrity/reliability, measurement accuracy, and virtual–real consistency, are adopted to establish a comprehensive data credibility indicator system. The Credibility-aware multi-source measurement fusion workflow with digital twin-based consistency calibration is shown in
Figure 2.
4.1.1. Timeliness Indicator
Timeliness reflects the consistency between measured data and the real operating state of the power system. For data sources with transmission or sampling delays, the timeliness is defined as follows:
where
denotes the time delay of the
-th data source at time
, and
represents the time decay coefficient. A larger time delay corresponds to a lower timeliness value
, indicating weaker real-time performance of the measurement data.
4.1.2. Integrity/Reliability Indicator
The integrity/reliability indicator describes the completeness and communication reliability of data during acquisition and transmission. It is quantified based on the data loss rate, anomaly rate and historical availability, and the specific expression is given by:
where
,
, and
represent the number of lost measurements, abnormal measurements, and total measurements of the
-th data source at time
, respectively. Higher data integrity and communication reliability correspond to a higher integrity/reliability score.
4.1.3. Measurement Accuracy Indicator
Measurement accuracy characterizes the inherent measurement error level of data acquisition devices. Given the statistical variance
of the
-th type of measurement, the normalized accuracy indicator is defined as:
where
is the measurement variance of the
-th data source, and
is a minimal positive constant to avoid zero denominator. A smaller measurement variance indicates higher measurement accuracy and a larger accuracy indicator value.
4.1.4. Virtual–Real Consistency Indicator
To compensate for the poor adaptability of traditional static quality evaluation methods under dynamic operating conditions, a model-based digital twin reference consistency verification mechanism under simulation settings is introduced in this work. The virtual–real consistency indicator is established by quantifying the deviation between physical measured data and digital twin simulation reference data:
where
and
denote the physical measurement and corresponding digital twin reference measurement of the
-th data source at time
, respectively, and
is the virtual–real deviation penalty coefficient. A smaller deviation between physical measurements and twin simulation data leads to higher virtual–real consistency.
In order to ensure the comparability between different credibility evaluation indexes, this paper first normalizes the four indexes of timeliness, integrity/reliability, accuracy and virtual–real consistency, so that their values are limited to the range of [0, 1]. Among them, the accuracy index is no longer directly used in the form of variance reciprocal, but the normalized accuracy score is used to avoid the accuracy index from being too large and leading the comprehensive credibility calculation when the measurement variance is small.
Integrating the above four individual indicators, the comprehensive credibility of the
-th data source is calculated as a weighted combination:
where
are the weight coefficients of timeliness, integrity/reliability, measurement accuracy, and virtual–real consistency indicators, satisfying the unit constraint:
Specifically, the AHP judgment matrix is constructed according to the relative importance of different data-quality factors in the tested state estimation scenario, and the final weights are further checked and adjusted based on engineering experience. Therefore, the credibility weights are not determined only by the mathematical consistency test, but also by jointly considering AHP consistency, measurement characteristics, and the sensitivity of state estimation to different data-quality factors.
The judgment matrix is set as follows:
The final weight vector calculated from this judgment matrix is:
where the weights denote the weights of timeliness, integrity/reliability, measurement accuracy, and virtual–real consistency, respectively. The AHP consistency test result is:
This indicates that the judgment matrix satisfies the consistency requirement and that the obtained weights can be used for comprehensive credibility calculation.
In the tested simulation scenario, measurement accuracy and virtual–real consistency are assigned relatively higher weights because the final state estimation results are sensitive to measurement errors and deviations in generated pseudo-measurements. Since the proposed method introduces DDPM-generated pseudo-measurements and digital twin reference measurements, virtual–real consistency provides an important criterion for evaluating whether the generated measurements are consistent with feasible operating states. In comparison, timeliness and data integrity are also considered in the credibility evaluation, but their weights are slightly lower because the simulated communication delays and missing-data ratios are within controllable ranges in the present test setting.
It should be noted that the above weight setting is scenario-dependent rather than universally fixed. In practical applications, if severe communication delays, large-scale AMI data loss, or poor communication-link reliability occur, the weights of timeliness and data integrity should be increased accordingly. Therefore, the AHP-based weights used in this paper represent a reasonable configuration for the current simulation scenario, rather than a fixed setting applicable to all operating conditions.
To analyze the roles of different credibility indicators in multi-source heterogeneous measurement fusion, this paper designs a credibility-indicator ablation analysis. The timeliness indicator is mainly used to reduce the influence of asynchronous sampling and communication delays on state estimation results. The integrity/reliability indicator reflects data missingness and abnormal communication conditions. The accuracy indicator distinguishes the accuracy differences among different measurement devices. The virtual–real consistency indicator measures the deviation between physical measurements and digital twin reference measurements. By removing each individual indicator and comparing the result with the complete credibility fusion strategy, the analysis shows that the indicators correspond to different data-quality risks and jointly improve the reliability of fused measurements.
4.2. Adaptive Weighted Fusion Based on Comprehensive Credibility
A single physical quantity in power systems is usually observed by multiple heterogeneous data sources simultaneously. To fully exploit valid measurement information and suppress data noise, adaptive dynamic weighting is performed for multi-source data based on the proposed comprehensive credibility indicator. Define
as the set of available data sources for fusion, and the normalized fusion weight of the
-th data source is formulated as:
On this basis, the standardized fused measurement profile is constructed via weighted fusion:
where
and
represent the normalized fusion weight and original measurement of the
-th data source at time
, and
is the final fused standardized measurement. Data sources with higher comprehensive credibility occupy larger weights in the fusion results. Compared with conventional fixed-weight fusion strategies, the proposed method dynamically adjusts fusion weights according to real-time system operating states and data quality, achieving superior adaptability under topology switching, measurement anomalies and volatile operating conditions.
Notably, the pseudo-measurements generated by the DDPM are regarded as an independent supplementary data source for fusion. The credibility of generated pseudo-measurements is evaluated according to their physical constraint compliance and virtual–real consistency. This strategy avoids error propagation caused by direct application of generated data while fully utilizing the compensation capability of pseudo-measurements in low-observability scenarios.
4.3. Equivalent Measurement Covariance Correction for State Estimation
To integrate data credibility information into the state estimation solving process, an adaptive covariance correction strategy is proposed for multi-source heterogeneous measurements. Let
be the original covariance matrix of the
-th data source; the credibility-calibrated equivalent covariance matrix is defined as:
where
denotes the equivalent covariance matrix after credibility correction. Measurements with higher comprehensive credibility obtain smaller equivalent covariance and higher weights in the state estimation solution, which suppresses the interference of low-quality data.
In order to ensure that the equivalent covariance matrix after credibility correction still has good numerical properties, this paper limits the comprehensive credibility to the interval [ε, 1], where ε > 0. When the original measurement covariance matrix is a symmetric positive definite matrix, the modified equivalent covariance matrix still remains symmetric positive definite, because is always a positive scalar. This ensures that the covariance matrix after credibility correction can be stably used for subsequent weighted least squares state estimation.
Furthermore, the fused multi-source measurements and corrected covariance matrix are incorporated into the weighted least squares state estimation objective function:
where
is the estimated system state vector, and
represents the nonlinear measurement function of the power system. The proposed framework realizes unified modeling of data evaluation, multi-source fusion and state estimation, enabling reliable and accurate system state perception under complex multi-source heterogeneous measurement conditions.
5. Simulation Analysis
5.1. Simulation Setup and Data Description
The IEEE 14-bus standard test system is used to validate the proposed method, and MATPOWER is employed to generate the base power flow data. This test system consists of buses, branches, generators, and loads, and is used to simulate power system state estimation scenarios under multi-source heterogeneous measurement conditions. The basic operating scenarios consider the effects of load disturbances, measurement noise, partial missing measurements, and different measurement configurations on state estimation results. A total of 1000 samples are selected for testing and analyzing the generative model and state estimation method. These samples are measurement data generated under different load disturbance and measurement noise conditions, mainly including bus voltage magnitudes, bus active/reactive power injections, active/reactive branch power flows at the sending end, and active/reactive branch power flows at the receiving end. The voltage magnitude sequences are used to evaluate the pseudo-measurement completion performance of different generative models, and the related multi-source measurement data are used to validate the state estimation performance of the proposed method under different measurement configurations.
This paper selects 1000 samples for generative model comparison and state estimation validation. For simulation analysis based on an IEEE test system, this sample size can cover typical operating states under different load disturbances, measurement noise levels, and missing-measurement conditions; therefore, it can satisfy the requirements of comparing the generation performance of VAE, GAN, and DDPM and validating the state estimation performance in this work.
The characteristics and functions of the different data sources considered in the multi-source heterogeneous measurement scenario are summarized in
Table 2.
Note: In the IEEE 14-bus simulation, the measurement coverage is specified as follows. PMU measurements are assigned to the selected PMU buses and provide voltage magnitude and phase angle measurements. AMI measurements are assigned to the selected load buses and provide load-side active/reactive power measurements. SCADA measurements include nodal active/reactive power injection measurements and active/reactive power flow measurements at both ends of the monitored branches. Here, nodal injection measurements refer to the active and reactive power injections at the monitored buses, while branch flow measurements refer to the active and reactive power flows at both the sending and receiving ends of the monitored branches. DDPM-generated pseudo-measurements are used to complete the missing nodal and branch measurements determined by the random measurement-level mask during each state estimation period.
5.2. Simulation Setup and Reproducibility Configuration
To improve the reproducibility of the experiments, the main DDPM architecture, training parameters, data-masking strategy, data partitioning method, random seed, and computing environment are summarized in
Table 3.
It should be noted that the current simulation is conducted with a fixed random seed and one independent run. This setting is used to ensure that all compared schemes, including the proposed method and the ablation variants, are evaluated under the same data partition, noise setting, masking pattern, and MATPOWER configuration. Therefore, the comparison mainly reflects the relative influence of different modules under a controlled simulation setting, rather than a statistically general conclusion across multiple random seeds. The statistical stability of the proposed method under multiple random seeds will be further investigated in future work.
To further improve reproducibility, Algorithm 1 summarizes the complete workflow of the proposed method based on the experimental settings listed in
Table 3.
| Algorithm 1: Digital Twin-Guided Multi-Source Measurement Fusion State Estimation Method |
Input:
Output:
1 Digital Twin Mapping Phase:
2 ,
3 Self-Supervised Masking Phase:
4
5 DDPM Training Phase:
6 repeat
7 Sample diffusion step and Gaussian noise:
8 Perform forward diffusion and DT-guided noise prediction:9 Optimize the DDPM with conditional, physical and DT-consistency losses:10 Update the DDPM parameters by gradient descent
11 until convergence
12 DDPM Sampling Generation Phase:
13 Initialize target measurements from Gaussian noise:14 for t = T,…, 1 do
15 Update the target measurements through DT-guided reverse denoising and physical feasible-domain projection:16 end for
17 Obtain the generated pseudo-measurements
18 Multi-source Data Fusion Phase:
19 Collect SCADA, PMU, AMI and DDPM-generated pseudo-measurements
20 Evaluate data credibility and perform adaptive weighted fusion:21 Correct the equivalent measurement covariance matrix:22 WLS State Estimation and Feedback Phase:
23 Construct the WLS state estimation objective:24 repeat
25 Update the system state by WLS iteration:26 until |||| <
27 Obtain the final estimated state and virtual–real deviation:
,
28 Feed and back to the digital twin model
29 return |
5.3. Analysis of the Digital Twin Reference-Guided DDPM
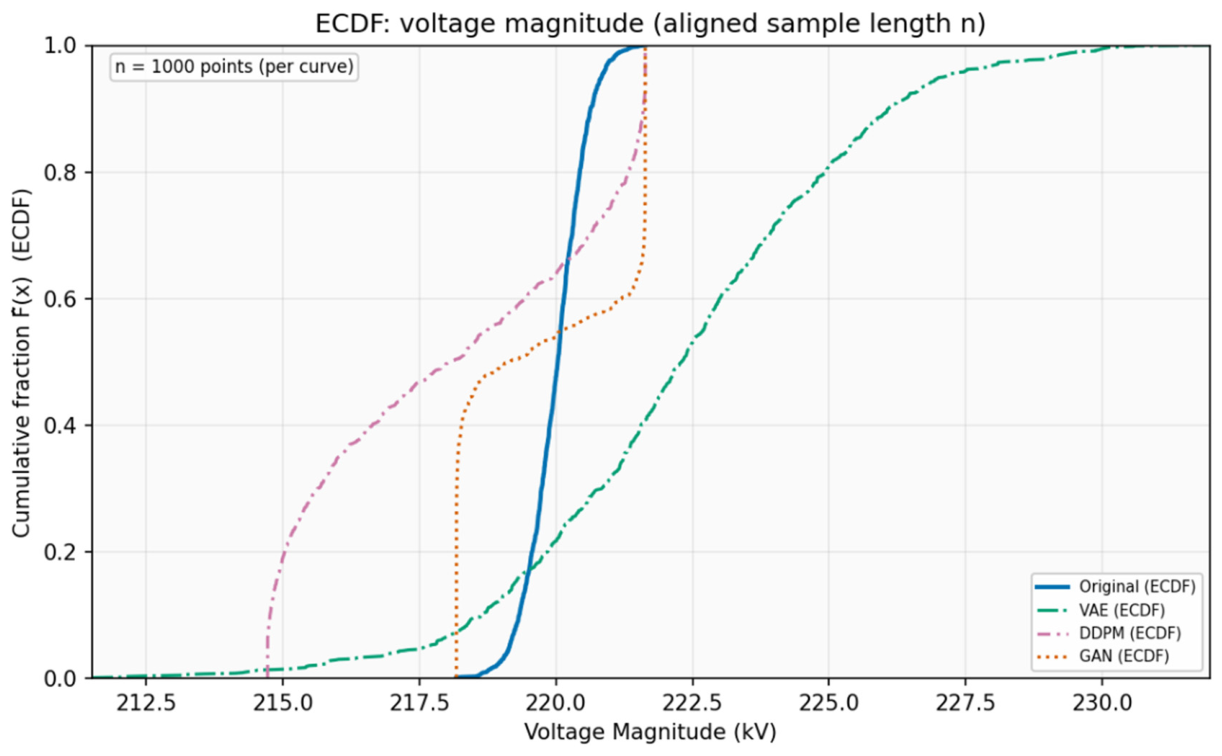
To analyze the applicability of the digital twin reference-guided DDPM in voltage data generation, this paper takes the PMU voltage magnitude sequence as the reference truth. With the support of operating-state mapping, reference measurement constraints, and prior information provided by the digital twin, the corresponding sequences generated by VAE, DDPM, and GAN are aligned point by point under the same sequence length. A total of
samples are selected for comparative analysis. The empirical cumulative distribution function is used to evaluate the consistency of the one-dimensional voltage magnitude distribution, while the mean absolute error MAE, normalized root mean square error NRMSE, and maximum absolute error MaxAE are used to quantify the deviation between each model and the real data through an error heatmap. The three indicators are defined as follows:
where
denotes the real voltage value,
denotes the generated voltage value,
denotes the sample length, and
and
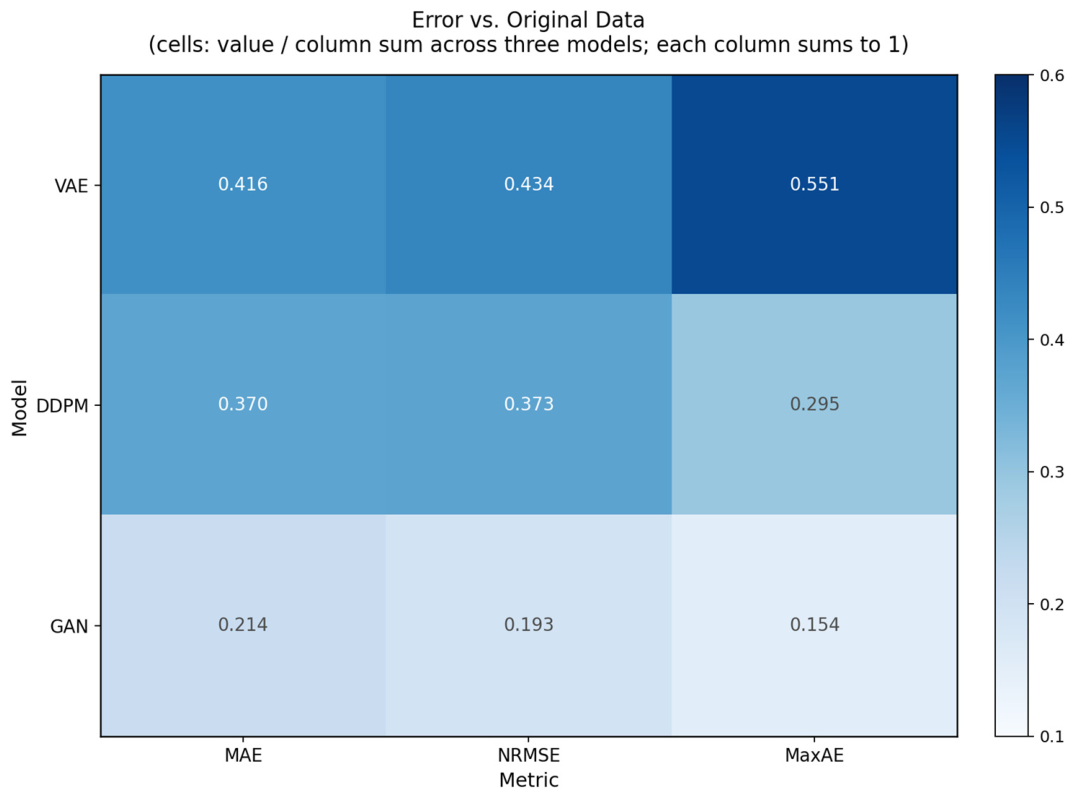
denote the maximum and minimum values in the real voltage sequence, respectively. It should be noted that the heatmap in
Figure 3 normalizes each column of error indicators. Therefore, the cell values represent the relative error share of each model under the corresponding indicator, rather than the original error values. Meanwhile, the color range of the heatmap is set to 0.1–0.6 to enhance the visual distinction among different models.
To provide a clearer comparison, the normalized error shares of VAE, DDPM, and GAN shown in
Figure 3 are summarized in
Table 4.
As shown in
Figure 3 and
Figure 4 and
Table 4, different generative models exhibit different characteristics in voltage data generation. VAE shows relatively large deviations from the real data distribution and occupies higher normalized error shares under MAE, NRMSE, and MaxAE. GAN achieves lower values than DDPM in some normalized point-error metrics, indicating that adversarial learning can provide competitive point-wise reconstruction performance in this comparison. However, GAN relies on adversarial training and may face training-stability and mode-collapse risks in the physical-constraint measurement recovery scenario considered in this paper. In comparison, DDPM does not rely on adversarial optimization. More importantly, its stepwise denoising structure facilitates the incorporation of known observations, digital twin reference measurements, topology information, and physical constraints into the generation process. Therefore, DDPM is adopted in this paper not because it is claimed to be universally superior to GAN in all generative tasks or all numerical indicators, but because it is more suitable for the proposed physically constrained and digital twin-guided missing-measurement completion framework.
5.4. State Estimation Analysis on the IEEE 14-Bus System
To further verify the effectiveness of the proposed digital twin-guided state estimation model in power systems, this paper conducts state estimation simulation analysis based on the IEEE 14-bus test system. The Matpower toolbox is used to generate the benchmark operating data of the system, and the related implementation and testing are completed in the MATLAB environment. With the model-based digital twin reference information, the physical system topology, reference measurement information, and the high-credibility pseudo-measurements generated in the previous stage are uniformly introduced into the state estimation process, thereby constructing a state framework under multi-source heterogeneous measurement conditions.
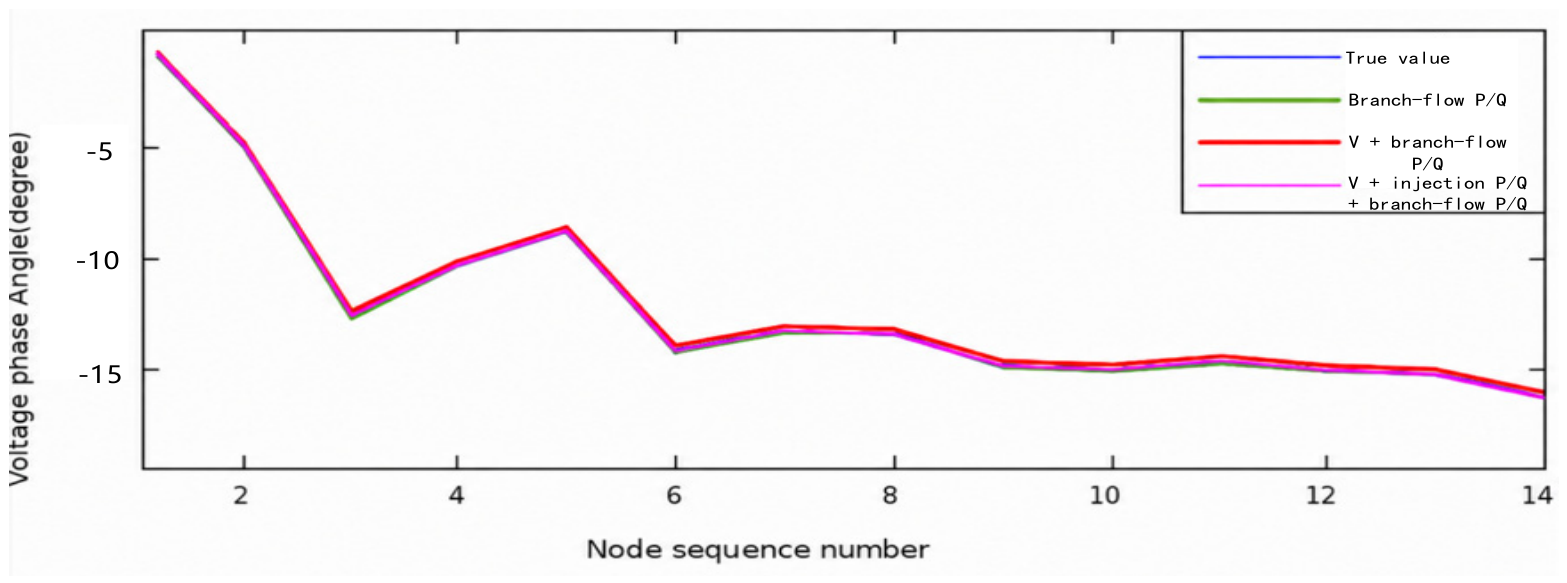
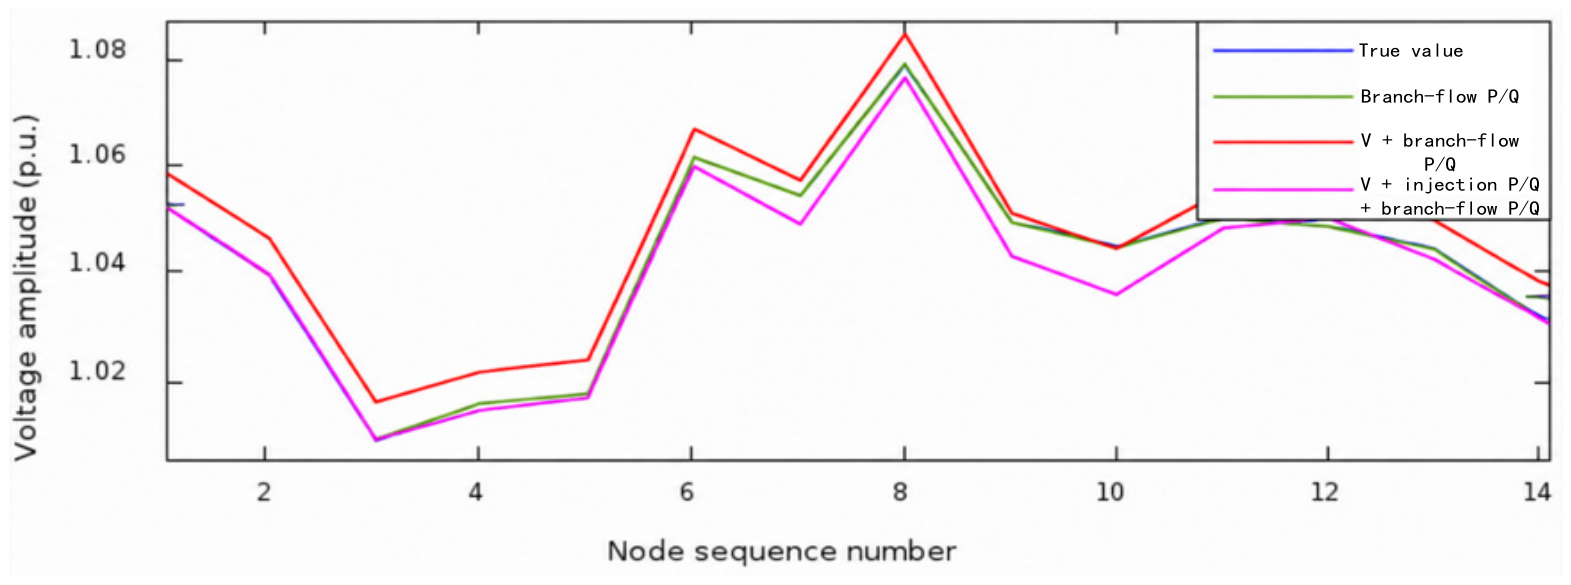
After completing multi-source measurement data fusion, this paper further tests the influence of different measurement configurations on the state estimation results of the power system. To improve the readability of
Figure 5 and
Figure 6, the original internal measurement-configuration labels are replaced with explicit legend labels. Specifically, Branch P/Q flow only denotes the configuration containing only active and reactive power flow measurements at both ends of the monitored branches; Voltage + branch P/Q flow denotes the configuration that adds nodal voltage magnitude measurements on the basis of branch-end power flow measurements; and Voltage + injection P/Q + branch P/Q flow denotes the configuration that simultaneously includes nodal voltage magnitude measurements, nodal active/reactive power injection measurements, and active/reactive power flow measurements at both ends of the monitored branches.
To further evaluate the physical feasibility and operational reliability of the state estimation results, two physically interpretable metrics, namely the number of voltage limit violations and the nodal power balance error, are introduced.
The number of voltage limit violations is defined as:
Here, denotes the number of voltage limit violations, denotes the estimated voltage magnitude of node i, and denote the allowable lower and upper voltage limits of the node, respectively.
Meanwhile, the nodal power balance error is defined as:
Here, and denote the active and reactive power balance errors of node i, respectively, and denotes the number of system nodes.
As shown in
Figure 5 and
Figure 6, the state estimation performance varies significantly under different measurement configurations. In general, the richer the measurement information, the closer the estimated results are to the true values. This indicates that multi-source heterogeneous measurement fusion can supplement the effective measurement information through complementarity among different measurement types and improve the numerical stability of state estimation. It can also use data redundancy to weaken the influence of insufficient single-source measurements on the estimation results, thereby improving the estimation accuracy of both voltage magnitudes and phase angles.
5.5. Qualitative Role Analysis of Credibility Indicators
To further clarify the individual roles of the four credibility indicators in multi-source heterogeneous measurement fusion, a qualitative role analysis is conducted. Each indicator is discussed according to the data-quality risk it addresses and the possible conceptual effect caused by removing it from the credibility-aware fusion strategy.
As shown in
Table 5, the four indicators qualitatively address different data-quality risks, including measurement delay, data missingness, accuracy differences, and virtual–real deviations. Their joint use provides a more comprehensive basis for credibility-aware multi-source measurement fusion.
5.6. Sensitivity Analysis of AHP Weights
In addition, we have added a weight sensitivity analysis. Specifically, the four weights are perturbed within the specified ranges, and the perturbed weights are renormalized before recalculating the final state estimation errors. The sensitivity analysis results are as follows:
As shown in
Table 6, when the four credibility weights vary within a certain range, the voltage magnitude error and phase angle error change only slightly, and no significant degradation of the state estimation results is observed. This indicates that the proposed credibility-aware fusion strategy has a certain degree of robustness to weight settings.
5.7. Ablation Analysis of the Main Components
To further quantify the contributions of the DDPM-based missing-measurement completion, digital twin reference information, and credibility-aware fusion mechanism, an ablation analysis is conducted by comparing the conventional method, the method without DDPM, the method without digital twin guidance, and the complete proposed method.
As shown in
Table 7, the traditional scheme exhibits the largest voltage magnitude and phase angle errors because it does not include DDPM-based missing-measurement completion, digital twin reference information, or credibility-aware fusion. The scheme without DDPM introduces digital twin guidance and credibility fusion, but its ability to compensate for missing measurements remains limited. The scheme without digital twin guidance can generate pseudo-measurements through DDPM; however, the absence of digital twin reference measurements, topology information, and virtual–real consistency constraints reduces the physical consistency and scenario adaptability of the generated data. The no-physical-projection approach is still capable of generating missing measurements via DDPM, but some of the generated values may fall outside the physically feasible domain, thereby increasing state estimation errors; the fixed-weight fusion approach cannot dynamically adjust the weights of different data sources based on timeliness, completeness, accuracy, and virtual–physical consistency, resulting in a decline in final estimation accuracy when low-quality data sources are present. Under the fixed random seed and controlled simulation setting used in this study, the comprehensive method combines DDPM, digital twin reference, physical projection, and credibility-aware fusion, and achieves lower voltage magnitude error, lower phase angle error, and fewer iterations than the compared ablation variants. In this controlled comparison, the complete method obtains a voltage magnitude error of 0.001986 p.u. and a phase angle error of 0.187394°, while reducing the number of state estimation convergence iterations to four. These results indicate that DDPM-based measurement completion, digital twin guidance, and credibility-aware fusion provide complementary contributions to improving state estimation accuracy and numerical convergence. Since the ablation results are obtained from one independent run, they are used to compare the relative effects of different modules under the same experimental configuration, rather than to claim statistically general superiority across multiple random seeds.
To further verify the role of physical projection and digital twin guidance in improving the physical feasibility of generated pseudo-measurements, additional feasibility-related indicators are evaluated, as shown in
Table 8.
The complete method not only reduces voltage amplitude and phase angle errors, but also reduces the proportion of infeasible pseudo-measurements, node power imbalance errors, and the number of voltage out-of-limit events. Therefore, in addition to improving numerical accuracy, the method presented in this paper also enhances the physical feasibility of the generated measurements and the operational interpretability of the state estimation results. In particular, for the complete method, physical projection reduces the infeasible pseudo-measurement ratio from 4.6% before projection to 0.5% after projection. Compared with the complete method without physical projection, the final method also achieves fewer voltage limit violations and lower nodal power-balance error. These physical feasibility results are also obtained under the same fixed random seed and controlled simulation configuration, and further multi-seed tests are needed to quantify the statistical variability of these indicators.
6. Discussion
The results of this study should be interpreted in the context of previous research on power system state estimation, data-driven measurement completion, and digital twin-based cyber–physical modeling. Traditional state estimation methods, such as weighted least squares and dynamic filtering approaches, rely heavily on measurement quality and predefined physical models, while recent deep learning-based methods improve nonlinear mapping capability but may still suffer from weak physical interpretability and poor robustness under missing-data or topology-changing conditions. Based on the hypothesis that digital twin information can provide useful physical priors for generative measurement completion, this paper integrates real-time topology, reference measurements, and physical constraints into a self-supervised DDPM framework. The simulation results support this hypothesis by showing that the proposed method can improve pseudo-measurement completion quality and enhance state estimation reliability under multi-source heterogeneous measurement conditions.
It should also be emphasized that the current validation is based on IEEE standard test systems and simulated multi-source measurement configurations. Therefore, the results demonstrate the effectiveness of the proposed digital twin reference mechanism under controlled simulation settings. They should not be interpreted as a full verification of a real-time operational digital twin system deployed in an actual distribution network. In practical engineering applications, additional issues such as communication latency, sensor synchronization errors, topology identification errors, model-parameter uncertainty, and online model updating should be further considered.
The results of this paper can be understood at two levels: pseudo-measurement generation and state estimation. At the pseudo-measurement generation level, DDPM mainly evaluates its ability to complete missing measurements, using MAE, NRMSE, MaxAE, and distribution consistency indicators. At the state estimation level, the effects of generated pseudo-measurements, digital twin references, and credibility fusion on the final voltage magnitude and phase angle estimation results are further examined. The ablation experiments show that DDPM helps improve the quality of missing-measurement completion, the digital twin helps enhance the physical consistency of generated results, and credibility fusion helps reduce the impact of low-quality data on state estimation.
The observability improvement discussed in this paper mainly means that, under the 20% random measurement masking condition, the pseudo-measurements generated by DDPM can supplement missing-measurement information and jointly form a fused measurement vector with actual measurements, thereby improving the effective measurement input and numerical stability of state estimation. It should be noted that generated pseudo-measurements are not equivalent to adding real physical sensors and cannot replace a strict topological observability analysis.
The significance of this finding is that digital twins are not only used as simulation tools, but they can also serve as active physical guidance for data-driven state estimation. Nevertheless, the current validation is mainly based on 1000 samples generated from simulations of the IEEE 14-bus standard test system; therefore, further studies using larger-scale systems, practical distribution-network operating data, more complex bad-data scenarios, and accelerated diffusion sampling strategies are needed to evaluate the generalization capability and real-time applicability of the proposed method.
From the perspective of the framework structure, the proposed digital twin-guided DDPM state estimation method has modular scalability. The digital twin layer, DDPM-based missing-measurement completion module, credibility fusion module, and state estimation solver can all be independently extended according to system scale. For larger transmission or distribution systems, regional decomposition can be used to divide the entire network into multiple local areas. Digital twin reference generation, missing-measurement completion, and local state estimation can then be performed within each area, followed by coordination among areas through boundary-node information. Meanwhile, sparse Jacobian matrices, parallel computing, and accelerated diffusion sampling can be used to reduce the computational burden in large-scale systems.
It should be noted that the current simulation analysis is mainly based on standard test systems under fixed topology, and dedicated topology-switching experiments such as branch outages and network reconfiguration have not yet been conducted. Therefore, the discussion of digital twin feedback and DDPM adjustment mechanisms under topology changes in this paper mainly reflects the methodological framework design rather than fully validated experimental conclusions. Future work will further consider topology-switching events and systematically evaluate the adaptability of the proposed method under dynamic network structures.
In addition, the communication delays, missing-data ratios, and multi-source measurement configurations used in this paper are simulated settings rather than field measurements from an actual distribution network. Therefore, the obtained results should be interpreted as evidence under controlled IEEE test-system scenarios, rather than as a full engineering validation of a real-time operational digital twin system under field deployment conditions. Accordingly, the digital twin-related functions discussed in this paper should be interpreted as simulation-based reference generation, virtual–real consistency evaluation, and feedback-based adjustment mechanisms, rather than as validated field-deployed real-time digital twin operations. Moreover, the present numerical comparisons are based on one independent run with a fixed random seed. Although this setting ensures controlled comparisons among different schemes, it does not fully quantify the statistical variability caused by neural network training, Gaussian noise, random masking, and DDPM sampling.
7. Conclusions
This paper presented a model-based digital twin reference-guided state estimation method for power systems with multi-source heterogeneous measurements under simulation settings. The method combines physical sensing, digital twin mapping, DDPM-based missing-measurement completion, and credibility-aware data fusion within a unified estimation procedure. In the proposed process, the self-supervised DDPM uses available measurements, twin reference values, and physical constraints to recover missing data. The selection of DDPM is mainly motivated by its compatibility with conditional observations, digital twin reference measurements, and physical constraints, rather than by an assumption that it achieves the lowest numerical error among all generative models or completely avoids mode collapse. The measured and generated data are then fused with adaptive weights determined by data quality and cyber–physical consistency. Under the current IEEE test-system simulation and multi-source heterogeneous measurement configurations, the results indicate that the proposed model-based digital twin reference-guided method can improve missing-measurement recovery quality, state estimation accuracy, credibility-weighted fusion performance, and physical consistency. However, since the current numerical comparisons are based on one independent run, further validation under multiple random seeds and more diverse operating scenarios is still required.
It should be noted that the present validation is mainly based on a standard test system, simulation data, and fixed network topology. Dedicated topology-switching experiments involving branch outages and network reconfiguration, as well as scenarios with high missing-data ratios and complex abnormal data, have not yet been sufficiently evaluated. In addition, the real-time computational efficiency of the proposed method in larger transmission or distribution systems has not been systematically verified. Therefore, future work will further investigate the adaptability and scalability of the proposed method under complex dynamic conditions using larger-scale test systems and actual distribution-network operating data, and will explore regional decomposition, parallel computing, sparse matrix techniques, and accelerated diffusion sampling to improve its engineering applicability.