


Abstract
Post-disaster recovery is a multi-year, multi-dimensional process, yet most remote-sensing assessments rely on single indicators and are hard to apply in data-sparse regions—limiting their value for sustainable, evidence-based reconstruction. We develop a Google Earth Engine (GEE)-based multi-sensor Recovery-Activity Index (RAI), built entirely from free satellite data, and apply it to the 2023 Al Haouz earthquake (Mw 6.8) in the High Atlas, Morocco. The index is framed explicitly as an observed recovery-activity monitoring proxy, not a direct measure of welfare or resilience capacity. Monthly VIIRS nighttime-light (NTL) anomalies, Dynamic World built-up probability, and precipitation-corrected Sentinel-2 NDVI were extracted for a 30 km rural core zone (January 2022–May 2026), deseasonalized, standardized, and integrated. NTL anomalies rose after the earthquake (post-event mean +18%) and appeared to precede built-up anomalies by about two months; because monthly series are short and autocorrelated, we tested this lead with block-bootstrap and block-permutation methods and report it as a reproducible but modest early-activity lead (r = 0.65, p = 0.02; p = 0.14 after correction) that is not an artefact of optical data gaps. NDVI was governed mainly by precipitation (R2 = 0.61) with negligible earthquake-attributable change, so vegetation signals do not confound the index. The integrated RAI peaked in December 2024 and proved robust to indicator weighting (pairwise r ≥ 0.97), baseline choice (r = 0.88), and spatial domain (<9% variation), with a genuinely multi-sensor peak (NTL 62%, built-up 43%). Province-level analysis revealed an uneven recovery hierarchy (Chichaoua > Al Haouz > Taroudannt) driven by differences in physical-rebuilding signal rather than baseline luminosity. Running in minutes server-side at no cost, the RAI offers data- and resource-limited administrations a scalable, reproducible tool to flag where reconstruction activity lags and to prioritize targeted ground verification—supporting more equitable, sustainability-oriented recovery governance—rather than serving as a stand-alone, validated recovery measure.
1. Introduction
Disaster resilience is increasingly treated as a dynamic capacity spanning physical, economic, social, environmental, and institutional systems rather than a simple “bounce back” to pre-disaster conditions [1,2]. Across reviews and frameworks, resilience is framed as the ability to prepare, absorb, recover, and adapt over time, often emphasizing “bouncing forward” rather than merely returning to a prior state [1,2], with dimensions commonly including social, economic, infrastructure/physical, environmental, governance, and community competence [3,4,5,6,7]. A substantial body of work translates these concepts into indicator-based tools for recovery planning—from municipal composite disaster-resilience indices [3,6,7] to social-resilience frameworks [5] and national recovery-capacity instruments [4]—yet these frameworks differ markedly in scope, methods, and treatment of recovery speed and trajectory. Many of these tools rely on multi-criteria weighting schemes, most commonly the analytic hierarchy process (AHP) and related pairwise-comparison methods, to combine heterogeneous indicators into a single recovery- or vulnerability-potential score [3,4,6]. The AHP has been applied specifically to seismic recovery- and reconstruction-potential assessment, where expert pairwise judgments weight factors such as damage, accessibility, and socioeconomic capacity [8]. While the AHP offers a transparent, expert-driven means of assigning indicator importance, it is sensitive to subjective judgment and is typically applied to static, census-based inputs rather than to continuously observed post-event trajectories, motivating data-driven alternatives whose results can be tested for robustness to the chosen weights.
A persistent limitation is that most indicator frameworks remain static and cross-sectional, with limited dynamic modeling of recovery itself [2,9]. Where dynamics are addressed, they tend to focus on infrastructure restoration trajectories [10] or behavioral data such as large-scale mobility, which has revealed strong socioeconomic and racial disparities in time to recovery [11]. Systematic reviews further note that only a small share of indices undergo empirical validation, that adaptive, absorptive, and transformative capacities are used inconsistently, and that recovery metrics are applied unevenly as external validation indicators [9,11]. These gaps suggest that future indicators should explicitly couple pre-event capacities with observed post-event recovery paths.
Satellite remote sensing combined with cloud computing now allows consistent monitoring of post-disaster change across large, hard-to-access regions. Google Earth Engine (GEE) is central to this shift because it hosts long archives of optical and radar data and provides the server-side processing power needed for dense time-series analyses [12,13,14]. GEE enables cloud- and shadow-free composites, time-series reconstruction, and change detection at regional to global scales without local downloading [12,13,15,16]. Demonstrated applications include random forest land-cover recovery mapping after Typhoon Haiyan, which achieved over 88% accuracy across 62 municipalities and showed most areas returning to pre-disaster land cover within three years [12], forest spectral-recovery trajectory mapping over tens of thousands of harvest areas [13], and NDVI-based tracking of vegetation recovery after hydrological and other disturbances [16,17].
However, existing GEE-based recovery studies focus mainly on land cover or spectral indices as proxies for physical or ecological recovery [12,13,14,16,17], and even robust workflows acknowledge that more functional and socioeconomic information is needed to capture the full complexity of recovery [12,13,14,15]. Land-cover and land-use change (LCLUC) is a well-established recovery proxy: stacking multi-temporal classifications can yield pixel-level recovery maps in which both physical and functional recovery are largely explained by LCLUC transitions [18], and earthquake case studies show cropland, forest, built-up, and bare-land types changing markedly during recovery [19,20,21]. Indices such as urban index, NDVI, and MNDWI have tracked built-up reconstruction over a decade or more [22,23,24,25], and agent-based models treat machine-learning-derived land-use maps as empirical evidence of recovery [26].
Yet vegetation-only metrics are problematic in arid and semi-arid mountains, where NDVI responds strongly to precipitation variability with time-lagged, spatially complex relationships [27,28,29]. Index performance in detecting disturbance and recovery varies with precipitation regime along climate gradients [20,30], implying that vegetation-based indicators alone may conflate post-disaster recovery with hydroclimatic fluctuations and must be interpreted jointly with built-up change and other human-activity proxies [22,23,24,31]. Nighttime-light (NTL) data from the VIIRS sensor provide one such complementary proxy, offering a globally consistent measure of human activity: VIIRS NTL reductions correlate with building damage, and time-series composites can model post-earthquake economic recovery [32,33]. NTL nonetheless requires careful masking and deseasonalization and should be treated as a relative activity-intensity indicator rather than a direct measure of physical damage or welfare, particularly given its coarse resolution, its sensitivity to emergency lighting and temporary settlement, and the tendency of harmonized coarse-sensor series to overstate disaster impacts [32,33].
These motivations define a clear and still-unfilled gap. The problem is concrete: existing recovery monitoring often relies on single proxies; vegetation proxies are climate-sensitive in semi-arid mountains; NTL captures activity but not physical rebuilding; and built-up products capture physical change but may lag and require validation. A multi-sensor anomaly framework could therefore improve the temporal interpretation of recovery. Although multi-sensor recovery assessments exist [6,18,26], and although GEE-based monitoring is mature for single-indicator tracking [12,13,14,15,16,17], three contributions remain absent and constitute the core of this work. First, we integrate activity (NTL), physical-rebuilding (built-up), and environmental (precipitation-corrected NDVI) signals into a single, fully reproducible GEE index and explicitly quantify the temporal lead–lag structure between activity and rebuilding—a relationship that single-indicator studies cannot resolve. Second, we couple this index with a climatic-noise separation step (explicit precipitation correction of NDVI) so that drought is not mistaken for recovery, and we test the spatial generality of this separation province by province. Third, we subject every key claim to robustness and alternative-explanation testing—weight sensitivity, baseline sensitivity, spatial-domain sensitivity, optical-coverage diagnostics, classification-noise diagnostics, RAI decomposition, and an independent SAR cross-check—rather than relying on internal consistency alone. We frame the resulting index as an observed recovery-activity monitoring proxy, not a direct measure of resilience capacity or welfare.
The 2023 Al Haouz earthquake offers an instructive case. On 8 September 2023, an Mw 6.8 earthquake struck the High Atlas Mountains with its epicenter near Ighil, roughly 70–75 km southwest of Marrakech, in a setting where large earthquakes are rare and preparedness was low [34,35,36,37]. Damage—close to 2900–3000 fatalities and on the order of 50,000 collapsed residential buildings—was heavily concentrated in remote rural mountain villages, while modern structures in Marrakech were largely unaffected [34,35,37]. This severe, spatially heterogeneous damage in data-sparse mountainous terrain makes Al Haouz an instructive case for multi-sensor, remote-sensing-based recovery assessment [36,37].
Accordingly, this study develops a GEE-based multi-sensor RAI integrating VIIRS NTL, Dynamic World built-up probability, and precipitation-corrected NDVI and applies it to the Al Haouz recovery. We address three questions: (i) Can multi-sensor anomalies, deseasonalized against a pre-earthquake baseline, capture a coherent recovery-activity signal in a data-sparse rural setting? (ii) What is the temporal relationship between activity (NTL) and physical-rebuilding (built-up) signals, and is it robust to alternative explanations and to autocorrelation-adjusted significance testing? (iii) How does recovery vary across the affected provinces, and what drives this variation?
2. Materials and Methods
2.1. Study Area
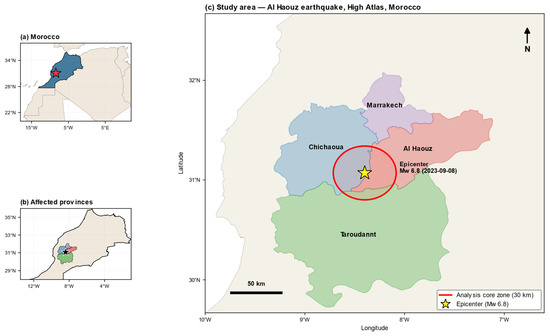
The study focuses on the rural High Atlas region affected by the 2023 Al Haouz earthquake (Mw 6.8; epicenter approximately 31.07° N, 8.40° W) [34,35]. The earthquake occurred within the Moroccan High Atlas intraplate belt through oblique-reverse faulting on a lower-crustal fault, with slip concentrated at depths of about 15–35 km and no clear surface rupture [34,36]. Geologically, the High Atlas is an intracontinental fold-and-thrust belt formed by Cenozoic inversion of Mesozoic rift basins, in which Jurassic carbonates and clastic sequences are deformed by an array of generally ENE–WSW-trending reverse and oblique-reverse faults. These deep, predominantly blind thrust and oblique-reverse faults constitute the principal structural discontinuities of the rock mass in the epicentral region; the absence of a clear coseismic surface rupture indicates that slip on these structures was accommodated at depth rather than expressed as a through-going surface break [34,36]. This structural setting—steep, faulted, and lithologically heterogeneous terrain—combines with the local construction stock to condition damage severity. Reported shaking reached Modified Mercalli Intensity 9 near the epicenter and 7 in Marrakech [34]. Field studies attribute the heavy losses to unreinforced masonry and earthen construction, poor material quality, absence of seismic design, and difficult topography [35,36].
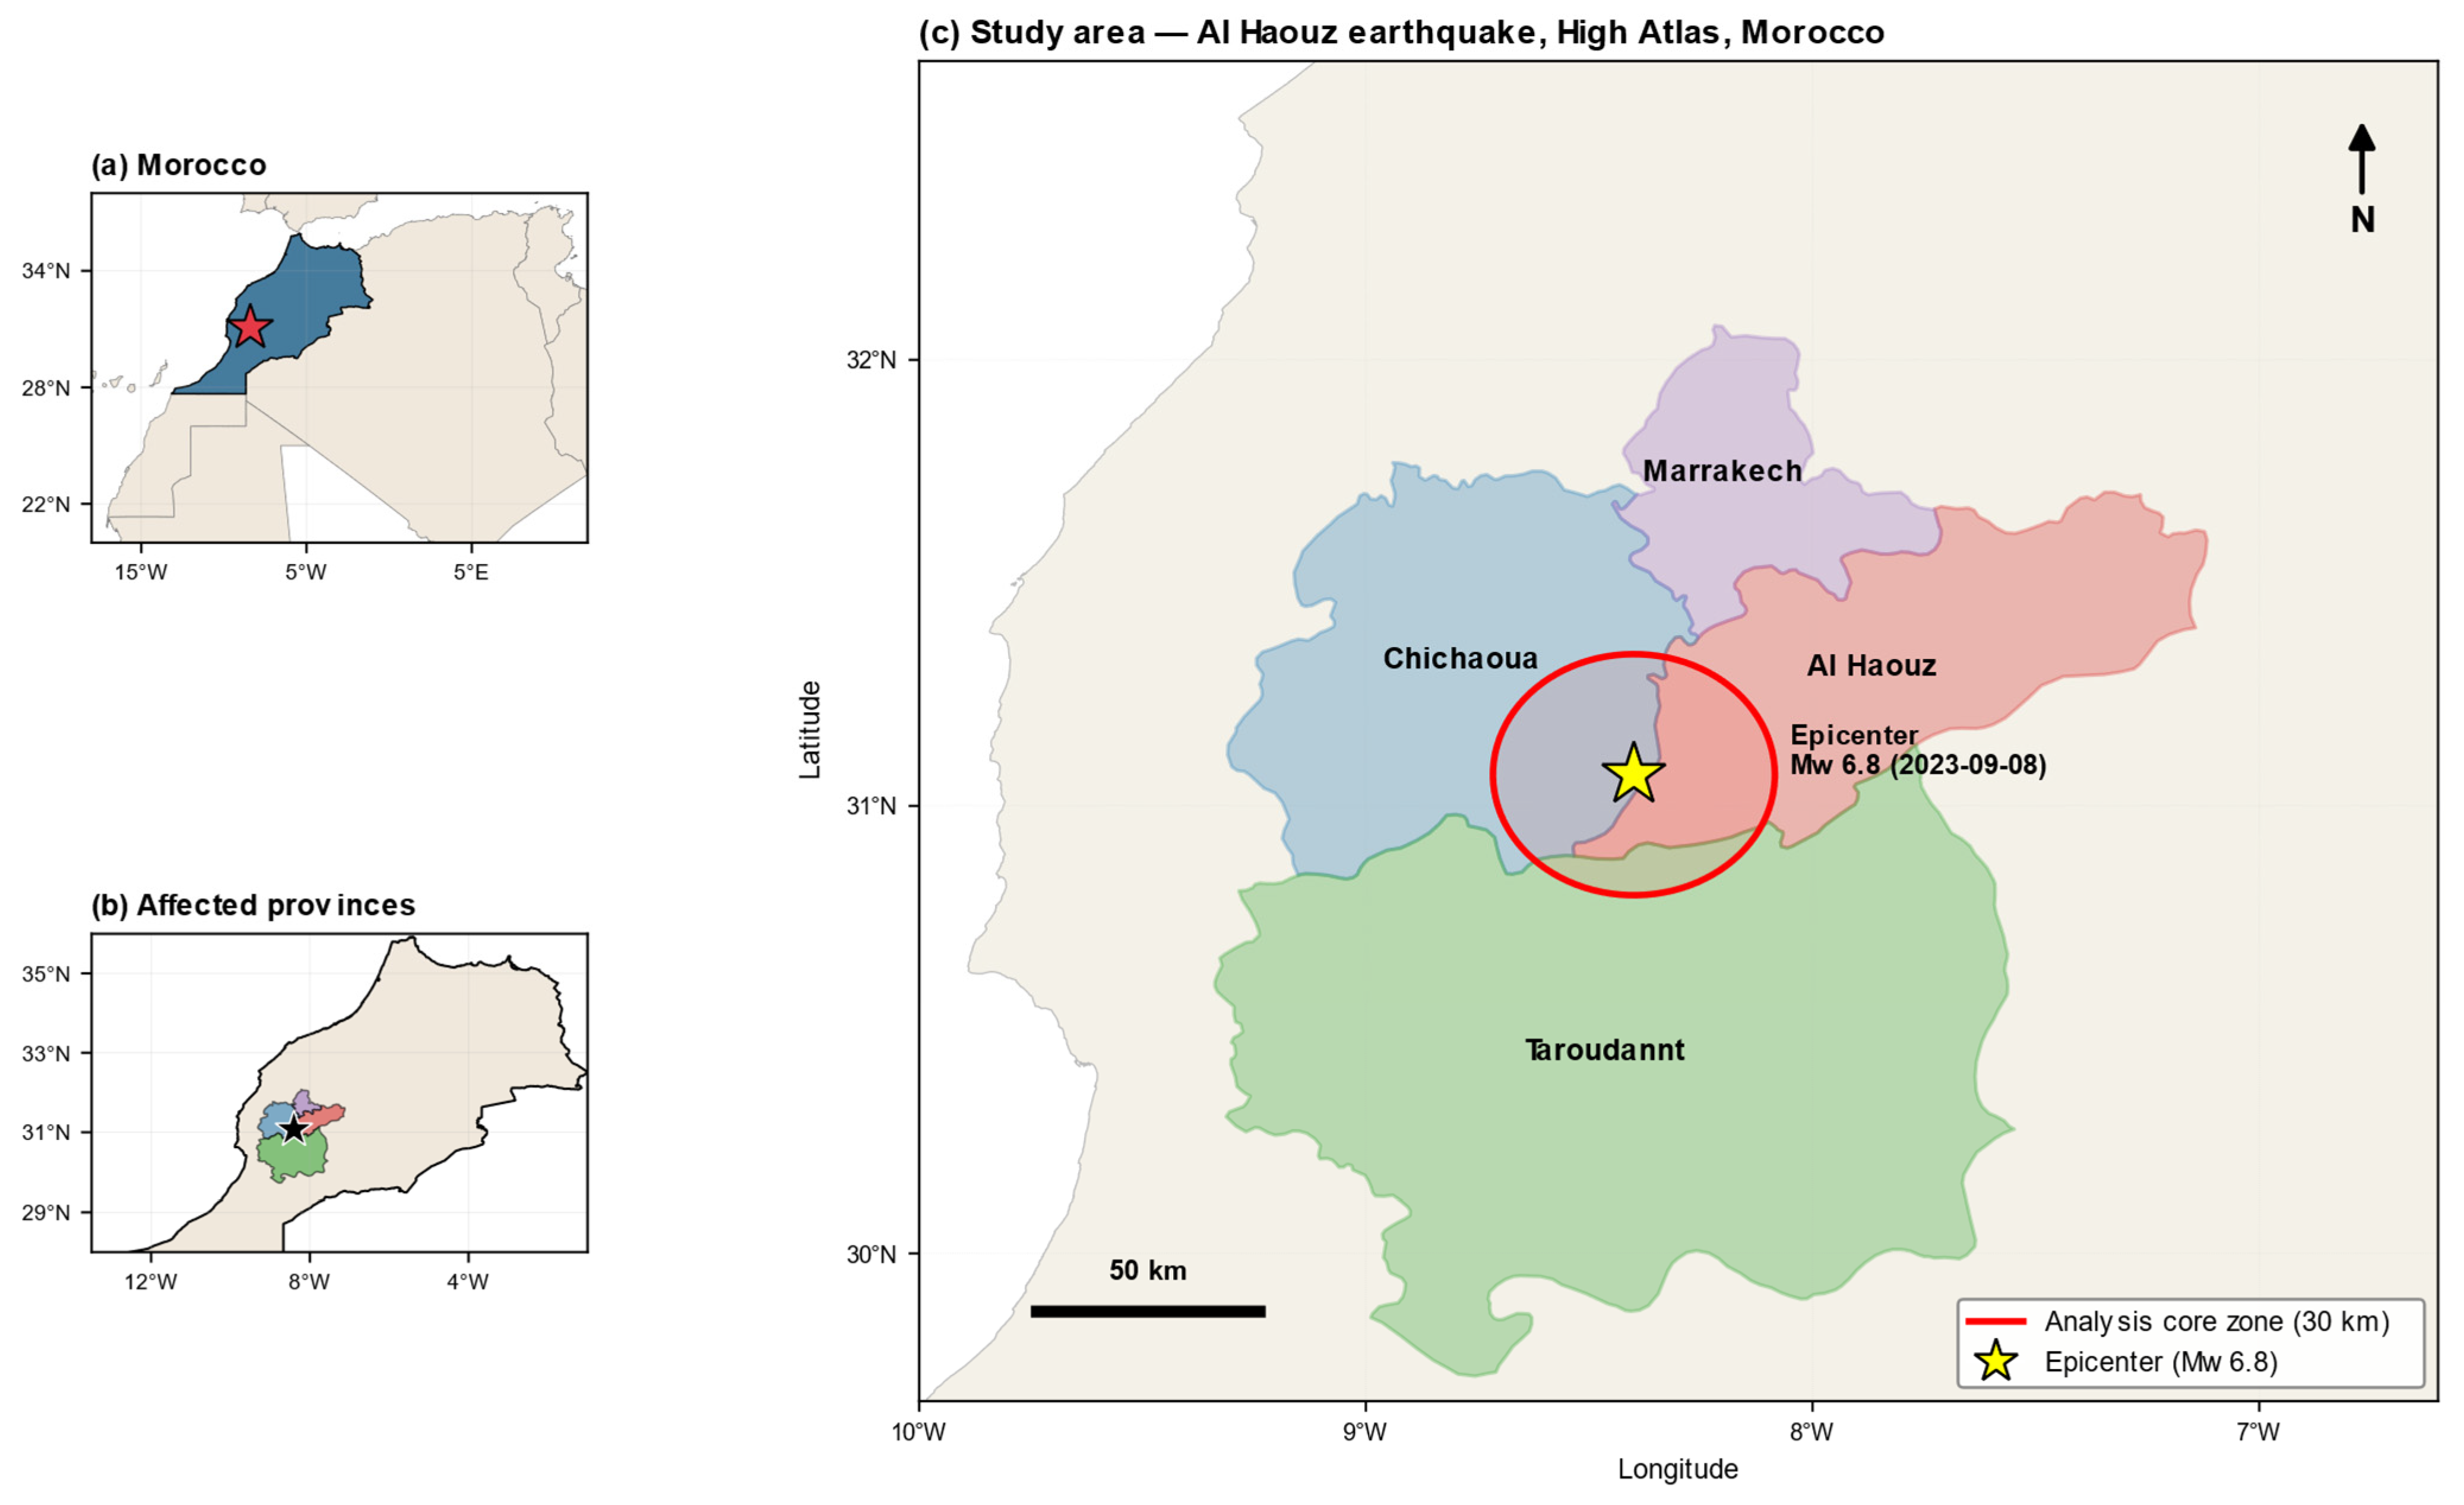
Administratively, the disaster affected five provinces; here we analyze the three provinces—Al Haouz, Chichaoua, and Taroudannt—that fall substantially within a 30 km core zone around the epicenter. Marrakech Province lies almost entirely outside this core zone and is retained only for cartographic context. The 30 km rural core zone was adopted to concentrate on the heavily damaged mountain settlements while excluding the largely unaffected urban fabric of Marrakech; an urban mask (GHSL built-up surface < 3000 m2 per cell) further restricted the analysis to rural pixels. The 30 km radius approximates the zone of strongest reported shaking and damage concentration around the epicenter [34,37], and the sensitivity of results to both the buffer radius and the mask threshold is tested in Section 3.8 and Appendix A (Table A10) (see Figure 1).
Figure 1.
Study area of the 2023 Al Haouz earthquake (Mw 6.8, 8 September 2023), High Atlas, Morocco. (a) Location of Morocco within North Africa, with the epicenter marked by a star. (b) The four administratively affected provinces (Al Haouz, Chichaoua, Marrakech, Taroudannt) and the epicenter. (c) Main map showing the four provinces, the epicenter, and the 30 km analysis core zone. Marrakech Province lies almost entirely outside the core zone and was excluded from the province-level analysis. Province boundaries are from the FAO GAUL 2015 dataset.
2.2. Data
All datasets were accessed and processed within Google Earth Engine, leveraging its long-term archives and server-side computation to avoid local downloading [12,13]. The activity dimension was represented by monthly VIIRS Day/Night Band nighttime lights (NOAA/VIIRS/DNB/MONTHLY_V1/VCMSLCFG, avg_rad band) [32,33]. The physical-rebuilding dimension was represented by Dynamic World built-up probability (GOOGLE/DYNAMICWORLD/V1, built band) and the environmental dimension by Sentinel-2 NDVI (COPERNICUS/S2_SR_HARMONIZED, cloud filtering below 40%). Daily CHIRPS precipitation (UCSB-CHG/CHIRPS/DAILY) was aggregated to monthly totals. For the independent radar cross-check, Sentinel-1 GRD VV/VH backscatter (COPERNICUS/S1_GRD, IW mode, descending orbit) was used. Supporting layers included GHSL built-up surface (JRC/GHSL/P2023A/GHS_BUILT_S/2020) for the urban mask, WorldPop population (WorldPop/GP/100m/pop/MAR_2020) and accessibility to cities for province-level driver analysis, and FAO GAUL 2015 administrative boundaries for aggregation.
The analysis period spanned January 2022 to May 2026, providing roughly 20 months of pre-earthquake baseline and over 30 months of post-earthquake observation. We acknowledge that this pre-event window is short for a monthly climatology and that anomaly estimates therefore depend on a limited number of observations per calendar month; the consequences of this choice are addressed by a baseline-sensitivity analysis using a long-term (2014–2023) VIIRS climatology (Section 3.7, Appendix A Table A9, Figure A6). All indicators were aligned to a common monthly timeline; 52 monthly observations were available, and the RAI was computed only for months in which all required components were present (no interpolation was applied). Because the earthquake occurred early in the month (8 September 2023), September 2023 was treated as the first post-event month; we verified that reassigning it as transitional did not materially change the results.
2.3. Methodological Workflow
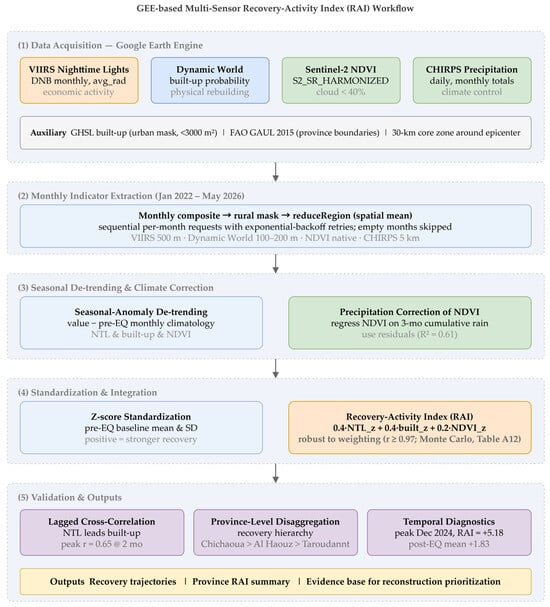
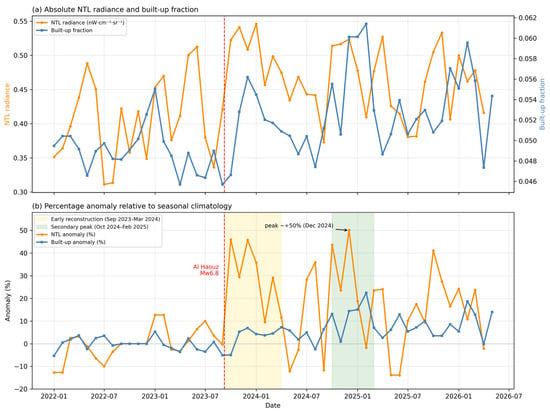
The RAI was constructed in four stages: (i) monthly extraction of each indicator over the rural core zone; (ii) seasonal-anomaly detrending against a pre-earthquake climatology; (iii) z-score standardization and weighted integration; and (iv) validation through lagged cross-correlation, precipitation regression, robustness testing, and province-level disaggregation (see Figure 2).
Figure 2.
Methodological workflow of the GEE-based Recovery-Activity Index (RAI), from multi-sensor data acquisition (VIIRS nighttime lights, Dynamic World built-up probability, Sentinel-2 NDVI, CHIRPS precipitation) through seasonal-anomaly detrending and z-score standardization to the integrated multi-sensor RAI.
For each calendar month, image collections were filtered to the core zone, composited to a monthly mean, masked to rural pixels, and reduced to a spatial mean using reduceRegion with bestEffort and appropriate tileScale settings. Requests were issued sequentially per month with exponential-backoff retries. VIIRS was reduced at 500 m, Dynamic World built-up at 100–200 m, NDVI at native resolution, and CHIRPS at 5 km, all in the dataset-native geographic coordinate reference system (EPSG:4326).
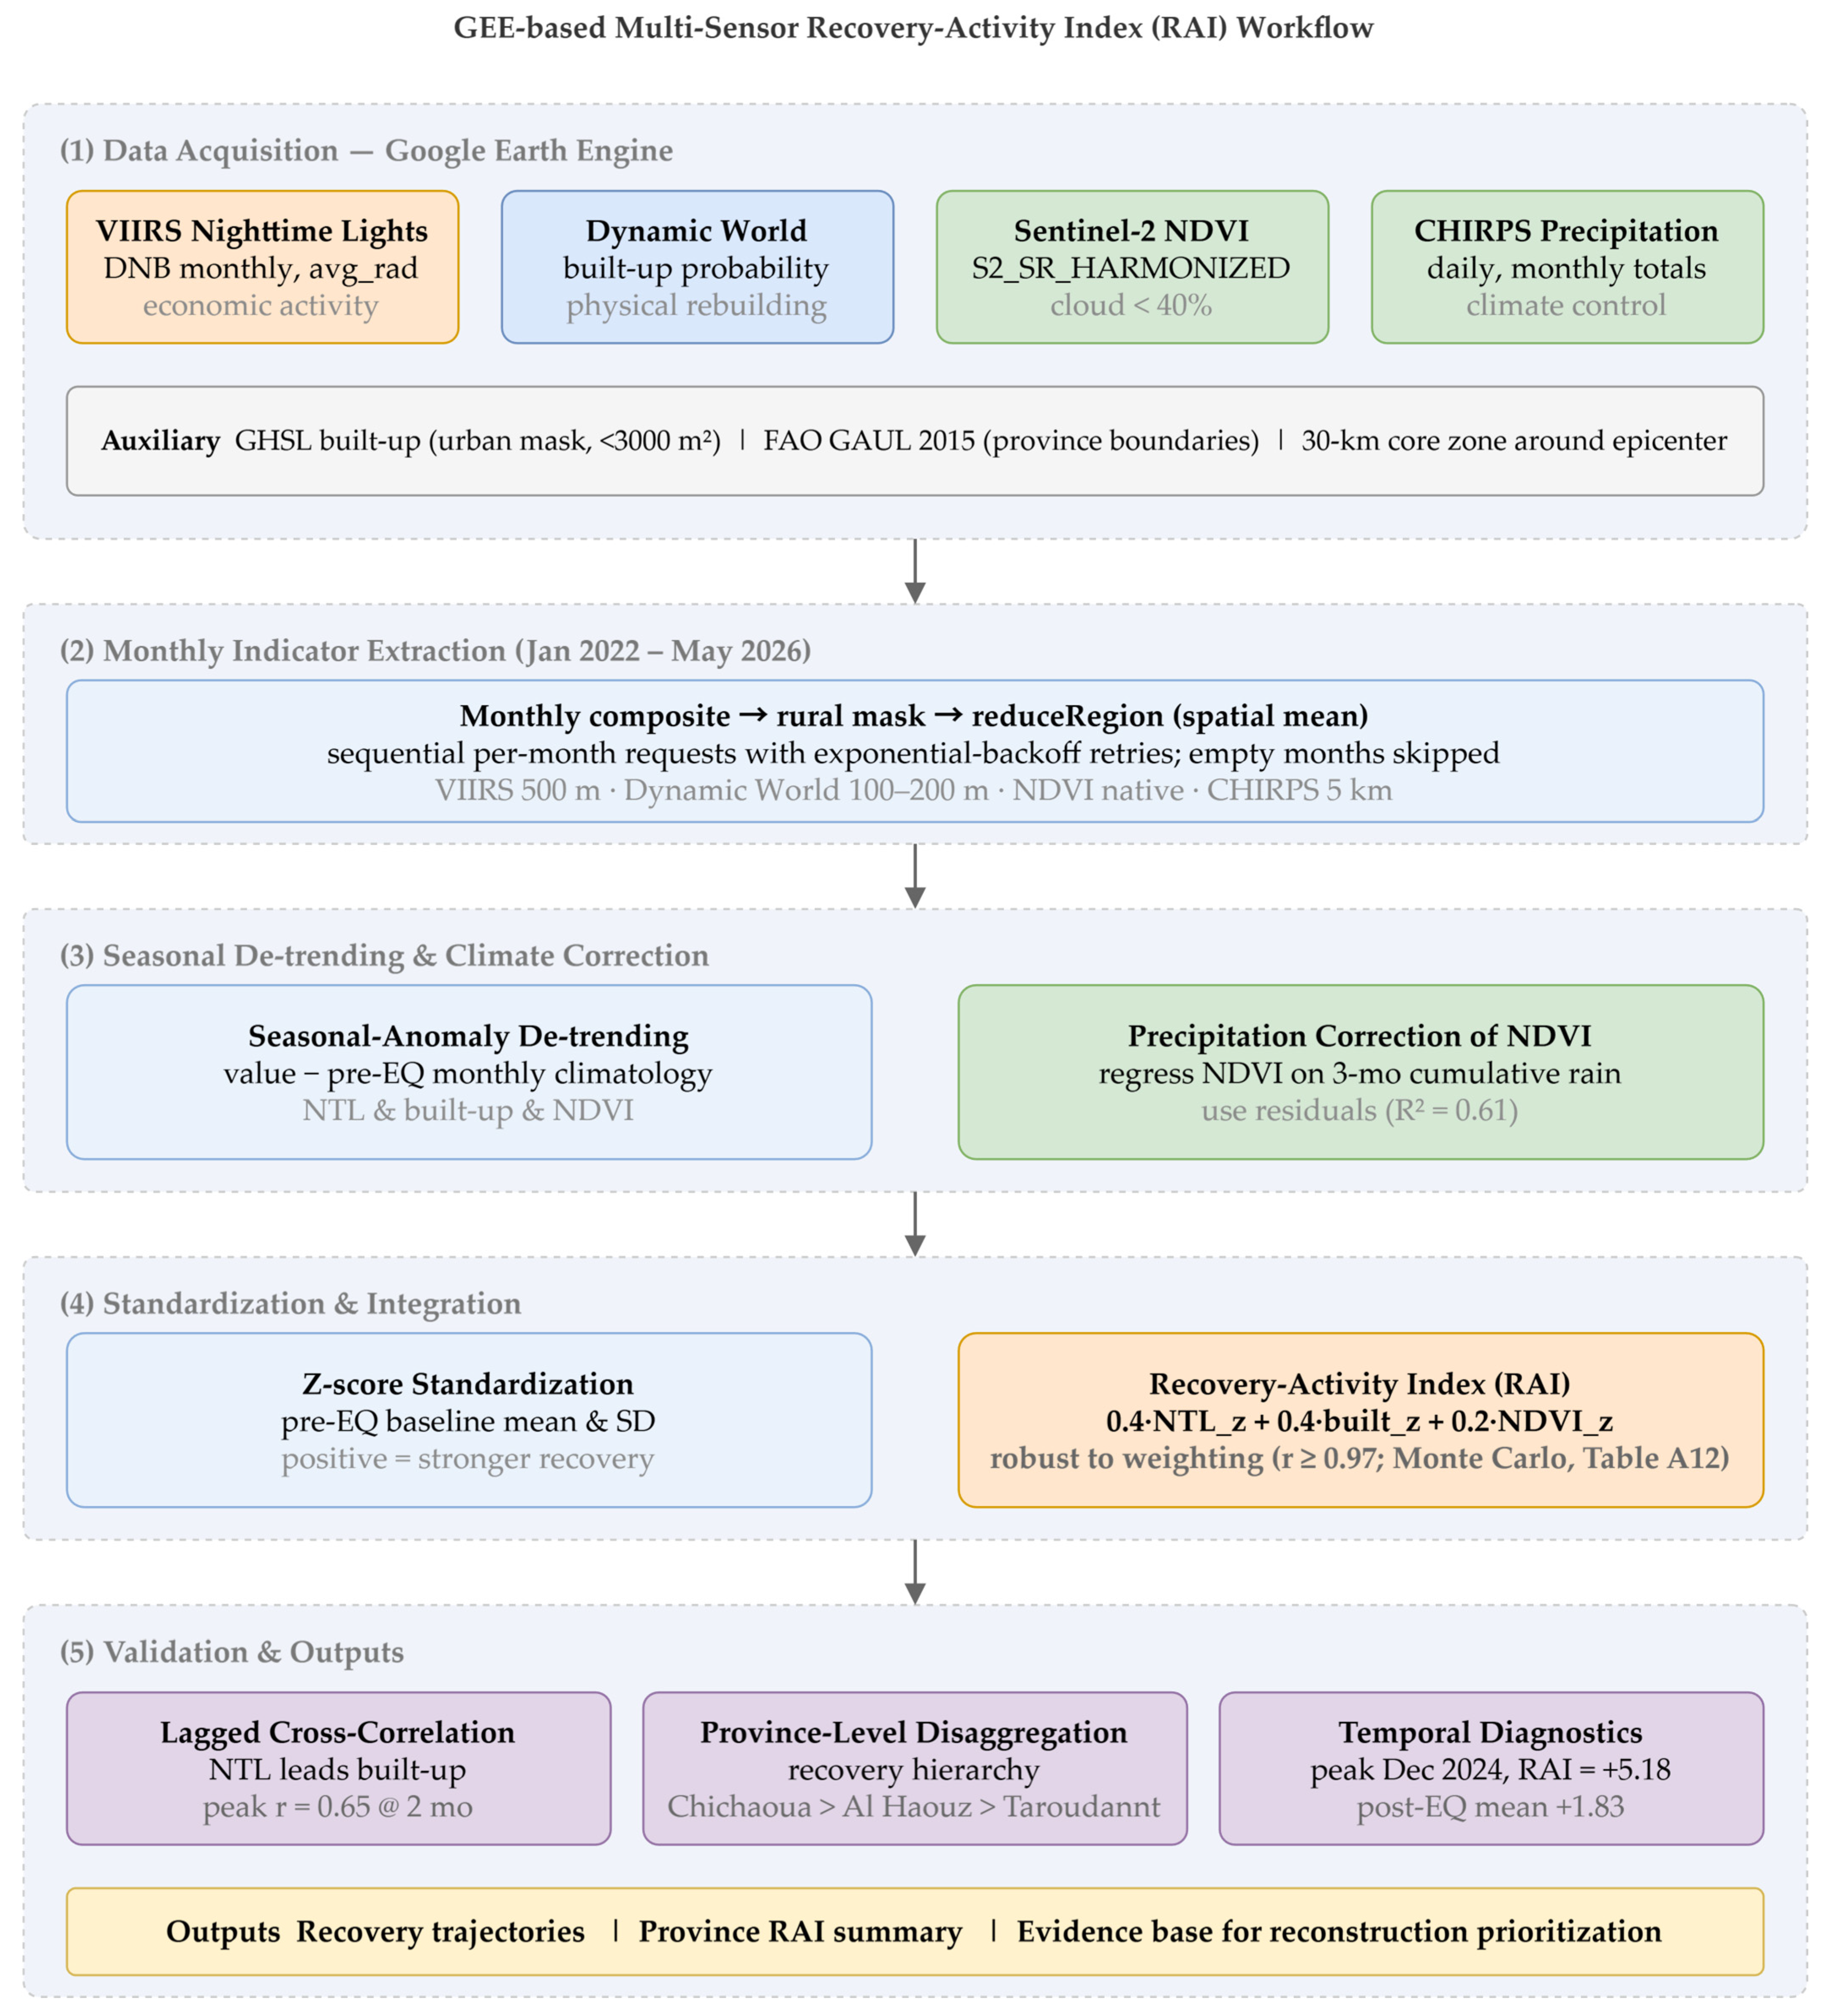
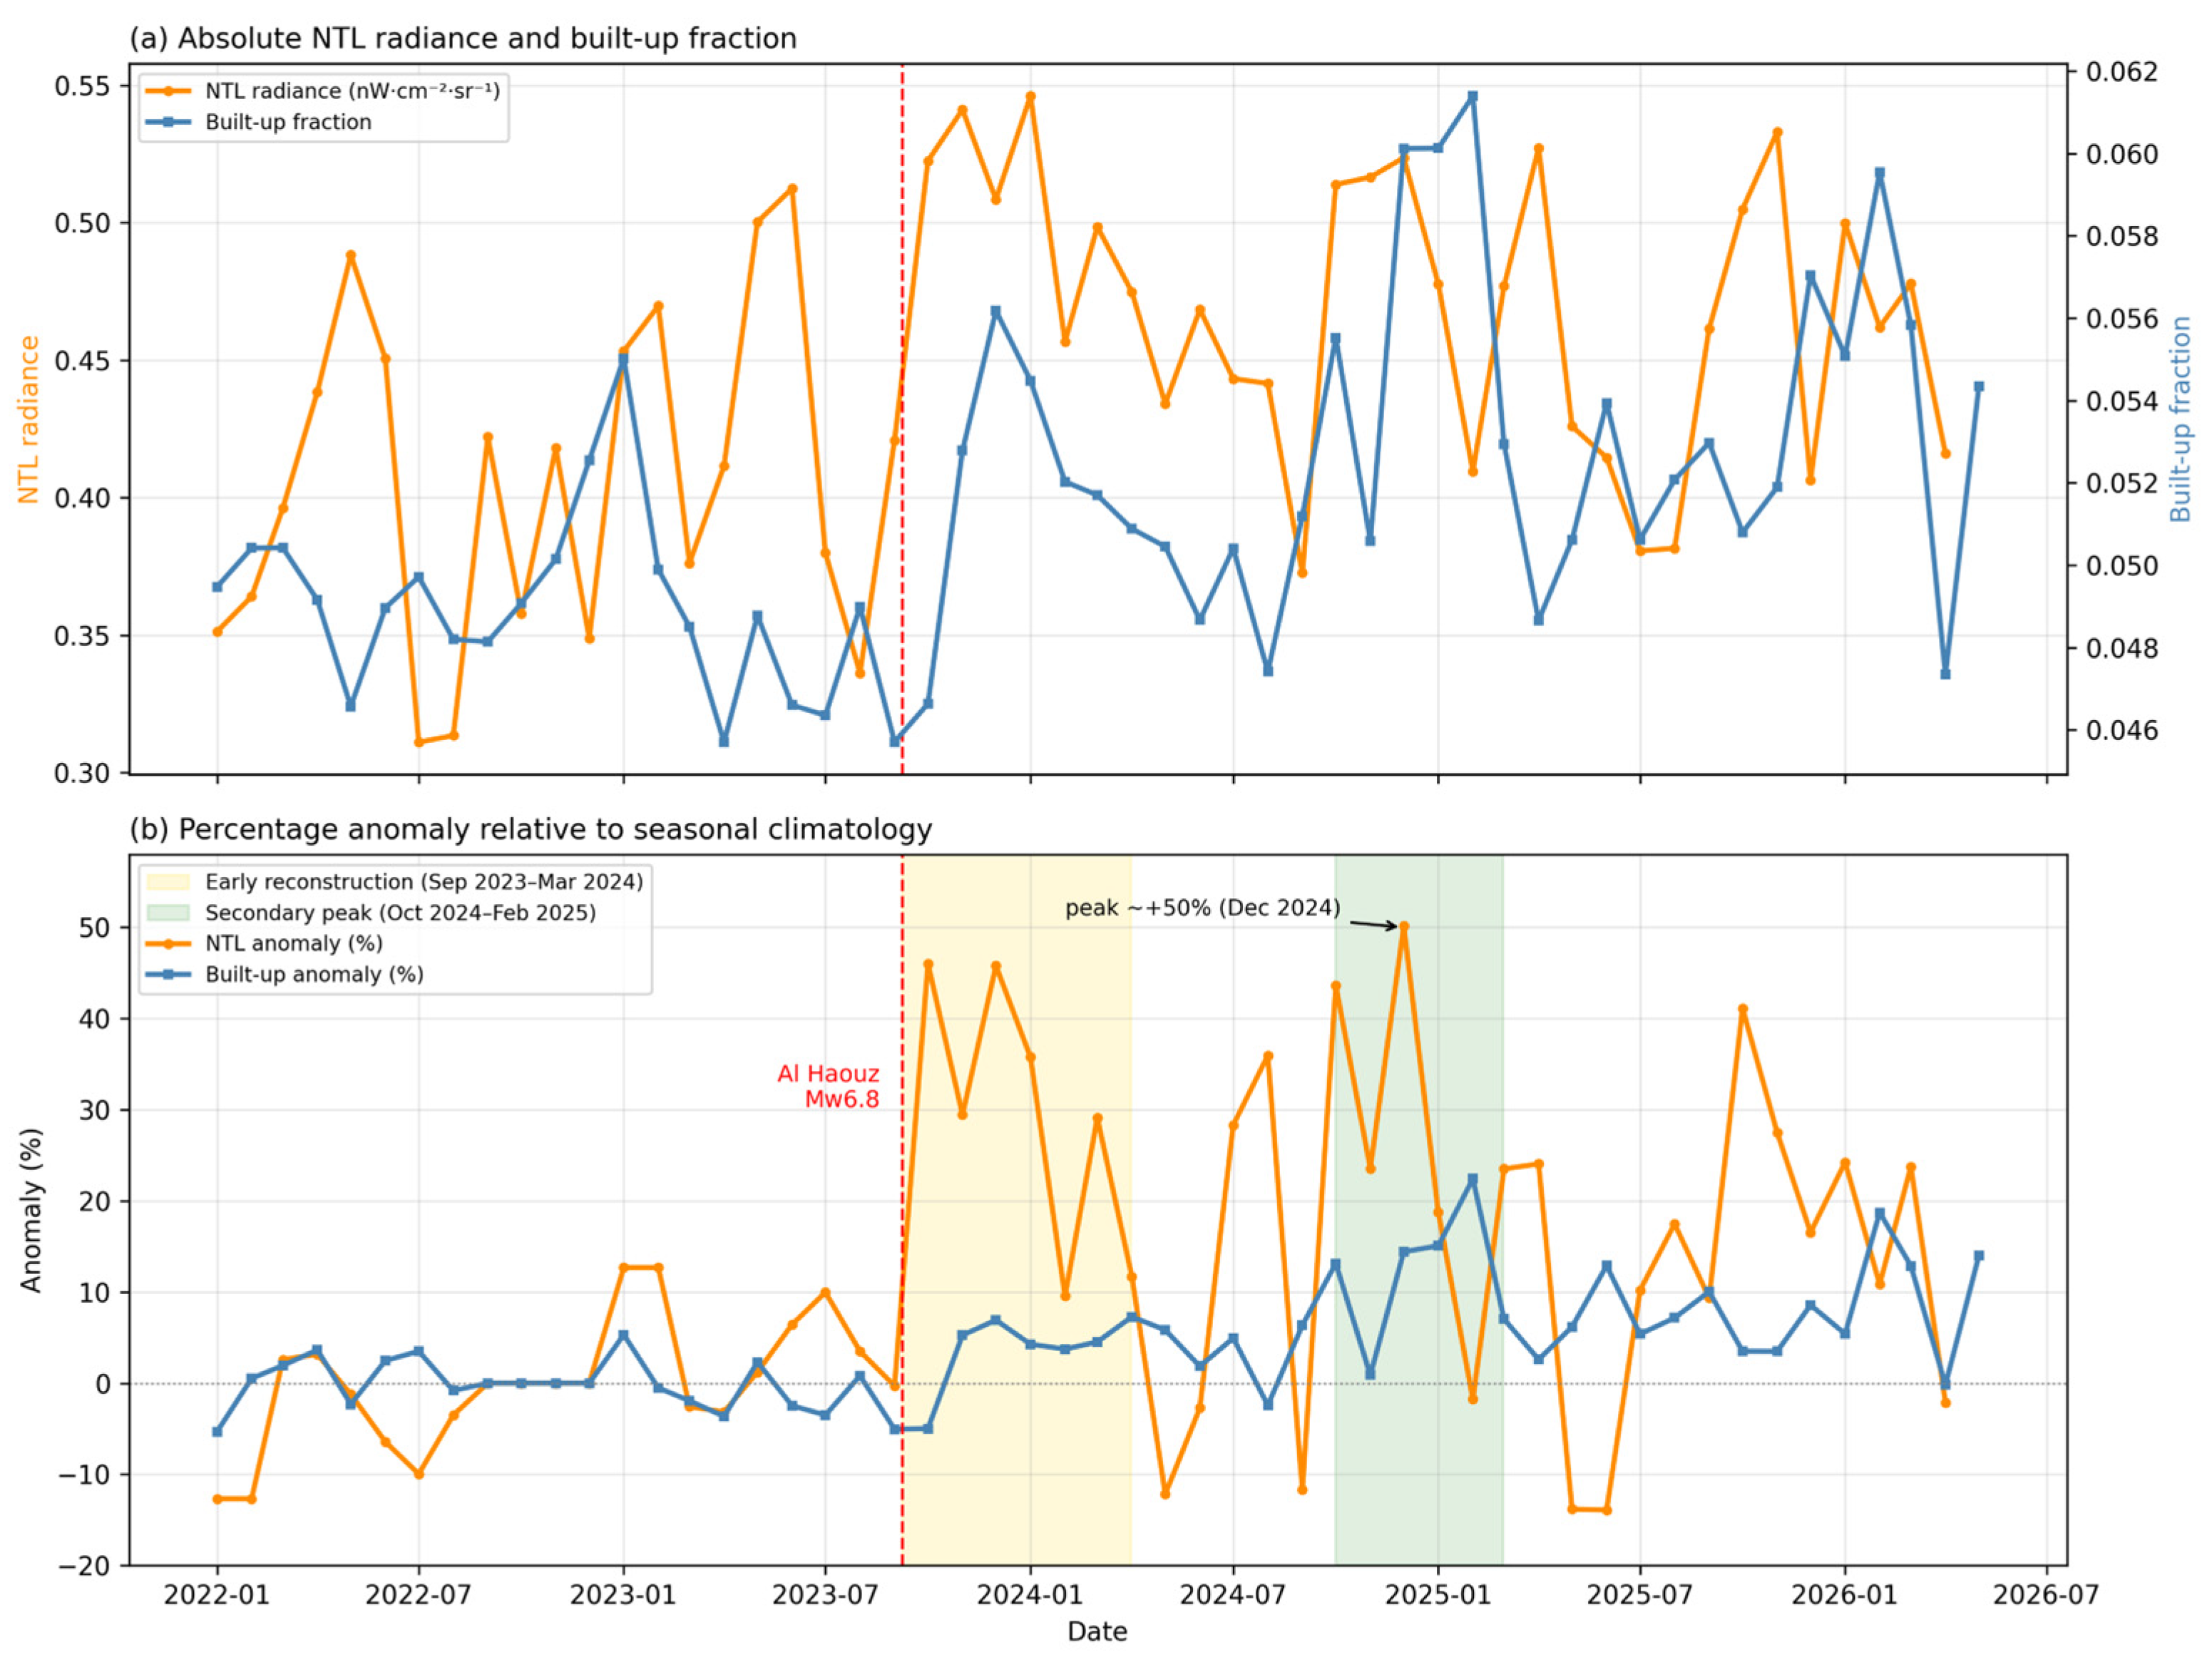
For VIIRS pre-processing, we used the stray-light-corrected monthly composite (VCMSLCFG), which already removes stray-light- and lunar-contaminated observations. Analysis was confined to rural pixels by the GHSL mask. Because the rural core zone is dimly lit, we retained low-radiance pixels rather than applying a low-radiance threshold, so as not to discard genuine dark-to-lit reconstruction transitions; negative or anomalous radiance values, which were rare after rural masking, were treated as missing rather than set to zero. Anomalies were computed relative to the monthly climatology to suppress residual seasonal and lunar effects. Because small absolute changes in a dim baseline can translate into large percentage anomalies, we report absolute radiance alongside percentage anomalies throughout (Figure 3) so that readers can judge the physical magnitude of a given anomaly.
Figure 3.
Post-disaster recovery signals in the 30 km rural core zone. (a) Absolute monthly nighttime-light radiance (orange) and Dynamic World built-up fraction (blue). (b) Percentage anomalies relative to the seasonal climatology, with the early reconstruction phase (September 2023–March 2024) and the secondary reconstruction peak (October 2024–February 2025) shaded; NTL anomalies peaked near +50% in December 2024. In both panels, the vertical red dashed line marks the earthquake (8 September 2023).
Because both NTL and NDVI exhibit strong seasonality in this semi-arid setting, each indicator was deseasonalized relative to its pre-earthquake monthly climatology; for month m, the anomaly is the observed value minus the corresponding climatological mean, expressed where appropriate as a percentage of climatology, following established NTL practice [32]. To test whether NDVI variation reflects recovery or hydroclimatic fluctuation, monthly NDVI was regressed on cumulative CHIRPS precipitation; the accumulation window is justified empirically in Section 3.3 and Appendix A (Table A2), and the regression residuals (precipitation-corrected NDVI) were compared between pre- and post-earthquake periods to isolate any earthquake-attributable vegetation signal [27,28,29]. Each anomaly series was standardized to a z-score and oriented so that positive values denote stronger recovery activity.
The three indicators were combined as RAI = 0.4·NTL_z + 0.4·built_z + 0.2·NDVI_z. Because each indicator is standardized against its pre-event distribution, the pre-event mean RAI is zero by construction; post-event values therefore express the magnitude of deviation from the pre-event baseline in standard-deviation units (Table 1). The weights are pragmatic and theory-informed rather than statistically estimated: NTL and built-up, as direct human-activity and physical-rebuilding signals, are weighted equally, while NDVI is down-weighted because we show it is precipitation-dominated. We retain NDVI at a low weight as an environmental-disturbance control—its near-zero earthquake residual provides positive evidence that the composite is not contaminated by drought-driven vegetation change—rather than as a recovery signal in its own right, and we verify (Section 3.6) that it contributes negligibly to the RAI peak. Robustness to the weighting, including NDVI weights of 0.1/0.2/0.3 and equal weighting, is examined in Section 3.5 and Appendix A (Table A1, Figure A2). For the province-level analysis, a two-axis RAI (NTL and built-up, equal weights) was used because indicator-specific NDVI residuals were not separately derived per province.
Table 1.
Province-level Recovery-Activity Index (RAI) summary for the three provinces within the 30 km core zone of the 2023 Al Haouz earthquake. For each province the table reports the core-zone area, the pre- and post-earthquake mean RAI, the peak RAI value and the month in which it occurred, and the number of monthly observations (n). The province-level RAI uses the two-axis (NTL + built-up, equal-weight) formulation described in Section 2.3.
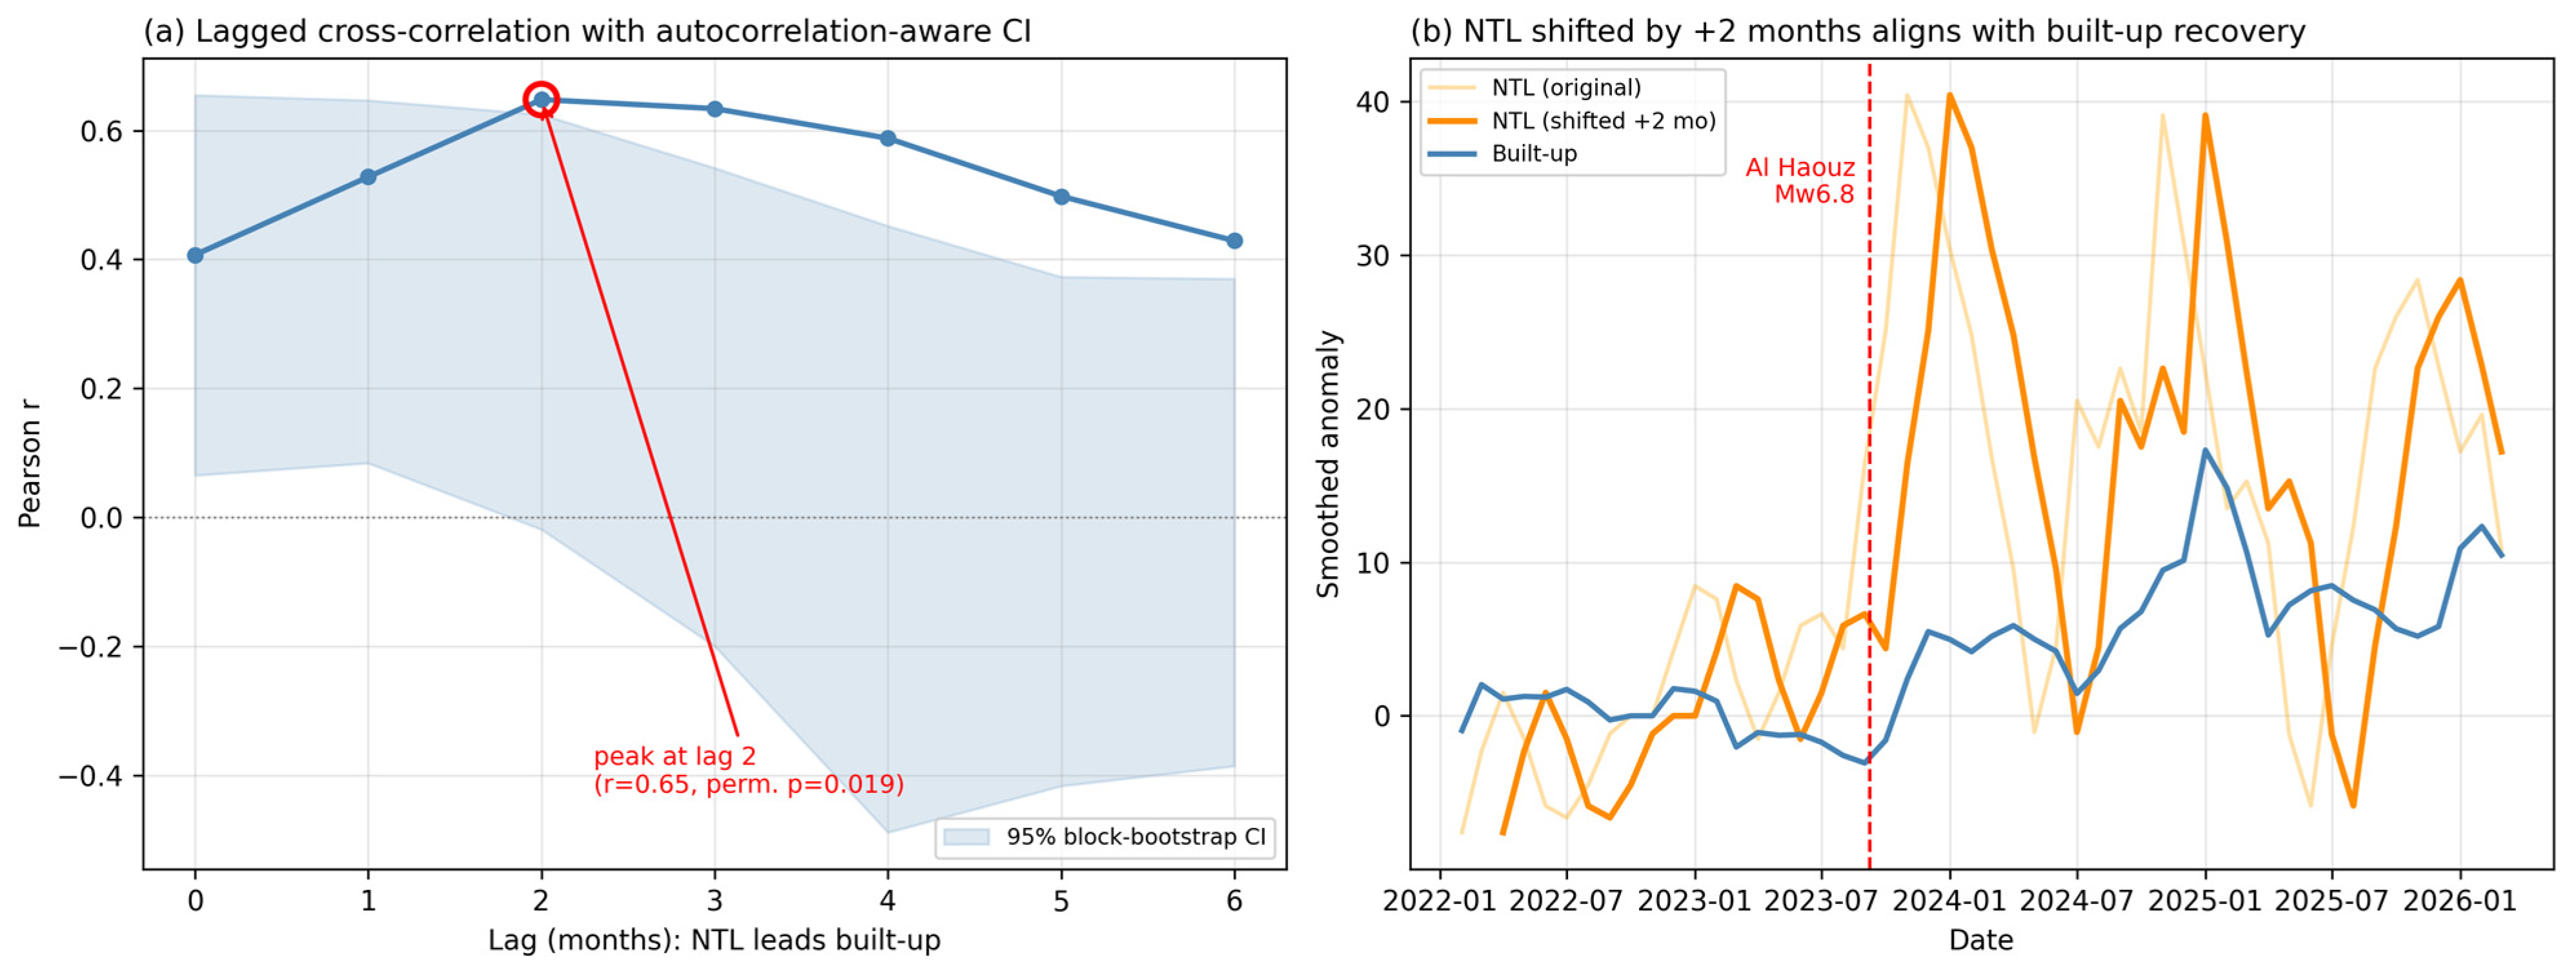
Finally, the temporal relationship between activity and rebuilding signals was quantified by lagged cross-correlation of three-month-smoothed NTL and built-up series at lags of 0–6 months, with significance assessed by 4-month block bootstrap (95% confidence intervals) and block-permutation testing (5000 replicates) preserving temporal autocorrelation, corrected across lags with the Holm method (Section 3.4). Throughout, a positive lag of k months means that NTL anomalies at month t are correlated with built-up anomalies at month t + k.
3. Results
3.1. Post-Disaster Nighttime-Light Response
In the 30 km rural core zone, VIIRS NTL anomalies were near zero before the earthquake and rose afterward, with a post-event mean anomaly of +18.1% relative to climatology. The early reconstruction phase (September 2023–March 2024) averaged +28%, and anomalies peaked near +50% in December 2024 before converging toward +15% on average. Because the rural baseline is dimly lit, we report these alongside absolute radiance (Figure 3a): the post-event mean rose from roughly 0.40 to 0.46 nW·cm−2·sr−1, so the percentage anomalies, while large, correspond to modest absolute changes and should be read as relative activity intensity. The post-event values consistently exceeded same-month values from the preceding year, which is consistent with elevated human and reconstruction activity rather than a seasonal artefact, and with VIIRS NTL functioning as a relative activity-intensity proxy [32,33].
3.2. Built-Up Signal and Coevolution
Dynamic World built-up probability showed a brief decline immediately after the earthquake (September–October 2023) followed by sustained positive anomalies that increased through late 2024 and early 2025. Although the absolute amplitude of built-up change was small—consistent with incremental rural reconstruction—its direction and timing tracked the NTL trajectory, which is consistent with a multi-sensor interpretation of staged recovery activity. Throughout, we treat the “built-up-probability anomaly” as a physical-rebuilding signal rather than as validated, completed reconstruction; its sensitivity to classification noise is examined in Section 3.9.
3.3. Vegetation Dynamics Are Precipitation-Driven
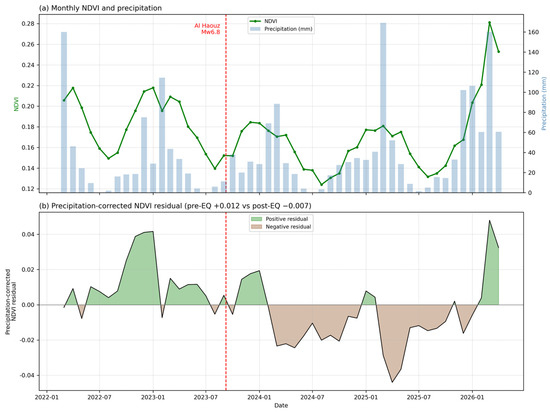
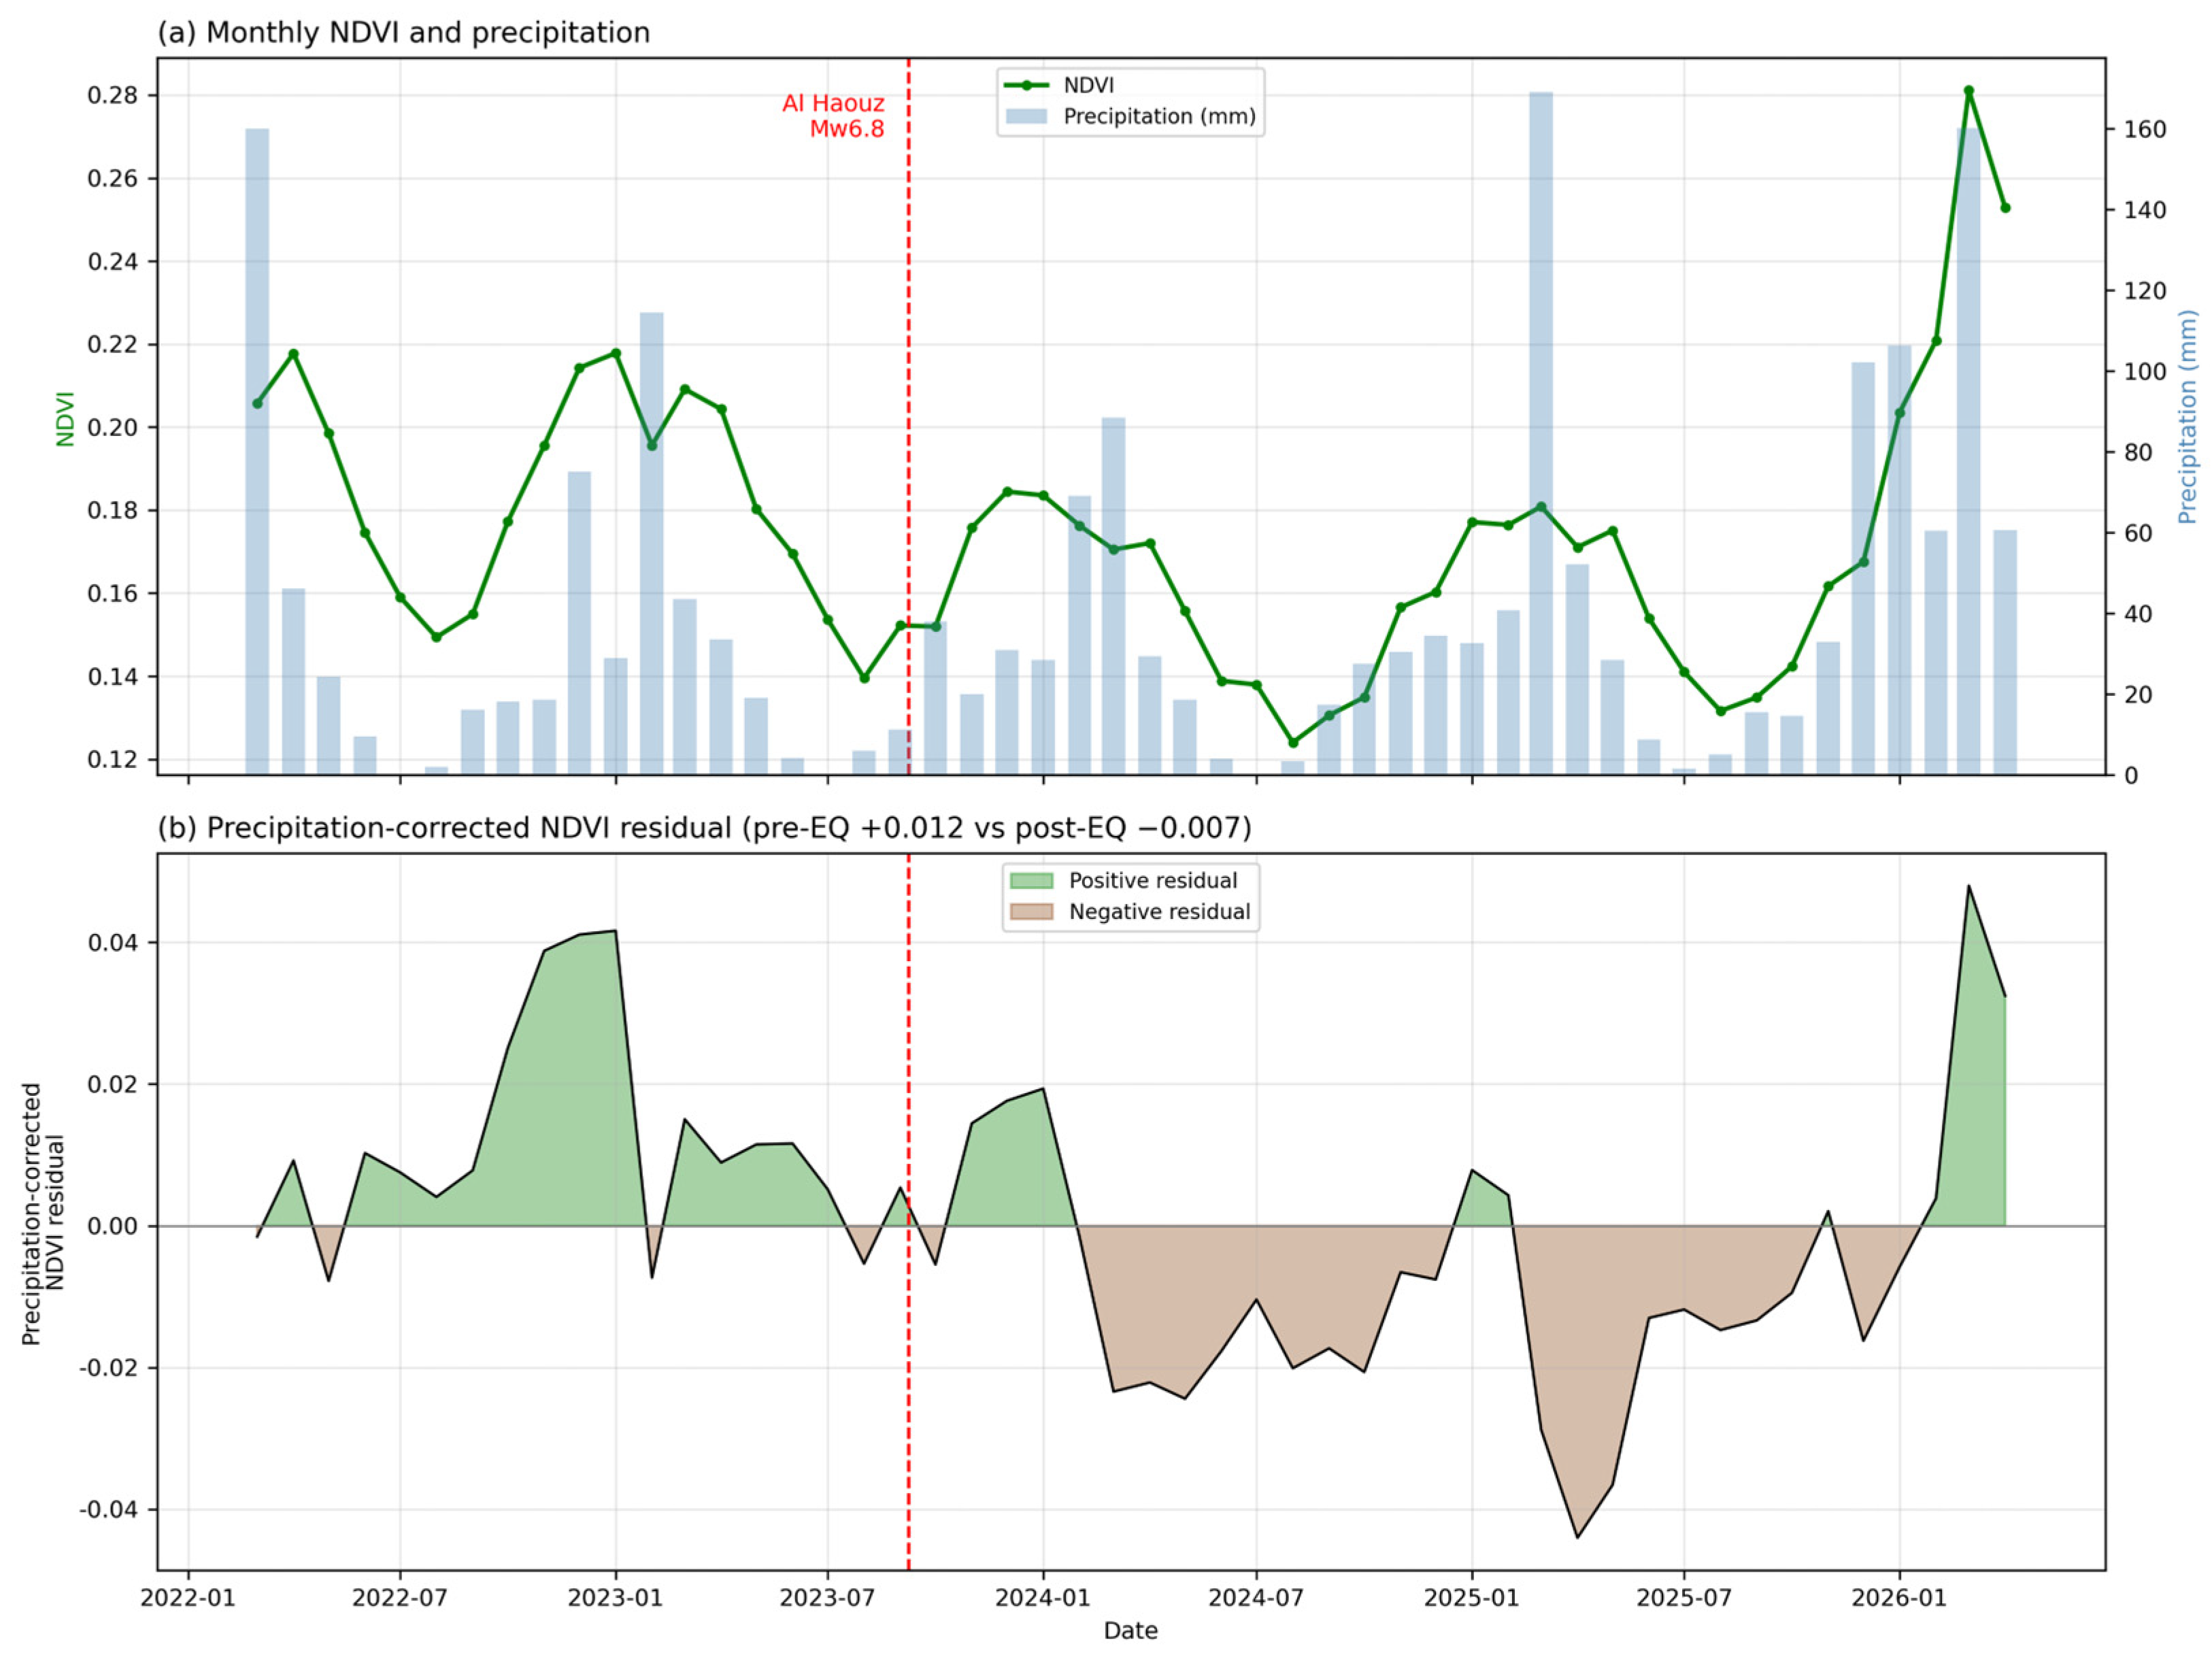
Across the study period, mean NDVI in the core zone declined only slightly, and spatial patterns of NDVI change aligned with agricultural zones rather than the epicentral vicinity. NDVI was strongly correlated with precipitation—r = 0.60 (p < 0.001) for same-month and r = 0.78 (p < 0.001) for three-month cumulative precipitation—and the regression of NDVI on three-month cumulative precipitation explained 61% of NDVI variance. To justify the accumulation window rather than assume it, we compared 1-, 2-, 3-, 4-, and 6-month cumulative precipitation as predictors (Appendix A, Table A2): explained variance peaked at the 3-month window (R2 = 0.59) and declined for longer accumulations, while the AIC difference between the 2- and 3-month windows was negligible (ΔAIC ≈ 2.6), so the 3-month window was adopted as the variance-maximizing choice consistent with the lagged vegetation response of semi-arid systems. Precipitation-corrected NDVI residuals differed negligibly between the pre- and post-earthquake periods (+0.012 vs −0.007), which suggests that NDVI variation is largely drought-driven, with no detectable direct earthquake effect [27,28,30] (see Figure 4).
Figure 4.
Disentangling vegetation dynamics from precipitation. (a) Monthly NDVI and monthly CHIRPS precipitation in the rural core zone. (b) Precipitation-corrected NDVI residuals, showing negligible difference between the pre- and post-earthquake periods (+0.012 vs. −0.007). Positive (green) and negative (brown) residuals are shown relative to the zero line. In both panels, the vertical red dashed line marks the earthquake (8 September 2023).
To verify that this conclusion is not an artefact of pooling spatially heterogeneous terrain, we repeated the analysis province by province (Appendix A, Table A3, Figure A1). The precipitation–NDVI coupling was strong and highly significant in every province but varied in strength (R2 = 0.63, 0.59, and 0.40 for Chichaoua, Al Haouz, and Taroudannt), confirming genuine spatial heterogeneity that the unified regression averages over. The earthquake-attributable residual remained negligible in all three provinces, so the core finding holds across space. This negligible residual is precisely why we retain NDVI only as a low-weight environmental control rather than as a primary recovery signal (Section 2.3).
3.4. Nighttime-Light Anomalies Precede Built-Up Anomalies
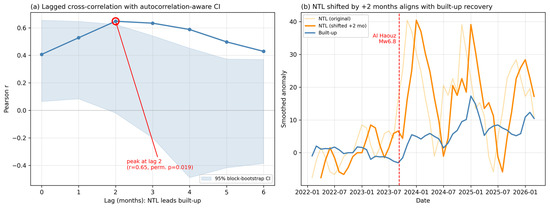
Lagged cross-correlation between the three-month-smoothed NTL and built-up series revealed a clear temporal structure, with the correlation peaking at r = 0.65 at a two-month lag (a positive lag of k meaning NTL at month t correlates with built-up at month t + k). Because monthly series are autocorrelated, smoothed, and short, nominal p-values overstate significance; we therefore assessed the two-month peak with a 4-month block bootstrap and a block-permutation test (5000 replicates) preserving temporal structure, correcting across lags with the Holm method (Appendix A, Table A8; Figure 5). The two-month peak was significant under the permutation test (p = 0.02) but attenuated after Holm correction (p = 0.14), and its bootstrap confidence interval marginally included zero. We therefore characterize the result as a reproducible but modest two-month lead, in which surges in activity captured by nighttime lights appear to precede measurable physical-rebuilding signal, rather than as a strongly significant or causal effect.
Figure 5.
Lagged cross-correlation between VIIRS nighttime-light anomalies and Dynamic World built-up anomalies (three-month smoothed). (a) Lag profile with a 95% block-bootstrap confidence band; the correlation peaks at a two-month lag (r = 0.65), significant under a permutation test (p = 0.02) though attenuated after Holm correction. (b) NTL anomalies shifted forward by two months, illustrating alignment with built-up anomalies during the 2024 reconstruction period. A positive lag of k months means NTL at month t correlates with built-up at month t + k.
We explicitly tested whether this lead could instead reflect data-side artefacts such as Dynamic World update latency or cloud-driven optical gaps (Appendix A, Table A5; Figure A3). Over the core zone, Dynamic World coverage was complete—no month lacked scenes (minimum 3, mean 5.5 per month) and valid built-up pixel counts were stable (mean ≈ 3.1 × 10⁵). The built-up anomaly was uncorrelated with scene count (r = −0.02, p = 0.87) and only weakly related to valid-pixel count (r = −0.27, p = 0.05) in the direction opposite to a coverage artefact. The lead therefore appears to reflect genuine staged activity rather than acquisition effects.
3.5. Integrated Recovery-Activity Index and Its Robustness
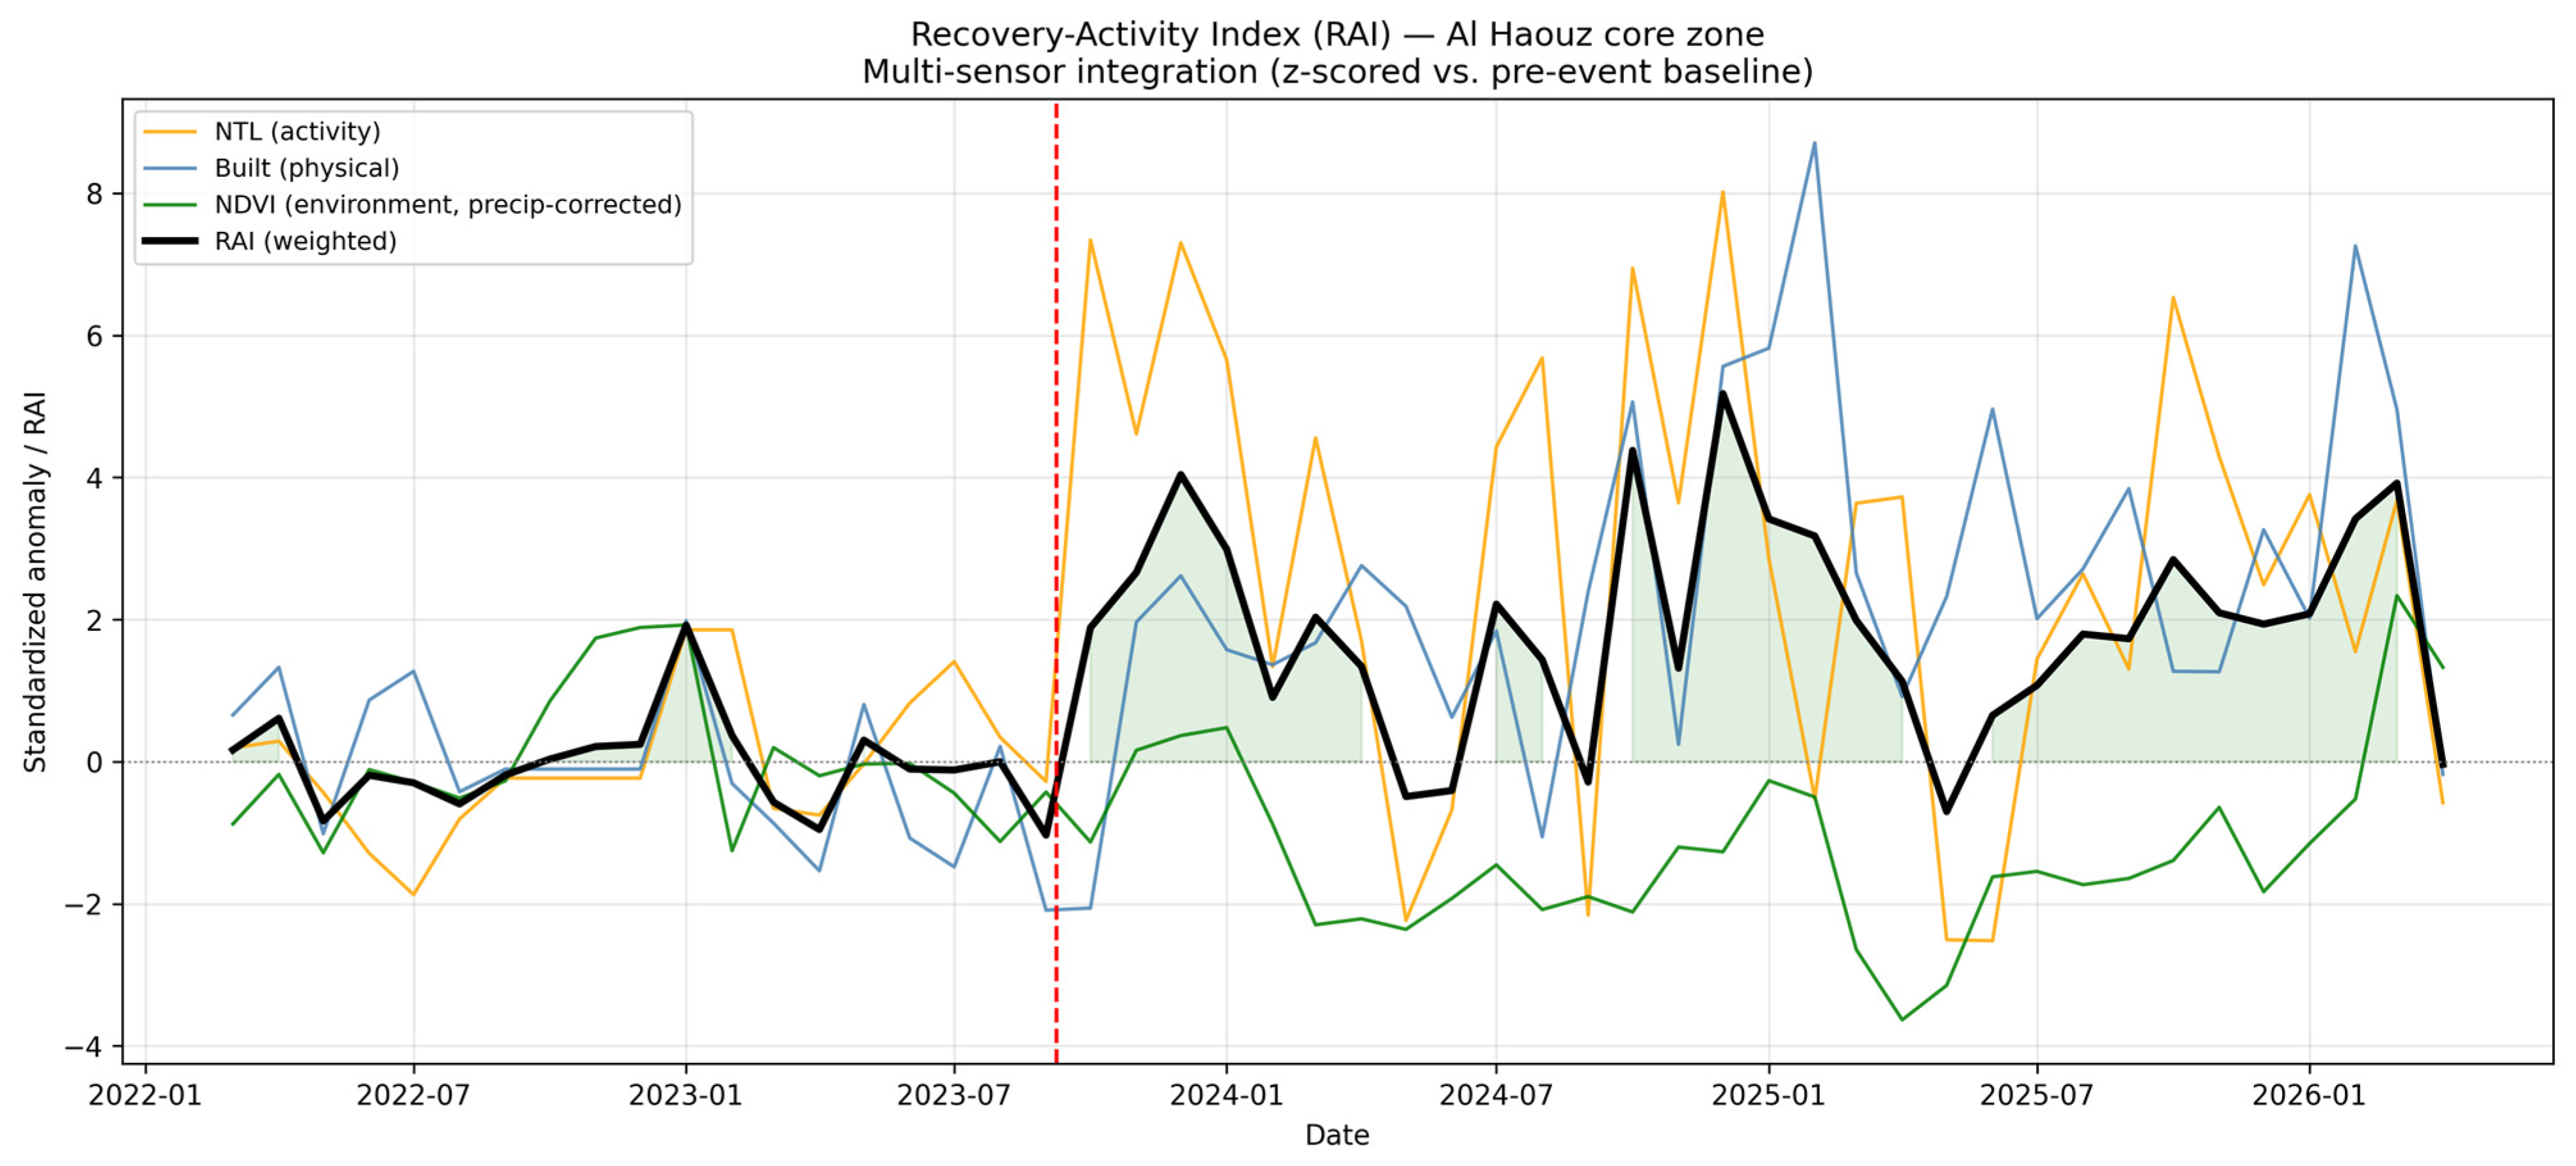
The integrated RAI (weights 0.4/0.4/0.2) rose from a pre-event mean near zero to a post-event mean of +1.83, peaking in December 2024 (RAI = +5.18), coincident with the NTL and built-up peaks. Because the RAI is a weighted sum of standardized anomalies, a peak of +5.18 reflects the simultaneous, coherent elevation of two independent sensors rather than an extreme single-component excursion; the decomposition in Section 3.6 confirms this. To address the subjectivity of the weighting, we recomputed the RAI with NDVI weights of 0.1, 0.2, and 0.3 (NTL and built-up kept equal) and with equal (1/3) weighting (Appendix A, Table A1; Figure A2). All schemes produced near-identical series (pairwise r ≥ 0.97) and the same December 2024 peak, with only the amplitude scaling with the NDVI weight (post-event mean 2.21, 1.83, 1.45). The recovery signal is therefore driven by coherent multi-sensor behavior rather than by a specific weight allocation.
To probe a wider weight space than these discrete schemes, we additionally performed a Monte Carlo weight-sampling analysis (Appendix A, Table A12; Figure A7). Across 10,000 random weight vectors summing to one (drawn from a Dirichlet distribution over the three indicators), the sign of the post-event mean RAI remained positive in 90.5% of draws and the province ranking (Chichaoua > Al Haouz > Taroudannt) was unchanged in 84.4%. When sampling was restricted to the plausible weight space in which NDVI is capped at 0.4—consistent with its role as a low-weight environmental control (Section 2.3)—the December 2024 peak fell within the late-2024–early-2025 reconstruction plateau in 96.2% of draws and the post-event mean was positive in every draw. The peak-month and post-event-mean distributions are summarized in Figure A7. These results confirm that the integrated recovery signal is governed by coherent multi-sensor behavior rather than by any specific weight allocation (see Figure 6).
Figure 6.
Integrated multi-sensor Recovery-Activity Index (RAI) for the 30 km rural core zone, combining standardized nighttime-light, built-up, and precipitation-corrected NDVI signals (weights 0.4/0.4/0.2). The RAI rises from a pre-event mean near zero to a post-event mean of +1.83, peaking in December 2024. The vertical dashed line marks the earthquake (8 September 2023). Results are robust to alternative weighting (Appendix A, Table A1).
3.6. Decomposition of the RAI Peak
To show whether the December 2024 peak is genuinely multi-sensor or mainly NTL-driven, we decomposed it into component contributions (Appendix A, Table A7). At the peak, NTL contributed +3.21 (62% of the RAI value) and built-up contributed +2.23 (43%), while precipitation-corrected NDVI contributed −0.25 (−5%; contributions sum to 100% including the small negative NDVI term). The peak is thus a coherent NTL-plus-built-up signal rather than an NTL-only spike, and the negligible NDVI contribution confirms that the environmental component adds an interpretive control rather than driving the composite.
3.7. Sensitivity to the Climatological Baseline
Because the operational baseline is short, we recomputed the VIIRS NTL anomaly using a long-term pre-earthquake seasonal climatology (2014–2023) and rederived the RAI (Appendix A, Table A9; Figure A6). The resulting RAI was strongly correlated with the original (r = 0.88), and the post-event mean remained clearly positive (+1.31 vs. +1.83 under the operational baseline). The recovery peak remained within the late-2024 to early-2025 reconstruction plateau, its exact month shifting only marginally between baselines (December 2024 to February 2025). The somewhat smaller post-event mean under the long-term baseline is expected, since that climatology spans a period of generally lower regional luminosity, and the persistence of a strong, positive, plateau-aligned recovery signal under both baselines indicates that the result is not an artefact of the chosen baseline.
3.8. Sensitivity to the Spatial Domain
We tested whether results hold under alternative spatial definitions by recomputing the post-event mean RAI for buffers of 20, 30, and 40 km and for rural-mask thresholds of 1500 and 3000 m2 (Appendix A, Table A10). The post-event mean RAI varied by less than 9% across all configurations. The slightly higher value at 40 km is consistent with the inclusion of less-affected peripheral terrain, supporting the 30 km core zone as a focused representation of the heavily damaged settlements. Results are thus robust to the choice of buffer radius and mask threshold.
3.9. Validation of the Built-Up Indicator Against Classification Noise
Because Dynamic World yields class probabilities rather than a dedicated reconstruction product, we assessed whether classification noise could distort the built-up signal (Appendix A, Table A11). The post-event increase in built-up fraction was small in absolute terms (Δ = +0.0036) but statistically significant (Welch t = 4.28, p < 10−4) and exceeded the pre-event month-to-month variability (signal-to-noise ratio = 1.68). The signal was weakly negatively correlated with the number of valid observations (r = −0.36, p = 0.01), the opposite of what noise from sparse observations would produce. A pixel-level validation against high-resolution imagery or OpenStreetMap building footprints was beyond the scope of this study and is identified as a priority for future work; accordingly, we describe the built-up anomaly as a physical-rebuilding signal consistent with reconstruction rather than as validated reconstruction.
3.10. Province-Level Recovery Hierarchy and Its Drivers
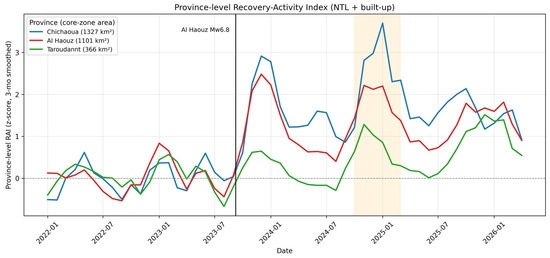
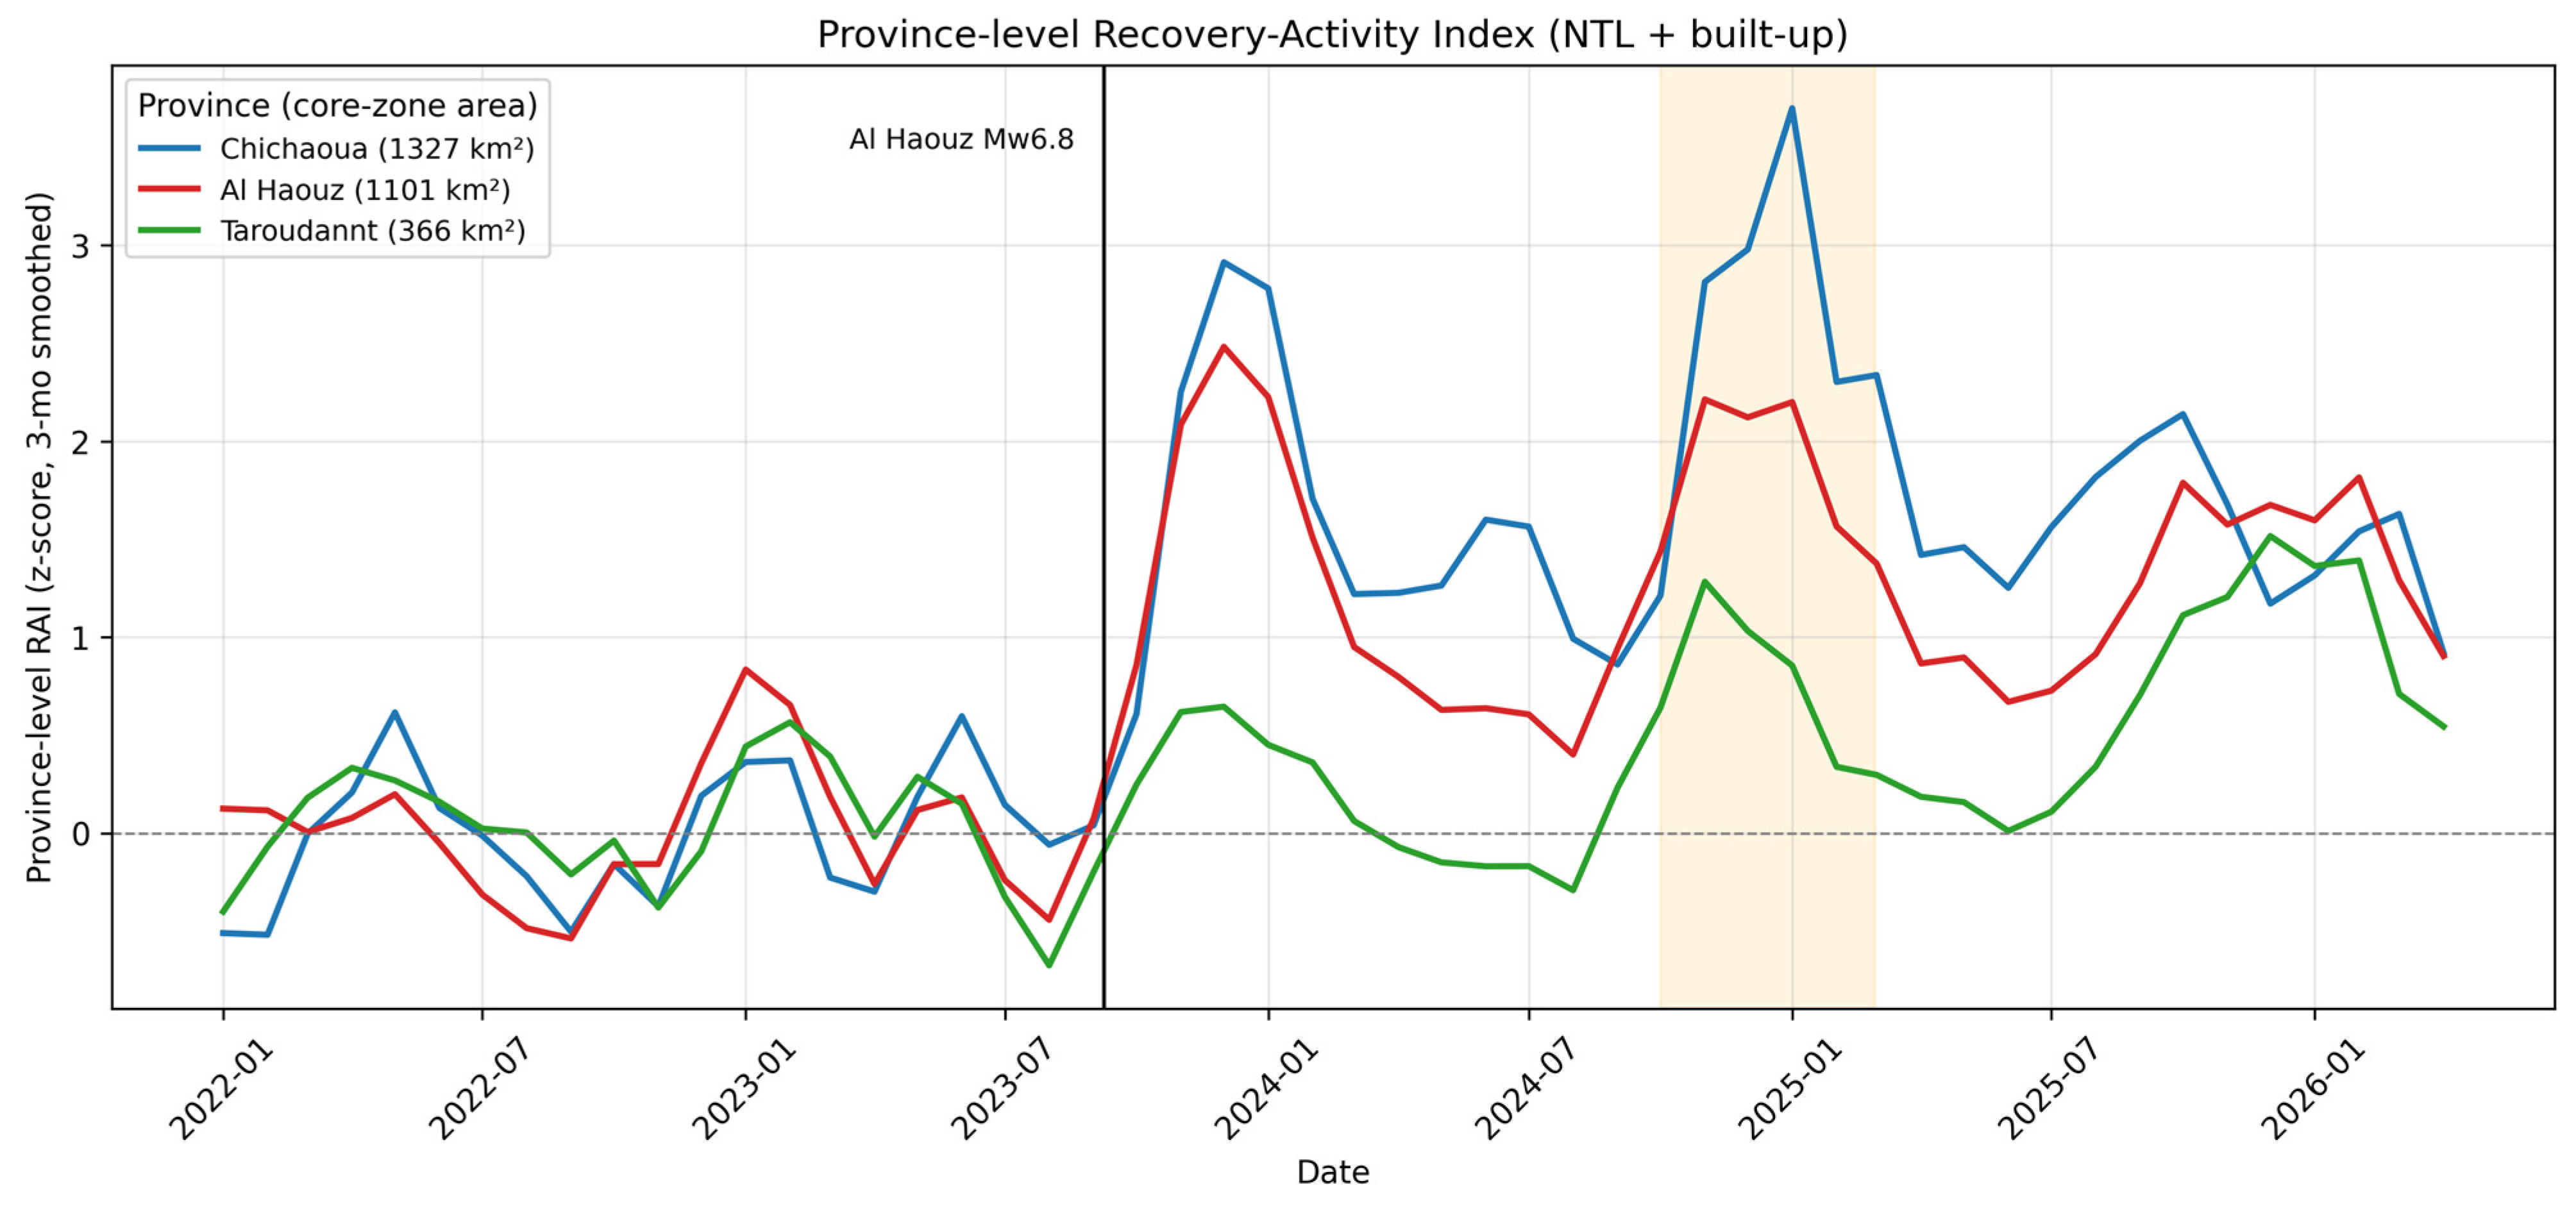
Disaggregating the two-axis RAI to the three core-zone provinces revealed an uneven hierarchy. Chichaoua exhibited the strongest response (post-event mean +1.70; peak +5.22), followed by Al Haouz (+1.28; +3.62) and Taroudannt (+0.48; +1.99). To avoid overinterpreting standardized values, we report both relative and absolute indicators against potential drivers (Appendix A, Table A4). Decomposing the recovery into absolute changes clarifies the drivers: nighttime-light recovery was similar across all three provinces (ΔNTL = 15.0–15.9%), whereas built-up change differed markedly—Chichaoua and Al Haouz showed substantial reconstruction signal (ΔBuilt = +5.5% and +5.3%) while Taroudannt showed almost none (+0.3%). The ranking thus appears to reflect genuine differences in physical-rebuilding signal, tracking affected-settlement extent and population (core-zone areas of 1327, 1101, and 366 km2; rural populations of ≈57,000, ≈55,000, and ≈13,000) rather than baseline luminosity, which does not explain the order. This also illustrates the value of the multi-sensor approach: the built-up signal captured the comparatively stalled signal in Taroudannt that nighttime lights alone would have missed.
Importantly, this activity-based ranking should not be read as a ranking of damage severity. Independent province-level estimates of the earthquake’s impact rank the worst-affected provinces by fatalities as Al Haouz (≈1684 deaths) > Taroudannt (≈980) > Chichaoua (≈202) and report the largest direct economic-infrastructure losses concentrated in Al Haouz, followed by Taroudannt and Chichaoua [38]. The RAI ordering (Chichaoua > Al Haouz > Taroudannt) therefore does not mirror this damage ranking: Taroudannt sustained heavy human and economic losses yet registered a comparatively stalled built-up signal in our analysis. Rather than contradicting the damage record, this divergence underscores the intended meaning of the index—the RAI captures observed reconstruction activity, not damage magnitude—and suggests that, within the core zone, rebuilding activity in Taroudannt may have lagged relative to its exposure. Such areas, where the activity signal appears weak relative to reported damage, are precisely those where ground verification should be prioritized.
In contrast to Chichaoua and Al Haouz, whose RAI peaks in December 2023, Taroudannt shows no coherent reconstruction peak: its nominal maximum (January 2026, RAI = 1.99) is only marginally above pre-event-level fluctuations (e.g., February 2023, RAI = 1.92) and well below the early-reconstruction peaks of the other two provinces. Given its comparatively small core-zone area (366 km2) and weak post-event mean (+0.48), Taroudannt should be interpreted as a low-signal case rather than as exhibiting a delayed recovery surge.
Province-level magnitudes should nonetheless be read as relative activity intensity, not absolute reconstruction volume, and our core-zone subsets do not coincide with full provincial administrative boundaries used in [38]; the comparison above is therefore one of rank and direction rather than of matched absolute quantities. A more rigorous validation would compare the RAI trajectory against province- or commune-level damage and reconstruction-disbursement statistics as these become available at compatible spatial scales [38] (see Figure 7).
Figure 7.
Province-level Recovery-Activity Index (NTL + built-up, equal weights) for the three provinces within the 30 km core zone, three-month smoothed, annotated with each province’s core-zone area. Chichaoua and Al Haouz exhibit the strongest responses and a shared secondary peak in late 2024–early 2025 (shaded), whereas Taroudannt shows a weaker signal. The vertical line marks the earthquake (8 September 2023).
3.11. Processing Performance and Scalability
Because the framework is intended as a low-cost, transferable monitoring tool, its computational footprint is itself a relevant result. We therefore report indicative processing times for the complete single-event workflow, measured on the Al Haouz analysis (52-month series, January 2022–May 2026) using the free Google Earth Engine (GEE) tier and a standard broadband client connection.
The entire RAI pipeline—monthly extraction of all indicators (VIIRS NTL, Dynamic World built-up, Sentinel-2 NDVI, and CHIRPS precipitation), seasonal-anomaly detrending, z-score standardization, weighted integration, and province-level disaggregation—was executed server-side within GEE, with no local download of satellite imagery. Each indicator series completed on the order of a few minutes, and the full multi-sensor core-zone analysis ran end-to-end in roughly ten to fifteen minutes. The robustness tests reported in Section 3.5, Section 3.6, Section 3.7, Section 3.8 and Section 3.9 (weighting, baseline, spatial-domain, coverage, and noise diagnostics) added only incremental cost, as they reuse the same server-side reductions rather than reprocessing raw imagery.
These figures are indicative rather than benchmark-grade: absolute timings depend on server load, network conditions, the chosen spatial extent, and reducer settings, and should be read as an order-of-magnitude indication rather than a fixed performance guarantee. Even so, the low computational cost and the absence of any local storage or download requirement are the practical features that underpin the framework’s scalability. The same workflow can, in principle, be repointed to other events and regions simply by changing the epicenter, study period, and administrative boundaries, making the approach realistic for data- and resource-limited administrations that lack high-performance computing infrastructure.
4. Discussion
4.1. Capturing a Staged Trajectory of Recovery Activity
The central finding is that a multi-sensor index can capture a staged structure of post-disaster recovery activity that single indicators miss. Nighttime-light anomalies appeared to precede built-up-probability anomalies by approximately two months, which is consistent with a sequence in which human, relief, and reconstruction activity intensifies first, followed by a measurable physical-rebuilding signal. This ordering is intuitive—emergency response, debris clearance, temporary settlement, and construction logistics generate light and activity before durable structures register in built-up classifications—but we emphasize that our analysis establishes temporal precedence, not causation, and that the lead, while reproducible, was modest once autocorrelation and multiple comparisons were accounted for (Section 3.4). It may help explain why contemporaneous correlations are weak and why prior single-indicator studies [12,13,17] could underrepresent the early, activity-driven phase. The sustained elevation of activity for more than a year is consistent with a prolonged process rather than a short bounce back.
4.2. Disentangling Climate from Recovery
With 61% of core-zone NDVI variance explained by three-month cumulative precipitation and negligible earthquake-attributable residual in every province, vegetation change in the Al Haouz core zone appears to reflect drought rather than recovery. This is consistent with evidence that NDVI in semi-arid mountains is precipitation-driven and time-lagged [27,28,29] and that index performance varies along climate gradients [20,30]. For recovery assessment in such settings, vegetation indices may need to be precipitation-corrected or down-weighted and interpreted jointly with human-activity proxies [23,24,31]. Conflating drought with reconstruction could misdirect scarce resources toward areas that are climatically, not seismically, stressed.
4.3. Uneven Recovery and Needs-Based Reconstruction
The province hierarchy (Chichaoua > Al Haouz > Taroudannt) suggests spatially uneven recovery activity, which our driver analysis attributes mainly to affected-settlement extent rather than baseline luminosity, and which absolute built-up changes corroborate. Such heterogeneity is consistent with findings that recovery trajectories differ across populations and places [11] and that dynamic recovery metrics complement static capacity indices [9]. Because our index measures relative activity intensity rather than welfare, persistently weaker signals—such as Taroudannt’s—may flag areas where reconstruction momentum appears to lag and where ground verification should be prioritized. Coupling the RAI with socioeconomic and social-vulnerability layers [14,23] would be needed before it could speak to equitable, sustainability-oriented planning in any direct sense.
4.4. A Low-Cost, Reproducible Monitoring Proxy
Because the RAI is built entirely from free satellite datasets within a reproducible cloud platform, and because the workflow runs in minutes server-side (Section 3.11), it constitutes a transferable, low-cost monitoring proxy that data- and resource-limited administrations could adopt to prioritize ground verification [13]. We frame it as a hypothesis-generating monitoring tool rather than an empirically validated recovery measure. To support reproducibility, the GEE and Python scripts, exact dataset identifiers, bands, date filters, cloud masks, scale parameters, reducers, and derived monthly time series are provided (see Data Availability Statement). The analyses were run in Python 3.12.9 using the Earth Engine Python API (earthengine-api 1.7.26) and geemap 0.37.2, with pandas 3.0.2, NumPy 2.4.4, SciPy 1.17.1, statsmodels 0.14.6, geopandas 1.1.3, and Matplotlib 3.10.8.
4.5. Limitations
Several limitations temper interpretation, listed in approximate order of importance. Most significant is the absence of high-resolution ground truth and socioeconomic validation [12,13,14]; this is the single greatest constraint and limits the extent to which the index can speak to welfare or equity, making ground-based or very-high-resolution validation the highest-priority next step. Because of it, the central finding should be read as “NTL activity precedes built-up signal”, not as confirmed reconstruction, since nighttime lights can reflect emergency lighting, temporary camps, road works, or relief logistics rather than durable rebuilding. Second, the short pre-event baseline makes the monthly climatology statistically fragile; we mitigated this with a long-term baseline-sensitivity test (Section 3.7) but cannot fully remove the concern. Third, NTL must be treated as a relative activity-intensity indicator, not a measure of damage or welfare; at 500 m resolution, small absolute changes in dimly lit terrain become large percentage anomalies, so province-level magnitudes are relative rather than absolute. Fourth, Dynamic World built-up probability is not a validated reconstruction product, and although signal-to-noise diagnostics are encouraging (Section 3.9), pixel-level validation remains outstanding. Fifth, the independent SAR cross-check (Section 4.6) captured the coseismic impact but, at coarse aggregation, did not track gradual rebuilding. Finally, the index was demonstrated on a single event, so transferability remains to be tested.
4.6. Independent SAR Cross-Check and Outlook
As an external test beyond internal cross-correlation, we examined Sentinel-1 VV/VH backscatter (Appendix A, Table A6; Figure A4). A pronounced coseismic backscatter spike coincided with the earthquake month, confirming that an independent sensor measuring a different physical quantity (surface roughness) captured the event. Over the full post-event period, however, mean backscatter returned to baseline (ΔVV = +0.09 dB, p = 0.35; ΔVH = +0.01 dB, p = 0.92) and monthly SAR anomalies were uncorrelated with the NTL and built-up signals (|r| ≤ 0.16), which indicates that coarse-aggregated C-band backscatter, dominated by vegetation and soil-moisture variability, cannot resolve the dispersed, incremental rebuilding of small rural structures. This delineates a clear resolution limit and motivates the integration of high-resolution SAR or InSAR coherence in future work [10], alongside coupling the RAI with census and social-vulnerability data and testing transferability across hazards and regions.
5. Conclusions
This study developed a GEE-based multi-sensor Recovery-Activity Index and applied it to the 2023 Al Haouz earthquake. By integrating deseasonalized VIIRS nighttime lights, Dynamic World built-up probability, and precipitation-corrected NDVI, the index captured a coherent post-event recovery-activity signal (post-event mean RAI +1.83; peak December 2024) that proved robust to indicator weighting (pairwise r ≥ 0.97), to the climatological baseline (r = 0.88), and to the spatial domain (<9% variation) and whose peak was demonstrably multi-sensor (NTL 62%, built-up 43%). The key temporal insight is that nighttime-light anomalies precede built-up anomalies by approximately two months—a reproducible if modest lead once autocorrelation and multiple comparisons are accounted for, and one we show is not attributable to optical data gaps. We also demonstrated that NDVI is precipitation-governed across an empirically justified accumulation window and across provinces and that the province hierarchy is driven mainly by affected-settlement extent, with absolute built-up change (+5.5% vs. +0.3%) corroborating genuine differences in rebuilding signal. An independent SAR cross-check captured the coseismic impact while clarifying the limits of coarse optical monitoring. We have demonstrated a reproducible workflow and a coherent anomaly pattern; we have not demonstrated that the index directly measures welfare recovery, equitable reconstruction, or resilience capacity. The RAI is therefore best understood as an early-warning and monitoring proxy that should guide targeted ground verification and that, combined with damage, population, and socioeconomic data, can support evidence-based reconstruction governance in data-sparse regions.
Author Contributions
Conceptualization, S.-J.L., J.K., I.-S.H. and H.-S.Y.; methodology, S.-J.L., J.K., I.-S.H. and H.-S.Y.; software, S.-J.L. and I.-S.H.; validation, S.-J.L. and I.-S.H.; formal analysis, J.K., S.-J.L. and I.-S.H.; investigation, S.-J.L., J.K. and I.-S.H.; resources, J.K. and H.-S.Y.; data curation, S.-J.L. and I.-S.H.; writing—original draft preparation, S.-J.L. and I.-S.H.; writing—review and editing, S.-J.L., J.K., I.-S.H. and H.-S.Y.; visualization, S.-J.L. and I.-S.H.; supervision, I.-S.H. and H.-S.Y.; project administration, H.-S.Y.; funding acquisition, J.K. and H.-S.Y. All authors have read and agreed to the published version of the manuscript.
Funding
This research was supported by 2023-MOIS36-004 (RS-2023-00248092) of the Technology Development Program on Disaster Restoration Capacity Building and Strengthening, funded by the Ministry of the Interior and Safety (MOIS, Korea).
Institutional Review Board Statement
Not applicable.
Informed Consent Statement
Not applicable.
Data Availability Statement
The satellite and geospatial datasets are publicly available through the Google Earth Engine data catalog (https://developers.google.com/earth-engine/datasets, accessed on 20 June 2026). The analysis used VIIRS DNB monthly nighttime lights (NOAA/VIIRS/DNB/MONTHLY_V1/VCMSLCFG), Dynamic World (GOOGLE/DYNAMICWORLD/V1), Sentinel-2 surface reflectance (COPERNICUS/S2_SR_HARMONIZED), CHIRPS daily precipitation (UCSB-CHG/CHIRPS/DAILY), GHSL built-up surface (JRC/GHSL/P2023A/GHS_BUILT_S/2020), Sentinel-1 GRD (COPERNICUS/S1_GRD), WorldPop (WorldPop/GP/100m/pop/MAR_2020), and FAO GAUL 2015 administrative boundaries. To support the reproducibility emphasized in this study, the Google Earth Engine and Python processing scripts, exact band, date-filter, cloud-mask, scale, and reducer settings, and the derived monthly anomaly and RAI time series are deposited in a public repository [39].
Conflicts of Interest
The authors declare no conflicts of interest.
Abbreviations
The following abbreviations are used in this manuscript:
| AIC | Akaike Information Criterion |
| CHIRPS | Climate Hazards Group InfraRed Precipitation with Station data |
| DNB | Day/Night Band |
| EQ | Earthquake |
| FAO GAUL | Food and Agriculture Organization Global Administrative Unit Layers |
| GEE | Google Earth Engine |
| GHSL | Global Human Settlement Layer |
| InSAR | Interferometric Synthetic Aperture Radar |
| LCLUC | Land-Cover and Land-Use Change |
| MMI | Modified Mercalli Intensity |
| MNDWI | Modified Normalized Difference Water Index |
| Mw | Moment Magnitude |
| NDVI | Normalized Difference Vegetation Index |
| NTL | Nighttime Light |
| RAI | Recovery-Activity Index |
| SAR | Synthetic Aperture Radar |
| VIIRS | Visible Infrared Imaging Radiometer Suite |
Appendix A
Figure A1.
Province-level monthly NDVI versus 3-month cumulative precipitation for Chichaoua, Al Haouz, and Taroudannt, with ordinary-least-squares regression lines, R2, Pearson r, and sample size (n). Pre-earthquake (blue) and post-earthquake (red) observations are distinguished. The precipitation–NDVI coupling is strong and significant in every province but varies in strength, confirming the spatial heterogeneity that the pooled regression averages over.
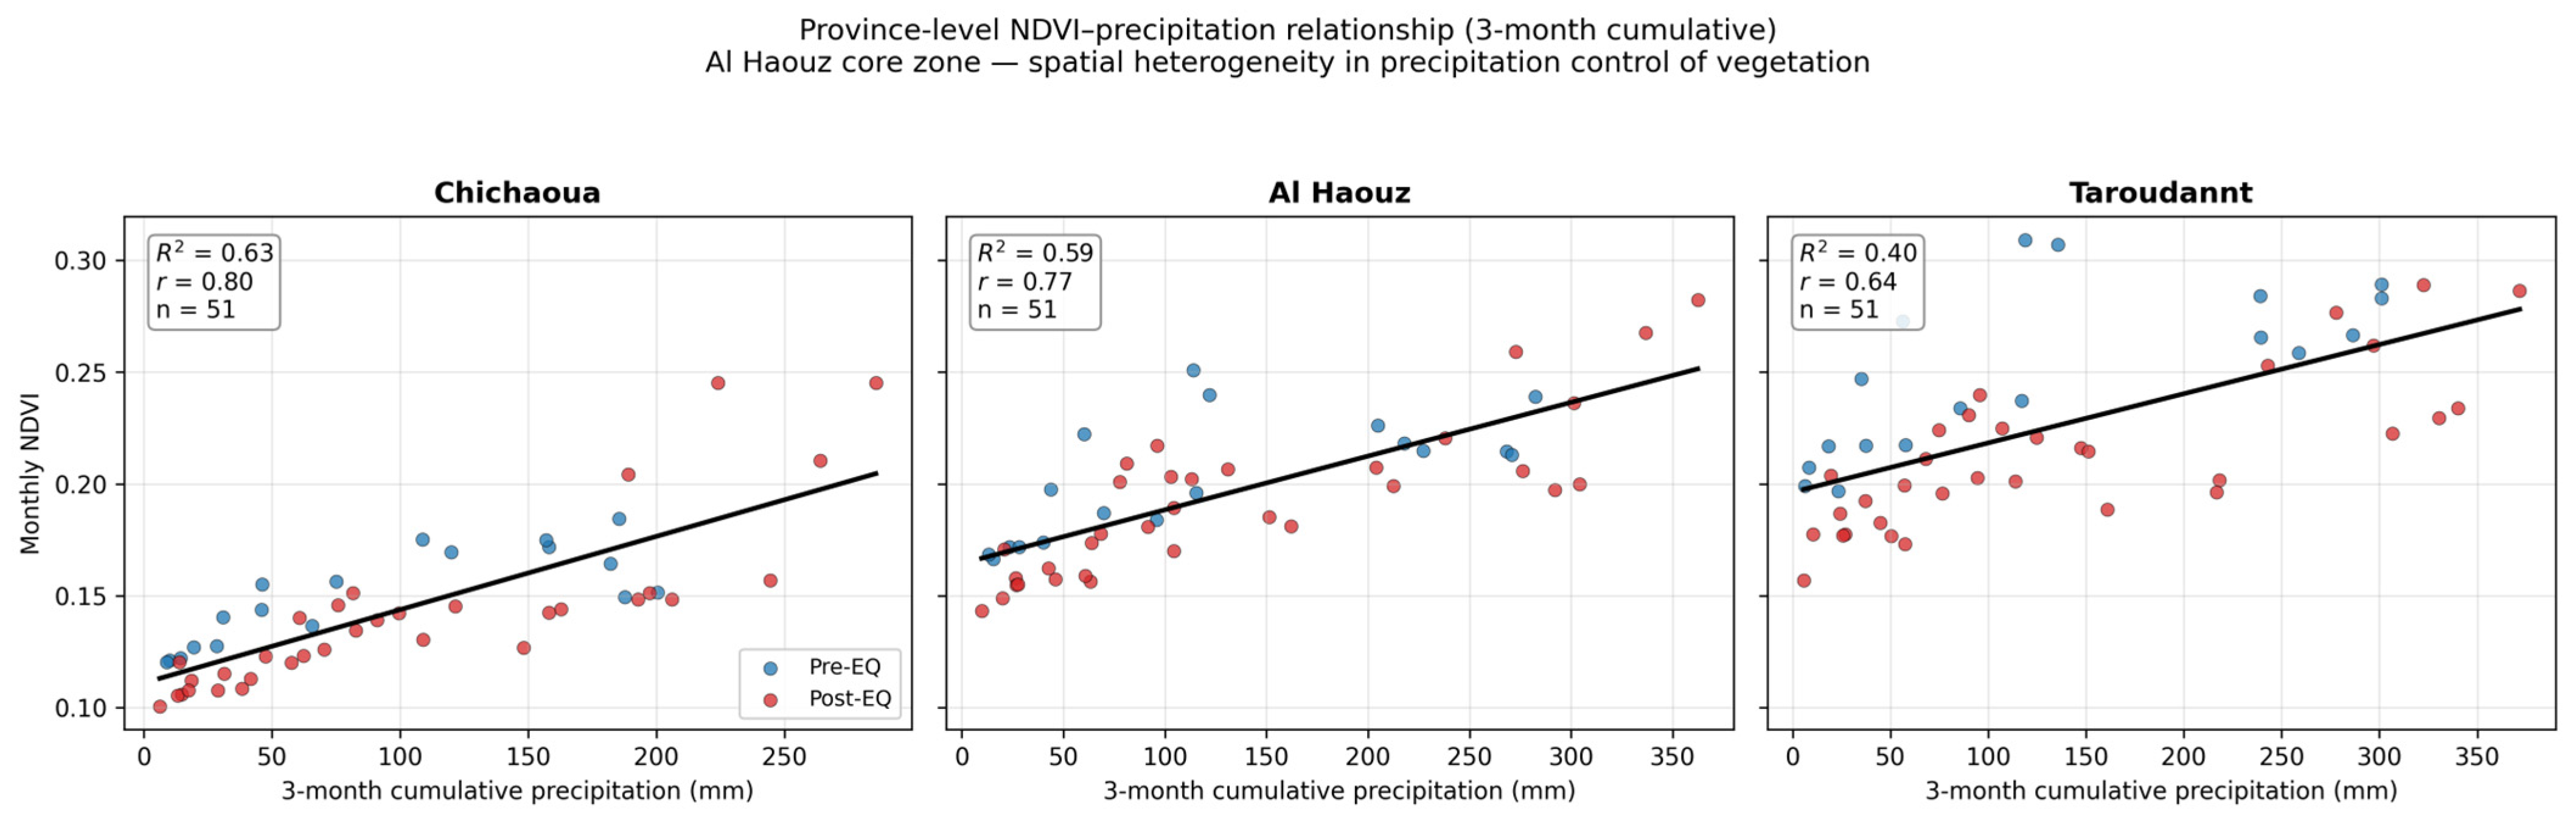
Figure A2.
RAI weight-sensitivity test under NDVI weights of 0.1, 0.2 (base), and 0.3 (NTL and built-up kept equal) and equal (1/3) weighting. All schemes produce near-identical series (pairwise r ≥ 0.97) and the same December 2024 peak, with only the amplitude scaling with the NDVI weight. The vertical dashed line marks the earthquake (8 September 2023).
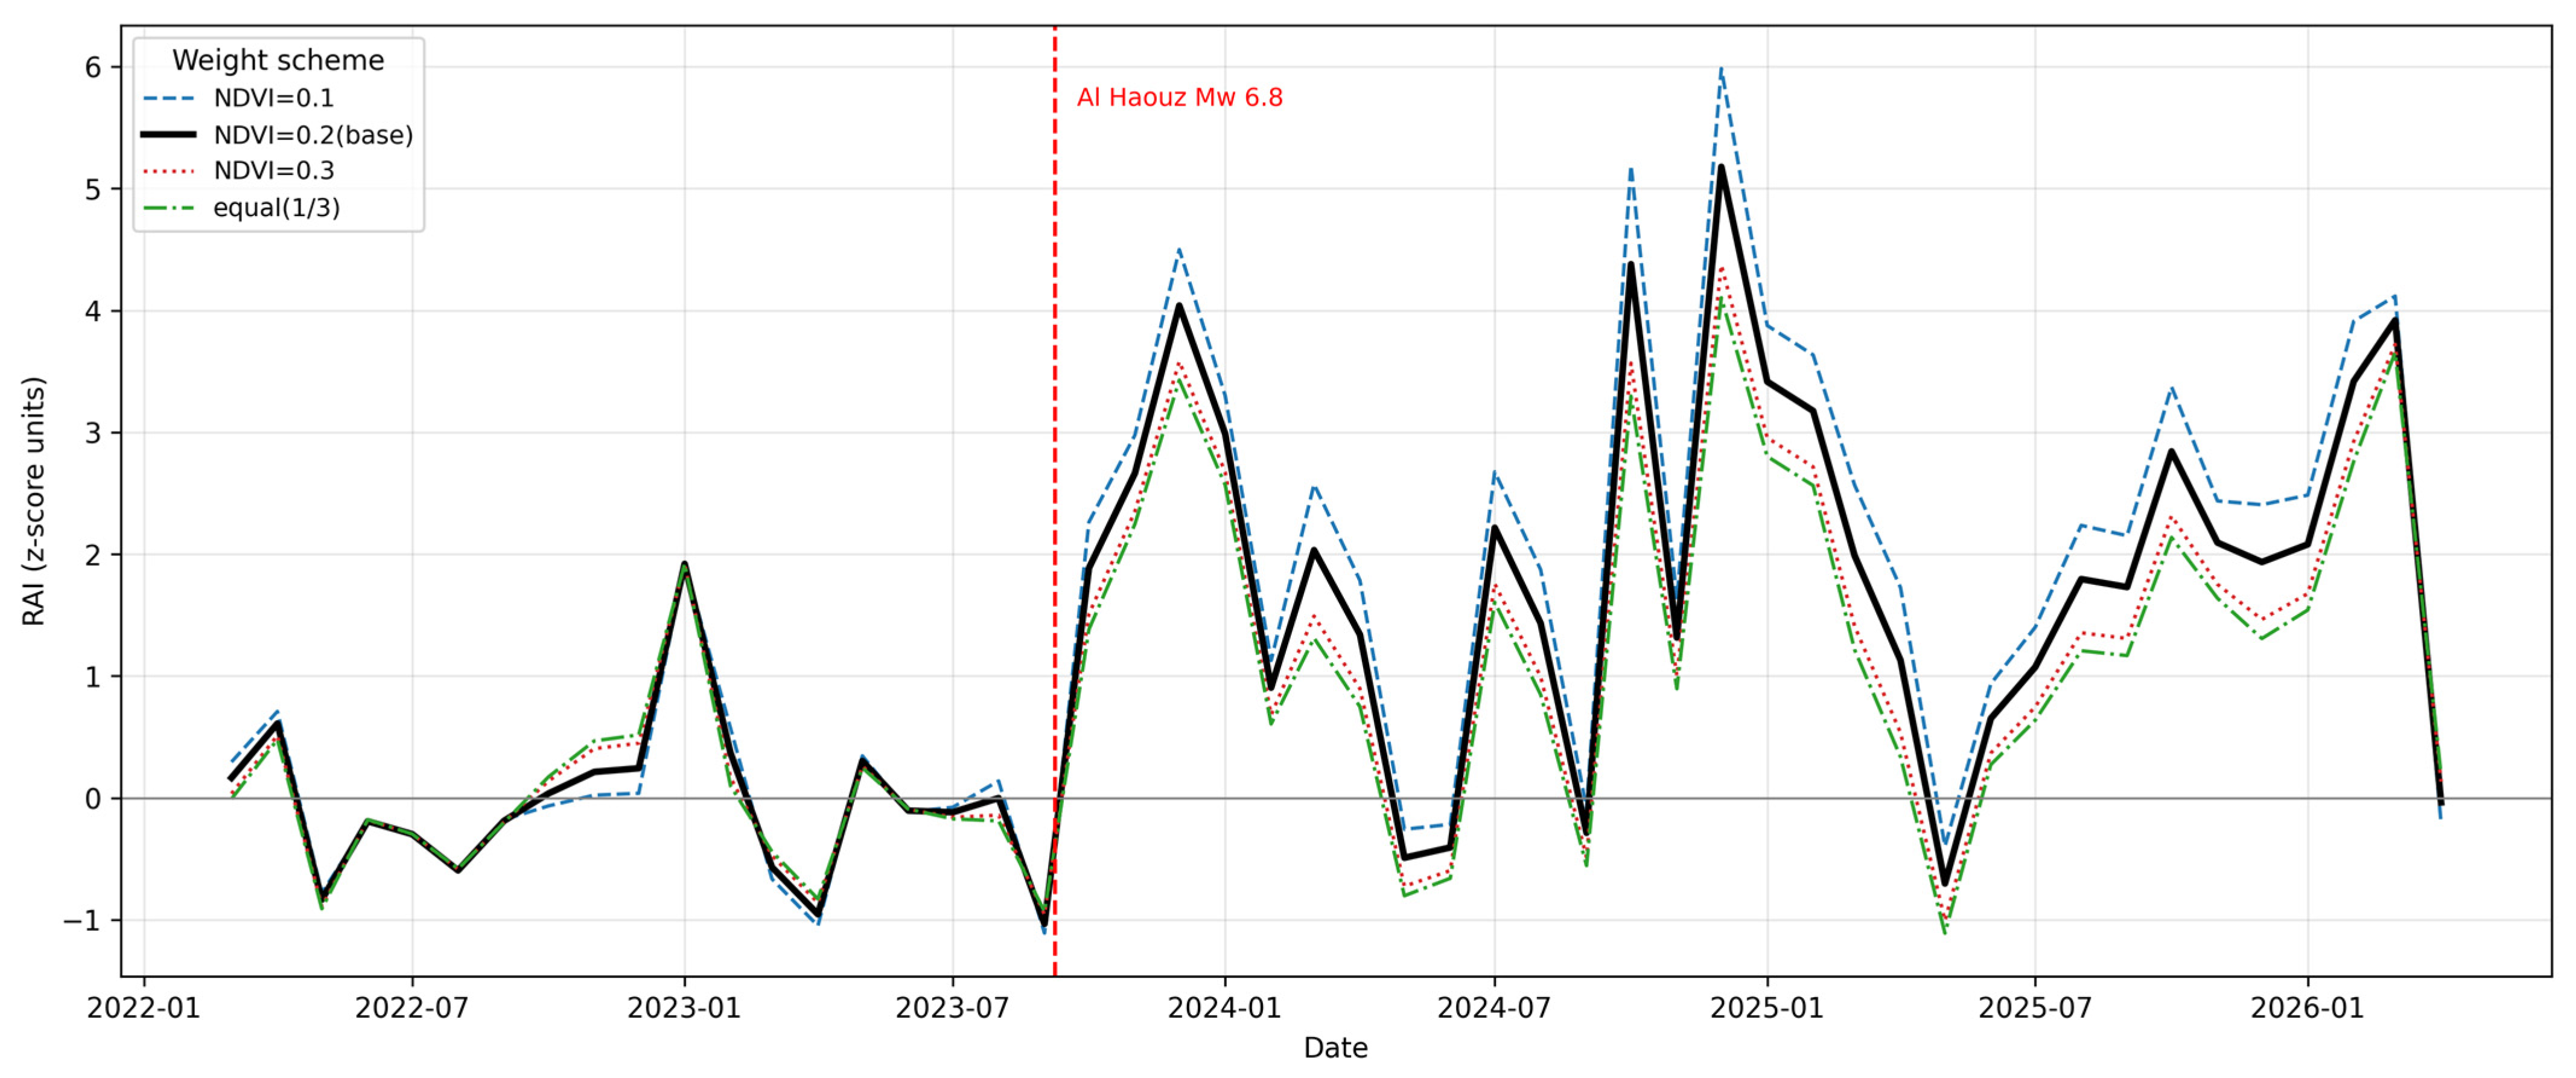
Figure A3.
Dynamic World monthly coverage in the rural core zone.
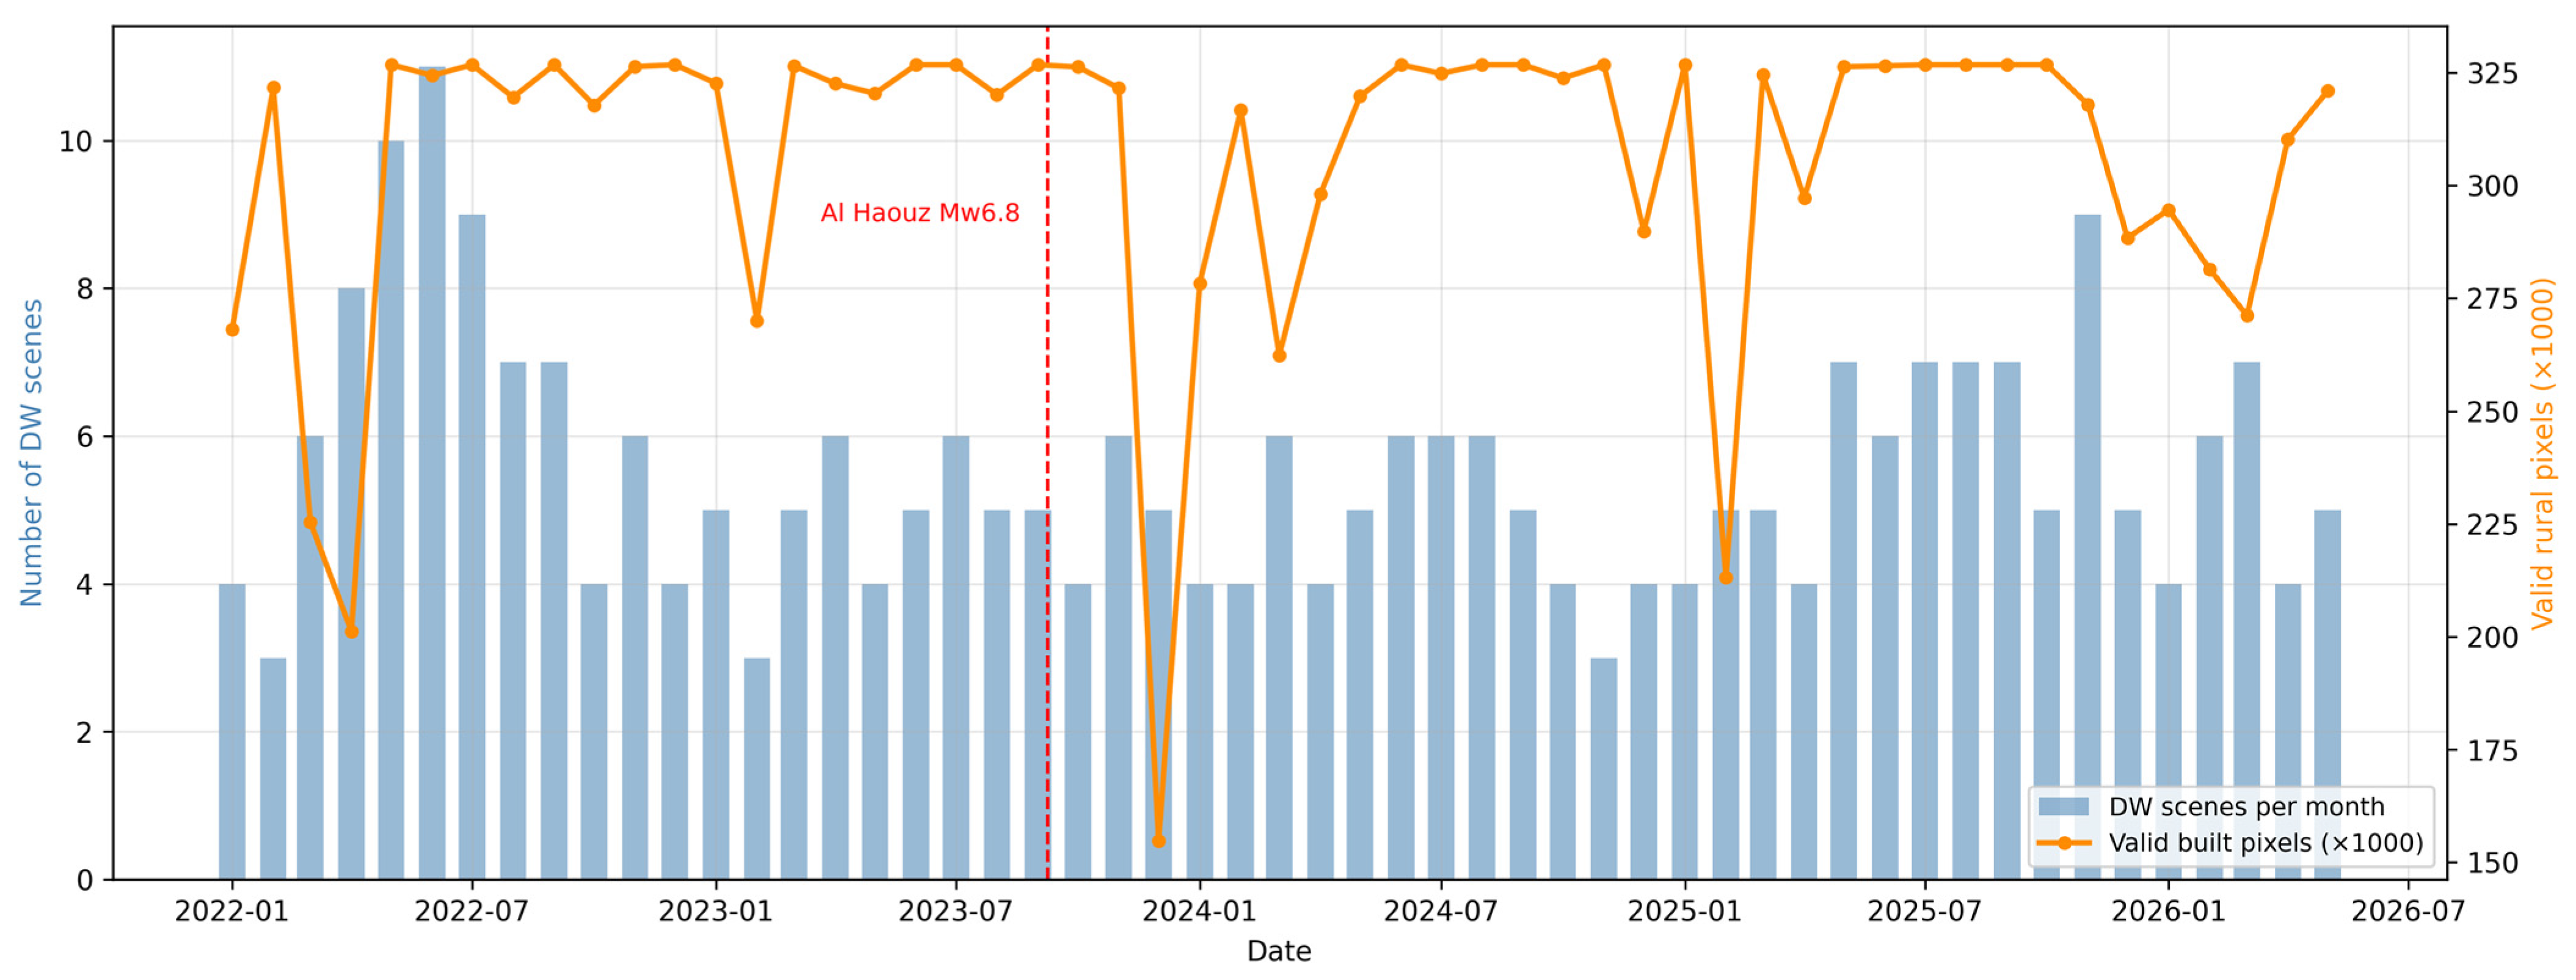
Figure A4.
Independent Sentinel-1 VV (blue) and VH (red) backscatter anomalies (dB) for the rural core zone. A pronounced coseismic backscatter spike coincides with the earthquake month (highlighted), confirming that an independent sensor captured the event, but over the full post-event period mean backscatter returned to baseline (ΔVV = +0.09 dB, p = 0.35; ΔVH = +0.01 dB, p = 0.92), indicating that coarse-aggregated C-band backscatter cannot resolve gradual, incremental rebuilding. The vertical dashed line marks the earthquake (8 September 2023).
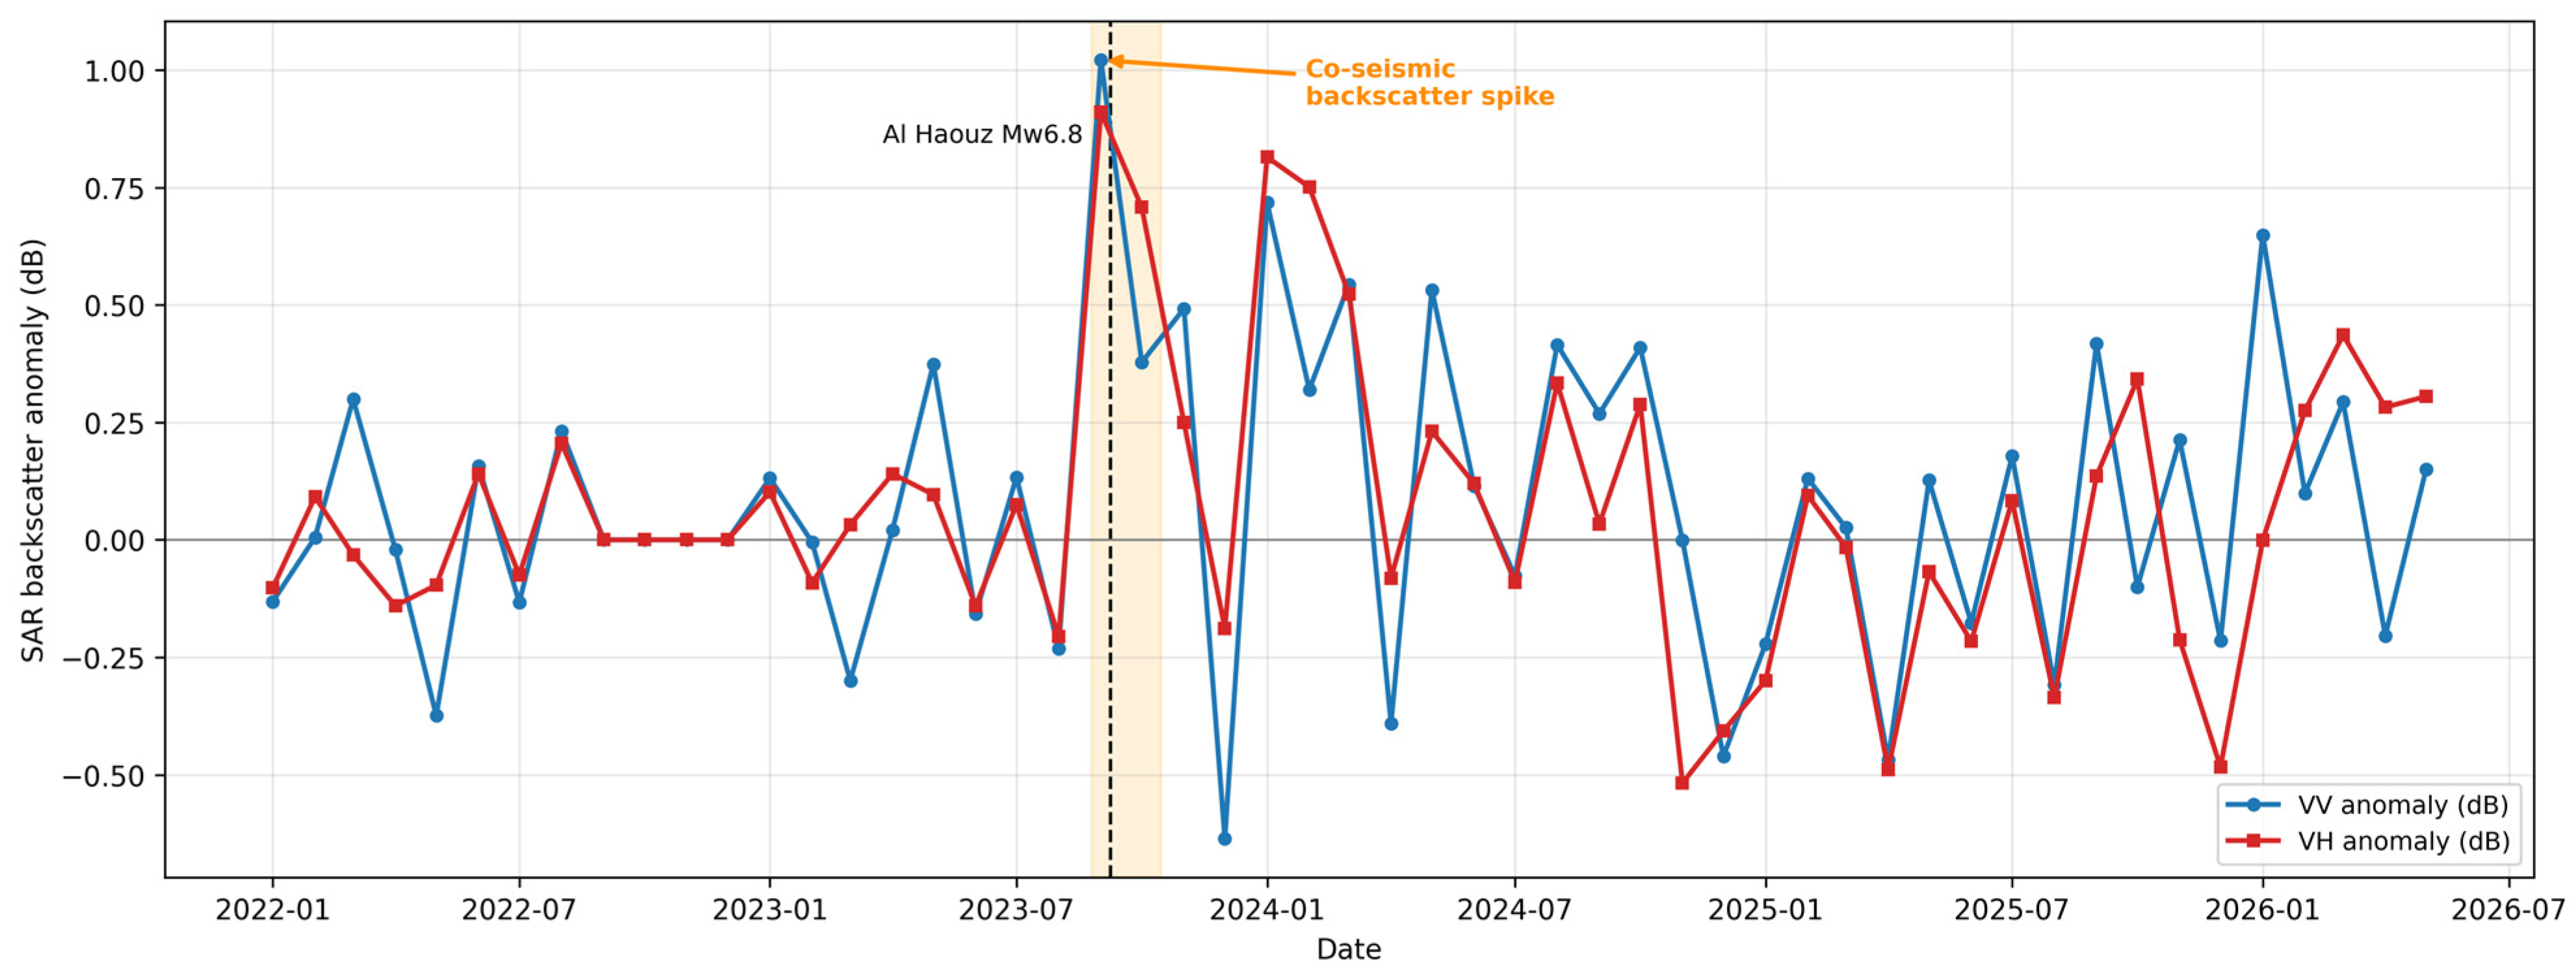
Figure A5.
Monthly decomposition of the integrated RAI into its weighted NTL (0.4·z), built-up (0.4·z), and precipitation-corrected NDVI (0.2·z) contributions; the black line shows the total RAI. The December 2024 peak is a coherent NTL-plus-built-up signal with a negligible NDVI contribution (see Table A7). The vertical dashed line marks the earthquake (8 September 2023).
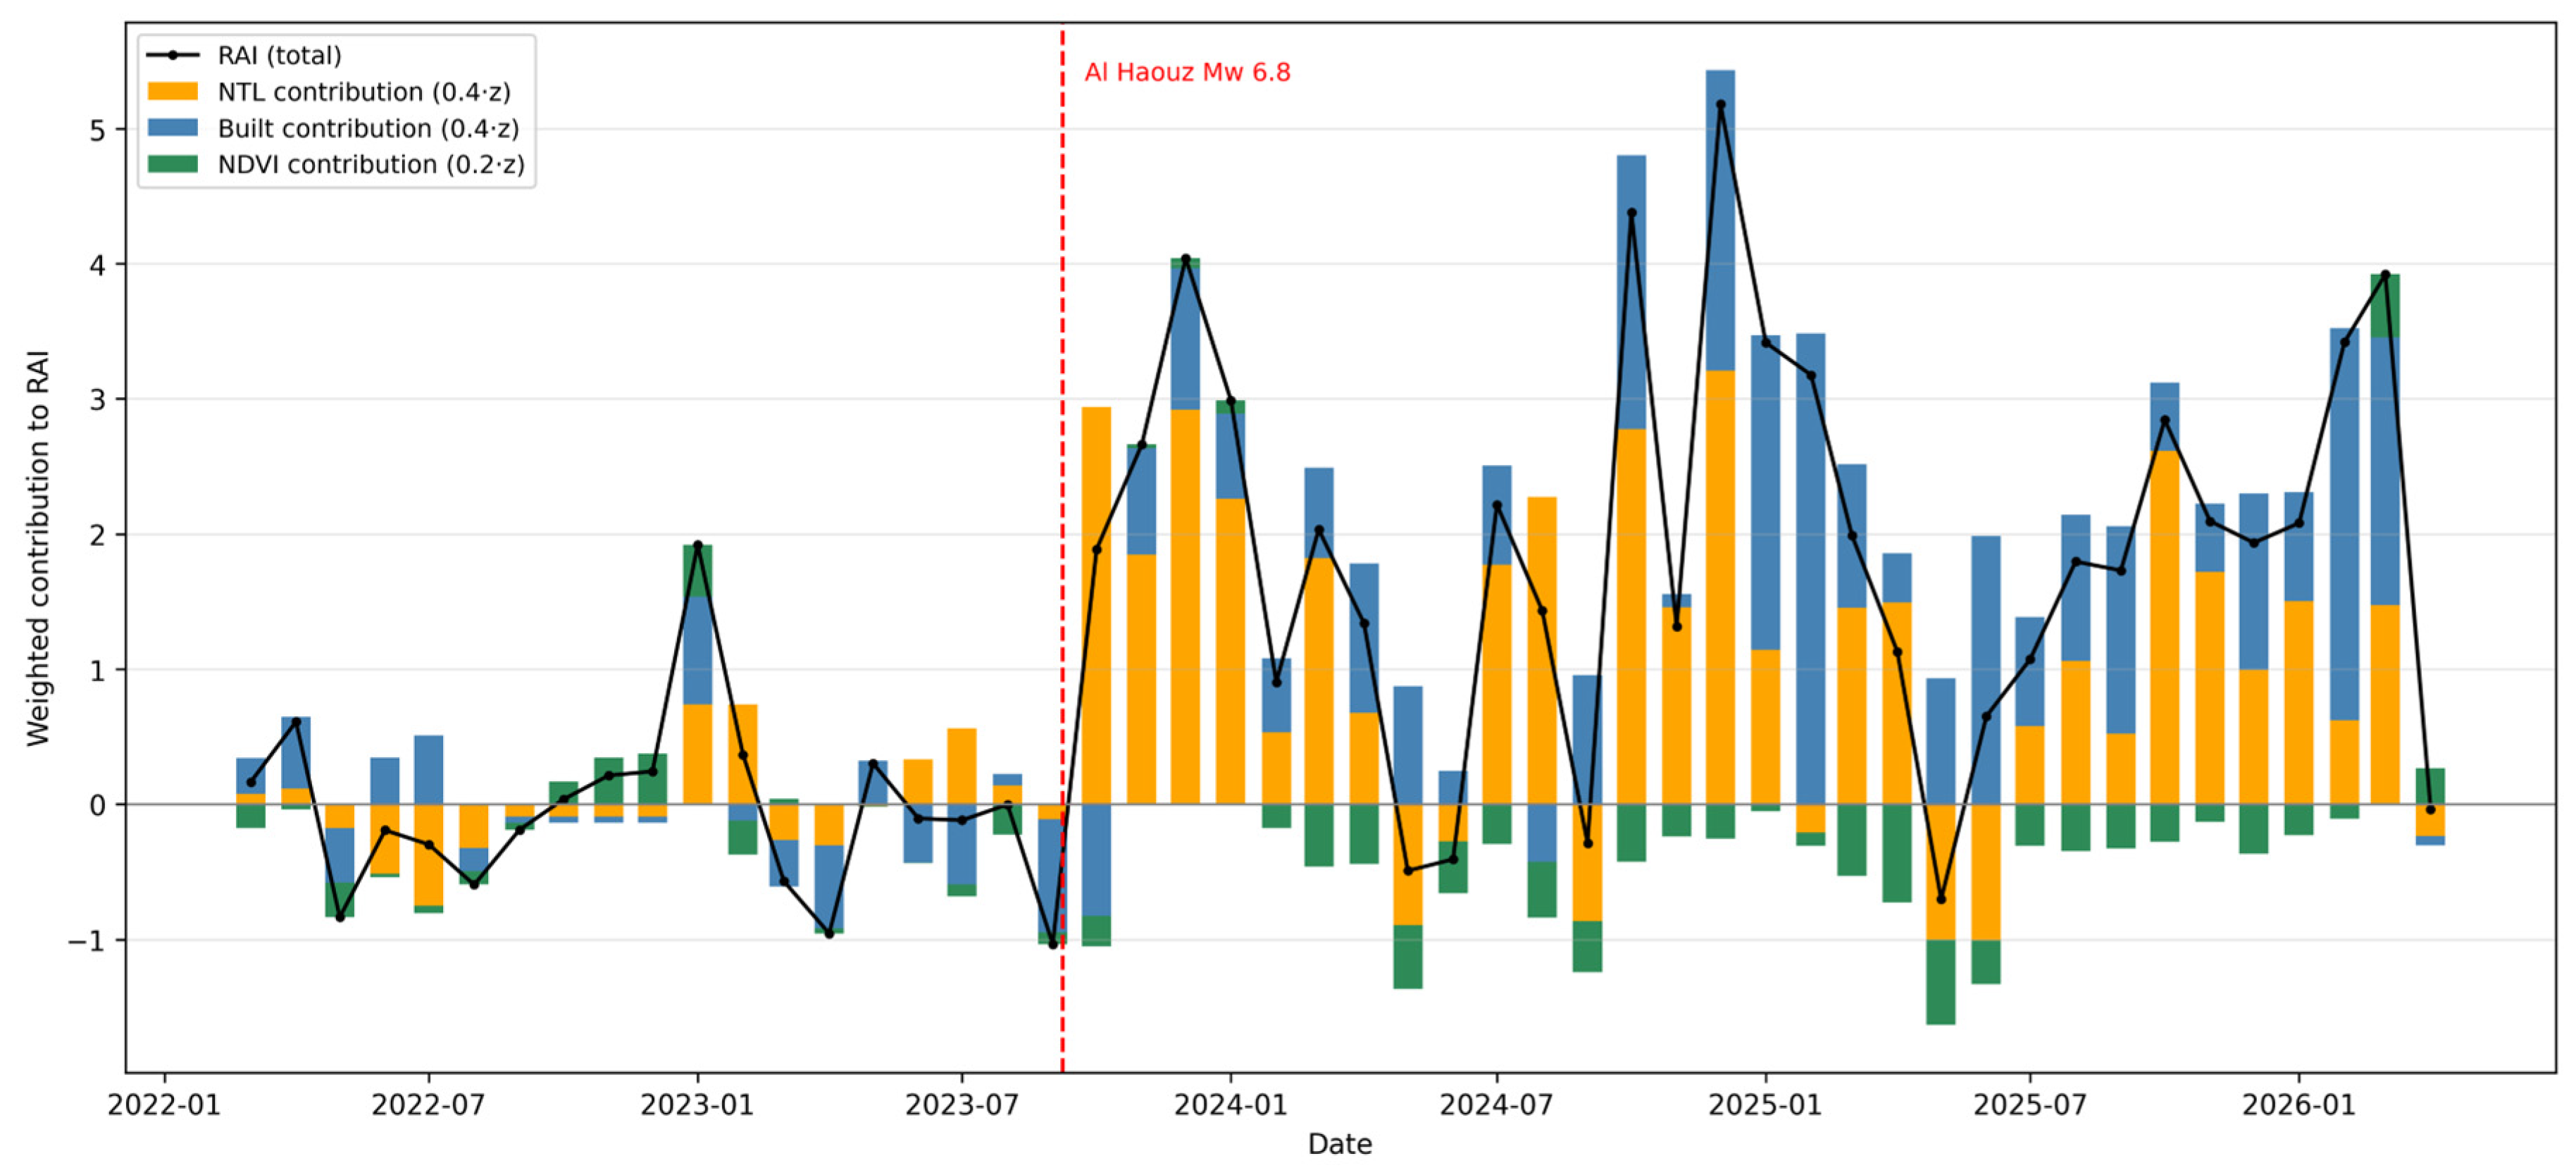
Figure A6.
Robustness of the RAI to the climatological baseline (operational 2022–2026 vs. long-term 2014–2023 VIIRS climatology; r = 0.86). Both peaks (operational December 2024, long-term February 2025) fall within the late-2024 to early-2025 recovery plateau (shaded). The vertical dashed line marks the earthquake (8 September 2023).
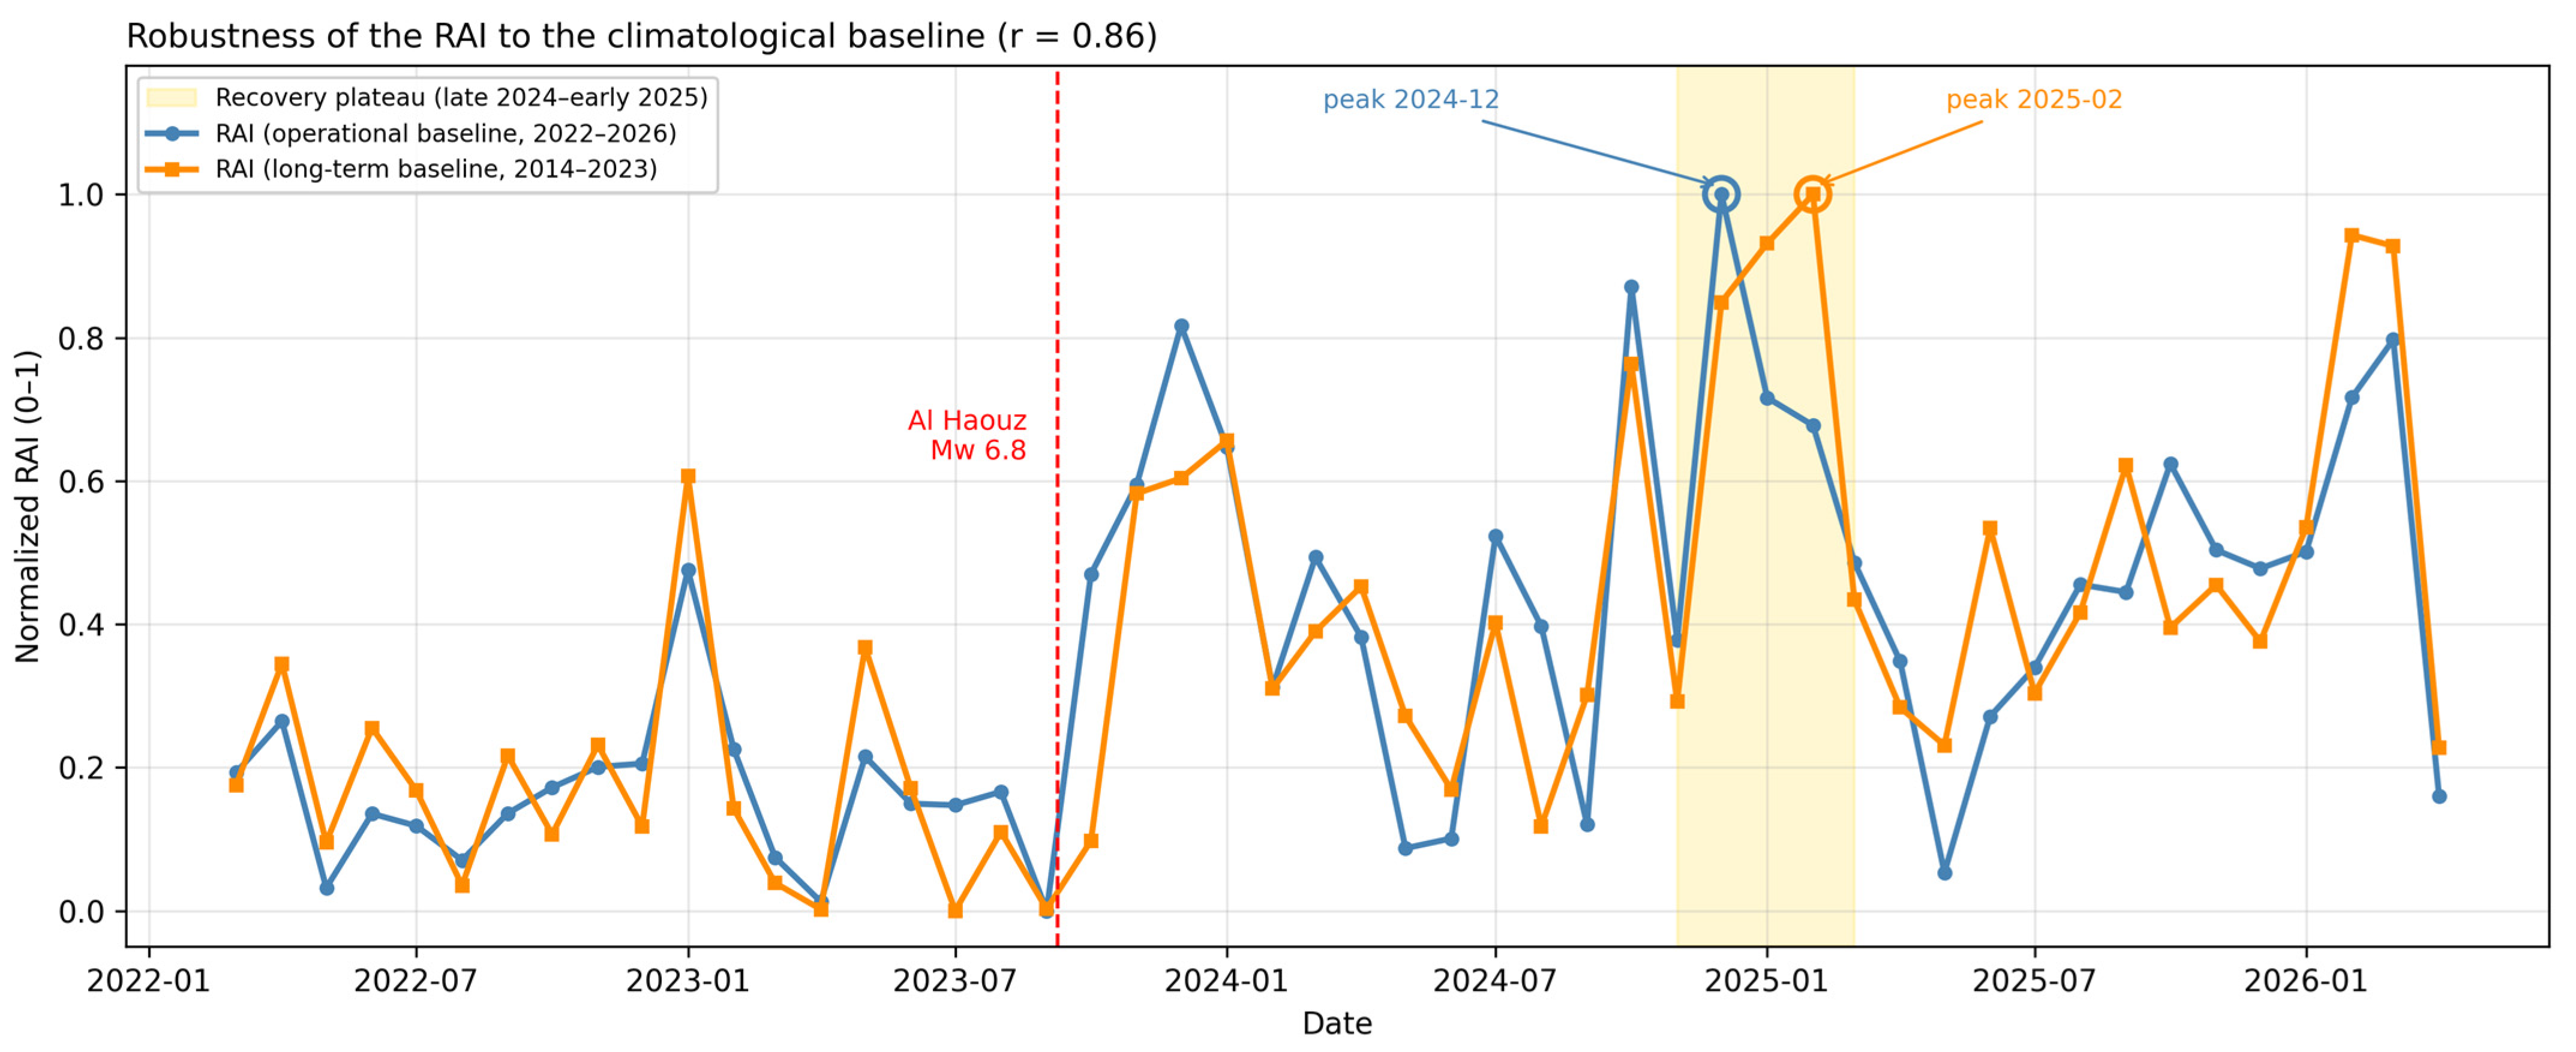
Figure A7.
Monte Carlo weight-sampling stability of the RAI. (a) Distribution of the RAI peak month across 10,000 random weight vectors summing to one (Dirichlet); the December 2024 peak is the most frequent outcome, and the great majority of draws fall within the late-2024–early-2025 reconstruction plateau. (b) Distribution of the post-event mean RAI across the random draws; the dashed line marks the value under the base weights (0.4/0.4/0.2). The post-event mean is positive in the overwhelming majority of draws, confirming that the recovery signal does not depend on the specific weight allocation.
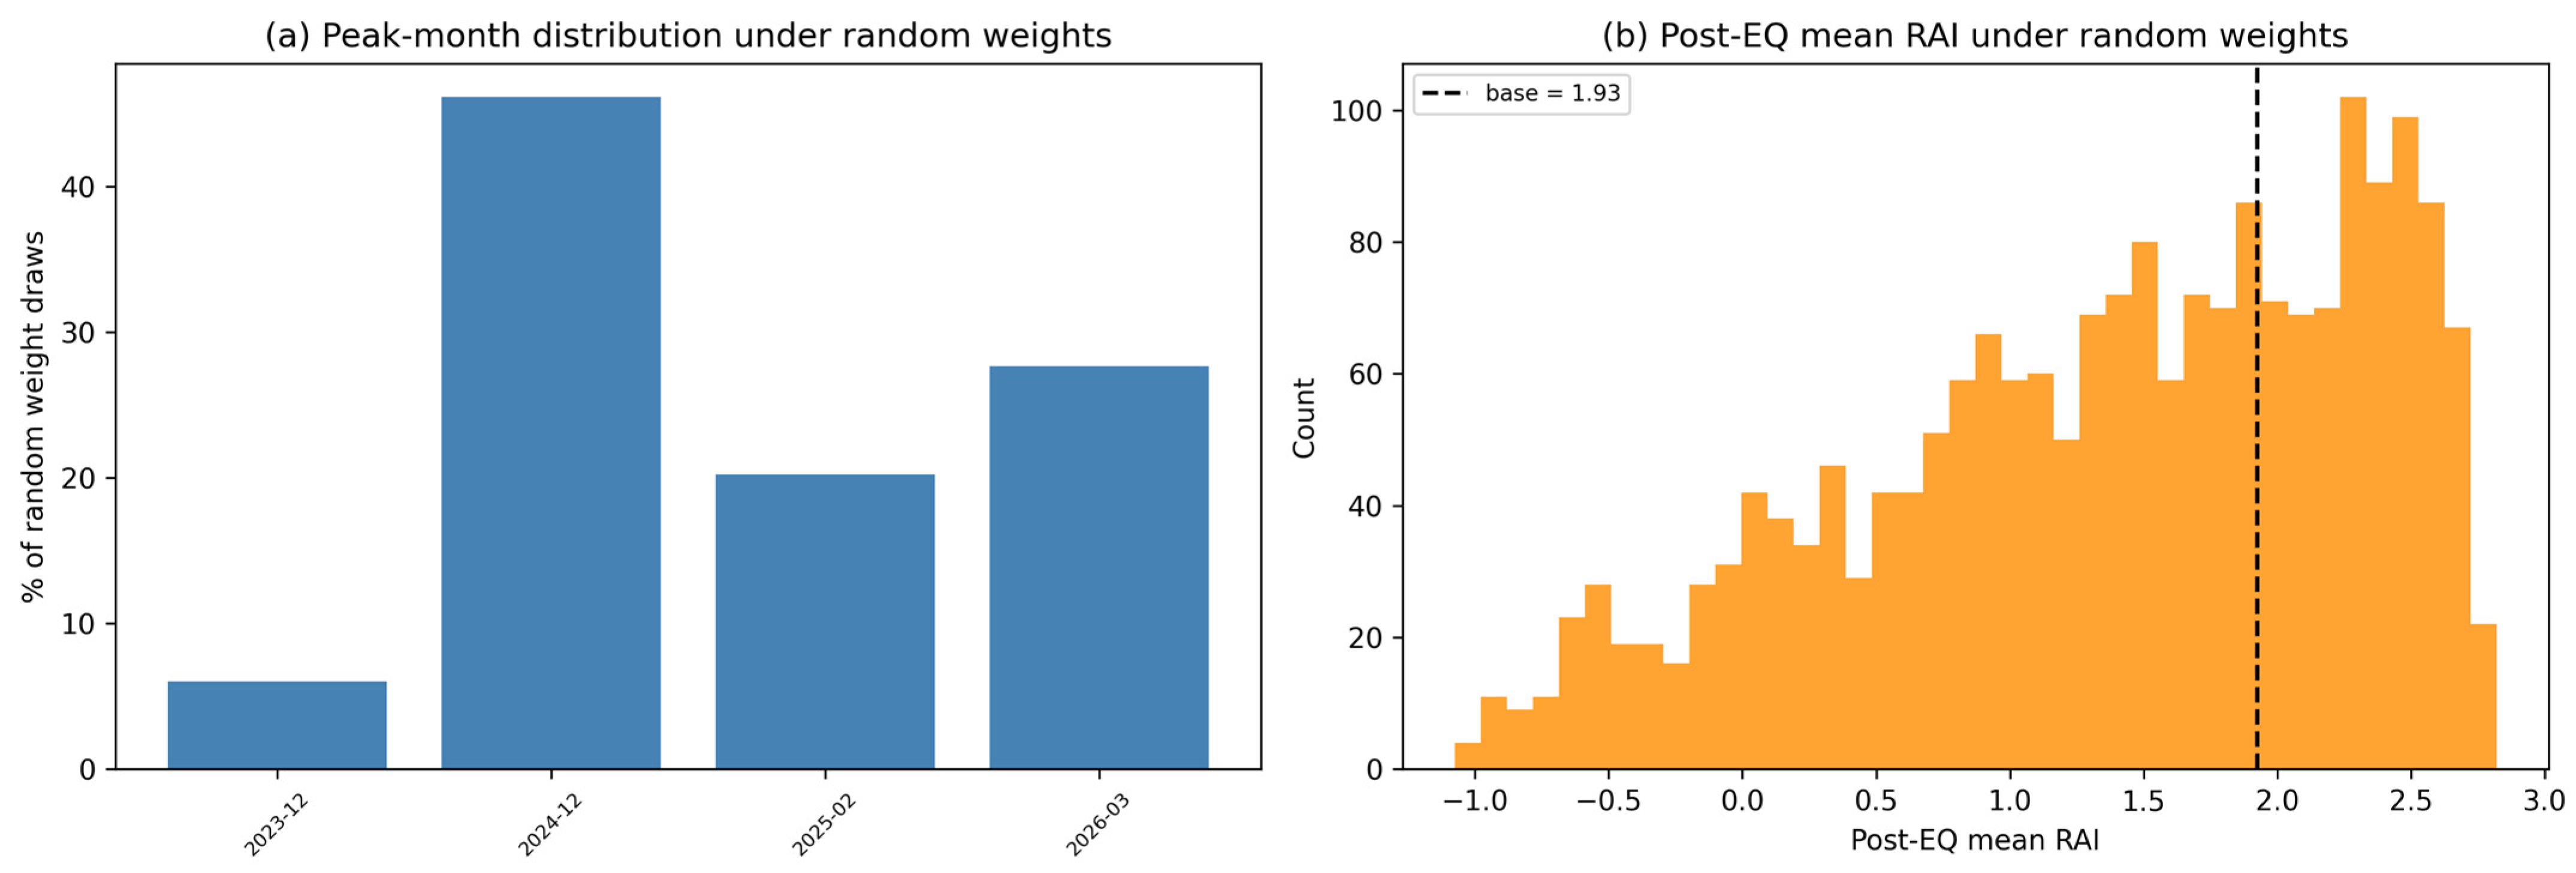
Table A1.
Sensitivity of the RAI to indicator weighting (NDVI weight 0.1/0.2/0.3 and equal 1/3), with interscenario correlation matrix.
Table A2.
Selection of the precipitation accumulation window for the NDVI regression (1/2/3/4/6-month cumulative); R2 peaks at the 3-month window with negligible AIC difference from the 2-month window.
Table A3.
Province-level regression of monthly NDVI on 3-month cumulative precipitation, showing heterogeneous coupling but negligible earthquake-attributable residual everywhere.
Table A4.
Province-level recovery ranking against potential drivers, with absolute pre-/post-earthquake NTL and built-up values and percentage changes.
Table A5.
Dynamic World coverage diagnostics for the rural core zone.
Table A6.
Independent Sentinel-1 SAR validation: pre-/post-earthquake VV/VH backscatter with t-tests and correlation with NTL and built-up signals.
Table A7.
Decomposition of the December 2024 RAI peak into NTL, built-up, and NDVI contributions.
Table A8.
Autocorrelation-aware lag analysis (block-bootstrap confidence intervals, block-permutation p-values, Holm correction) for the NTL–built-up cross-correlation.
Table A9.
Sensitivity of the integrated RAI to the climatological baseline (operational 2022–2026 vs. long-term 2014–2023 VIIRS climatology). Values are on the same scale as the main-text RAI.
Table A10.
Sensitivity of the post-earthquake mean RAI to the spatial domain (20/30/40 km buffers and 1500/3000 m2 rural-mask thresholds).
Table A11.
Validation of the Dynamic World built-up signal against classification noise (signal-to-noise ratio, pre/post t-test, correlation with observation density).
Table A12.
Monte Carlo sensitivity of the RAI to the indicator weighting. Random weight vectors summing to one were drawn for the three indicators (NTL, built-up, NDVI), and for each draw the RAI was recomputed to assess the stability of the December 2024 peak, the sign of the post-event mean, and the province ranking. Results are reported for the full weight space (10,000 Dirichlet draws) and for the plausible weight space in which the NDVI weight is capped at 0.4, consistent with its role as a low-weight environmental control (Section 2.3). The peak remained within the late-2024–early-2025 reconstruction plateau in 96.2% of plausible-space draws and the post-event mean was positive in 100%, confirming that the recovery signal does not depend on the specific weight allocation.
References
- Cai, H.; Lam, N.; Qiang, Y.; Zou, L.; Correll, R.M.; Mihunov, V. A synthesis of disaster resilience measurement methods and indices. Int. J. Disaster Risk Reduct. 2018, 31, 844–855. [Google Scholar] [CrossRef] [Scilit]
- Laurien, F.; Martin, J.G.C.; Mehryar, S. Climate and disaster resilience measurement: Persistent gaps in multiple hazards, methods, and practicability. Clim. Risk Manag. 2022, 37, 100443. [Google Scholar] [CrossRef] [Scilit]
- Marzi, S.; Mysiak, J.; Essenfelder, A.; Amadio, M.; Giove, S.; Fekete, A. Constructing a comprehensive disaster resilience index: The case of Italy. PLoS ONE 2019, 14, e0221585. [Google Scholar] [CrossRef] [Scilit] [PubMed]
- Borre, A.; Ghizzoni, T.; Trasforini, E.; Ottonelli, D.; Rudari, R.; Ferraris, L. Developing the Recovery Gap Index. Sustainability 2025, 17, 1044. [Google Scholar] [CrossRef] [Scilit]
- Saja, A.; Teo, M.; Goonetilleke, A.; Ziyath, A.M. An inclusive and adaptive framework for measuring social resilience to disasters. Int. J. Disaster Risk Reduct. 2018, 28, 862–873. [Google Scholar] [CrossRef] [Scilit]
- Mavhura, E.; Manyangadze, T.; Aryal, K. A composite inherent resilience index for Zimbabwe. Int. J. Disaster Risk Reduct. 2021, 57, 102152. [Google Scholar] [CrossRef] [Scilit]
- Yoon, D.; Kang, J.; Brody, S. A measurement of community disaster resilience in Korea. J. Environ. Plan. Manag. 2016, 59, 436–460. [Google Scholar] [CrossRef] [Scilit]
- Mohammadnazari, Z.; Mamoudan, M.M.; Alipour-Vaezi, M.; Aghsami, A.; Jolai, F.; Yazdani, M. Prioritizing Post-Disaster Reconstruction Projects Using an Integrated Multi-Criteria Decision-Making Approach: A Case Study. Buildings 2022, 12, 136. [Google Scholar] [CrossRef] [Scilit]
- Bakkensen, L.A.; Fox-Lent, C.; Read, L.; Linkov, I. Validating Resilience and Vulnerability Indices in the Context of Natural Disasters. Risk Anal. 2017, 37, 12677. [Google Scholar] [CrossRef] [Scilit] [PubMed]
- DeVries, B.; Huang, C.; Armston, J.; Huang, W.; Jones, J.W.; Lang, M. Rapid and robust monitoring of flood events using Sentinel-1 and Landsat data on the Google Earth Engine. Remote Sens. Environ. 2020, 240, 111664. [Google Scholar] [CrossRef] [Scilit]
- Cutter, S. The landscape of disaster resilience indicators in the USA. Nat. Hazards 2015, 80, 741–758. [Google Scholar] [CrossRef] [Scilit]
- Ghaffarian, S.; Farhadabad, A.R.; Kerle, N. Post-Disaster Recovery Monitoring with Google Earth Engine. Appl. Sci. 2020, 10, 4574. [Google Scholar] [CrossRef] [Scilit]
- Hird, J.N.; Kariyeva, J.; McDermid, G. Satellite Time Series and Google Earth Engine Democratize the Process of Forest-Recovery Monitoring over Large Areas. Remote Sens. 2021, 13, 4745. [Google Scholar] [CrossRef] [Scilit]
- Ghaffarian, S.; Kerle, N.; Filatova, T. Remote Sensing-Based Proxies for Urban Disaster Risk Management and Resilience: A Review. Remote Sens. 2018, 10, 1760. [Google Scholar] [CrossRef] [Scilit]
- Zhou, J.; Menenti, M.; Jia, L.; Gao, B.; Zhao, F.; Cui, Y.; Xiong, X.; Liu, X.; Li, D. A scalable software package for time series reconstruction of remote sensing datasets on the Google Earth Engine platform. Int. J. Digit. Earth 2023, 16, 988–1007. [Google Scholar] [CrossRef] [Scilit]
- Kwong, I.H.Y.; Wong, F.K.; Fung, T. Automatic Mapping and Monitoring of Marine Water Quality Parameters in Hong Kong Using Sentinel-2 Image Time-Series and Google Earth Engine Cloud Computing. Front. Mar. Sci. 2022, 9, 871470. [Google Scholar] [CrossRef] [Scilit]
- Hurtado, W.A.V.; Tapete, D. Monitoring the Recovery Process After Major Hydrological Disasters with GIS, Change Detection and Open and Free Multi-Sensor Satellite Imagery. Water 2025, 17, 2902. [Google Scholar] [CrossRef] [Scilit]
- Sheykhmousa, M.; Kerle, N.; Kuffer, M.; Ghaffarian, S. Post-Disaster Recovery Assessment with Machine Learning-Derived Land Cover and Land Use Information. Remote Sens. 2019, 11, 1174. [Google Scholar] [CrossRef] [Scilit]
- Kang, J.; Wang, Z.; Cheng, H.; Wang, J.; Liu, X. Remote Sensing Land Use Evolution in Earthquake-Stricken Regions of Wenchuan County, China. Sustainability 2022, 14, 9721. [Google Scholar] [CrossRef] [Scilit]
- Liu, W.; Guan, H.; Hesp, P.; Batelaan, O. Remote sensing delineation of wildfire spatial extents and post-fire recovery along a semi-arid climate gradient. Ecol. Inform. 2023, 78, 102304. [Google Scholar] [CrossRef] [Scilit]
- Wang, J.; Wang, Z.; Cheng, H.; Kang, J.; Liu, X. Land Cover Changing Pattern in Pre- and Post-Earthquake Affected Area from Remote Sensing Data: A Case of Lushan County, Sichuan Province. Land 2022, 11, 1205. [Google Scholar] [CrossRef] [Scilit]
- Derakhshan, S.; Cutter, S.; Wang, C. Remote Sensing Derived Indices for Tracking Urban Land Surface Change in Case of Earthquake Recovery. Remote Sens. 2020, 12, 895. [Google Scholar] [CrossRef] [Scilit]
- Ghaffarian, S.; Emtehani, S. Monitoring Urban Deprived Areas with Remote Sensing and Machine Learning in Case of Disaster Recovery. Climate 2021, 9, 58. [Google Scholar] [CrossRef] [Scilit]
- Volke, M.I.; Abarca-del-Rio, R.; Warner, T.A. Cost-effective disaster-induced land cover analysis: A semi-automatic methodology using machine learning and satellite imagery. Int. J. Remote Sens. 2024, 45, 279–305. [Google Scholar] [CrossRef] [Scilit]
- Contreras, D.; Blaschke, T.; Tiede, D.; Jilge, M. Monitoring recovery after earthquakes through the integration of remote sensing, GIS, and ground observations: The case of L’Aquila (Italy). Cartogr. Geogr. Inf. Sci. 2016, 43, 115–133. [Google Scholar] [CrossRef] [Scilit]
- Ghaffarian, S.; Roy, D.; Filatova, T.; Kerle, N. Agent-based modelling of post-disaster recovery with remote sensing data. Int. J. Disaster Risk Reduct. 2021, 60, 102285. [Google Scholar] [CrossRef] [Scilit]
- Mo, K.; Chen, Q.; Chen, C.; Zhang, J.; Wang, L.; Bao, Z. Spatiotemporal variation of correlation between vegetation cover and precipitation in an arid mountain-oasis river basin in northwest China. J. Hydrol. 2019, 574, 138–147. [Google Scholar] [CrossRef] [Scilit]
- Almalki, R.; Khaki, M.; Saco, P.; Rodríguez, J.F. Monitoring and Mapping Vegetation Cover Changes in Arid and Semi-Arid Areas Using Remote Sensing Technology: A Review. Remote Sens. 2022, 14, 5143. [Google Scholar] [CrossRef] [Scilit]
- Sanz, E.; Saa-Requejo, A.; Díaz-Ambrona, C.H.; Ruíz-Ramos, M.; Rodríguez, A.; Iglesias, E.; Esteve, P.; Soriano, B.; Tarquis, A. Normalized Difference Vegetation Index Temporal Responses to Temperature and Precipitation in Arid Rangelands. Remote Sens. 2021, 13, 840. [Google Scholar] [CrossRef] [Scilit]
- Mi, H.; Cui, J.; Ning, Y.; Liu, Y.; Zhu, M. Post-earthquake recovery monitoring and driving factors analysis of the 2014 Ludian Ms6.5 earthquake in Yunnan, China based on LUCC. Stoch. Environ. Res. Risk Assess. 2023, 37, 4991–5007. [Google Scholar] [CrossRef] [Scilit]
- Uddin, M.S.; Haque, C.E.; Khan, M.N.; Doberstein, B.; Cox, R.S. Community resilience and livelihoods reconstruction in coastal communities of Bangladesh. Int. J. Disaster Risk Reduct. 2021, 63, 102444. [Google Scholar] [CrossRef] [Scilit]
- Li, F.; Liao, S.; Fu, X.; Liu, T. NPP-VIIRS Nighttime Lights Illustrate the Post-Earthquake Damage and Subsequent Economic Recovery in Hatay Province, Turkey. ISPRS Int. J. Geo.Inf. 2025, 14, 149. [Google Scholar] [CrossRef] [Scilit]
- Gibson, J.; Jiang, Y.; Zhang, X.; Boe-Gibson, G. Are Disaster Impact Estimates Distorted by Errors in Popular Night-Time Lights Data? Econ. Disasters Clim. Change 2024, 8, 391–416. [Google Scholar] [CrossRef] [Scilit]
- Yeck, W.; Hatem, A.; Goldberg, D.; Barnhart, W.; Jobe, J.T.A.; Shelly, D.; Villaseñor, A.; Benz, H.; Earle, P. Rapid Source Characterization of the 2023 Mw 6.8 Al Haouz, Morocco, Earthquake. Seism. Rec. 2023, 3, 357–366. [Google Scholar] [CrossRef] [Scilit]
- Achbani, A.; Bouchriti, Y.; Sine, H.; Kharbach, A.; Boukrim, M.; Rida, J.; Ougjij, A.A.; Sine, H. Key Takeaways from the Al Haouz Earthquake, Morocco, 2023. Disaster Med. Public Health Prep. 2024, 18, e88. [Google Scholar] [CrossRef] [Scilit] [PubMed]
- Imtiaz, A.; Saloustros, S.; Beqiraj, M.; Cortés, G.; Devaux, M.; Lattion, E.; Zhu, Y.; Sehaqui, H. Understanding building damage through the lens of the Swiss post-seismic reconnaissance mission of 2023 Al Haouz, Morocco, earthquake. Sci. Rep. 2025, 15, 16587. [Google Scholar] [CrossRef] [Scilit] [PubMed]
- González-Rodrigo, B.; Navas-Sánchez, L.; Rejas-Ayuga, J.G.; Hernández-Rubio, O.; Benito, M.B. Preliminary Geospatial and In Situ Reconnaissance of the 8 September 2023 Moroccan Atlas Earthquake Damage. Buildings 2024, 14, 693. [Google Scholar] [CrossRef] [Scilit]
- Haddad, E.A.; El Aynaoui, K.; Ait Ali, A.; Arbouch, M.; Saoudi, H.; Araujo, I.F. Assessing the Economic Impacts of the Al-Haouz Earthquake: Damages and Recovery Strategy; Research Paper N 07/24; Policy Center for the New South: Rabat, Morocco, 2024. [Google Scholar]
- Lee, S.-J.; Kim, J.; Heo, I.-S.; Yun, H.-S. Recovery-Activity Index (RAI)—Al Haouz Earthquake (Revision Code); Version 1.0.0; Zenodo: Geneva, Switzerland, 2026. [Google Scholar]

Disclaimer/Publisher’s Note: The statements, opinions and data contained in all publications are solely those of the individual author(s) and contributor(s) and not of MDPI and/or the editor(s). MDPI and/or the editor(s) disclaim responsibility for any injury to people or property resulting from any ideas, methods, instructions or products referred to in the content. |
© 2026 by the authors. Licensee MDPI, Basel, Switzerland. This article is an open access article distributed under the terms and conditions of the Creative Commons Attribution (CC BY) license.