Article

Study on the Nexus Effects of Water Conservation, Pollutant Control and Carbon Emissions of a Multi-Source Water Supply System

1
Zhejiang Institute of Hydraulics and Estuary (Zhejiang Institute of Marine Planning and Design), Hangzhou 310020, China
2
Zhejiang Key Laboratory of River-Lake Water Network Health Restoration, Hangzhou 310000, China
*
Author to whom correspondence should be addressed.
Sustainability 2026, 18(13), 6556; https://doi.org/10.3390/su18136556
Submission received: 21 May 2026 / Revised: 17 June 2026 / Accepted: 24 June 2026 / Published: 28 June 2026

Abstract

Water scarcity and the greenhouse effect are two global issues that have attracted researchers’ attentions for decades. A multi-source water supply system has been established in a typical Chinese city experiencing a water shortage—namely, Yiwu City—in order to solve the city’s water shortage problem. Our study focuses on the integrated analysis of water conservation, pollutant control and carbon emissions in the multi-source water supply system, and a comprehensive model is derived in order to simulate these three factors together. It is confirmed that the multi-source water supply system has significantly improved the efficiency of local water allocation and the water supply guarantee rate, considering that the replacement rate of reclaimed water varies from 0% to 50%. It is anticipated that water conservation and pollutant control can be achieved simultaneously in Yiwu City, although accomplishing these goals and also reducing carbon emissions is difficult due to the significant impact of local topography and geomorphology. When the proportion of reclaimed water used in landscape ecological water increases from 0 to 50%, COD emissions decrease by 656 t/a, NH3-N emissions decrease by 11 t/a, and the corresponding carbon emissions increase by 0.096 × 10⁴ t CO2/a. The simulation results of this study provide important references for addressing water shortage issues and achieving carbon emission reduction goals in Yiwu City and other similar cities experiencing water shortages in the future.

1. Introduction

Water scarcity and the greenhouse effect are two key issues that have attracted the attention of previous researchers [1,2,3,4]. In order to alleviate local water scarcity [5,6], multi-source water supply systems with multilevel water quality have been widely accepted as a novel local water management tool around the world. These systems can enhance the utilization efficiency of local water supplies by allocating different water sources for different purposes, such as for agricultural and industrial use [4,5,6,7,8,9]. Additionally, reducing sewage discharge and alleviating pollutant emissions can both be achieved by utilizing a multi-source water supply system. As a typical city experiencing a water shortage [7,8,9,10,11], Yiwu City requires a multi-source water supply to ensure local water security, which is critical for urban residents and local industry. In this study, the nexus effects connecting water conservation, pollutant control, and carbon emissions are evaluated and analyzed. Our evaluation will not only be helpful for local water resource management, but will also demonstrate the advantages of these supply systems in improving both the local environment and economy over the next decades [12,13,14,15,16].
The nexus effects of water conservation, pollutant control and carbon emissions from a multi-source water supply system represent a vital research topic, as water environment conservation and carbon emission reduction are critical issues around the world [7,12,15]. As indicated by recent studies, new computational methods such as the finite concentration method (FCM) can simulate carbon monoxide and carbon dioxide in a variety of different environmental situations [14,15,16,17,18,19,20]. Based on these developments, a numerical model is derived in this study. Through the numerical simulation and analysis of the water conservation, pollutant control and carbon emissions of a multi-source water supply system in Yiwu City, we demonstrate that the mutual coordination of water conservation and pollutant control can be achieved simultaneously through the optimized allocation of different water sources [5,6,7,8,9,21,22,23,24]. However, the coordination of all three main factors, namely water conservation, pollutant control and carbon emission reduction, is infeasible to achieve synchronously due to the local terrain, topography and spatial layout of water sources, all of which have significant impacts on carbon emission intensity [6,15,19]. Additionally, the local carbon emission intensities of the water supply system’s sources can be ranked from small to large based on different levels of high-quality water source replacement. General water sources contribute the least carbon emissions; high-quality water sources, such as reservoir water, contribute medium carbon emissions; and reclaimed water sources lead to the highest carbon emissions [12,13,14,15,16,17,18]. On the other hand, it is anticipated that utilizing more reclaimed water will lead to better water conservation and pollutant control despite the greater carbon emission scenario, as indicated by previous research [9,10,11,12].

2. Materials and Methods

2.1. Study Area

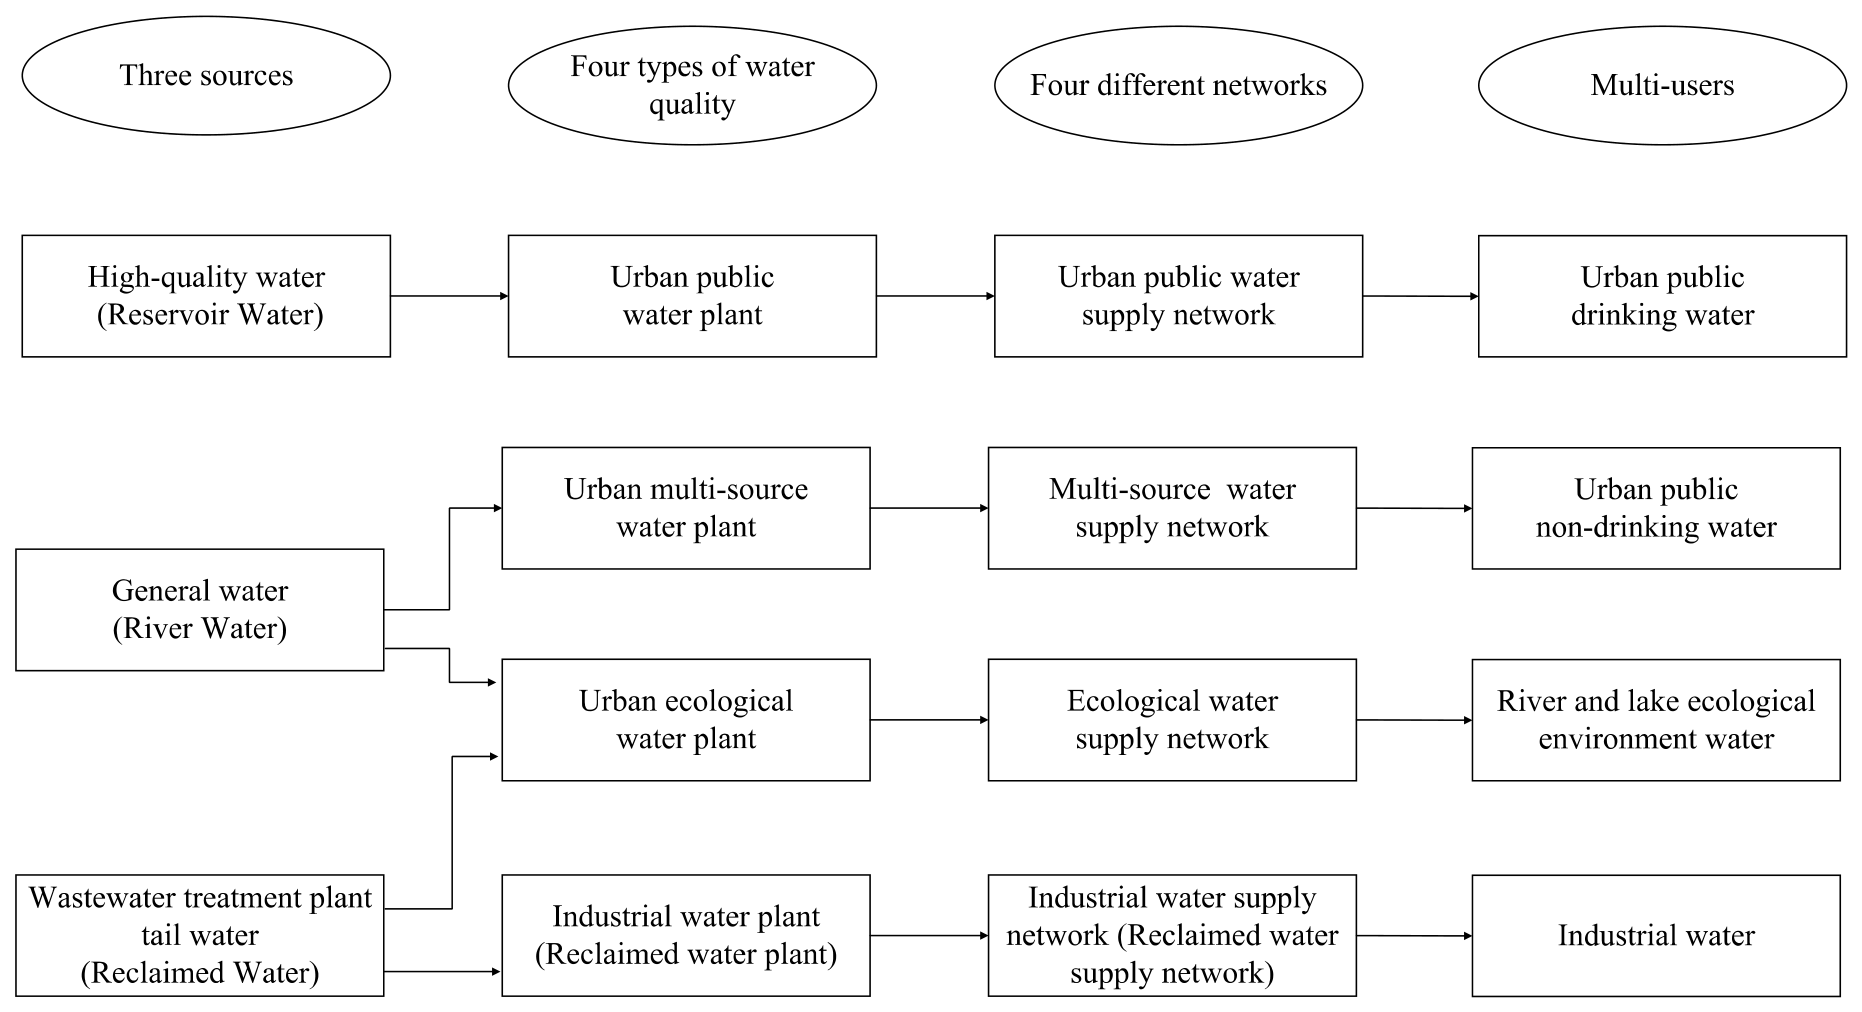
Yiwu City, located in the central part of Zhejiang Province, is close to the east coast of China. Due to its dense population and highly developed economy, the imbalance between the city’s water demand and supply has become increasingly prominent. Efforts have been made to overcome these water supply barriers: the city’s government constructed a local multi-source water supply system in 2010 in order to optimize different water resources for various purposes. Specifically, high-quality water resources are used for urban residents’ drinking water, while general river water is used in industrial processes and contributes to water in rivers and lakes. Additionally, reclaimed water is widely used in toilet flushing, road cleaning and small- and medium-sized rivers. Indeed, Yiwu City has constructed the most efficient water supply system in the eastern area of China, demonstrating its effective function in promoting optimal local water usage over the past decades.

2.2. Methodology

Firstly, water-saving refers to a reduction in the use of high-quality reservoir water and river water by local residents due to the increasing use of reclaimed water from sewage treatment plants, which is recognized as a good alternative to high-quality water [18,19,20,21,22,23]. Secondly, pollutant control refers to the use of reclaimed water, which reduces the amount of wastewater discharge and improves the water quality of the river network in Yiwu City [20,21,22,23,24]. Thirdly, carbon emission effects refer to the carbon dioxide emissions from the local multi-source water supply system, which is also related to the local water demand and the local water supply capacity [20,21,22,23,24,25].
Figure 1 shows that the relationship between water conservation, pollutant control and carbon emissions is complex. The nexus effects among them are the focus of this study due to the uncertainty and substitutability of local water demand. As indicated in Figure 1, various kinds of local water consumers participate in the complex local multi-source water supply system [26,27,28,29,30,31,32].
In order to clarify the relationships between water conservation, pollutant control and carbon emissions and their nexus effects in the multi-source water supply system in Yiwu City, a numerical model combining local water demand and supply, pollutant discharge and carbon emission intensity is developed in this study. It is assumed that the capacity of the hydraulic control structures in Yiwu City will not change during their life cycle, remaining a constant during the simulation [24,25,26].
(1)
General equations
First, a water supply function is introduced to determine the maximum water supply capacity of the local multi-source water supply system, given as [6,22]
f 1 = max i = 1 2 W i max W i
where Wimax and Wi are the maximum water supply capacity (m3/s) and the actual water supply capacity (m3/s), respectively. The physical meaning of Equation (1) is to ensure that the maximum water supply capacity will not exceed the actual water supply capacity. Hence, the limitation of the local water supply capacity is confirmed as the basic condition of the general model.
Second, a pollutant control function is used to ensure that the inflow of major pollutants, which is represented by chemical oxygen demand (COD) and ammonia nitrogen (NH3-N), will not exceed the pollutant carrying capacity of the local rivers in Yiwu City. The pollutant control function is given as
f 2 = P Q j 0 P Q j 0
where PQ is the amount of the specific pollutant (t/a). The superscript 0 represents the pollutant carrying capacity for COD and NH3-N, respectively.
Third, a carbon emissions function is introduced to calculate the total carbon emissions from the multi-source water supply system, given as
f 3 = min i = 1 3 k = 1 4 w i k × α i k
where αik is the carbon emission intensity (t/m3) of the different water consumers. Additionally, the energy and material consumption of the entire social water cycle process, including the water source, water supply, water usage and drainage, are calculated using Equations (2) and (3) [22,24,25,26,27,28,29].
(2)
Constraints
(1) The local water guarantee rate is given as
p k p k 0
where pk is the guarantee rate (%), and the superscript 0 indicates the current status.
(2) The balance between local water supply and demand is given as
W i = k = 1 w i k / 1 β k
W w o = i = 1 k = 1 w i k × δ 0
where wik is the water demand of different water consumers, β is the water-saving coefficient, and δ is the water consumption coefficient. The relationship between the local water demand and water supply is calculated based on Equations (4)–(6).
(3) The water demand constraint condition is set to represent the total water volume allocated to different industries. In this study, it basically describes the limits of the water demand and water supply during the simulation [28,29,30,31].
(4) The pollutant control condition represents local pollutants discharged into the river network, given as
Q j = A × φ 1 j + W w o o u t × φ 2 j
where A is the local area (km2), and the other symbols are the same as above.
(5) The water quantity condition is given as
W Q i W Q i max
where WQ is the water quantity (104 m3), and WQmax is the local maximum water quantity (104 m3).
(6) The maximum local multi-source water supply capacity and the local water demand are both considered in this study, and are introduced to guarantee that the configured water volume of all the water supply projects will not exceed their maximum water supply capacity, as shown in Equations (7) and (8). A non-negative constraint is additionally included in the numerical model [32,33,34,35,36,37].

2.3. Simulation Algorithm

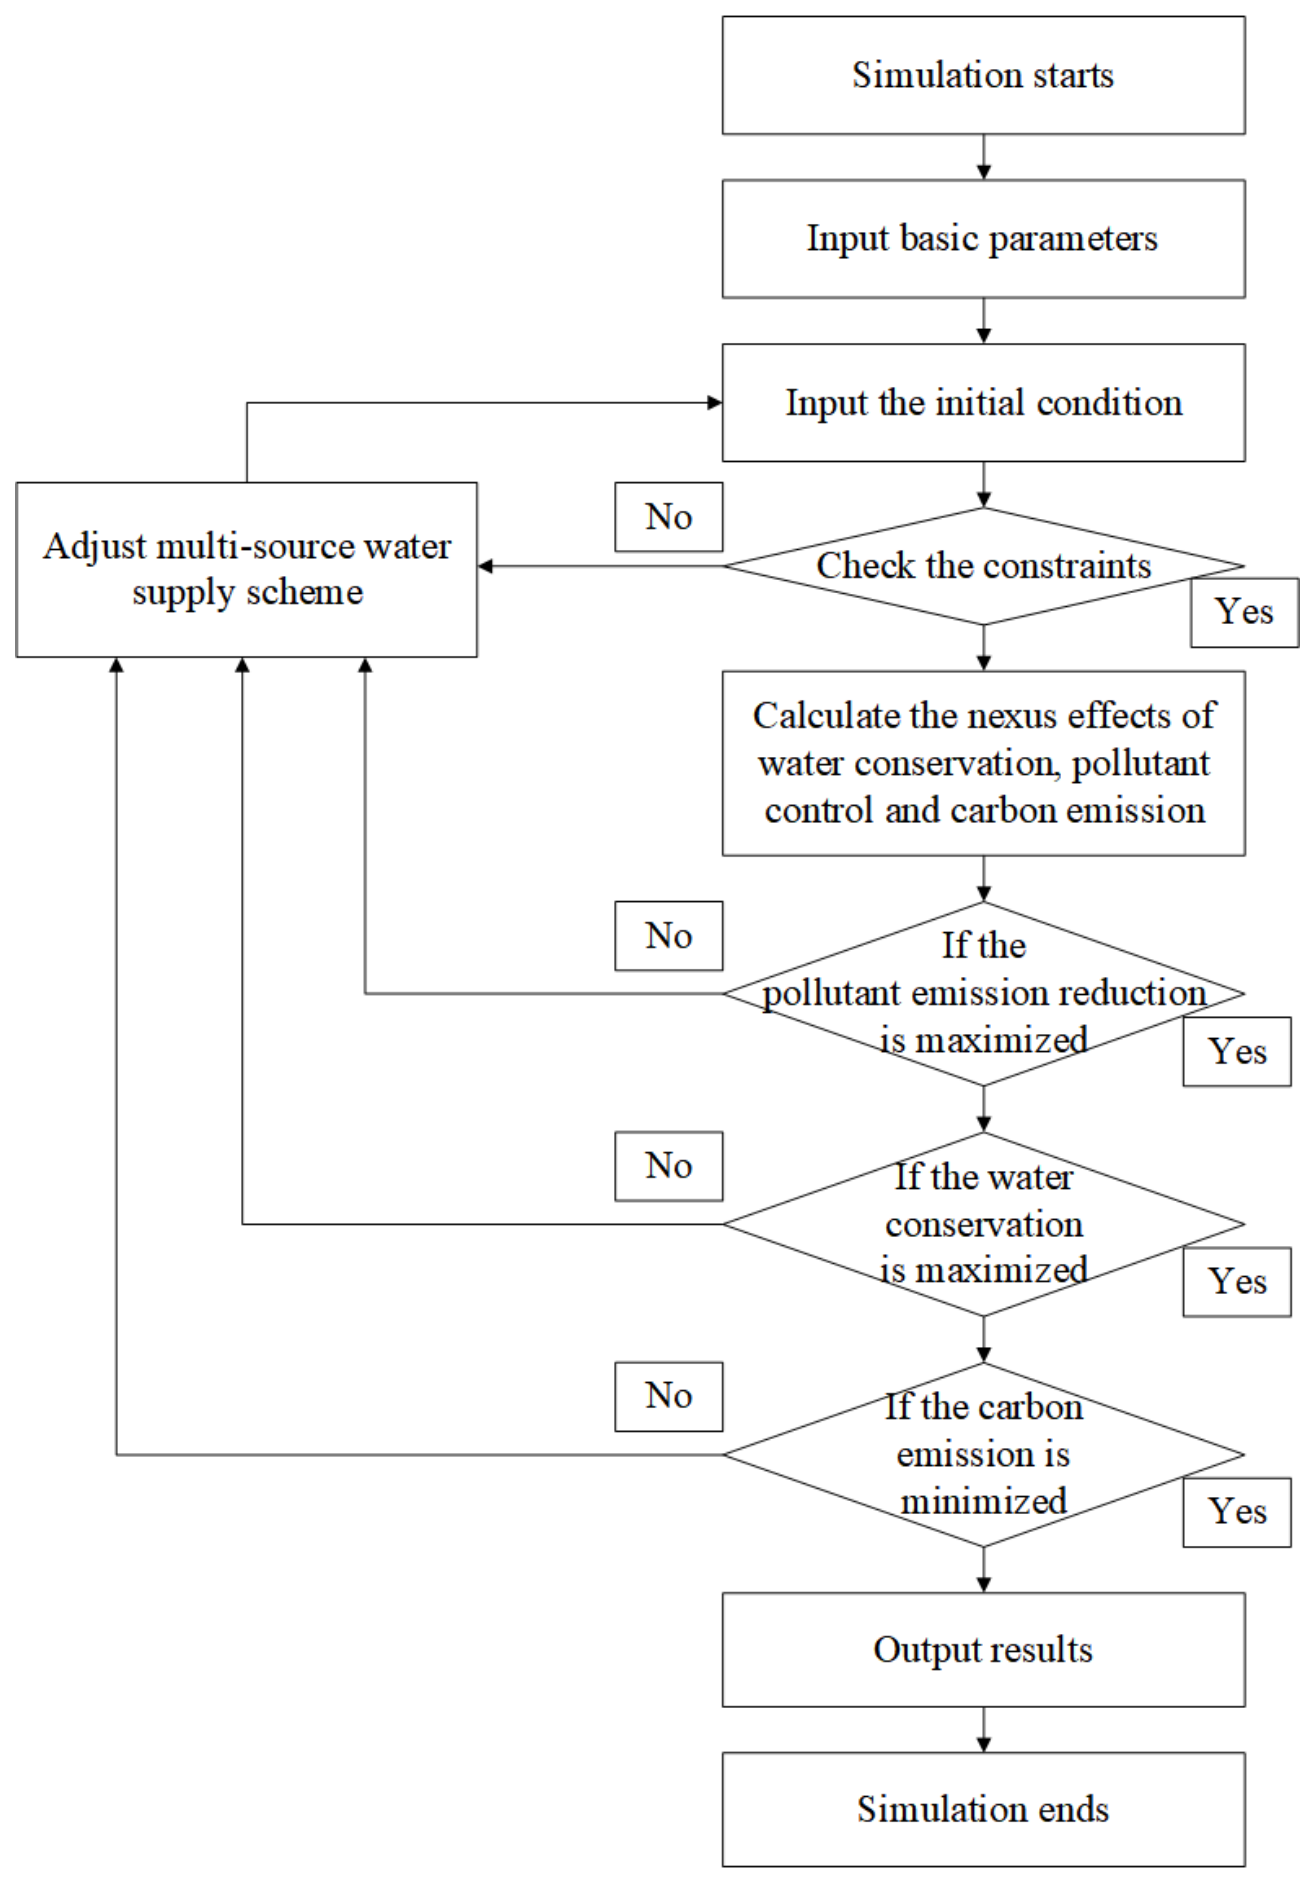
The numerical model of the local multi-source water supply system is developed based on the algorithm shown in Figure 2. A i7 CPU and 32 GB memory Work Station is used in this study to solve the model. The verification data used in this model were obtained from the local government statistical yearbook for the years 2019 to 2024 [35]. The model algorithm is shown in Figure 2, including the input of the parameters, the initial conditions and the constrains. The model is used to calculate the nexus effects of water conservation, pollutant control and carbon emissions together. If the model evaluation criteria are satisfied, the final allocation scheme will be selected; otherwise, the model will recalculate until all the criteria are met.

3. Simulation Characteristics

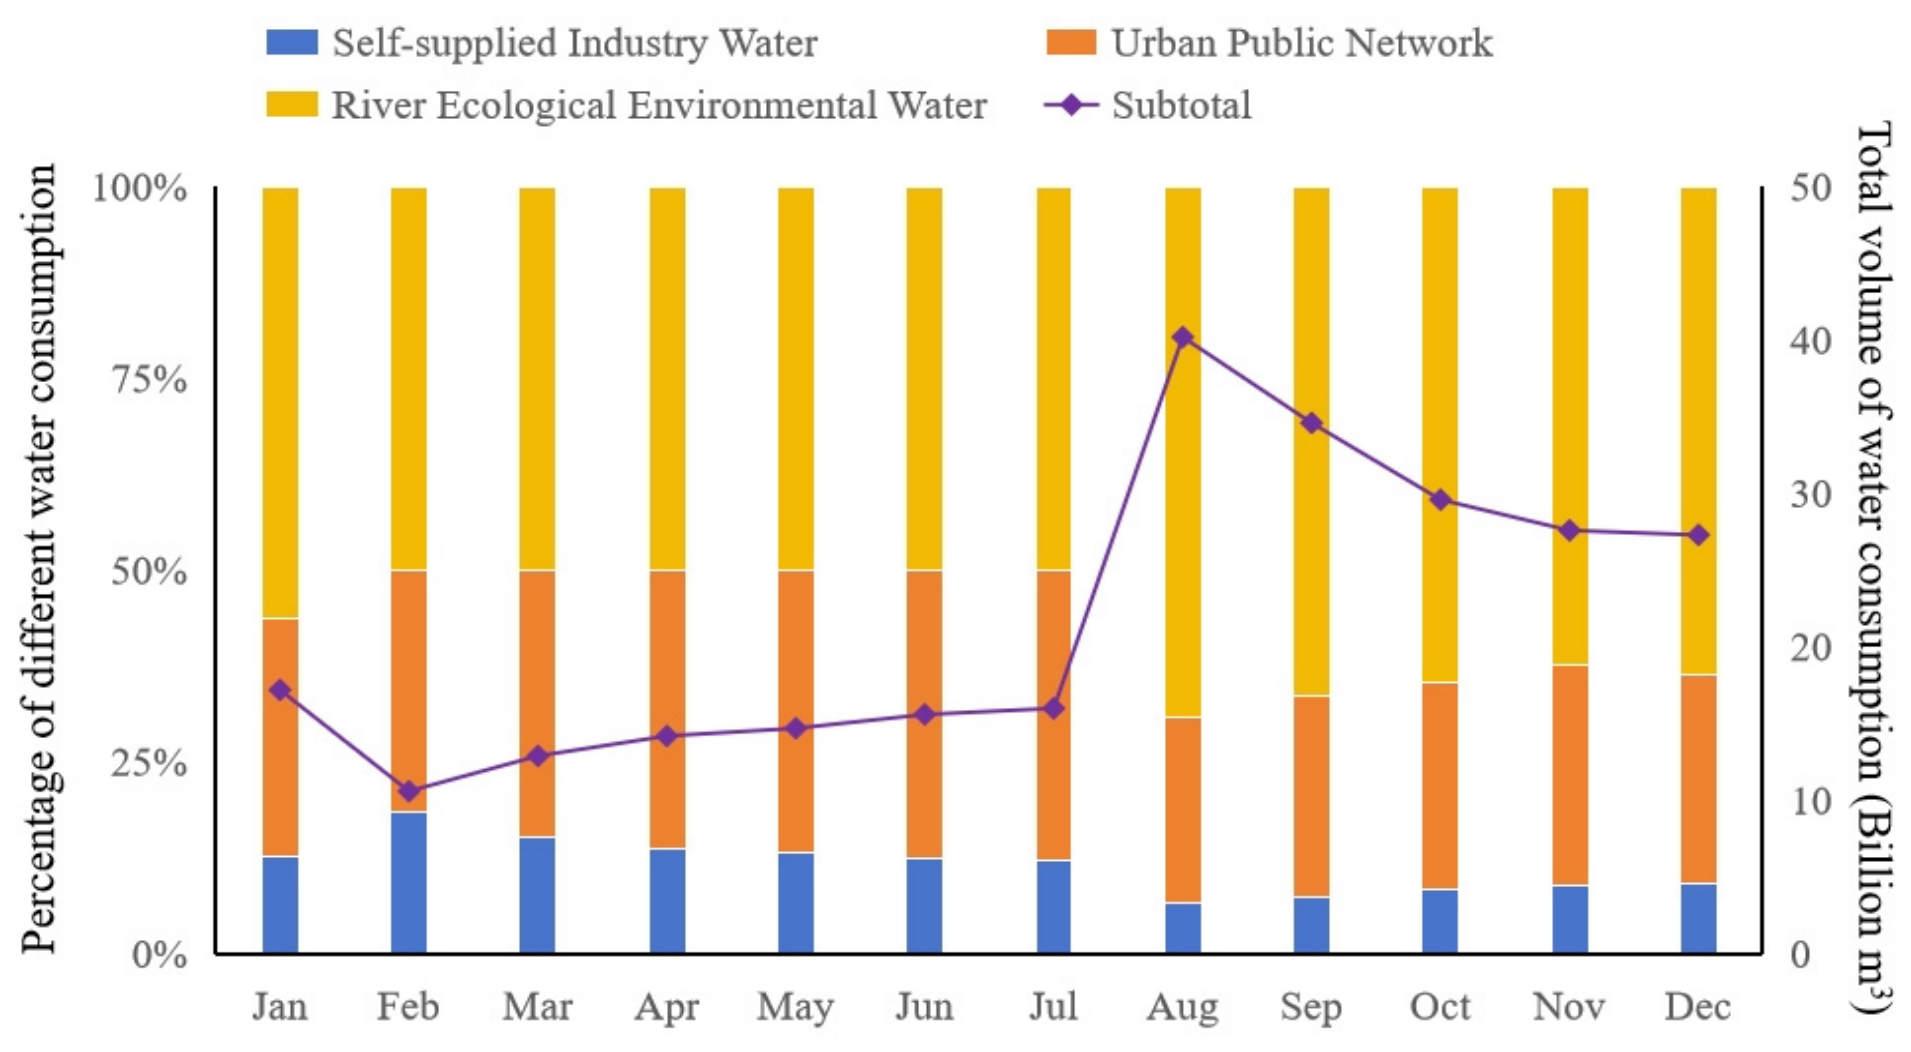
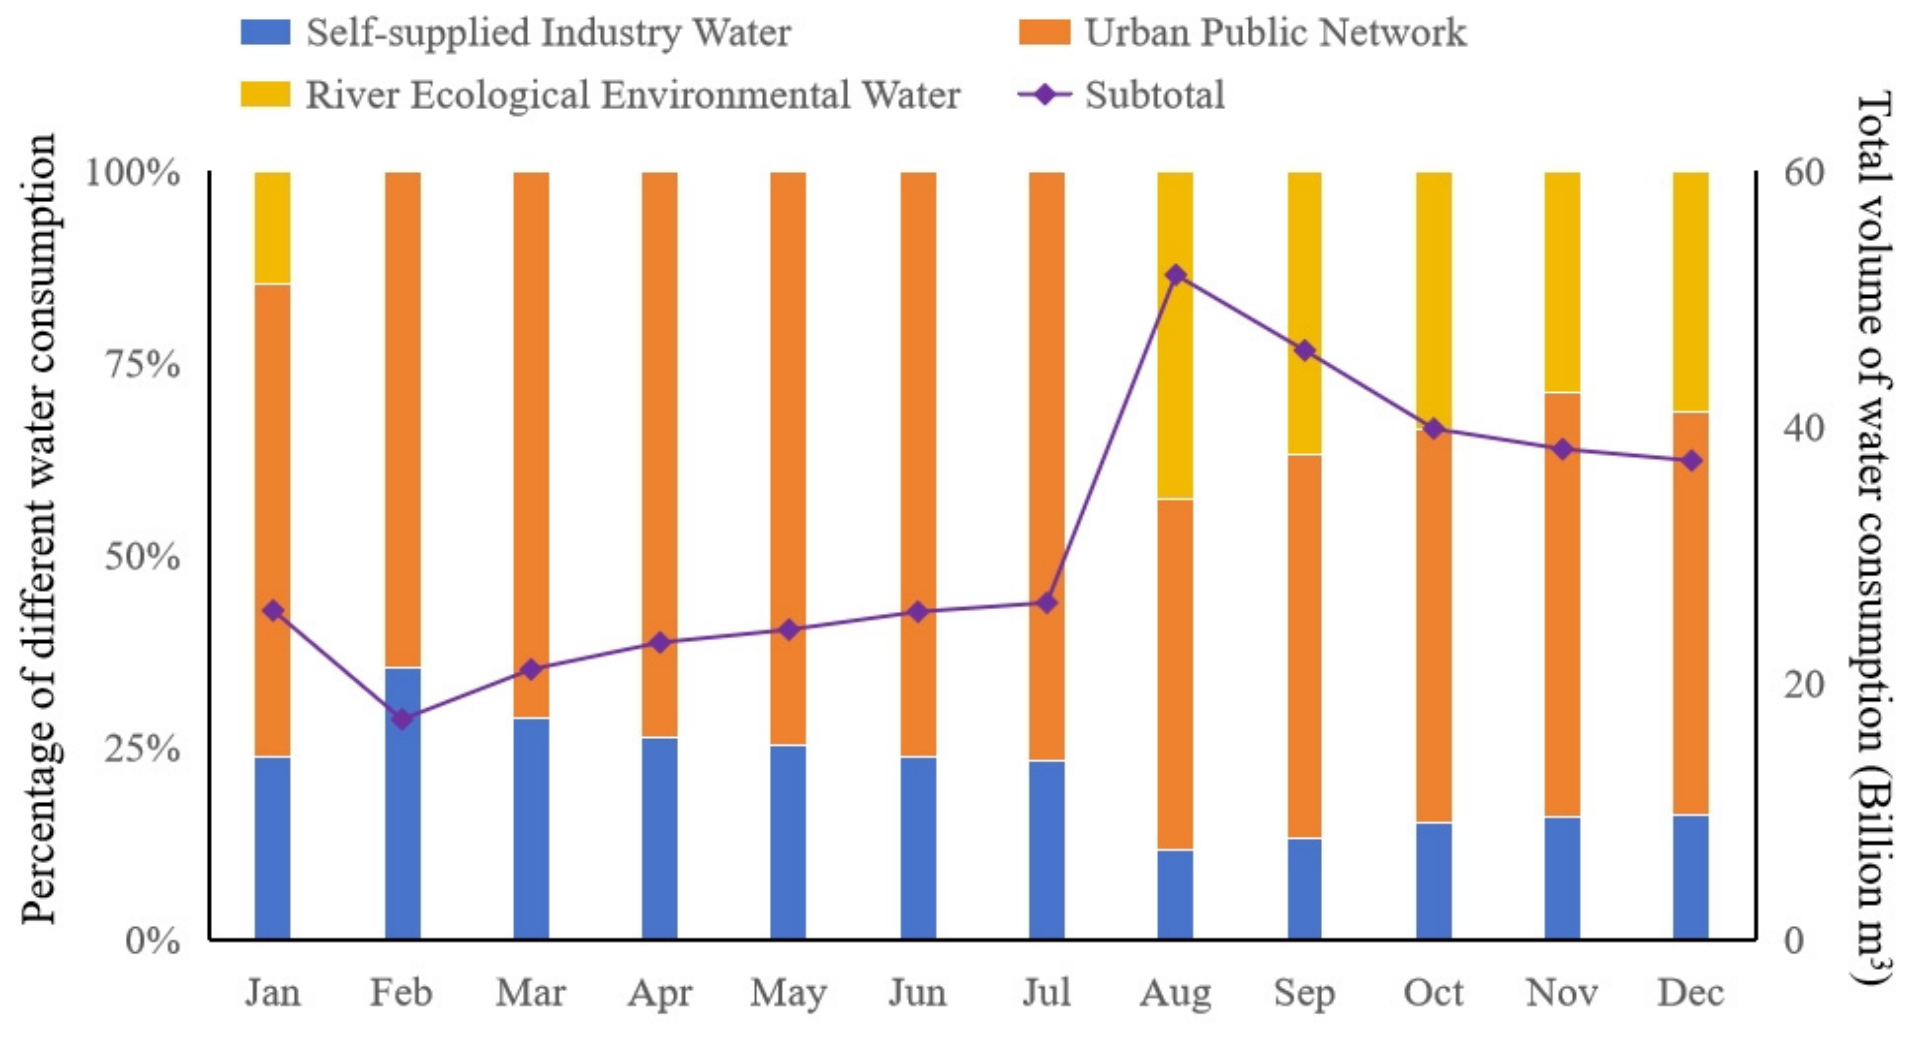
This study utilized a 95% hydrological frequency during the simulation based on local hydrological and meteorological conditions [31]. The year 2025 was selected as the current year, and the year 2030 was selected as the planning year. The corresponding water volumes from different water sources are shown in Table 1 and Figure 3. The predicted results for water consumption at both the current-year level and planning-year level are shown in Table 2, while the components of different types of water consumption are shown in Figure 4 and Figure 5 for the different years, respectively.
As indicated in Section 2.2 and Section 2.3, the verification data used in this model was obtained from the local government statistical yearbook for the years 2019 to 2024, while the parameters were also determined using historical data. During model verification, the coefficient of determination varied from 0.91 to 0.96, which demonstrates good validation results. Both the pollutant emission coefficients and carbon emission coefficients used in the present model are shown in Table 3 and Table 4. The pollutant emission coefficients will be used in Equations (5) and (7), while the carbon emission coefficients will be used in Equation (3).
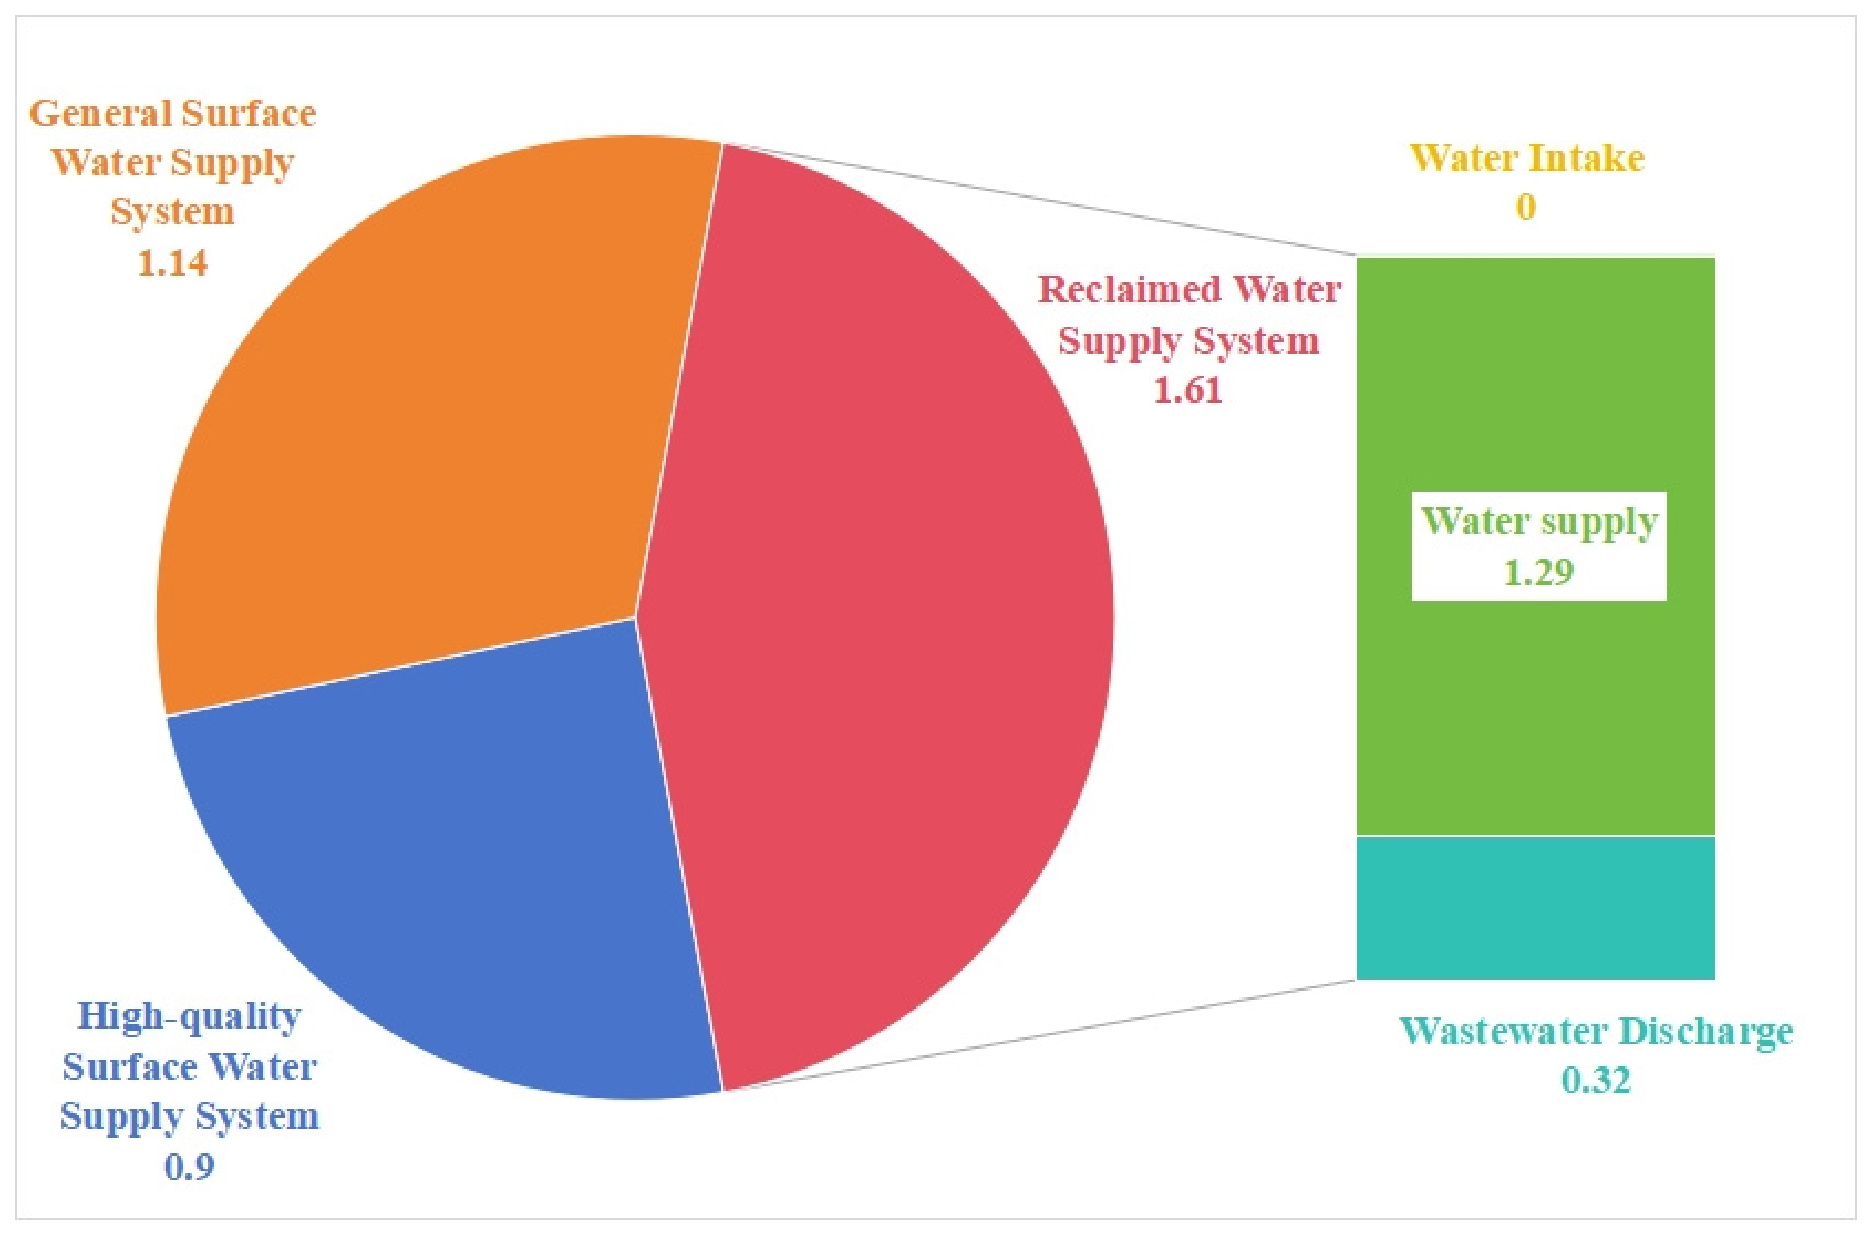
Indeed, the seasonal river flow, the treatment efficiency and the point and non-point source will affect the distribution and concentration of COD and NH3-N in both the local river network and the reclaimed water from the sewage treatment plant. It is confirmed that the water quality will be better in the winter season rather than in the summer season, while higher treatment efficiency will lead to lower COD and NH3-N concentrations in the reclaimed water. The local indicator values of point and non-point source emission coefficients were determined based on the field monitoring performed in previous research, as shown in Table 3. The pollution carrying capacity of the local river network and the carbon emission intensity of the multi-source water supply system in Yiwu City were both determined based on previous research. The pollutant reduction indicators of point and non-point sources in Yiwu City and the calculation results for the pollution carrying capacity are shown in Table 3. The carbon emission intensity parameters were determined based on the local government annual report and previous research, and are shown in Table 4. Additionally, the different components of the water supply system are shown in Figure 6 for the years 2025 and 2030.
The simulation model for the local multi-source water supply system was developed based on the simulation algorithm shown in Figure 2 in Section 2.2, while the relevant parameters used during the present simulation are shown in Table 5.

4. Discussion

The results of the above simulation model of the multi-source water supply system for both the current year and planning year for Yiwu City are shown in Table 6 and Table 7. Generally, the high-quality water source replacement rate was fixed at 30% and 50% during the simulation for the recommended plan. Further analysis is focused on the nexus effects of water conservation, pollutant control and carbon emissions on the local environment and ecology. The analyzed results are shown in Table 8 and Table 9.
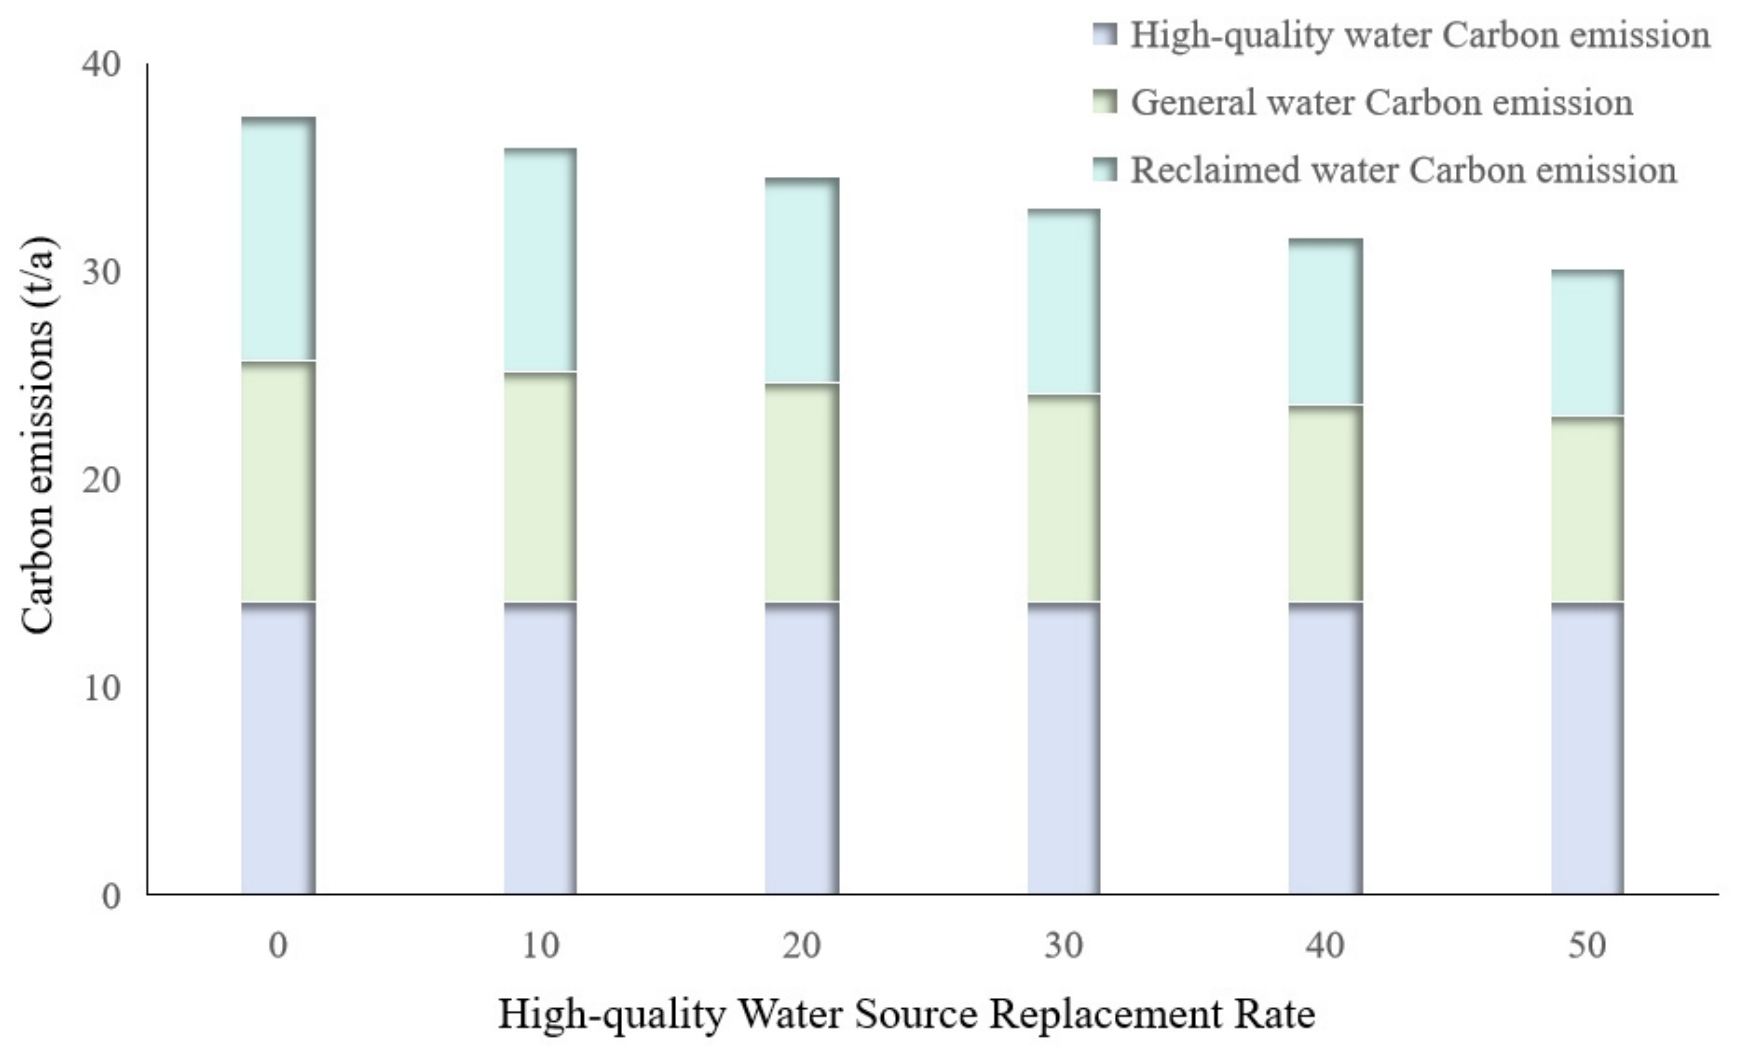
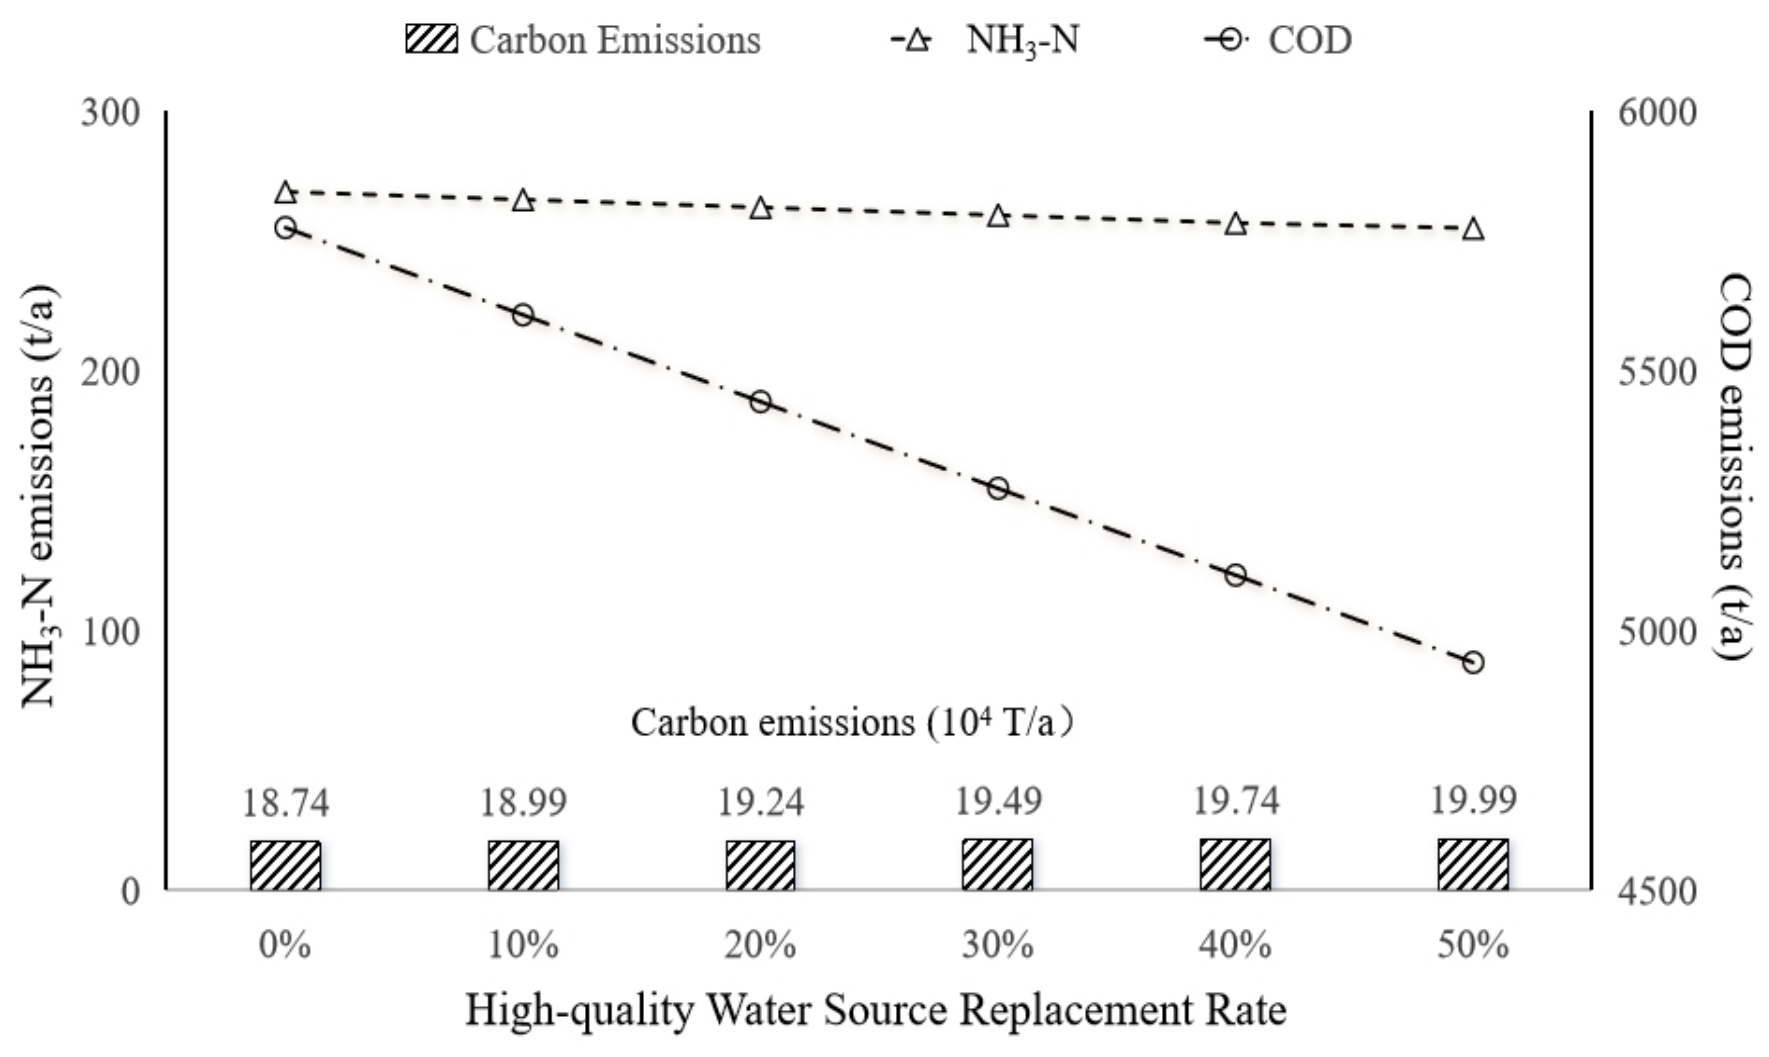
As shown in Table 6 and Figure 6, when considering the current-year level, every simulation of Yiwu City was able to achieve a balance between water supply and demand. However, differences are still observed between cases in terms of the three important indicators: namely, the total volume of water conservation, the total amount of pollutant control and the total carbon emissions. With the increase in the high-quality water source replacement rate from 0% to 50%, the proportion of high-quality water, general water and reclaimed water varied from 3.3:87.8:8.9 to 9.6:84.7:8.7, and the total amount of COD and NH3-N decreased by 837 t/a and 14 t/a, respectively, while the corresponding carbon emissions increased by 1.25 × 10⁴ t CO2/a. The COD and NH3-N emissions decreased by 167.4 t/a and 2.8 t/a, and the corresponding carbon emissions increased by 0.25 × 10⁴ t CO2/a for every 10% high-quality water replacement rate increment.
Table 6 shows that pollutant emissions generally decrease, while carbon emissions increase as the replacement rate rises in 2025. This trade-off is observed because the better efficiency of the sewage treatment plant results in lower pollutant emissions, though the energy consumption is much higher. The carbon emissions will eventually increase along with the energy consumption; hence, the results shown in Table 6 are also acceptable.
In the case of the planning-year level shown in Table 7 and Figure 7, representing a continuous rise in social and economic water demand in Yiwu City, it is quite difficult to achieve a balance between water supply and demand. The replacement rate of high-quality water sources had to be above 30% in order to reach a balance between the local water supply and demand; otherwise, water shortage problems will appear due to the insufficient local water supply capacity.
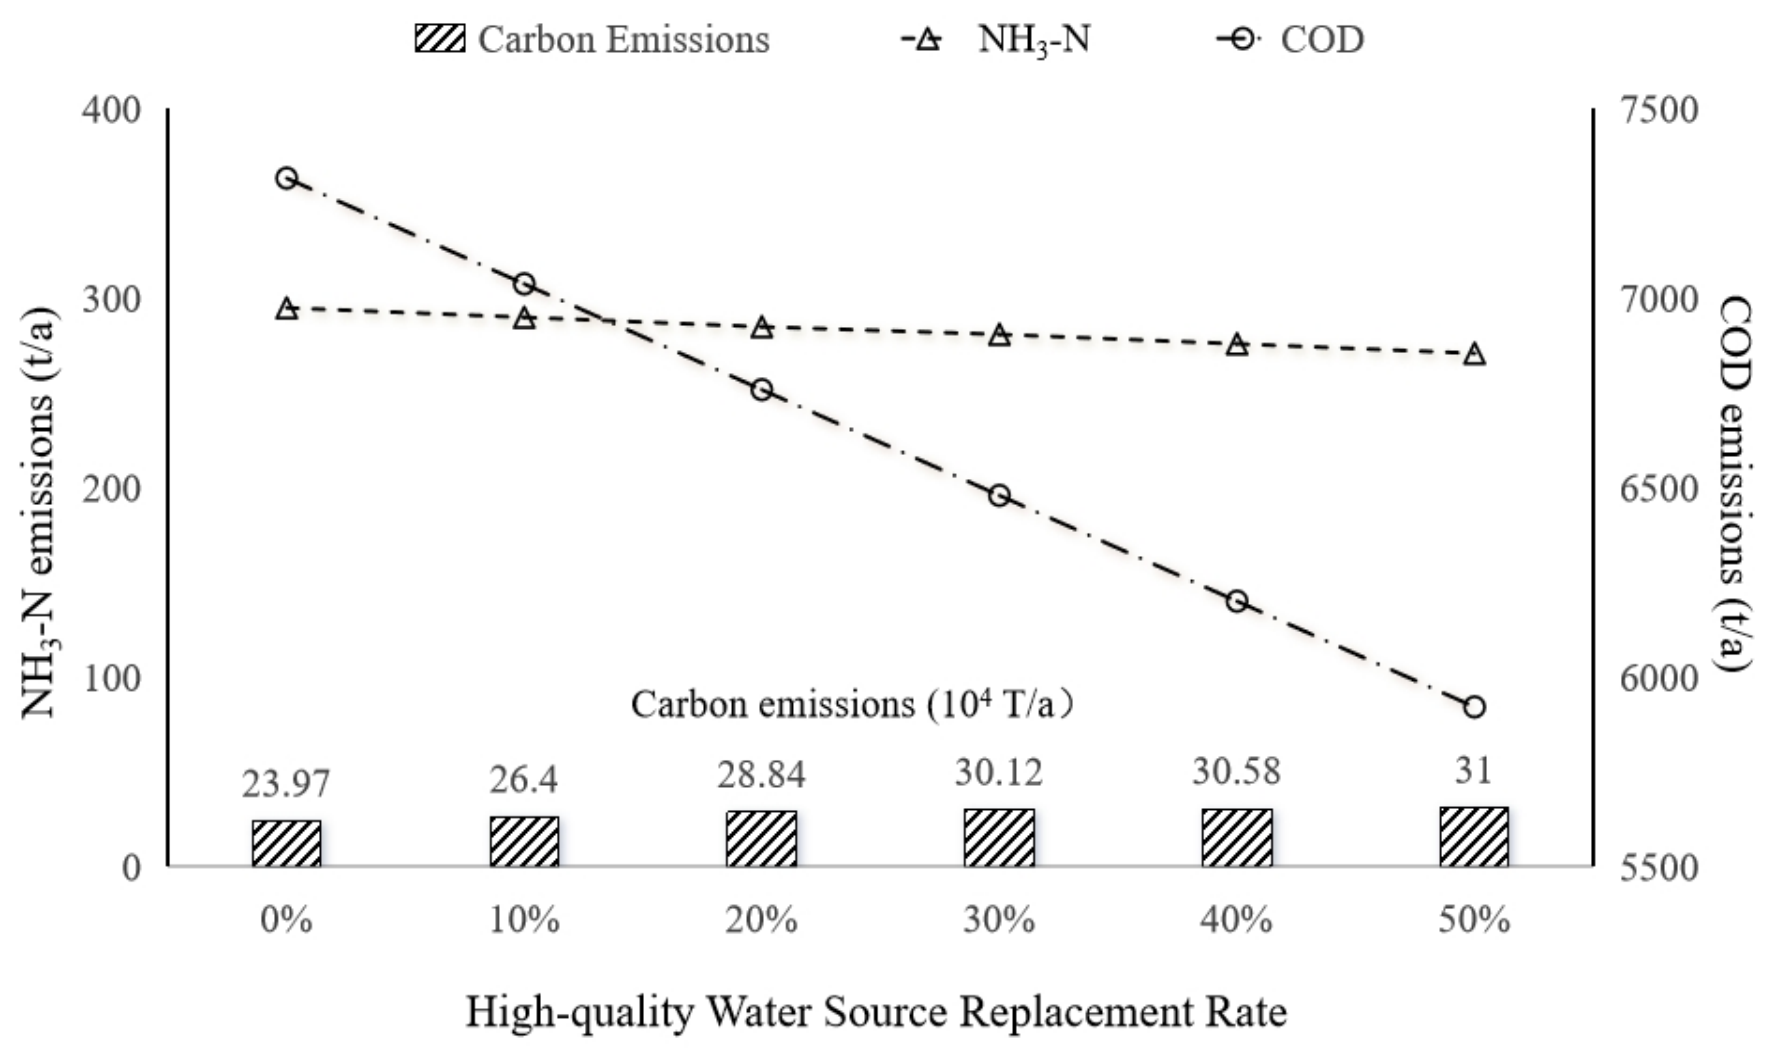
Similarly, when the replacement rate of high-quality water sources increased from 0 to 50%, the proportion of high-quality water, general water and reclaimed water varied from 0:82.8:17.2 to 5.5:81.8:12.7. Meanwhile, the total amounts of COD and NH3-N decreased by 1395 t/a and 24 t/a, respectively, and the corresponding carbon emissions increased by 7.03 × 10⁴ t CO2/a. The COD and NH3-N emissions decreased by 279 t/a and 4.8 t/a, and the corresponding carbon emissions increased by 1.406 × 10⁴ t CO2/a for every 10% high-quality water replacement rate increment.
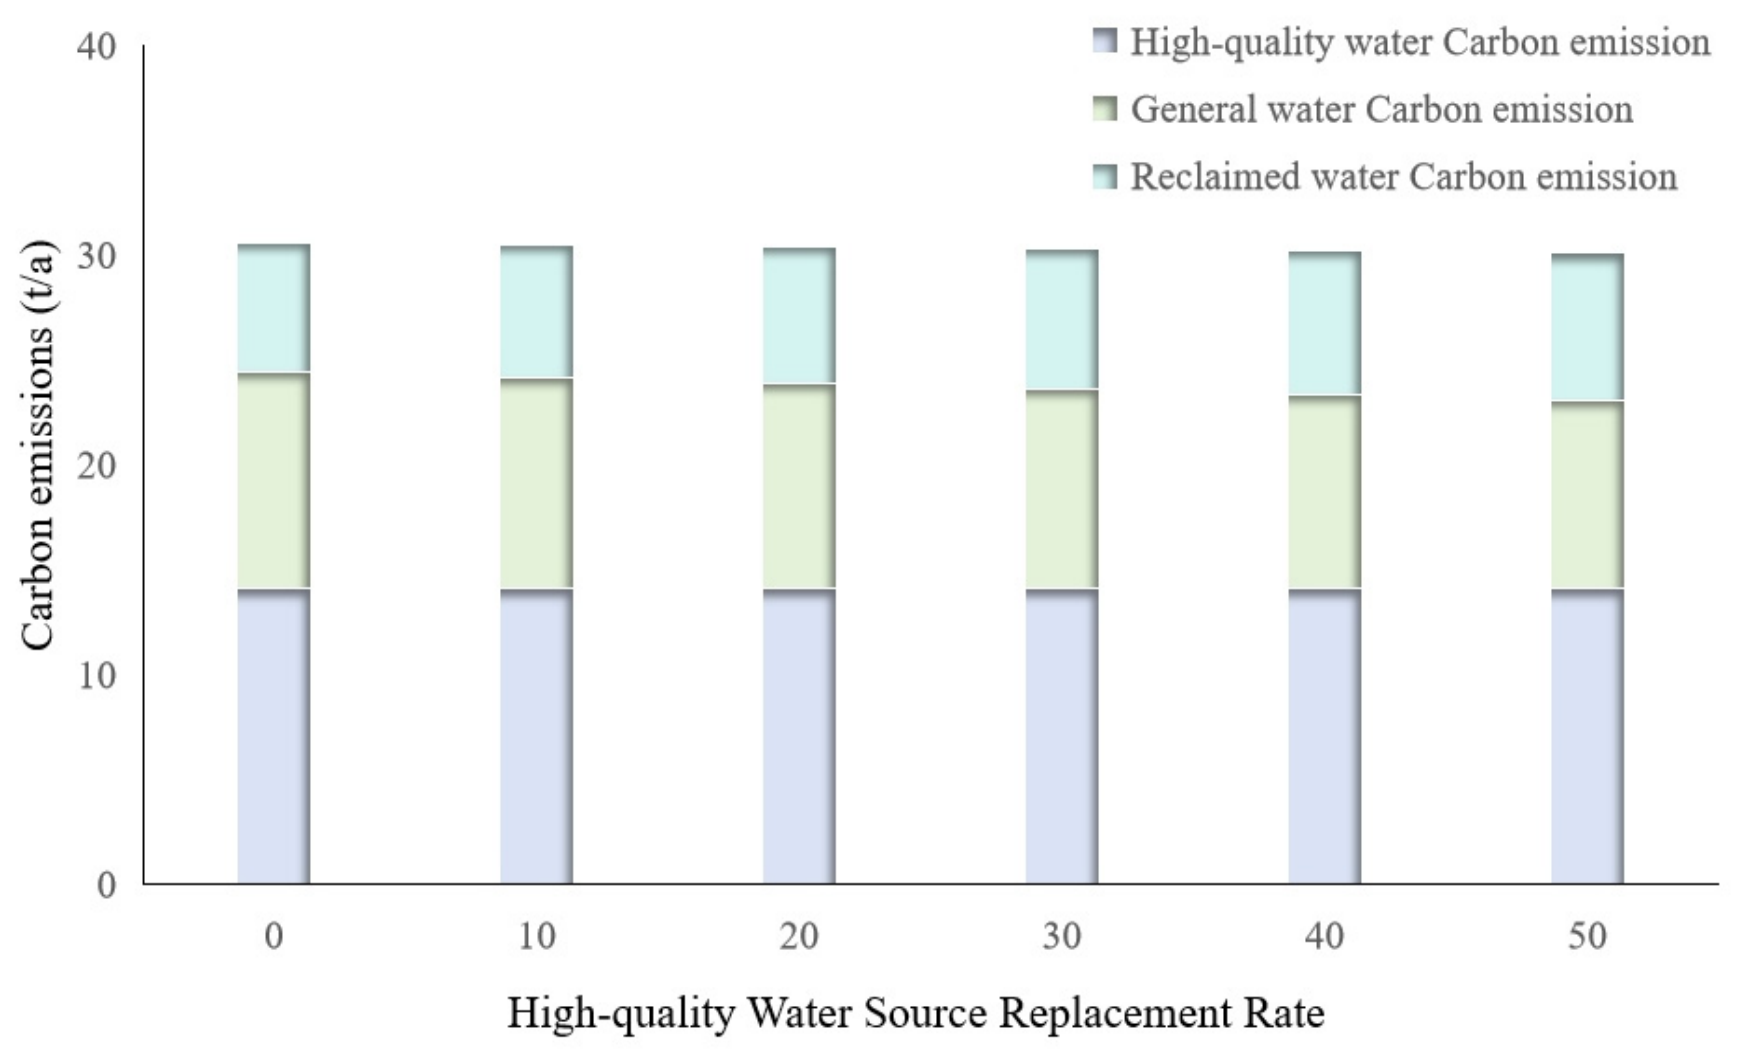
Under the conditions of the planning year, sensitivity analysis among all types of water sources also shows the importance of local pollutant control and carbon emissions, as can be seen in Table 8 and Table 9 and Figure 8 and Figure 9. As shown in Table 8 and Figure 8, during the year 2025, the local water supply will become insufficient compared with the local household water demand, especially for high-quality water. As predicted by the numerical model, a balance between local water supply and demand will be reached only if a 50% replacement rate of high-quality water sources is achieved. Additionally, the corresponding carbon emissions decrease by 1.406 × 10⁴ t CO2/a with every 10% increment in the reclaimed water source utilization rate. Moreover, COD emissions increase by 279 t/a, and NH3-N emissions increase by 3.0 t/a for every 10% increment in reclaimed water utilization. It can be concluded that, because of the temporal and spatial distribution of different water sources in Yiwu City, a water shortage problem will occur, especially in urban areas, and efforts should be made to enhance the utilization of reclaimed water.
As shown in Table 9 and Figure 9, during the year 2030, the water conservation, pollutant control and carbon emission nexus effects are also apparent, and are similar to the local multi-source water supply system for the year 2025. Indeed, when the proportion of reclaimed water used in landscape ecological water increases from 0 to 50%, COD emissions decrease by 656 t/a, NH3-N emissions decrease by 11 t/a and corresponding carbon emissions increase by 0.096 × 10⁴ t CO2/a.
Table 8 and Table 9 demonstrate the sensitivity of the utilization of reclaimed water for the multi-source system in Yiwu City. In order to satisfy the local water demand, with the increase in the balanced total volume of reclaimed water from 1.21 × 10⁸ m3 to 1.54 × 10⁸ m3, the point source emissions of COD increase from 1349 t/a to 2186 t/a. Conversely, when the total balanced volume of reclaimed water usage reduces from 1.94 × 10⁸ m3 to 1.54 × 10⁸ m3, the point source emissions of COD decrease from 2841 t/a to 2186 t/a. Similar variations are obtained when considering the NH3-N point source emissions. In summary, since Yiwu City suffers from a serious water shortage problem, a 50% replacement rate of reclaimed water is required to satisfy the local water demand, which will lead to higher pollutant emissions.

5. Conclusions

In this study, we focused on the integrated analysis of water conservation, pollutant control and carbon emissions in a multi-source water supply system. A comprehensive model was constructed in order to simulate these three factors together, along with factors related to local sustainability, socio-economic and scientific progress and integrated approaches to sustainable development. Attention was also paid to the multi-source supply system in Yiwu City, which has three different water sources with various types of water qualities. A typical carbon emission intensity model for the life cycle of the multi-source water supply system was also established in this study in order to calculate carbon emissions from the local water supply. Based on the field monitoring and data analysis, the nexus effects of the multi-source water supply system in Yiwu City were evaluated.
The multi-source water supply system proved to be effective in improving both the efficiency and the guarantee rate of local social water circulation. For the planning year, the shortage of high-quality water sources will increase from a gap of 55 million cubic meters to an even greater high-quality water deficit. The utilization of reclaimed water and general river water for social and industrial applications will reach 163 million cubic meters, and the replacement rate of high-quality water resources will exceed 30%. The discharge of local wastewater will be significantly reduced due to the utilization of large amounts of reclaimed water. Finally, a nearly 95% guarantee rate for the local household water demand will be achieved, along with a 90% guarantee rate for local industrial and agricultural water, which is sufficient and critical for local households and governments. The present model is also useful for cities affected by water shortage problems around the world, and can help resolve the contradictions between reclaimed water utilization, pollutant reduction, carbon emissions and local sustainable development. The nexus effects of water conservation, pollutant control and carbon emissions for the multi-source water supply system can be calculated and analyzed based on local data and the new derived numerical model, and the multi-source water supply system and reclaimed water have both been proven beneficial for those cities in the future.
In summary, we have identified that carbon emission intensity is significantly affected by domestic topography, geomorphology and the spatial layout of water sources. Future studies are recommended to focus on multi-water source spatial configurations, and the numerical model has been proven as a useful tool for simulating the nexus effects of water conservation, pollutant control and carbon emissions based on the different water demand requirements of the multi-source water supply system. Moreover, many new methods, including creator variable machines (CVMs), high-correlated variable creator machines (HCVCM), stronger variable creator machines (SVCMs), modified stronger variable creator machines (MSVCMs) and dynamic selecting machines (DSMs), have been created and presented between 2021 and 2025 [36,37,38,39]. These methods are strongly applicable for studying the nexus effects of water conservation, pollutant control and carbon emissions in a multi-source water supply system, and they can also be combined with other methods, such as ML, DP, GEP and the regression method, in an ensemble or hybrid model to improve both the accuracy and efficiency of the simulation results.

Author Contributions

Conceptualization, L.F. and S.W.; Methodology, J.W. and Y.L.; Investigation, F.S. and Z.G.; Resources, W.Z. and J.W.; Writing—original draft, L.F. and J.W. All authors have read and agreed to the published version of the manuscript.

Funding

This research was jointly supported by the Key Research and Development Program of Zhejiang Province (No. 2023C03134), the Research Program of the Department of Water Resources of Zhejiang Province (No. RB2517), the Applied Basic Public Research Program and Natural Science Foundation of Zhejiang Province (No. ZJWY23E090028), Zhejiang Key Laboratory of River-Lake Water Network Health Restoration (2025E10112) and the Scientific Research Fund Key Project of Zhejiang Institute of Hydraulics & Estuary (ZIHE25Z002).

Institutional Review Board Statement

Not applicable.

Informed Consent Statement

Not applicable.

Data Availability Statement

The data that support the findings of this study are openly available at www.yw.gov.cn (accessed on 7 January 2026).

Conflicts of Interest

The authors declare no conflicts of interest.

References

  1. Cardenes, I.; Siddiqi, A.; Naeini, M.M.; Hall, J.W. Multi-objective optimization of energy and greenhouse gas emissions in water pumping and treatment. Water Sci. Technol. 2020, 82, 2745–2760. [Google Scholar] [CrossRef] [Scilit] [PubMed]
  2. Younos, T.; Grady, C.A. Climate Change and Water Resources; Springer: Berlin/Heidelberg, Germany, 2013; pp. 169–197. [Google Scholar]
  3. Lam, K.L.; Kenway, S.J.; Lant, P.A. Energy use for water provision in cities. J. Clean. Prod. 2017, 143, 699–709. [Google Scholar] [CrossRef] [Scilit]
  4. Forsberg, C.W. Nuclear energy for a low-carbon-dioxide-emission transportation system with liquid fuels. Nucl. Technol. 2008, 164, 348–367. [Google Scholar] [CrossRef] [Scilit]
  5. Chen, W.; Tao, T.; Zhou, A.; Zhang, L.; Liao, L.; Wu, X.; Yang, K.; Li, C.; Zhang, T.C.; Li, Z. Genetic optimization toward operation of water intake-supply pump stations system. J. Clean. Prod. 2021, 279, 123573. [Google Scholar] [CrossRef] [Scilit]
  6. Laraasti, A.; Fowler, G.D.; Graham, N.J.D. Chemical regeneration of granular activated carbon: Preliminary evaluation of alternative regenerant solutions. Environ. Sci. Water Res. Technol. 2020, 6, 2043–2056. [Google Scholar] [CrossRef] [Scilit]
  7. Fan, G.; Xu, Q.; Wang, Y.; Chen, H.; Lin, C.; Wei, Z.; Xu, X.; Yang, C.; Luo, J.; Chen, X.; et al. Research on carbon emission accounting and low carbon operation methods for urban water supply systems. J. Water Process. Eng. 2024, 68, 106438. [Google Scholar] [CrossRef] [Scilit]
  8. Li, J.Y.; Liu, S.M.; Meng, F.L.; Wu, X.; Smith, K. An efficient constraint-based pruning method to improve chlorine dosage optimization. J. Water Resour. Plan. Manag. 2022, 148, 15–30. [Google Scholar] [CrossRef] [Scilit]
  9. Deniere, E.; Van Langenhove, H.; Van Hulle, S.W.H.; Demeestere, K. Improving the ozone-activated peroxymonosulfate process for removal of trace organic contaminants in real waters through implementation of an optimized sequential ozone dosing strategy. Sci. Total Environ. 2023, 856, 158764. [Google Scholar] [CrossRef] [Scilit] [PubMed]
  10. Farajiamiri, M.; Meyer, J.C.; Walther, G. Multi-objective optimization of renewable fuel supply chains regarding cost, land use, and water use. Appl. Energy. 2023, 349, 121652. [Google Scholar] [CrossRef] [Scilit]
  11. Feng, K.; Hubacek, K.; Siu, Y.L.; Li, X. The energy and water nexus in Chinese electricity production: A hybrid life cycle analysis. Renew. Sustain. Energy Rev. 2014, 39, 342–355. [Google Scholar] [CrossRef] [Scilit]
  12. Gungor-Demirci, G.; Lee, J.; Keck, J. Optimizing pump operations in water distribution systems: Energy cost, greenhouse gas emissions and water quality. Water Environ. J. 2020, 34, 841–848. [Google Scholar] [CrossRef] [Scilit]
  13. Al-Omari, A.; Al-Houri, Z.; Muhammetoglu, H.; Muhammetoglu, A.; Topkaya, B. footprints for the urban water cycle in Amman, Jordan. Int. J. Environ. Res. 2022, 16, 87. [Google Scholar] [CrossRef] [Scilit]
  14. Yu, N.C.; Zeng, X.H.; Ma, X.N.; Sun, Y.; Wang, Y.; Chen, B.; Luo, Z.; Dong, C.; Shen, K.; Wu, J. Preparation of Ce-Fe2O3/Al2O3 catalyst for simultaneous degradation of benzodiacetone and reduction of Cr(VI) by electro-Fenton process: Performance, mechanism, degradation pathways. J. Alloys Compd. 2025, 1045, 184745. [Google Scholar] [CrossRef] [Scilit]
  15. Jiang, W.Y.; Zeng, Z.X.; Zhang, Z.Y.; Zhao, Y.C. Regulation and optimization of urban water and land resources utilization for low carbon development: A case study of Tianjin, China. Sustainability 2022, 14, 2760. [Google Scholar] [CrossRef] [Scilit]
  16. Wang, Z.; Jiang, L.; Wan, W.; Wang, K.; Bai, Y. Fuzzy multi-objective optimization model for carbon emissions during water supply based on life cycle assessment. Sustain. Energy Technol. Assess. 2024, 20, 104027. [Google Scholar] [CrossRef] [Scilit]
  17. Kyung, D.; Kim, D.; Park, N.; Lee, W. Estimation of CO2 emission from water treatment plant model development and application. J. Environ. Manag. 2013, 131, 74–81. [Google Scholar] [CrossRef] [Scilit]
  18. Pao, H.T.; Chen, C.C. Decoupling strategies: CO2 emissions, energy resources, and economic growth in the Group of Twenty. J. Clean. Prod. 2019, 206, 907–919. [Google Scholar] [CrossRef] [Scilit]
  19. Xu, Z.W.; Yao, L.M.; Chen, X.D. Urban water supply system optimization and planning: Bi-objective optimization and system dynamics methods. Comput. Ind. Eng. 2020, 142, 106373. [Google Scholar] [CrossRef] [Scilit]
  20. Capodaglio, A.G.; Olsson, G. Energy issues in sustainable urban wastewater management: Use demand reduction and recovery in the urban water cycle. Sustainability 2020, 12, 266. [Google Scholar] [CrossRef] [Scilit]
  21. Lin, J.L.; Kang, S.F. Analysis of carbon emission hot spot and pumping energy efficiency in water supply system. Water Supply 2018, 19, 200–206. [Google Scholar] [CrossRef] [Scilit]
  22. Guo, H.; Dong, Z.T.; Yang, Y.Y.; Sui, L.; Wang, W.-J.; Liang, C.; Xiong, T.; Chen, Y.-R.; Yan, M.; Wen, X.-J.; et al. Polarized electric field-mediated graphitic carbon nitride-based S-scheme heterostructure for efficient photocatalytic removal of bisphenol A. Appl. Surf. Sci. 2025, 682, 161739. [Google Scholar] [CrossRef] [Scilit]
  23. Wen, X.J.; Zhan, Q.; Wu, D.D.; Xu, J.; Qian, B.; Xu, Q.; Su, T.; Liu, Z.; Fei, Z.; Guo, H. Construction of an S-scheme Bi12O17Cl2/CeO2 heterojunction for efficient photocatalytic degradation of ciprofloxacin and hydrogen evolution. J. Taiwan Inst. Chem. E 2026, 188, 106769. [Google Scholar] [CrossRef] [Scilit]
  24. Yateh, M.; Li, F.; Tang, Y.; Li, C.; Xu, B. Energy consumption and carbon emissions management drinking water treatment plants: A systematic review. J. Clean. Prod. 2024, 437, 140688. [Google Scholar] [CrossRef] [Scilit]
  25. Li, S.; Milia, A.; Schafer, A.I.; Richards, B.S. Renewable energy powered membrane technology: Energy consumption analysis of ultrafiltration backwash configurations. Sep. Purif. Technol. 2022, 287, 120388. [Google Scholar] [CrossRef] [Scilit]
  26. Lu, Y.Z.; Sha, H.Y.; Di, C.; Zhu, G.C. A cross-kingdom survival strategy: A methanotroph recruits a microalga for synergistic detoxification of metronidazole. J. Hazard. Mater. 2026, 503, 141127. [Google Scholar] [CrossRef] [Scilit] [PubMed]
  27. Milenov, T.; Dimov, D.; Nikolov, A.; Stankova, N.; Avramova, I.; Karashanova, D.; Georgieva, B.; Avdeev, G.; Karaivanova, D.; Valcheva, E. Synthesis of graphene–like phases by laser ablation of micro-crystalline graphite in water suspension. Surf. Interfaces 2021, 27, 101491. [Google Scholar] [CrossRef] [Scilit]
  28. Meng, L.; Huang, B. Shaping the relationship between economic development and carbon dioxide emissions at the local level: Evidence from spatial econometric models. Environ. Resour. Econ. 2018, 71, 127–156. [Google Scholar]
  29. Zhao, Y.; Shi, Q.; Li, H.; Qian, Z.; Zheng, L.; Wang, S.; He, Y. Simulating the economic and environmental effects of integrated policies in energy-carbon-water nexus of China. Energy 2022, 238, 121783. [Google Scholar] [CrossRef] [Scilit]
  30. Nair, S.; George, B.; Malano, H.M.; Arora, M.; Nawarathna, B. Water-energy-greenhouse gas nexus of urban water systems: Review of concepts, state-of-art and methods. Resour. Conserv. Recycl. 2014, 89, 1–10. [Google Scholar] [CrossRef] [Scilit]
  31. Xiao, Y.; Fang, L.; Hipel, K.W. Conservation-targeted hydrologic-economic models for water demand management. J. Environ. Inform. 2021, 37, 49–61. [Google Scholar]
  32. Zhou, S.W.; Guo, S.S.; Xu, W.X.; Du, B.-G.; Liang, J.-Y.; Wang, L.; Li, Y.-B. Digital twin-based pump station dynamic scheduling for energy-saving optimization in water supply system. Water Resour. Manag. 2024, 38, 2773–2789. [Google Scholar] [CrossRef] [Scilit]
  33. Soytas, U.; Sari, R.; Ewing, B.T. Energy consumption, income, and carbon emissions in the United States. Ecol. Econ. 2007, 62, 482–489. [Google Scholar] [CrossRef] [Scilit]
  34. Tan, S.; Yao, L. Managing and optimizing urban water supply system for sustainable development: Perspectives from water-energy-carbon nexus. Sustain. Prod. Consum. 2023, 37, 39–52. [Google Scholar] [CrossRef] [Scilit]
  35. Yiwu Municipal Bureau of Statistics. Yiwu Statistical Yearbook; Yiwu Municipal Bureau of Statistics: Yiwu, China, 2025. [Google Scholar]
  36. Zhou, Y.; Zhang, B.; Wang, H.; Bi, J. Drops of energy: Conserving urban water to reduce greenhouse gas emissions. Environ. Sci. Technol. 2013, 47, 10753–10761. [Google Scholar] [CrossRef] [Scilit] [PubMed]
  37. Giammar, D.E.; Greene, D.M.; Mishra, A.; Rao, N.; Sperling, J.B.; Talmadge, M.; Miara, A.; Sitterley, K.A.; Wilson, A.; Akar, S.; et al. Cost and energy metrics for municipal water reuse. ACS ES&T Eng. 2022, 2, 489–507. [Google Scholar]
  38. Shishegaran, A.; Varaee, H.; Rabczuk, T.; Shishegaran, G. High correlated variables creator machine: Prediction of the compressive strength of concrete. Comput. Struct. 2021, 247, 106479. [Google Scholar] [CrossRef] [Scilit]
  39. Bhati, A.; Hiran, K.K.; Vyas, A.K.; Mijwil, M.M.; Aljanabi, M.; Metwally, A.S.M.; Al-Asad, F.; Awang, M.K.; Ahmad, H. Low cost artificial intelligence Internet of Things based water quality monitoring for rural areas. Internet Things 2024, 27, 101255. [Google Scholar] [CrossRef] [Scilit]
Figure 1. The multi-source water supply system in Yiwu City.
Sustainability 18 06556 g001
Figure 2. Model algorithm.
Sustainability 18 06556 g002
Figure 3. Water consumption at current-year level (2025) in Yiwu City.
Sustainability 18 06556 g003
Figure 4. Water consumption during planning year (2030) in Yiwu City.
Sustainability 18 06556 g004
Figure 5. Components of the multi-source water supply system in Yiwu City.
Sustainability 18 06556 g005
Figure 6. Analysis of water conservation, pollutant control and carbon emission nexus effects at the current-year level (2025).
Sustainability 18 06556 g006
Figure 7. Analysis of water conservation, pollutant control and carbon emission nexus effects for the planning year (2030).
Sustainability 18 06556 g007
Figure 8. Sensitivity analysis of carbon emission intensity for Yiwu City in 2025.
Sustainability 18 06556 g008
Figure 9. Sensitivity analysis of carbon emission intensity for Yiwu City in 2030.
Sustainability 18 06556 g009
Table 1. Multi-source water supply capacity in Yiwu City in 2025.
MonthVolume (106 m3)
Reservoir WaterDiversion ProjectGeneral River Water
Jan3.1038.9
Feb5.3068.4
Mar10.50140.7
Apr10.90145.1
May10.50140.7
Jun17.40234.3
Jul7.4089.4
Aug3.8033.8
Sep3.7036
Oct2.3026.5
Nov2.3027.2
Dec2.3027.2
Total79.301008.3
Table 2. Simulation results of water demand for different years in Yiwu City.
MonthCurrent-Year Level (2025, 106 m3)Planning-Year Level (2030, 106 m3)
Self-Supplied IndustryUrban Public NetworkRiver Ecological EnvironmentTotalSelf-Supplied IndustryUrban Public Pipeline NetworkRiver Ecological EnvironmentTotal
Jan3.99.53.817.26.115.83.825.7
Feb3.96.7010.66.111.1017.2
Mar3.99012.96.115021.1
Apr3.910.3014.26.117.1023.2
May3.910.8014.76.118.1024.2
Jun3.911.7015.66.119.5025.6
Jul3.912.10166.120.2026.3
Aug3.914.122.240.26.123.622.251.9
Sep3.913.71734.66.122.91746
Oct3.912.313.429.66.120.413.439.9
Nov3.912.71127.66.121.21138.3
Dec3.911.711.727.36.119.611.737.4
Total46.6134.679.1260.373.4224.679.1377.1
Table 3. Simulation results of point and non-point source pollutant emissions in Yiwu City.
CategoryNon-Point Source Emission CoefficientPoint Source Emissions ConcentrationRiver and Lake Pollution Capacity
Pollutant IndicatorCODNH3-NCODNH3-NCODNH3-N
Indicator Unitt/km2t/km2mg/Lmg/Lt/at/a
Indicator Value5.1990.29516.570.289427283
Table 4. Simulation results of carbon emission intensity in Yiwu City.
Multi-Source Water Supply SystemCarbon Emission Intensity (kgCO2/m3)
Water IntakeWater SupplyWastewater Discharge Total
Socio-Economic Water Ecological Environment Water Socio-Economic Water Ecological Environment Water Socio-Economic Water Ecological Environment Water
High-Quality Surface Water Supply System0.150.43/0.32/0.90/
General Surface Water Supply System0.120.350.230.3200.790.35
Reclaimed Water Supply System01.060.230.3201.380.23
Table 5. Determination of the relevant model parameters.
IndicatorUnitValueIndicator Description
Water supply capacity of high-quality surface water104 t/d74Includes the capacity of urban public water plants and their supporting pipe networks
Water supply capacity of ordinary surface water104 t/d36Includes the capacity of urban water plants with different water qualities and their supporting pipe networks and the capacity of urban ecological water plants and their supporting pipe networks
Water supply capacity of sewage treatment plants104 t/d17.5Includes the capacity of industrial water plants and their supporting pipe networks and the capacity of ecological water plants and their supporting pipe networks
Upper limit of industrial water replacement rate%57Upper limit of industrial water supply from reclaimed water and river water
Upper limit of urban public water replacement rate%40Upper limit of urban public water supply from reclaimed water and river water
Leakage rate of various water supply pipelines%12Implemented in accordance with the provisions of existing policy documents
Comprehensive coefficient of sewage treatment plants%0.80Deducts the water loss during urban sewage collection and treatment processes
Rainwater catchment area of rivers and lakeskm2826.1Obtained from topographic maps according to the overall water resources plan of Yiwu City
Table 6. Simulation results of multi-source water supply configuration for Yiwu City in 2025.
High-Quality Water Source Replacement Rate (%)01020304050
Balance Water Volume of Different Water Sources
(108 m3)
High-Quality Water0.350.480.620.750.891.02
Ordinary Water9.339.269.199.139.068.99
Reclaimed Water0.950.880.810.750.680.61
Water Shortage of Different Water Users
(108 m3)
Industrial Water Use000000
Urban Water Use000000
Landscape Ecology000000
Carbon Emissions
(104 t.CO2/a)
High-Quality Water12.1110.909.698.487.276.06
Ordinary Water4.234.765.295.826.356.89
Reclaimed Water2.403.334.265.196.127.04
Total18.7418.9919.2419.4919.7419.99
Table 7. Simulation results of multi-source water supply configuration for Yiwu City in 2030.
High-Quality Water Source Replacement Rate (%)01020304050
Balance Water Volume of Different Water Sources
(108 m3)
High-Quality Water0000.130.350.57
Ordinary Water9.068.958.848.738.618.50
Reclaimed Water1.881.771.651.541.431.32
Water Shortage of Different Water Users
(108 m3)
Industrial Water Use000000
Urban Water Use0.550.330.10000
Landscape Ecology000000
Carbon Emissions (104 t CO2/a)High-Quality Water15.2615.2615.2614.1012.1210.10
Ordinary Water6.317.208.098.979.8610.75
Reclaimed Water2.403.955.507.058.6010.15
Total23.9726.4028.8430.1230.5831.00
Table 8. Sensitivity analysis of reclaimed water utilization for Yiwu City in 2025.
High-Quality Water Source Replacement Rate (%)01020304050
Balance Water Volume of Different Water Sources
(108 m3)
High-Quality Water0.130.130.130.130.130.13
Ordinary Water8.398.468.538.598.668.73
Reclaimed Water1.211.271.341.411.471.54
Water Shortage of Different Water Users
(108 m3)
Industrial Water Use000000
Urban Water Use0.6680.53320.3990.26380.12910
Landscape Ecology000000
Point Source Emissions
(t/a)
COD134915161683185120182186
NH3-N22.7925.6228.4531.2734.136.93
Non-Point Source Emissions
(t/a)
COD429542954295429542954295
NH3-N244244244244244244
Total Emissions
(t/a)
COD564358115978614663136480
NH3-N266269272275278281
Remarks: Ordinary water and reclaimed water account for 50% of ecological water use.
Table 9. Sensitivity analysis of reclaimed water utilization for Yiwu City in 2030.
High-Quality Water Source Replacement Rate (%)01020304050
Balance Water Volume of Different Water Sources
(108 m3)
High-Quality Water0.130.130.130.130.130.13
Ordinary Water8.338.418.498.578.658.73
Reclaimed Water1.941.861.781.701.621.54
Water Shortage of Different Water Users
(108 m3)
Industrial Water Use000000
Urban Water Use000000
Landscape Ecology000000
Point Source Emissions
(t/a)
COD284127102579244823172186
NH3-N484644413937
Non-Point Source Emissions
(t/a)
COD429542954295429542954295
NH3-N244244244244244244
Total Emissions
(t/a)
COD713670056874674366126480
NH3-N292289287285283281
Remarks: Ordinary water and reclaimed water account for 50% of ecological water use.
Disclaimer/Publisher’s Note: The statements, opinions and data contained in all publications are solely those of the individual author(s) and contributor(s) and not of MDPI and/or the editor(s). MDPI and/or the editor(s) disclaim responsibility for any injury to people or property resulting from any ideas, methods, instructions or products referred to in the content.