


Abstract
Grid-connected photovoltaic–battery energy storage–electric vehicle (PV-BESS-EV) charging stations require supervisory energy management that can coordinate tariff response, carbon-intensity signals, peak constraints, storage utilization, and converter-level operability within a transparent evidential framework. This study develops a bounded-reference rule-based supervisory energy management system (RB-SEMS) that preserves lower-level local converter controllers while generating operating modes and saturated reference commands for BESS power, grid exchange, and EV charging limits. A dual-time-scale evaluation framework is established by combining short-time switching/control simulations for dynamic traceability and SOC-sensitive protection with 24 h, 15 min EMS-level energy-balance simulations for cost, carbon, peak, PV utilization, EV service, and storage throughput assessment. Selected daily reference-injection cases are retained as copied-model diagnostic checks rather than as full-day switching-level validation. Under the D4-LSOC condition, RB-SEMS reduces the reported post-startup DC-bus deviation from 46.13 V to 40.60 V and the filtered BESS peak from 269.18 kW to 84.42 kW. In the E1-TOU scenario, E1-TOU-cost reduces daily total cost from 623.57 CNY to 564.05 CNY, lowers peak-period grid import from 183.75 kWh to 126.75 kWh, and increases local PV utilization from 71.13% to 78.71%; E1-PC66 further reduces the maximum 15 min grid import from 77.88 kW to 66.00 kW. Under the prescribed E2-PCC scenario, E2-CP reduces the calculated grid-related CO2 emissions from 550.29 kg to 500.42 kg, whereas the price-only diagnostic increases them to 572.29 kg. Same-metric PV-SC and MILP comparisons, tested-range sensitivity analysis, and a throughput-based degradation proxy clarify that RB-SEMS is an interpretable supervisory baseline for cost–carbon–peak–cycling trade-off analysis rather than a cost-optimal controller or regionally validated proof of carbon reduction.
1. Introduction
The rapid electrification of road transport is increasing the operational importance of electric vehicle charging stations (EVCSs). With the integration of photovoltaic (PV) generation and battery energy storage systems (BESSs), an EVCS is no longer only a passive load connected to the distribution grid but a station-level energy hub with local generation, storage flexibility, controllable grid exchange, and service obligations to EV users. Recent reviews of EVCS operation and EMS optimization show that station operation must account for market participation, grid interaction, pricing, uncertainty, and multiple control objectives [1,2]. Large-scale aggregator and renewable-integration studies further indicate that smart charging, storage coordination, and renewable supply can change peak load, energy cost, and carbon outcomes at the charging-infrastructure scale [3,4]. These developments make supervisory energy management a central problem for PV-BESS-EV charging stations because EV service demand, intermittent PV power, BESS state of charge (SOC), converter interfaces, grid exchange, time-of-use (TOU) tariff, and grid carbon intensity must be coordinated simultaneously [5,6].
The physical coupling among PV generation, BESS operation, EV charging demand, and grid exchange has been extensively recognized in recent planning and techno-economic studies. Stochastic and planning-oriented PV-BESS-EVCS research shows that PV uncertainty and BESS power constraints materially affect the feasible operation of integrated charging stations [7,8]. Multi-objective techno-economic studies also demonstrate that PV capacity, BESS capacity, tariff structure, grid-connection conditions, and EV service targets must be evaluated jointly rather than optimized in isolation [9,10]. Highway, urban, residential, and transportation-aware planning studies have further extended this coupling to charging-station location, fleet penetration, demand response, and long-term infrastructure evolution [11,12]. Recent PV storage studies confirm that renewable generation and storage can improve renewable utilization, reduce grid dependence, or improve economic and carbon performance, but these benefits remain sensitive to demand patterns, grid constraints, and storage assumptions [13,14]. Hybrid solar-wind and hybrid wind-solar PV EVCS analyses further extend this planning stream to mixed renewable charging infrastructure [15,16]. At the same time, this planning literature typically focuses on capacity configuration, siting, or long-horizon economics; it does not usually reveal how station-level supervisory modes and reference channels respond to short-time source/load disturbances [17,18].
At the operational level, EMS research has moved from simple load supply to multi-objective coordination among tariff response, grid-import limitation, PV self-consumption, BESS scheduling, and EV service quality. Online EVCS operation studies show that cost, service quality, and grid-impact objectives can compete under uncertain EV arrivals and charging requirements [19]. Demand-charge and peak-aware scheduling further demonstrate that minimizing daily electricity cost is not equivalent to limiting the maximum 15 min interval grid import [20]. Fleet charging, distributed EVCS coordination, hierarchical pricing, and menu-based charging studies show that station operation can be shaped by user preferences, demand response, and grid-side constraints [21,22]. Renewable-consumption-oriented charging management also indicates that price signals can be used to shift EV demand toward renewable output, although such strategies do not necessarily address station-level BESS stress or converter-level traceability [23,24]. Therefore, a complete daily EMS evaluation should distinguish the total cost, peak-period import energy, maximum 15 min interval grid import, local PV utilization, EV service ratio, BESS throughput, and terminal SOC rather than reducing all objectives to a single cost metric [25].
Carbon-aware operation adds another layer of complexity to tariff-aware EMS design. Although battery-electric charging eliminates local tailpipe emissions, the indirect emissions associated with charging depend on the temporal carbon intensity of grid electricity. Carbon-aware tariff design and low-carbon demand-response studies show that electricity price and grid carbon intensity may not be aligned over time, so a dispatch rule that follows only low-price intervals can conflict with emission-reduction objectives [26,27]. Market-level and urban-scale studies also indicate that renewable matching, carbon accounting, and PV availability strongly affect the carbon interpretation of EV charging [13,28]. Carbon-oriented safe reinforcement-learning research provides a more advanced algorithmic direction, but it also illustrates the need for explicit constraints, reward design, and evaluation boundaries when carbon is introduced into charging decisions [29]. These studies motivate an EMS formulation in which tariff and grid carbon intensity are treated as separate exogenous signals, allowing price-only behavior and carbon-priority behavior to be evaluated without assuming that a low tariff automatically implies low carbon intensity.
A separate but related stream of research focuses on converter-level control, real-time station management, hardware-in-the-loop (HIL) validation, and intelligent EMS algorithms. PV-BESS-grid fast-charging studies and model-predictive power-management studies emphasize dynamic power exchange, DC-bus behavior, converter control, and reference tracking under real-time disturbances [30,31]. Grid-interface and multi-station coordination studies show that converter or grid-tie limitations can become binding operational constraints for EVCS operation [32]. HIL studies and port-Hamiltonian EVCS control work further demonstrate that realistic validation and switched or converter-level evidence are essential when claims involve stability, reference tracking, or physical implementation [33,34]. Reinforcement-learning and multi-agent reinforcement-learning methods have recently been developed for safe charging control and highway or multi-station energy management, but they require careful definition of state observations, action limits, reward terms, communication structures, and safety shields [35,36]. Risk-aware and learning-based coordination studies therefore provide important future benchmarks, but they do not remove the need for a transparent, reproducible station-level baseline with clearly bounded evidence [37,38].
A key unresolved issue is how to link short-time-scale supervisory behavior with daily tariff- and carbon-aware EMS operation. Existing studies have advanced PV-BESS-EVCS planning, multi-objective scheduling, carbon-aware charging, converter-level control, and intelligent EMS algorithms; however, the connection between short-time supervisory traceability and daily tariff/carbon operation is often not explicit. Daily scheduling studies may quantify 24 h cost, carbon, local PV utilization, or peak metrics without showing how supervisory references behave under switching/control disturbances. Conversely, converter-level studies may demonstrate dynamic operability without evaluating daily cost, carbon, EV service, or peak-cap consequences. This paper, therefore, develops RB-SEMS as an interpretable supervisory baseline with explicit reference saturation, SOC-sensitive protection, and evidence-bounded validation rather than as a global optimizer or learning-based controller.
The main methodological contribution lies in a bounded-reference RB-SEMS workflow that links interpretable rule logic, reference saturation, daily EMS-level dispatch, selected daily reference injection into fast-model windows, reproducible baseline comparison, storage and peak-cap sensitivity evidence, carbon-profile sensitivity, throughput/EFC cycling interpretation, and EMS-level GSA-lite screening. This positioning distinguishes the method from conventional rule-based EMS studies that may lack cross-scale reference evidence, from MPC/MILP studies that prioritize optimization rather than transparent rule execution, and from carbon-aware EV charging studies that often evaluate carbon outcomes without explicitly separating designed scenario assumptions from measured regional carbon data.
The main contributions of this work are as follows:
(1) A hierarchical PV-BESS-EV charging-station EMS is formulated by retaining lower-level local converter controllers and adding a rule-based supervisory layer that generates operating modes and bounded-reference channels for BESS power, grid exchange, and EV charging limits.
(2) A dual-time-scale evaluation framework is established to separate short-time switching/control evidence from 24 h EMS-level daily energy-balance evidence, and selected daily reference-injection cases are used to check whether daily dispatch references can be traced in bounded fast-model windows.
(3) A TOU tariff, the designed carbon-intensity profiles, PV/EV daily profiles, BESS power/energy limits, and a closed-cycle terminal SOC constraint are incorporated into the daily EMS evaluation, with fair PV-SC and MILP baselines, solved using intlinprog in MATLAB R2024b (version 24.2) and Optimization Toolbox R2024b (version 24.2; MathWorks, Natick, MA, USA), used to contextualize the rule-based dispatch results.
(4) Quantitative evidence is reported for D4 SOC-sensitive protection under a bounded post-startup and unit-consistent interpretation, E1-TOU cost-oriented and peak-cap operation, E2-PCC carbon-priority dispatch with alternative carbon-profile sensitivity, tested-range storage sensitivity, throughput/EFC degradation-cost proxy sensitivity, and EMS-level GSA-lite screening, while cyber-communication co-simulation, variance-complete Sobol GSA, and cell-physics aging remain outside the claim boundary.
2. Materials and Methods
2.1. System Architecture and Local-Control Baseline
The studied station is a grid-connected PV-BESS-EV charging station comprising a PV generation branch, a bidirectional BESS branch, a common DC bus, a grid-side bidirectional AC/DC interface, and an EV charging branch. The station is represented as a hierarchical system. At the lower level, the PV-side converter, BESS DC/DC converter, grid-side converter, and EV-side charger retain their local control functions. At the upper level, the proposed supervisory EMS receives monitored station variables and exogenous tariff/carbon inputs and then sends bounded-reference commands and an operating mode to the local controller/interface layer. The supervisory layer does not generate switching signals directly and does not replace the converter-level loops.
The DC-bus power interpretation follows the basic converter power relation. For a branch connected to the DC bus,
where is the instantaneous branch power (kW), is the DC-bus voltage (V), is the branch current (A), is the branch voltage (V), and is the equivalent resistance () when an equivalent resistive representation is used. The resistive relations are used only for equivalent resistive representations and are not treated as general converter power equations. Equation (1) is not used as a replacement for the detailed converter model; it defines the sign-consistent power interpretation used when post-processing the switching/control traces.
For daily EMS-level simulations, the available PV power is supplied through the prescribed daily profile. The notation distinguishes available PV power from PV power locally used by EV demand or BESS charging. When a physical irradiance-temperature model is required, the available PV power can be expressed as
where is the available PV power (kW), is the PV rated power (kW), is the PV conversion efficiency, is the PV array area (m2), is the irradiance (kW/m2), is the temperature coefficient (1/°C), is the cell temperature (°C), and is the reference temperature (°C). In this paper, the daily simulations use the prescribed PV profile and scale it as
where k is the 15 min interval index, is the normalized PV availability, and in the E1/E2 daily EMS-level scenarios. The superscript av distinguishes available PV from locally used PV in the energy-balance and local PV utilization metrics.
Positive grid power denotes import from the utility grid. For the reported daily EMS simulations, a no-export accounting boundary is used; PV surplus that cannot be consumed by EV demand or stored in the BESS is treated as curtailed PV energy rather than exported energy. The station-level EMS energy balance is written as
where and are the grid import and export powers (kW), is the PV power used at the station (kW), and are the BESS discharge and charge powers (kW), is the served EV charging power (kW), and represents the aggregate conversion or balance losses (kW). For the reported EMS-level daily simulations, no separate aggregate loss term is added beyond the BESS charge/discharge efficiency factors in Equation (5); therefore is treated as zero in the interval balance. The daily EMS-level model uses this interval energy balance, while the D1-D4 branch uses switching/control simulations to evaluate transient traces. In the reported daily EMS accounting, grid export is fixed to zero; therefore, no feed-in revenue or export-related carbon credit is included in Equations (14)–(16).
2.2. Control-Configuration Definitions: LCB and RB-SEMS
LCB is the retained local-control baseline. It includes local operation of the PV, BESS, grid-side, and EV-side branches, but it does not produce station-level , , , or Mode channels. LCB serves as a locally operable reference configuration that represents operation without station-level supervisory mode selection or bounded-reference generation.
RB-SEMS is the proposed rule-based supervisory EMS. It receives , , , , , the electricity tariff , and the grid carbon-intensity factor . It then determines an operating mode and bounded references. The low-SOC protection mode reduces or blocks BESS discharge and permits grid takeover within the defined operating constraints. The short-time supervisory thresholds are fixed as follows: ; center/exit deadbands = ; SOC low enter/exit thresholds = 30%/35%; grid-reference limit = ; BESS discharge/charge-reference limits = 45/30 kW; emergency low-SOC discharge cap = 10 kW; EV-limit ceiling = 90 kW; grid/BESS-reference step limits = 6/8 kW; and Mode 2 BESS split coefficient = 0.70. The daily EMS-level constraints are separately listed in the daily EMS-level input-settings table.
Rule implementation and mode definitions. Mode 1 denotes normal supervisory coordination in which PV power is first used for EV demand, surplus PV can charge the BESS within SOC and power limits, and residual demand is supplied by BESS discharge or grid import. Mode 2 denotes combined source-load coordination used when PV variation and EV-load demand must be balanced jointly; the EMS coordinates BESS and grid references rather than relying on independent local loops. Low-SOC protection mode is entered when < ; BESS discharge is reduced or blocked, and grid takeover is permitted within the grid-import and EV service limits. The dominant mode reported in the results is the post-startup mode with the largest time share in the corresponding trace. In the D3/D4 switching/control tests, Mode 2 is activated by the predefined combined-disturbance test flag rather than by an online disturbance classifier.
The raw references follow the same priority logic: satisfy EV service subject to ; use available PV locally before grid import; charge the BESS from PV surplus when SOC and power limits allow; discharge the BESS to reduce grid import or enforce a peak cap when SOC is above the protection threshold; and assign grid import as the residual balancing channel. Each raw reference is then saturated by Equation (8).
The engineering basis and local sensitivity evidence for the selected RB-SEMS parameters are summarized in the engineering-basis table below. These settings are used as documented engineering parameters and are not treated as optimized constants.
The RB-SEMS thresholds are treated as engineering settings rather than optimized constants. Their values are tied to station ratings, converter limits, SOC-protection requirements, and the EV service envelope, and the final interpretation is supported by threshold and reference-limit sensitivity tests. This study therefore uses the sensitivity evidence to document robustness around the selected settings, not to claim optimization-proven thresholds (Algorithm 1).
| Algorithm 1. Rule-based supervisory EMS for mode selection and bounded-reference generation. |
| Inputs at interval : available PV power , requested EV charging power , BESS state of charge , DC-bus voltage , grid power , tariff , grid carbon-intensity factor , and the strategy/test flag. |
| Parameter set: DC-bus enter/exit thresholds 40/25 V around the 1500 V reference; SOC low enter/exit thresholds 30%/35%; grid-reference limit ∈[0, 30] kW for short-time tests; BESS-reference limits ∈[−30, 45] kW; emergency low-SOC discharge cap 10 kW; EV-limit ceiling ∈[0, 90] kW; grid/BESS-reference step limits 6/8 kW; and Mode 2 BESS share coefficient . |
| Outputs: saturated supervisory references , , , and the selected supervisory mode |
A positive denotes demand not covered by available PV, whereas a negative denotes PV surplus. |
|
|
|
The BESS energy state is updated at the EMS time step as
where is the BESS stored energy (kWh), and are the charge and discharge efficiencies, and h for the E1/E2 daily EMS-level simulations. The corresponding SOC and power constraints are
where kWh and kW in the daily EMS cases. Simultaneous charging and discharging are not allowed in the rule implementation:
The reference channels generated by RB-SEMS are bounded before being sent to local controllers:
Here, is the raw supervisory reference, is the saturated reference sent to the lower-level controller, and and are the admissible lower and upper limits. This saturation is the mathematical representation of the bounded-reference design shown in Figure 1 and Table 1 and Table 2.
Figure 1.
Overall architecture of a grid-connected PV-BESS-EV charging station with rule-based supervisory EMS. The station power stage includes the PV branch, bidirectional BESS branch, common DC bus, grid-side bidirectional AC/DC converter, and EV charging station. LCB retains only the local converter controllers, whereas RB-SEMS adds a station-level supervisory layer that receives monitored physical signals and external tariff/carbon inputs, and generates bounded supervisory references without replacing the lower-level controllers.
Table 1.
Terminology hierarchy for control configurations, evaluation cases, and dispatch strategies.
Table 2.
Engineering basis and local sensitivity evidence for RB-SEMS rule parameters.
2.3. Fast-Time-Scale Dynamic Tests D1-D4
The fast-time-scale evidence chain is organized around the D1–D4 dynamic switching/control tests. These tests compare LCB and RB-SEMS under PV-side, EV-load, combined PV-EV, and SOC-sensitive disturbances. The D1–D4 simulations evaluate local operability, supervisory traceability, post-startup DC-bus response, and SOC-aware BESS protection. Daily cost, carbon, local PV utilization, and EV service metrics are instead evaluated in the E1/E2 EMS-level simulations.
For DC-bus interpretation, the startup transient is excluded, and the main metric is the post-startup maximum absolute deviation relative to the 1500 V reference:
where is the post-startup threshold used for signal screening. For BESS interpretation, quality-filtered BESS power peaks are evaluated after excluding the predefined startup interval and invalid logging intervals. EV-side instantaneous converter-power traces are interpreted as EV-side power-demand indicators rather than 24 h EV service energy. The same post-processing window and invalid-sample exclusion rules are applied to LCB and RB-SEMS traces; no strategy-specific filtering is used. Invalid logging intervals are identified using the criteria summarized in the following evaluation and post-processing tables (Table 3, Table 4, Table 5 and Table 6).
Table 3.
Evaluation-case definitions and evidence boundaries for D1-D4 and E1/E2.
Table 4.
Daily EMS-level input settings for E1/E2.
Table 5.
TOU tariff periods for the E1-TOU daily EMS scenario.
Table 6.
Designed E2-PCC price–carbon conflict segmentation for reproducible EMS-level accounting.
2.4. Daily EMS-Level Scenarios E1/E2
The 24 h daily study is intentionally implemented as an EMS-level energy-balance simulation rather than a 24 h switching-level simulation. This choice enables interval-based cost, carbon, peak-period import, local PV utilization, EV service, BESS throughput, and peak-cap assessment using daily profiles and exogenous tariff/carbon inputs. All E1/E2 calculations use 15 min intervals.
The E2-PCC case is a designed price–carbon conflict scenario for reproducible EMS-level accounting. It intentionally creates periods in which low price and high carbon intensity, or high price and low carbon intensity, conflict. The scenario is not a measured regional hourly carbon series; instead, prescribed alternative carbon profiles are used to test sensitivity to carbon-profile assumptions.
The daily EV energy requested and served are
where intervals over 24 h.
Daily dispatch strategy implementation. To avoid conflating time scales, LCB is reserved for the short-time switching/control baseline, whereas DLB denotes the 24 h daily local baseline used in the EMS-level energy-balance simulations. In the daily EMS-level comparisons, E1-DLB and E2-DLB denote daily local baselines without supervisory BESS energy scheduling; the BESS does not perform daily arbitrage, peak-cap scheduling, or carbon-priority scheduling. The daily strategies are deterministic rule-based dispatch variants rather than optimization solutions. They share the same physical constraints, no-export accounting boundary, and closed-cycle terminal SOC band, but they differ in their priority signals: tariff priority for E1-TOU-cost and E2-PO, interval grid-import cap priority for E1-PC66/E1-PC70, and carbon-intensity priority for E2-CP (Algorithm 2).
| Algorithm 2. Daily EMS-level dispatch variants at 15 min resolution. |
| Common inputs: For each interval , read the prescribed daily profiles and states: available PV power , requested EV charging power , tariff , grid carbon-intensity factor , BESS SOC , initial SOC , terminal SOC band, BESS energy/power limits, and charge/discharge efficiencies and . |
| Common constraints and accounting boundary: Use min and intervals. Apply no export , no simultaneous BESS charging/discharging , SOC bounds , EV service limit kW, a sustained BESS charge/discharge limit of 100 kW, and a terminal band of . |
| E1-DLB/E2-DLB: Use the daily local baseline without daily BESS arbitrage, peak-cap scheduling, or carbon-priority scheduling. Available PV serves EV demand first; residual EV demand is supplied by grid import; PV surplus that cannot be locally used is curtailed under the no-export accounting boundary. |
| E1-TOU-cost: Use tariff priority based on . Charge the BESS from PV surplus when SOC and power limits allow, and discharge during predefined high-tariff intervals to reduce grid import while preserving the terminal SOC reserve. This strategy supports cost and peak-period energy assessment, not the maximum 15 min peak-cap claim. |
| E1-PC66/E1-PC70: Use an interval grid-import cap kW. Compute the uncapped import . If , discharge the BESS by the active minimum among import excess , BESS power availability , SOC-energy allowance , and terminal SOC reserve . If residual exceedance remains, classify the cap as partially feasible rather than fully feasible. |
| E2-PO: Use tariff only as the dispatch signal. Low-tariff intervals may charge the BESS even when the designed E2-PCC label is low-price/high-carbon; is not used in the dispatch decision. This row is retained as a price-only diagnostic baseline for carbon-risk behavior. |
| E2-CP: Use the E2-PCC carbon labels derived from as the primary dispatch signal. Avoid low-price/high-carbon charging, and reserve or discharge BESS energy to reduce high-carbon and high-price/high-carbon grid import. Use only as a secondary ordering signal when carbon priority is identical. |
| Terminal guard and output metrics: In the terminal window, enforce to avoid apparent daily gains from end-of-day depletion or overcharging. Report , , , , , , , , and . |
2.5. Tariff, Carbon, PV/EV Profile, and Terminal SOC Modeling
Positive grid power denotes grid import. The net grid exchange is decomposed as
The initial SOC is 50%, and the terminal SOC is constrained to a closed-cycle terminal SOC band:
This terminal SOC constraint prevents apparent cost or emission reductions that would result solely from ending the day with a lower BESS SOC. The tariff and carbon-intensity profiles are exogenous inputs. Therefore, the daily results should be interpreted under the defined tariff, carbon, PV/EV, BESS-capacity, power-limit, and terminal SOC assumptions rather than as universally optimal schedules.
The electricity cost, grid-related carbon emissions, carbon cost, and combined monetary operating cost are calculated as
where is the electricity cost (CNY), is the TOU electricity price (CNY/kWh), is the indirect grid-related emission (kg ), is the grid carbon-intensity factor (kg /kWh), is the carbon cost in CNY ( CNY/kg ), and is the total monetary operating cost in CNY. The formulation follows standard EMS accounting practice for interval-based electricity and emission metrics used in PV-BESS-EV charging studies [7,8,19]. The carbon price is used only to report the carbon-cost component in the accounting metric; the E2-CP dispatch itself uses as an explicit priority signal rather than being driven solely by the monetized carbon cost.
2.6. Dual-Time-Scale Simulation-Based Evaluation Framework
To connect the fast-time-scale dynamic evidence with the daily sustainability-oriented EMS results, this study adopts a dual-time-scale simulation-based evaluation framework, summarized in Figure 2. The short-time branch provides switching/control simulation evidence for LCB and RB-SEMS under D1-D4 switching/control tests. The daily branch provides 24 h EMS-level energy-balance evidence for tariff-aware, peak-cap, and carbon-priority operation using 15 min EMS-level simulations.
Figure 2.
Dual-time-scale simulation-based evaluation framework for the PV-BESS-EV supervisory EMS. The D1-D4 branch uses separate switching/control Simulink R2024b (version 24.2; MathWorks, Natick, MA, USA) models to provide short-time switching/control simulation evidence for LCB and RB-SEMS, while the E1/E2 branch uses 24 h EMS-level daily simulations for tariff-aware, peak-cap, and carbon-priority operation. The daily E1/E2 results are interval-based EMS-level simulations rather than 24 h switching-level simulations.
The two branches are complementary and address different performance metrics. The switching/control simulation branch supports dynamic traceability, post-startup DC-bus interpretation, SOC-sensitive protection, and post-processed BESS-power analysis. The EMS-level daily branch supports operating cost, carbon emission, peak-period import, local PV utilization, aggregate EV energy service, BESS throughput, and maximum 15 min interval grid-import assessment under the defined profiles and terminal SOC constraint. Thus, the E1/E2 results are slow-time-scale EMS evidence rather than full-day switching-level validation.
In Table 7, section (a), the reference set is ordered as . The copied fast-model checks are used only to audit daily reference-injection provenance and short-window diagnostic behavior.
Table 7.
Selected daily-reference injection cases and diagnostic metrics for copied-model checks.
In Table 7, sections (b) and (c), the BESS- and grid-power metric order is mean/final/RMSE/MAE/maximum absolute error, and the DC-bus diagnostic order is /maximum deviation/final deviation. The diagnostic errors are computed after the common startup exclusion, , using the following editable equation definitions:
The available trace is not treated as an EV-limit tracking signal because it represents instantaneous converter power rather than a validated served-EV channel. Therefore, no EV-limit tracking error is reported. CV1-CV3 are retained as selected 0.5 s copied-model diagnostic checks, whereas CV4-CV5 are retained only as 0.05 s diagnostic-only checks. The large BESS-power diagnostic errors and DC-bus deviations indicate that these copied-model runs should not be interpreted as validation-quality reference-tracking evidence or full-day switching-level validation.
These CV cases are retained only as copied-model diagnostic checks. They document the provenance of selected daily reference-injection points and quantify diagnostic deviations under short copied-model windows. Table 7, sections (a)–(c), report the selected reference sets, post-startup BESS-power and grid-power diagnostic metrics, DC-bus diagnostic deviations, and valid/invalid sample counts. The EV-limit quantity is not reported as a tracking-error metric because the available EV-side trace represents instantaneous converter power rather than a validated served-EV channel. Therefore, the CV results are not used as validation-quality reference-tracking evidence and do not constitute full-day switching-level validation.
2.7. Evaluation Metrics and Post-Processing
The daily cost and carbon metrics are defined in Equations (14)–(16). Local PV utilization, aggregate EV energy service ratio, BESS throughput, and maximum 15 min interval grid import are computed as
Here, and are the locally used PV energy and the available PV energy (kWh), respectively; is interpreted as the local PV self-consumption ratio rather than as an exported value; is the aggregate daily EV energy service ratio (%); is the BESS throughput (kWh); and is the maximum 15 min interval grid-import power over the daily EMS horizon (kW), not a sub-interval transient peak. For fast-time-scale results, in Equation (9) is evaluated after excluding , and BESS power peaks are evaluated after applying the common post-startup validity window and invalid-sample exclusion rules in the post-processing and filtering-rules table (Table 8 and Table 9). These fast-time-scale metrics are used only for dynamic traceability and SOC-protection conclusions. The BESS power limit in Table 4 is applied in the 15 min daily EMS-level dispatch model, whereas the short-time switching/control traces report transient branch-power stress indicators rather than sustained rated-power dispatch commands.
Table 8.
Cross-time-scale interpretation of BESS power limits and peak metrics.
Table 9.
Post-processing and filtering rules for fast-time-scale switching/control metrics.
For D4 post-processing, all strategies use one common validity rule. A sample is valid only when it is inside the post-startup window, finite, available for both LCB and RB-SEMS, and unit-consistent; otherwise, it is retained as raw or boundary evidence. In editable text form, if and all required samples are finite and inside the common window; otherwise, . This prevents strategy-specific filtering and separates raw, startup-excluded, filtered, and unit-suspect records. No strategy-specific filtering is used; the same post-startup validity mask is applied to LCB and RB-SEMS.
For EMS-level GSA-lite screening, selected exogenous signals and rule parameters are perturbed within the documented local ranges and ranked by the resulting changes in the total cost, grid-related CO2 emissions, and maximum 15 min interval grid import. The screening is used to identify influential EMS-level inputs such as EV-demand scale, carbon-peak timing, SOC-low threshold, and Mode 2 BESS share. It is not a variance-complete Sobol GSA and does not include communication-network or cyber-communication co-simulation layers.
Storage sensitivity protocol. The tested-range EMS-level storage sensitivity is evaluated using the same deterministic daily dispatch engines as the E1/E2 daily simulations. One-factor-at-a-time tests cover initial SOC, BESS capacity, sustained BESS power limit, and terminal SOC band, while rule/signal screening covers SOC threshold, Mode 2 BESS share, EV demand, PV availability, and carbon-profile timing/amplitude. The main quantitative ranges are reported later in the storage-sensitivity result tables; the evidence documents local sensitivity over the tested ranges and is not used for optimal BESS sizing, hardware robustness, or exhaustive robustness claims.
Peak-cap reproducibility protocol. The E1 peak-cap analysis combines the 60–75 kW base-profile feasibility scan with PV/EV perturbation cases. The 66 kW cap is interpreted as feasible for the documented base profile, whereas the perturbation cases define tested feasibility boundaries and residual-violation conditions. The main peak-cap results are reported later in the peak-cap feasibility table, with source profiles and dispatch outputs covered by the Data Availability Statement.
D4 post-processing boundary. The D4 metrics are interpreted as reported post-startup and unit-consistent switching/control evidence. The startup interval is excluded, Udc deviation is evaluated relative to the documented reference, and BESS peak values are interpreted as transient branch-power stress indicators rather than sustained EMS dispatch limits. The same post-startup validity boundary is applied to LCB and RB-SEMS, raw and diagnostic records are retained for internal audit transparency, and BESS peak and Udc response are treated as separate objectives.
3. Results
3.1. Fast-Time-Scale LCB and RB-SEMS Dynamic Traceability
This subsection evaluates whether adding the RB-SEMS supervisory layer improves the dynamic traceability of the locally operable station. LCB remains locally operable after startup, but it does not provide explicit station-level operating modes or reference records. RB-SEMS adds interpretable mode and reference-generation channels. The analysis focuses on traceability, voltage response, and peak power behavior under the tested disturbances.
Table 10 summarizes the post-startup results for D1-D3. In D2-EV, RB-SEMS slightly reduces from to . In D1-PV and D3-Dual, the same metric increases. The combined-disturbance D3-Dual case produces the largest RB-SEMS post-startup deviation, indicating that RB-SEMS improves supervisory traceability but does not uniformly reduce DC-bus voltage deviation.
Table 10.
Selected fast-time-scale LCB/RB-SEMS indicators under D1-D3.
Figure 3 shows the D3-Dual combined-disturbance post-startup response and illustrates how RB-SEMS makes station-level power coordination observable through mode and reference channels. The PV power, EV-side power demand, BESS participation, and grid exchange traces can be interpreted together with the dominant Mode 2 state, which is not available under LCB.
Figure 3.
D3-Dual traceability details. The figure provides a qualitative illustration of post-startup D3-Dual source-load coordination and supervisory traceability; quantitative D1-D3 indicators are reported in Table 10.
3.2. SOC-Sensitive Protection Under D4
The D4 cases evaluate whether the supervisory EMS responds differently as the BESS SOC condition changes. The D4 results are retained as reported post-startup and unit-consistent post-processing evidence. D4-LSOC is the primary low-SOC protection case because it activates the low-SOC trigger and grid-takeover response, whereas D4-NSOC and D4-HSOC are retained as SOC-condition comparison cases without the low-SOC trigger.
Table 11 summarizes the reported D4 values. Under D4-LSOC, RB-SEMS reduces the reported post-startup Udc deviation from 46.13 V to 40.60 V and the reported BESS peak from 269.18 kW to 84.42 kW. Under D4-NSOC and D4-HSOC, the reported BESS peaks are lower under RB-SEMS, but the Udc deviation increases relative to LCB. These results indicate that BESS transient-stress reduction and DC-bus-voltage deviation are separate objectives rather than a single uniformly improved dynamic metric.
Table 11.
SOC-sensitive D4 comparison based on the reported post-startup and unit-consistent post-processing protocol.
The D4 values are retained as reported post-processed evidence. D4-LSOC is interpreted as the primary low-SOC protection case, whereas D4-NSOC and D4-HSOC are retained as SOC-condition comparison cases. The table is not presented as a replacement rerun. Raw, source-status, and runtime-diagnostic records are kept for internal audit transparency rather than used as final performance metrics (Figure 4).
Figure 4.
Reported D4 SOC-sensitive bounded evidence under the post-startup and unit-consistent post-processing boundary. The panels summarize the reported D4-LSOC, D4-NSOC, and D4-HSOC results for DC-bus deviation, BESS peak, and supervisory mode/protection indicators. D4-LSOC is interpreted as the primary low-SOC protection case, while D4-NSOC and D4-HSOC are retained as SOC-condition comparison cases. The figure summarizes reported post-processed evidence and is not a replacement result.
3.3. Selected Daily Reference-Injection Cross-Scale Assessment
The selected daily reference-injection assessment is retained as a copied-model diagnostic check rather than as validation-quality reference-tracking evidence. Table 7, sections (a)–(c), and Figure 5 report diagnostic metrics for selected daily EMS operating points injected into the copied switching-level model without changing the solver, sample time, PID/MPPT settings, or physical parameters. CV1–CV3 are reported as 0.5 s copied-model diagnostic checks, whereas CV4–CV5 are reported as 0.05 s diagnostic-only checks. These cases document reference-injection provenance and short-window diagnostic behavior, but they are not used as evidence of tracking superiority, validation-quality reference tracking, or full-day switching-level validation.
Figure 5.
Diagnostic metrics for selected daily reference-injection checks. The panels report BESS-power RMSE, grid-power RMSE, post-startup DC-bus maximum absolute deviation, and completed diagnostic window. CV4–CV5 are 0.05 s diagnostic-only checks. The CV cases document copied-model injection behavior and are not used as validation-quality reference-tracking evidence or full-day switching-level validation. Blue, green, red, and orange bars denote BESS-power RMSE, grid-power RMSE, DC-bus deviation, and diagnostic-window duration, respectively.
3.4. Daily Input Profiles and EMS-Level Simulation Framework
The daily EMS study uses 15 min input profiles for a 24 h horizon. Figure 6 shows the E1-TOU operation profile and the designed E2-PCC price–carbon conflict profile. The E2-PCC profile is an input scenario that separates low-price/high-carbon, high-price/low-carbon, and high-price/high-carbon intervals; it is not an output of the EMS and should not be interpreted as measured grid-carbon evidence.
Figure 6.
Daily input profiles for E1-TOU and the designed E2-PCC scenario, including PV availability, EV request, TOU tariff, prescribed carbon-intensity profile, and price–carbon conflict markers.
The daily figures and metrics are computed from the EMS-level time-series outputs. They provide EMS-level daily evidence for energy-management consequences under the defined tariff, carbon, BESS-capacity, power-limit, EV-demand, PV-profile, and closed-cycle terminal SOC assumptions.
3.5. E1-TOU Cost-Oriented Dispatch
The E1-TOU-cost assessment evaluates the ability of TOU-oriented dispatch to reduce daily cost and peak-period grid import using the PV surplus and scheduled BESS discharge under the terminal SOC constraint. Figure 7 and Table 12 compare E1-DLB, PV-SC, RB-SEMS, and MILP rows using the same metric set under shared daily EMS constraints, while Table 13 reports MILP solver-status and objective-anchor information. The comparison shows that RB-SEMS is not cost-optimal under the base E1 profile; its value lies in transparent bounded-reference generation, SOC-sensitive protection logic, interval peak-cap operation, and selected copied-model diagnostic checks for reference-injection provenance.
Figure 7.
Same-metric baseline comparison under shared daily EMS constraints. PV-SC and MILP rows are recomputed into the same daily metric set; RB-SEMS is evaluated as an interpretable rule-based supervisory EMS, not as a cost-optimal or optimization-proven controller.
Table 12.
Same-metric baseline comparison under shared daily EMS constraints.
Table 13.
MILP solver-status and objective-anchor information under the shared daily EMS boundary.
The E1 results include two comparison anchors: a fair PV self-consumption baseline and MATLAB intlinprog MILP dispatch rows recomputed into the same daily metric set. PV-SC and MILP cost-min provide lower-cost anchors than RB-SEMS under the base E1 profile, so RB-SEMS is not presented as cost-optimal or optimization-proven. The MILP rows contextualize the rule-based results under the shared no-export and terminal SOC boundary.
The PV-SC and MILP anchors show that RB-SEMS is not cost-optimal under the base E1 profile. The value of RB-SEMS lies in transparent bounded-reference generation, SOC-sensitive protection logic, interval peak-cap operation, and selected cross-scale tracking evidence, rather than in outperforming PV self-consumption or optimization-based dispatch in the cost objective (Figure 8).
Figure 8.
E1-TOU daily operation details under the shared no-export and terminal SOC assumptions.
Compared with E1-DLB, E1-TOU-cost reduces total cost from 623.57 CNY to 564.05 CNY and electricity cost from 579.55 CNY to 522.55 CNY. The carbon-cost component decreases from 44.01 CNY to 41.49 CNY because the calculated grid-related CO2 emissions decrease from 550.16 kg to 518.64 kg under the prescribed accounting profile. Peak-period grid import decreases from 183.75 kWh to 126.75 kWh, while local PV utilization increases from 71.13% to 78.71%. The aggregate daily EV energy service ratio remains 100%, and terminal SOC remains within the 49–51% closed-cycle terminal SOC band. These values are summarized in Table 14 and visualized with the E1-TOU metrics in Figure 9.
Table 14.
E1-TOU-cost dispatch results under E1-TOU.
Figure 9.
E1-TOU metric details under the unified E1-DLB daily baseline naming convention.
The E1-TOU-cost strategy should not be used as the main evidence for 15 min interval peak reduction because its remains equal to the E1-DLB daily baseline. It supports the cost, peak-period energy, and local PV utilization claim, while the 15 min interval peak-cap claim is evaluated separately in Section 3.6.
3.6. E1-TOU 15 Min Interval Peak-Cap Operation
Section 3.6 separately evaluates the maximum 15 min interval grid-import cap. Figure 10 summarizes the documented base-profile peak-cap scan and the tested PV/EV perturbation boundary for E1-PC66 and E1-PC70.
Figure 10.
Peak-cap feasibility and reproducibility. E1-PC66 is feasible for the documented base profile, E1-PC70 is retained as a conservative comparison, and PV/EV perturbation defines tested feasibility boundaries.
The peak-cap result is reported as a reproducible base-profile result for rather than as a universal feasibility guarantee. The cap is feasible for the documented base profile, while the PV/EV perturbation cases define a tested feasibility boundary, and the cap-scan evidence is used to show how PV/EV variation changes the feasible operating boundary (Table 15).
Table 15.
E1-TOU peak-cap feasibility boundary.
The cap scan identifies the feasible boundary from the dispatch results. The 60 kW target remains a partial-success case with a 66.00 kW achieved peak, a 3.25 h violation marker, and a 6.00 kW maximum violation. The 65 kW target is closer to the boundary but still remains a partial-success case, with a 66.00 kW achieved peak, a 1.50 h violation marker, and a 1.00 kW maximum violation. Both partial cases retain a 100% aggregate daily EV energy service ratio and a final SOC of 50.00%, so the paper classifies them as residual cap-violation cases under the joint BESS/SOC/terminal SOC/EV service constraint set rather than as feasible cap settings. The 66 kW case is the lowest fully achieved cap in the tested scan.
The terminal SOC check confirms that final SOC values in the peak-cap runs are controlled closed-cycle outcomes rather than uncontrolled natural returns. In the 66 kW case, the terminal SOC guard is active for 0.75 h and discharges 43.36 kWh to return the battery to the final 49–51% band; in the 70 kW case, it is active for 1.00 h and discharges 49.77 kWh. The terminal SOC guard ensures fair peak-cap comparisons by avoiding peak reduction caused by end-of-day overcharging or depletion.
A tested-range EMS-level storage, rule-parameter, and profile sensitivity analysis was completed using the same deterministic daily dispatch and screening sources. Table 16 and Table 17 summarize the main-text quantitative ranges for storage settings, selected rule parameters, and PV/EV perturbations. Carbon-profile sensitivity is reported separately in Section 3.7. The sensitivity results document local robustness over the tested ranges and are not used to claim globally optimal parameter settings, exhaustive robustness, or optimal storage sizing.
Table 16.
Main-text summary of tested-range storage and parameter sensitivity.
Table 17.
Rule-parameter and profile sensitivity summary.
3.7. E2-PCC Price–Carbon Conflict and Price-Only Diagnostic
Within the designed E2-PCC scenario, the price-only diagnostic assessment tests whether tariff-only dispatch can produce carbon-risk behavior when the electricity tariff and carbon intensity are not aligned. Figure 11 shows that E2-PO reduces monetary cost relative to E2-DLB but increases calculated grid-related CO2 emissions and high-carbon-period grid import. This behavior indicates that a low tariff does not necessarily imply low carbon intensity under the designed E2-PCC profile.
Figure 11.
E2-PCC daily operation details for the designed price–carbon conflict scenario under the prescribed carbon-intensity profiles.
The price-only diagnostic indicates the need to include carbon intensity explicitly in the supervisory EMS rather than relying only on tariff signals or a fixed monetized carbon-price term. E2-PO is not presented as the proposed carbon-priority strategy; it is a diagnostic dispatch strategy that exposes carbon-risk behavior under the designed E2-PCC profile.
To keep the numerical evidence readable in the main text, the original wide carbon-sensitivity table is separated into three compact tables: profile definitions, CO2-emission sensitivity, and operational consistency indicators. All carbon-intensity values are prescribed inputs for scenario demonstration rather than measured regional grid-carbon data.
In the following tables, , , and denote the grid-related CO2 emissions of E2-DLB, E2-PO, and E2-CP, respectively. The reported differences are defined as .
Here, denotes the BESS throughput, and denotes the terminal SOC.
The E2 carbon-priority results are interpreted within the designed E2-PCC boundary. Table 18, Table 19 and Table 20 report the prescribed carbon-intensity definitions, the corresponding CO2-emission sensitivity, and the operational consistency indicators for the base, flat, amplitude-low, amplitude-high, shift-minus, and shift-plus profiles. These tests support profile-dependence analysis under the documented assumptions; they do not use measured hourly regional carbon data and do not establish a universal CO2-reduction claim (Figure 12).
Table 18.
Prescribed values for the designed E2-PCC carbon-profile sensitivity analysis (kg CO2/kWh).
Table 19.
CO2-emission sensitivity results under the prescribed E2-PCC profiles () and the corresponding differences (kg).
Table 20.
Operational consistency indicators for carbon-profile sensitivity: high-carbon import, , and terminal SOC.
Figure 12.
Carbon-profile sensitivity under the designed E2-PCC scenario. The panels compare E2-DLB, E2-PO, and E2-CP under the prescribed carbon-intensity profiles and show the CP minus the DLB CO2 change. The analysis tests scenario dependence and does not use the measured regional grid-carbon data.
3.8. E2-PCC Carbon-Priority Dispatch Performance
E2-CP is selected as the main E2-PCC carbon-priority dispatch strategy because it explicitly reduces high-carbon grid import under the designed price–carbon conflict profile while maintaining aggregate EV energy service and a closed-cycle terminal SOC. Figure 13 and Table 21 summarize the E2-PCC metrics.
Figure 13.
E2-PCC carbon-priority metrics for the designed scenario demonstration. E2-PO is retained as a diagnostic price-only row, while E2-CP is interpreted under the prescribed carbon-intensity profiles rather than regional grid-carbon validation.
Table 21.
E2-PCC performance of the daily baseline, price-only diagnostic strategy, and carbon-priority dispatch strategy.
Compared with E2-DLB, E2-CP reduces the total cost from 677.13 CNY to 606.64 CNY, the electricity cost from 633.10 CNY to 566.60 CNY, and the grid-related CO2 emissions calculated from the prescribed carbon-intensity profile from 550.29 kg to 500.42 kg. Relative to E2-PO, E2-CP avoids the carbon-risk behavior of charging during low-price/high-carbon periods: E2-PO increases low-price/high-carbon grid import from 200.70 kWh to 263.86 kWh, whereas E2-CP keeps this component at the baseline value of 200.70 kWh and instead reduces high-price/high-carbon import from 264.00 kWh to 197.50 kWh. Under this prescribed E2-PCC profile, the carbon-priority strategy reduces both the calculated emissions and total cost at the expense of higher BESS throughput: 140.18 kWh for E2-CP versus 120.16 kWh for E2-PO.
3.9. Overall Cost-Carbon-BESS Throughput Comparison
The daily EMS results show that cost reduction, 15 min interval peak limitation, CO2 reduction under the prescribed carbon-intensity profiles, and BESS cycling are coupled but non-identical objectives. Figure 14 and Figure 15 summarize the cost-carbon-throughput trade-off and the throughput-based degradation-cost proxy across the final E1/E2 dispatch strategies. The preferred strategy depends on the dominant operating objective: E1-TOU-cost is used for cost and peak-period import reduction, E1-PC66 is used for the 15 min interval peak-cap result, and E2-CP is used for the designed E2-PCC carbon-priority scenario demonstration.
Figure 14.
EMS-level cost-carbon-throughput map using unified E1-DLB and E2-DLB daily baseline labels.
Figure 15.
Throughput-based degradation proxy and adjusted cost. The proxy assigns cdeg = 0.06 CNY/kWh-throughput and reports EFC/day; it is a cycling-cost accounting screen rather than a cell-physics aging model. Blue bars show adjusted total cost on the left axis, and the red line/markers show EFC/day on the right axis.
The trade-off map should be interpreted as an EMS-level daily comparison under the defined profiles and the closed-cycle terminal SOC constraint. It does not replace switching-level validation of daily operating points. Because several cost, peak, or carbon benefits require additional storage cycling, this subsection adds a throughput-based degradation proxy to quantify how sensitive the reported cost benefits are to an assumed cycling-cost coefficient.
For the degradation proxy, the daily BESS throughput is counted as the sum of charged and discharged energy:
The equivalent-full-cycle proxy is then defined as
The throughput-based degradation proxy cost and the degradation-adjusted daily cost are calculated as
The break-even throughput degradation coefficient is defined as the cycling-cost coefficient at which the pre-degradation operating-cost benefit would be fully offset:
Here, is the daily BESS throughput, is the rated BESS energy capacity, is the assumed throughput cost coefficient, is the degradation proxy cost, is the degradation-adjusted daily cost, and is the break-even coefficient relative to the corresponding daily local baseline.
Table 22 separates the storage-use indicators from the degradation-adjusted cost calculation. Cost-oriented and carbon-priority strategies can reduce daily operating costs under their respective scenario assumptions, but the required BESS cycling differs substantially. In particular, the MILP cost-min anchor has the lowest pre-degradation E1 cost, whereas it also requires the greatest throughput in this comparison.
Table 22.
BESS throughput and EFC-based cycling proxy by strategy.
Table 23 applies = 0.06 CNY/kWh-throughput as an accounting screen. Under this assumed coefficient, all strategies with a positive pre-degradation cost benefit retain a positive adjusted-cost benefit, except for the MILP peak-min anchor, which is already cost-disadvantaged before adding the proxy. The break-even coefficient indicates how large the throughput cost would need to be before each pre-degradation benefit is fully offset.
Table 23.
Degradation-adjusted cost and break-even throughput coefficient.
This degradation proxy is not a cell-physics aging model. It is used only to quantify the throughput cost level at which the reported operating-cost benefit would be offset by additional BESS cycling. The adjusted-cost rows therefore provide throughput-based accounting sensitivity rather than electrochemical aging prediction or a global Pareto-frontier proof.
Figure 16 documents the selected daily-reference injection traces as provenance and diagnostic evidence under short windows. The tested-range storage and parameter sensitivity analysis reported in Section 3.6 and summarized in Figure 17 further confirms that the EMS outcomes depend on the storage assumptions, rule parameters, PV/EV perturbations, and prescribed carbon-profile timing or amplitude. These sensitivity results remain local tested-range evidence; they are not variance-complete Sobol indices, do not include cyber-communication layers, and do not make the rule thresholds optimization-proven.
Figure 16.
Diagnostic traces for selected daily reference-injection checks. The traces document copied-model provenance and diagnostic behavior under short windows; they are not used as validation-quality reference-tracking evidence or full-day switching-level validation.
Figure 17.
Main-text tested-range storage and parameter sensitivity summary. The tornado-style panels summarize local changes in total cost, CO2, and maximum 15 min grid import across the documented tested ranges; the result is not an exhaustive robustness or variance-complete Sobol analysis.
The recovered historical 1.5 s MAT run is retained only as an internal diagnostic record and is not used as final performance evidence in the main results.
4. Discussion
4.1. Interpretation of Dual-Time-Scale Evidence
The main value of the dual-time-scale simulation-based evaluation framework is to assign each performance metric to the time scale at which it is physically meaningful. The D1-D4 branch evaluates short-time switching/control behavior, including supervisory traceability, post-startup DC-bus response, BESS transient stress, and SOC-sensitive protection. The E1/E2 branch evaluates 24 h EMS-level consequences, including operating cost, carbon emissions, local PV utilization, aggregate EV energy service, BESS throughput, peak-period grid import, and maximum 15 min interval grid-import cap feasibility. This separation is important because converter-level control studies primarily address dynamic power exchange and real-time operability, whereas daily EMS studies address slower scheduling and accounting metrics [30,31].
The D1-D4 branch provides short-time interpretability and traceability evidence, but each dynamic metric is interpreted within its own post-processing boundary. For D4, the reported values are treated as bounded post-startup and unit-consistent switching/control evidence rather than a replacement for validation. D4-LSOC provides the primary low-SOC protection evidence because it activates the low-SOC trigger and grid-takeover response, whereas D4-NSOC and D4-HSOC are retained as SOC-condition comparison cases. The D4 results should therefore not be interpreted as uniform improvement across every dynamic metric; BESS peak reduction and Udc deviation are separate objectives.
The E1/E2 branch supports a different class of conclusions. It quantifies how the same station-level EMS objectives affect daily cost, carbon, local PV utilization, aggregate EV energy service, BESS throughput, and maximum 15 min interval grid-import peaks under 15 min EMS-level energy-balance assumptions. These results constitute daily EMS evidence rather than full-day converter-stability evidence. Therefore, the proposed framework complements switched converter-control modeling and port-Hamiltonian EVCS control studies by retaining a short-time dynamic branch while also reporting daily tariff, carbon, and peak-cap metrics that are normally outside the scope of converter-only simulations [34].
4.2. Coupling Among PV Generation, BESS Operation, EV Charging Demand, and Grid Exchange
The results should be interpreted from the perspective of a coupled PV-BESS-EV-grid system. PV generation reduces grid dependence only when its temporal availability overlaps with EV charging demand or when surplus PV can be stored within the BESS SOC and power constraints. This explains why PV utilization, EV service, grid import, BESS throughput, and terminal SOC must be evaluated together. Stochastic PV-BESS-EVCS scheduling studies and solar EVCS planning studies similarly show that PV uncertainty, battery power constraints, and charging demand jointly shape feasible station operation [7,8].
The BESS plays a dual role in this coupling. On one hand, storage can absorb PV surplus and release energy during high-tariff, high-demand, or high-carbon periods. On the other hand, BESS flexibility is bounded by charge/discharge power limits, SOC constraints, terminal SOC neutrality, and long-term cycling exposure. Techno-economic PV-BESS-EVCS studies show that storage value depends strongly on tariff and capacity assumptions [9,10], while battery-degradation studies caution that additional cycling should not be treated as free flexibility [39]. The present E1-TOU-cost result is consistent with this interpretation: PV utilization and peak-period import improve only under a closed-cycle terminal SOC constraint. Similarly, the E2-CP result lowers carbon-related metrics but requires additional BESS throughput, which should be understood as a storage-use trade-off rather than a purely beneficial outcome.
Grid exchange is the balancing channel through which these coupled effects become visible. From a power-balance perspective, grid import supports EV service and DC-bus operation when PV and BESS cannot meet demand. From an economic perspective, the same grid import is weighted by the TOU tariff. From a sustainability perspective, it is weighted by the time-varying carbon-intensity factor. Urban PV-EVCS and integrated PV-BESS-EVCS studies show that grid dependence and carbon benefits vary with PV availability, charging demand, and station configuration [13,14]. Multi-objective coordination studies further confirm that grid, storage, renewables, and EV charging objectives cannot be reduced to a single operating metric [25]. This coupling explains why the manuscript reports cost, carbon, peak, PV utilization, EV service, BESS throughput, and terminal SOC as a linked set of indicators.
4.3. Cost–Carbon–Peak Trade-Off
The E1-TOU and E2-PCC results demonstrate that daily cost reduction, 15 min interval peak limitation, and grid-related CO2 reduction under the prescribed carbon-intensity profile are related but separate EMS objectives. In E1-TOU, the E1-TOU-cost strategy reduces the total cost, electricity cost, and peak-period grid-import energy, and improves local PV utilization. However, it is not the main evidence for 15 min interval peak reduction because the maximum 15 min interval grid import remains equal to the daily baseline. This distinction is consistent with demand-charge scheduling studies, which show that minimizing energy cost and controlling billing-period peak demand require different scheduling logic [20]. Distributed EVCS pricing and grid-interface studies likewise indicate that grid constraints can make peak or feasible-region management a separate objective from total cost minimization [22,32].
The E1-PC66 strategy addresses this separate peak objective by enforcing a 66 kW maximum 15 min interval grid-import cap under the tested BESS, SOC, and grid constraints. Such a cap-oriented operation has a practical engineering interpretation: storage may need to be reserved for short high-demand intervals rather than dispatched solely for energy-cost reduction. Online scheduling and menu-based charging research has shown that EVCS operation must often handle user demand, urgency, grid limits, and operational constraints simultaneously [24]. The present peak-cap scan therefore provides a bounded feasibility result rather than an unrestricted guarantee that any lower cap can be achieved.
The E2-PCC scenario highlights a storage–throughput trade-off under the designed price–carbon conflict profile. The price-only diagnostic reduces monetary cost but increases the calculated grid-related CO2 emissions and high-carbon-period grid import because it follows low-price intervals, even when those intervals are high-carbon. In the source data, E2-PO increases low-price/high-carbon grid import from 200.70 kWh to 263.86 kWh and leaves high-price/high-carbon import unchanged at 264.00 kWh. E2-CP avoids this low-price/high-carbon charging behavior and reduces high-price/high-carbon import to 197.50 kWh, which explains why it can reduce both the total cost and calculated CO2 emissions in this prescribed scenario. This is not a measured regional carbon-series result or a universal carbon-reduction claim. The associated increase in BESS throughput indicates that the main trade-off is between cost/carbon improvement and additional storage cycling, degradation, and lifetime cost in future deployment [39,40].
4.4. Comparison with Previous Studies
RB-SEMS is positioned as an interpretable supervisory baseline with bounded evidence, rather than as a replacement for optimization-based EMS or cyber-physical co-simulation. Compared with rule-based EMS, the added contribution is the explicit reference-boundary assessment; compared with MPC/MILP EMS, the contribution is transparent operation with documented baseline comparisons; and compared with carbon-aware EV charging, the contribution is the combination of designed carbon conflict testing and explicit provenance boundaries. The EMS-level GSA-lite screening is interpreted relative to cyber-physical power-system (CPPS) GSA work that uses coupled cyber-physical modeling and Sobol sensitivity analysis [41], while cyber-communication co-simulation and variance-complete Sobol analysis remain future work for the present station-level EMS.
Compared with planning and techno-economic PV-BESS-EVCS studies, the present work does not optimize station siting, PV/BESS sizing, or long-term investment timing. Fuzzy planning, highway allocation, residential planning, transportation-aware multistage planning, and hybrid renewable EVCS studies provide important evidence that charging infrastructure must be planned with PV, storage, demand response, traffic, and grid constraints in mind [11,12]. Other studies optimize PV-BESS capacity and scheduling simultaneously or evaluate hybrid on/off-grid renewable EVCS configurations under techno-economic objectives [17,42]. These studies are essential for infrastructure design, but they usually do not expose short-time supervisory mode transitions or SOC-sensitive protection behavior. The present paper complements them by retaining a fixed station architecture and examining how a supervisory EMS behaves under both switching/control disturbances and daily EMS-level profiles.
Compared with daily scheduling, pricing, and renewable-consumption studies, the present work emphasizes interpretable supervisory operation and clearly separated evaluation time scales. Fleet scheduling and charging management studies show that EV demand can be coordinated with PV storage stations or renewable output through optimization and price-based mechanisms [21,23]. Hierarchical pricing and multi-objective coordination studies further demonstrate that station operation can be embedded in broader grid, market, or renewable-consumption frameworks [22,25]. The present RB-SEMS is deliberately simpler: it uses explicit rules and closed-cycle terminal SOC constraints to evaluate TOU-cost, peak-cap, and carbon-priority behavior without presenting the schedules as optimization-proven.
Compared with converter-level and real-time control studies, this paper adds daily sustainability-oriented metrics while preserving short-time dynamic traceability. PV-BESS-grid fast-charging and PV-EV MPC studies provide important evidence for dynamic power management and real-time station control [30,31]. Port-Hamiltonian EVCS modeling further emphasizes that converter dynamics and switched simulations are central when stability or physical implementation is the claim [34]. The present paper does not replace such converter-level validation; rather, it places selected short-time switching/control tests alongside daily EMS-level simulations so that dynamic traceability and daily cost–carbon–peak performance are not conflated.
Compared with learning-based and risk-aware EV charging studies, the present EMS is intentionally more transparent and less algorithmically complex. Safe reinforcement learning, carbon-oriented safe RL, highway RL, and transformer-based multi-agent RL studies show that intelligent controllers can address complex charging problems but require careful state representation, action saturation, reward design, communication structure, and safety assurance [29,35]. Risk-aware P2P trading and multi-station RL studies also address network-level or collaborative settings that are beyond the scope of the present single-station evidence chain [37,38]. The current RB-SEMS can therefore serve as a controlled baseline for future MPC, stochastic, or RL-EMS comparisons, provided that the data boundary, terminal SOC constraint, and evaluation metrics remain fixed [36].
4.5. Engineering Implications
The first engineering implication is that a supervisory EMS can be integrated above retained local converter controllers without replacing all lower-level control loops. This integration pathway is practical for PV-BESS-EV stations because the supervisory layer generates modes and bounded references, while the converter-level controllers remain responsible for local current, voltage, and power-loop behavior. This layered design is consistent with EVCS control studies that distinguish station-level power management from converter-level implementation [30,34].
Second, station operators should evaluate EMS performance using a multi-metric evaluation framework rather than a single cost indicator. The E1/E2 results show that the total cost, peak-period energy, 15 min interval peak import, carbon emissions, local PV utilization, aggregate EV energy service ratio, BESS throughput, and terminal SOC describe different aspects of station operation. Reporting only cost could hide carbon-risk behavior; reporting only carbon could hide BESS cycling stress; and reporting only peak power could hide improvements in peak-period energy or PV absorption. Studies on user-grid balance and charging-station management similarly support the need to evaluate user service, grid requirements, renewable integration, and storage operation together [5].
Third, carbon-signal-aware operation should retain grid carbon intensity as an explicit time-varying input rather than collapsing all environmental information into a fixed carbon-price term. The E2-PCC diagnostic shows that a tariff-only rule can increase high-carbon-period import when low-price and high-carbon intervals coincide under the designed profile. This supports practical EMS designs in which tariff and carbon-intensity channels are separately monitored and weighted according to the operating objective [26,27].
Fourth, validation should proceed in stages. Short-time switching/control simulations are appropriate for critical transitions, source/load disturbances, post-startup DC-bus response, and SOC-protection behavior. EMS-level daily simulations are appropriate for cost, carbon, local PV utilization, EV service, BESS throughput, and peak-cap assessment. Selected daily operating points should then be tested in switching/control simulations and ultimately in HIL or experimental platforms when communication delay, grid events, converter limits, and measurement noise need to be evaluated [33]. This staged workflow avoids overextending daily EMS-level evidence while still using daily simulations to identify which operating points deserve more detailed validation.
4.6. Limitations and Future Work
Several limitations should be recognized when interpreting the present results. First, the selected daily reference-injection cases were completed only as copied-model diagnostic checks. CV1–CV3 were quantified over 0.5 s windows and CV1–CV5 over 0.05 s windows, but these cases document reference-injection provenance and short-window diagnostic behavior rather than validation-quality reference tracking or full-day switching-level validation. The recovered historical 1.5 s MAT run is therefore retained only as an internal diagnostic record and is not used as final performance evidence in the main results.
Second, the carbon-aware results are based on a designed E2-PCC price–carbon conflict scenario and alternative prescribed carbon-intensity profiles. These profiles are useful for testing whether tariff-only and carbon-priority dispatch rules behave differently when price and carbon signals are misaligned, but they do not measure regional hourly carbon-intensity data. Consequently, the E2-CP results should be interpreted as a reproducible scenario demonstration under documented assumptions rather than as regionally validated or universal CO2-reduction evidence. Future work should replace the prescribed profiles with measured regional and seasonal carbon-intensity series, assess the sensitivity of the dispatch conclusions across longer time horizons, and quantify uncertainty in carbon-accounting outcomes.
Third, the present RB-SEMS is an interpretable supervisory baseline rather than an optimization-proven controller. The same-metric PV-SC and MATLAB intlinprog MILP comparisons show that RB-SEMS is not cost-optimal under the base E1 profile, while the tested-range storage and parameter sensitivity results provide local evidence only over the selected ranges. The EMS-level GSA-lite screening is not a variance-complete Sobol sensitivity analysis and does not include cyber-communication or networked cyber-physical co-simulation layers. Future studies should benchmark RB-SEMS against MPC, stochastic optimization, and reinforcement-learning EMS methods under identical input profiles, terminal SOC constraints, safety limits, action saturation boundaries, and evaluation metrics.
Fourth, the degradation assessment is intentionally limited to a throughput-based accounting proxy. Although BESS throughput, EFC/day, degradation-adjusted cost, and break-even throughput coefficients help prevent misleading cost comparisons, they do not represent a cell-physics battery-aging model. Future degradation-aware EMS formulations should include depth-of-discharge dependence, C-rate effects, calendar aging, thermal constraints, and battery-temperature dynamics, especially for peak-cap and carbon-priority strategies that increase storage utilization.
Finally, the D4 results are reported within a bounded post-startup and unit-consistent post-processing boundary. D4-LSOC provides the strongest evidence for SOC-sensitive protection because the low-SOC trigger and grid-takeover response are active, whereas D4-NSOC and D4-HSOC are retained as comparison cases showing that BESS transient-stress reduction and DC-bus voltage response may diverge. Future work should conduct complete replacement reruns, higher-fidelity switching/control validation, and hardware-in-the-loop or experimental tests for selected operating points, including mode transitions, 15 min interval peak-cap intervals, high-carbon/low-carbon transitions, communication delays, measurement uncertainty, grid events, and converter-interface constraints.
5. Conclusions
This study developed and evaluated a bounded-reference, rule-based supervisory energy management system for a grid-connected PV-BESS-EV charging station. The central objective was not to replace optimization-based or converter-level controllers, but to provide an interpretable supervisory baseline that can coordinate tariff response, carbon-intensity signals, peak-cap operation, SOC-sensitive BESS protection, EV service requirements, and storage throughput implications within a clearly defined evidential framework. By retaining lower-level local converter controllers and adding a rule-based supervisory layer that generates operating modes and saturated reference channels, the proposed RB-SEMS provides a transparent structure for examining how daily EMS decisions and short-time dynamic evidence can be interpreted without conflating their time scales.
The dual-time-scale evaluation framework is the main methodological contribution of this work. Short-time switching/control simulations were used to examine dynamic traceability, DC-bus behavior, and SOC-sensitive protection, whereas 24 h EMS-level simulations with 15 min resolution were used to quantify daily cost, CO2 emissions under the prescribed profiles, peak-period import, maximum 15 min grid import, local PV utilization, EV service ratio, terminal SOC, and BESS throughput. The selected daily reference-injection cases were retained only as copied-model diagnostic checks for reference-injection provenance and short-window diagnostic behavior; they were not used as validation-quality reference-tracking evidence or full-day switching-level validation. This separation clarifies which conclusions are supported by fast dynamic tests and which are supported by daily EMS-level accounting.
The D4 results show that the value of RB-SEMS is most clearly observed under the low-SOC protection condition. In D4-LSOC, where the low-SOC trigger and grid-takeover response are active, RB-SEMS reduces the reported post-startup DC-bus deviation from 46.13 V to 40.60 V and the filtered BESS peak from 269.18 kW to 84.42 kW. The NSOC and HSOC comparison cases further indicate that BESS transient-stress reduction and DC-bus voltage deviation are not the same objective and should not be interpreted as uniformly improved dynamic performance. Thus, the dynamic evidence supports SOC-sensitive supervisory behavior under bounded post-startup conditions and unit-consistent interpretation, rather than a general claim that all fast-time-scale indices improve under RB-SEMS.
The daily EMS-level results demonstrate that cost, peak, carbon, PV utilization, EV service, and BESS cycling must be evaluated as a coupled set of station-level indicators. Under the E1-TOU scenario, E1-TOU-cost reduces the daily total cost from 623.57 CNY to 564.05 CNY and the electricity cost from 579.55 CNY to 522.55 CNY, while reducing peak-period grid import from 183.75 kWh to 126.75 kWh and increasing local PV utilization from 71.13% to 78.71%. However, its maximum 15 min grid import remains unchanged, confirming that energy-cost reduction and interval peak limitation are distinct objectives. The E1-PC66 case addresses this separate peak objective by reducing the maximum 15 min grid-import peak from 77.88 kW to 66.00 kW, a 15.25% reduction, and the cap scan identifies 66 kW as the lowest fully achieved cap under the documented base profile and tested BESS, SOC, terminal SOC, and EV service constraints.
The designed E2-PCC scenario further shows why tariff and carbon intensity should be treated as separate EMS inputs. The price-only diagnostic strategy reduces monetary cost but increases the calculated grid-related CO2 emissions from 550.29 kg to 572.29 kg by increasing low-price/high-carbon grid import from 200.70 kWh to 263.86 kWh. In contrast, the E2-CP carbon-priority strategy avoids this low-price/high-carbon charging behavior, reduces high-price/high-carbon import from 264.00 kWh to 197.50 kWh, and decreases the calculated grid-related CO2 emissions to 500.42 kg under the base prescribed profile. These findings demonstrate the operational effect of explicit carbon-intensity signals in a reproducible price–carbon conflict scenario, but they should not be interpreted as measured regional carbon-data validation or as universal CO2-reduction evidence.
Same-metric PV-SC and MILP comparisons place the rule-based strategy in an appropriate performance context. The results show that RB-SEMS is not cost-optimal under the base E1 profile and should not be interpreted as an optimization-proven controller. Its contribution lies instead in transparent bounded-reference generation, SOC-sensitive protection logic, interval peak-cap operation, multi-metric EMS accounting, and documented scenario-dependent carbon-priority behavior. The tested-range storage and parameter sensitivity results further support local robustness over the selected ranges, while the throughput-based degradation proxy shows how the reported cost benefits depend on additional BESS cycling. This proxy is an accounting screen rather than a cell-physics aging model.
Overall, the revised evidence supports RB-SEMS as a transparent supervisory baseline for analyzing cost–carbon–peak–cycling trade-offs in PV-BESS-EV charging-station operation under documented assumptions. Future work should extend the present evidence chain in three directions: measured regional and seasonal carbon-intensity data should be used to replace the prescribed E2-PCC profiles; HIL or experimental validation should be conducted for selected operating points with communication delays, measurement uncertainty, grid events, and converter constraints; and degradation-aware EMS formulations should incorporate depth-of-discharge, C-rate, calendar aging, and thermal effects. Under identical data and constraint boundaries, future MPC, stochastic optimization, and reinforcement learning EMS benchmarks can then be evaluated against the present rule-based supervisory baseline.
Author Contributions
Conceptualization, Z.L. and F.J.; methodology, Z.L.; software, Z.L.; validation, Z.L., Y.Z., and Z.M.; formal analysis, Z.L.; investigation, Z.L. and Y.Z.; resources, Z.M. and F.J.; data curation, Z.L.; writing—original draft preparation, Z.L.; writing—review and editing, Z.L., Y.Z., Z.M., and F.J.; visualization, Z.L.; supervision, F.J.; project administration, Z.M. and F.J.; funding acquisition, F.J. All authors have read and agreed to the published version of the manuscript.
Funding
This research was funded by the State Grid Qinghai Electric Power Company Ultra-High-Voltage Company under the project “Research on New Intelligent Operation and Maintenance Technologies for Target Recognition of Insulators and Fittings of Transmission Lines in High-Altitude Areas”, grant number 522821250001. The APC was funded by the State Grid Qinghai Electric Power Company Ultra-High-Voltage Company.
Institutional Review Board Statement
Not applicable.
Informed Consent Statement
Not applicable.
Data Availability Statement
The original contributions presented in this study are included in the article. Further inquiries can be directed to the corresponding author.
Acknowledgments
The authors thank Qinghai University for providing academic and research support during the preparation of this study.
Conflicts of Interest
The authors declare that this study received funding from State Grid Qinghai Electric Power Company Ultra-High-Voltage Company under the project “Research on New Intelligent Operation and Maintenance Technologies for Target Recognition of Insulators and Fittings of Transmission Lines in High-Altitude Areas”, grant number 522821250001. The funder was not involved in the study design, collection, analysis, interpretation of data, the writing of this article or the decision to submit it for publication.
Abbreviations
| BESS | Battery energy storage system |
| EMS | Energy management system |
| EV | Electric vehicle |
| EVCS | Electric vehicle charging station |
| HIL | Hardware-in-the-loop |
| MPC | Model predictive control |
| PV | Photovoltaic |
| SOC | State of charge |
| TOU | Time of use |
| LCB | Local-control baseline |
| RB-SEMS | Rule-based supervisory energy management system |
| PCC | Price–carbon conflict |
| RL-EMS | Reinforcement learning-based energy management system |
| DLB | Daily local baseline |
References
- Ghanbari Motlagh, S.; Oladigbolu, J.; Li, L. A review on electric vehicle charging station operation considering market dynamics and grid interaction. Appl. Energy 2025, 392, 126058. [Google Scholar] [CrossRef] [Scilit]
- Salim, A.; Ab Aziz, N.F.B.; Mohammed, K.K.; Rahmat, N.A.B.; Mekhilef, S. Optimization approaches for energy management system in electric vehicle charging station: A comprehensive review. J. Power Sources 2026, 676, 239752. [Google Scholar] [CrossRef] [Scilit]
- Xin, W.; Lu, Z.; Yu, Z.; He, Z.; Pu, H.; Ye, B. Aggregator-driven optimisation of electric vehicle charging stations in Shenzhen: Synergising smart charging, renewable energy integration and energy storage. Appl. Energy 2025, 397, 126345. [Google Scholar] [CrossRef] [Scilit]
- Trang, N.T.Q.; Okada, K.; Sugiyama, Y.; Yoshida, T.; Hirano, Y.; Jittrapirom, P.; Nakaegawa, T.; Kobashi, T. On the decarbonization potentials of rooftop PVs integrated with EVs as battery for all the municipalities of Japan. Appl. Energy 2025, 393, 126067. [Google Scholar] [CrossRef] [Scilit]
- Rehman, A.U.; Lu, J.; Du, B.; Bai, F.; Sanjari, M.J. Efficient management of electric vehicle charging stations: Balancing user preferences and grid demands with energy storage systems and renewable energy. Appl. Energy 2025, 393, 126147. [Google Scholar] [CrossRef] [Scilit]
- Zhao, A.P.; Li, S.; Li, Z.; Wang, Z.; Fei, X.; Hu, Z.; Alhazmi, M.; Yan, X.; Wu, C.; Lu, S.; et al. Electric vehicle charging planning: A complex systems perspective. IEEE Trans. Smart Grid 2025, 16, 754–772. [Google Scholar] [CrossRef] [Scilit]
- Dong, X.-J.; Shen, J.-N.; Ma, Z.-F.; He, Y.-J. Stochastic optimization of integrated electric vehicle charging stations under photovoltaic uncertainty and battery power constraints. Energy 2025, 314, 134163. [Google Scholar] [CrossRef] [Scilit]
- Ozturk, Z.; Demirci, A.; Terkes, M.; Yumurtaci, R. Optimal planning of solar PV-based electric vehicle charging stations empowered by energy storage system: Feasibility and green charge potential. Renew. Energy 2025, 255, 123715. [Google Scholar] [CrossRef] [Scilit]
- Pinheiro Neto, D.; Coimbra, A.P.; Moura, P.; de Almeida, T.R.; de Almeida, A.T. Multi-objective techno-economic optimization of hybrid photovoltaic and battery energy storage systems for electric vehicle charging stations. Renew. Energy 2026, 259, 125138. [Google Scholar] [CrossRef] [Scilit]
- Hull, C.; Wust, J.; Booysen, M.J.; McCulloch, M.D. Techno-economic optimization and assessment of solar-battery charging station under grid constraints with varying levels of fleet EV penetration. Appl. Energy 2024, 374, 123990. [Google Scholar] [CrossRef] [Scilit]
- Lin, J.; Qiu, J.; Tao, Y.; Sun, X. Planning of electric vehicle charging stations with PV and energy storage using a fuzzy inference system. IEEE Trans. Transp. Electrif. 2024, 10, 5894–5909. [Google Scholar] [CrossRef] [Scilit]
- Hammam, A.H.; Nayel, M.A.; Mohamed, M.A. Optimal design of sizing and allocations for highway electric vehicle charging stations based on a PV system. Appl. Energy 2024, 376, 124284. [Google Scholar] [CrossRef] [Scilit]
- Huang, W.; Wang, J.; Wang, J.; Zeng, H.; Zhou, M.; Cao, J. Assessment of the technical economic viability and carbon reduction potential of urban-scale photovoltaic generation for electric vehicle charging station. Renew. Sustain. Energy Rev. 2025, 210, 115190. [Google Scholar] [CrossRef] [Scilit]
- Dong, X.-J.; Shen, J.-N.; Liu, C.-W.; Ma, Z.-F.; He, Y.-J. Simultaneous capacity configuration and scheduling optimization of an integrated electrical vehicle charging station with photovoltaic and battery energy storage system. Energy 2024, 289, 129991. [Google Scholar] [CrossRef] [Scilit]
- He, L.; Wu, Z. Advancing sustainable EV charging infrastructure: A hybrid solar-wind fast charging station with demand response. Renew. Energy 2024, 237, 121843. [Google Scholar] [CrossRef] [Scilit]
- Dejkam, R.; Madlener, R. Green mobility infrastructure: A techno-economic analysis of hybrid wind-solar PV charging stations for electric vehicles in Germany. Energy 2025, 334, 137450. [Google Scholar] [CrossRef] [Scilit]
- Wang, P.; Yuan, J. Adaptive multi-stage planning of electric vehicle charging infrastructure with photovoltaic and energy storage systems: A transportation-aware optimization approach. Appl. Energy 2026, 410, 127517. [Google Scholar] [CrossRef] [Scilit]
- Zhang, M.; Yan, Q.; Guan, Y.; Ni, D.; Agundis Tinajero, G.D. Joint planning of residential electric vehicle charging station integrated with photovoltaic and energy storage considering demand response and uncertainties. Energy 2024, 298, 131370. [Google Scholar] [CrossRef] [Scilit]
- Li, Y.; Duan, J.; Pan, L.; Ishizaki, T.; Gao, L.; Zeng, Z. Online multiobjective optimization for electric vehicle charging station operation. IEEE Trans. Transp. Electrif. 2024, 10, 8640–8655. [Google Scholar] [CrossRef] [Scilit]
- Yang, L.; Geng, X.; Guan, X.; Tong, L. EV charging scheduling under demand charge: A block model predictive control approach. IEEE Trans. Autom. Sci. Eng. 2024, 21, 2125–2138. [Google Scholar] [CrossRef] [Scilit]
- Hu, X.; Li, H.; Xie, C. Optimal charging scheduling of an electric bus fleet with photovoltaic-storage-charging stations. Appl. Energy 2025, 390, 125714. [Google Scholar] [CrossRef] [Scilit]
- Meng, W.; Song, D.; Huang, L.; Chen, X.; Yang, J.; Dong, M.; Talaat, M.; Elkholy, M.H. Distributed energy management of electric vehicle charging stations based on hierarchical pricing mechanism and aggregate feasible regions. Energy 2024, 291, 130332. [Google Scholar] [CrossRef] [Scilit]
- Ni, F.; Xiang, Y.; Wang, S.; Hu, Z.; Liu, F.; Xu, X.; Jiang, Y.; Wang, Y. Charging management of electric vehicles with consumption of renewable energy. Energy 2025, 321, 135264. [Google Scholar] [CrossRef] [Scilit]
- Mathioudaki, A.; Tsaousoglou, G.; Varvarigos, E.; Fotakis, D. Online menu-based scheduling of electric vehicle charging. IEEE Trans. Smart Grid 2025, 16, 2478–2491. [Google Scholar] [CrossRef] [Scilit]
- Shao, M.; Yin, X. Multi-objective optimal coordination of electric vehicle charging, power grid, energy storages and renewables. J. Clean. Prod. 2024, 474, 143528. [Google Scholar] [CrossRef] [Scilit]
- Silva, C.A.M.; Bessa, R.J. Carbon-aware dynamic tariff design for electric vehicle charging stations with explainable stochastic optimization. Appl. Energy 2025, 389, 125674. [Google Scholar] [CrossRef] [Scilit]
- Du, B.; Jia, H.; Zhang, B.; Li, Y.; Wang, H.; Yan, J.; Du, E.; Zhang, N. Evaluating the carbon-emission reduction potential of employing low-carbon demand response to guide electric-vehicle charging: A Chinese case study. Appl. Energy 2025, 397, 126196. [Google Scholar] [CrossRef] [Scilit]
- Will, C.; Zimmermann, F.; Ensslen, A.; Fraunholz, C.; Jochem, P.; Keles, D. Can electric vehicle charging be carbon neutral? Uniting smart charging and renewables. Appl. Energy 2024, 371, 123549. [Google Scholar] [CrossRef] [Scilit]
- Shi, X.; Xu, Y.; Chen, G.; Guo, Y. An augmented Lagrangian-based safe reinforcement learning algorithm for carbon-oriented optimal scheduling of EV aggregators. IEEE Trans. Smart Grid 2024, 15, 795–809. [Google Scholar] [CrossRef] [Scilit]
- Elsanabary, A.; Khairullah, K.; Ab Aziz, N.F.; Mekhilef, S. Power management and optimized control of hybrid PV-BESS-grid integrated fast EV charging stations. J. Energy Storage 2024, 90, 111802. [Google Scholar] [CrossRef] [Scilit]
- Watil, A.; Chojaa, H. Enhancing grid-connected PV-EV charging station performance through a real-time dynamic power management using model predictive control. Results Eng. 2024, 24, 103192. [Google Scholar] [CrossRef] [Scilit]
- Saber, H.; Ranjbar, H.; Hajipour, E.; Shahidehpour, M. Two-stage coordination scheme for multiple EV charging stations connected to an exclusive DC feeder considering grid-tie converter limitation. IEEE Trans. Transp. Electrif. 2024, 10, 8213–8223. [Google Scholar] [CrossRef] [Scilit]
- Ucer, E.; Kisacikoglu, M.J. Development of a hardware-in-the-loop testbed for a decentralized, data-driven electric vehicle charging control algorithm. IEEE Trans. Ind. Appl. 2024, 60, 6622–6633. [Google Scholar] [CrossRef] [Scilit]
- Gernandt, H.; Severino, B.; Zhang, X.; Mehrmann, V.; Strunz, K. Port-Hamiltonian modeling and control of electric vehicle charging stations. IEEE Trans. Transp. Electrif. 2025, 11, 2897–2907. [Google Scholar] [CrossRef] [Scilit]
- Guan, Y.; Zhang, J.; Ma, W.; Che, L. Rule-based shields embedded safe reinforcement learning approach for electric vehicle charging control. Int. J. Electr. Power Energy Syst. 2024, 157, 109863. [Google Scholar] [CrossRef] [Scilit]
- Xie, H.; Song, G.; Shi, Z.; Peng, L.; Feng, D.; Song, X. Stable energy management for highway electric vehicle charging based on reinforcement learning. Appl. Energy 2025, 389, 125541. [Google Scholar] [CrossRef] [Scilit]
- Song, G.; Xie, H.; Zhang, J.; Fu, H.; Shi, Z.; Feng, D.; Song, X.; Zhang, H. Long-term efficient energy management for multi-station collaborative electric vehicle charging: A transformer-based multi-agent reinforcement learning approach. Appl. Energy 2025, 397, 126315. [Google Scholar] [CrossRef] [Scilit]
- Chen, X.; Wang, X.; Shahidehpour, M. Risk-aware hierarchical coordination of peer-to-peer energy trading for electric vehicle charging stations in constrained power distribution and urban transportation networks under uncertainties. IEEE Trans. Transp. Electrif. 2024, 10, 9264–9280. [Google Scholar] [CrossRef] [Scilit]
- Sagaria, S.; van der Kam, M.; Bostrom, T. Vehicle-to-grid impact on battery degradation and estimation of V2G economic compensation. Appl. Energy 2025, 377, 124546. [Google Scholar] [CrossRef] [Scilit]
- Sharma, J.; Sundarabalan, C.K.; Balasundar, C. Advanced energy management strategy for enhancing battery lifespan in solar PV-powered EV charging stations with hybrid energy storage systems. Renew. Energy 2025, 251, 123443. [Google Scholar] [CrossRef] [Scilit]
- Qiu, D.; Zhang, S.; Luo, T.; Zhang, X. Global sensitivity analysis for cyber-physical power distribution network. IEEE Trans. Ind. Cyber-Phys. Syst. 2026, 4, 213–224. [Google Scholar] [CrossRef] [Scilit]
- Gonul, O.; Duman, A.C.; Guler, O. Multi-objective optimal sizing and techno-economic analysis of on- and off-grid hybrid renewable energy systems for EV charging stations. Sustain. Cities Soc. 2024, 115, 105846. [Google Scholar] [CrossRef] [Scilit]
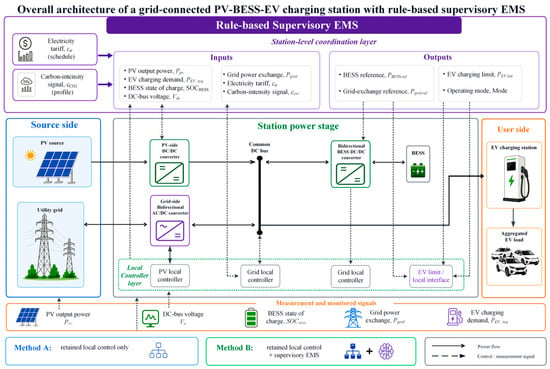
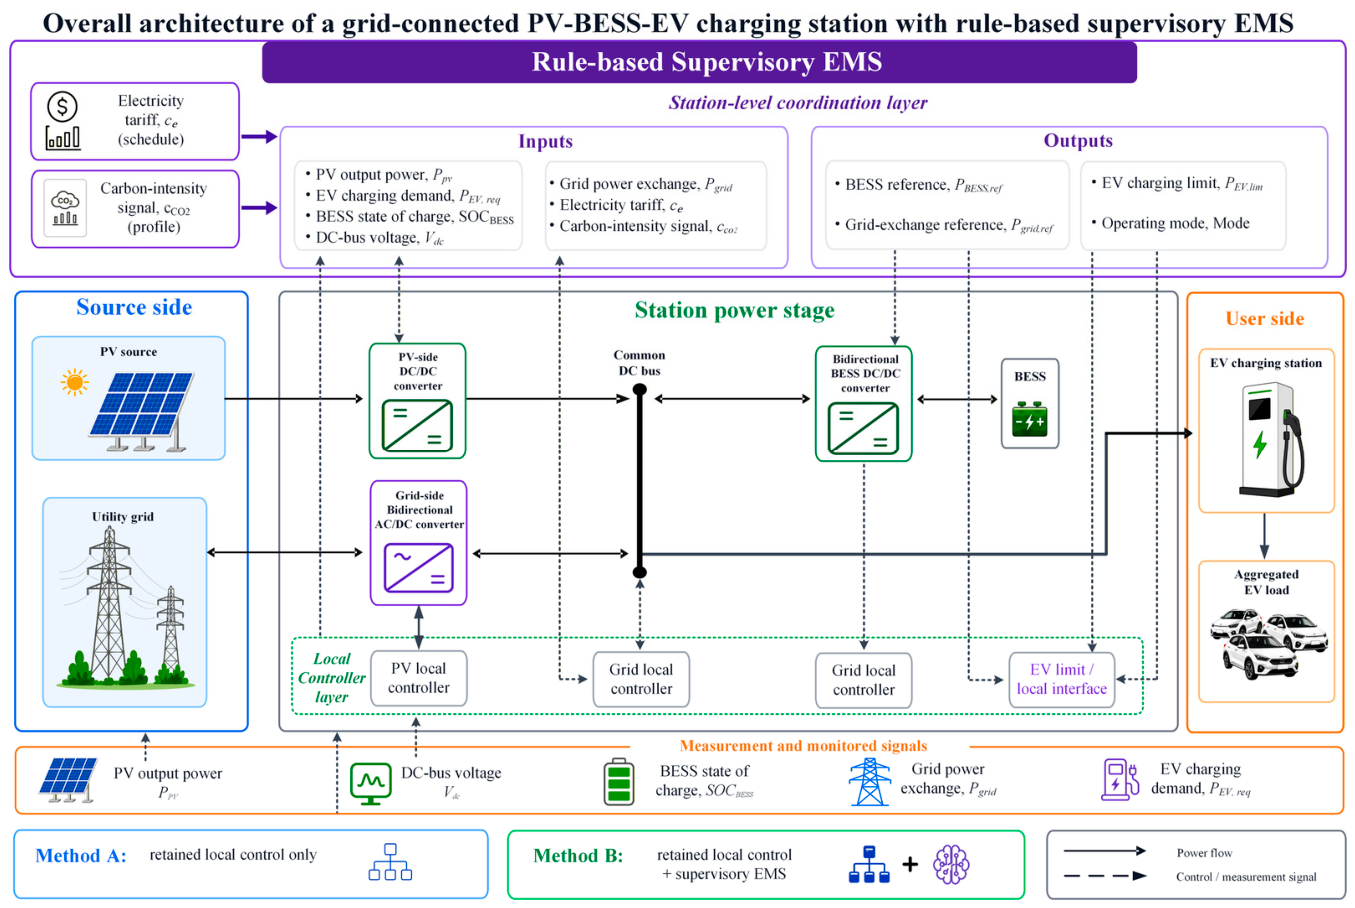
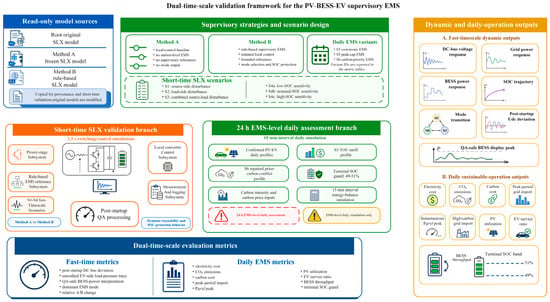
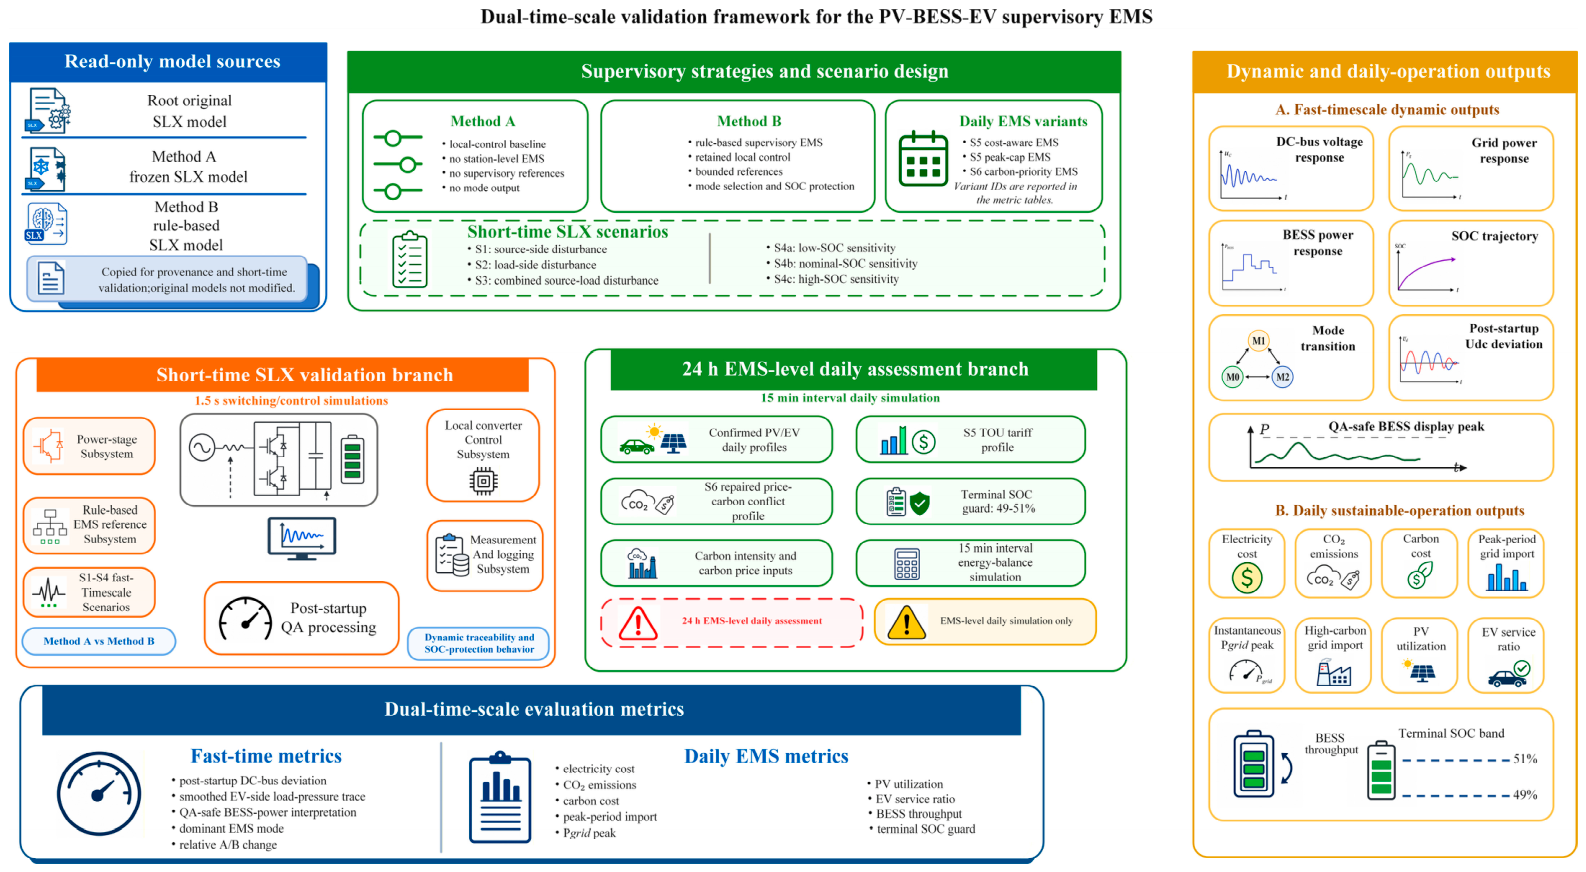
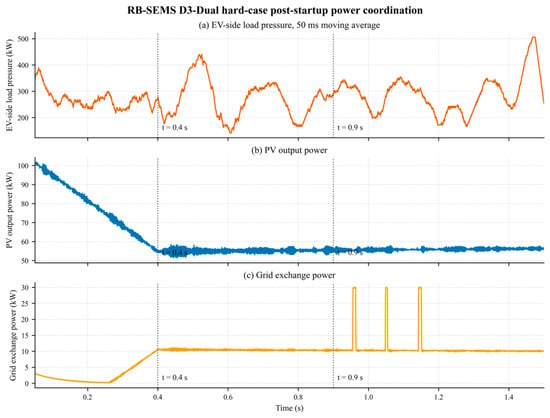
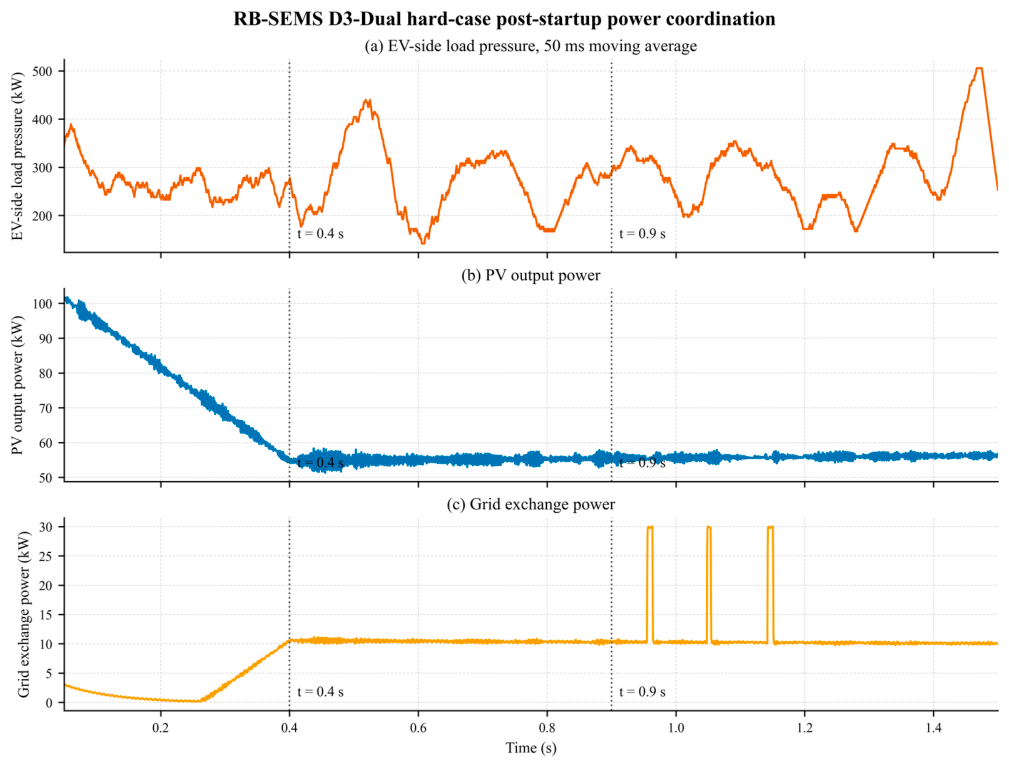
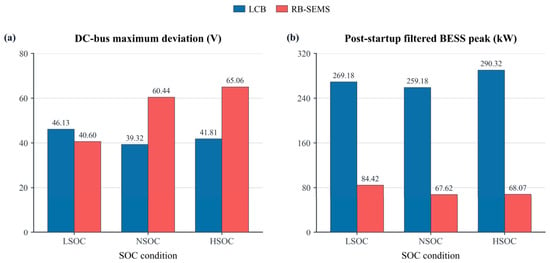
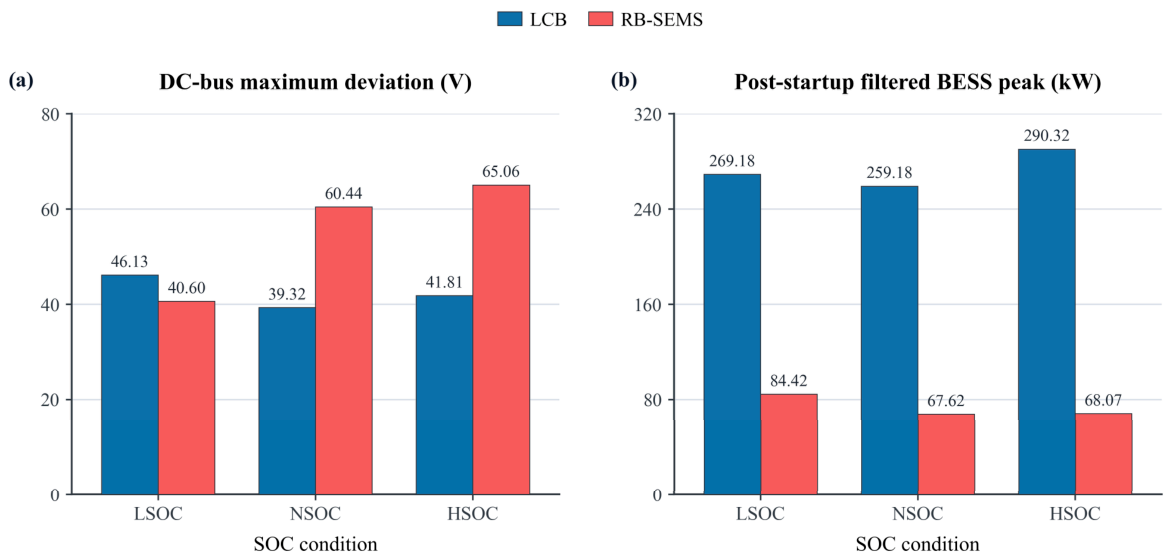
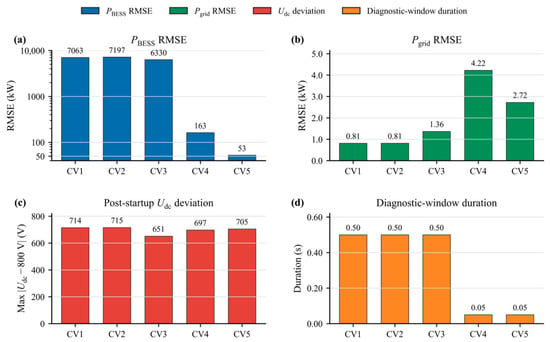
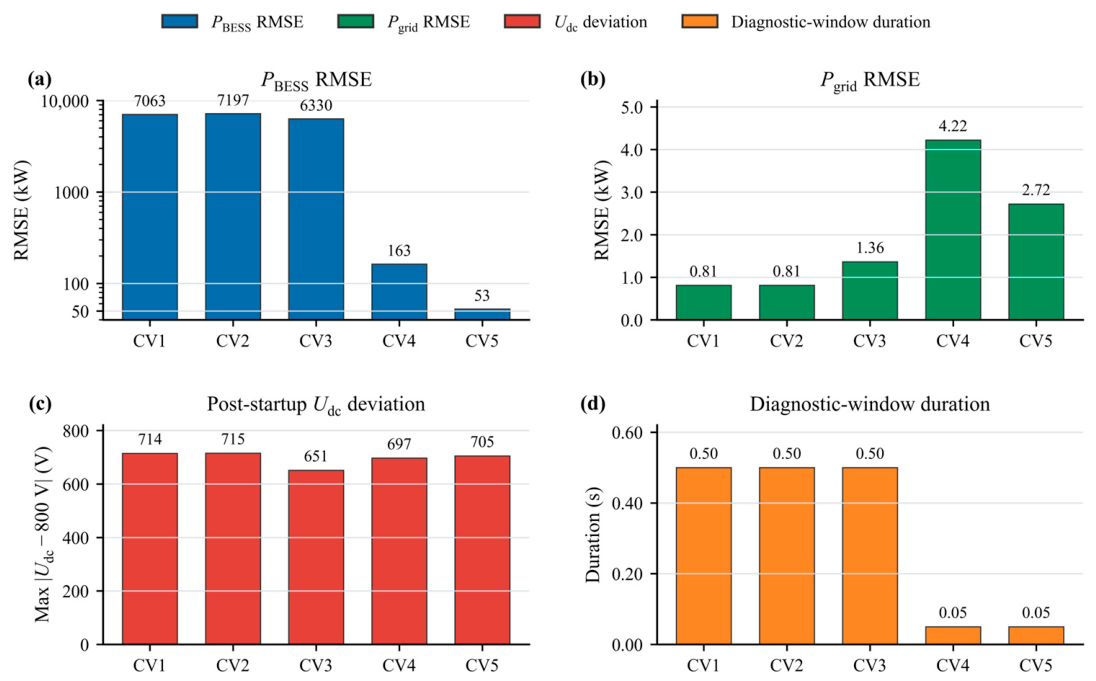
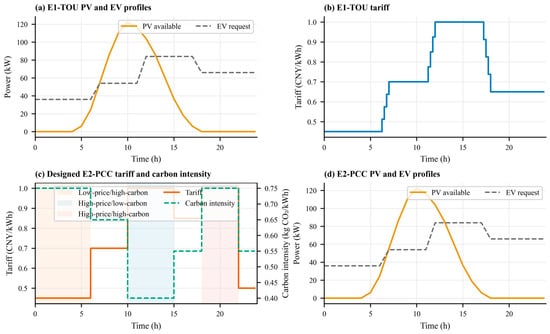
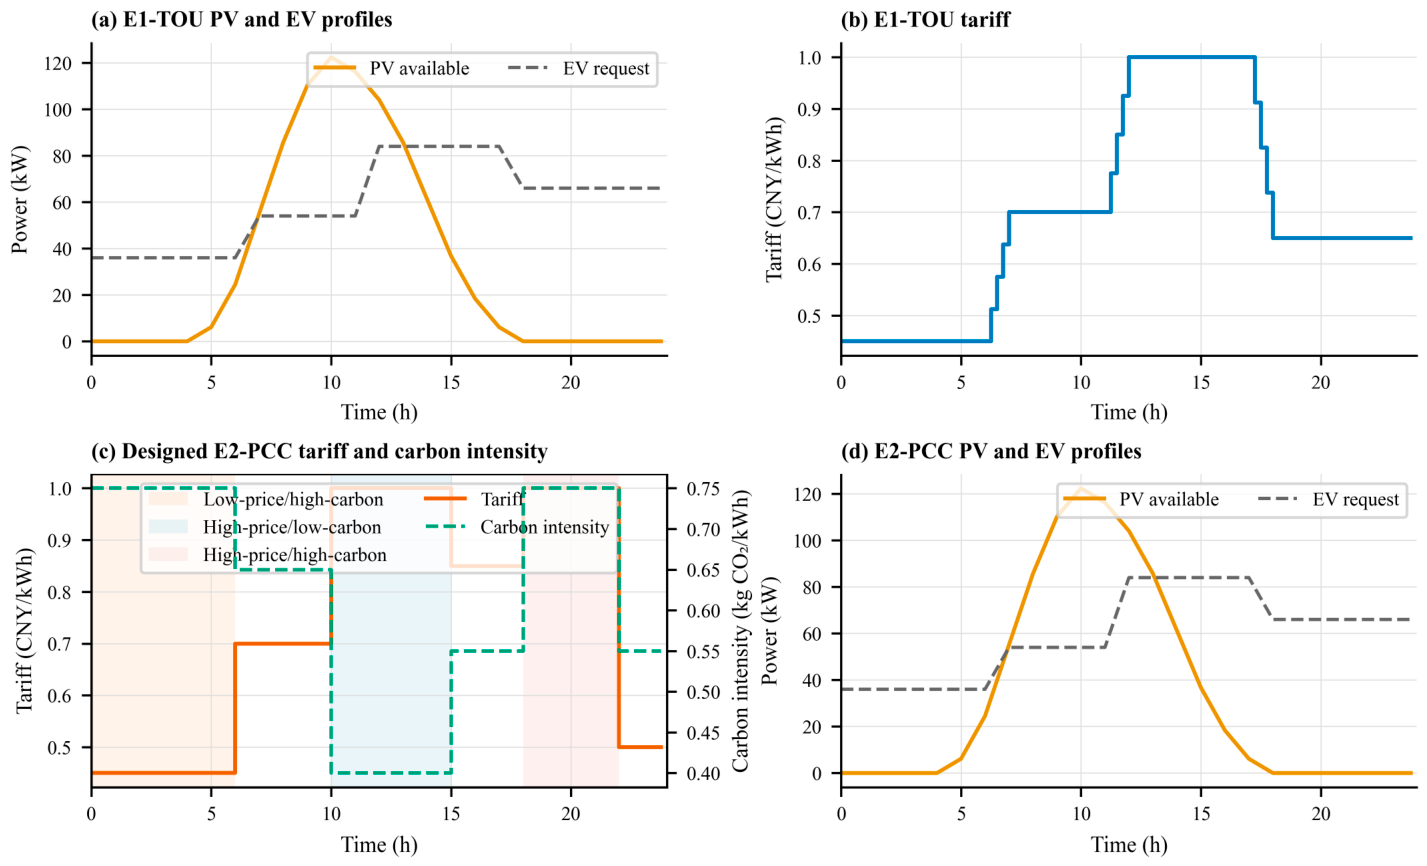
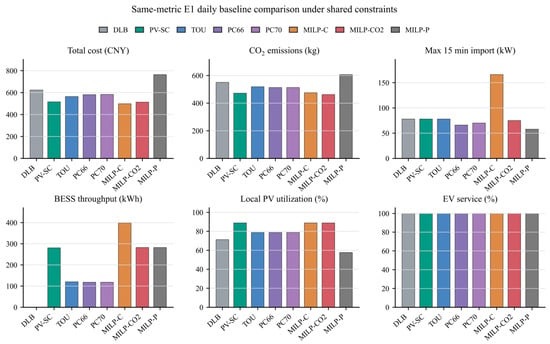
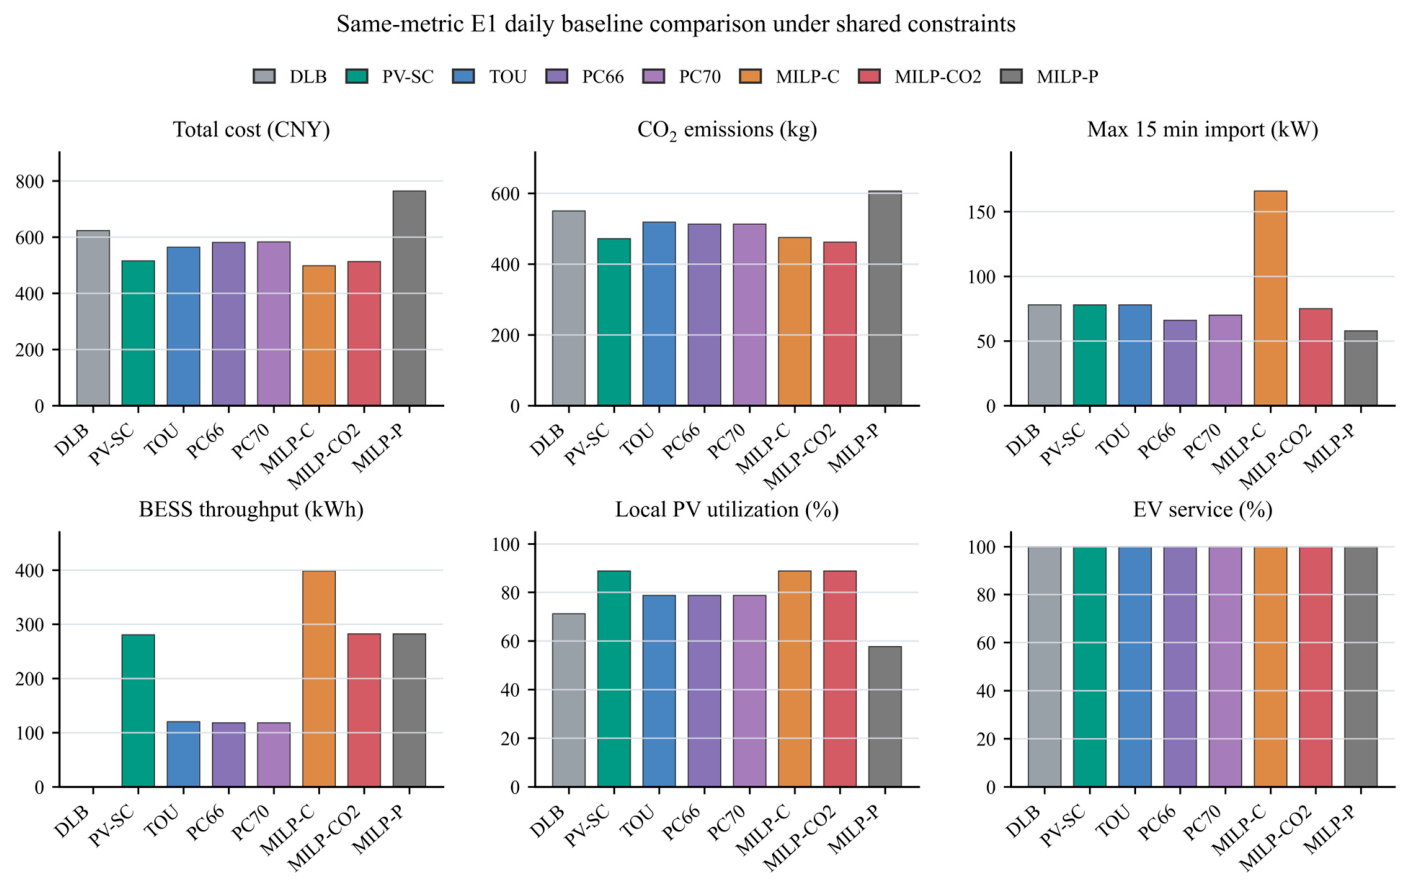
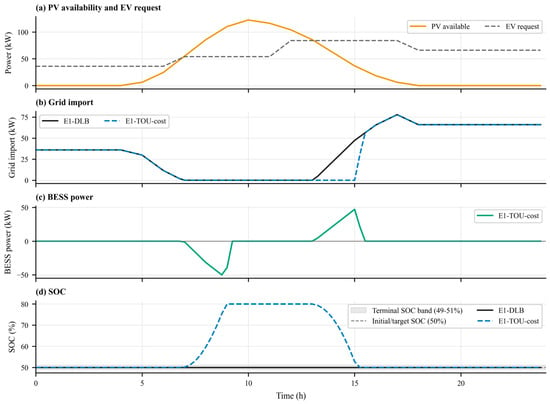
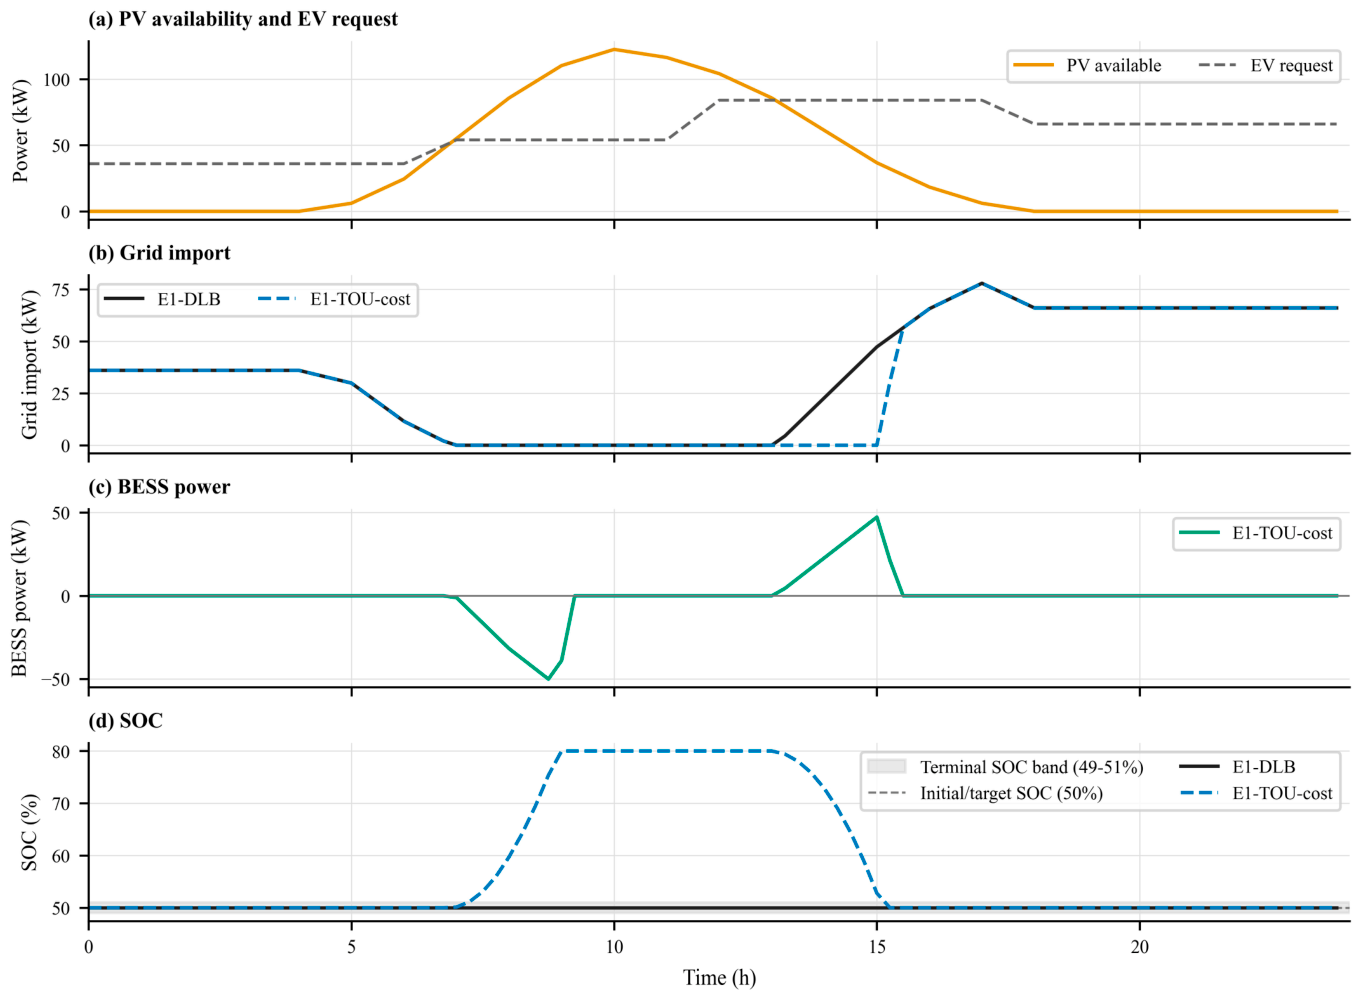
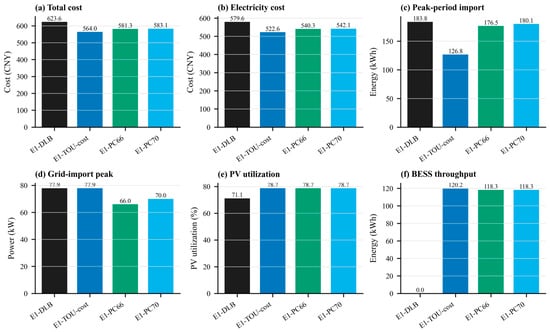
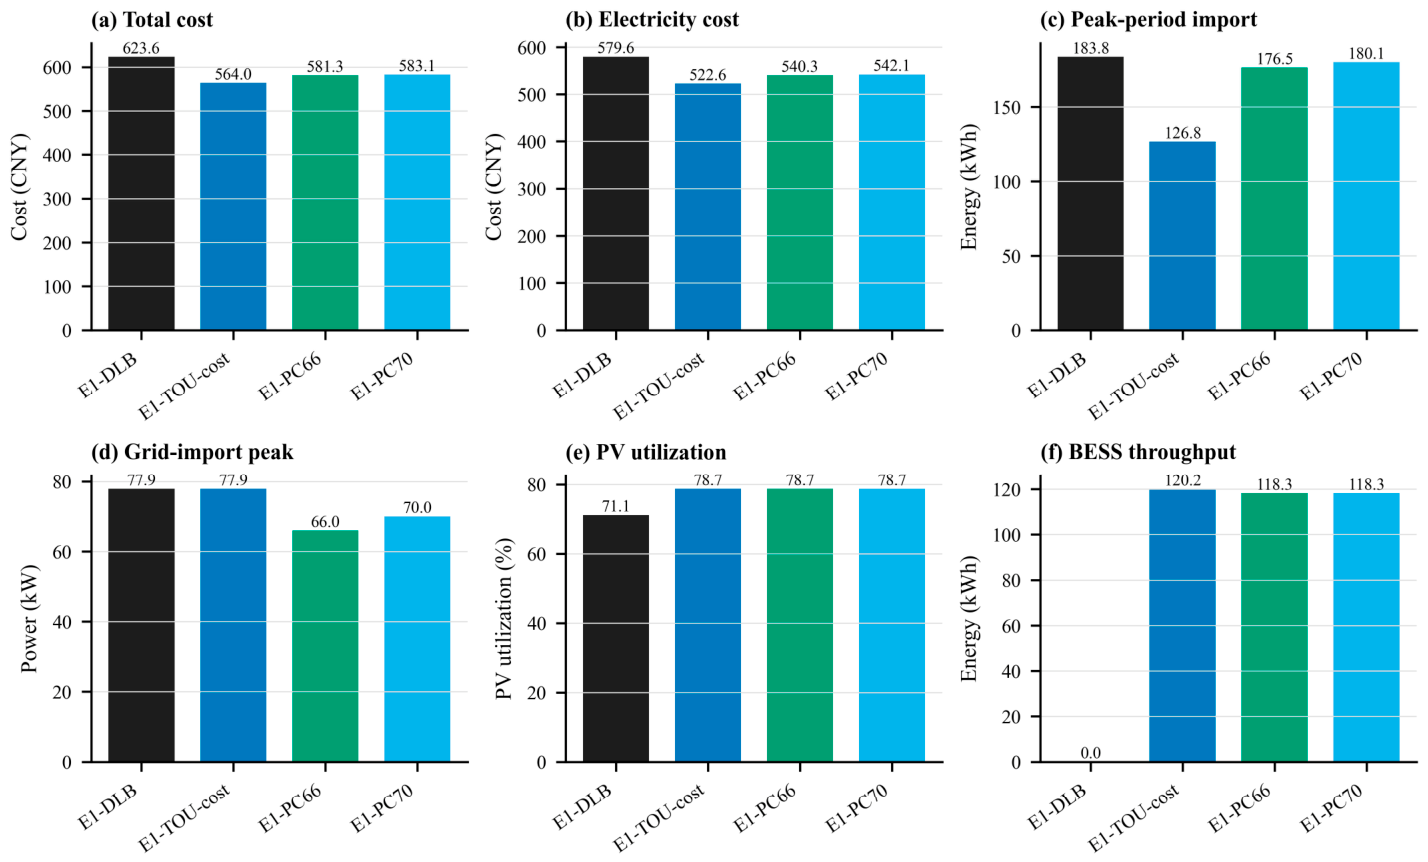
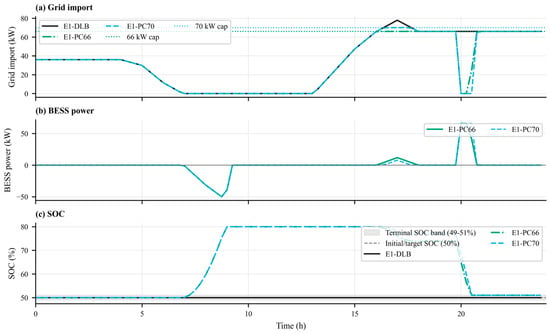
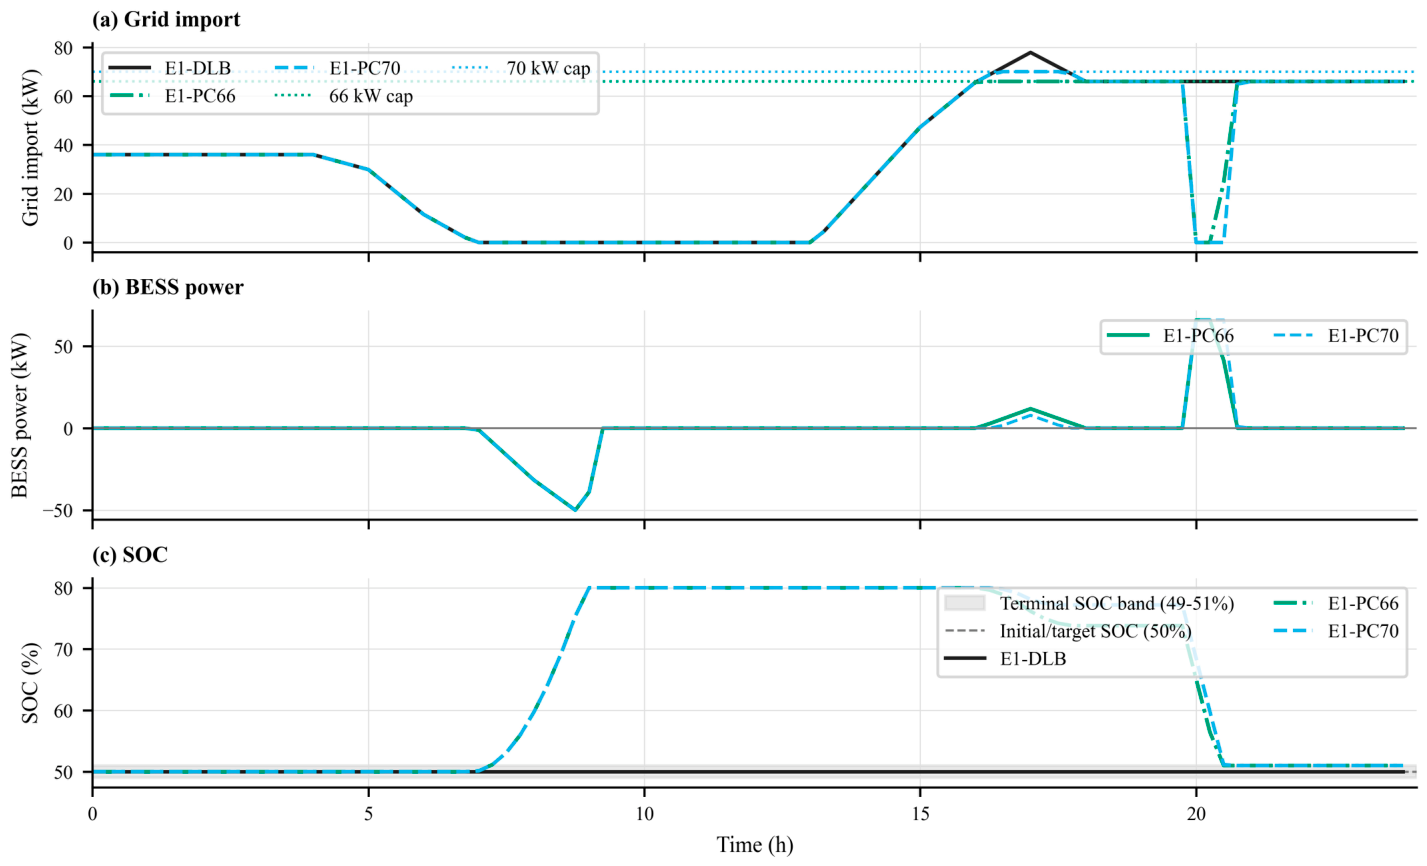
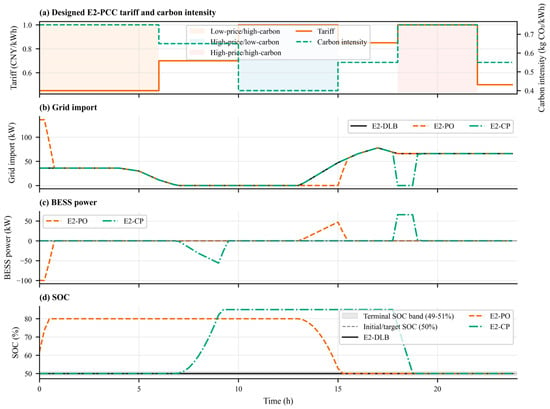
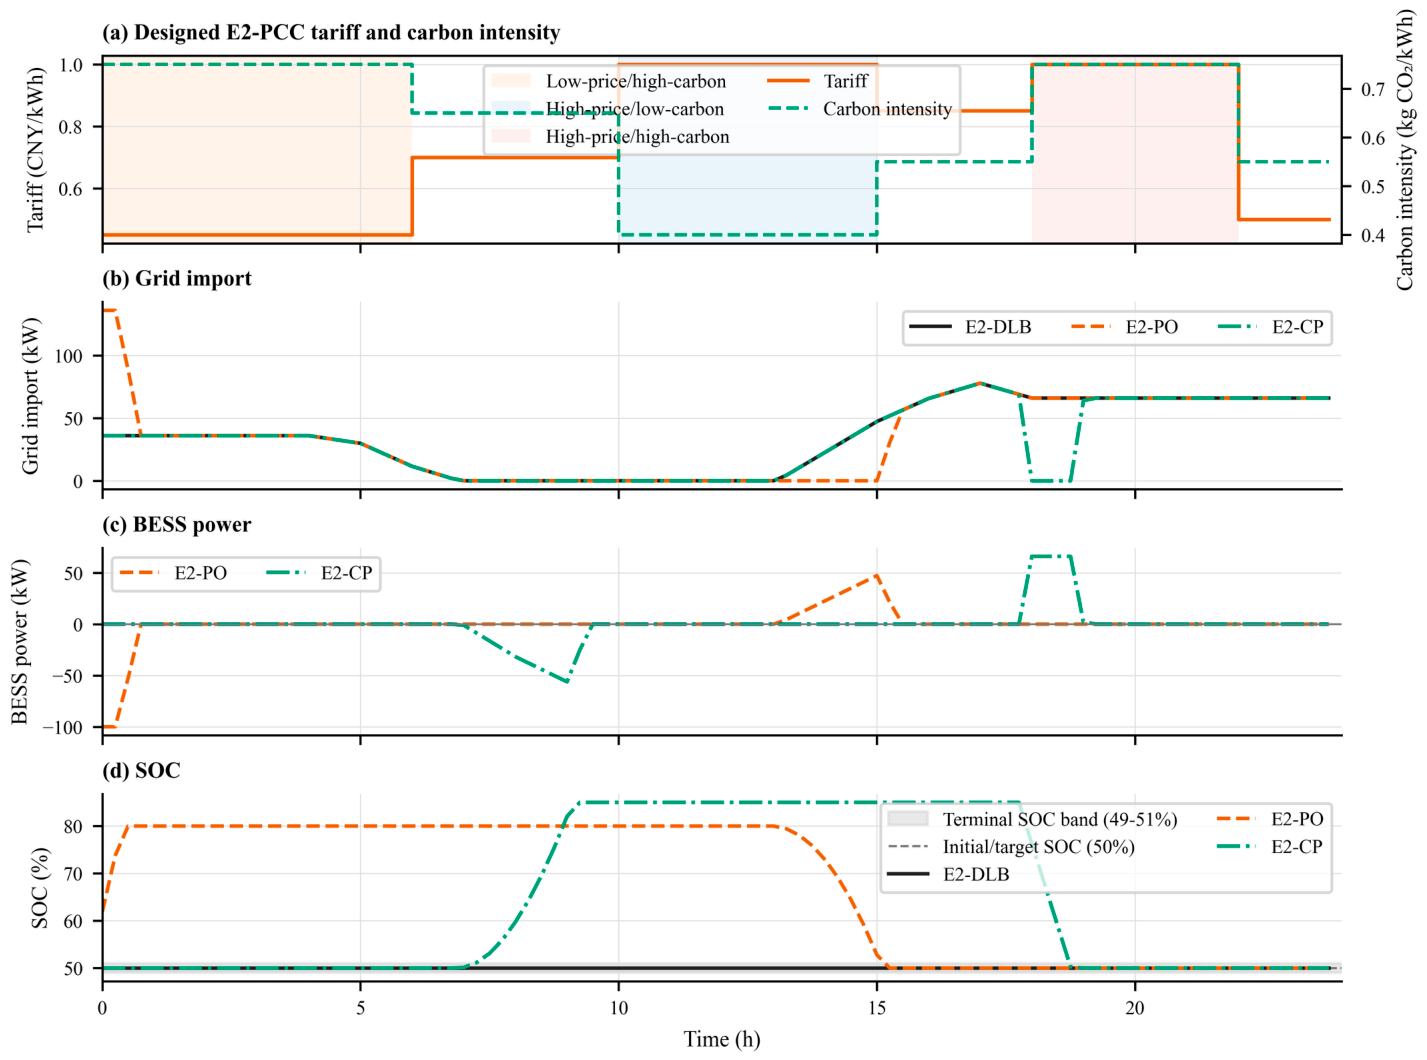
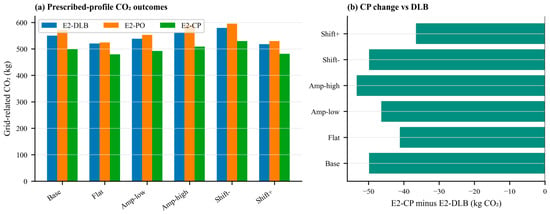
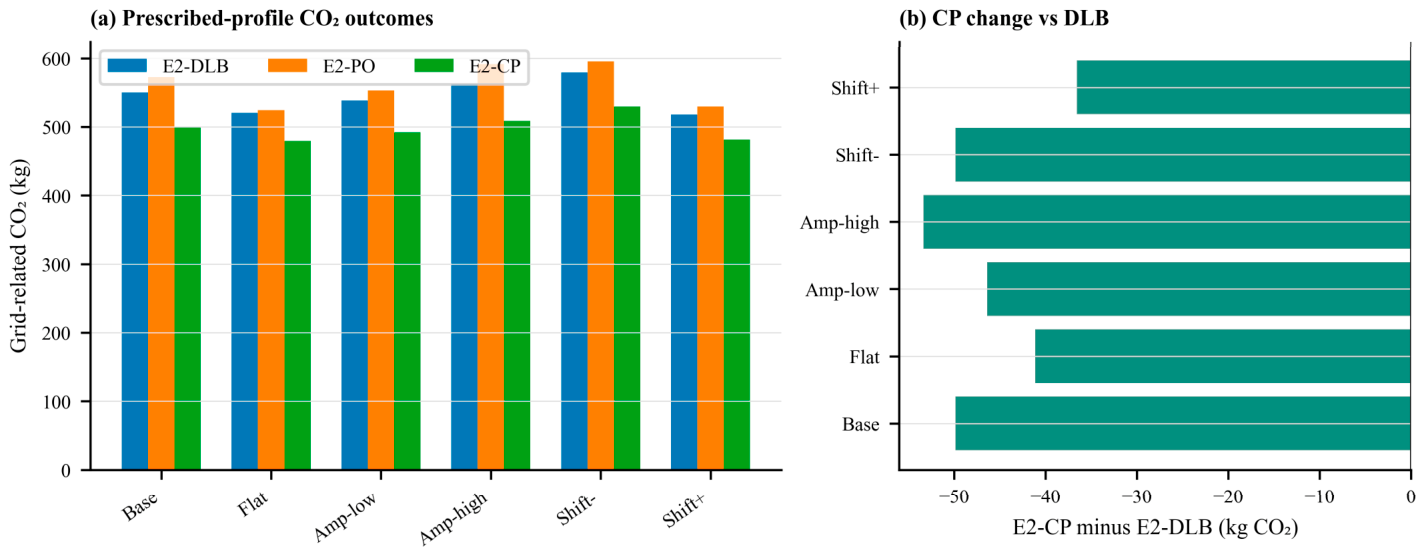
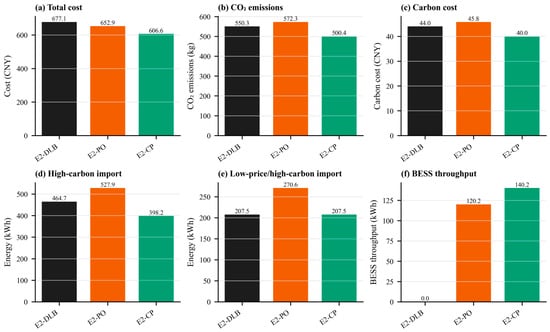
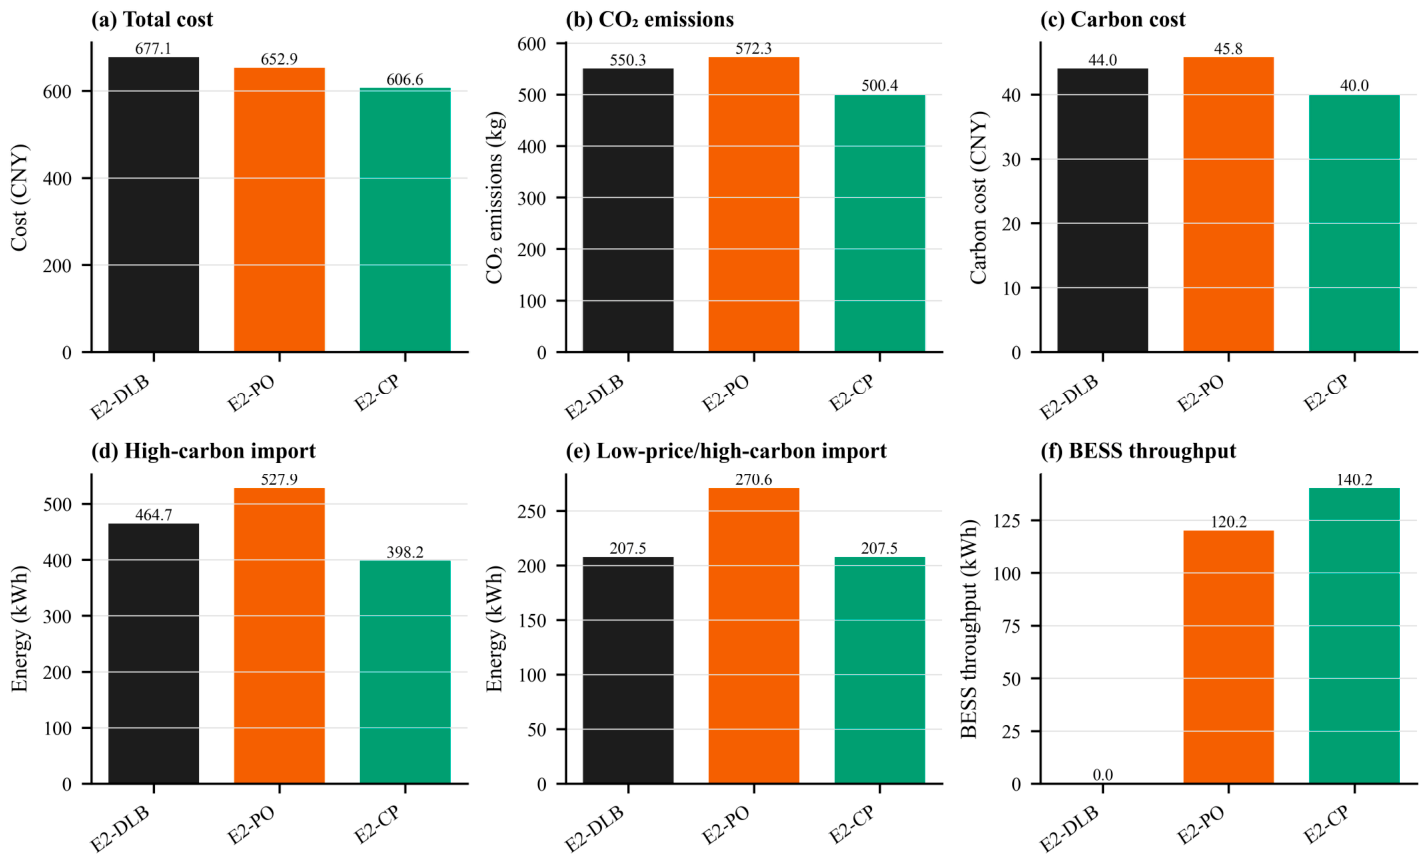
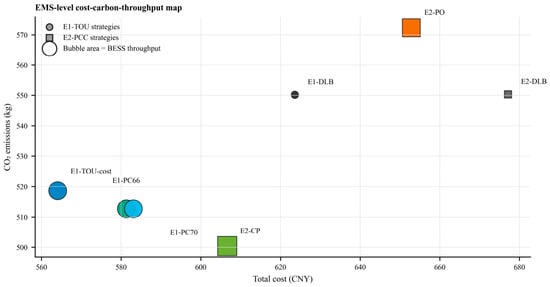
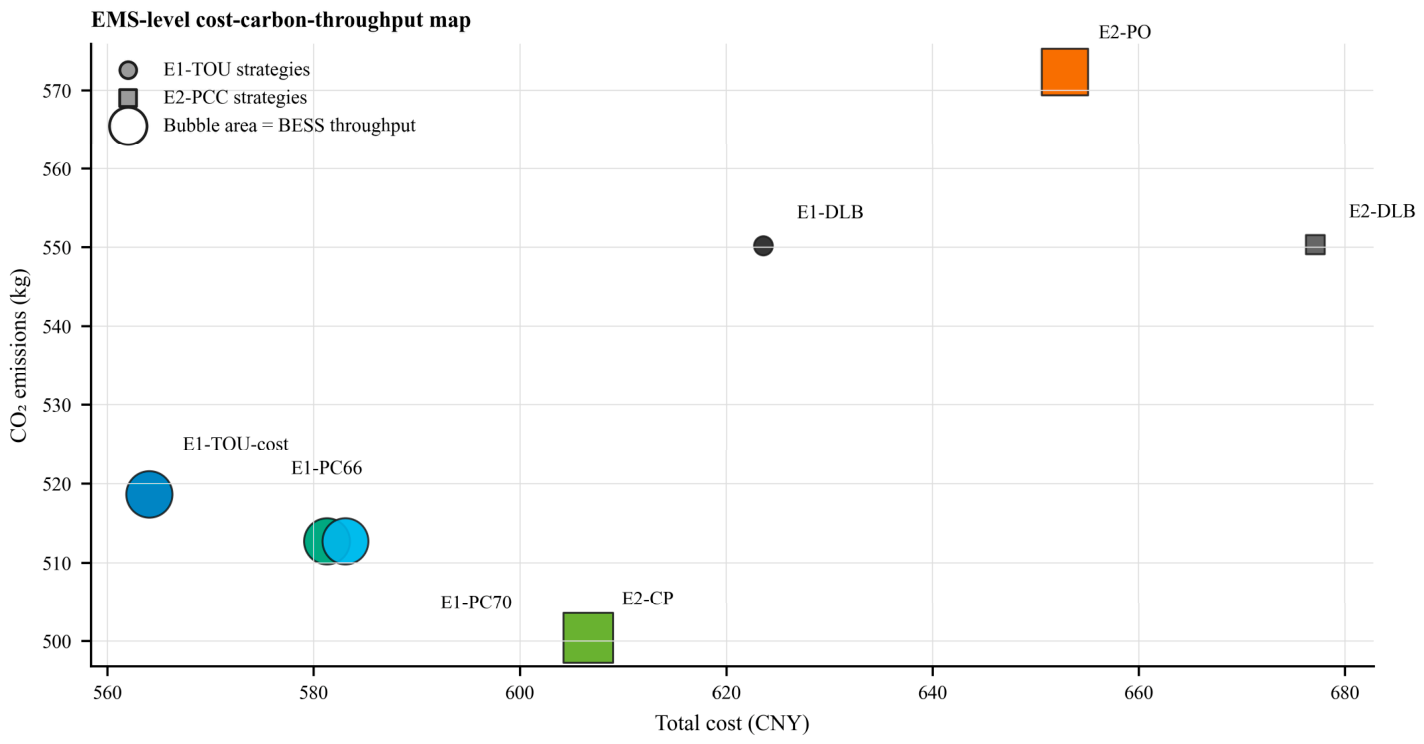
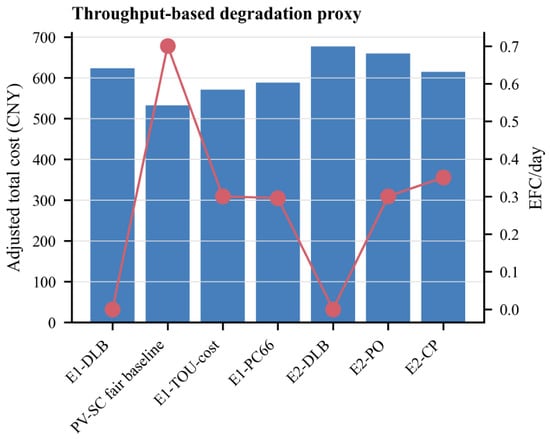
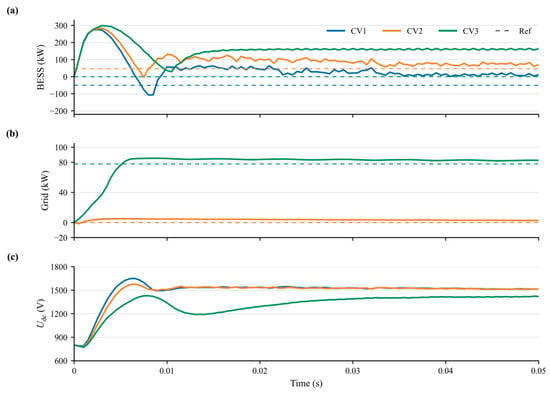
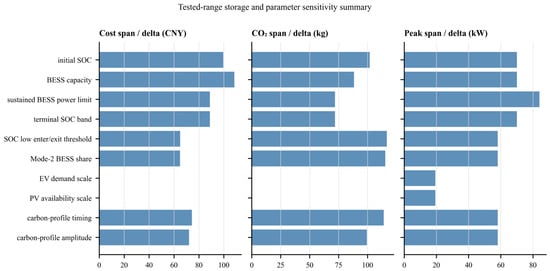
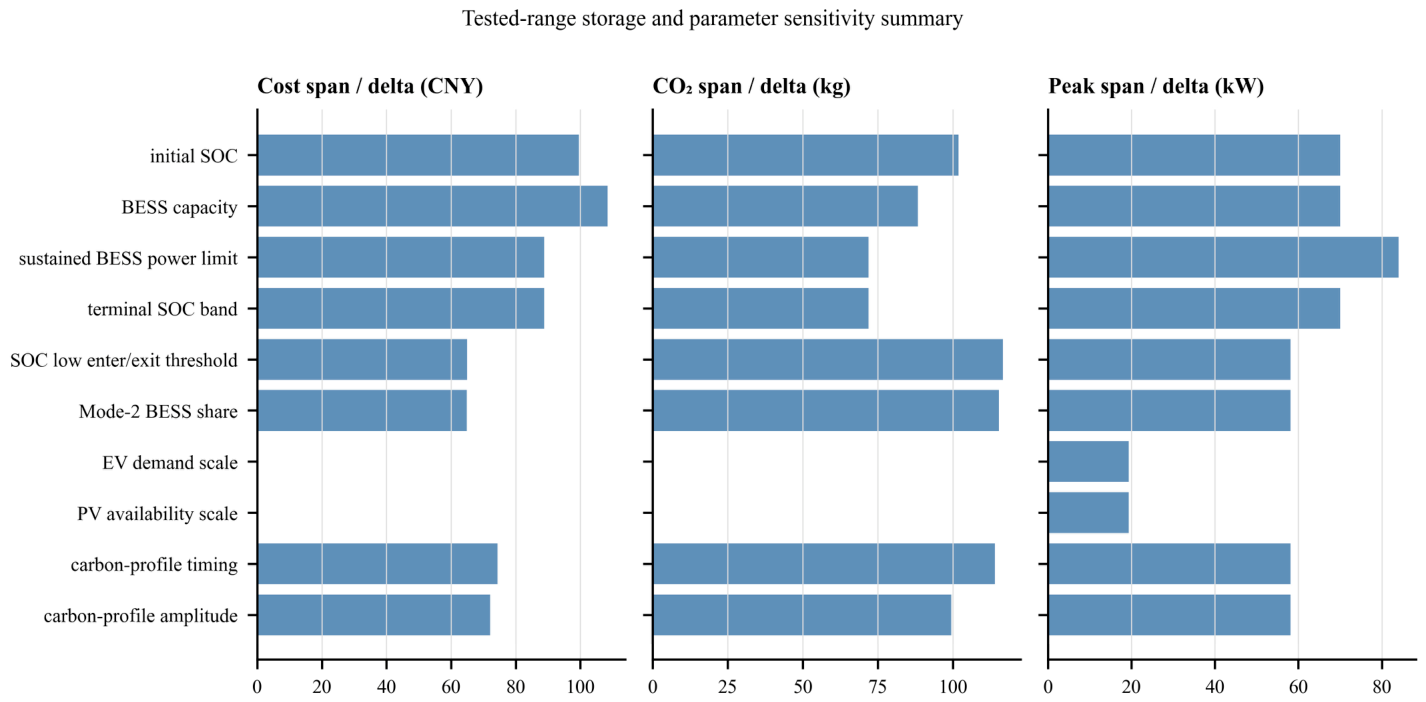

Disclaimer/Publisher’s Note: The statements, opinions and data contained in all publications are solely those of the individual author(s) and contributor(s) and not of MDPI and/or the editor(s). MDPI and/or the editor(s) disclaim responsibility for any injury to people or property resulting from any ideas, methods, instructions or products referred to in the content. |
© 2026 by the authors. Licensee MDPI, Basel, Switzerland. This article is an open access article distributed under the terms and conditions of the Creative Commons Attribution (CC BY) license.