3.1. Determination of the Content and Distribution Patterns of Heavy Metals in the Soil Cover of Almaty
Based on the analysis of 73 soil samples collected from various districts of Almaty, contamination factors (Kc) and the integrated pollution index (Zc) were calculated for heavy metals (Pb, Cd, As, Zn, Cu, Ni, Co, Mo, and Mn). Pb and As values were assessed according to the maximum permissible concentrations adopted in the Republic of Kazakhstan [
39], whereas Cd, Zn, Cu, and Ni were evaluated using the approximate permissible concentrations of the Russian Federation [
40]. The values for Co, Mo, and Mn were interpreted based on approximate permissible concentrations and background values reported in the literature [
3,
4,
5]. The approach complies with methodological guidelines MU 2.1.7.730-99 [
41,
42] SanPiN 2.1.7.1287-03, and R 2.1.10.1920-04 [
43], taking into account the regional geochemical background and international screening levels (Netherlands, United Kingdom, Canada) to verify conservatism. Approximate permissible concentrations (APC) and geochemical background values were used due to the absence of national standards for certain elements.
To assess the content of potentially toxic elements in soils, the following normative values were applied (mg/kg dry soil). Lead (Pb) and arsenic (As) concentrations were assessed according to the Hygienic Standards approved by the Order of the Minister of Health of the Republic of Kazakhstan dated 21 April 2021, with maximum permissible concentrations of 32 mg/kg for Pb and 2 mg/kg for As. For cadmium (Cd), zinc (Zn), copper (Cu), and nickel (Ni), the minimum values of the approximate permissible concentrations of the Russian Federation were applied: 0.5 mg/kg for Cd (from the range 0.5–2.0 mg/kg), 55 mg/kg for Zn (from the range 55–220 mg/kg), 33 mg/kg for Cu (from the range 33–132 mg/kg), and 20 mg/kg for Ni (from the range 20–80 mg/kg). For cobalt (Co), an approximate normative value of 5 mg/kg was adopted in accordance with commonly accepted methods of agrochemical analysis. The background content of manganese (Mn) was taken as 1500 mg/kg according to data from [
18] as a characteristic background value for soils in Kazakhstan.
The contamination factor (Kc) was calculated using the formula: Kc = C_actual/C_norm, where C_actual is the actual concentration of the metal (mg/kg), and C_norm is the normative (permissible) value. Interpretation: Kc < 1—normal level; 1–2—low contamination; 2–5—moderate contamination; 5–10—strong contamination; >10—very strong contamination.
The contamination factor was calculated using the following formula:
where C
fact is the actual metal content in the sample, mg/kg; and C
norm is the standard value of MAC/APC or background, mg/kg.
The calculated K
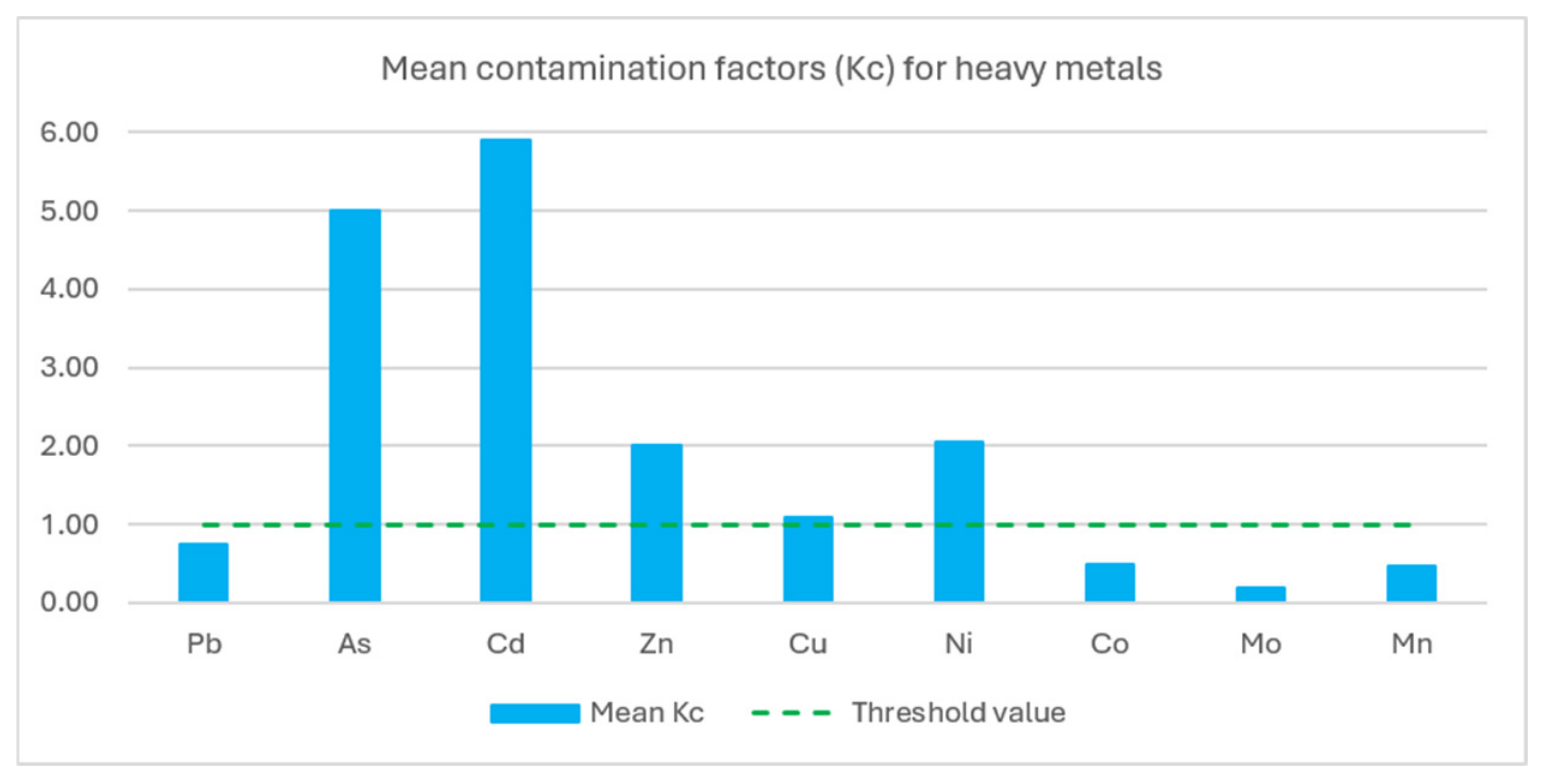
c values for all elements made it possible to determine the degree of technogenic impact and the spatial heterogeneity of soil pollution. The mean contamination factor values and the threshold K
c = 1 are presented in
Figure 2.
The analysis of Kc revealed systematically elevated values for As, Zn, and Ni. For As, Kc ≥2 was observed in 97% of sampling points (median Kc ≈ 5), with widespread areal increases. For Zn, exceedances occurred in 98% of points (Kc > 1), including strong and very strong cases. For Ni, Kc > 1 was recorded in nearly all points, predominantly at moderate levels. For Cu, exceedances were generally weak, with rare strong cases. Cd and Co remained at background levels in most samples, although isolated point peaks were noted (Kc > 8). Pb complied with MPC in 85% of points, with localized moderate to strong exceedances. Mo showed background levels with occasional weak exceedances. Mn remained at background levels without any exceedances.
The integrated pollution index Z
c was calculated using the formula Z
c = Σ(K
c − 1) for K
c > 1 [
9]. Based on the classification proposed by [
9], soils with Zc ≤ 16 were considered to be in a permissible condition (Class I), whereas values of 16 < Zc ≤ 32, 32 < Zc ≤ 128, and >128 corresponded to moderately hazardous (Class II), hazardous (Class III), and extremely hazardous (Class IV) conditions, respectively.
The Z
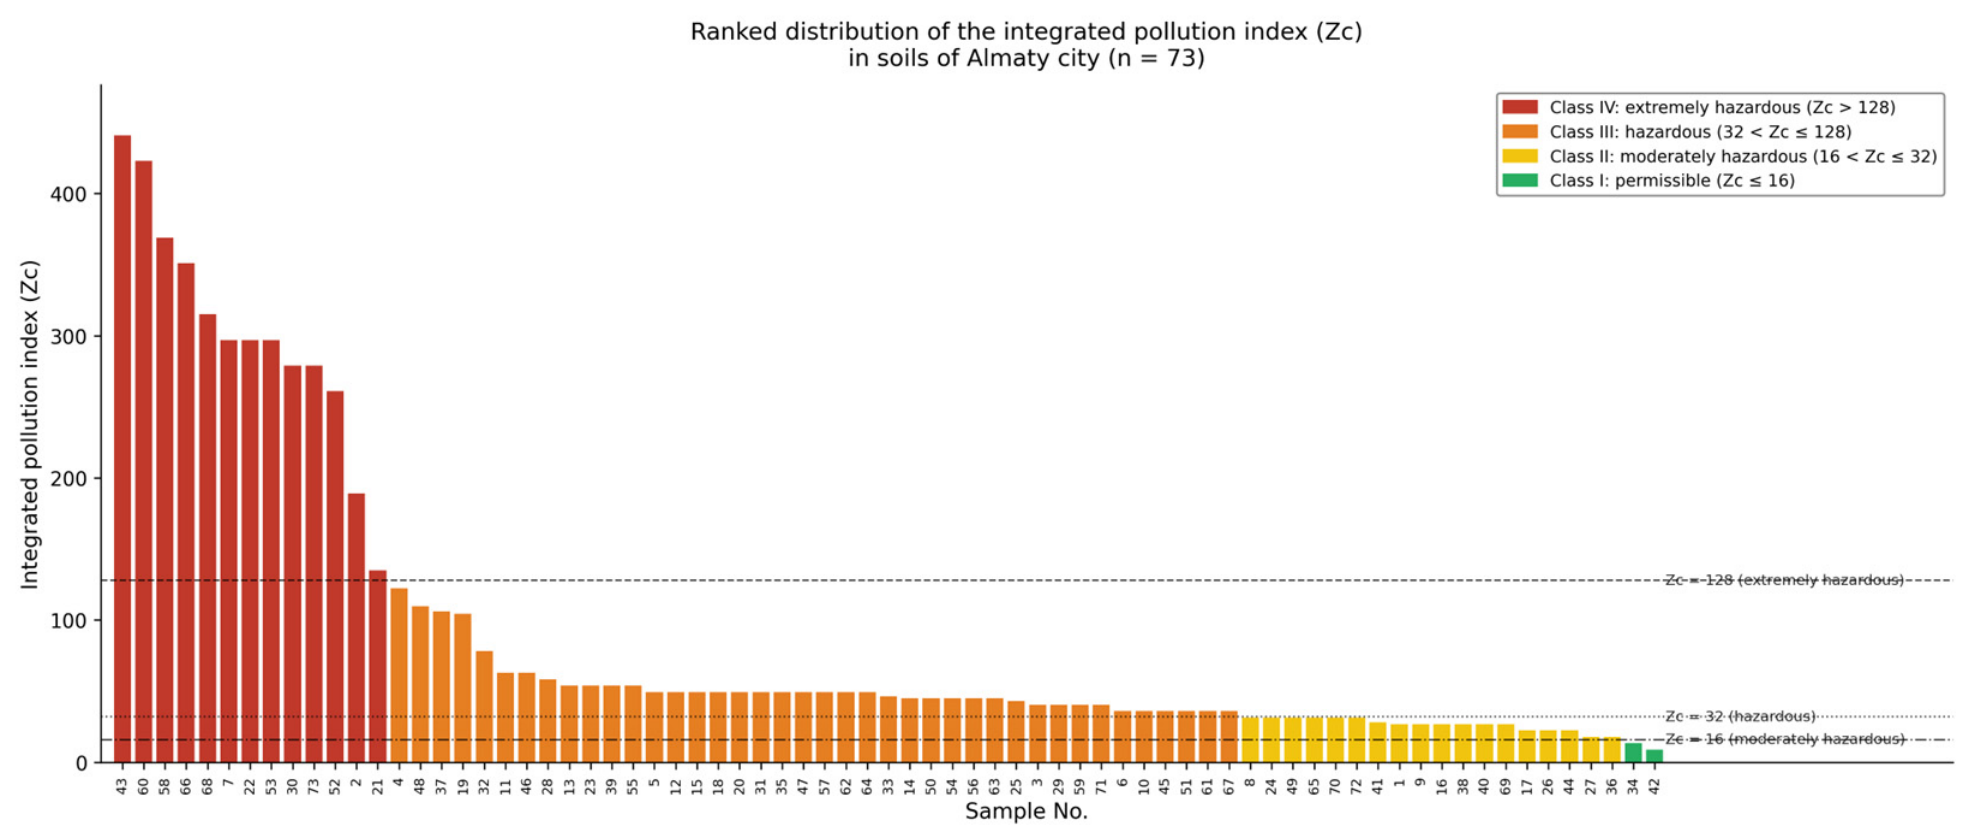
c results are shown in
Figure 3 (ranked distribution).
Figure 3 presents the ranked distribution of the integrated pollution index (Z
c) values across 73 soil samples from Almaty city. The curve exhibits a pronounced descending pattern, reflecting high spatial differentiation of pollution across the urban territory. Approximately 18% of the samples fall into the extremely hazardous category (Z
c > 128), more than half (about 54%) belong to the hazardous class (32 < Z
c ≤ 128), and 25% of the samples are classified as moderately hazardous (16 < Z
c ≤ 32). Only isolated points (about 3%) remain within the permissible range (Z
c ≤ 16).
This distribution indicates the presence of localized hotspots of strong pollution and an overall high technogenic load on the soil cover from multiple elements simultaneously. The descending shape of the curve demonstrates that a significant portion of the territory exhibits exceedance of the complex pollution index above the normative level.
To analyze the nature of concentration distributions and assess the variability in heavy metal contents, descriptive statistical methods were applied.
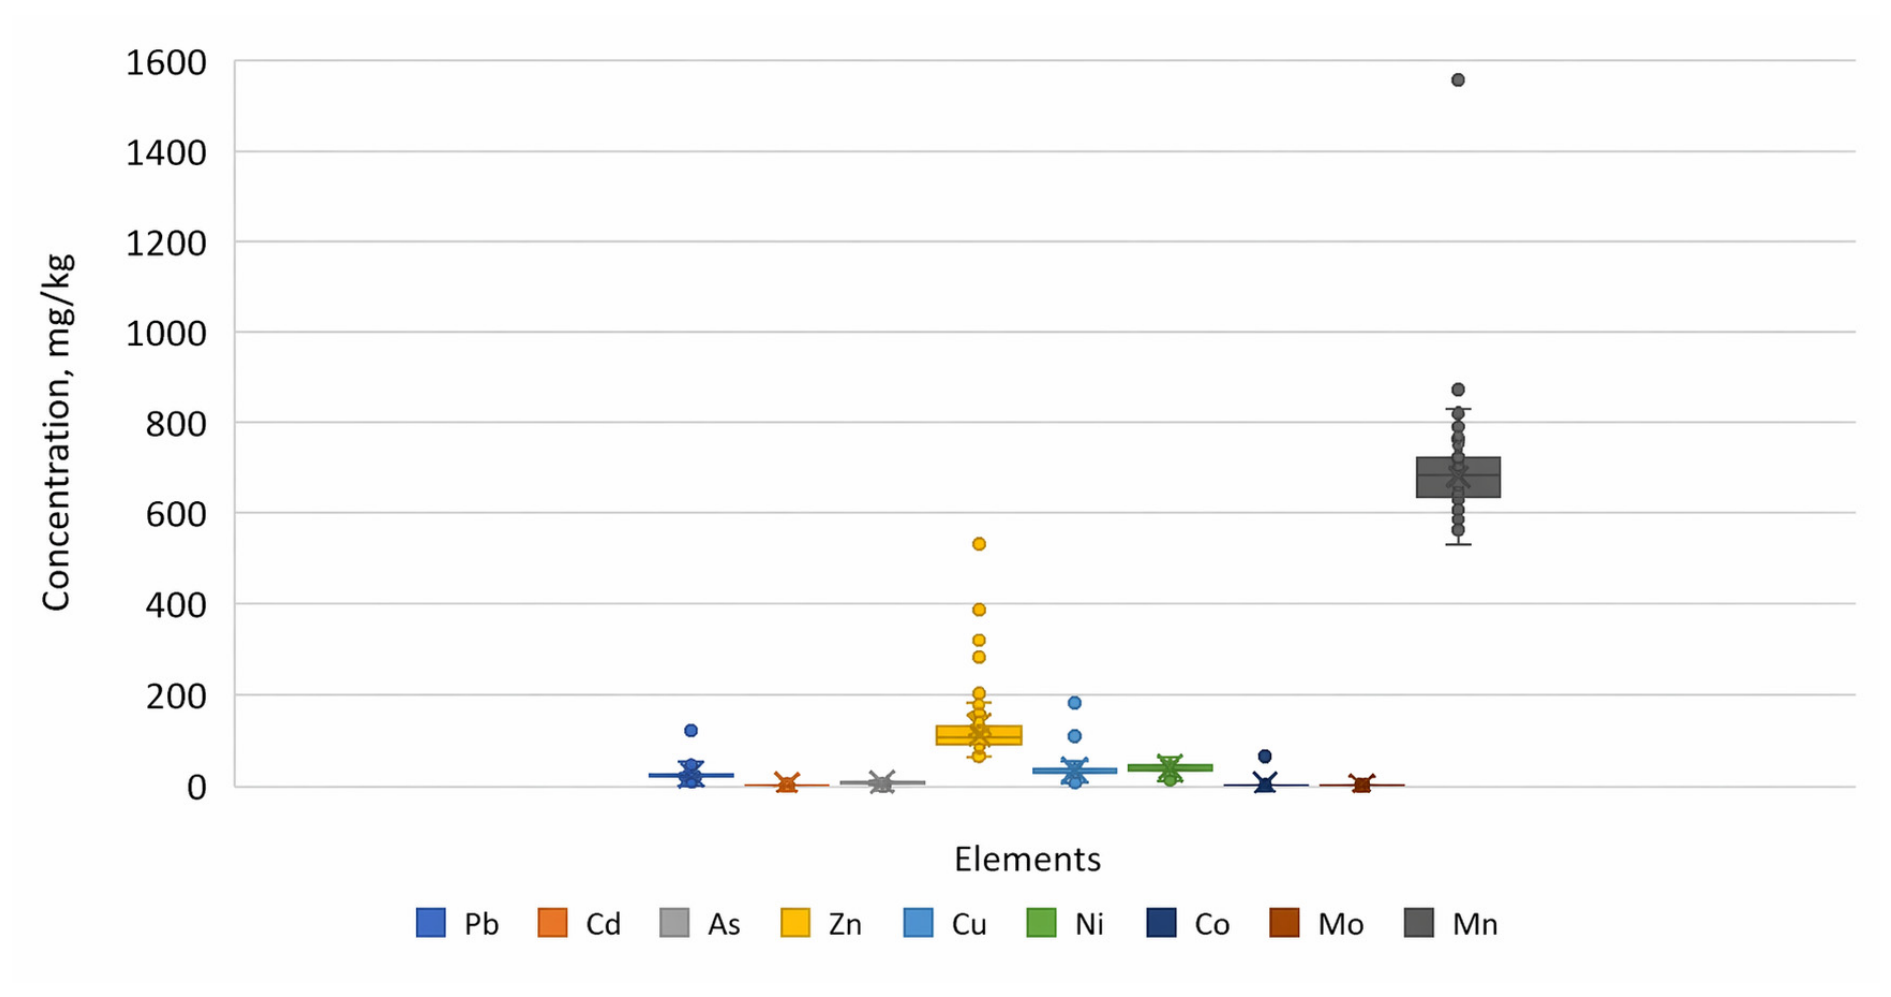
Figure 4 presents the median, minimum, maximum, and quartile values of heavy metal concentrations in the soil samples from Almaty city based on the analysis results (boxplot diagram).
The central line within the box represents the median; the box boundaries indicate the 25th and 75th percentiles; the “whiskers” extend to the minimum and maximum values excluding outliers; individual points denote outliers.
Visual inspection of the boxplot highlights elements exhibiting the most pronounced asymmetry and presence of outliers, indicating localized pollution hotspots. To quantitatively characterize the degree of variability, the main statistical parameters were calculated (
Table 1).
3.2. The Obtained Statistical Parameters Confirm the Presence of Significant Differences Among the Elements in Terms of Spatial Heterogeneity
The analysis of the boxplot reveals pronounced differences in the distribution of concentrations of the nine elements in the soils of Almaty city. According to median values and interquartile range (IQR), the concentration ranges vary from relatively stable to strongly asymmetric.
Pb, Zn, and Cu exhibit comparatively high median levels (24, 111, and 35 mg/kg, respectively) and wide interquartile ranges, indicating substantial variation in content and the presence of localized areas of elevated contamination. These elements also show a considerable number of outliers (8–12 points), which points to the heterogeneity of technogenic impact and likely point sources of heavy metal input (transport, industrial zones).
Cd, Co, and Mo have median concentrations below the detection limit (BDL), yet they demonstrate extremely high coefficients of variation (189–338%) and multiple outliers. This suggests a predominantly background level of content with rare but pronounced exceedances characteristic of individual samples. Such a pattern is typical for elements with episodic technogenic input.
Ni and As are characterized by more uniform distributions (CV ≈ 20–30%), a smaller number of outliers, and medians within 10–41 mg/kg, indicating relatively uniform spatial distribution.
Mn, despite having the highest absolute concentrations (median ≈686 mg/kg), exhibits a low coefficient of variation (18%), confirming its stable background distribution.
Thus, the most variable and potentially ecologically hazardous elements are Pb, Zn, Cu, Cd, Co, and Mo, which are distinguished by large ranges and the presence of outliers, whereas Ni, As, and Mn show lower spatial variability, which combined with correlation analysis suggests a predominantly geogenic background.
To identify possible associations among the elements and to determine common sources of their input, a correlation analysis of the data was performed. Due to the non-normal distribution of the data, the non-parametric Spearman’s rank correlation coefficient, which is robust to outliers and asymmetry, was applied (
Table 2).
The correlation analysis (Spearman’s coefficient) is presented in
Table 2.
The interpretation of correlations is presented in
Table 3.
Spearman’s rank correlation coefficients (ρ) range from −1 to +1 and reflect the direction and strength of the relationship between elements. Correlations below 0.3 indicate a weak association, 0.3–0.7—a moderate association, and above 0.7—a strong association (
Table 3).
In the studied soils of Almaty city, the correlation values are predominantly weak to moderate, indicating diverse sources of metal input and a complex pattern of technogenic influence. Certain element pairs exhibit significant positive correlations, suggesting a possible common source or similar migration behavior.
Strong and significant correlations are characteristic of arsenic and nickel, zinc and copper, and lead and zinc. The pair As–Ni shows the most pronounced positive association (ρ = 0.72), reflecting possible co-occurrence from parent rocks or through aerotechnogenic emissions. Both elements are typical of industrially influenced zones and fuel combustion areas. A high correlation is observed between Zn and Cu (ρ = 0.63), pointing to a common technogenic source related to vehicle wear (tires, lubricants, brake pads) and industrial emissions. A notable positive correlation also exists between Pb and Zn (ρ = 0.63), which is typical for urbanized territories where lead and zinc often enter jointly via road dust and thermal power plant emissions.
Moderate correlations were calculated for copper and cobalt, nickel and manganese, and arsenic and cobalt. The pairs Cu–Co (ρ = 0.28) and Ni–Mn (ρ = 0.34) likely reflect partial overlap in geochemical behavior and sorption onto organo-mineral complexes. The As–Co pair (ρ = 0.23) shows a weak positive correlation, suggesting a possible common background but without a clearly defined technogenic source.
Negative correlations were identified for the pairs arsenic and zinc, zinc and nickel, molybdenum and manganese, cadmium and lead, and cadmium and zinc. Thus, the inverse relationships in As–Zn (ρ = −0.26) and Zn–Ni (ρ = −0.27) indicate different geochemical barriers and migration mechanisms. As zinc content increases, nickel and arsenic concentrations generally decrease, which is typical for soils with heterogeneous composition and variable pH. The dependence in the Mo–Mn pair (ρ = −0.23) may reflect competitive uptake or differing mobility in alkaline versus acidic environments. Weak and opposing associations in Cd–Pb (ρ = −0.12) and Cd–Zn (ρ ≈ −0.03) confirm independent pollution sources (Cd is more often linked to battery production and fuel combustion, Pb to transport).
Thus, strong correlations are as follows: As–Ni (ρ = 0.72), Zn–Cu (ρ = 0.63), Pb–Zn (ρ = 0.63)—technogenic associations (transport, thermal power plants); moderate: Cu–Co (ρ = 0.28), Ni–Mn (ρ = 0.34); and negative: As–Zn (ρ = −0.26), Zn–Ni (ρ = −0.27)—antagonism. This divides the elements into predominantly technogenic (Pb–Zn–Cu–Ni) and predominantly geogenic (As–Co–Mo–Mn) groups [
18,
20].
The weak interconnection of cadmium with other elements underscores its specific source (localized emissions, battery waste). High correlation values among heavy metals of transport-industrial origin confirm the complex technogenic nature of soil pollution within the urban territory of Almaty.
The results of the study demonstrate that the primary contaminating elements in the soils of Almaty city are zinc (Zn), copper (Cu), lead (Pb), and nickel (Ni), characterized by the highest contamination factors (Kc > 1) and elevated values of the integrated pollution index Zc. The highest Zc values were recorded in the central and eastern districts of the city, indicating pronounced technogenic impact related to transport, industrial emissions, and dense urban development. According to the ranked distribution, more than half of the samples fall into the hazardous and extremely hazardous pollution categories (Zc > 32), pointing to a persistent exceedance of the permissible technogenic load level.
The Spearman correlation analysis confirmed close associations among elements of technogenic origin, particularly Pb–Zn (ρ = 0.63), Zn–Cu (ρ = 0.63), and As–Ni (ρ = 0.72). This reflects their joint input into the soil cover as a result of fuel combustion, vehicle wear, and industrial activity. At the same time, Cd, Co, Mo, and Mn exhibit weak or negative correlations, indicating diverse sources and differences in geochemical behavior. Thus, soil pollution in Almaty has a complex technogenic–natural character, with the main load formed by heavy metals of transport-industrial origin, while secondary elements reflect the regional geochemical background features.
Overall, the condition of the soil cover can be characterized as contaminated, with localized zones of potential risk that require further monitoring and refinement of the geochemical background.
3.3. Identification of Local Technogenic Pollution Hotspots by Priority Pollutants in the Urbanized Territories of Almaty City
Heavy metal contamination of the soil cover represents a global ecological problem. According to Sereda et al. [
44], approximately 1,400,000 local sites contaminated with heavy metals and organic pollutants have been identified in Western Europe, while about 600,000 sites with elevated heavy metal concentrations requiring remediation have been reported in the United States. In urban environments, the degradation of asphalt surfaces also contributes to the accumulation of heavy metals and aromatic hydrocarbons in soils.
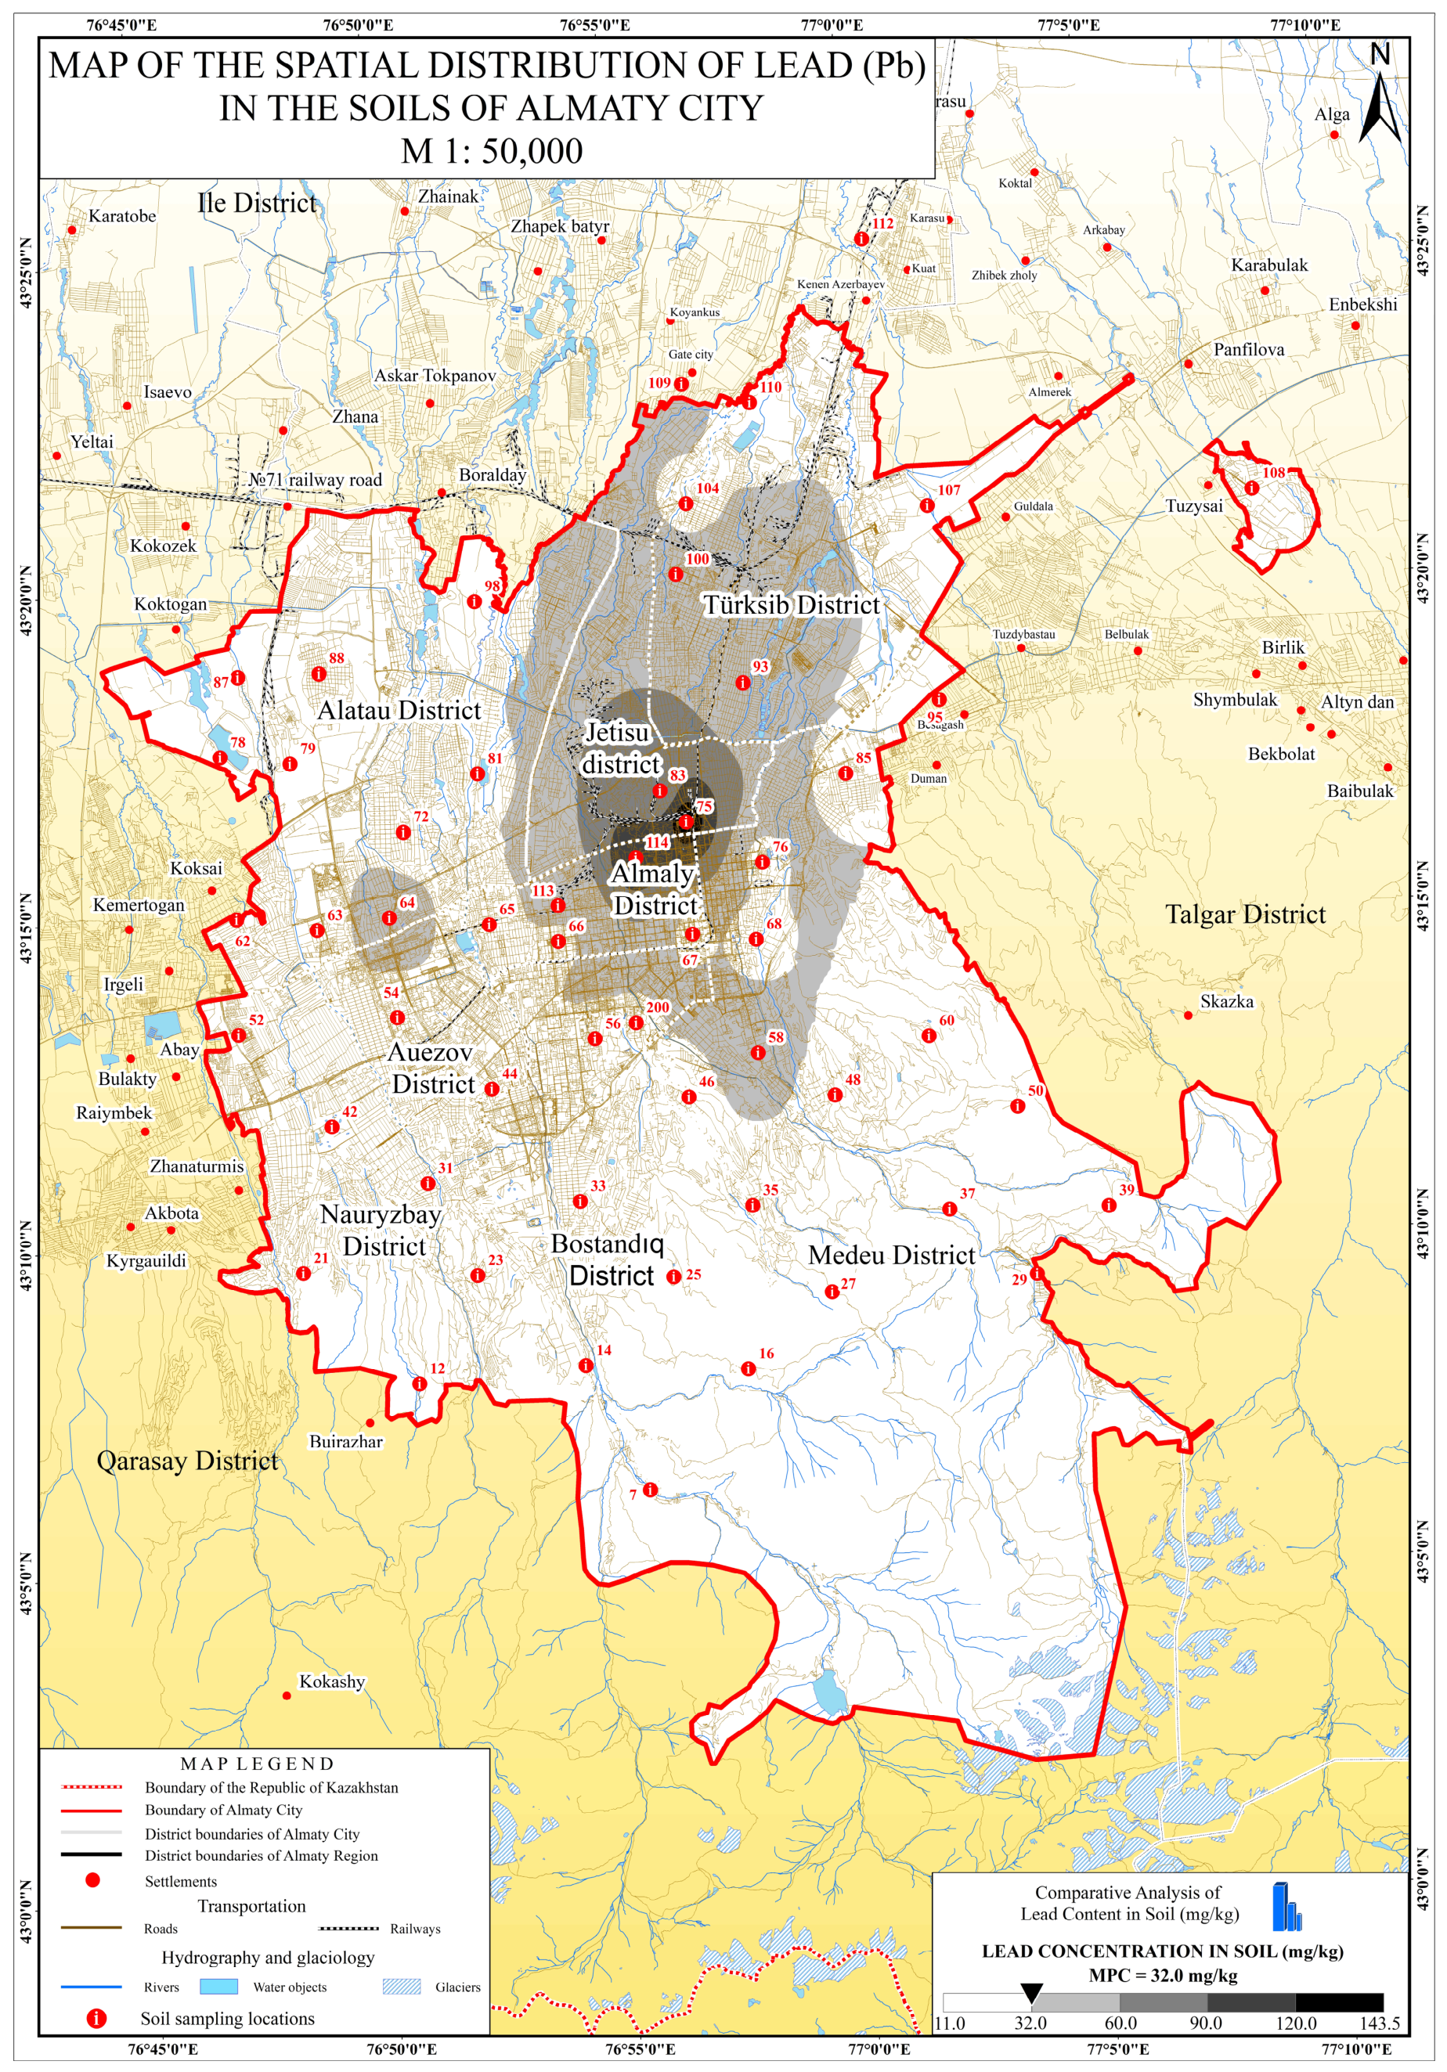
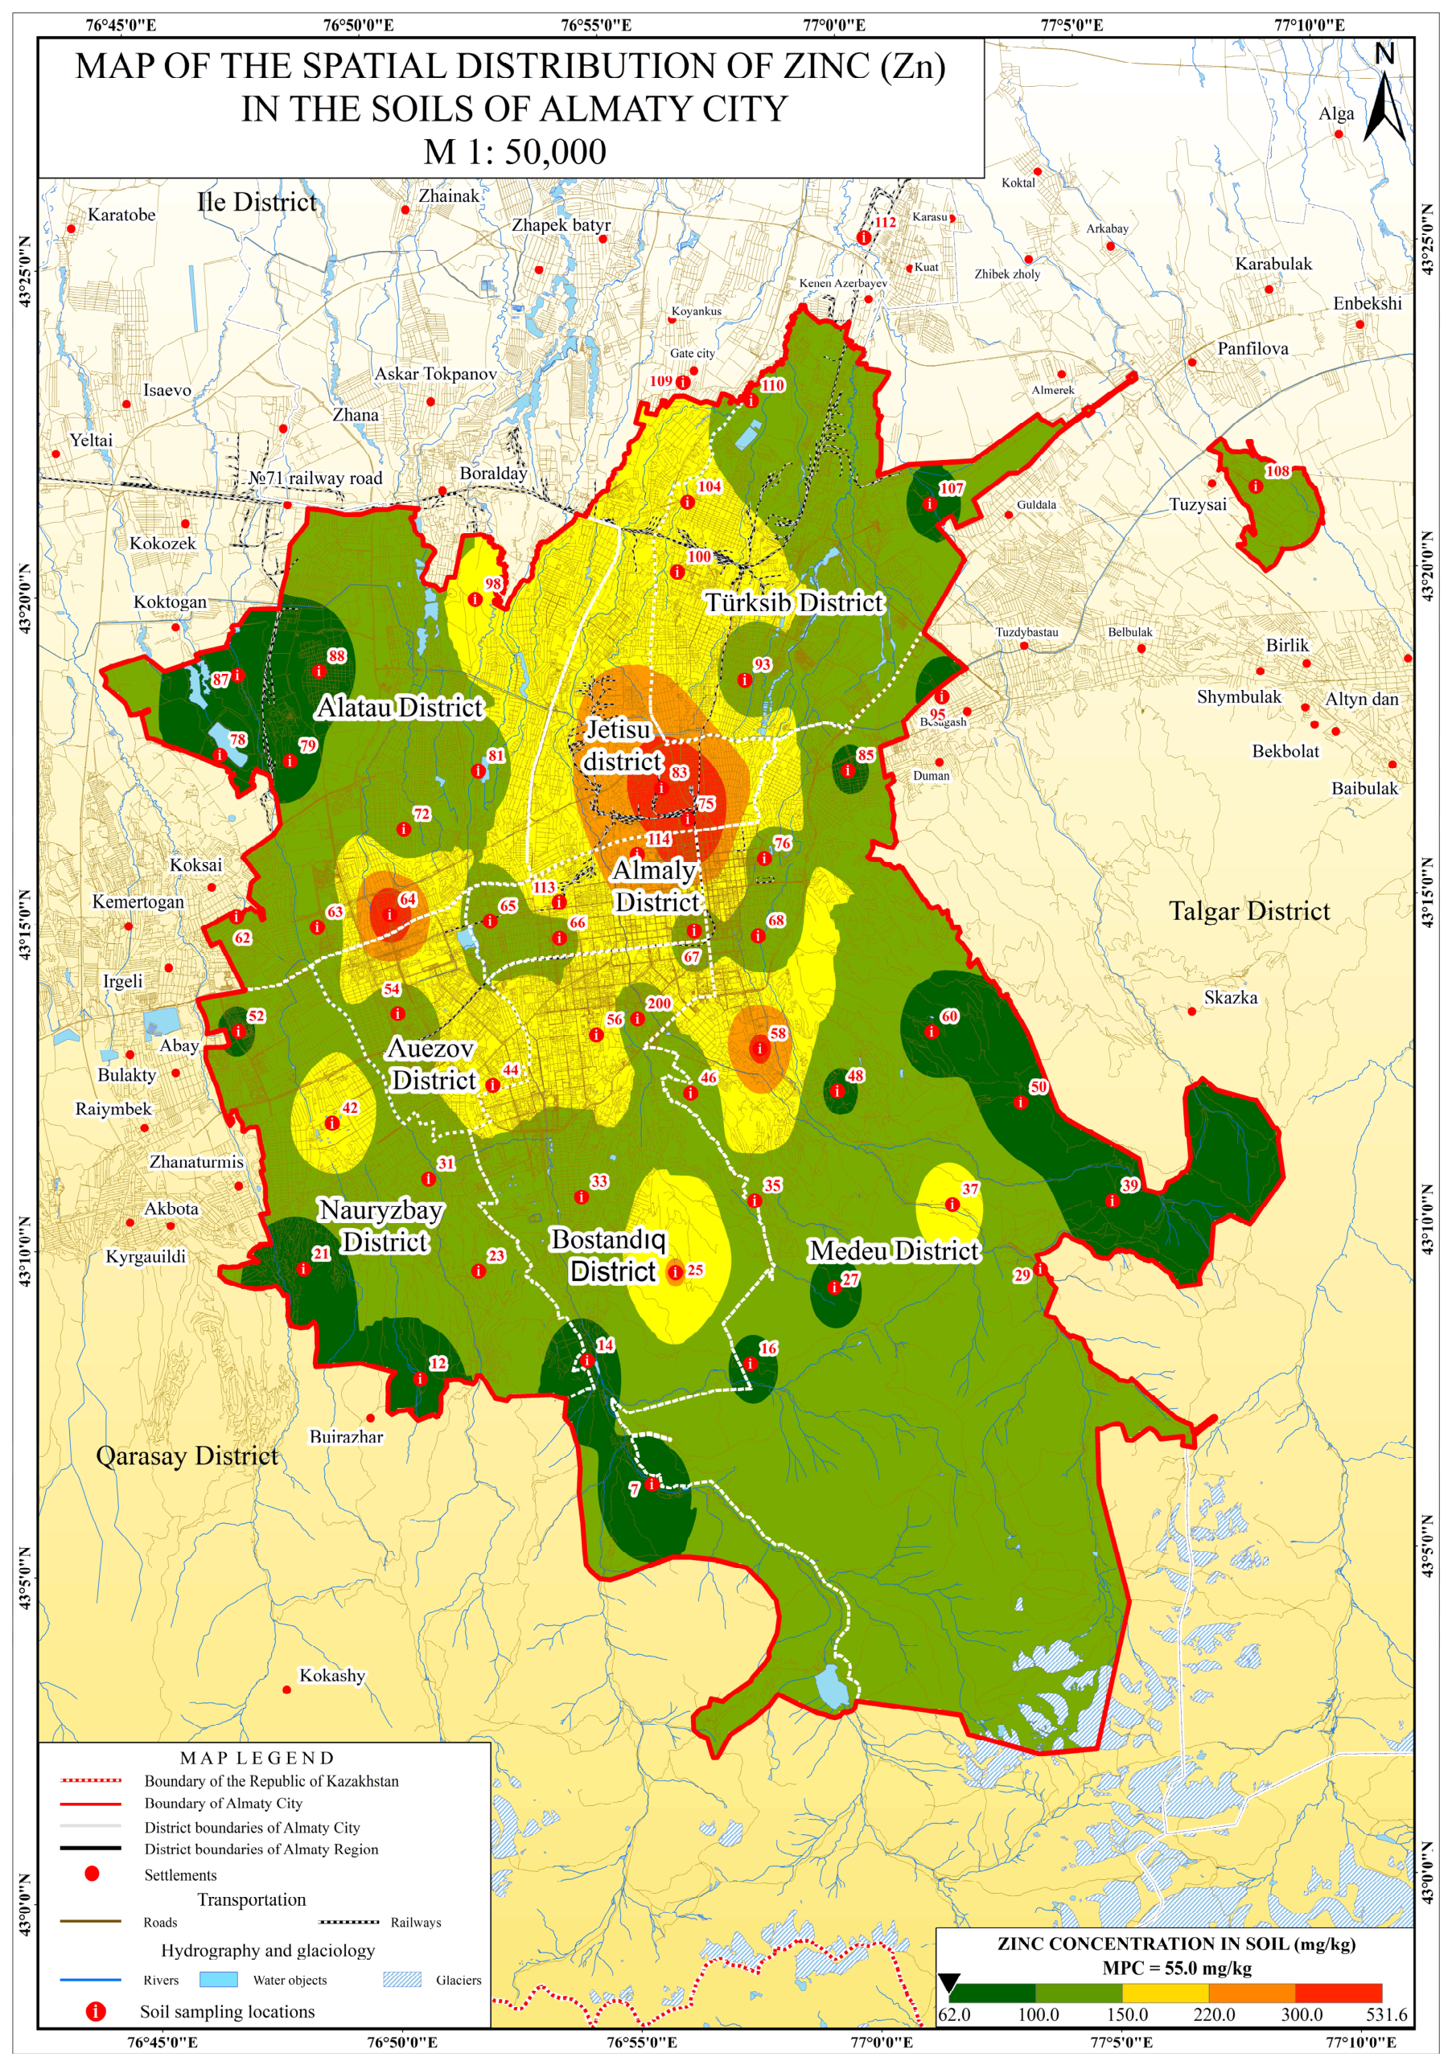
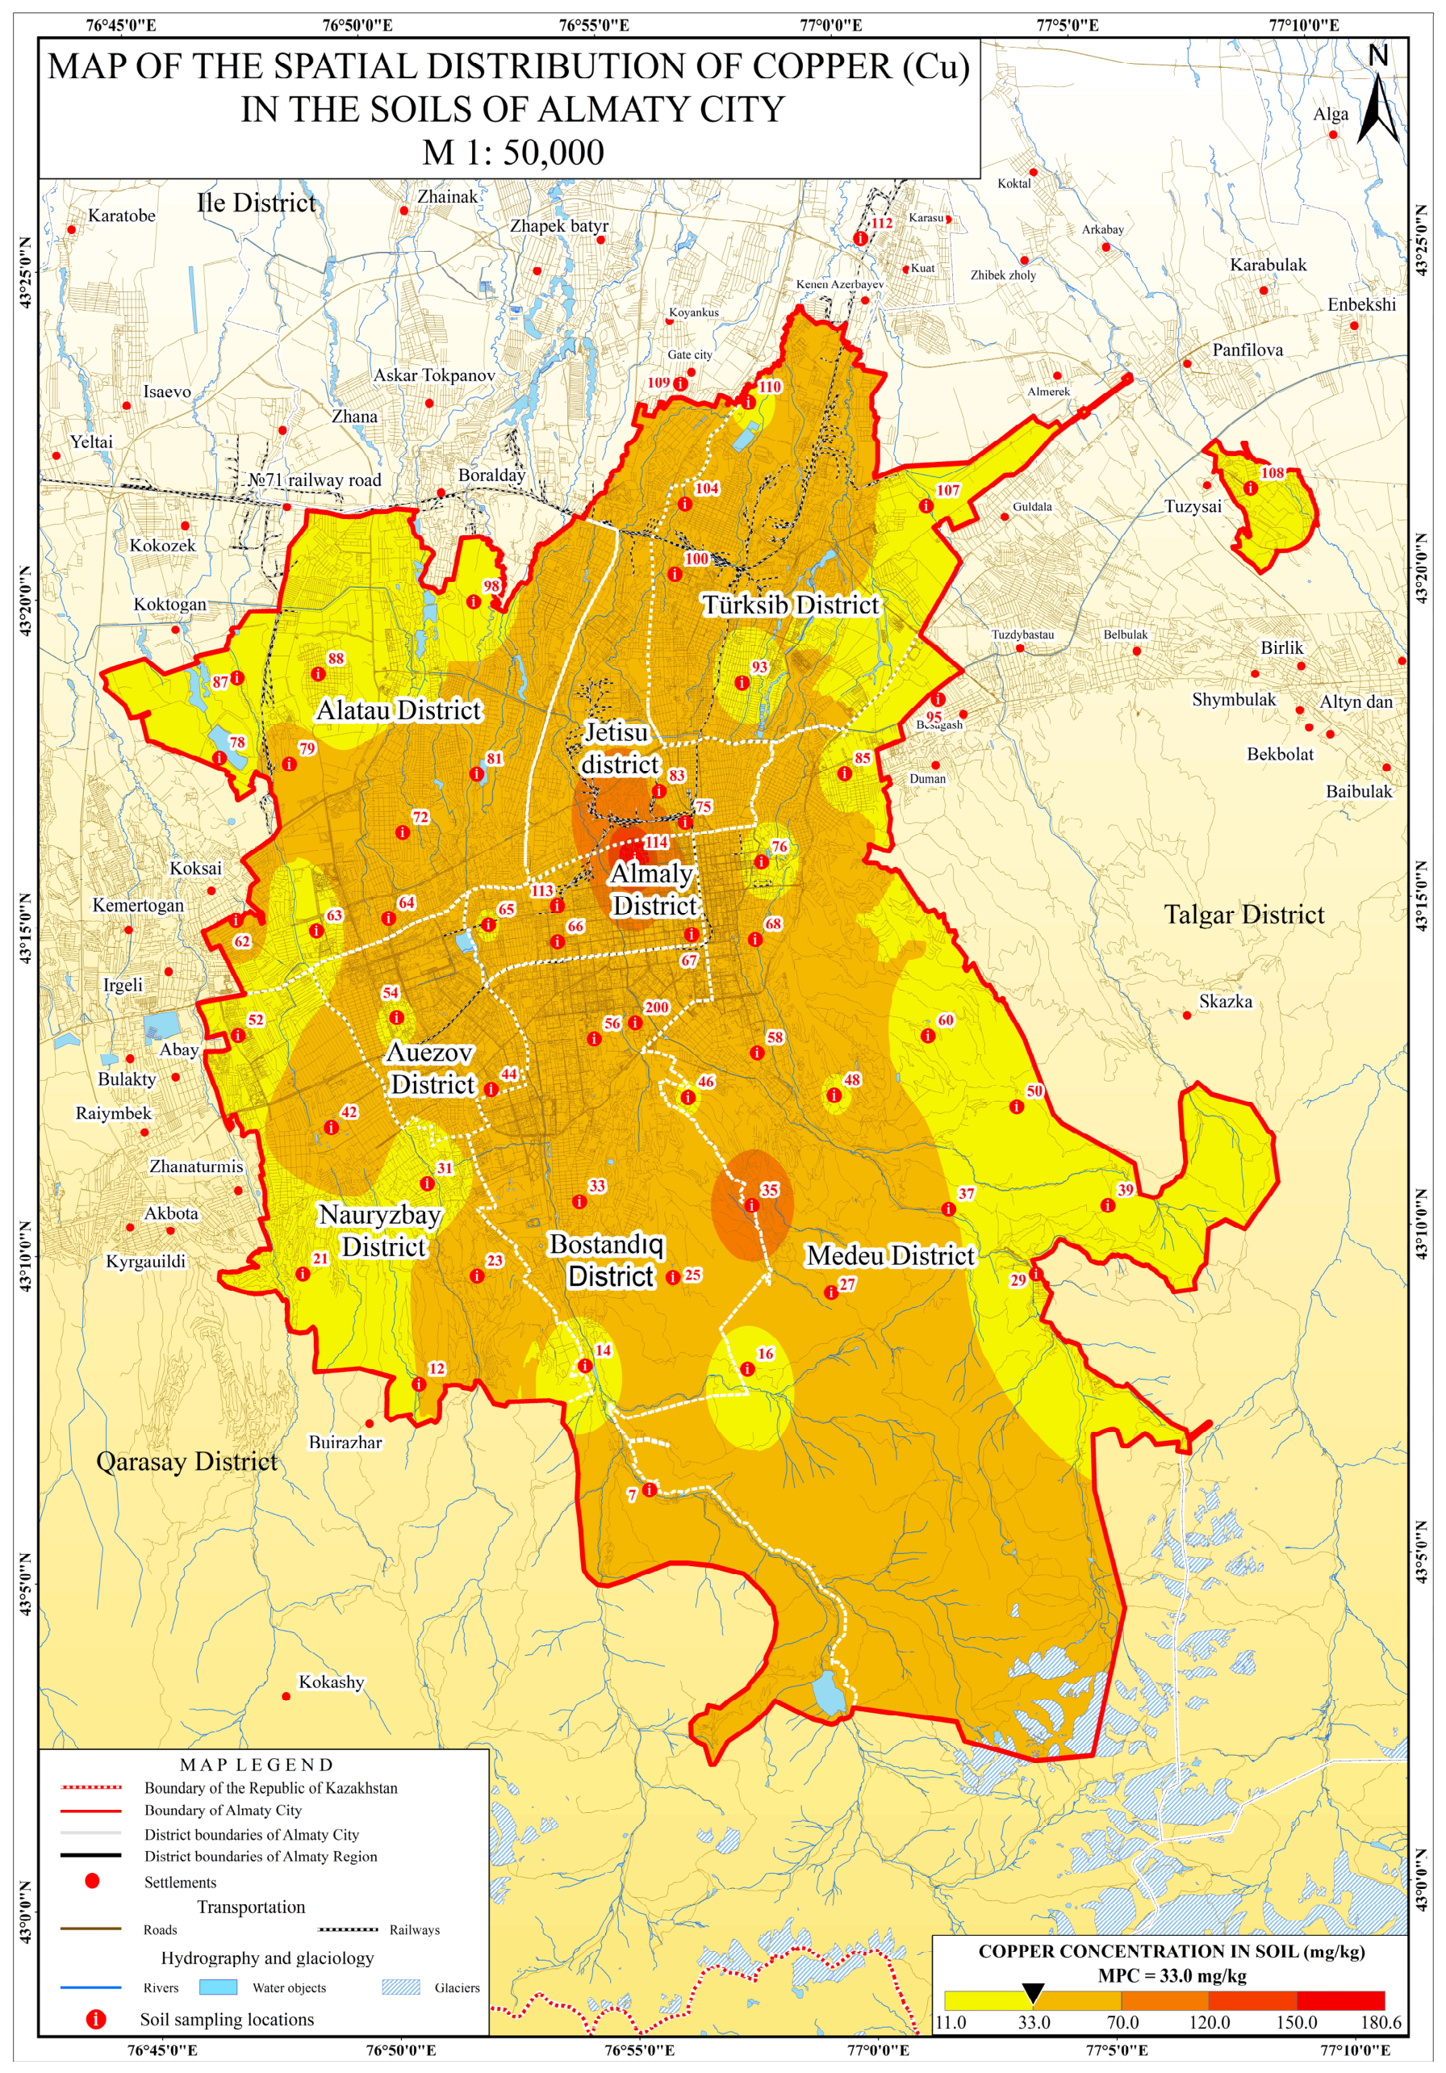
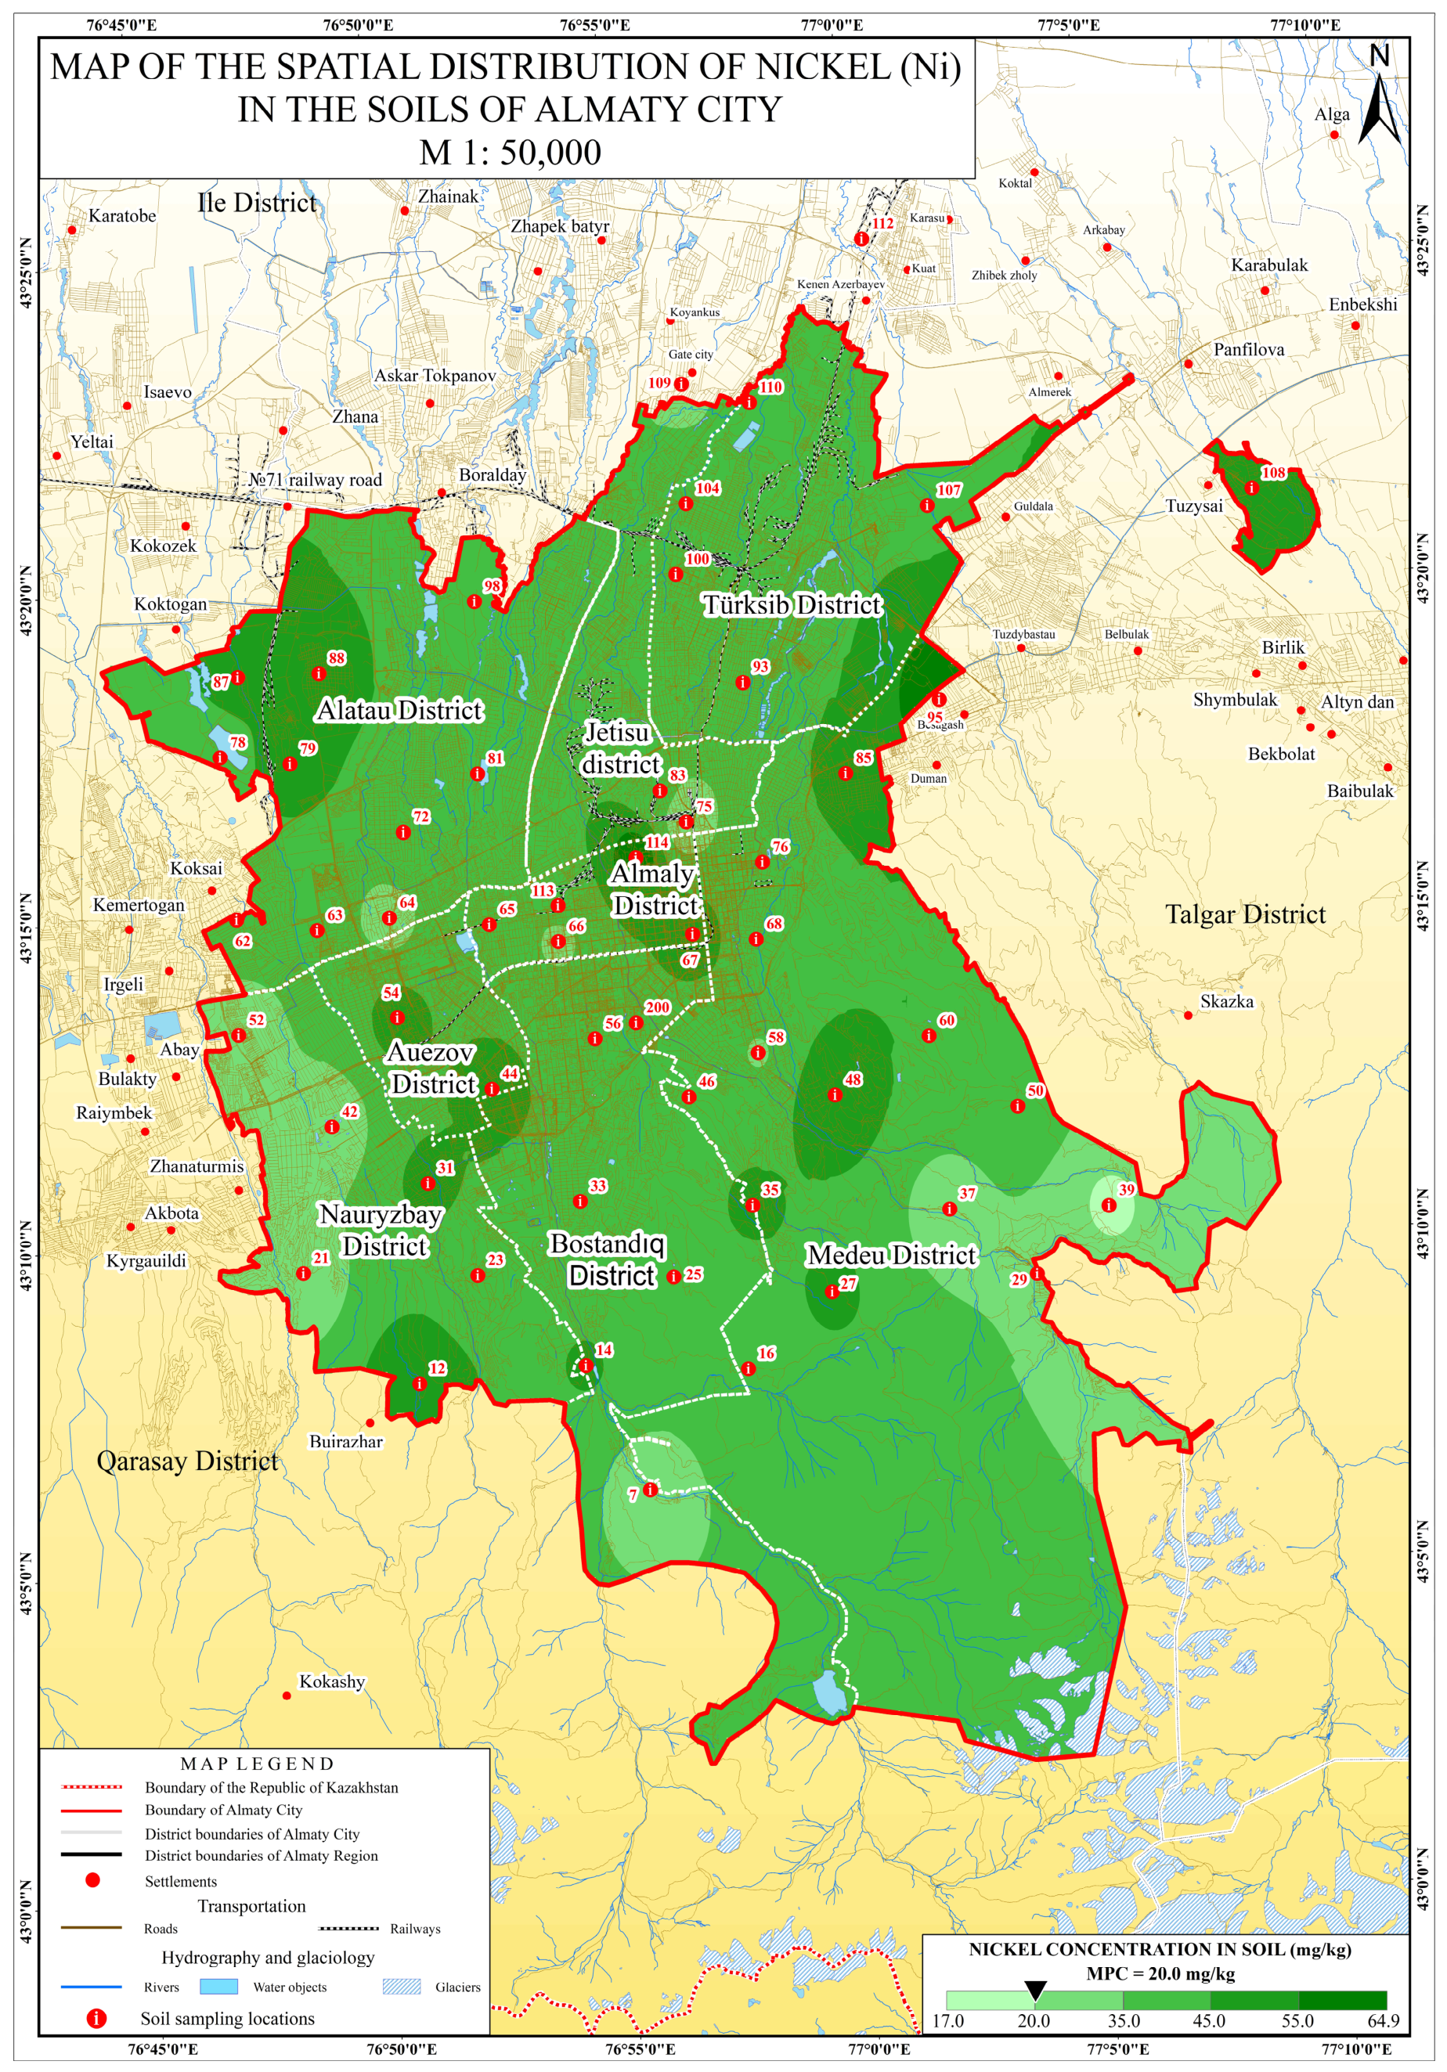
The results of the analysis of heavy metal and trace element contents in the soils of the urbanized territories of Almaty demonstrated significant variability, with exceedances of maximum permissible concentrations (MPC) in a number of cases. This indicated the presence of local technogenic pollution hotspots formed under the influence of anthropogenic factors. Below, the content of individual heavy metals across the city territory is considered, with mapping performed for priority pollutants (
Figure 5,
Figure 6,
Figure 7 and
Figure 8).
Lead is among the most widespread contaminants in urban environments. Exceedances of the MPC (32 mg/kg) were recorded in samples No. 75, 114, 83, 20K, and 100, where Pb concentrations ranged from 54 to 144 mg/kg. This evidenced technogenic input of lead associated with transport emissions and the activities of industrial enterprises. Sample No. 114 (Makatayev Street, 129/1V, vicinity of the former S.M. Kirov Machine-Building Plant) showed elevated concentrations of Pb, Zn, Cu, and Ni, attributable to historical industrial emissions from metalworking, foundry, forging, electroplating, and heat treatment activities. Although the plant is currently non-operational, elevated concentrations have persisted due to residual contamination from prolonged technogenic impact. Lead is characterized by high stability in the soil environment and low migration capacity, contributing to the formation of persistent pollution hotspots.
Samples No. 75 (Abylai Khan Street, 8/10) and No. 83 (Seifullin Street, 6, near CHP-1) were located in areas with high industrial and transport loads. The B. Orazbayev CHP-1 (Seifullin Avenue, 433) operated on fuel combustion, leading to emissions of heavy metals and their deposition on the soil surface. Sample No. 100 (S. Seifullin Park) also showed lead exceedance; despite its status as a green zone, the site was affected by transport emissions and stationary sources. The studied territories were characterized by significant anthropogenic pressure associated with industrial facilities and intensive traffic, which contributed to lead accumulation in the upper soil layer. Sample No. 75 (Abylai Khan Street, 8/10) and No. 83 (Seifullin Street, 6, near CHP-1) exhibited high Pb and Zn levels associated with intensive traffic and thermal power plant emissions from fuel combustion. These territories were characterized by significant anthropogenic pressure from industrial facilities and heavy traffic.
The elevated cadmium content could be associated with vehicle emissions and the activities of small production enterprises using fuel and metal-containing materials. Samples No. 87 and 85 belonged to the territory of Tole bi Street–Sain Street, characterized by high traffic load and dense development; here, cadmium was likely accumulated as a result of emissions from intensive road traffic and vehicle exhaust gases.
Samples No. 9K (Al-Farabi Street–Dostyk Street area) and No. 12K (Suyunbay Street–industrial zone area) also demonstrated significant cadmium concentrations. These zones were technogenically loaded territories affected by industrial enterprises, boiler houses, and motor vehicle flows. Sample No. 107 (Timiryazev Street–Manas area) contained 20 mg/kg of cadmium, which is 40 times above the MPC. An automobile filling station (gas station) was located in this area, and the territory was characterized by intensive traffic and the presence of small service facilities (car repair shops, car washes, auto services), which could serve as sources of cadmium contamination. The identified sites with MPC exceedances for cadmium are localized in zones with pronounced technogenic impact. Cadmium accumulation in the soil cover was caused by the combined influence of transport emissions, fuel combustion, and industrial enterprise operations, necessitating regular monitoring and ecological risk assessment.
In the majority of soil samples, arsenic concentrations exceeded the MPC (2 mg/kg) 3–8 times. Maximum values (15–16 mg/kg) were recorded in samples No. 88, 114, 20K, and 1K. Sample No. 88 was collected in the Tole bi Street–Sain Street area, characterized by high traffic activity and proximity to an industrial zone. The exceedance of arsenic content was likely associated with dust deposition from fuel combustion areas and vehicle emissions. Sample No. 114 (Makatayev Street, 129/1V, territory of the former S.M. Kirov Machine-Building Plant) showed 13 mg/kg As, indicating technogenic influence from the enterprise.
Sample No. 20K (vicinity of Al-Farabi Avenue, Farabi Hub area) contained 15 mg/kg of arsenic; the site was located near a major traffic artery with intensive movement, contributing to element accumulation through atmospheric emissions and dust deposition. Sample No. 1K (Dostyk Street–Zholdasbekov Street area) showed the maximum value in the dataset (16 mg/kg); the area was characterized by increased urbanization, active transport movement, and proximity to highways. Elevated arsenic concentrations were observed in zones with pronounced technogenic impact, where the combined influence of industrial enterprises, traffic flows, and atmospheric dust particle deposition led to element accumulation in the upper soil horizon. In the human body, arsenic causes lung cancer, skin diseases, ulceration, hematological effects, and anemia.
Zinc concentrations exceeded the MPC (55 mg/kg) in virtually all investigated samples. Particularly high values were recorded in samples No. 75, 114, 58, 64, and 83 (281–533 mg/kg, exceeding by 5–10 times). Sample No. 75 (Abylai Khan Street, 8/10) demonstrated the maximum (533 mg/kg); the territory was located in the central part of the city with intensive traffic, where the exceedance was associated with wear of automobile tires, brake pads, and batteries. Sample No. 114 (Makatayev Street, 129/1V) contained 281 mg/kg Zn, attributable to industrial emissions from metalworking production and electroplating processes.
Sample No. 75 (Abylai Khan Street, 8/10) demonstrated the maximum Zn concentration (533 mg/kg), associated with intensive traffic and tire/brake wear. Sample No. 114 (Makatayev Street, 129/1V) contained 281 mg/kg Zn, attributable to historical industrial emissions from metalworking and electroplating processes.
The combined influence of transport, thermal power, and machine-building enterprises led to the formation of persistent localized pollution hotspots, necessitating regular environmental monitoring.
Copper concentrations ranged from 19 to 181 mg/kg, exceeding the MPC (33 mg/kg) by 1.3–5.5 times in many cases. The highest values were observed in central, industrial, and transport-loaded districts. Sample No. 114 (Makatayev Street, 129/1V) contained 181 mg/kg; the source was the activity of a machine-building enterprise with emissions of copper-containing aerosols. Sample No. 35 (Tau–Samal microdistrict, V.G. Fesenkov Astrophysical Institute) showed 112 mg/kg, likely due to accumulation of dust particles from central highways. Sample No. 64 (Aqbulaq microdistrict, Ryskulov Street, 147, “Qazaq Oil” filling station) contained 61 mg/kg, resulting from traffic movement and localized sources of petroleum products.
Sample #20K (near Al-Farabi Avenue) showed 58 mg/kg, associated with traffic flows. Sample #83 (Seifullina Street, near CHPP-1) was 67 mg/kg, indicating the influence of heat and power production. Sample #75 (Abylay Khan Street, 8/10) contained 134 mg/kg, associated with traffic activity. Sample #79 (Algabas Microdistrict, 7th Street, 130, near CHPP-2) was 38 mg/kg, from heat and power emissions. Sample #66 (M.K. Gandhi Park) was 44 mg/kg, from atmospheric deposition. Sample #67 (Kurmangazy/Abylay Khana Street) was 44 mg/kg, from transport exposure. Sample #113 (Tole Bi Street, 189, AZTM) was 45 mg/kg, from historical emissions. Sample #62 (Terekti microdistrict, Heroes of the Second World War Park) was 36 mg/kg, from atmospheric transfer. Sample #42 (Kalkaman-2 microdistrict, Alatau recreation area) was 45 mg/kg, from transport and household emissions. Sample #25 (Alatau SGP microdistrict) was 45 mg/kg, from atmospheric deposition and road activity. Copper is one of the priority soil pollutants in Almaty. The most vulnerable areas are the central and industrial districts, where localized foci of technogenic pollution form under the influence of transport and industrial factors.
Nickel concentrations exceeded the MAC (20 mg/kg) in almost all samples (except for No. 39, Butakovka), ranging from 23 to 65 mg/kg (an excess of 1.5 to 3.2 times). The highest values were: No. 114 (65 mg/kg), No. 35 (47 mg/kg), No. 20K (34 mg/kg), No. 64 (30 mg/kg), and No. 83 (37 mg/kg). Elevated concentrations were typical for central, industrial, and transport-heavy areas.
The main sources were metallurgical and machine-building enterprises, thermal power facilities (CHP-1, CHP-2), and motor vehicles. Nickel accumulation was associated with atmospheric deposition and the low mobility of the element. Exceedances of the MPC indicated widespread technogenic pollution and the need for monitoring zones under industrial and transport impact.
Cobalt concentrations exceeded the MPC (5 mg/kg) in samples No. 67, 95, 35, 7K, 12K, and 42 (47–80 mg/kg, exceeding by 9–16 times). The highest values were recorded in: Alghabas microdistrict near CHP-2 (80 mg/kg), Zhandosov Street (66 mg/kg), Tau-Samal microdistrict (63 mg/kg), Kalkaman-2 microdistrict (64 mg/kg), southern industrial zone (69 mg/kg), and the intersection of Kurmangazy and Abylai Khan Streets (51 mg/kg). Concentrations were confined to areas with industrial infrastructure and traffic load; sources included enterprise emissions, fuel combustion, and vehicle wear. Cobalt distribution exhibited a hotspot pattern, with localized technogenic anomalies in industrial-transport districts, requiring regular monitoring and assessment of migration activity.
Molybdenum concentrations generally did not exceed the MPC (4 mg/kg), although slight exceedances (4.5–7.0 mg/kg) were observed at several points: AZTM territory (Tole bi Street, 189), Aqbulaq microdistrict (Ryskulov Street, 147, “Qazaq Oil” filling station), industrial zone along Severnoye Koltso Street, Zhandosov Street area, Sain Street, SGP “Alatau”, and the industrial zone on Severnoye Koltso. Exceedances were characteristic of sites near traffic flows, filling stations, thermal power, and machine-building enterprises; sources included dust emissions from fuel combustion, wear of vehicle components, and wastewater. Despite the relatively low levels, systematic molybdenum accumulation warranted monitoring.
Manganese concentrations (529–872 mg/kg) did not exceed the MPC (1500 mg/kg) and corresponded to natural background levels. Characteristic values were recorded in M.K. Gandhi Park, AZTM territory, Aqbulaq microdistrict, vicinity of the V.G. Fesenkov Observatory, SGP “Alatau”, “Alatau” recreation zone, and the vicinity of Farabi Hub. The content was determined by natural geochemical processes of weathering and accumulation.
Elevated concentrations were also observed in areas with high human presence. In the Central Park of Culture and Leisure named after Gorky, MPC exceedances were recorded for nickel (2 times), zinc (1.9 times), arsenic (3.5 times), and cadmium (8.2 times). In the vicinity of Almaty-2 railway station: lead (1.5 times), cadmium (4 times), zinc (1.7 times), and arsenic (3.5 times). In the area of the central stadium and circus: lead (2 times), cadmium (8 times), zinc (1.5 times), and arsenic (4 times). Near the airport: lead (2 times), cadmium (12 times), zinc (1.5 times), and arsenic (8 times).
Overall, localized areas of intensive technogenic pollution with MPC exceedances for Pb, Cd, As, Zn, Cu, Ni, Co, and Mo were identified in the urbanized territories. The most contaminated samples were No. 75, 114, 58, 64, 83, 44, 12K, and 107, indicating high technogenic load and the need for further monitoring and pollution reduction.
The results of the comprehensive analysis of heavy metal content, morphological characteristics, and spatial distribution of pollution indicators (Kc and Zc) enabled the identification of several localized areas with elevated technogenic load within Almaty city. These zones are associated with industrial districts, transport hubs, and older residential areas, where accumulation of priority pollutants—Pb, Zn, Cu, and Ni—was observed.
The central and eastern parts of the city (Rayymbek Avenue–Sain Street–Almaty-2 area) were characterized by extremely high integrated pollution indices (Zc > 128). The highest concentrations were recorded for Pb, Zn, and Cu (Kc = 4–8), corresponding to strong and very strong pollution levels. Morphologically, these soils were classified as urbanozems with inclusions of construction debris, signs of compaction, and darkening of the humus horizon. Pollution sources included motor vehicles, industrial enterprise emissions, and dust accumulation.
In the industrial zone of the eastern sector (Alatau district, industrial zone along Ryskulov–Sayaly Streets), a high pollution level was observed (Kc = 3–6; Zc = 60–110). Cu, Ni, and Co predominated here, with likely sources being industrial emissions and dust from metallurgical and construction activities. Soils exhibited slightly acidic reaction, dense structure, and reduced humus content. Morphological profiles showed technogenic inclusions and signs of secondary salinization.
The southeastern part of the city (Baum Grove–Bostandyq district) demonstrated moderate pollution levels, with Zn and Pb exceeding background values by 3–5 times (Kc = 2–4) according to analytical measurements. Soils fell into the moderately hazardous category (Zc = 25–40). Thinning of the humus layer was recorded, although partial biogenic activity was preserved. These areas represented a transitional zone between industrial and recreational functions.
Foothill and western areas (Kokzhaylau and KazNU-city districts) maintained near-background conditions. In these zones, Zc ≤ 16, and metal contents did not exceed background levels (Kc < 1–1.2). Soils exhibited natural morphology, well-developed humus horizons. These areas demonstrated stable ecosystem conditions, high buffering capacity, and potential for self-purification.
The analysis showed that the primary contaminants of urban soils in Almaty are lead (Pb), associated with transport arteries and older built-up areas with high Kc = 4–8; zinc (Zn), showing widespread distribution and forming technogenic halos around roads; copper (Cu), linked to industrial emissions and accumulation in the eastern and central sectors; and nickel (Ni), occurring together with Cu and Co and indicating specific technogenic sources, and metallurgical and machine-building facilities.
Correlation analysis confirmed a common origin for the Pb–Zn–Cu–Ni group, evidencing a unified mechanism of input and migration. In contrast, Mn, Co, and Mo retained a more background character, forming the geochemical baseline of the soils. The spatial distribution of contaminants reflected the combination of primary accumulation and secondary migration processes. In the central part of the city, accumulation and fixation of metals in the upper horizons predominated, due to low filtration capacity and weak drainage. In peripheral zones, partial redistribution of contaminants and formation of diffuse technogenic halos were observed.
The most hazardous areas in terms of combined indicators were the urbanozems of the eastern and central sectors, where the complex impact of pollutants led to structural degradation, loss of humus horizon, and reduced biological productivity of soils. These sites require priority monitoring and ecological rehabilitation.
The results of this study are directly related to several United Nations Sustainable Development Goals (SDGs).
SDG 3. Good Health and Well-being. Elevated concentrations of toxic elements such as lead, cadmium, and arsenic pose direct risks to public health.
SDG 11. Sustainable Cities and Communities. The identification of contaminated urban areas and the need for risk-based land management closely align with the objectives of this goal, which emphasizes the importance of reducing environmental risks in urbanized areas.
SDG 15. Life on Land. The observed degradation of soil properties, including reduced biological activity and disruption of biogeochemical cycles, reflects challenges related to the protection and restoration of terrestrial ecosystems.
The implementation of monitoring systems, remediation strategies, and sustainable land-use planning based on the findings of this study can contribute to achieving these goals at the regional level. The integration of these measures not only helps minimize current threats but also establishes a foundation for the city’s long-term environmental well-being.
Under conditions of rapid urbanization, soil contamination has become a critical factor limiting the sustainability of urban ecosystems. Urban soils perform essential ecological functions, including buffering pollutants, regulating water regimes, and supporting urban green infrastructure.
However, the accumulation of heavy metals significantly reduces their capacity to provide these ecosystem services. Despite growing recognition of this issue, the quality of urban soils is still insufficiently integrated into urban planning systems and sustainable development frameworks, particularly in Central Asian cities.
In this context, spatially oriented assessments of soil contamination are crucial for supporting science-based environmental management and sustainable urban development.