


Abstract
Mountain ecosystems of Kazakhstan host geographically isolated Sibiraea populations, whose taxonomic status is complicated by overlapping morphology, environmental plasticity, and conflicting nomenclatural treatments. We compared 177 adult shrubs sampled at nine elevation-stratified sublocalities nested within three regional analytical groups (two S. altaiensis groups, n = 60 each; one S. tianschanica group, n = 57) using whole-shrub morphology, quantitative leaf anatomy, four soil variables, and a preliminary four-locus DNA-barcode comparison based on eight taxon-level consensus sequences (two taxa × four loci). One-way ANOVA identified regional-group differences in bush width (F(2,174) = 8.89, p < 0.001), vegetative offshoot number (F(2,174) = 21.85, p < 0.001), leaf-blade thickness (F(2,174) = 21.09, p < 0.001), soil pH (F(2,174) = 72.61, p < 0.001), electrical conductivity (F(2,174) = 41.22, p < 0.001), total nitrogen (F(2,174) = 40.21, p < 0.001), and total carbon (F(2,174) = 39.00, p < 0.001). In contrast, plant height and several vascular traits did not differ significantly, and most soil-trait associations were weak (|ρ| ≤ 0.33). Across ITS, matK/KIM, psbA-trnH, and rbcL, the concatenated alignment showed 99.49% identity and an uncorrected p-distance of 0.51%; psbA-trnH (0.97%) and ITS (0.69%) were the most variable loci. The combined evidence demonstrates regional phenotypic and edaphic differentiation but does not establish independent evolutionary lineages because taxon and geography are confounded, and individual-level genetic variation was sparsely sampled. By establishing measurable baselines for demographic monitoring, habitat protection, provenance-based ex situ conservation, and future restoration, the study directly supports the sustainable management and long-term resilience of rare mountain-plant populations in Kazakhstan.
1. Introduction
The mountain systems of Kazakhstan form part of the Central Asian biodiversity region and retain extensive natural and semi-natural complexes across strong elevational and climatic gradients. The ten-volume Flora of Kazakhstan catalogued 5631 vascular-plant taxa. In contrast, a recent national synthesis reported 6035 species, underscoring both the richness of the flora and the ongoing need for taxonomic revision and georeferenced inventory [1,2].
Woody Rosaceae are prominent components of these mountain floras and include taxa of ecological, evolutionary, and conservation interest [3,4]. Within Rosaceae, Sibiraea is a small, geographically fragmented shrub genus whose members occur in disjunct mountain regions of Eurasia and Central Asia [5,6,7]. Such disjunctions make the genus useful for examining whether observed differences reflect historical lineage divergence, local ecological differentiation, phenotypic plasticity, or combinations of these processes.
The taxonomic treatment of the Altai plants is disputed. Regional floras and conservation sources have traditionally used Sibiraea altaiensis (Laxm.) C.K.Schneid., whereas Plants of the World Online and the World Checklist of Vascular Plants currently treat this name as a synonym of the accepted Sibiraea laevigata (L.) Maxim. [1,8,9]. By contrast, Sibiraea tianschanica (Krasn.) Pojark. is currently accepted and is reported as native to Kazakhstan and Kyrgyzstan; it was originally described at varietal rank as Spiraea laevigata var. tianschanica Krasn. [10]. We retain S. altaiensis as the regional field-identification name used in Kazakhstan, while explicitly distinguishing it from the broader accepted concept of S. laevigata.
The controversy persists because the taxa share a glabrous, multi-stemmed shrub habit, sessile, entire leaves, paniculate racemes, and similar follicles. Characters historically used for separation—plant stature, leaf width and apex shape, inflorescence size, pedicel development, and pubescence of the hypanthium and inflorescence axis—are quantitative, partly overlapping, and potentially responsive to altitude, moisture, exposure, and plant age [1,7]. The sampled Altai and Ketmen/Tien Shan groups are geographically separated rather than sympatric; therefore, the present design cannot test contemporary hybridisation directly and is also vulnerable to region-by-taxon confounding.
No single evidence class is sufficient for delimiting closely related plants. Morphology is directly interpretable and useful for field diagnosis, but can be plastic; anatomy may reveal less visible structural differences, but is also environmentally responsive; soil measurements characterise habitat contrasts but do not by themselves demonstrate adaptation; and standard DNA barcodes are reproducible but may lack resolution in recently diverged or reticulate Rosaceae [4,11,12,13,14,15,16]. An integrative approach is therefore strongest when concordance and disagreement among evidence classes are evaluated explicitly rather than used to force a predetermined taxonomic conclusion.
Previous molecular studies also caution against overinterpreting low barcode divergence in Sibiraea. Ballian et al. found very limited ITS and chloroplast-DNA variation among widely disjunct European and Altaic material [6]. In the Qinghai-Tibetan Sibiraea complex, chloroplast and ITS data alone provided limited species resolution, whereas nuclear microsatellites revealed population structure and gene flow [17,18,19]. These findings indicate that fixed differences in a small number of consensus barcode sequences should be treated as candidate diagnostic sites rather than as proof of independently evolving lineages.
The conservation context, however, makes rigorous population characterisation important. S. tianschanica has a restricted Central Asian distribution and has been assessed as threatened in regional conservation sources [10,20]. For S. altaiensis, recent reviews likewise emphasise rarity and the need to safeguard natural populations and ex situ resources [21]. Population-level information on morphology, regeneration, tissue structure, habitat chemistry, and genetic markers can therefore support monitoring even when taxonomic rank remains unsettled. From a sustainability perspective, such baselines help maintain viable populations, habitat integrity, and local provenance by enabling early detection of decline, prioritising site protection, and supporting evidence-based ex situ conservation and restoration.
This study addressed three scientific questions. First, do the three regional analytical groups differ consistently in morphology and leaf anatomy while retaining overlap expected under phenotypic plasticity? Second, how much of the observed trait variation is associated with the measured soil variables, and are those relationships sufficiently strong to support ecological interpretation? Third, do ITS, matK/KIM, psbA-trnH, and rbcL consensus sequences contain repeatable candidate differences, while remaining too conserved for definitive lineage delimitation?
We predicted that (H1) regional groups would differ in several quantitative morphology and anatomy traits but would not form completely discrete multivariate clusters; (H2) the four soil variables would distinguish regional habitats yet explain only a limited proportion of individual trait variation; and (H3) barcode sequences would show high overall identity with a small number of candidate diagnostic substitutions, especially in ITS and psbA-trnH. The objective was therefore to provide a conservative, integrative assessment of population differentiation and to translate the resulting evidence into a framework for sustainable monitoring, habitat management, and provenance-based conservation, rather than to present a definitive taxonomic revision.
2. Materials and Methods
2.1. Research Objects, Sampling Design, and Locations
The study examined plants identified in the field as Sibiraea altaiensis (Laxm.) C.K.Schneid. and Sibiraea tianschanica (Krasn.) Pojark. The 177 shrubs were sampled at nine elevation-stratified sublocalities nested within three regional analytical groups. The Rudny Altai group (SA-1; n = 60) comprised three sublocalities at 781, 914, and 1393 m; the Katon-Karagai group (SA-2; n = 60) comprised three sublocalities at 1665, 1847, and 1849 m; and the Ketmen/Tien Shan group (ST-1; n = 57) comprised three sublocalities at 1753, 2402, and 2512 m. Thus, the three group codes used in the analyses represent regional aggregates, not single-point populations. This nested structure provides replication across elevations within each regional group. However, the study includes only one regional group for S. tianschanica and therefore cannot fully separate taxon effects from geographic effects (Table 1). The full sampling hierarchy and sublocality-level elevations are provided in Supplementary Table S1.
Table 1.
Author-compiled comparative morphological characteristics used for field identification of Sibiraea altaiensis and Sibiraea tianschanica.
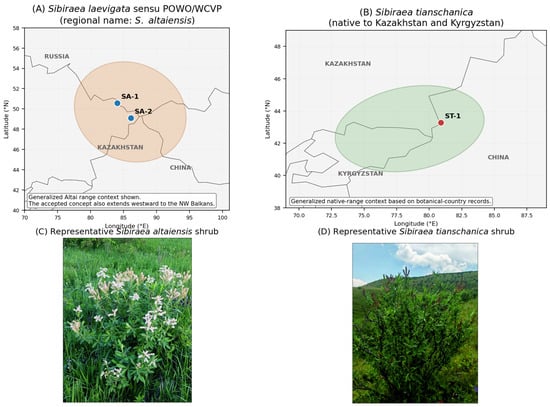
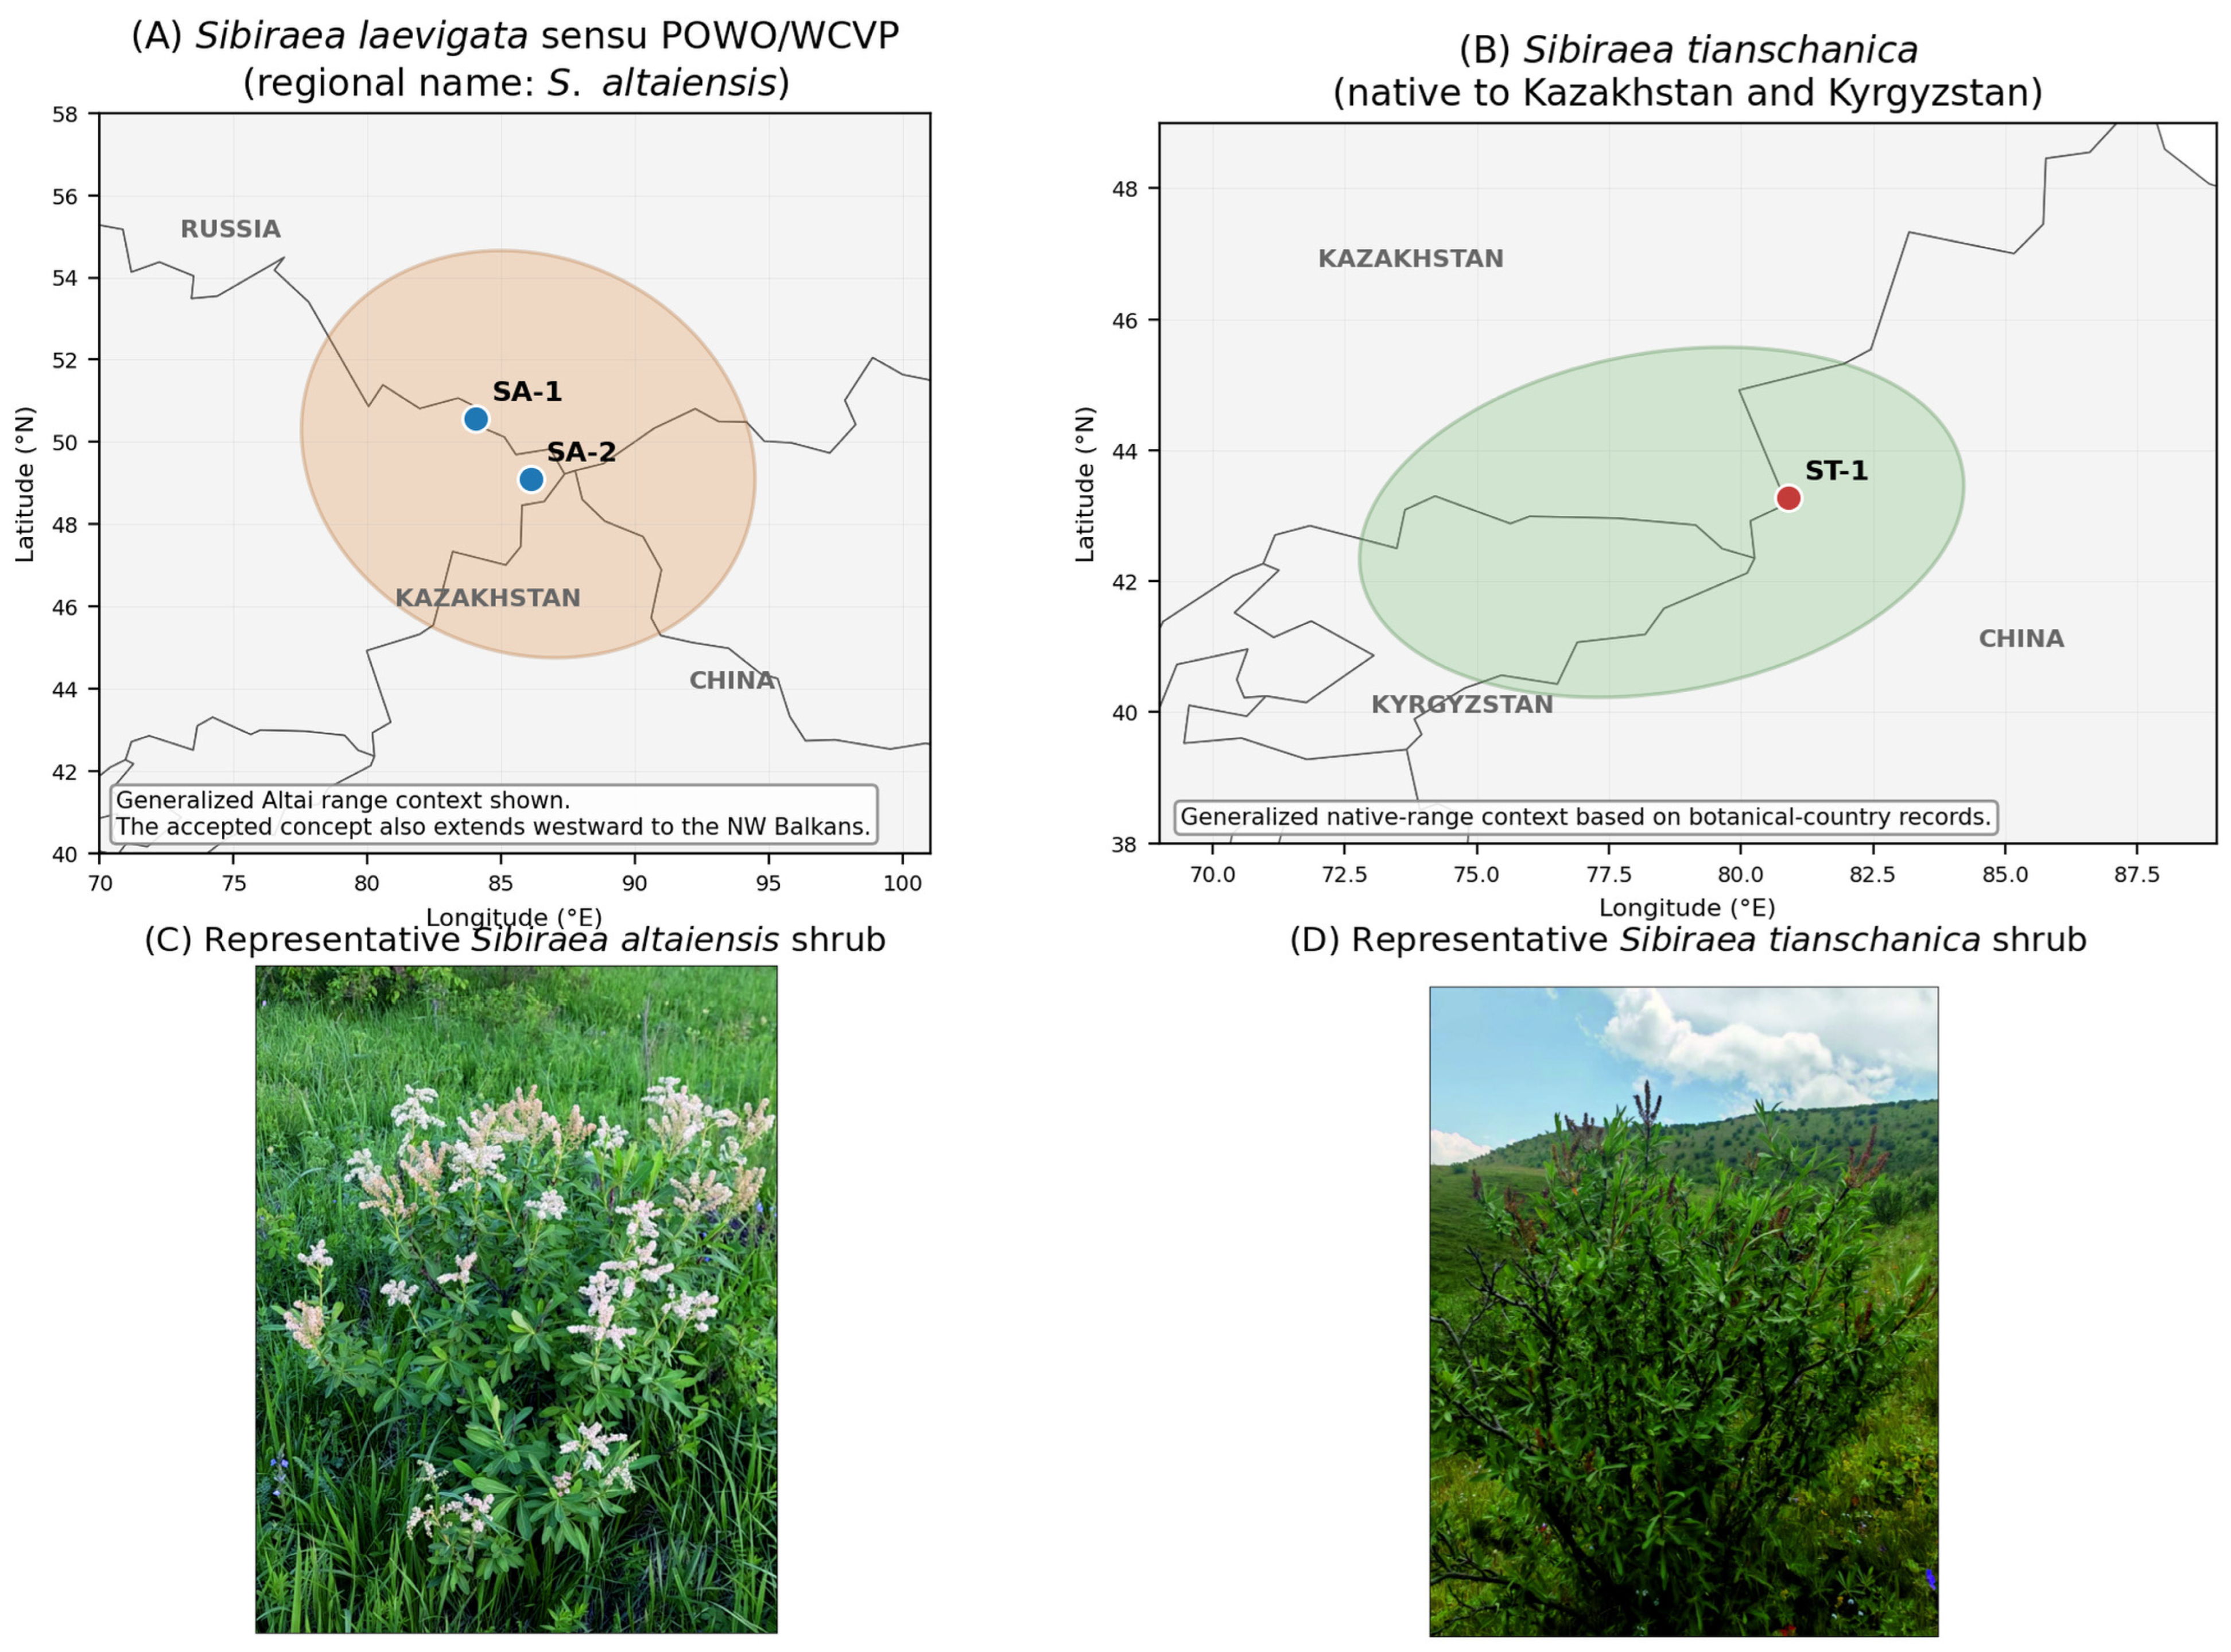
For each regional group, geographic coordinates were summarised in the WGS 84 system, and elevation and habitat were recorded for each nested sublocality (Table 2; Figure 1). Figure 1 separates the taxonomic-range context from the actual sampling locations. Panel A shows a generalised Altai range context for Sibiraea laevigata sensu POWO/WCVP, under which S. altaiensis is treated as a synonym, and locates SA-1 and SA-2. Panel B shows the generalised native-country context of S. tianschanica in Kazakhstan and Kyrgyzstan and locates ST-1. The shaded areas are broad contextual summaries, not occurrence polygons, distribution models, or evidence of sympatry.
Table 2.
Geographic characteristics of the studied populations of Sibiraea altaiensis and Sibiraea tianschanica in Kazakhstan.
Figure 1.
Generalised native-range context, sampling locations, and representative field habit of the studied Sibiraea taxa. (A) Sibiraea laevigata sensu POWO/WCVP, including the regional synonym S. altaiensis, with the SA-1 and SA-2 sampling groups; the broader accepted native range extends beyond the displayed Altai context. (B) S. tianschanica, reported as native to Kazakhstan and Kyrgyzstan, with the ST-1 sampling group. (C) Representative S. altaiensis shrub. (D) Representative S. tianschanica shrub. Shaded areas summarise broad taxonomic-range context and are not occurrence polygons or species distribution models.
Adult, multi-stemmed shrubs were examined at nine elevation-stratified sublocalities nested within three regional analytical groups. The design comprised 177 shrub-level observations: 60 in SA-1, 60 in SA-2, and 57 in ST-1. Chronological age and clonal identity were not determined; consequently, the records are interpreted as sampled shrubs rather than genetically verified genets.
Plant height and maximum bush width were recorded for each shrub, together with counts of generative shoots, vegetative offshoots, and dying trunks. Generative shoots were recorded as flowering or fruiting shoots, vegetative offshoots as non-reproductive basal or lateral shoots, and dying trunks as standing stems with extensive crown dieback or loss of living bark. The same shrub-level variables were used for descriptive summaries and regional-group comparisons, whereas continuous variables were z-standardised before multivariate ordination.
2.2. Anatomical and Histological Examination
Fully formed, visually intact leaves were selected for anatomical analysis. The central portion of the lamina, including the primary vein, was examined to reduce within-leaf positional variation. Measurements included leaf-blade, palisade-parenchyma and spongy-parenchyma thickness, primary-vein and central vascular-bundle radius, and phloem and xylem thickness. Repeated technical readings from comparable sections were consolidated into a single shrub-level value before inferential analysis, so that technical measurements were not treated as independent biological replicates.
Plant material was processed by standard paraffin histology following established plant-microtechnique principles [22,23]. The workflow comprised fixation, dehydration through an ascending alcohol series, clearing, paraffin infiltration, embedding, and transverse sectioning with a MEDITE A550 rotary microtome (MEDITE Medical GmbH, Burgdorf, Germany). Damaged, folded, compressed, or obliquely oriented sections were excluded. The same processing sequence was applied to all regional groups.
Sections were mounted on glass slides, deparaffinized, rehydrated, stained to differentiate mesophyll and vascular tissues, and examined with an RX50 light microscope (Ningbo Sunny Instruments Co., Ltd. [SOPTOP], Yuyao, Zhejiang, China). Micrographs were acquired with a SOPTOP digital camera (Ningbo Sunny Instruments Co., Ltd. [SOPTOP], Yuyao, Zhejiang, China), and calibrated measurements were obtained using MvImage View version 3.2.8 (Ningbo Sunny Instruments Co., Ltd. [SOPTOP], Yuyao, Zhejiang, China). Only intact transverse sections with clearly distinguishable tissue boundaries were measured.
Measurements were made at homologous positions in the central lamina and midrib using the same definitions across regional groups. Raw values were retained in micrometres for univariate analysis and standardised only for ordination. Inferential comparisons used shrub-level summaries so that repeated technical measurements from the same leaf or section were not treated as independent biological observations.
The leaf-blade and mesophyll variables characterise the thickness of assimilatory tissues, whereas the primary-vein, vascular-bundle, phloem, and xylem variables describe the conductive system. Raw values were retained in micrometres for univariate analysis and standardised only for ordination.
2.3. Soil Sampling and Chemical Analysis
Soil samples were collected from the upper root-zone in the immediate vicinity of the examined shrubs. They were linked to the same regional group and sublocality structure as the plant observations. The analytical dataset contains 177 records of shrub-associated soil. Because the archived field metadata do not distinguish all original cores from possible composite subsamples, the soil measurements are treated as shrub-associated analytical records rather than as fully independent spatial replicates.
After collection, the soil was air-dried, cleared of roots, litter, stones, and coarse fragments, gently disaggregated, passed through a 2-mm sieve (Retsch GmbH, Haan, Germany), and homogenised in accordance with ISO 11464 [24]. Aliquots for total carbon and nitrogen were ground before elemental analysis. Sample identifiers retained the regional-group and sublocality structure.
Soil pH was measured potentiometrically in an aqueous suspension using an AquaSearcher AB23PH-F bench meter equipped with an ST320 electrode (OHAUS Corporation, Parsippany, NJ, USA) [25]. Electrical conductivity was measured conductometrically in an aqueous soil extract and is reported as µS cm−1 [26]. Total nitrogen and total carbon were determined by dry combustion with a CN/CHNS elemental analyser in accordance with the cited standards [27,28]. All samples were processed using a consistent laboratory workflow across the three regional groups.
The limited soil panel was selected to provide comparable indicators of acidity, soluble-ion concentration, and bulk nitrogen and carbon status. The omission of texture, gravimetric moisture, available N-P-K, carbonates, and micronutrients is acknowledged as a limitation.
Soil values were analysed both as regional-group summaries and as shrub-linked covariates. Because taxon and region are partially confounded, soil-trait associations are interpreted as exploratory correlations rather than causal evidence of adaptation.
2.4. Molecular Genetic Analysis
The molecular component was designed as a preliminary taxon-level barcode comparison rather than a population-genetic or phylogenomic analysis. The available dataset contains one edited consensus sequence for each of four loci in each taxon (a total of eight consensus sequences). The archival metadata do not retain the exact number of source individuals contributing to every consensus sequence; therefore, the molecular analysis is limited to pairwise taxon-level comparison and does not estimate within-population diversity.
Genomic DNA was isolated from young leaf material using a standard plant-DNA extraction protocol. DNA concentration and purity were evaluated with a NanoDrop 2000 spectrophotometer (Thermo Fisher Scientific, Wilmington, DE, USA). The nuclear ITS region and the plastid rbcL, psbA-trnH, and matK/KIM regions were amplified using the primers listed in Table 3 [29,30,31,32].
Table 3.
Primers used for amplification of nuclear and plastid DNA markers in species of the genus Sibiraea.
PCR was performed in a VeritiPro thermal cycler (Applied Biosystems, Thermo Fisher Scientific, Waltham, MA, USA) using the locus-specific primer pairs listed in Table 3. The amplification workflow comprised initial denaturation, repeated denaturation–annealing–extension cycles, and final extension, with marker-specific annealing conditions. Products were analysed by agarose gel electrophoresis, purified, and bidirectionally sequenced by the Sanger method using the amplification primers.
Forward and reverse chromatograms were inspected manually, low-quality terminal regions were removed, and complementary reads were assembled into consensus sequences. Unresolved positions were coded as N. Locus alignments were checked before pairwise comparison, and gaps and ambiguous sites were tabulated separately from nucleotide substitutions.
BLASTn (NCBI BLAST+ version 2.17.0+) was used to screen sequences for initial identity checking [33]. For each locus, the two taxon-level consensus sequences were globally aligned and summarised by alignment length, the number of comparable A/C/G/T positions, matching sites, substitutions, ambiguous sites, gap columns, per cent identity, and uncorrected p-distance. The uncorrected p-distance was calculated as the number of nucleotide substitutions divided by the number of comparable A/C/G/T positions; gaps and ambiguous positions were tabulated separately and excluded from that denominator.
Candidate substitutions were accepted only when supported by the edited consensus sequences. They are described as candidate barcode differences that require validation across independently sequenced individuals and additional populations, not as fixed species-level characters or evidence of independent evolutionary lineages.
Public GenBank/INSDC accession numbers were not available at the time of revision. The edited consensus sequences and chromatogram-derived assemblies are retained in the project archive and are available from the corresponding author upon reasonable request. No provisional or fabricated accession identifiers are reported.
Sequence lengths, ambiguous-base counts, alignment lengths, and comparable-position counts are reported separately to avoid conflating substitutions with gaps or missing data. Per cent identity and uncorrected p-distance were calculated only from positions containing unambiguous A/C/G/T nucleotides in both compared consensus sequences.
The molecular analysis was explicitly separated from formal species delimitation. High-resolution SSR, SNP, RAD-seq, genome-skimming, or whole-plastome data, along with broader individual sampling, would be required to estimate population diversity, gene flow, and lineage independence [17,19].
The four-locus comparison was used only to evaluate relative barcode conservation and to identify provisional sites for future testing.
Because each locus is represented by only two taxon-level consensus terminals, no maximum-likelihood tree or haplotype network was constructed. With two terminals, there is only one unrooted connection and no alternative branching topology to compare; bootstrap resampling would therefore reproduce a mathematically trivial two-tip structure rather than test monophyly, within-taxon support or population-level lineage independence. Adding heterogeneous public records solely to create a larger tree would answer a different question and could introduce uneven locus coverage, uncertain voucher identity and non-comparable sequence quality. The present inference is therefore restricted to transparent pairwise barcode statistics and candidate positions. A defensible phylogenetic analysis requires multiple independently sequenced individuals, authenticated related taxa and consistent locus coverage.
2.5. Statistical Analysis
Continuous variables were summarised as mean ± standard deviation. One-way ANOVA and Tukey–Kramer pairwise comparisons were independently reconstructed from the reported group sample sizes, means, and standard deviations at α = 0.05; the recalculated F statistics, p values, and grouping letters matched the values reported in Table 4, Table 5 and Table 6 and Supplementary Table S3. This summary-statistic approach reproduces the classical one-way comparisons but does not permit residual diagnostics or a mixed-effects analysis of the nested sublocality structure. Results are therefore interpreted as regional-group comparisons rather than fully independent species-level tests.
Table 4.
Morphological parameters of the three regional analytical groups. Values are mean ± SD. Different superscript lowercase letters within a column indicate Tukey–Kramer differences at p < 0.05 after one-way ANOVA.
Table 5.
Leaf anatomical and histological parameters of the three regional analytical groups. Values are mean ± SD. Different superscript lowercase letters within a row indicate Tukey–Kramer differences at p < 0.05 after one-way ANOVA.
Table 6.
Soil-chemical parameters associated with the three regional analytical groups. Values are mean ± SD. Different superscript lowercase letters within a row indicate Tukey–Kramer differences at p < 0.05 after one-way ANOVA.
For principal coordinate analysis (PCoA), continuous traits were z-standardised, and Euclidean distances were calculated so that variables measured on different scales contributed comparably. Redundancy analysis (RDA) was used only for exploratory visualisation because the predictor panel included pH, EC, TN, and TC, and because taxon and region were not independently replicated. Soil-trait associations were evaluated with Spearman rank correlation; heat-map stars denote unadjusted p < 0.05. Effect size, direction, and the number of parallel tests were considered when interpreting correlations. Analyses were performed in R version 4.5.1 (R Foundation for Statistical Computing, Vienna, Austria) using reproducible scripts and the stats, vegan, ggplot2, dplyr, readxl, stringr, and ggrepel packages.
3. Results
3.1. Morphological Parameters of the Studied Populations
One-way ANOVA identified regional-group differences in bush width (F(2,174) = 8.89, p < 0.001), generative shoots (F(2,174) = 3.54, p = 0.031), and vegetative offshoots (F(2,174) = 21.85, p < 0.001). In contrast, bush height (F(2,174) = 1.61, p = 0.202) and dying trunks (F(2,174) = 2.48, p = 0.087) did not differ significantly (Table 4). Tukey–Kramer letters in the table identify pairwise differences.
Bush height was similar across groups (1.35–1.45 m). Bush width was lower in ST-1 (1.51 ± 0.43 m) than in both Altai groups (1.82 ± 0.78 and 1.99 ± 0.60 m). This pattern describes the sampled regional groups but cannot be assigned exclusively to species identity because region and taxon are confounded.
Generative shoot number was lower in ST-1 than in SA-2, with SA-1 intermediate. Vegetative offshoots were most abundant in SA-2 and did not differ between SA-1 and ST-1. The high standard deviations in generative shoot counts indicate overdispersion and heterogeneous reproductive effort; these values were retained rather than removed as outliers and should be interpreted cautiously.
Dying-trunk counts were numerically highest in ST-1, but the overall ANOVA was not significant. Consequently, the data do not support a categorical conclusion that ST-1 has higher mortality; rather, they identify this metric as a priority for continued demographic monitoring.
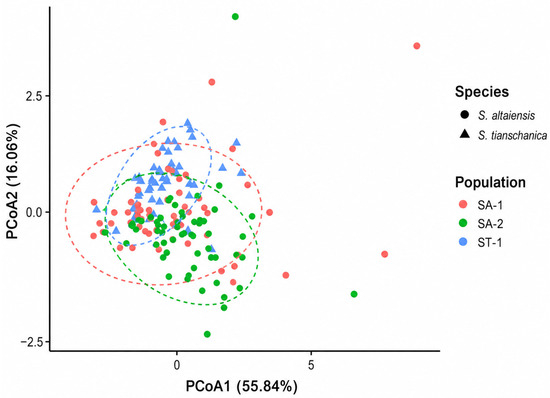
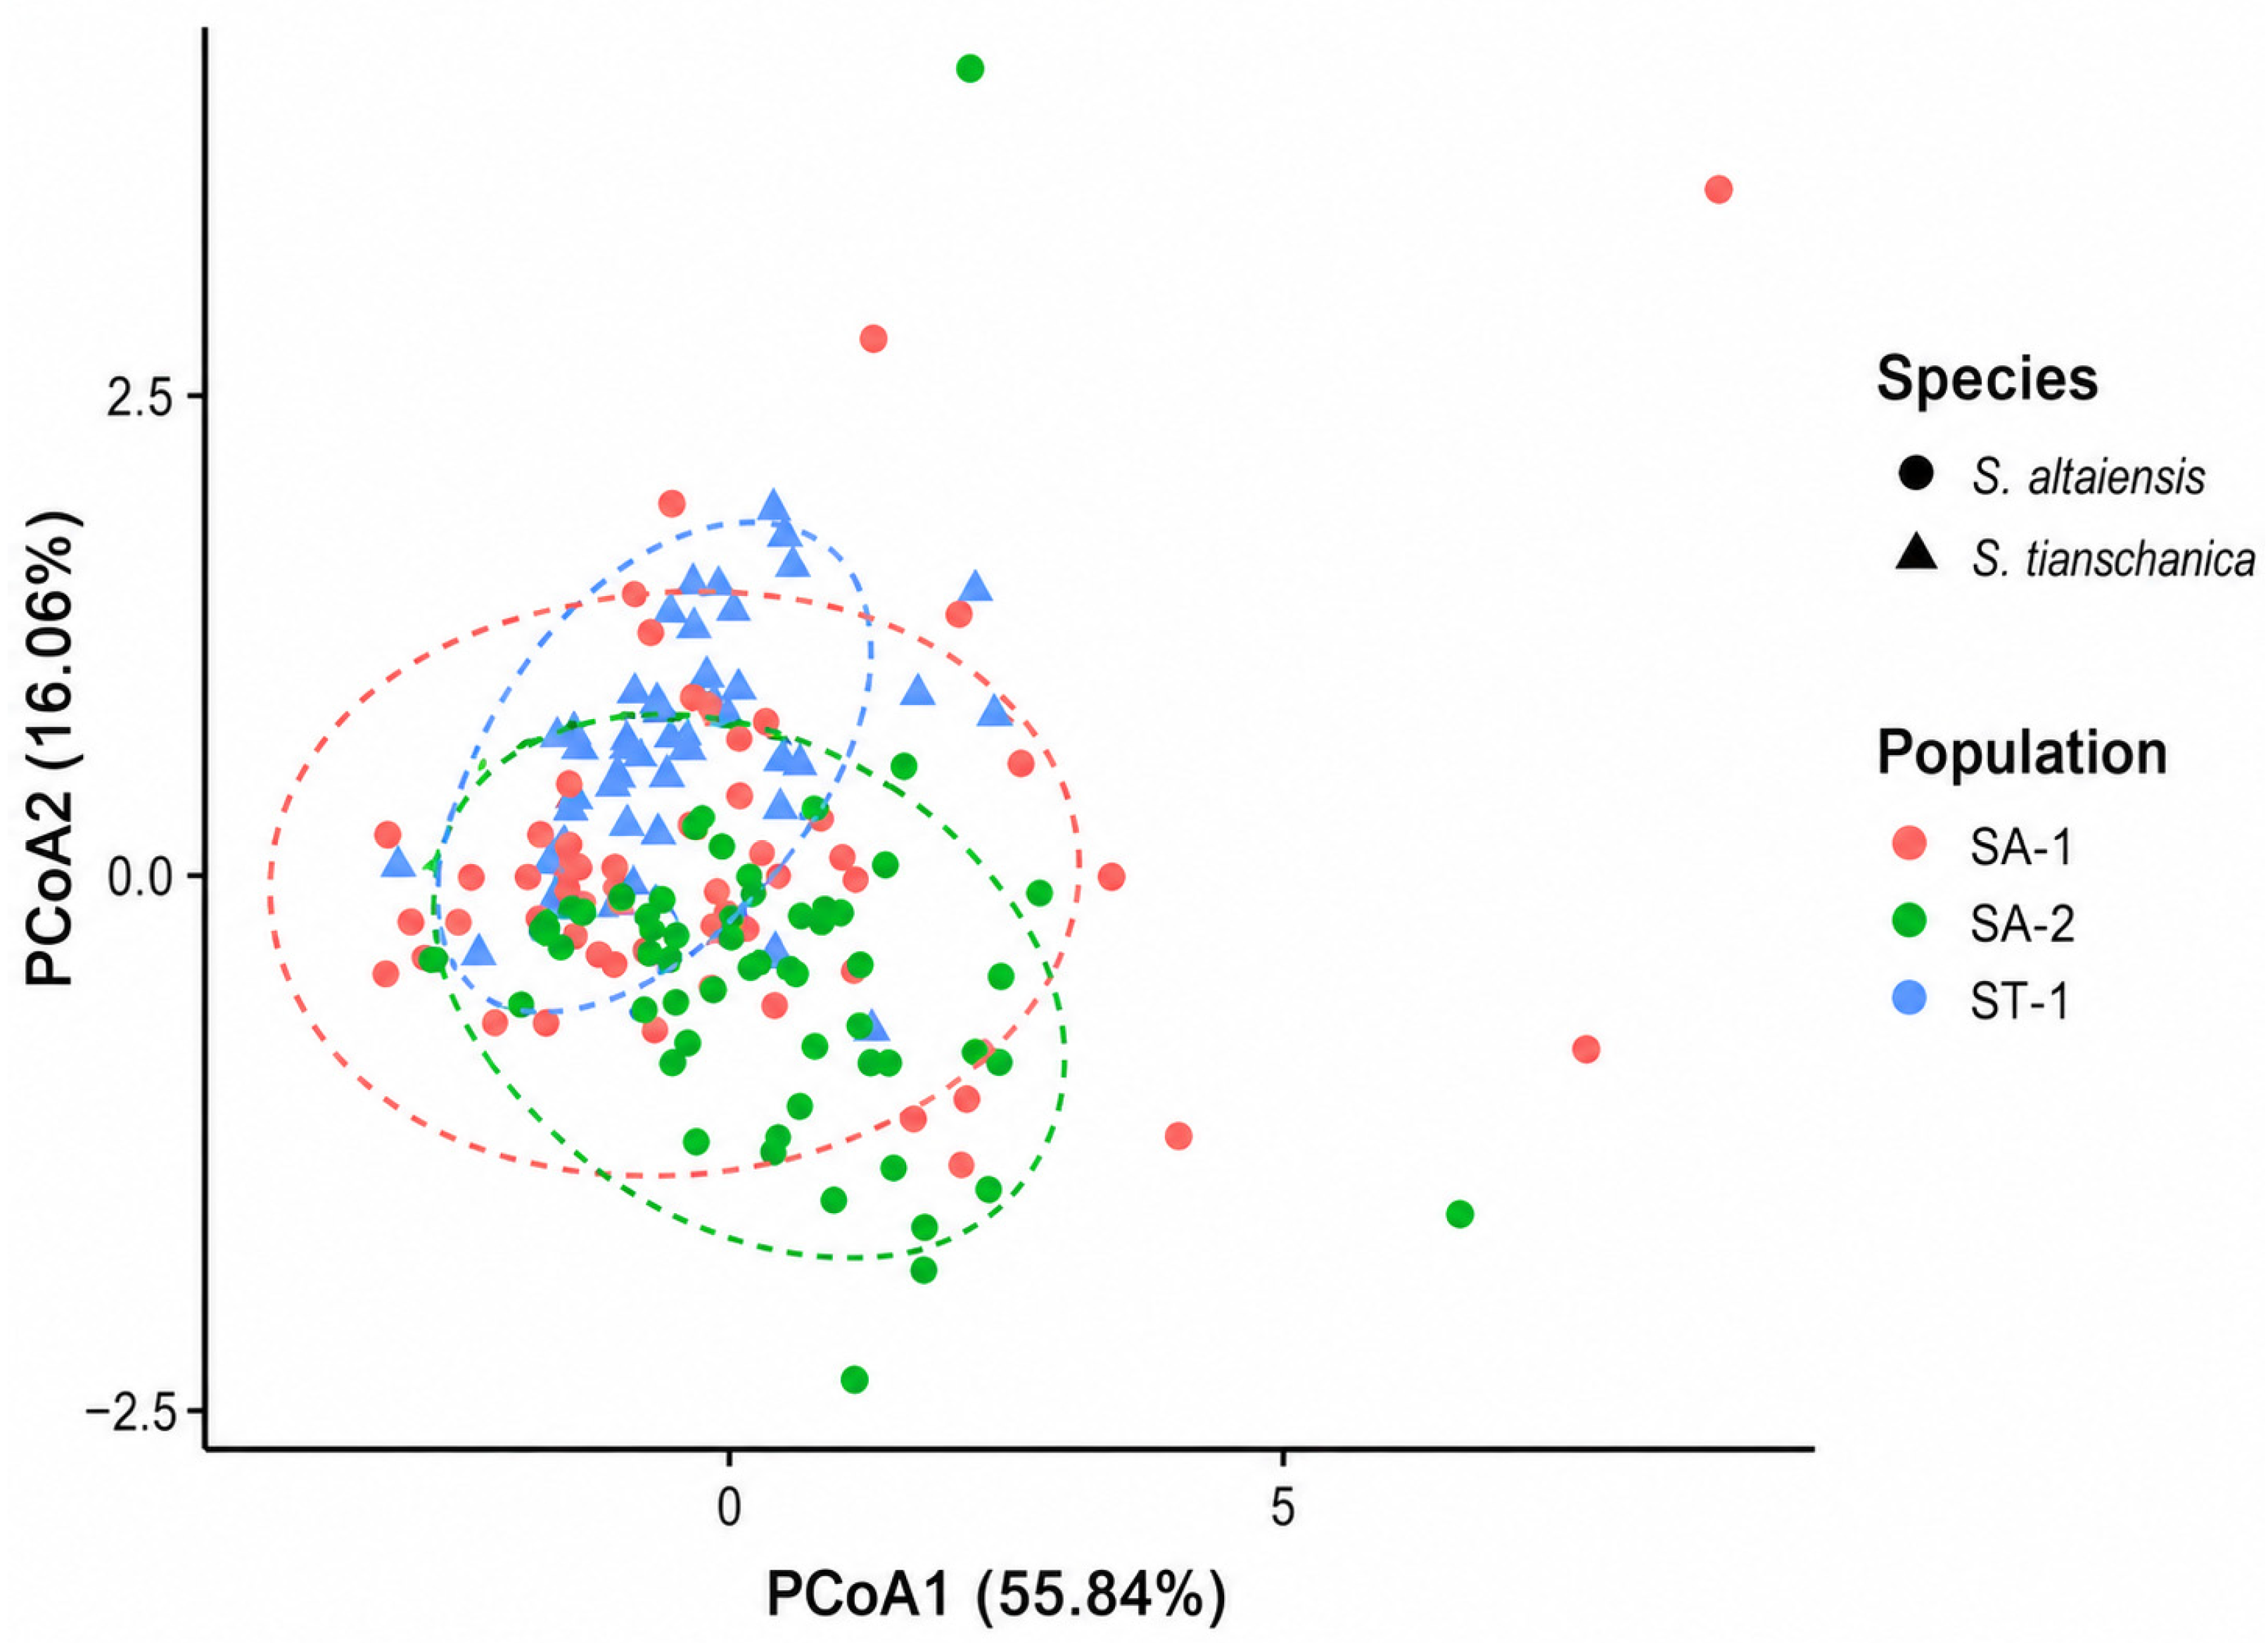
After z-standardisation, morphology-based PCoA summarised multivariate similarity using Euclidean distances. PCoA1 and PCoA2 explained 55.84% and 16.06% of variation, respectively (71.90% combined; Figure 2).
Figure 2.
Principal coordinate analysis (PCoA) of morphological parameters of S. altaiensis and S. tianschanica populations. Dashed ellipses show the group-specific ordination envelopes used to visualise within-group dispersion.
The three groups overlapped in ordination space. ST-1 was comparatively compact, whereas SA-1 showed the greatest dispersion. The partial separation supports regional phenotypic differentiation but not complete morphological diagnosability.
The wide dispersion of several SA-1 and SA-2 shrubs is consistent with substantial within-group variability. Because no observations were excluded solely for being distant from the centroid, the ordination represents the full measured range.
Overall, morphology supports H1: selected traits differed among regional groups, yet the groups did not form isolated clusters. The observed contrast is compatible with a combination of taxonomic, geographic, developmental, and environmental effects.
3.2. Anatomical and Histological Parameters of the Leaf
Leaf anatomy differed among regional groups for leaf-blade thickness (F(2,174) = 21.09, p < 0.001), palisade-parenchyma thickness (F(2,174) = 20.62, p < 0.001), spongy-parenchyma thickness (F(2,174) = 4.08, p = 0.019), primary-vein radius (F(2,174) = 11.52, p < 0.001), and phloem thickness (F(2,174) = 5.25, p = 0.006). Central vascular-bundle radius (F(2,174) = 1.79, p = 0.169) and xylem thickness (F(2,174) = 2.20, p = 0.113) did not differ significantly (Table 5).
SA-2 had thicker leaf blades, palisade parenchyma, and spongy parenchyma than SA-1 and ST-1. The latter two groups did not differ in Tukey–Kramer comparisons for these traits.
The primary vein radius was smaller in ST-1 than in either Altai group. Phloem was thinner in ST-1 than in SA-1, with SA-2 intermediate. No pairwise differences were supported for central vascular-bundle radius or xylem thickness.
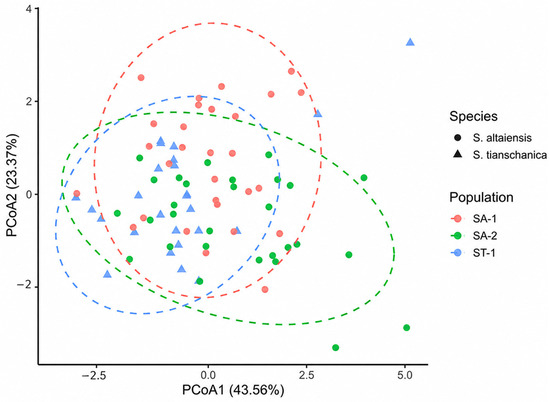
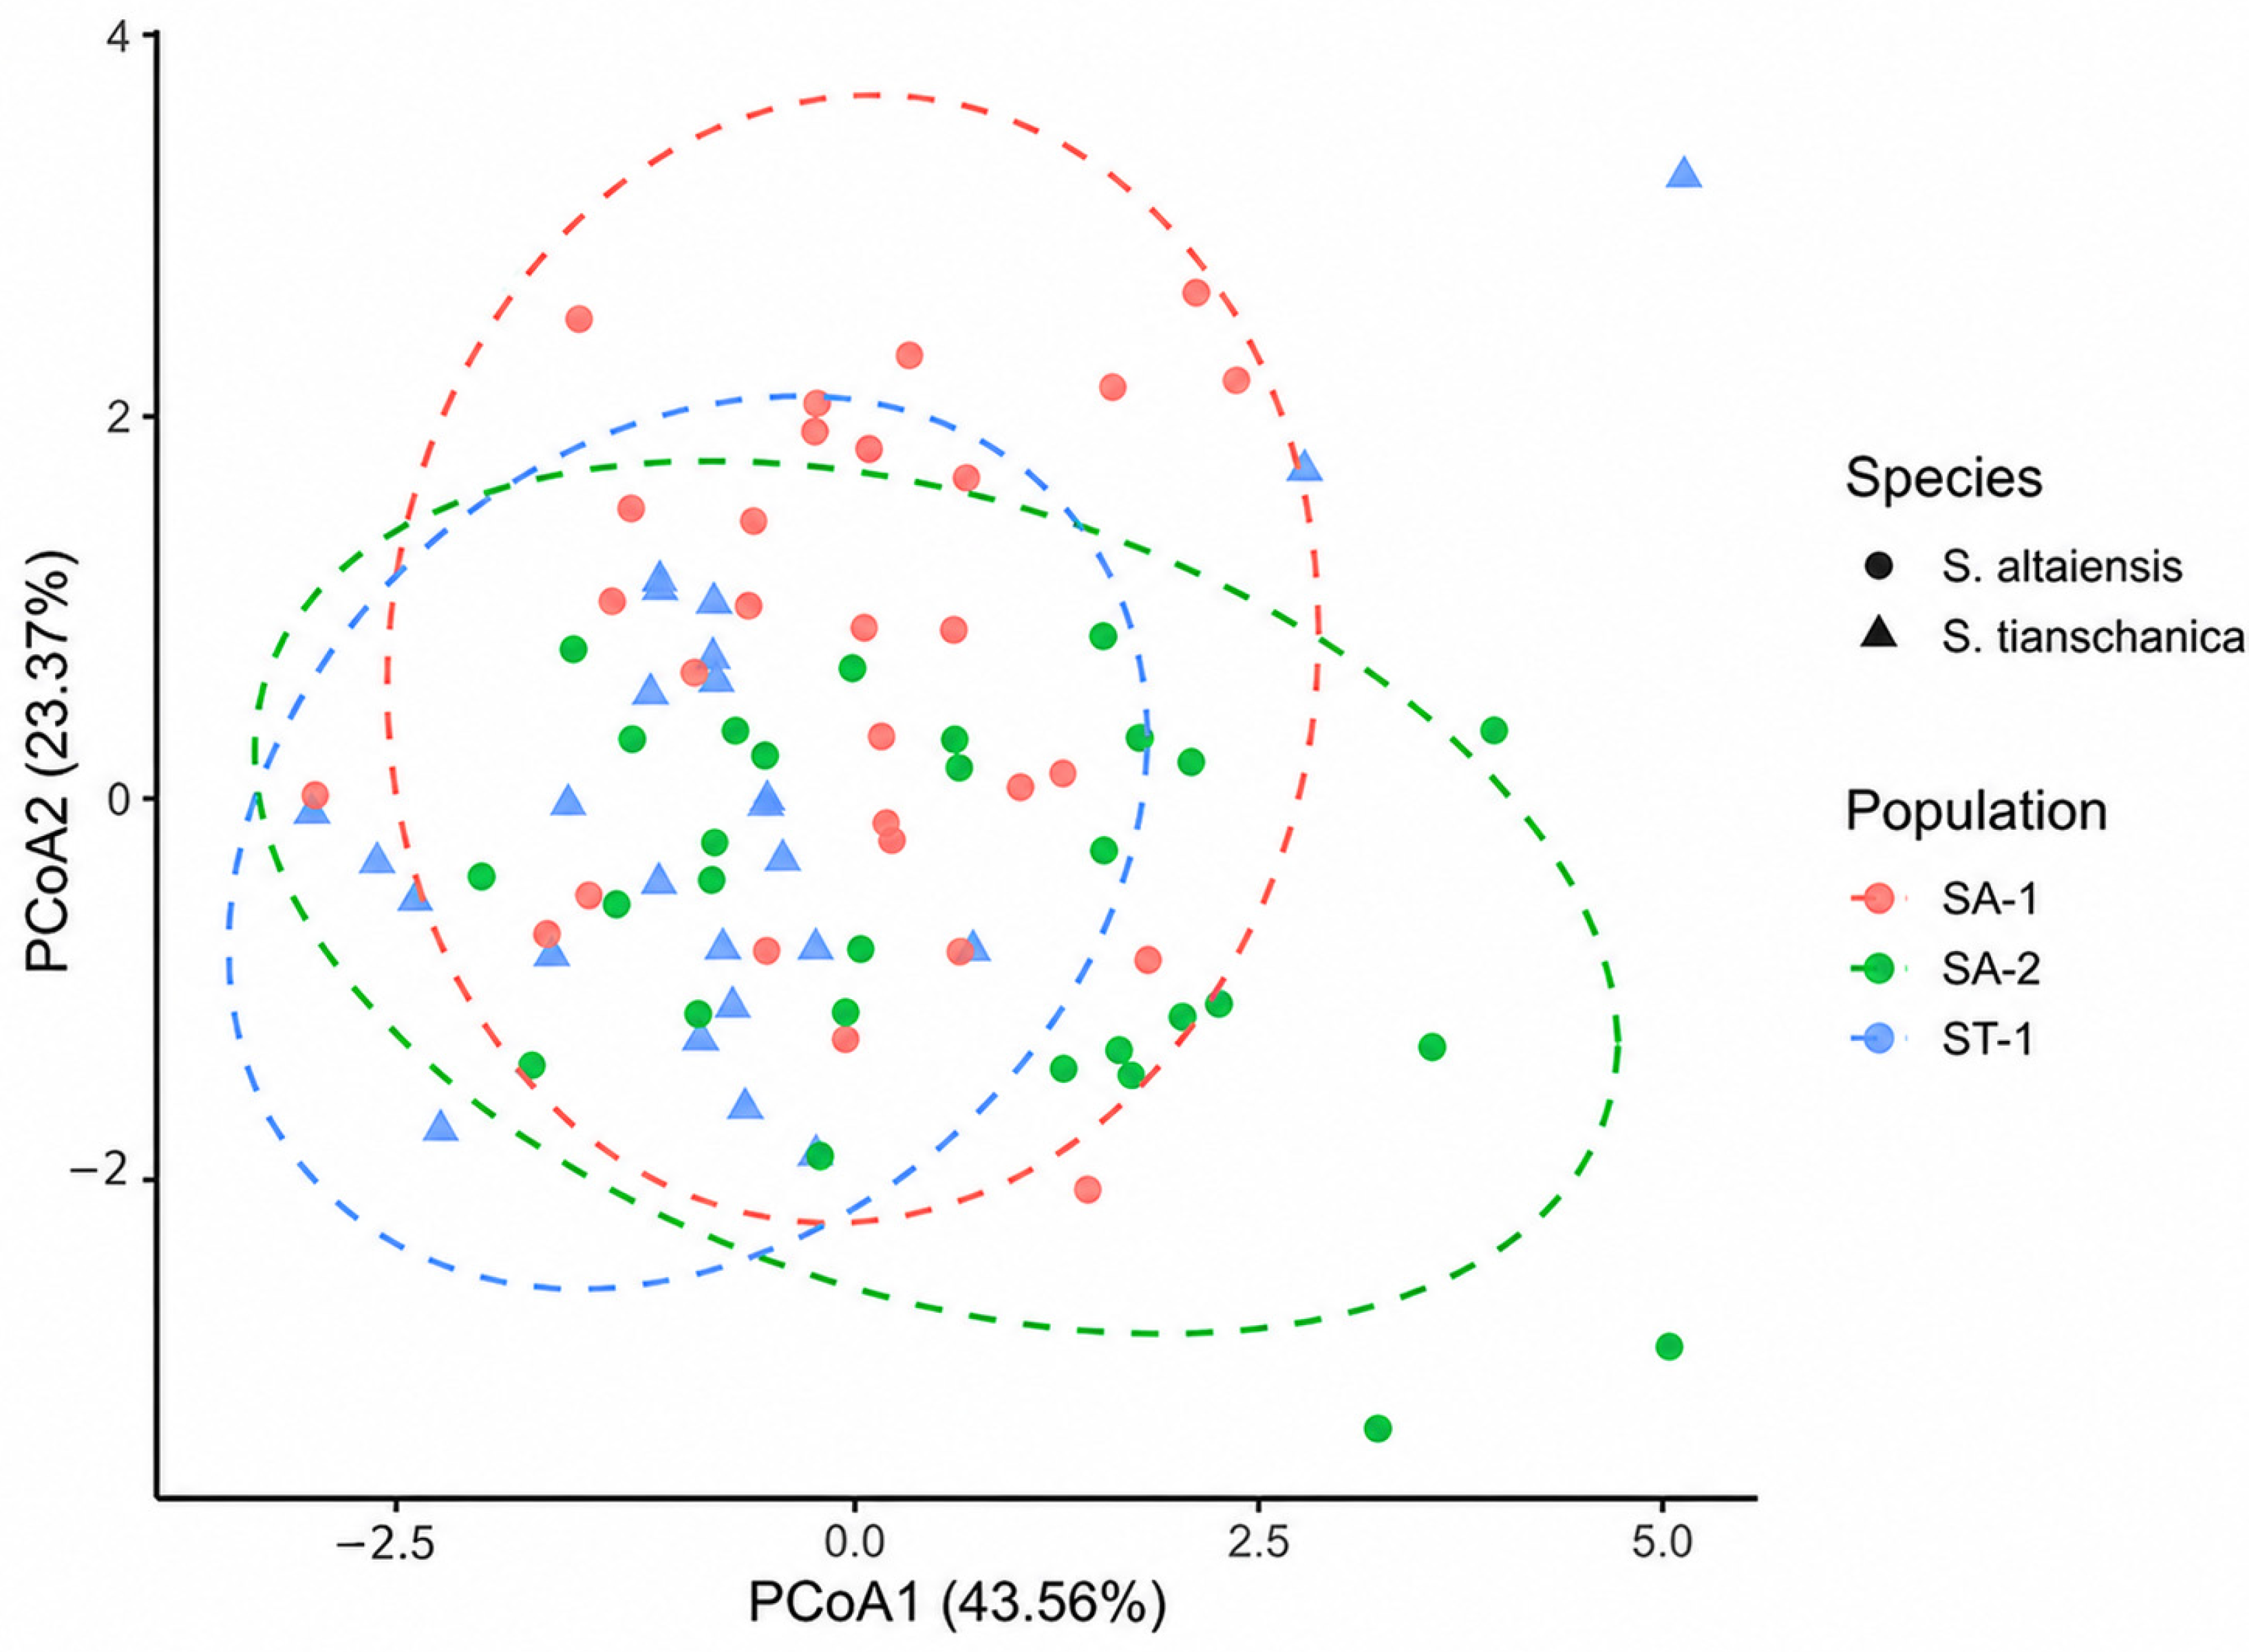
Anatomy-based PCoA used z-standardised traits and Euclidean distances. PCoA1 and PCoA2 explained 43.56% and 23.37% of variation, respectively (66.93% combined; Figure 3).
Figure 3.
Principal coordinate analysis (PCoA) of anatomical and histological parameters of Sibiraea altaiensis and Sibiraea tianschanica leaves. Dashed ellipses show the group-specific ordination envelopes used to visualise within-group dispersion.
All three groups overlapped, with SA-2 more dispersed and ST-1 comparatively compact. Thus, anatomy added discriminatory information but did not provide complete group separation.
These results support regional structural differentiation and demonstrate within-taxon heterogeneity between SA-1 and SA-2. They should not be interpreted as direct evidence of light, drought, or altitude adaptation without common-garden or reciprocal-transplant data.
3.3. Soil-Chemical Characteristics of Habitats
All four measured soil variables differed among regional groups: pH (F(2,174) = 72.61, p < 0.001), EC (F(2,174) = 41.22, p < 0.001), TN (F(2,174) = 40.21, p < 0.001), and TC (F(2,174) = 39.00, p < 0.001; Table 6). Tukey–Kramer tests showed that ST-1 differed from both Altai groups, whereas SA-1 and SA-2 did not differ from each other for any of the four variables.
ST-1 soils were less acidic and had higher EC, TN, and TC than soils associated with SA-1 and SA-2. EC is reported in µS cm−1. These contrasts describe the sampled habitats but cannot be interpreted as species-specific edaphic requirements because only one S. tianschanica region was sampled.
The similar soil conditions of SA-1 and SA-2, despite differences in several plant traits, indicate that pH, EC, TN, and TC alone do not account for all within—S. altaiensis variation.
The results support H2 at the habitat level—regional soils differed strongly—but the trait-level explanatory power of individual soil variables remained limited.
Texture, soil moisture, available nutrients, carbonates, topography, vegetation structure, shrub age, and disturbance were not measured and remain plausible covariates.
3.4. The Relationship of Soil-Chemical Parameters with Morphological and Anatomical-Histological Features
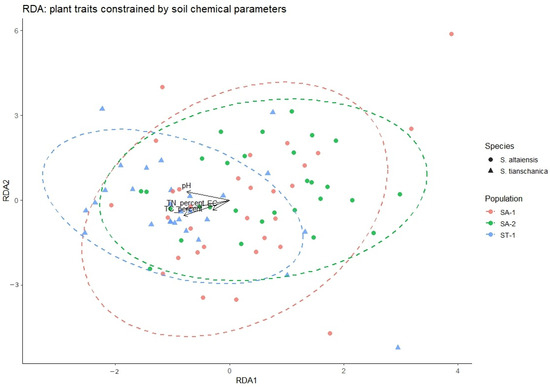
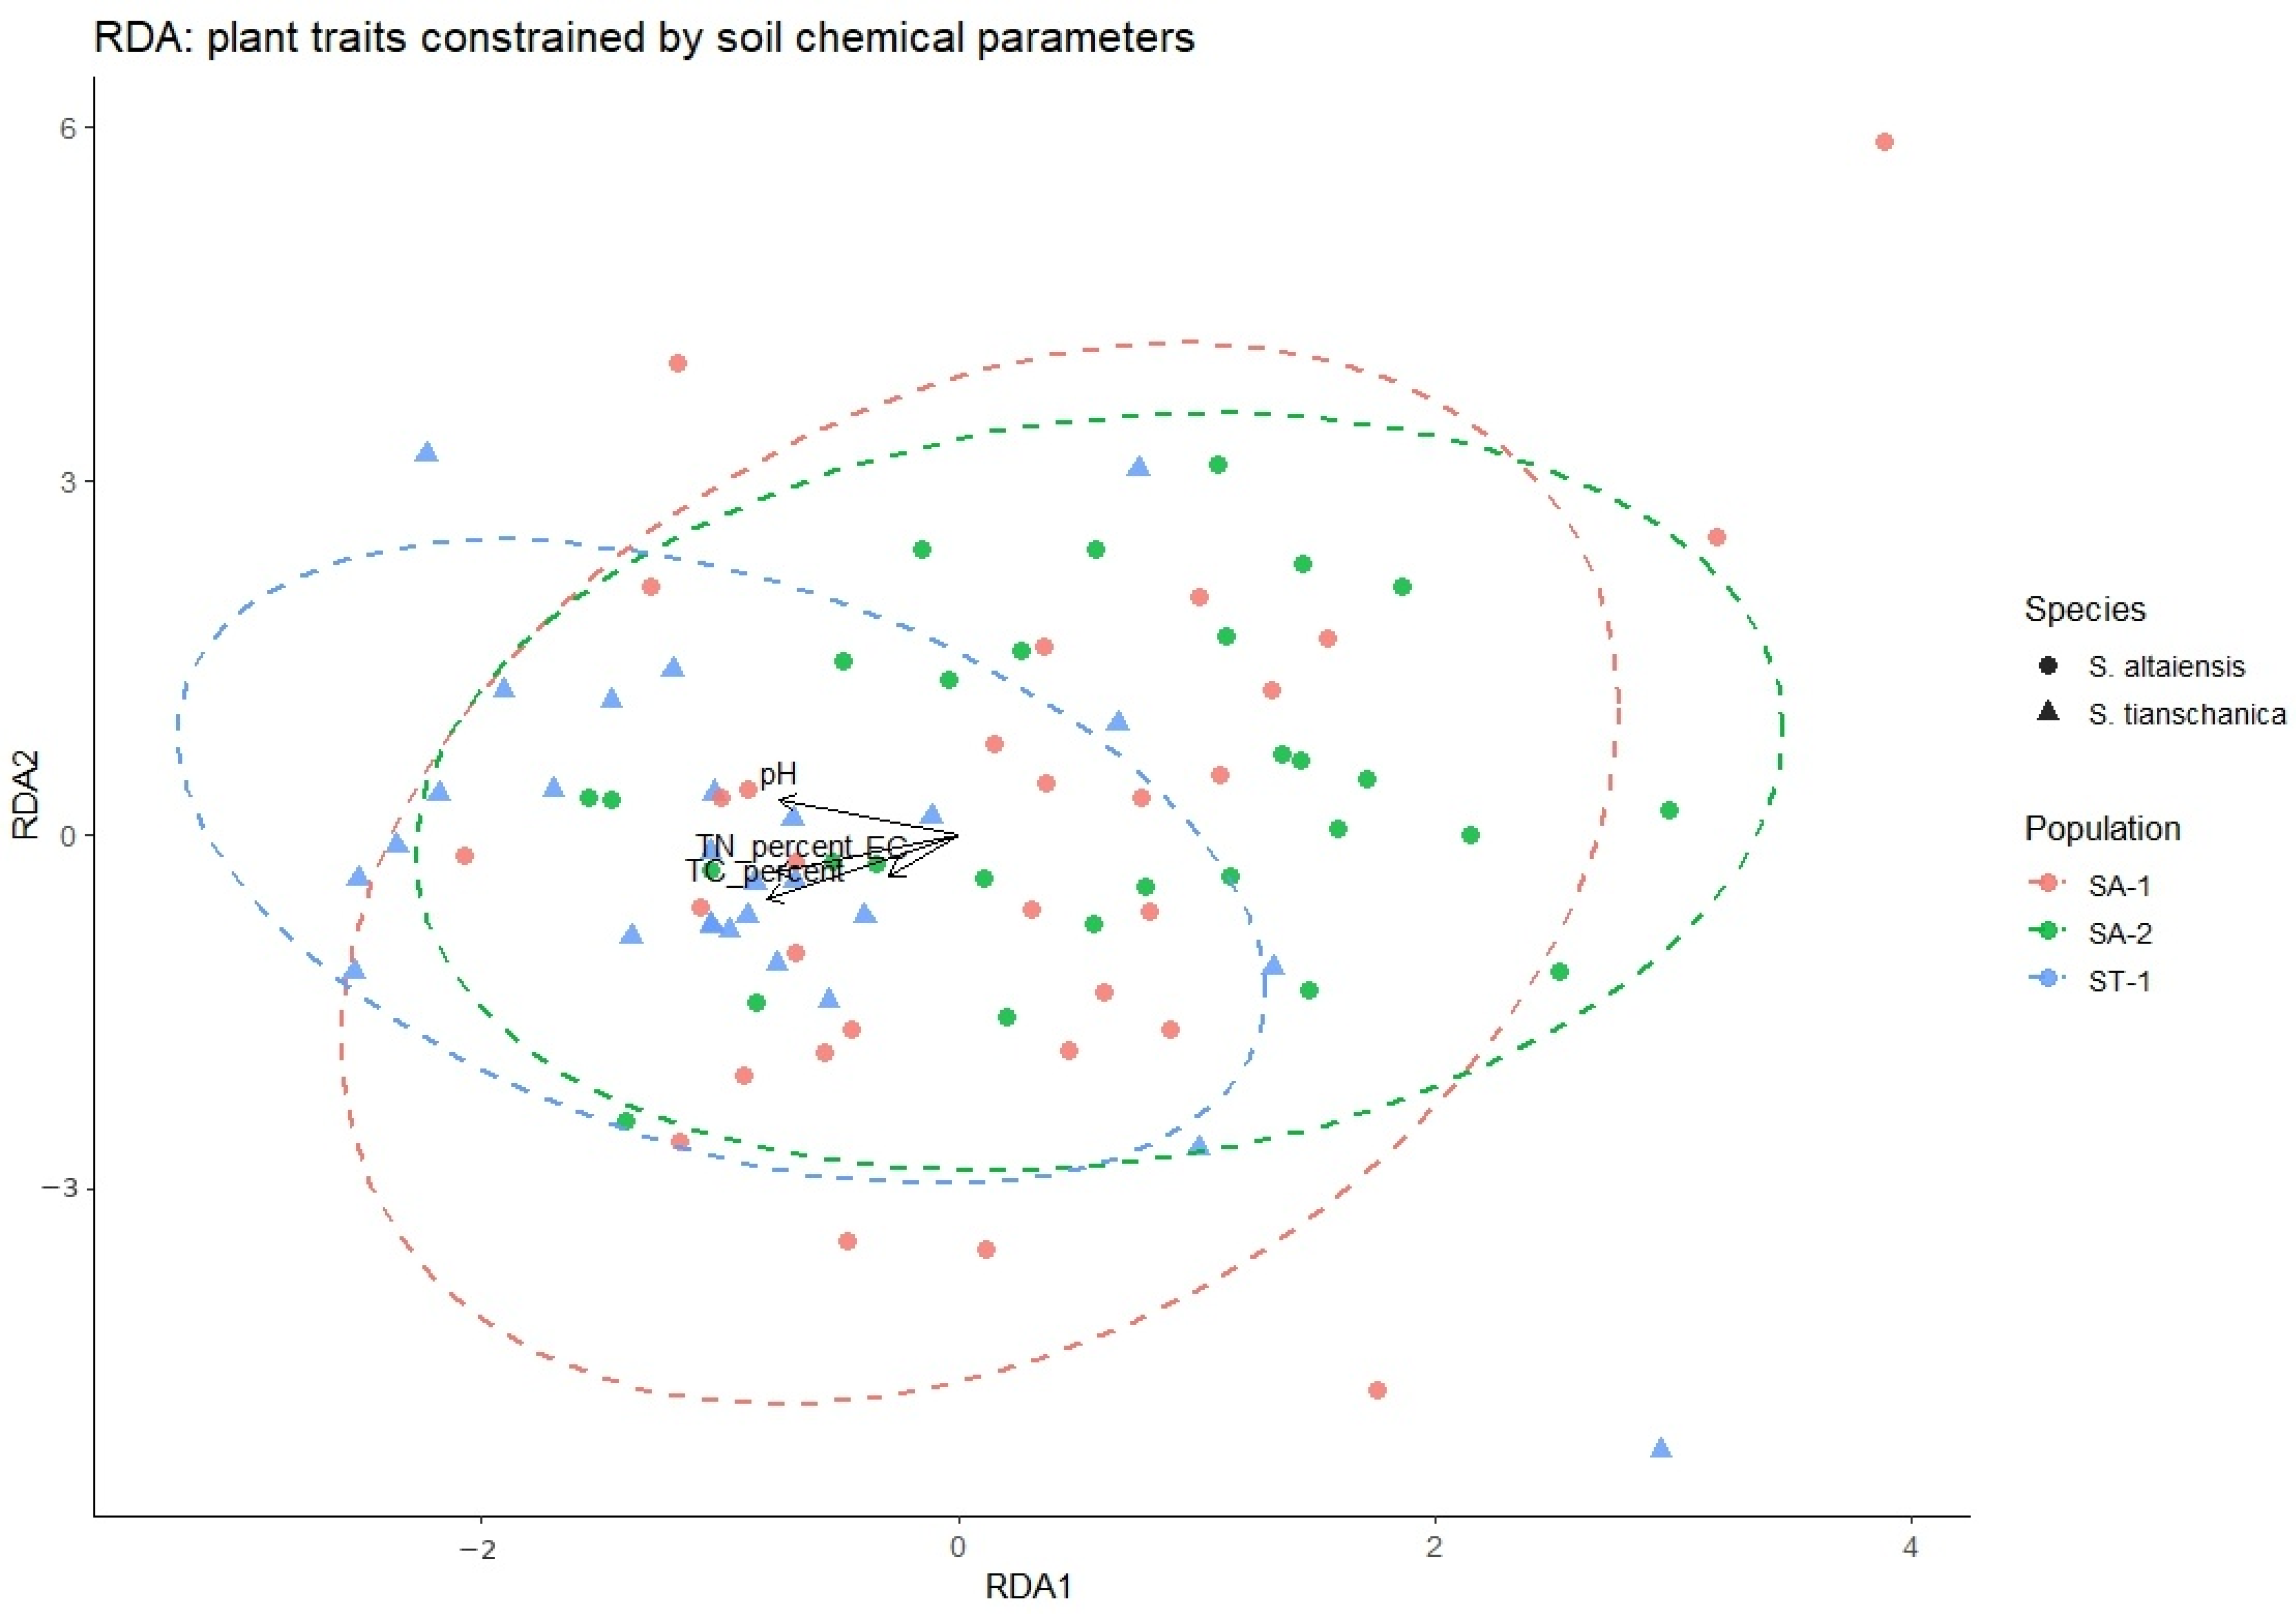
Exploratory RDA and Spearman correlations were used to evaluate associations among pH, EC, TN, TC, five morphology variables, and seven anatomy variables. Response traits were standardised before RDA. The constrained vectors were short, and the groups overlapped (Figure 4), indicating that the four measured soil variables did not provide strong multivariate separation.
Figure 4.
Redundancy analysis (RDA) of the relationship between morphological and anatomical-histological plant traits and soil-chemical parameters. Dashed ellipses show the group-specific ordination envelopes used to visualise within-group dispersion.
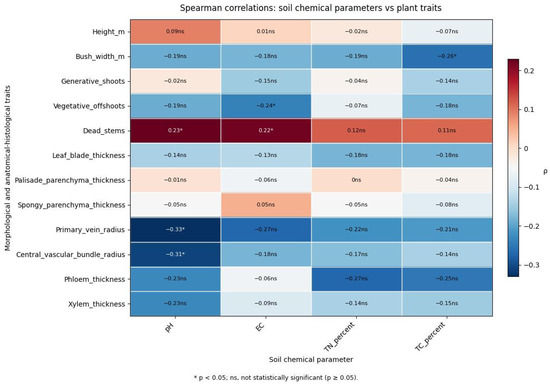
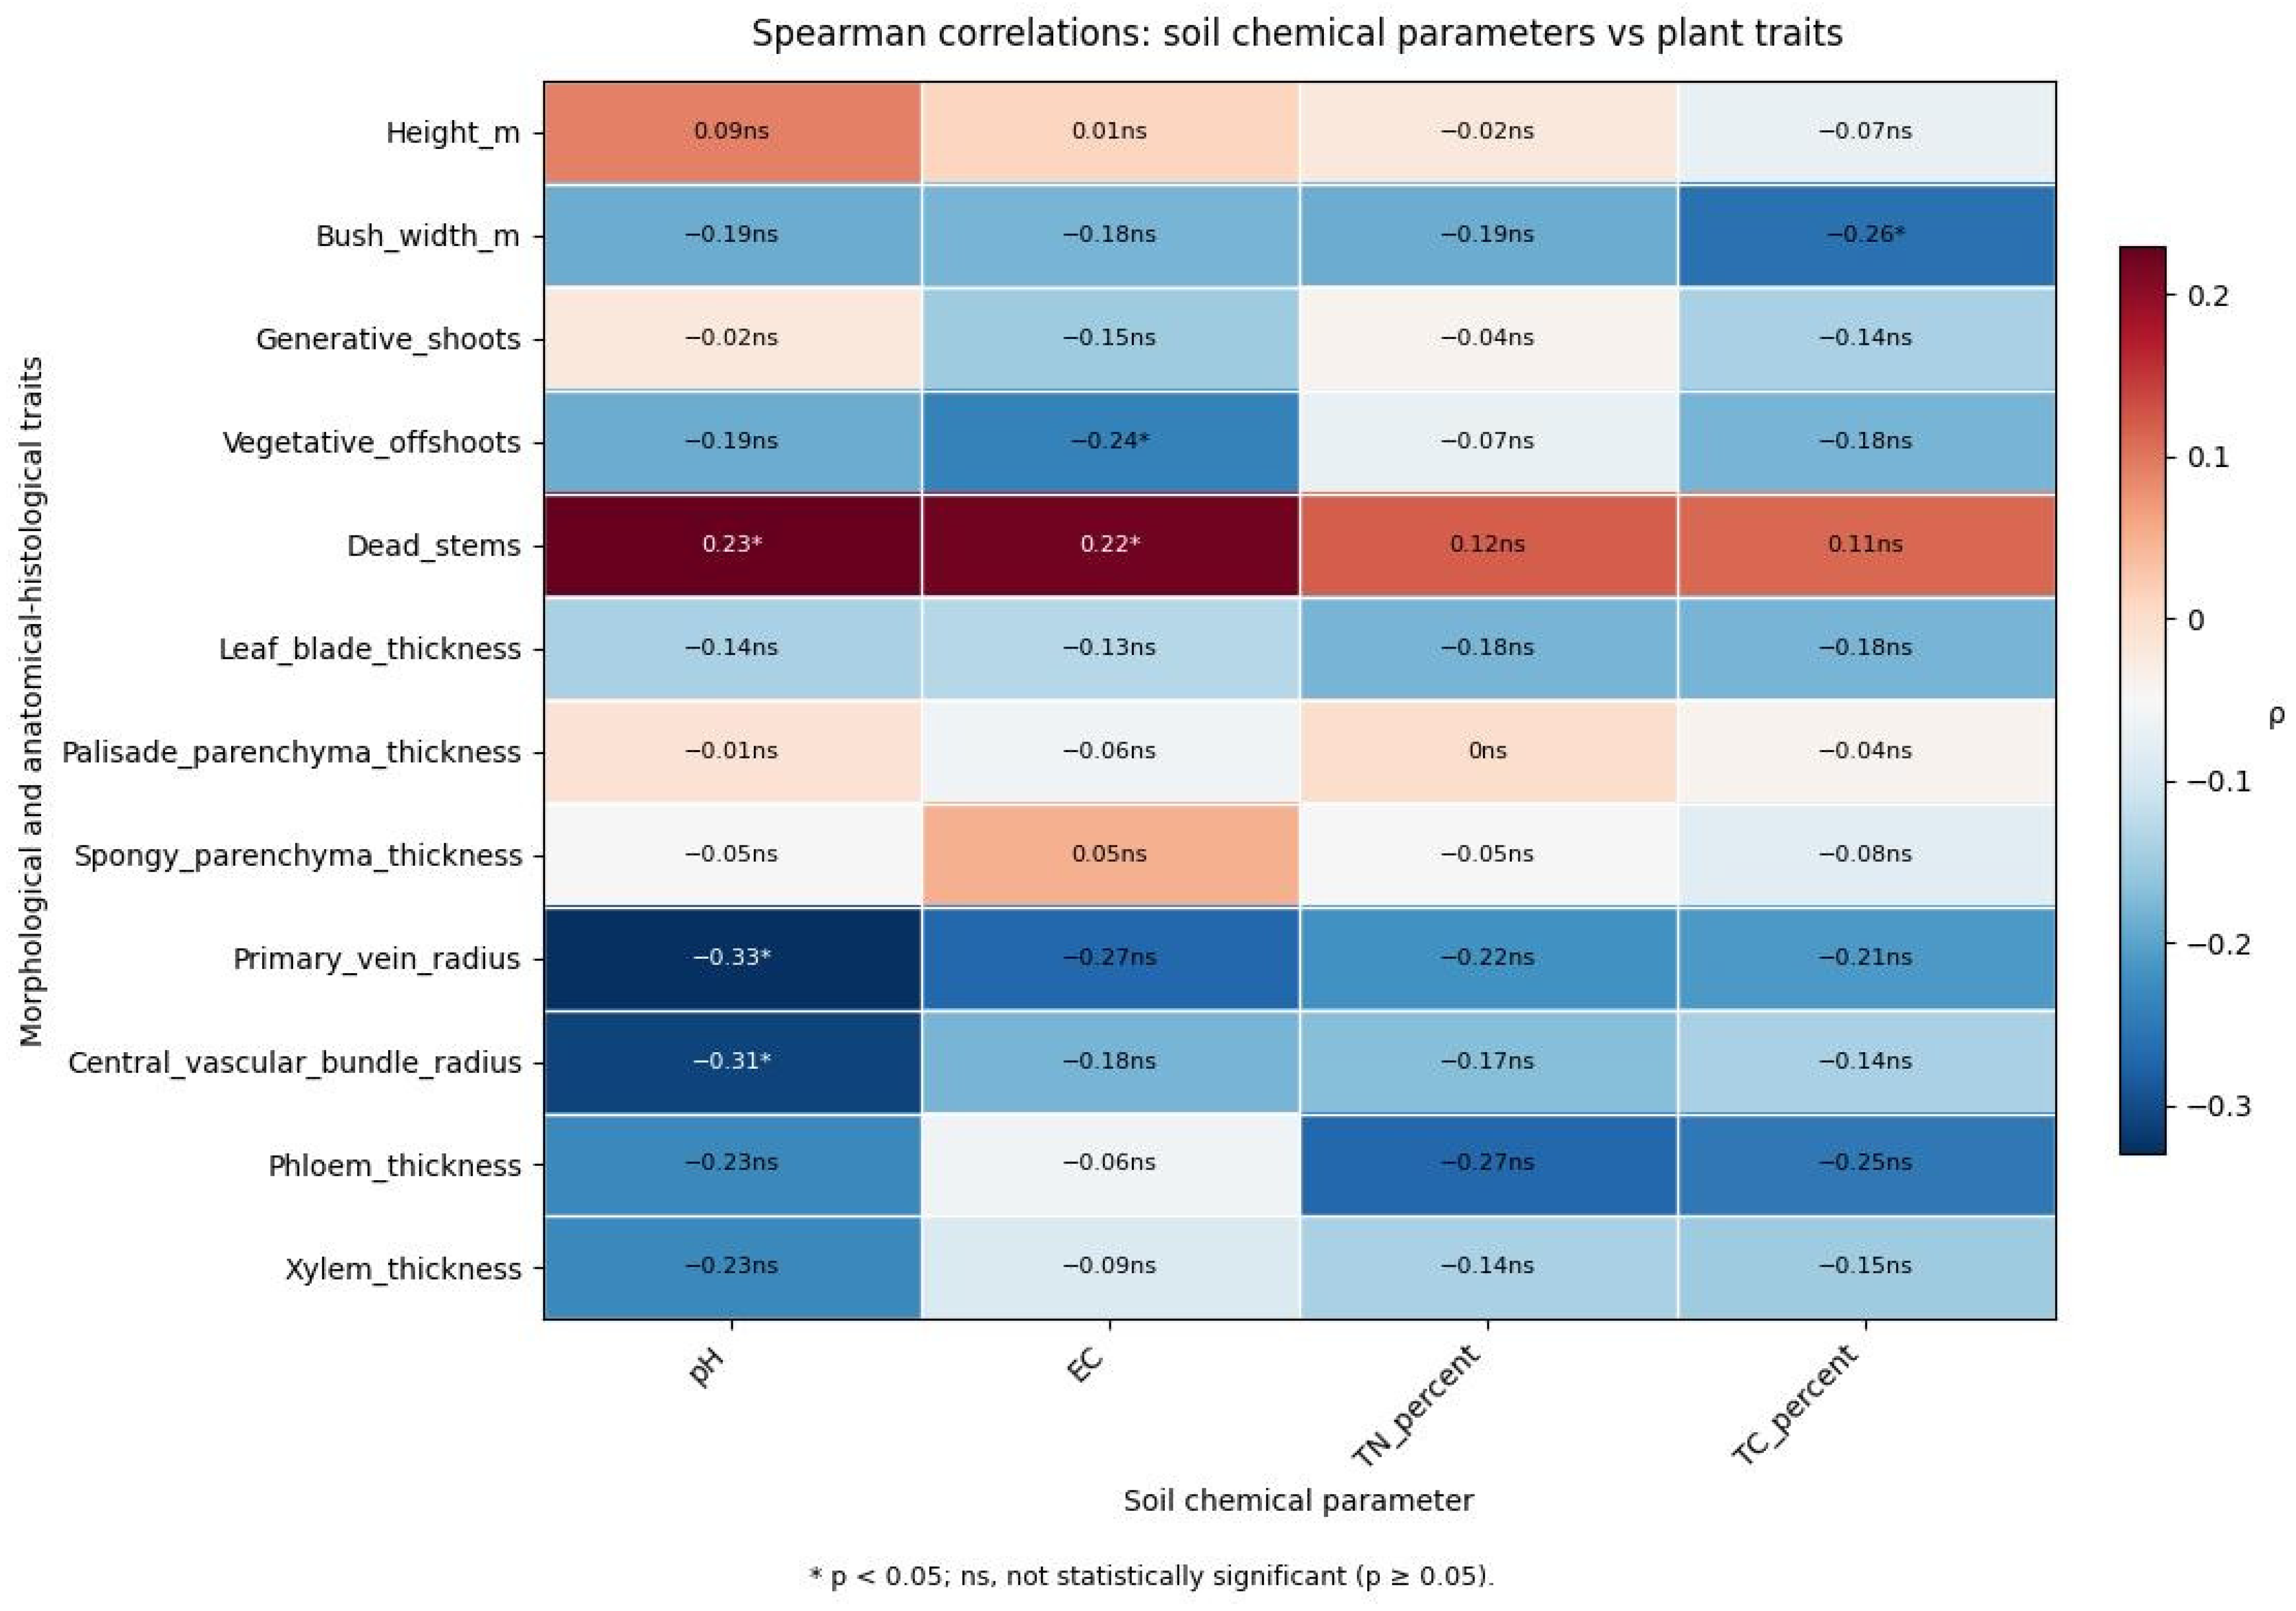
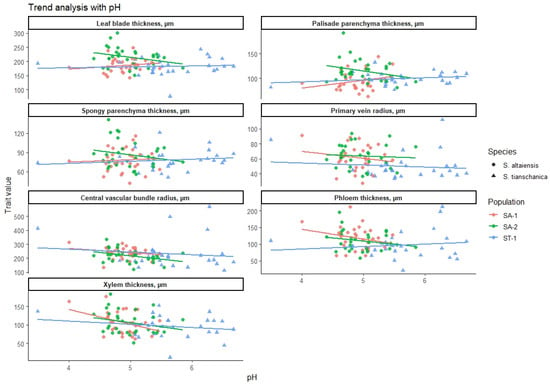
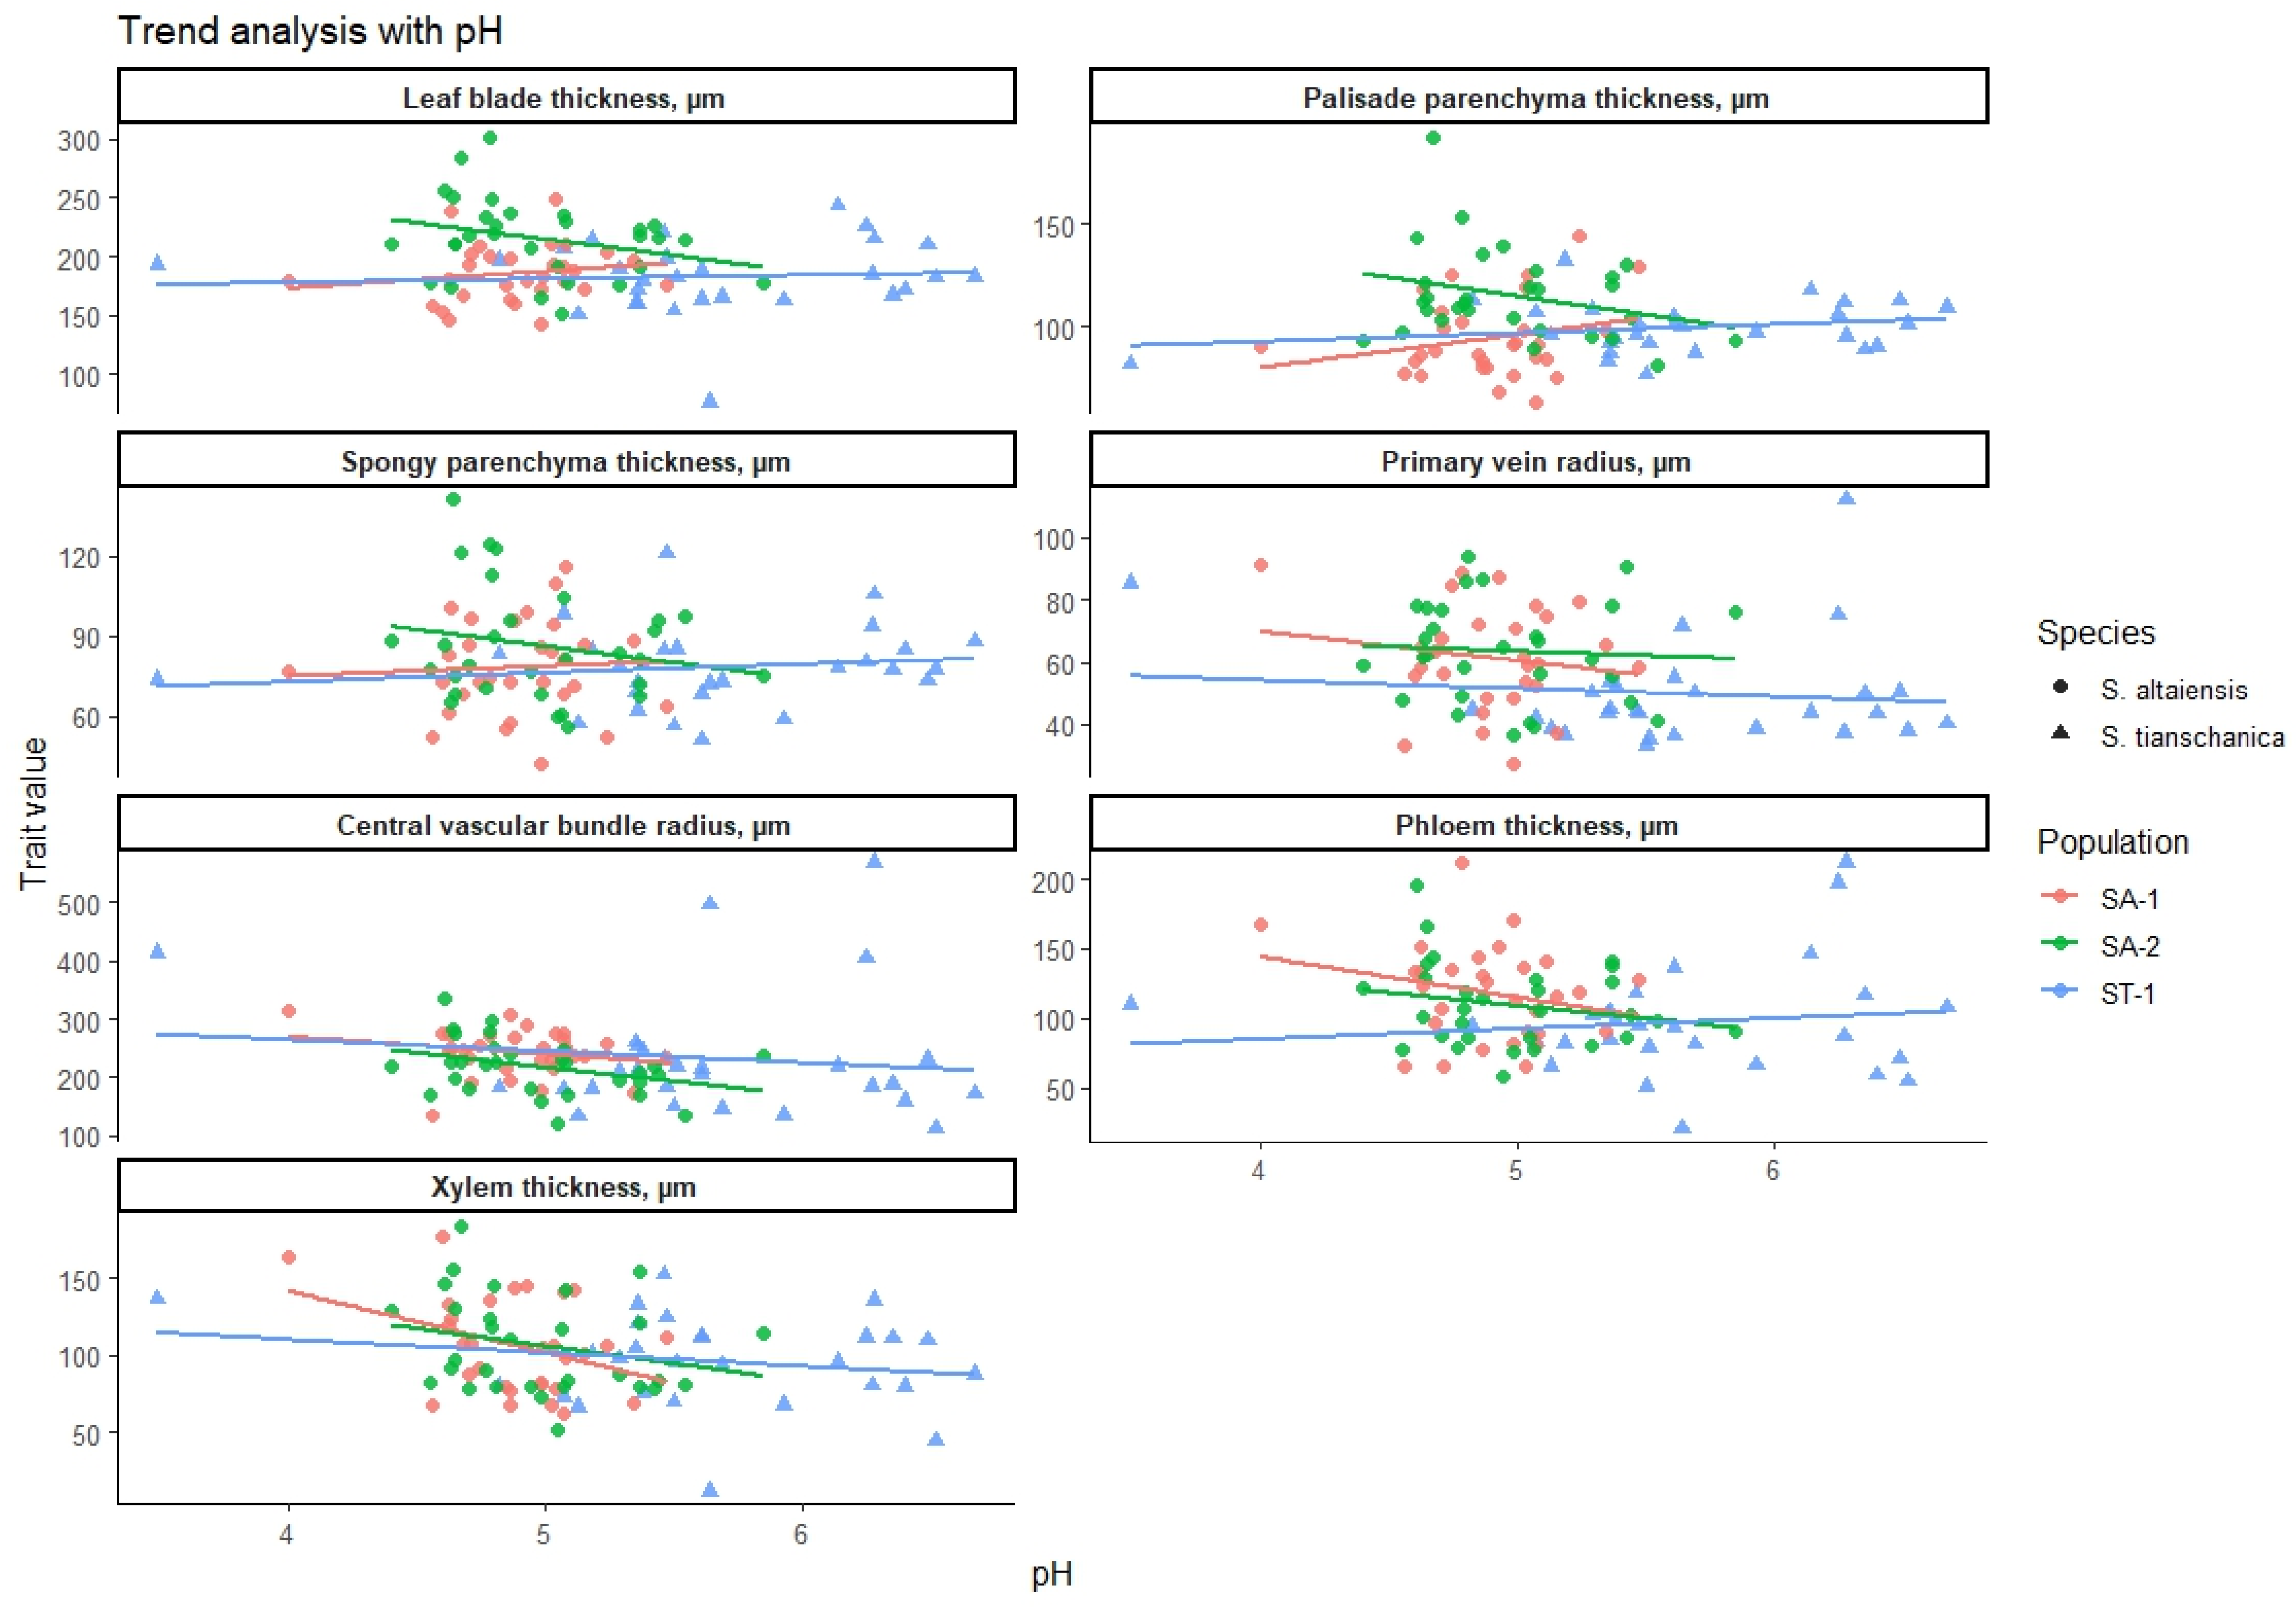
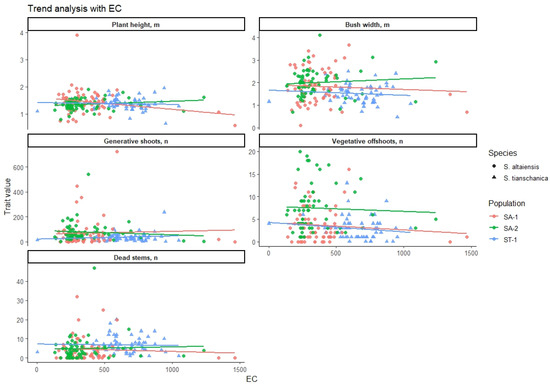
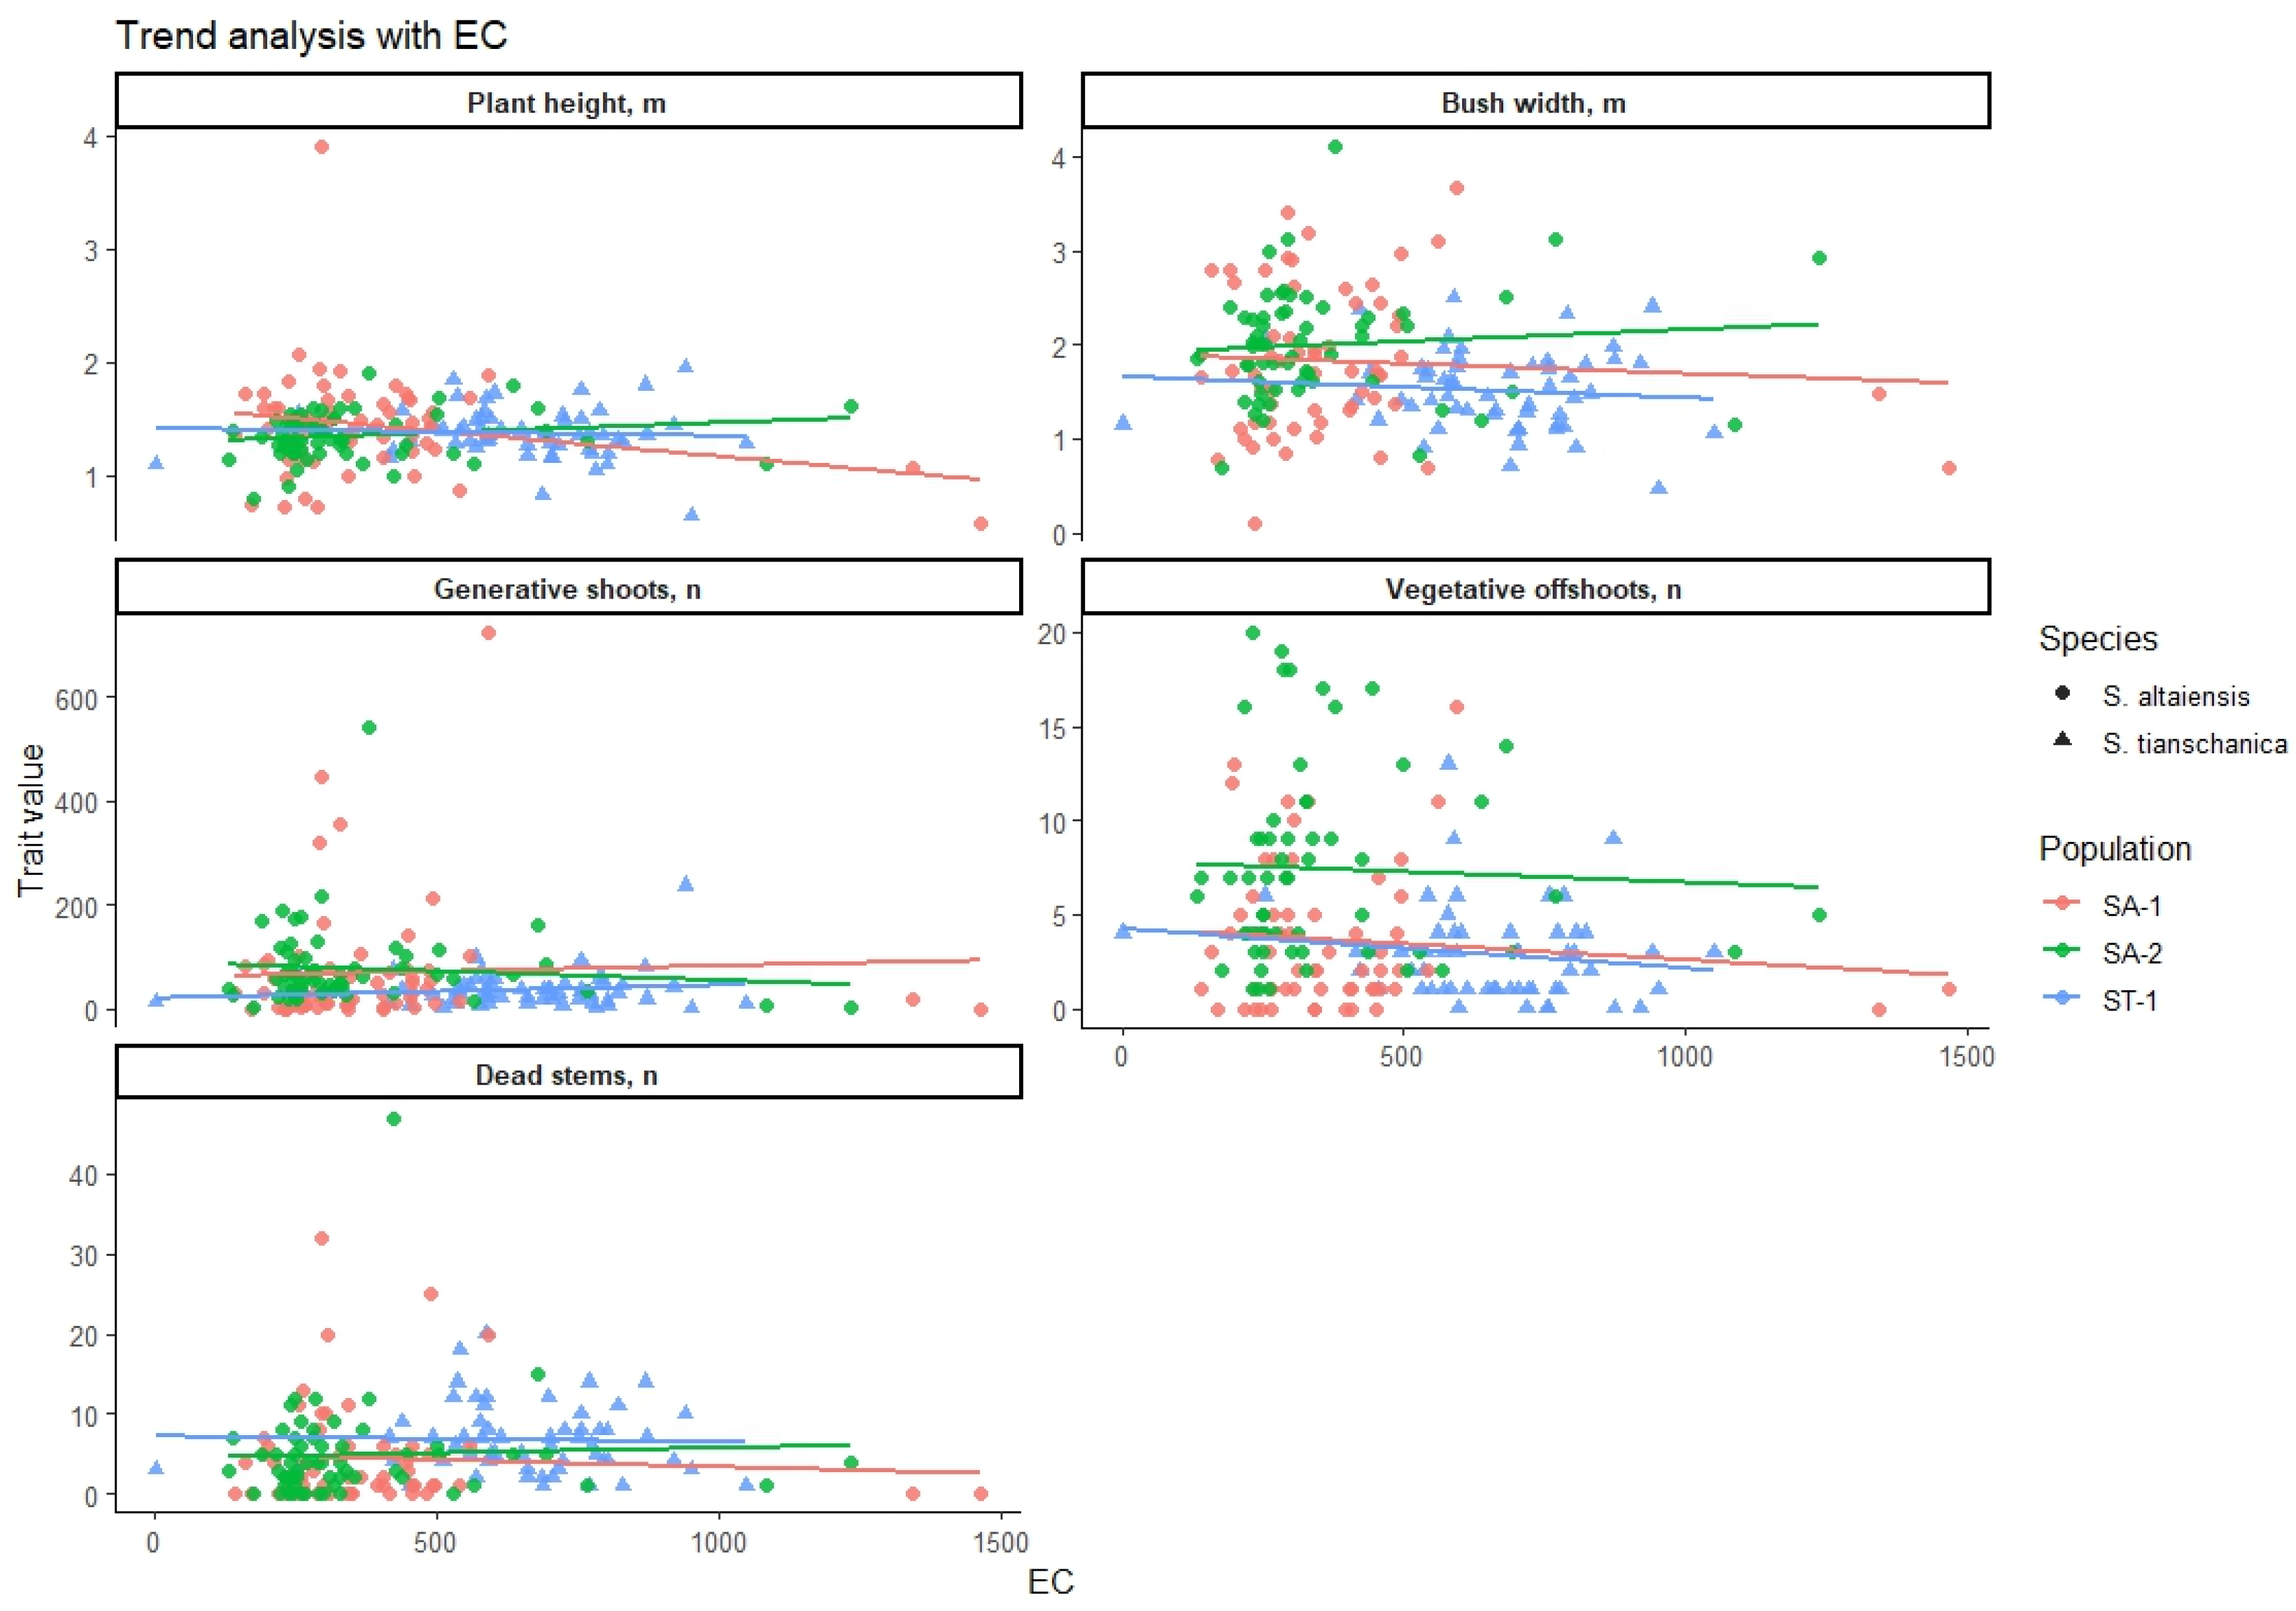
Spearman coefficients were predominantly small (Figure 5). Significant unadjusted associations (p < 0.05) were bush width with TC (rho = −0.26), vegetative offshoots with EC (rho = −0.24), dying trunks with pH (rho = 0.23) and EC (rho = 0.22), primary-vein radius with pH (rho = −0.33), and central vascular-bundle radius with pH (rho = −0.31). No absolute coefficient exceeded 0.33.
Figure 5.
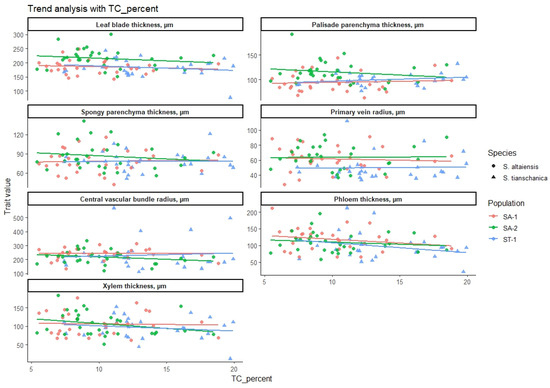
Spearman’s correlation heat map of soil chemical parameters and morphological–anatomical traits in Sibiraea populations. Values in the cells are Spearman’s correlation coefficients (ρ). * p < 0.05; ns, not statistically significant (p ≥ 0.05).
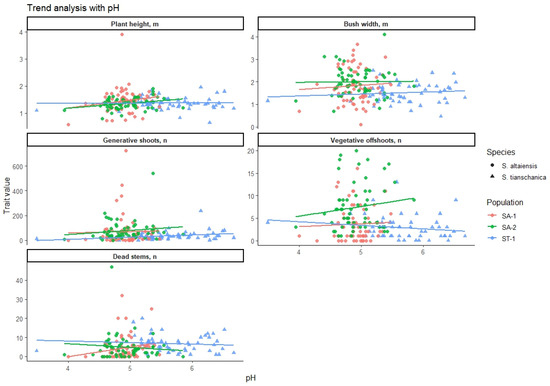
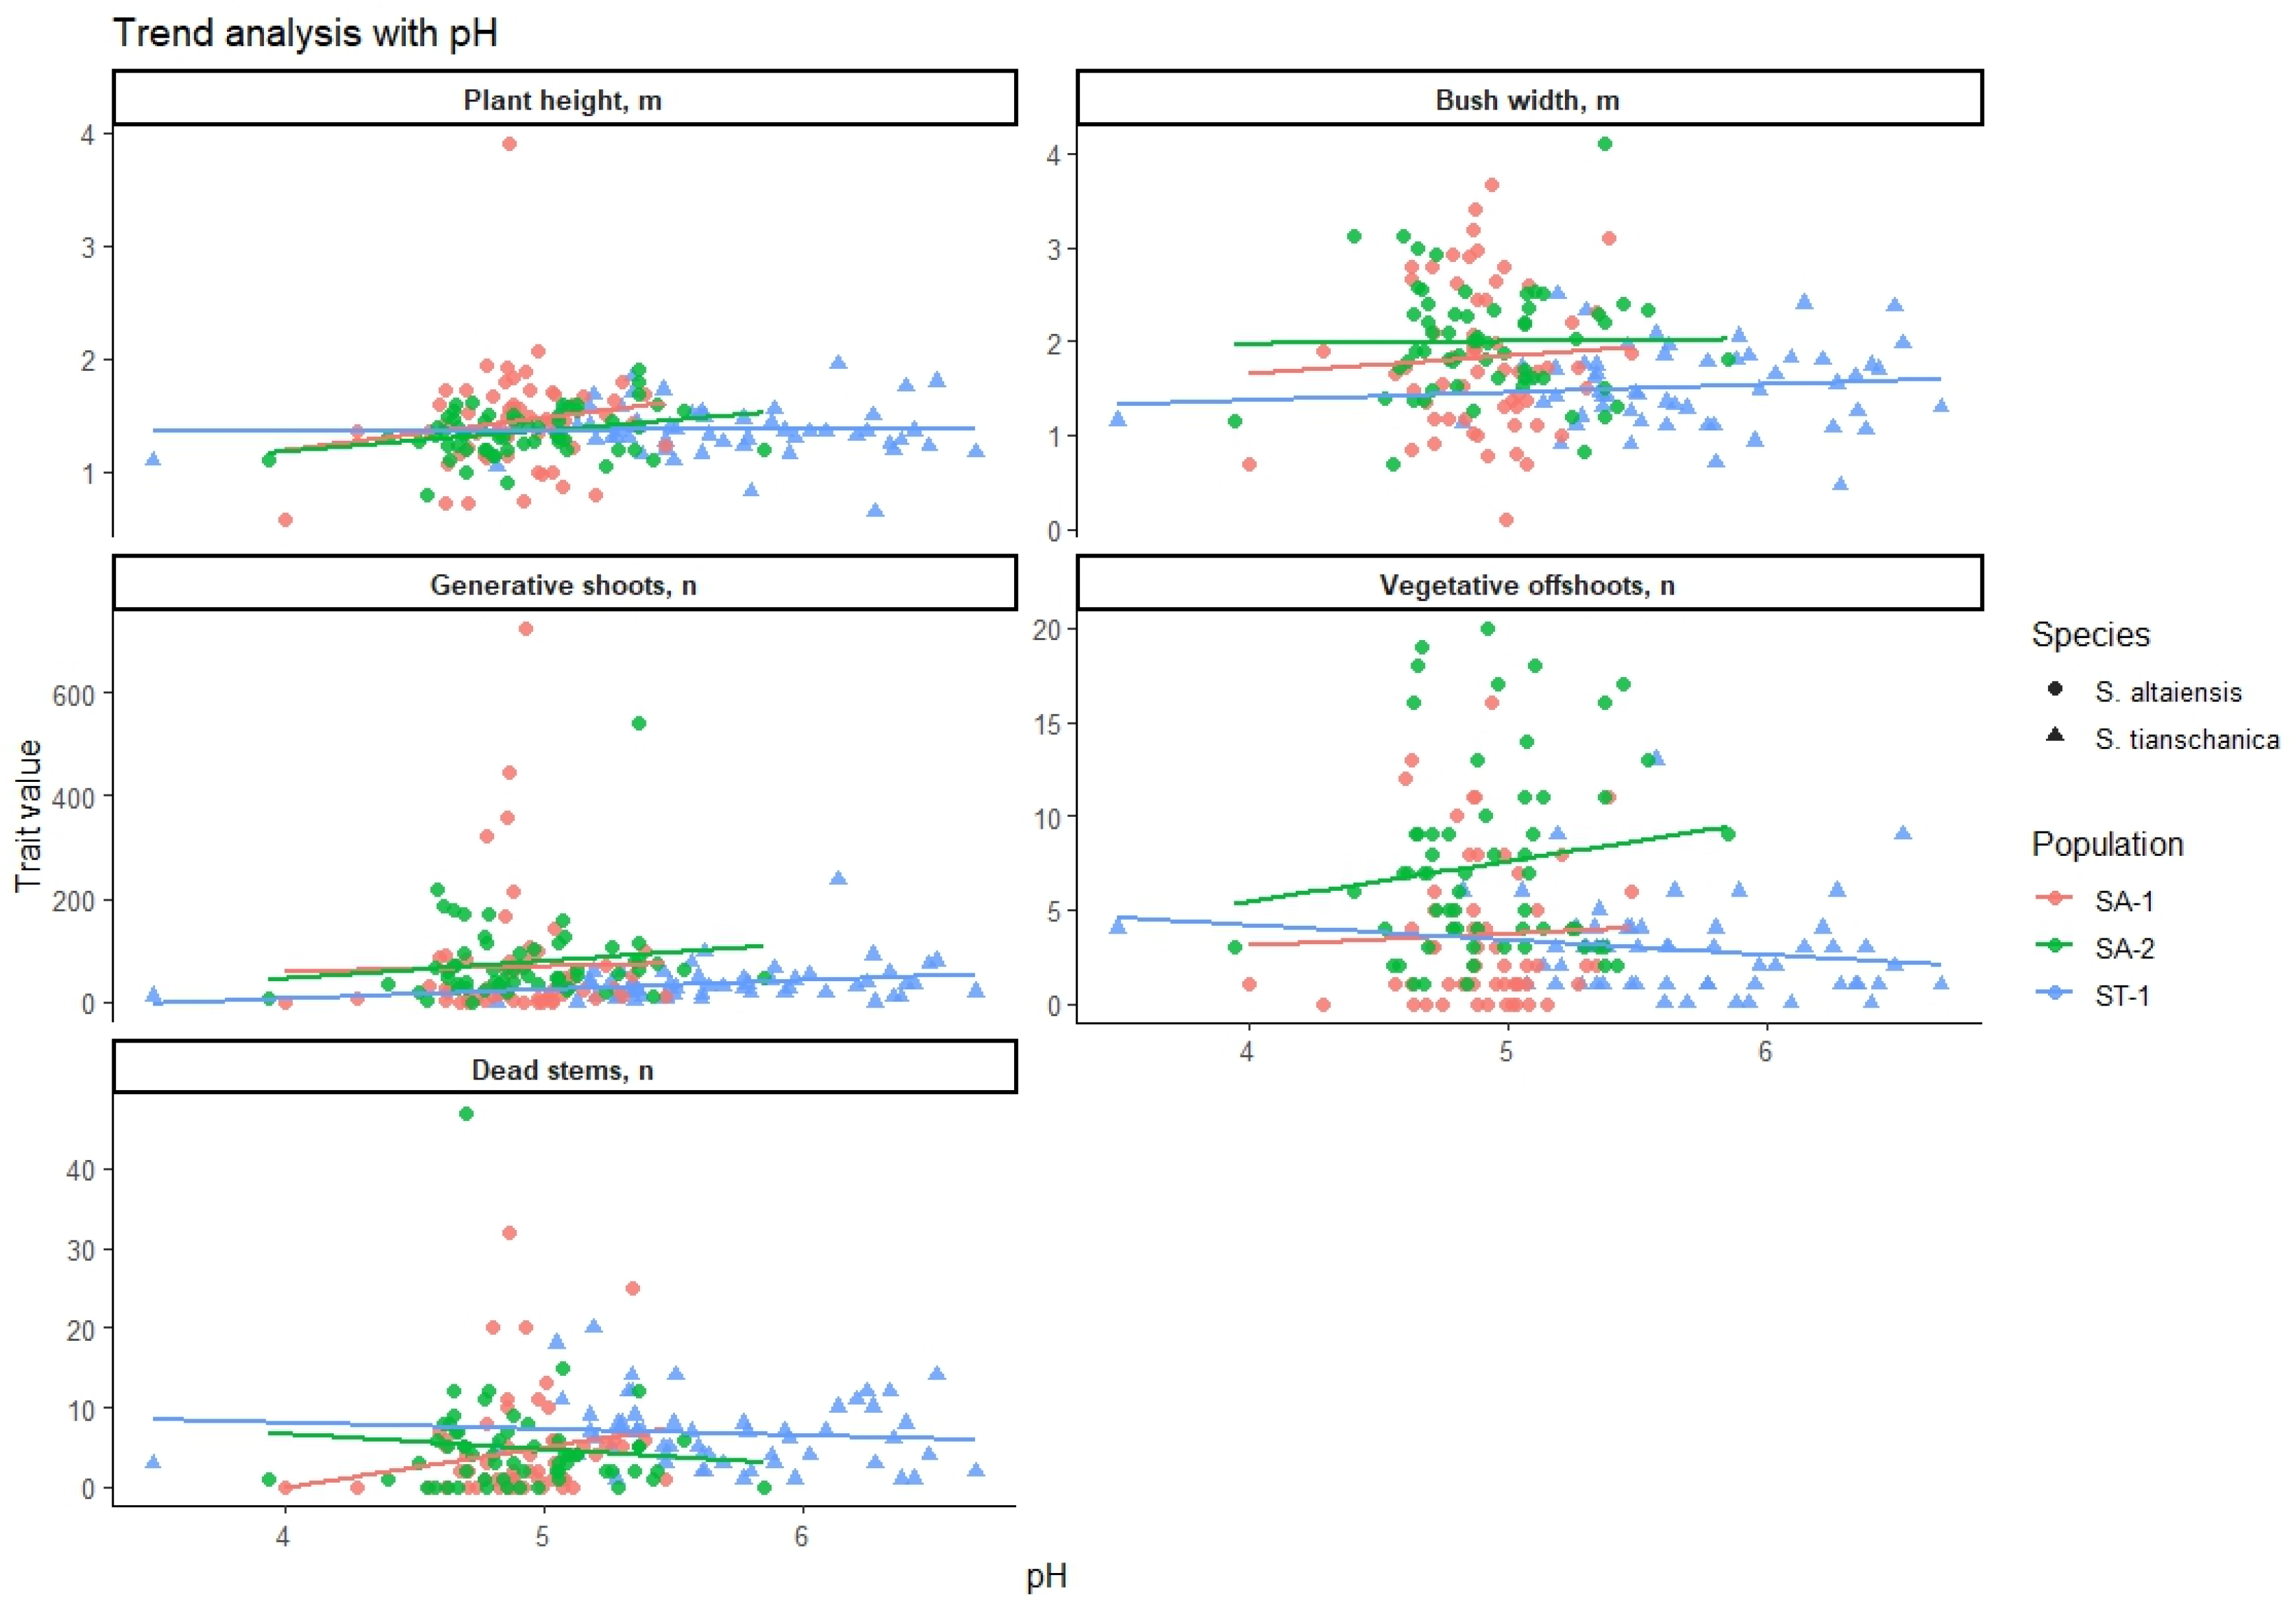
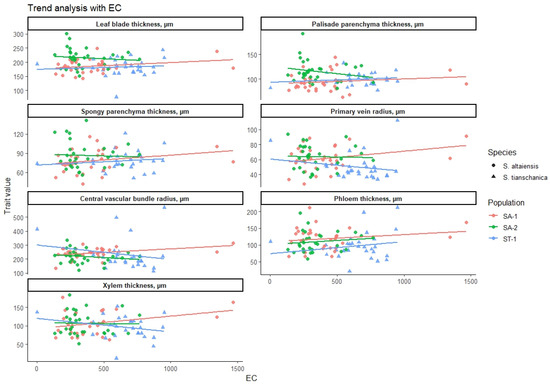
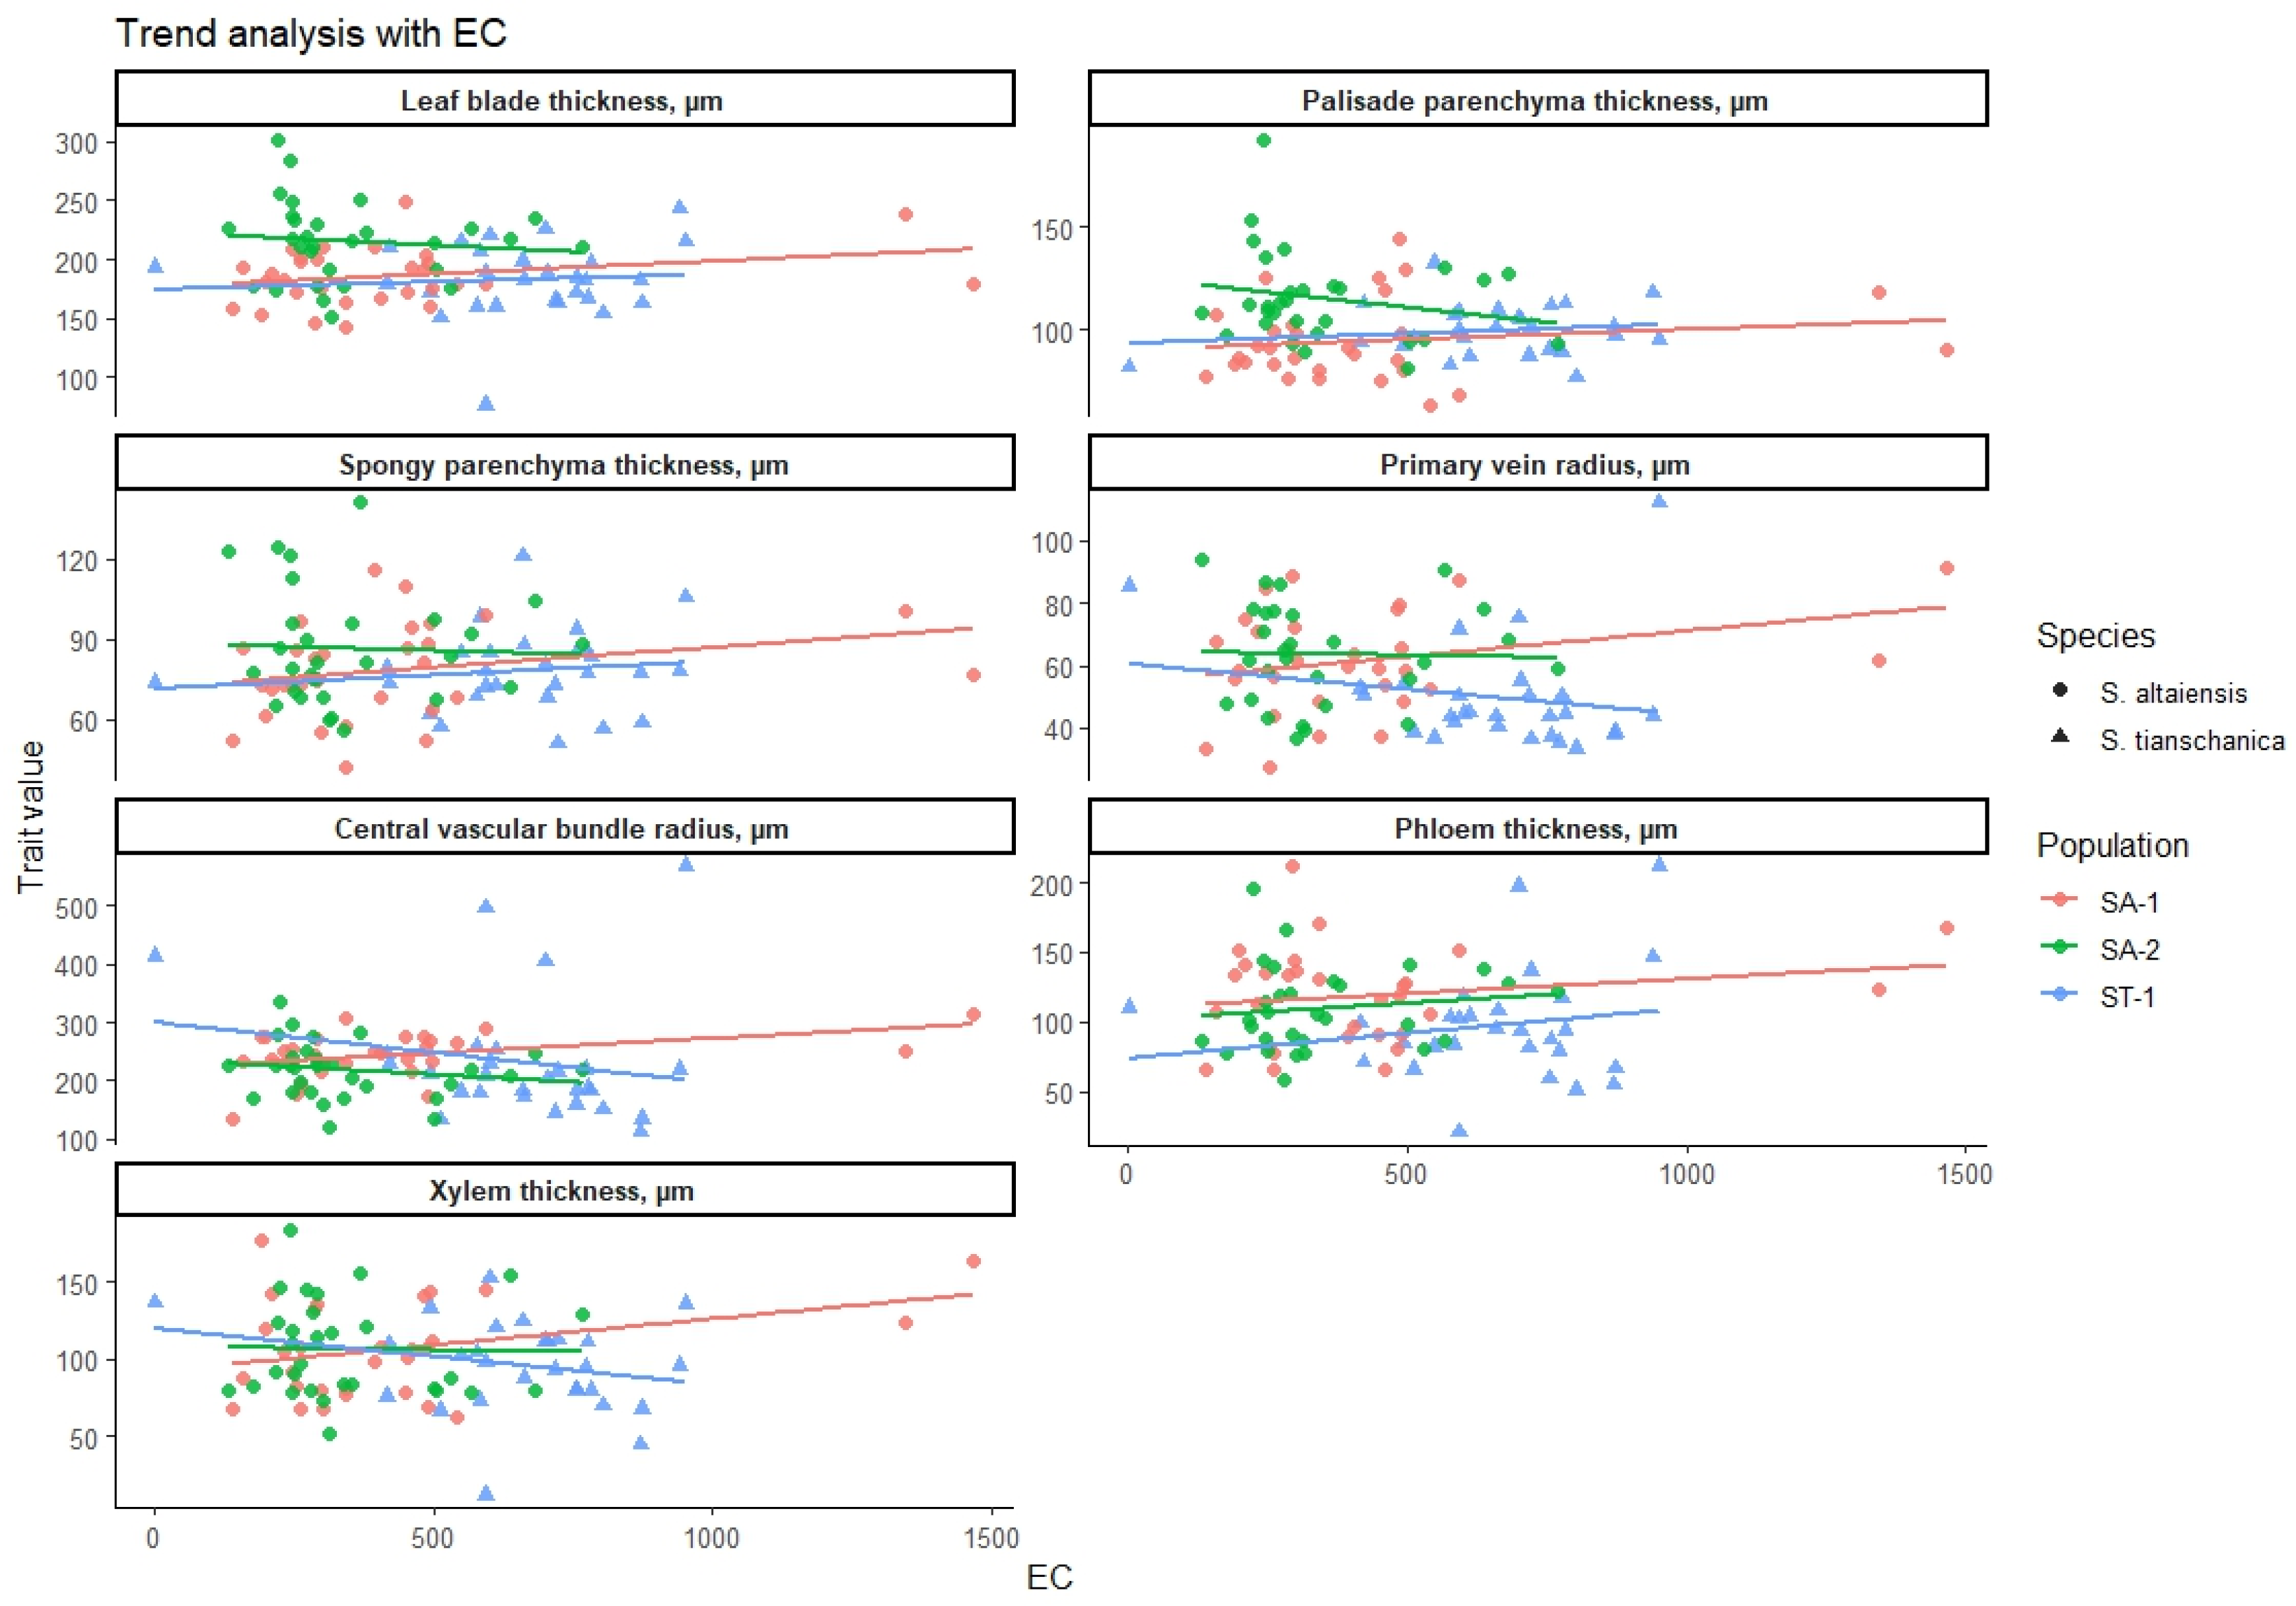
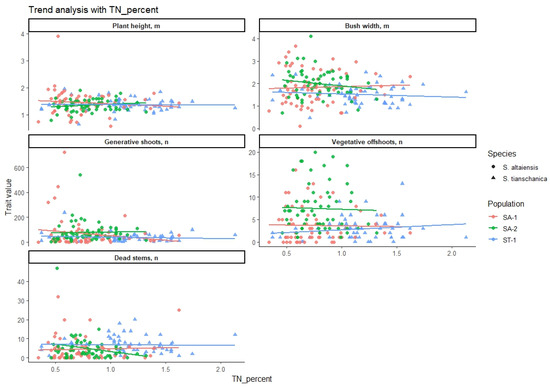
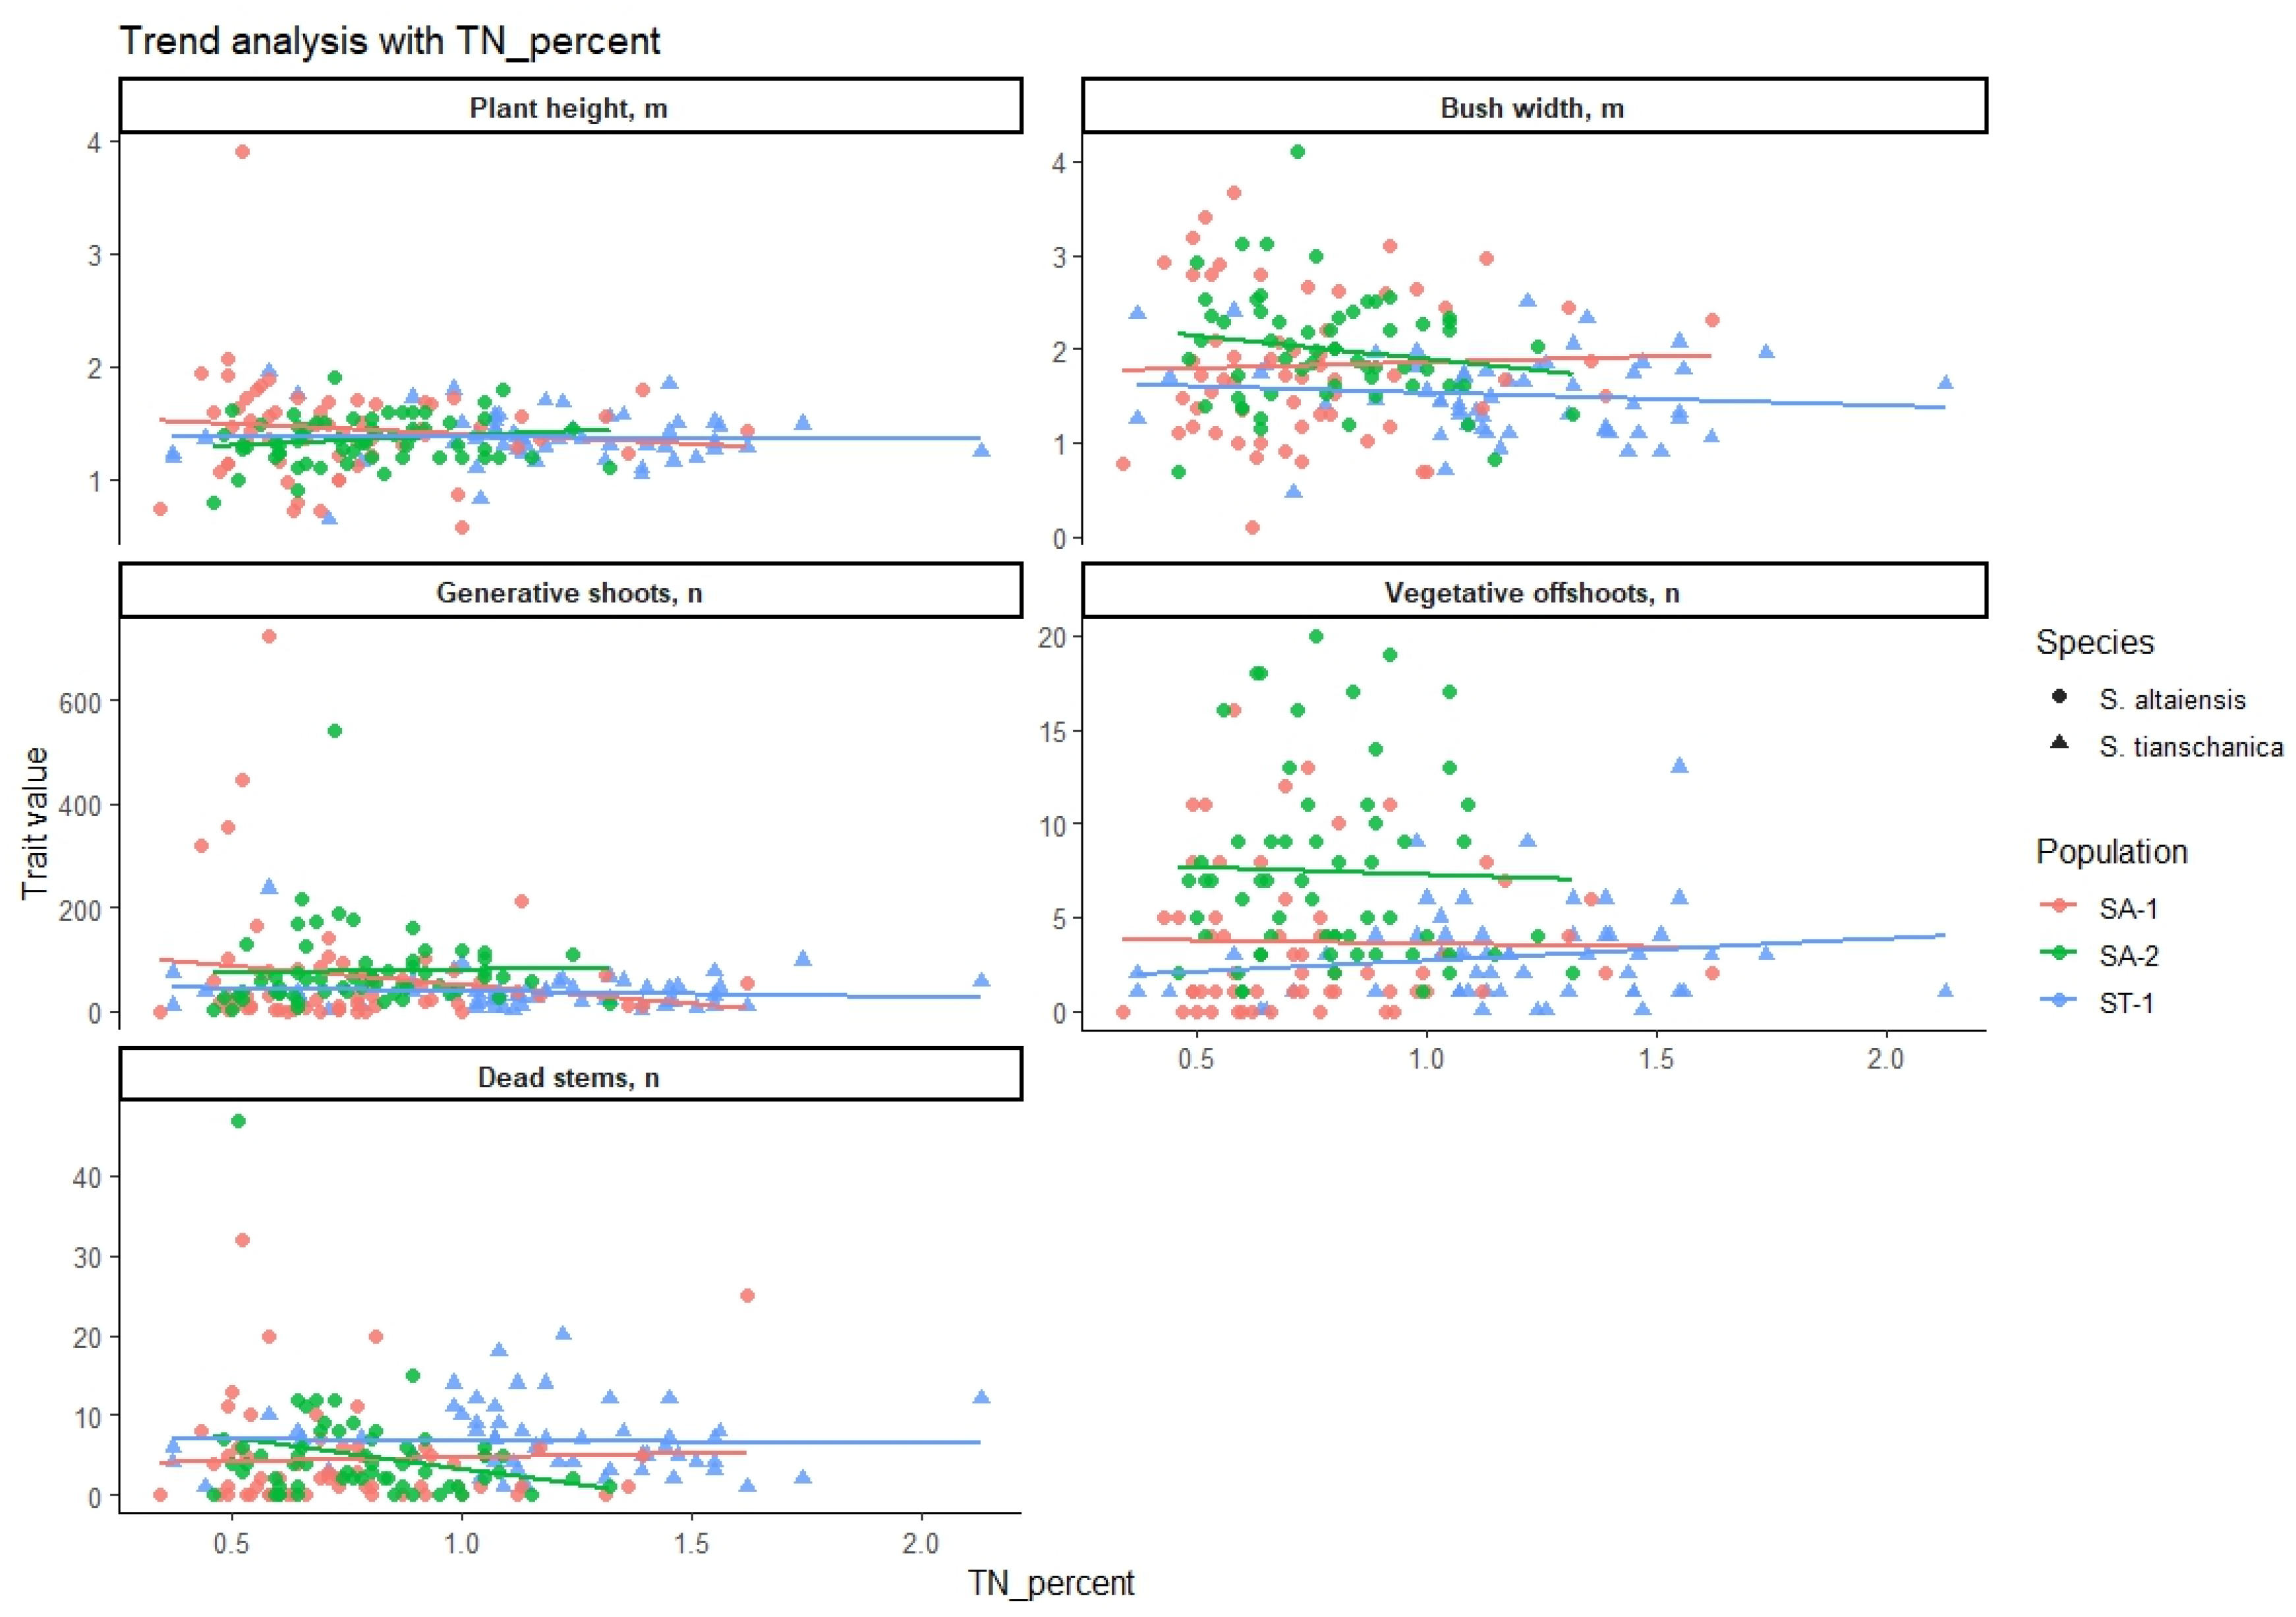
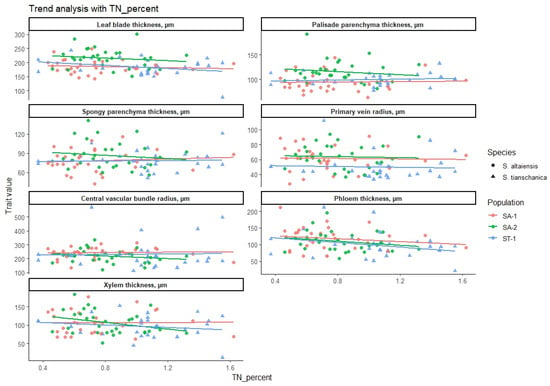
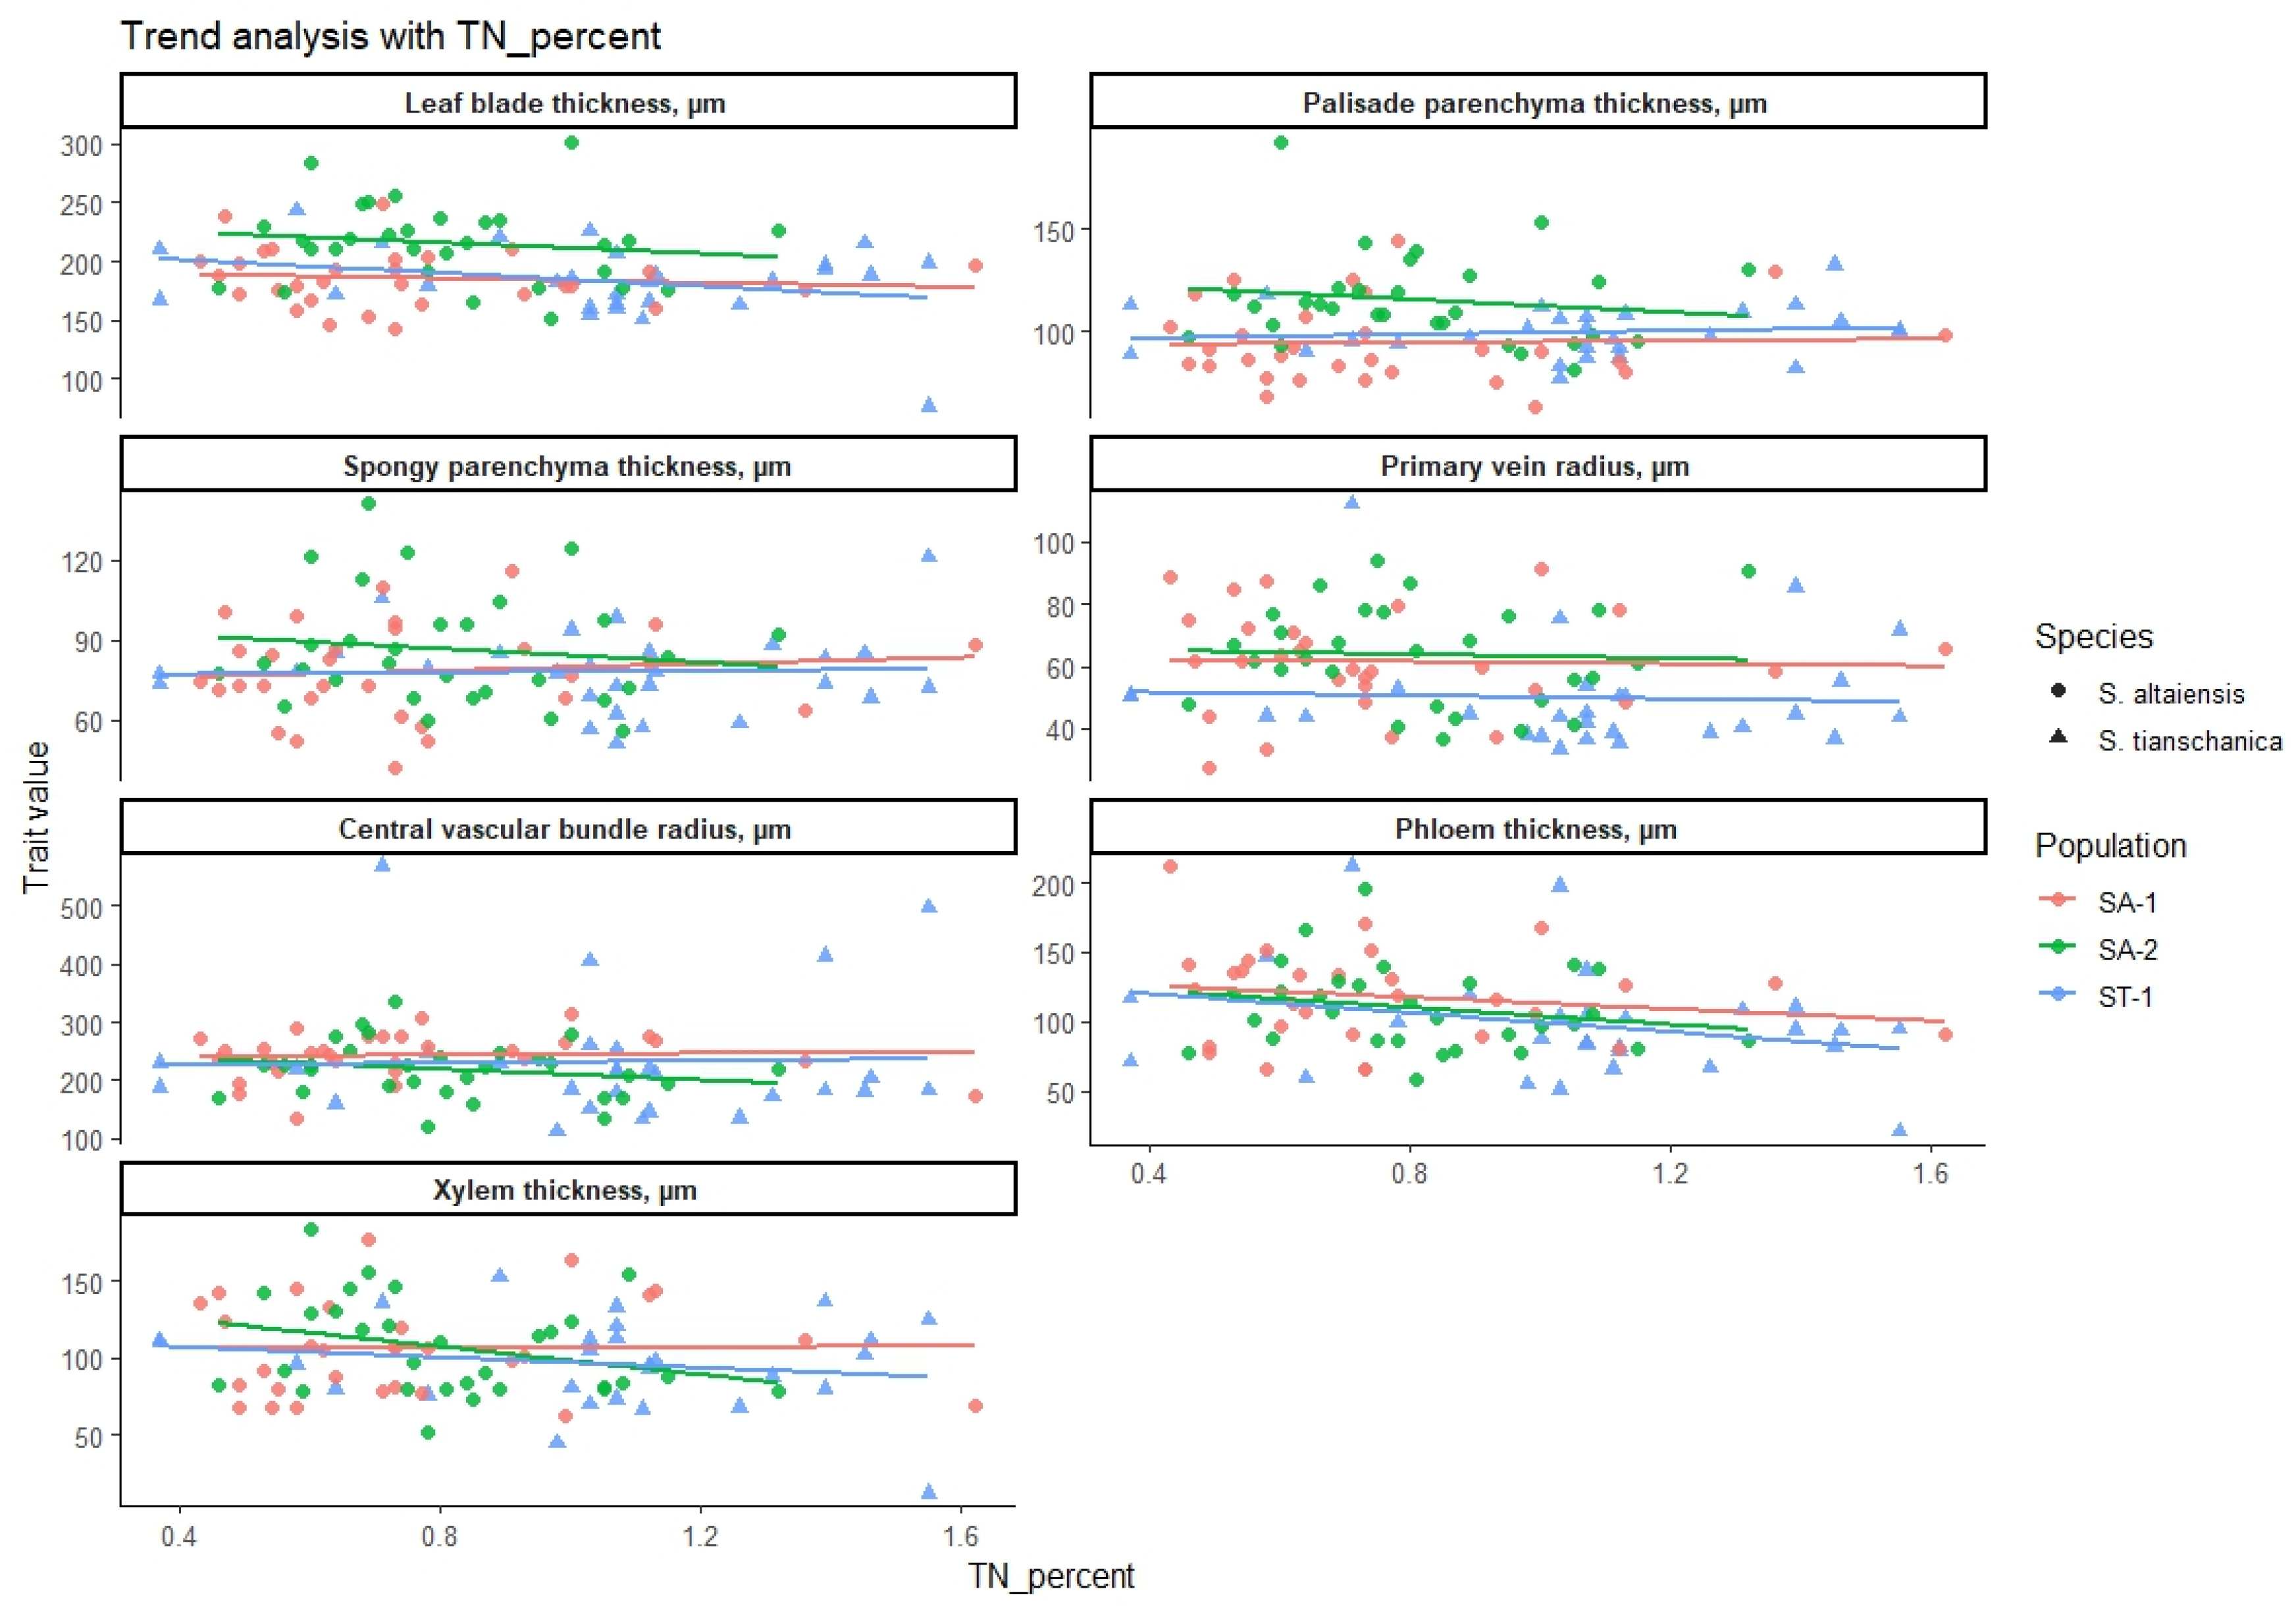
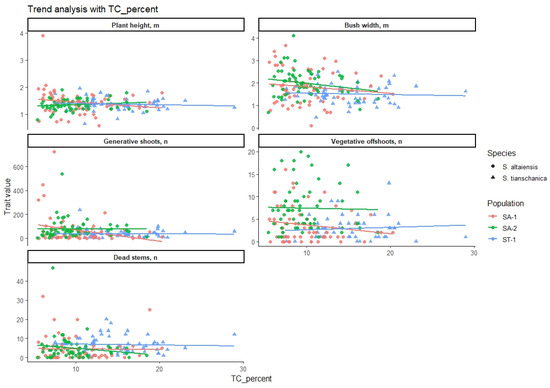
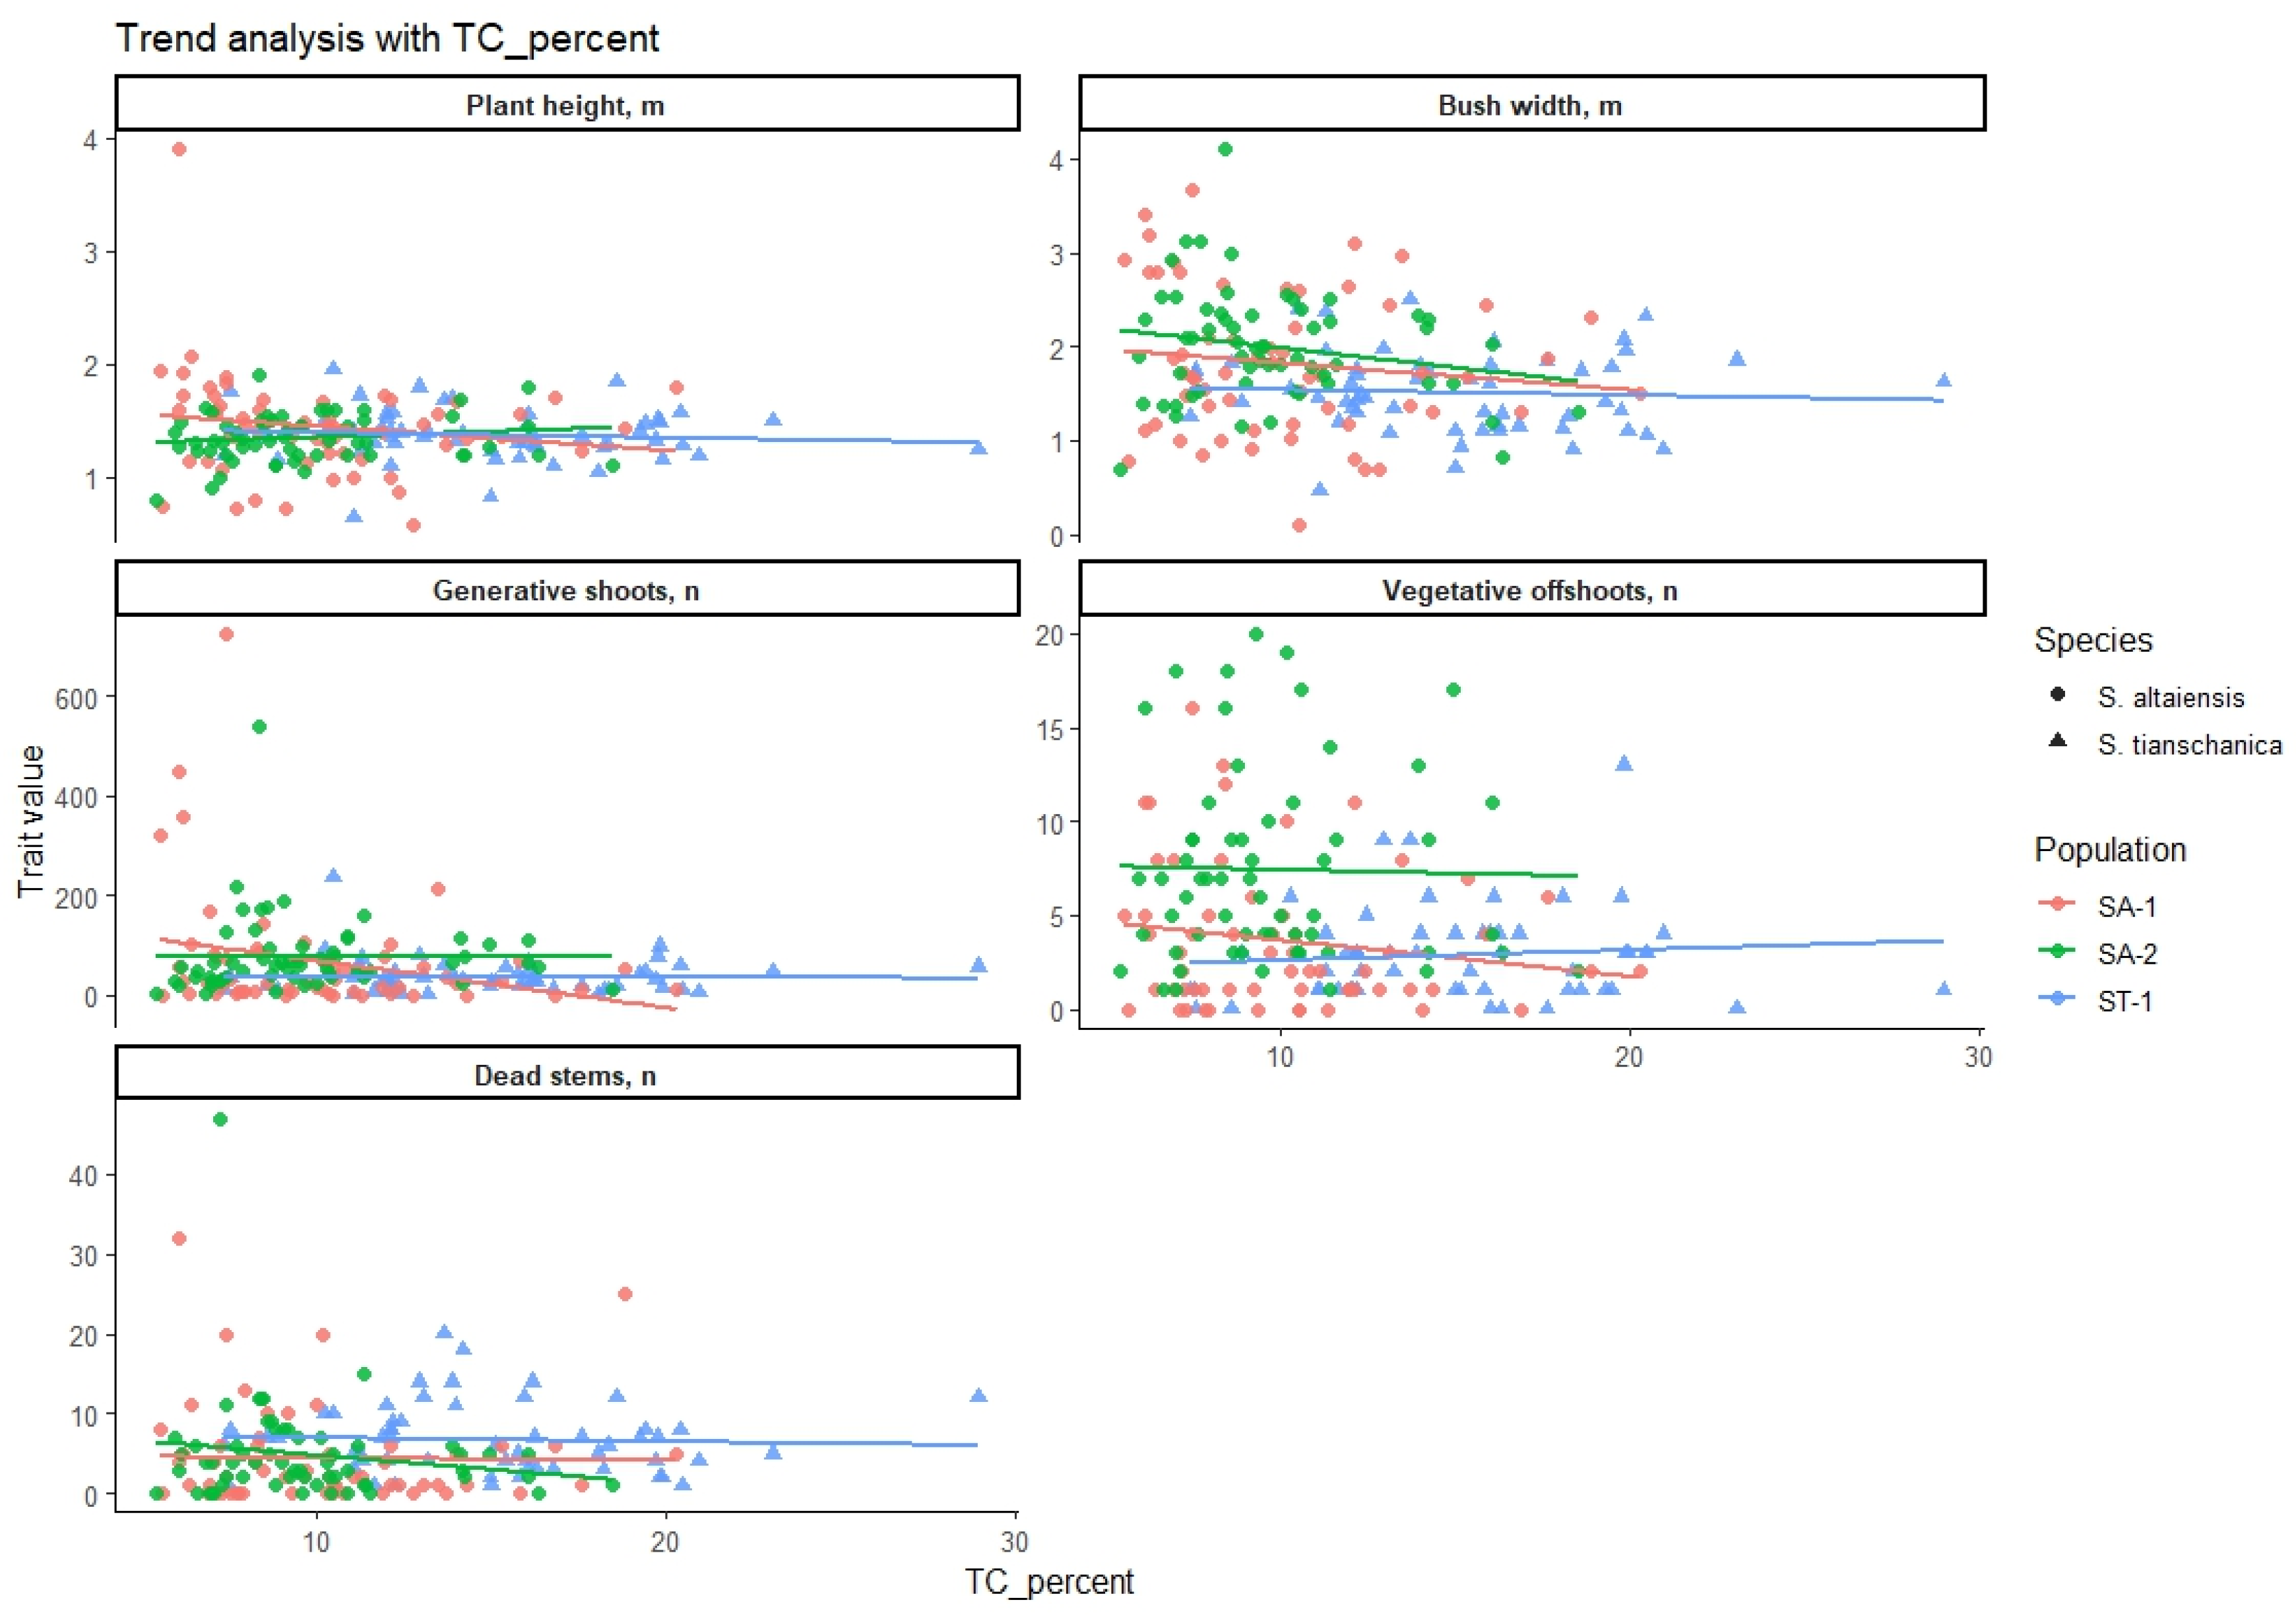
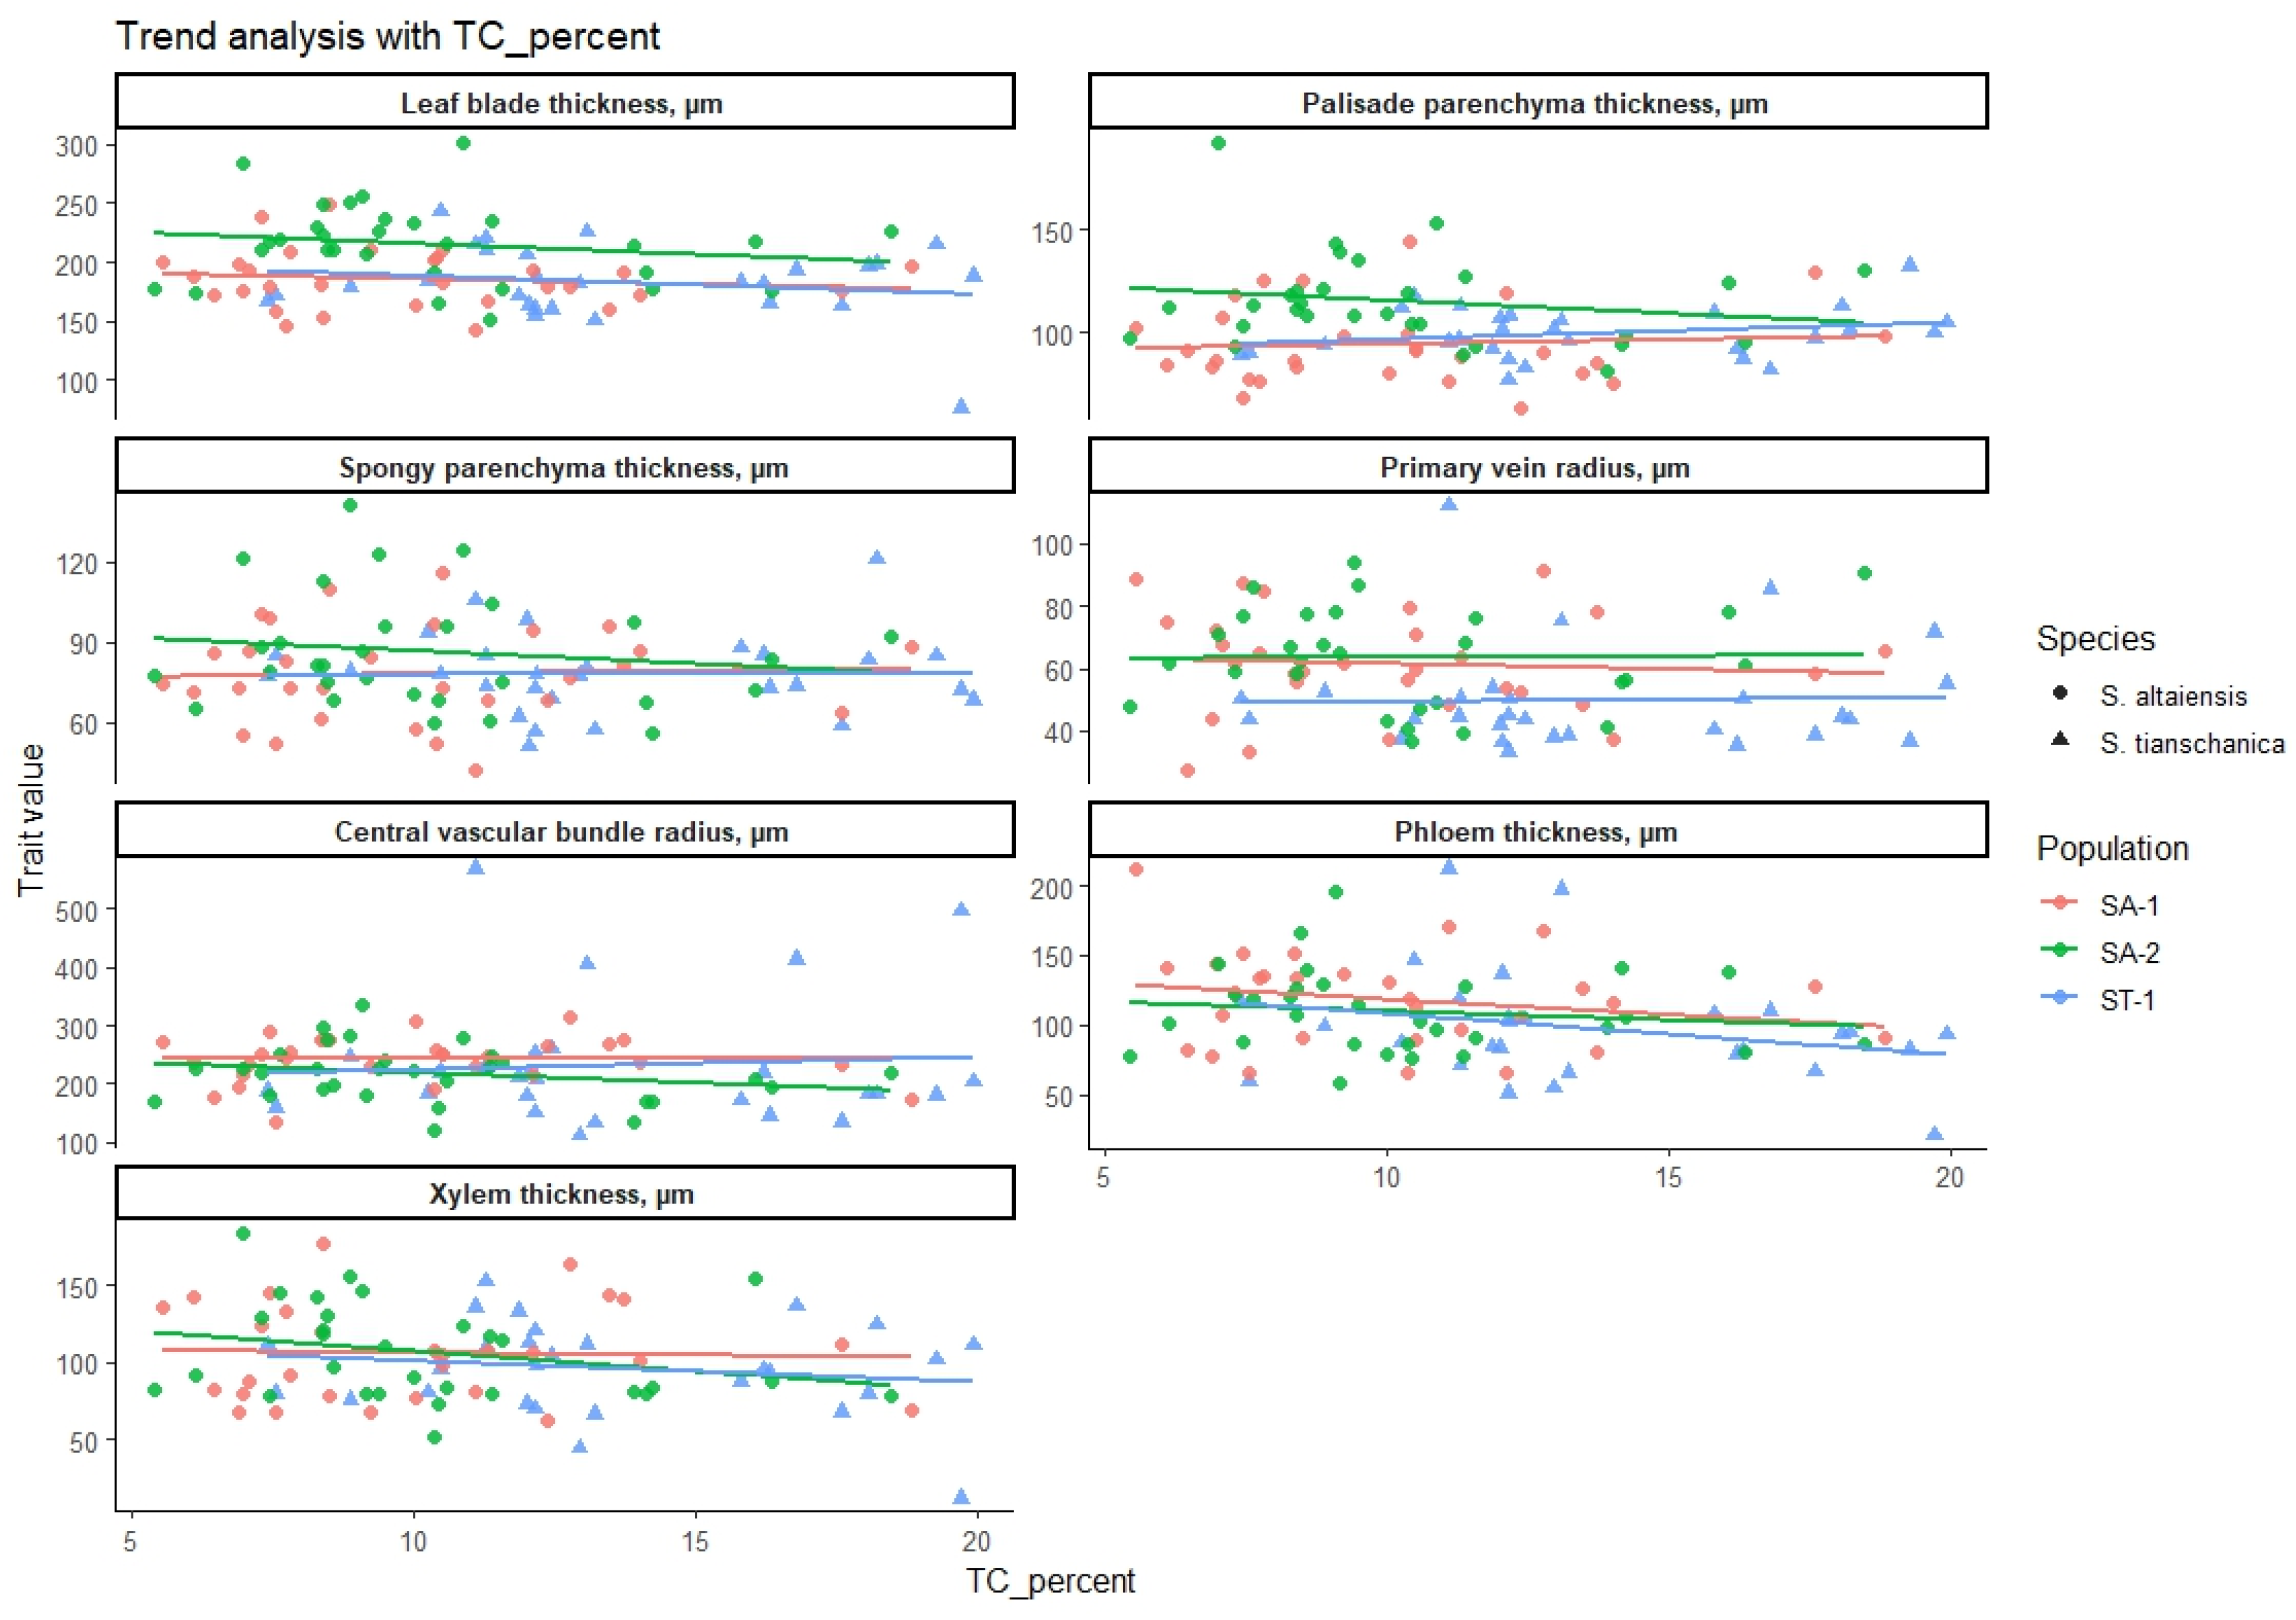
Because many trait-soil pairs were tested and no multiplicity adjustment was applied, these associations are treated as exploratory. The trend panels (Figure 6, Figure 7, Figure 8, Figure 9, Figure 10, Figure 11, Figure 12 and Figure 13) visualise dispersion and group-specific slopes but are not used to infer causal adaptation.
Figure 6.
Trend analysis of the relationship between soil pH and morphological characteristics of Sibiraea altaiensis and Sibiraea tianschanica.
Figure 7.
Trend analysis of the relationship between soil pH and anatomical and histological parameters of Sibiraea altaiensis and Sibiraea tianschanica leaves.
Figure 8.
Trend analysis of the relationship between soil electrical conductivity and morphological characteristics of Sibiraea altaiensis and Sibiraea tianschanica.
Figure 9.
Trend analysis of the relationship between soil electrical conductivity and anatomical and histological parameters of Sibiraea altaiensis and Sibiraea tianschanica leaves.
Figure 10.
Trend analysis of the relationship between total nitrogen content, TN (%), and the morphological characteristics of Sibiraea altaiensis and Sibiraea tianschanica.
Figure 11.
Trend analysis of the relationship between total nitrogen content, TN (%), and the anatomical and histological parameters of the leaves of Sibiraea altaiensis and Sibiraea tianschanica.
Figure 12.
Trend analysis of the relationship between total carbon content, TC (%), and the morphological characteristics of Sibiraea altaiensis and Sibiraea tianschanica.
Figure 13.
Trend analysis of the relationship between total carbon content, TC (%), and the anatomical and histological parameters of the leaves of Sibiraea altaiensis and Sibiraea tianschanica.
Plant height and generative-shoot number showed no meaningful association with any measured soil variable. Most mesophyll and vascular-tissue correlations were also weak and non-significant. The directionally consistent negative coefficients for several vascular traits, on their own, are insufficient to establish a physiological mechanism.
Overall, the correlation results support only limited soil-trait covariation. Region, elevation, microclimate, substrate texture, vegetation age, competition, and disturbance may account for additional variation, and the current dataset does not justify GLMM or structural equation modelling because it contains only three regional analytical groups, with taxon-region confounding.
3.5. Molecular Genetic Characteristics of Sibiraea altaiensis and Sibiraea tianschanica
The molecular dataset consisted of one reported taxon-level consensus sequence for each of four loci in each taxon (eight consensus sequences in total; Table 7). Because the number of source individuals represented by every consensus was not retained in the archival metadata, the results describe pairwise barcode-level differences and do not estimate within-population haplotype or nucleotide diversity.
Table 7.
Characteristics of the eight taxon-level consensus sequences (two taxa × four loci). Public GenBank/INSDC accession numbers were not available at the time of revision.
Edited sequence lengths ranged from 331 to 813 bp. ITS had the highest GC content (64.67–65.17%), whereas psbA-trnH was the most AT-rich locus (GC 22.54–24.63%). Public nucleotide-database accession numbers were not available at the time of revision.
Pairwise identity was 99.87% for matK/KIM, 99.43% for rbcL, 99.31% for ITS, and 99.03% for psbA-trnH (Table 8). Corresponding uncorrected p-distances were 0.13%, 0.57%, 0.69%, and 0.97%, respectively.
Table 8.
Pairwise comparison of the reported taxon-level consensus sequences. p-distance is based only on comparable ACGT sites; gaps and ambiguous sites are tabulated separately.
In the concatenated 2648 bp alignment, 2536 positions were comparable ACGT sites, 2523 were identical, and 13 were substitutions. Overall identity was 99.49%, and the uncorrected p-distance was 0.51%. Gap columns and ambiguous positions were summarised separately and were not counted as nucleotide substitutions.
The observed substitutions comprise five in ITS, one in matK/KIM, three in psbA-trnH, and four in rbcL (Table 9; Supplementary Table S2). These sites are candidate diagnostic positions between the two reported consensus sequences and require validation in independent individuals and populations.
Table 9.
Barcode-level differentiation between the two reported taxon-level consensus sequence sets. Substitutions are candidate diagnostic sites requiring individual-level validation.
No maximum-likelihood tree or haplotype network is presented because the available matrix contains only two taxon-level terminals per locus. Such a dataset lacks an alternative unrooted branching topology, cannot test reciprocal monophyly or within-taxon diversity, and yields bootstrap values that lack biologically meaningful clade comparisons. The molecular evidence, therefore, supports high overall similarity with low but detectable barcode differentiation, not a definitive conclusion about independent evolutionary lineages.
The relative variability of psbA-trnH and ITS identifies these loci as priorities for expanded sequencing, whereas matK/KIM was highly conserved in the present comparison.
4. Discussion
4.1. Interpretation of the Integrative Evidence
The revised analysis supports a conservative interpretation: the sampled regional groups differ in selected morphological, anatomical, and habitat variables, while multivariate overlap and very high barcode identity demonstrate substantial similarity. Concordance among evidence classes is therefore incomplete. The study is informative for regional diagnosis and monitoring, but it is not a formal species-delimitation test. This distinction is important because one current global taxonomic backbone treats S. altaiensis as a synonym of S. laevigata, whereas Kazakhstan sources retain S. altaiensis and accept S. tianschanica separately [1,8,9,10].
The three evidence classes address different scales. Morphology describes whole-shrub architecture and reproductive condition; leaf anatomy captures structural variation that may integrate development and environment; soil variables describe local habitat; and barcode loci provide a limited view of nuclear and plastid sequence differentiation. The strongest conclusion arises not from any single variable but from the combination of significant regional contrasts, extensive within-group variation, weak soil-trait correlations, and low molecular divergence.
4.2. Morphological Variation, Plasticity, and Vicariance
Bush width and vegetative offshoot number differed strongly among groups, and generative-shoot number differed more modestly. Plant height and dying-trunk number did not reach significance. The partial PCoA overlap is consistent with quantitative differentiation rather than discrete morphological separation. The Altai and Ketmen/Tien Shan samples are geographically disjunct and may be described as a vicariant sampling pattern in Kazakhstan; however, geography and taxon are confounded in the present design, and contemporary hybridisation was not tested.
The contrast between SA-1 and SA-2 is particularly important because both were identified as S. altaiensis. Their differences in vegetative reproduction and leaf structure demonstrate that substantial phenotypic heterogeneity occurs within the same taxonomic assignment. Altitude, slope exposure, snow cover, soil water availability, shrub age, competition, and disturbance could all contribute. Consequently, a trait that distinguishes ST-1 from one Altai group but not the other should not be treated as a stable species character without broader replication or common-garden evidence.
4.3. Leaf Anatomy Without Mechanistic Overinterpretation
SA-2 had thicker lamina, palisade, and spongy tissues, whereas ST-1 had a smaller primary vein and thinner phloem than SA-1. These findings expand the set of characters available for population comparison, but they do not demonstrate a specific light- or drought-adaptation mechanism. Leaf anatomical traits are plastic and may respond jointly to irradiance, temperature, water supply, ontogeny, and plant functional strategy [14,15]. The earlier wording that directly attributed thicker palisade tissue to better illumination has therefore been removed.
The lack of significant differences in central bundle radius and xylem thickness, together with strong overlap in the anatomy-based PCoA, also argues against using a single anatomical measurement as a diagnostic character. Replicated common-garden or reciprocal-transplant experiments, standardised leaf developmental stage, and direct measurements of irradiance and water status would be needed to separate genetic and environmental components.
4.4. Soil Contrasts and Limited Trait-Level Explanatory Power
ST-1 differed strongly from both Altai groups in pH, EC, TN, and TC, whereas SA-1 and SA-2 were similar for all four variables. In contrast, most individual soil-trait correlations were small, and no absolute Spearman coefficient exceeded 0.33. The mismatch between strong group-level soil contrasts and weak individual-level correlations indicates that these variables capture regional habitat differences but explain only a limited portion of plant-trait variation.
Several nominal associations were statistically significant, but their effect sizes were weak and were identified among many pairwise tests without multiplicity adjustment. They should therefore be considered hypotheses for future work, not evidence of causal adaptation. Unmeasured factors such as texture, soil moisture, available nutrients, carbonates, microtopography, vegetation age, competition, grazing, tourism, construction, and other human disturbances may obscure or mediate the observed relationships.
More complex GLMMs or structural equation models were not added because the current design has only three regional analytical groups and does not independently replicate species across regions; such models would give a misleading impression of mechanistic resolution. A future hierarchical design with multiple populations per taxon, repeated sublocalities, measured climate/topography/vegetation, and independent soil cores would make mixed-effects and causal models appropriate.
4.5. Molecular Evidence and Its Resolution Limits
The four barcode loci were highly conserved. The concatenated p-distance of 0.51% and the 13 candidate substitutions demonstrate detectable sequence differences between the two reported consensus sets, with psbA-trnH and ITS more variable than rbcL and matK/KIM. This agrees with Rosaceae barcoding studies in which nuclear ribosomal regions often provide greater discrimination than conserved plastid coding loci [16,34,35].
However, consensus-level differences cannot establish monophyly, population diversity, gene flow, or lineage independence. Ballian et al. reported minimal ITS and cpDNA differentiation among disjunct Sibiraea populations [6], and work on the Qinghai-Tibetan complex showed that SSR data resolved structure not evident in cpDNA and ITS [17,19,36]. The academic contribution of the present molecular component is therefore the identification of specific candidate sites and relative locus variability for future testing, not a final taxonomic decision.
A maximum-likelihood tree was not generated because each locus contains only two taxon-level terminal consensus sequences. For two terminals, the unrooted topology is unique; bootstrap resampling cannot choose among competing topologies, estimate within-taxon support, or test monophyly. We therefore consider a two-tip tree potentially misleading rather than informative. Future phylogenetic work should include multiple independent plants from each sublocality, authenticated representatives of the S. laevigata complex and related Spiraeeae, harmonised locus coverage, and, preferably, higher-resolution SSR/SNP, RAD-seq, genome-skimming, or whole-plastome data.
4.6. Sustainability and Conservation Implications
The sustainability relevance of this study lies in converting morphological, anatomical, edaphic, and molecular observations into measurable baselines for maintaining viable populations and habitat integrity. The ST-1 group warrants precautionary conservation because S. tianschanica is regionally restricted and threatened [10,20,37]. First, the three Ketmen sublocalities should be georeferenced as permanent monitoring units, with annual or biennial records of living stems, recruitment, flowering, fruiting, and mortality. Second, site-level threats—grazing pressure, tourism, road or construction activity, fire, and shrub removal—should be mapped and reduced through local protection agreements or micro-reserve zoning.
Ex situ conservation should preserve provenance. Seeds, cuttings, or living accessions should be collected separately from all nine sublocalities, documented with vouchers, and duplicated among botanical gardens or seed banks. Maintaining separate provenance records helps avoid unintentional genetic homogenisation and provides traceable material for future restoration. Reintroduction should not be attempted until propagation success, habitat suitability, disease risk, genetic provenance, and post-release monitoring protocols have been established. This combined monitoring-and-provenance approach supports the efficient use of conservation resources and long-term ecological resilience; these actions are more immediately defensible than taxonomic reclassification based on the current dataset.
4.7. Study Limitations and Future Research
The main limitations are: (i) two Altai regional groups but only one Ketmen/Tien Shan group, causing taxon–region confounding; (ii) chronological age and clonal identity were not determined; (iii) some legacy metadata on biological and technical replication, soil-field replication, and detailed PCR conditions were not retained; (iv) the soil panel was restricted to pH, EC, TN, and TC and lacked texture, gravimetric moisture, available nutrients, carbonates, and direct microclimate measurements; (v) the molecular results are taxon-level consensus comparisons and do not quantify within-population variation; (vi) public GenBank/INSDC accession numbers were not available at revision; (vii) ANOVA and Tukey–Kramer tests were reconstructed from summary statistics, precluding residual and hierarchical sensitivity analyses; and (viii) multiple exploratory correlations were evaluated without multiplicity correction and generally showed weak effect sizes.
Future research should sample multiple geographically independent populations of both taxonomic treatments across the Altai, Tien Shan, Kyrgyzstan, and adjacent Siberia; include authenticated herbarium material; use nested mixed-effects designs; measure climate, topography, vegetation, disturbance, and reproductive output; and apply individual-level SSR, SNP, RAD-seq, genome-skimming, and whole-plastome analyses. Common-garden experiments would be especially valuable for testing whether morphological and anatomical differences persist outside their native environments.
5. Conclusions
This study documents statistically supported differences among three regional Sibiraea groups sampled at nine elevation-stratified sublocalities in Kazakhstan. Bush width, generative and vegetative shoot numbers, several leaf-anatomical traits, and all four measured soil variables differed among groups, whereas plant height, dying-trunk number, central vascular-bundle radius, and xylem thickness did not. Multivariate ordinations showed partial overlap rather than complete separation.
Soil pH, EC, TN, and TC clearly distinguished the Ketmen/Tien Shan group from the two Altai groups, but most shrub-level soil-trait correlations were weak (|ρ| ≤ 0.33). The data, therefore, characterise regional habitat contrast without demonstrating causal adaptation or species-specific edaphic requirements.
The four-locus barcode comparison showed 99.49% concatenated identity and an uncorrected p-distance of 0.51%, with 13 candidate substitutions. These results indicate high molecular similarity with low barcode-level differentiation. Because the molecular dataset consists of taxon-level consensus sequences and lacks individual-level variation, it cannot establish monophyly, gene flow, or independent evolutionary lineages.
Taken together, the results support an integrative monitoring framework and identify candidate morphological, anatomical, edaphic, and molecular variables for broader testing. They do not resolve the competing taxonomic treatments of S. altaiensis/S. laevigata and S. tianschanica. The most immediate sustainability applications are repeated demographic monitoring, habitat protection, provenance-based ex situ conservation, and evidence-based restoration. These measures can reduce biodiversity loss, preserve locally differentiated material, and strengthen the long-term resilience of mountain ecosystems while broader taxonomic and population-genomic studies are completed.
Supplementary Materials
The following supporting information can be downloaded at: https://www.mdpi.com/article/10.3390/su18136500/s1, Table S1: Sampling hierarchy and elevation-stratified sublocalities; Table S2: Pairwise DNA-barcode comparison and candidate substitutions; and Table S3: One-way ANOVA summary for regional analytical groups.
Author Contributions
Conceptualization, A.O., A.M. and T.S.; methodology, Z.A., A.O., T.S. and S.T.; software, S.I. and A.O.; validation, T.S. and S.I.; formal analysis, A.O., Z.A. and A.M.; investigation, A.O., Z.A., A.M., T.S. and S.T.; resources, S.I., T.S. and A.M.; data curation, A.O., Z.A. and S.T.; writing—original draft preparation, A.O.; writing—review and editing, A.O., T.S., A.M. and S.I.; visualisation, Z.A. and A.M.; supervision, T.S., A.M. and A.O.; project administration, T.S.; funding acquisition, T.S., A.M. and S.I. All authors have read and agreed to the published version of the manuscript.
Funding
This research was funded by the Science Committee of the Ministry of Science and Higher Education of the Republic of Kazakhstan, grant No. AP26198171, “Geoecological and Molecular-Genetic Assessment, Monitoring of the Distribution, and Development of Rare Plant Species of the Genera Prunus, Sibiraea, and Rosa (Rosaceae) in Kazakhstan”.
Institutional Review Board Statement
Not applicable; the study involved plant and soil material and did not include humans or experimental animals.
Informed Consent Statement
Not applicable.
Data Availability Statement
The original contributions presented in this study are included in the article and Supplementary Material. The edited consensus sequences and chromatogram-derived assemblies are available from the corresponding author upon reasonable request.
Acknowledgments
The authors thank the field and laboratory staff at NatureLab, Astana International University, for assistance with sampling, sample preparation, and laboratory organisation.
Conflicts of Interest
The authors declare no conflicts of interest.
References
- Pavlov, N.V. (Ed.) Flora of Kazakhstan; Academy of Sciences of the Kazakh SSR: Alma-Ata, Kazakhstan, 1961; Volume 4, Available online: https://rusneb.ru/catalog/000199_000009_005634788/ (accessed on 19 June 2026).
- Shaimoldina, A.K.; Osmonali, B.B.; Zhou, Y.; Wariss, H.M.; Ma, S.; Li, W. Vascular Plant Diversity and Distribution Patterns in Kazakhstan. Diversity 2026, 18, 213. [Google Scholar] [CrossRef] [Scilit]
- Potter, D.; Eriksson, T.; Evans, R.C.; Oh, S.; Smedmark, J.E.; Morgan, D.R.; Kerr, M.; Robertson, K.R.; Arsenault, M.; Dickinson, T.A.; et al. Phylogeny and classification of Rosaceae. Plant Syst. Evol. 2007, 266, 5–43. [Google Scholar] [CrossRef] [Scilit]
- Judd, W.S.; Campbell, C.S.; Kellogg, E.A.; Stevens, P.F.; Donoghue, M.J. Plant Systematics: A Phylogenetic Approach, 3rd ed.; Sinauer Associates: Sunderland, MA, USA, 2008; pp. xv–611. [Google Scholar]
- Potter, D.; Still, S.M.; Grebenc, T.; Ballian, D.; Božič, G.; Franjić, J.; Kraigher, H. Phylogenetic relationships in tribe Spiraeeae (Rosaceae) inferred from nucleotide sequence data. Plant Syst. Evol. 2007, 266, 105–118. [Google Scholar] [CrossRef] [Scilit]
- Ballian, D.; Grebenc, T.; Božič, G.; Melnik, V.; Wraber, T.; Kraigher, H. History, genetic differentiation, and conservation strategies for disjunct populations of Sibiraea species from Southeastern Europe and Asia. Conserv. Genet. 2006, 7, 895–907. [Google Scholar] [CrossRef] [Scilit]
- Yun, N.; Suh, H.J.; Oh, S.H. Sexuality of Aruncus aethusifolius (Rosaceae). Korean J. Plant Taxon. 2017, 47, 189–195. [Google Scholar] [CrossRef] [Scilit]
- Royal Botanic Gardens, Kew. Plants of the World Online: Sibiraea altaiensis (Laxm.) C.K.Schneid. Available online: https://powo.science.kew.org/taxon/urn:lsid:ipni.org:names:741503-1 (accessed on 19 June 2026).
- Govaerts, R.; Nic Lughadha, E.; Black, N.; Turner, R.; Paton, A. The World Checklist of Vascular Plants is a continuously updated resource for exploring global plant diversity. Sci. Data 2021, 8, 215. [Google Scholar] [CrossRef] [Scilit] [PubMed]
- Royal Botanic Gardens, Kew. Plants of the World Online: Sibiraea tianschanica (Krasn.) Pojark. Available online: https://powo.science.kew.org/taxon/urn:lsid:ipni.org:names:741509-1 (accessed on 19 June 2026).
- Stuessy, T.F. Plant Taxonomy: The Systematic Evaluation of Comparative Data; Columbia University Press: New York, NY, USA, 2009. [Google Scholar]
- Fahn, A. Plant Anatomy; Pergamon Press: Oxford, UK, 1990. [Google Scholar]
- Dickison, W.C. Integrative Plant Anatomy; Elsevier: Amsterdam, The Netherlands, 2000. [Google Scholar]
- Ni, X.; Sun, L.; Cai, Q.; Ma, S.; Feng, Y.; Sun, Y.; An, L.; Ji, C. Variation and determinants of leaf anatomical traits from boreal to tropical forests in eastern China. Ecol. Indic. 2022, 140, 108992. [Google Scholar] [CrossRef] [Scilit]
- Yavas, I.; Jamal, M.A.; Din, K.U.; Ali, S.; Hussain, S.; Farooq, M. Drought-induced changes in leaf morphology and anatomy: Overview, implications and perspectives. Pol. J. Environ. Stud. 2024, 33, 1517–1530. [Google Scholar]
- Pang, X.; Song, J.; Zhu, Y.; Xu, H.; Huang, L.; Chen, S. Applying plant DNA barcodes for Rosaceae species identification. Cladistics 2011, 27, 165–170. [Google Scholar] [CrossRef] [Scilit] [PubMed]
- Fu, P.C.; Gao, Q.B.; Zhang, F.Q.; Xing, R.; Khan, G.; Wang, J.L.; Liu, H.R.; Chen, S.L. Responses of plants to changes in the Qinghai-Tibetan Plateau and glaciations: Evidence from phylogeography of a Sibiraea (Rosaceae) complex. Biochem. Syst. Ecol. 2016, 65, 72–82. [Google Scholar] [CrossRef] [Scilit]
- Duan, Y.; Gao, Q.; Zhang, F.; Li, Y.; Fu, P.; Chen, S. Phylogeographic analysis of the endemic species Sibiraea angustata reveals a marginal refugium in the Qinghai–Tibet Plateau. Nord. J. Bot. 2011, 29, 615–624. [Google Scholar] [CrossRef] [Scilit]
- Fu, P.C.; Gao, Q.B.; Zhang, F.Q.; Xing, R.; Khan, G.; Wang, J.L.; Liu, H.R.; Chen, S.L. Gene Flow Results in High Genetic Similarity between Sibiraea (Rosaceae) Species in the Qinghai-Tibetan Plateau. Front. Plant Sci. 2016, 7, 1596. [Google Scholar] [CrossRef] [Scilit] [PubMed]
- Eastwood, A.; Lazkov, G.; Newton, A.C. The Red List of Trees of Central Asia; Fauna & Flora International: Cambridge, UK, 2009. [Google Scholar]
- Serafimovich, M.V.; Efimova, M.V. The Altai endemic Sibiraea altaiensis (Laxm.) Schneid.: Possible use and methods of conservation. Plant Biotechnol. Breed. 2024, 7, 35–42. [Google Scholar] [CrossRef] [Scilit]
- Ruzin, S.E. Plant Microtechnique and Microscopy; Oxford University Press: New York, NY, USA, 1999; p. 322. [Google Scholar]
- Feder, N.E.D.; O’Brien, T.P. Plant microtechnique: Some principles and new methods. Am. J. Bot. 1968, 55, 123–142. [Google Scholar] [CrossRef] [Scilit]
- ISO 11464:2006; Soil Quality—Pretreatment of Samples for Physico-Chemical Analysis. International Organization for Standardization: Geneva, Switzerland, 2006.
- ISO 10390:2021; Soil, Treated Biowaste and Sludge—Determination of pH. International Organization for Standardization: Geneva, Switzerland, 2021.
- ISO 11265:1994; Soil Quality—Determination of the Specific Electrical Conductivity. International Organization for Standardization: Geneva, Switzerland, 1994.
- ISO 13878:1998; Soil Quality—Determination of Total Nitrogen Content by Dry Combustion (Elemental Analysis). International Organization for Standardization: Geneva, Switzerland, 1998.
- ISO 10694:1995; Soil Quality—Determination of Organic and Total Carbon After Dry Combustion (Elementary Analysis). International Organization for Standardization: Geneva, Switzerland, 1995.
- White, T.J.; Bruns, T.; Lee, S.; Taylor, J. Amplification and direct sequencing of fungal ribosomal RNA genes for phylogenetics. In PCR Protocols: A Guide to Methods and Applications; Academic Press: Cambridge, MA, USA, 1990. [Google Scholar]
- Kress, W.J.; Wurdack, K.J.; Zimmer, E.A.; Weigt, L.A.; Janzen, D.H. Use of DNA barcodes to identify flowering plants. Proc. Natl. Acad. Sci. USA 2005, 102, 8369–8374. [Google Scholar] [CrossRef] [Scilit] [PubMed]
- CBOL Plant Working Group. A DNA barcode for land plants. Proc. Natl. Acad. Sci. USA 2009, 106, 12794–12797. [Google Scholar] [CrossRef] [Scilit] [PubMed]
- Hollingsworth, P.M.; Graham, S.W.; Little, D.P. Choosing and using a plant DNA barcode. PLoS ONE 2011, 6, e19254. [Google Scholar] [CrossRef] [Scilit] [PubMed]
- Altschul, S.F.; Gish, W.; Miller, W.; Myers, E.W.; Lipman, D.J. Basic local alignment search tool. J. Mol. Biol. 1990, 215, 403–410. [Google Scholar] [CrossRef] [Scilit] [PubMed]
- Akzhunis, I.; Dinara, Z.; Nurzhaugan, D.; Aidyn, O.; Nazerke, T.; Gulmira, T. Unravelling the chloroplast genome of the Kazakh apricot (Prunus armeniaca L.) through MinION long-read sequencing. Plants 2025, 14, 638. [Google Scholar] [PubMed]
- Salmurzauly, R.; Myrzagaliyeva, A.; Irsaliyev, S.; Samarkhanov, T.; Orazov, A.; Nurtazin, S.; Altynbek, M.; Sagynysh, B. Fraxinus sogdiana Bunge forests in Charyn Canyon, Kazakhstan. Casp. J. Environ. Sci. 2024, 22, 1117–1131. [Google Scholar]
- Koblanova, S.; Mukhtubayeva, S.; Kakimzhanova, A.; Orazov, A.; Dyussembekova, D.; Abileva, G. Diversity of birch and alder forests in the Kostanay region of Kazakhstan. Forests 2024, 15, 1680. [Google Scholar] [CrossRef] [Scilit]
- Kubentayev, S.; Levichev, I.; Nobis, M.; Baasanmunkh, S.; Klichowska, E.; Orazov, A.; Alibekov, D.; Kubentayeva, B.; Choi, H.J. Integrative taxonomic revision concerning phylogenetic relationships, morphological variation, distribution, ecology and conservation of Gagea alberti (Liliaceae) within its natural range. Bot. Stud. 2025, 66, 16. [Google Scholar] [CrossRef] [Scilit] [PubMed]

Disclaimer/Publisher’s Note: The statements, opinions and data contained in all publications are solely those of the individual author(s) and contributor(s) and not of MDPI and/or the editor(s). MDPI and/or the editor(s) disclaim responsibility for any injury to people or property resulting from any ideas, methods, instructions or products referred to in the content. |
© 2026 by the authors. Licensee MDPI, Basel, Switzerland. This article is an open access article distributed under the terms and conditions of the Creative Commons Attribution (CC BY) license.