


Abstract
During the construction of large-diameter shield tunnels, tunnel lining segments frequently experience uplift after exiting the shield tail, inducing structural defects such as dislocation, cracking, and water leakage. This issue threatens both construction safety and the long-term sustainable operation of large-diameter shield tunnels. Shield tail grouting slurry buoyancy is the primary cause of segment uplift. However, existing studies mainly rely on atmospheric pressure tests and simplified models, failing to capture the dynamic evolution of grout buoyancy under real confining pressures. This study optimized grout mix proportions through laboratory tests and developed a novel buoyancy testing apparatus. Systematic time-dependent buoyancy tests were conducted. Results show that cement-based grouts exhibit a distinct three-stage buoyancy dissipation pattern, which is strongly influenced by confining pressure, stratum conditions, and mix design, whereas inert grouts follow a single-stage exponential decay. The optimized mix YH1 reduced the complete buoyancy dissipation time by 20–35% compared with conventional cement-based grout S9. Based on field monitoring at the Yangcheng West Lake Third Channel project, approximately 90% of segment uplift deformation occurred during the grout buoyancy persistence stage. These findings provide reliable theoretical support for optimizing anti-floating grout design and contribute to the resilience and sustainability of urban underground infrastructure.
1. Introduction
Shield tunnelling is a core technology for urban underground space development, offering significant improvements in land-use efficiency and supporting the construction of low-carbon urban transportation systems [1,2]. In recent years, to meet the dual demands of urban traffic capacity expansion and efficient underground space utilization, tunnel construction has progressively shifted from conventional cross-sections to large- and super-large-diameter domains [3,4,5]. However, during shield tunnelling, significant uplift of the tunnel lining segments commonly occurs after they emerge from the shield tail. This uplift readily induces structural defects such as segment dislocation, cracking, and water leakage. This issue has become a common technical challenge that constrains both the construction quality and the long-term sustainable operation of large-diameter shield tunnels [6,7,8,9]. Addressing this issue is essential for enhancing the resilience and lifecycle performance of urban underground infrastructure.
Existing studies have shown that segment uplift in shield tunnels is a typical multi-factor coupled mechanical problem with highly complex and diverse influencing factors [10,11,12]. In terms of theoretical calculations and numerical simulations, Koizumi et al. [13] first proposed a longitudinal beam–spring model to analyze the longitudinal uplift of tunnel segments. This model features parameters with clear physical meanings and has been widely applied in tunnel lining uplift analyses. Xiao et al. [14] calculated the overall longitudinal internal forces of shield tunnels during the construction phase based on the longitudinal beam–spring model and developed a numerical model for quantifying segment dislocation. Their results indicated that shortening the grout solidification time could effectively reduce segment dislocation deformation induced by uplift. Chen et al. [15] established a refined three-dimensional finite element model of tunnel segments and bolts using ANSYS software, incorporating the transverse and longitudinal joint stiffness, thereby achieving an effective integration of theoretical structural analysis and three-dimensional numerical simulation.
With the continuous advancement of research, the critical regulatory role of shield tail grouting in controlling lining uplift has been widely recognized by the academic community [16,17]. In recent years, scholars have begun to incorporate the time-dependent buoyancy effect of shield tail grouting into traditional models for further analysis. Geng et al. [18] divided the entire uplift process into two stages based on the grout solidification time and performed mechanical analysis and state evaluation of single-ring segments in each stage. Yuan et al. [19] introduced the viscous force of the grout and inter-ring friction into the segment loading model. By establishing force equilibrium equations, they derived a theoretical formula for calculating segment uplift. Furthermore, some researchers introduced correction parameters, such as time-varying buoyancy coefficients and time-dependent viscous resistance coefficients of grout, to characterize the dynamic evolution of uplift forces over time, thereby improving the agreement between the model and actual field conditions [20,21,22,23].
However, due to insufficient understanding of the actual behavior and mechanical properties of shield tail grouting in the surrounding ground, existing theoretical models are predominantly based on simplified assumptions and thus struggle to accurately capture the dynamic evolution of grout buoyancy under real construction conditions. Consequently, many scholars have shifted their focus to physical model tests to investigate buoyancy effects more directly and perform quantitative studies. Zhong et al. [24] and Shi et al. [25] improved the standard consolidation apparatus by adding modules for specimen height and pore pressure monitoring. They simulated confining pressure using air pressure and calculated the buoyant unit weight through internal pore pressure in the grout, subsequently fitting a buoyancy dissipation formula. Wang et al. [26] established a scaled physical model, utilizing a lifting screw rod to simulate segment movement. Considering viscous resistance, they directly measured the buoyancy dissipation process and proposed a two-stage time-dependent empirical model.
Although these experiments incorporated multiple key parameters and improved the engineering applicability of buoyancy testing, the underlying physical mechanisms remain insufficiently understood. Buoyancy dissipation patterns are still predominantly characterized by empirical formulas and numerical fitting, with limited consideration of hydrogeological conditions and the dynamic interactions within the grout–soil–segment system. Consequently, a notable gap persists between these models and actual engineering conditions.
This study focuses on controlling segment uplift in large-diameter shield tunnels through precise regulation of slurry buoyancy. Optimized grout mix proportions with excellent anti-floating performance were developed based on fundamental property tests. A novel buoyancy testing apparatus was independently designed to simulate real formation conditions and confining pressures, enabling quantitative evaluation of the time-dependent buoyancy characteristics of synchronous grouting slurry. By integrating field monitoring data from a large-diameter shield tunnel project, a quantitative relationship between grout buoyancy and segment uplift was established, and the staged evolution characteristics of segment uplift were clarified. The findings provide both theoretical insights and practical guidance for optimizing synchronous grouting in large-diameter shield tunnels. This contributes to improved construction quality, reduced long-term maintenance costs, and the development of more resilient and sustainable urban underground infrastructure.
2. Materials and Methods
2.1. Raw Materials
This study utilized conventional construction materials commonly used in shield tail grouting for shield tunnels. Portland cement (PO42.5, Anhui Conch Cement Co., Ltd., Wuhu, China) served as the primary binder, while Grade II fly ash (moisture content ≤ 1.0%, Hengyuan New Materials Co., Ltd., Binzhou, China) was incorporated as a supplementary cementitious material. Sodium-based bentonite (>95% passing 200-mesh sieve, Shandong Yousuo Chemical Technology Co., Ltd., Linyi City, China) was added as a stabilizing agent to improve suspension properties and control bleeding. Fine sand (mud content ≤ 3.0%, Xiamen Aisuo Standard Sand Co., Ltd., Xiamen, China) functioned as the aggregate component, and municipal tap water (pH 7–8, Suzhou, China) was used for mixing. All raw materials complied with the relevant requirements of the following national standards: Common Portland Cement (GB 175-2023) [27], Fly Ash Used in Cement, Mortar and Concrete (GB/T 1596-2017) [28], Bentonite (GB/T 20973-2020) [29], and Sand for Construction (GB/T 14684-2022) [30].
2.2. Slurry Mix Design and Basic Performance Tests
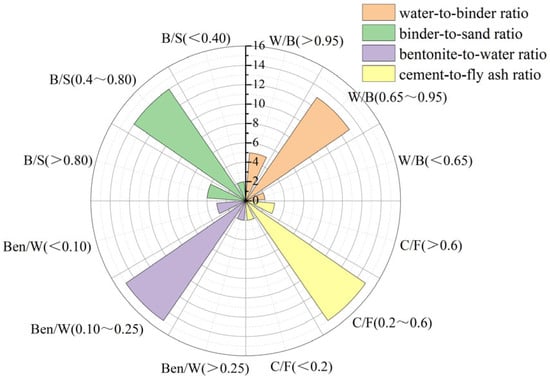
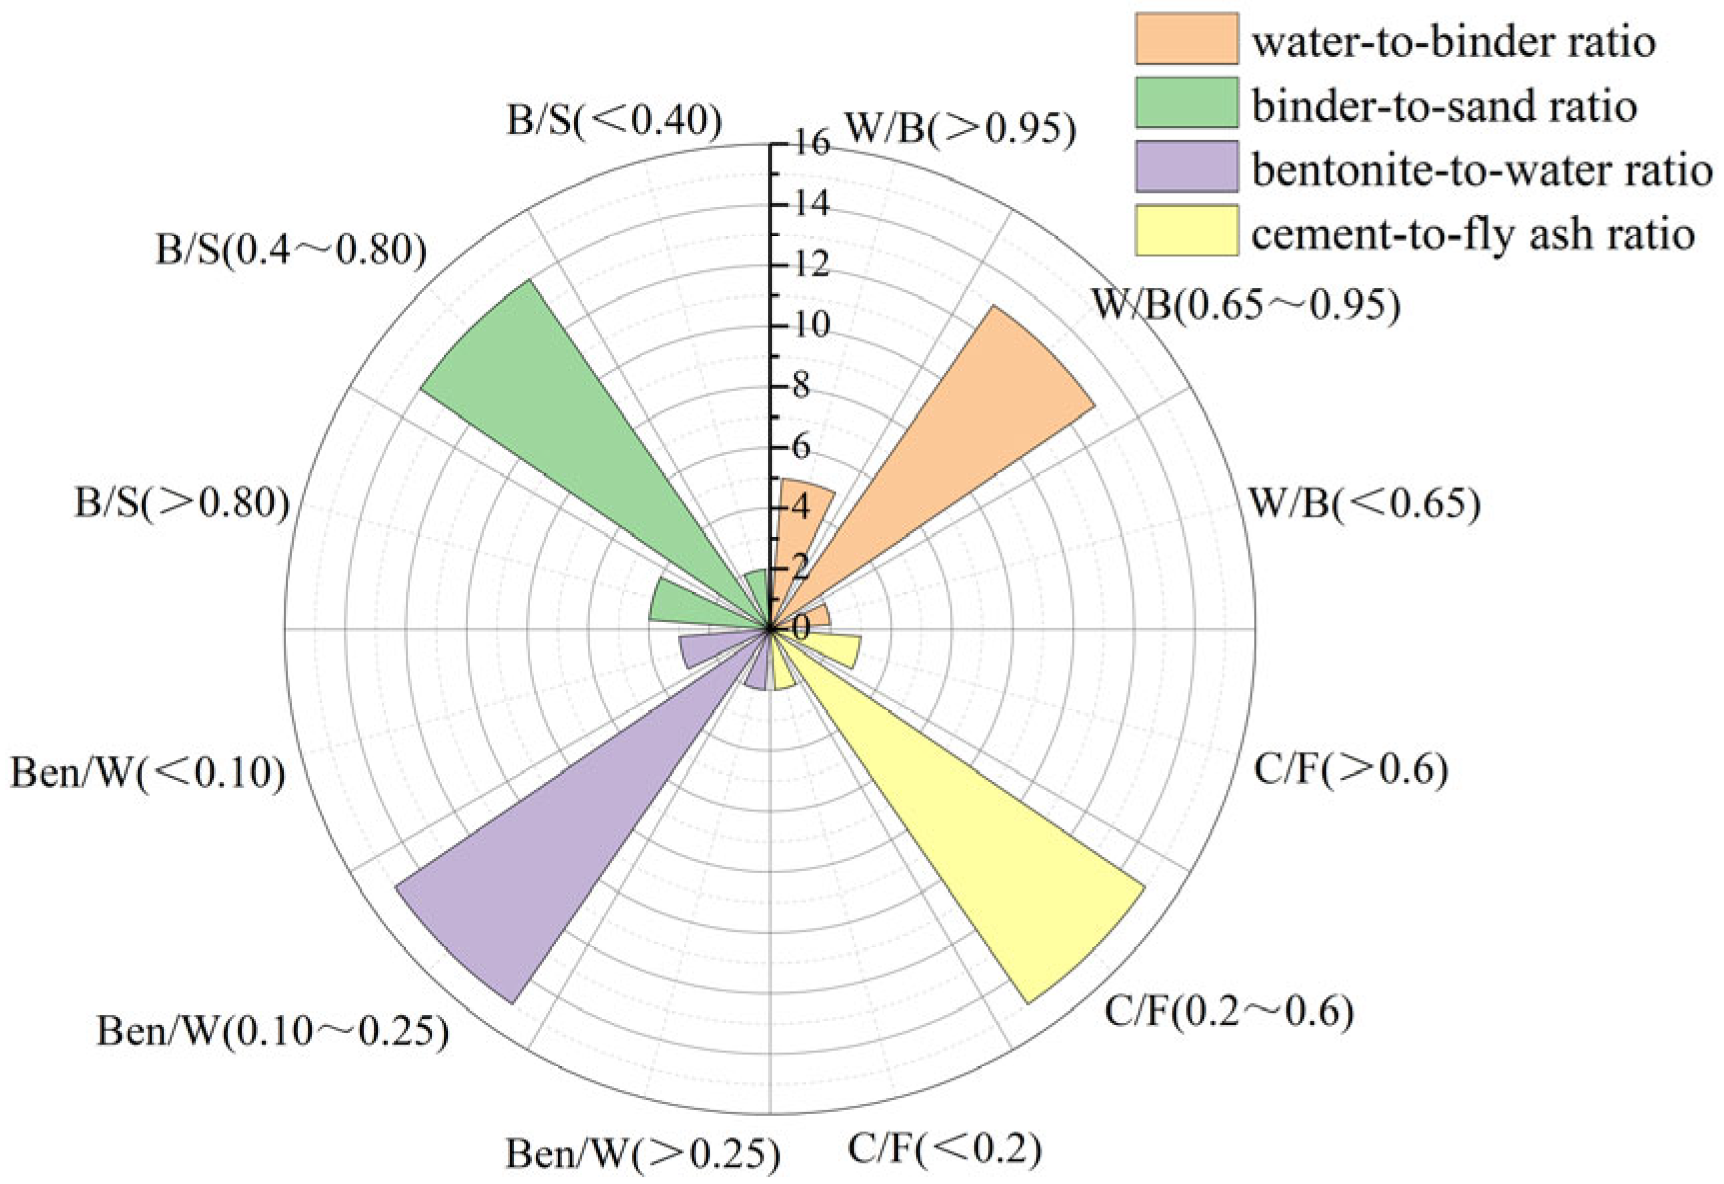
The buoyancy characteristics of shield tail grouting slurry are closely related to its fundamental physical properties [31,32]. To thoroughly elucidate the influence of slurry mix proportions on buoyancy behavior, this study conducted a statistical analysis of 20 actual shield tunnel projects to determine the distribution patterns of key mix parameters. Figure 1 presents the frequency distributions of the four primary factors, where the length of each colored sector represents the frequency of occurrence of the corresponding parameter within the specified range.
Figure 1.
Distribution frequency of grout ratios.
The analysis reveals distinct concentration patterns in engineering practice: the water-to-binder ratio (W/B) is predominantly distributed in the range of 0.65–0.95 (65%), the binder-to-sand ratio (B/S) in 0.40–0.80 (70%), the bentonite-to-water ratio (Ben/W) in 0.10–0.25 (75%), and the cement-to-fly ash ratio (C/F) in 0.20–0.60 (75%). Based on this frequency analysis, the parameter ranges for subsequent tests were determined as follows: water-to-binder ratio of 0.60–1.05, binder-to-sand ratio of 0.40–1.00, bentonite-to-water ratio of 0.05–0.275, and cement-to-fly ash ratio of 0–0.6 (where a ratio of 0 represents inert slurry). These ranges not only cover the mainstream intervals used in actual projects but also extend appropriately toward both higher and lower values, enabling a comprehensive investigation into the effects of mix proportions on slurry performance. To systematically evaluate these influences, an L16(44) orthogonal experimental design was adopted, with four levels selected for each of the four factors, resulting in a total of 16 test mixes. The detailed factor levels are presented in Table 1.
Table 1.
Factor levels in the orthogonal experimental design.
Slurry performance tests were conducted in strict accordance with the following national standards: Standard for Test Method of Basic Properties of Construction Mortar (JGJ/T 70–2009) [33] and Standard for Test Method of Performance on Ordinary Fresh Concrete (GB/T 50080–2016) [34]. The measured performance indices included slurry density (ρ), fluidity (F), bleeding rate (b), dynamic viscosity (η), consistency (s), consolidation shrinkage rate (ε), setting time (t), and unconfined compressive strength (f). By systematically examining these basic properties, this study aims to establish the correlation between the fundamental characteristics of the slurry and its buoyancy behavior, thereby providing key indicators for subsequent quantitative analysis of mix proportion optimization and anti-floating performance.
2.3. Development of Buoyancy Test Apparatus
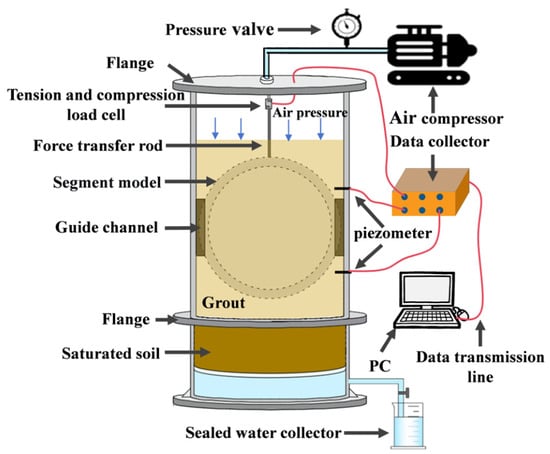
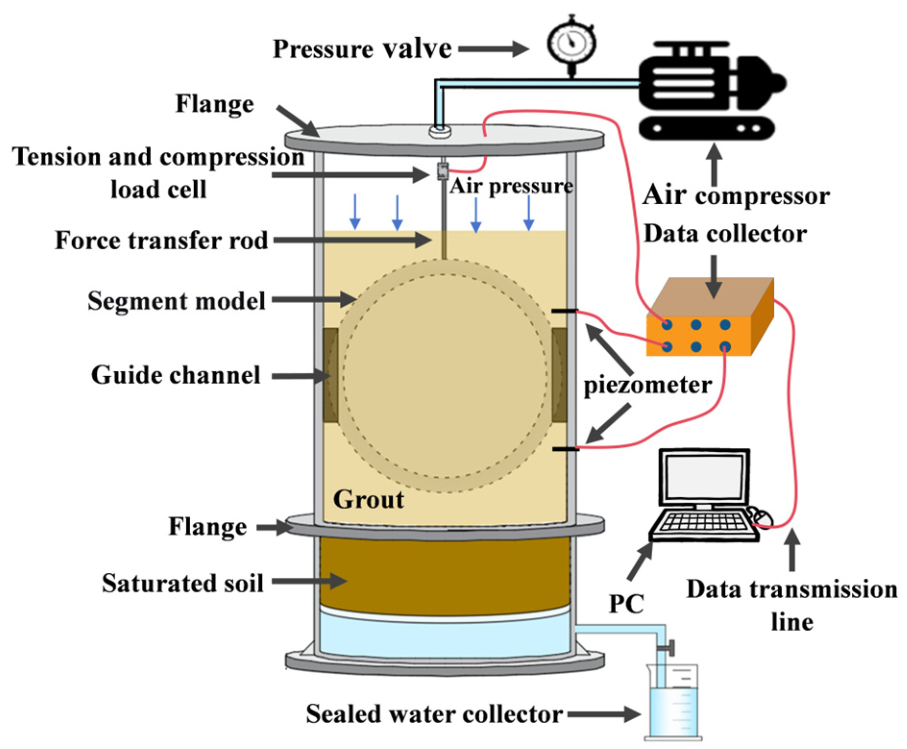
Existing buoyancy testing methods are predominantly based on atmospheric pressure or simplified conditions, which makes it difficult to realistically capture the time-dependent evolution of slurry buoyancy under confining pressure from the surrounding formation. To address this limitation, this study independently developed a shield tail grouting segment buoyancy test apparatus capable of simulating actual formation conditions and confining pressures, as shown in Figure 2.
Figure 2.
Schematic of the shield tail grouting segment buoyancy test apparatus.
The test cylinder adopts a vertically segmented structure. The upper cylinder was fabricated from high-strength transparent plexiglass, with two symmetrical guide slots on the inner wall to restrict the horizontal movement of the model segment, thereby ensuring that it is subjected only to longitudinal buoyancy. The upper section serves as the slurry chamber. The upper and lower cylinders were connected by flanges with identical inner diameters. The lower cylinder consisted of a soil layer and a water collection layer from top to bottom, where the soil layer can be configured according to experimental requirements to simulate different formation types.
The thickness of the soil layer was set to 10 cm. Since the actual diffusion range of grout in real formations was much smaller than this thickness, the design not only ensured adequate grout penetration but also effectively minimizes boundary effects, with negligible influence on the buoyancy time-dependent test results [35]. A perforated filter plate was placed between the soil layer and the water collection layer to separate and collect the water discharged during grout consolidation and permeation.
A pressure port and threaded connector was provided on the upper flange and connected via pipelines to an air compressor and a precision pressure regulator. This system delivers stable air pressure, enabling precise control of the overburden pressure applied above the slurry and thereby simulating the confining pressure exerted by the surrounding formation [36]. It should be noted that most previous studies on synchronous grouting have adopted this approach to simulate the ground restraint conditions. The buoyancy testing apparatus developed in this study follows the same method and is primarily intended to investigate the time-dependent buoyancy dissipation behavior of grouts under confining pressure. However, due to the constraints of laboratory testing conditions, the apparatus cannot fully reproduce the stress gradients caused by soil self-weight, nor can it accurately replicate the complex three-dimensional interaction among the slurry, soil, and tunnel segments under real shield tunnelling conditions. Therefore, the coupling mechanisms among the slurry, soil, and tunnel segments require further investigation through field monitoring and numerical simulation.
The top of the model segment was connected to a force transmission rod via bolts, and the lower part of the rod was fixed to the segment ring using bolts on both sides. The upper part of the rod was connected to an S-type load cell via bolts, with the load cell having a fixed end and a loading end at its upper and lower portions, respectively. The fixed end was securely mounted to the upper flange using bolts and washers. The buoyancy force acting on the model segment ring was transmitted through the force transmission rod to the load cell, and the sensor signals are collected by a data acquisition system and converted into electrical signals for recording. When the upward buoyancy force on the model segment exceeds its self-weight, the segment tends to float upward, causing the force transmission rod to move upward. The pressure value measured by the sensor at this point represents the effective buoyancy.
To accurately replicate the stress state of the segments during shield tail grouting in large-diameter shield tunnels and ensure that the model test results can effectively guide engineering practice, this study established similarity criteria for the model tests based on dimensional analysis. According to similarity theory, the scale factor C is defined as the ratio of a physical or mechanical parameter between the prototype and the model. Considering the experimental conditions and measurement accuracy, the outer diameter of the model segment was set to 180 mm. From Equation (1), the geometric similarity ratio was determined as CL = 1:62.5.
where D refers to the outer diameter of the segment, and L is the width of the segment.
However, geometric similarity alone was insufficient to replicate the uplift mechanism of tunnel lining segments. Segment uplift results from the dynamic coupling between grout buoyancy and segment self-weight. Therefore, besides geometric similarity, the buoyancy-to-weight ratio of the model must also satisfy the corresponding similarity criterion. Based on dimensional analysis, the following relationship was derived:
where V refers to the volume of the segment, F is the buoyancy force acting on the segment, and m is the mass of the segment.
Based on the established similarity relationships, the geometric dimensions of the model segment were determined as follows: outer diameter of 180 mm, inner diameter of 164 mm, segment thickness of 8 mm, and ring width of 24 mm. The total volume of the model segment is 610.7 cm3, with a mass of 260.6 g. The model segment adopted a detachable structure, allowing the buoyancy-to-weight ratio to be adjusted by adding or removing internal counterweights. Additionally, an internal grid structure was incorporated to distribute pressure, prevent deformation, and ensure the accuracy of buoyancy measurements. The placement and orientation of the model segment in the test were consistent with those of actual shield tunnel segments to maintain similarity in loading conditions.
The load measured by this apparatus represents the effective buoyancy, defined as the net uplift force of the grout, which is the difference between the theoretical buoyancy and the sum of the segment self-weight and viscous resistance. Due to model scale limitations, this absolute value cannot be directly applied to practical engineering. However, the ratio of effective buoyancy to segment self-weight is a dimensionless coefficient independent of scale. It intuitively reflects the grout’s actual effectiveness in suppressing segment uplift and serves as a key bridge linking laboratory experiments with engineering applications. In this study, the measured effective buoyancy data were normalized into a dimensionless form, and the buoyancy-to-weight ratio (F/G) was adopted as the evaluation index, where F denotes the grout buoyancy, and G represents the segment self-weight. All subsequent analyses were based on this dimensionless parameter.
2.4. Buoyancy Testing of Shield Tail Grouting Slurry Considering Formation Conditions and Confining Pressure
To investigate the time-dependent evolution of buoyancy of shield tail grouting grout under actual formation conditions, this study designed a systematic experimental scheme based on a self-developed buoyancy test apparatus. A three-factor and three-level orthogonal experimental design is adopted in the test. Grout type, formation condition and confining pressure are selected as the main influencing factors. Three types of grout are applied in the test, including inert grout S7 (W/B = 0.75, B/S = 0.8, Ben/W = 0.275, C/F = 0), conventional cementitious grout S9 (W/B = 0.9, B/S = 0.4, Ben/W = 0.2, C/F = 0.6), and optimized grout YH1. The time-dependent buoyancy tests were conducted exclusively on these three slurries. S7 and S9 were selected from the orthogonal test results as representative inert and conventional cement-based slurries, respectively, to compare their time-dependent buoyancy behavior. The optimized formulation YH1 was also included to verify its superior anti-floating performance. Three typical soil layers consisting of sand, silty clay and clay are chosen as the test formations. The physical and mechanical parameters of these soils are listed in Table 2. Three confining pressure levels of 100 kPa, 200 kPa and 300 kPa are set for comparative tests. A total of 27 groups of time-dependent buoyancy tests are completed through orthogonal combination of different test factors.
Table 2.
Physical and mechanical parameters of the experimental soils.
2.5. Field Case Study on Segment Uplift Behavior in the Yangcheng West Lake Third Channel Shield Tunnel
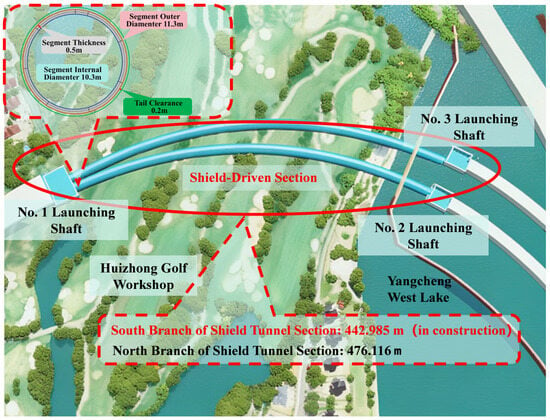
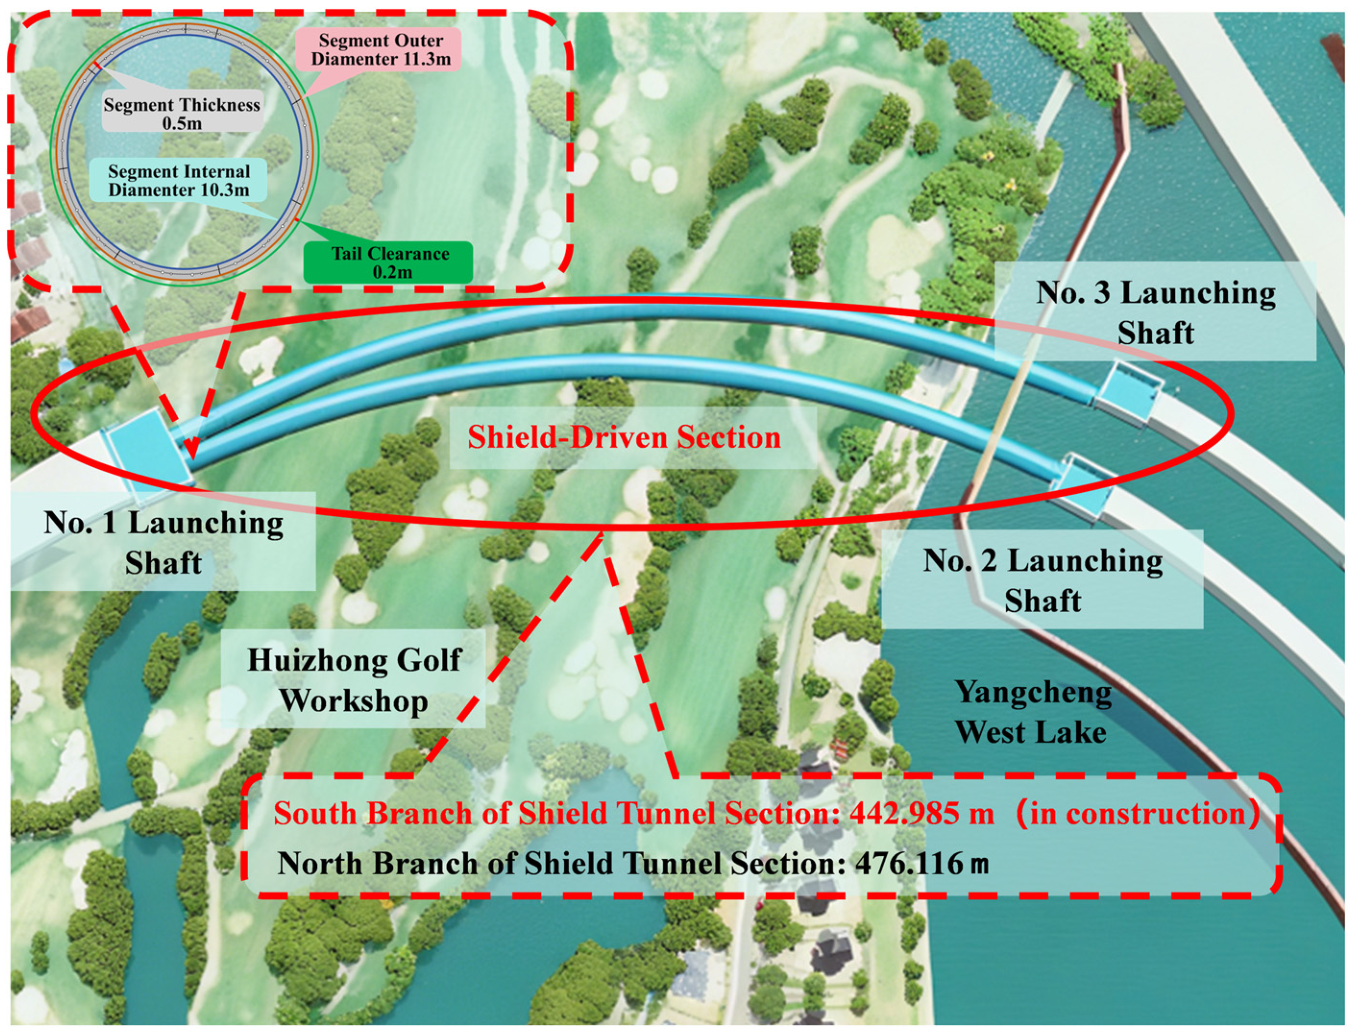
The Yangcheng West Lake Third Channel Shield Tunnel Project plans to construct parallel twin shield tunnels to connect the eastern and western districts of Yangcheng Lake. The western section of the route traverses developed urban areas and thus adopts the shield tunneling method for construction. As shown in Figure 3, the shield tunnels consist of a north line and a south line, with lengths of approximately 476.116 m and 442.985 m, respectively. The burial depth of the tunnel ranges from 6.2 m to 11.5 m. The groundwater table in the project area is approximately 5.0 m below the ground surface, which has a significant impact on construction and necessitates close monitoring of soil conditions and segment stresses during the construction process [37].
Figure 3.
Overview of the Yangcheng West Lake Third Channel Shield Tunnel Project.
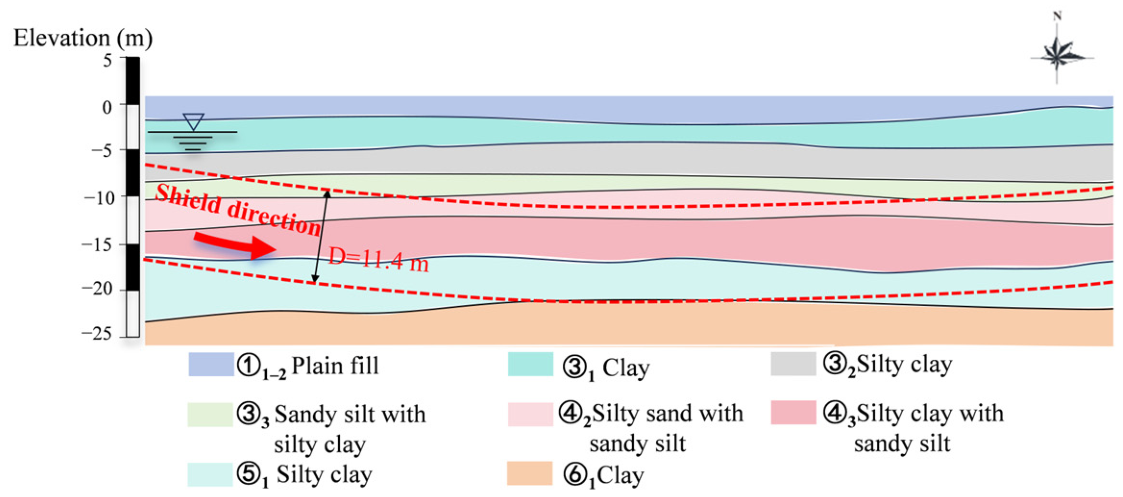
This project utilizes a slurry shield machine with an excavation diameter of 11.7 m. The construction sequence is as follows: the shield machine was launched from Shaft No. 1 to excavate the north line and broke through at Shaft No. 3, and was then transferred to Shaft No. 3 for subsequent construction. The segmental lining has an outer diameter of 11.3 m with a tail gap of 0.2 m, which is typical of large-diameter shield tunnels. As shown in Figure 4, the tunnel primarily traverses silty sand and silty clay layers. These strata exhibit relatively poor permeability, low integrity, and weak surrounding rock constraint capacity. Due to the large cross-section, relatively low self-weight, and large contact area with the grout, the segments are highly prone to vertical heave deformation under the buoyancy of the shield tail grouting slurry [38,39]. Consequently, segment uplift poses a prominent risk and has become a key challenge and focal point in construction control for this project.
Figure 4.
Geological profile of main strata crossed by shield tunnel.
This project employs a synchronized tail grouting system to perform simultaneous grouting as the shield advances, filling the tail gap between the tunnel lining and the surrounding soil to control ground deformation and tunnel settlement. The grouting system is equipped with four PM HSP550 grouting pumps and 16 grout pipes arranged in eight groups with standby lines, providing a total grouting capacity of 48 m3/h to meet the requirements of continuous on-site construction. The mix proportions of the shield tail grouting slurry adopted on site are as follows: W/B = 0.74, B/S = 0.83, Ben/W = 0.15, and C/F = 1.63.
Most existing studies on grout mix optimization have relied on conventional atmospheric pressure tests, primarily evaluating strength, bleeding rate, and deformation properties [40,41]. These methods often fail to account for the complex in situ conditions, including confining pressure, drainage, and consolidation. To overcome these limitations, a specialized slurry buoyancy testing apparatus was developed in this study. Using project-specific grout mix proportions and site-representative soils, buoyancy evolution tests were conducted under controlled confining pressures corresponding to the actual stratigraphic conditions. The tests quantitatively measured buoyancy magnitude, dissipation rate, and duration. Laboratory results were subsequently compared and validated against field-measured segment uplift data from the project to establish the relationship between slurry buoyancy evolution and segment uplift behavior.
3. Results and Discussion
3.1. Influence of Slurry Mix Proportions on Buoyancy Performance Through Basic Physical Properties
The performance test results of the 16 grout mixtures obtained from the orthogonal experiments on shield tail grouting mix proportions are presented in Table 3.
Table 3.
Basic performance indicators of grout mixtures.
Range analysis is a commonly used method for analyzing the results of orthogonal experiments. Calculating the range value R enables the evaluation of the influence degree of different grout mix proportion parameters on grout performance. The procedure for range analysis is as follows: (1) calculate the sum Ki of each factor at each level; (2) compute the average value Ki for each level of the factors; (3) determine the range R for each factor column, where R = max(Ki) − min(Ki); and (4) rank the factors according to the magnitude of R, with a larger R indicating a greater influence of the factor level variation on the experimental results and a higher contribution to the response.
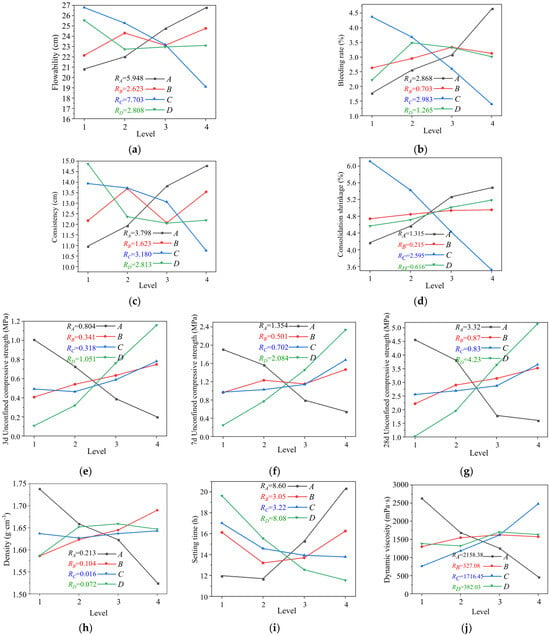
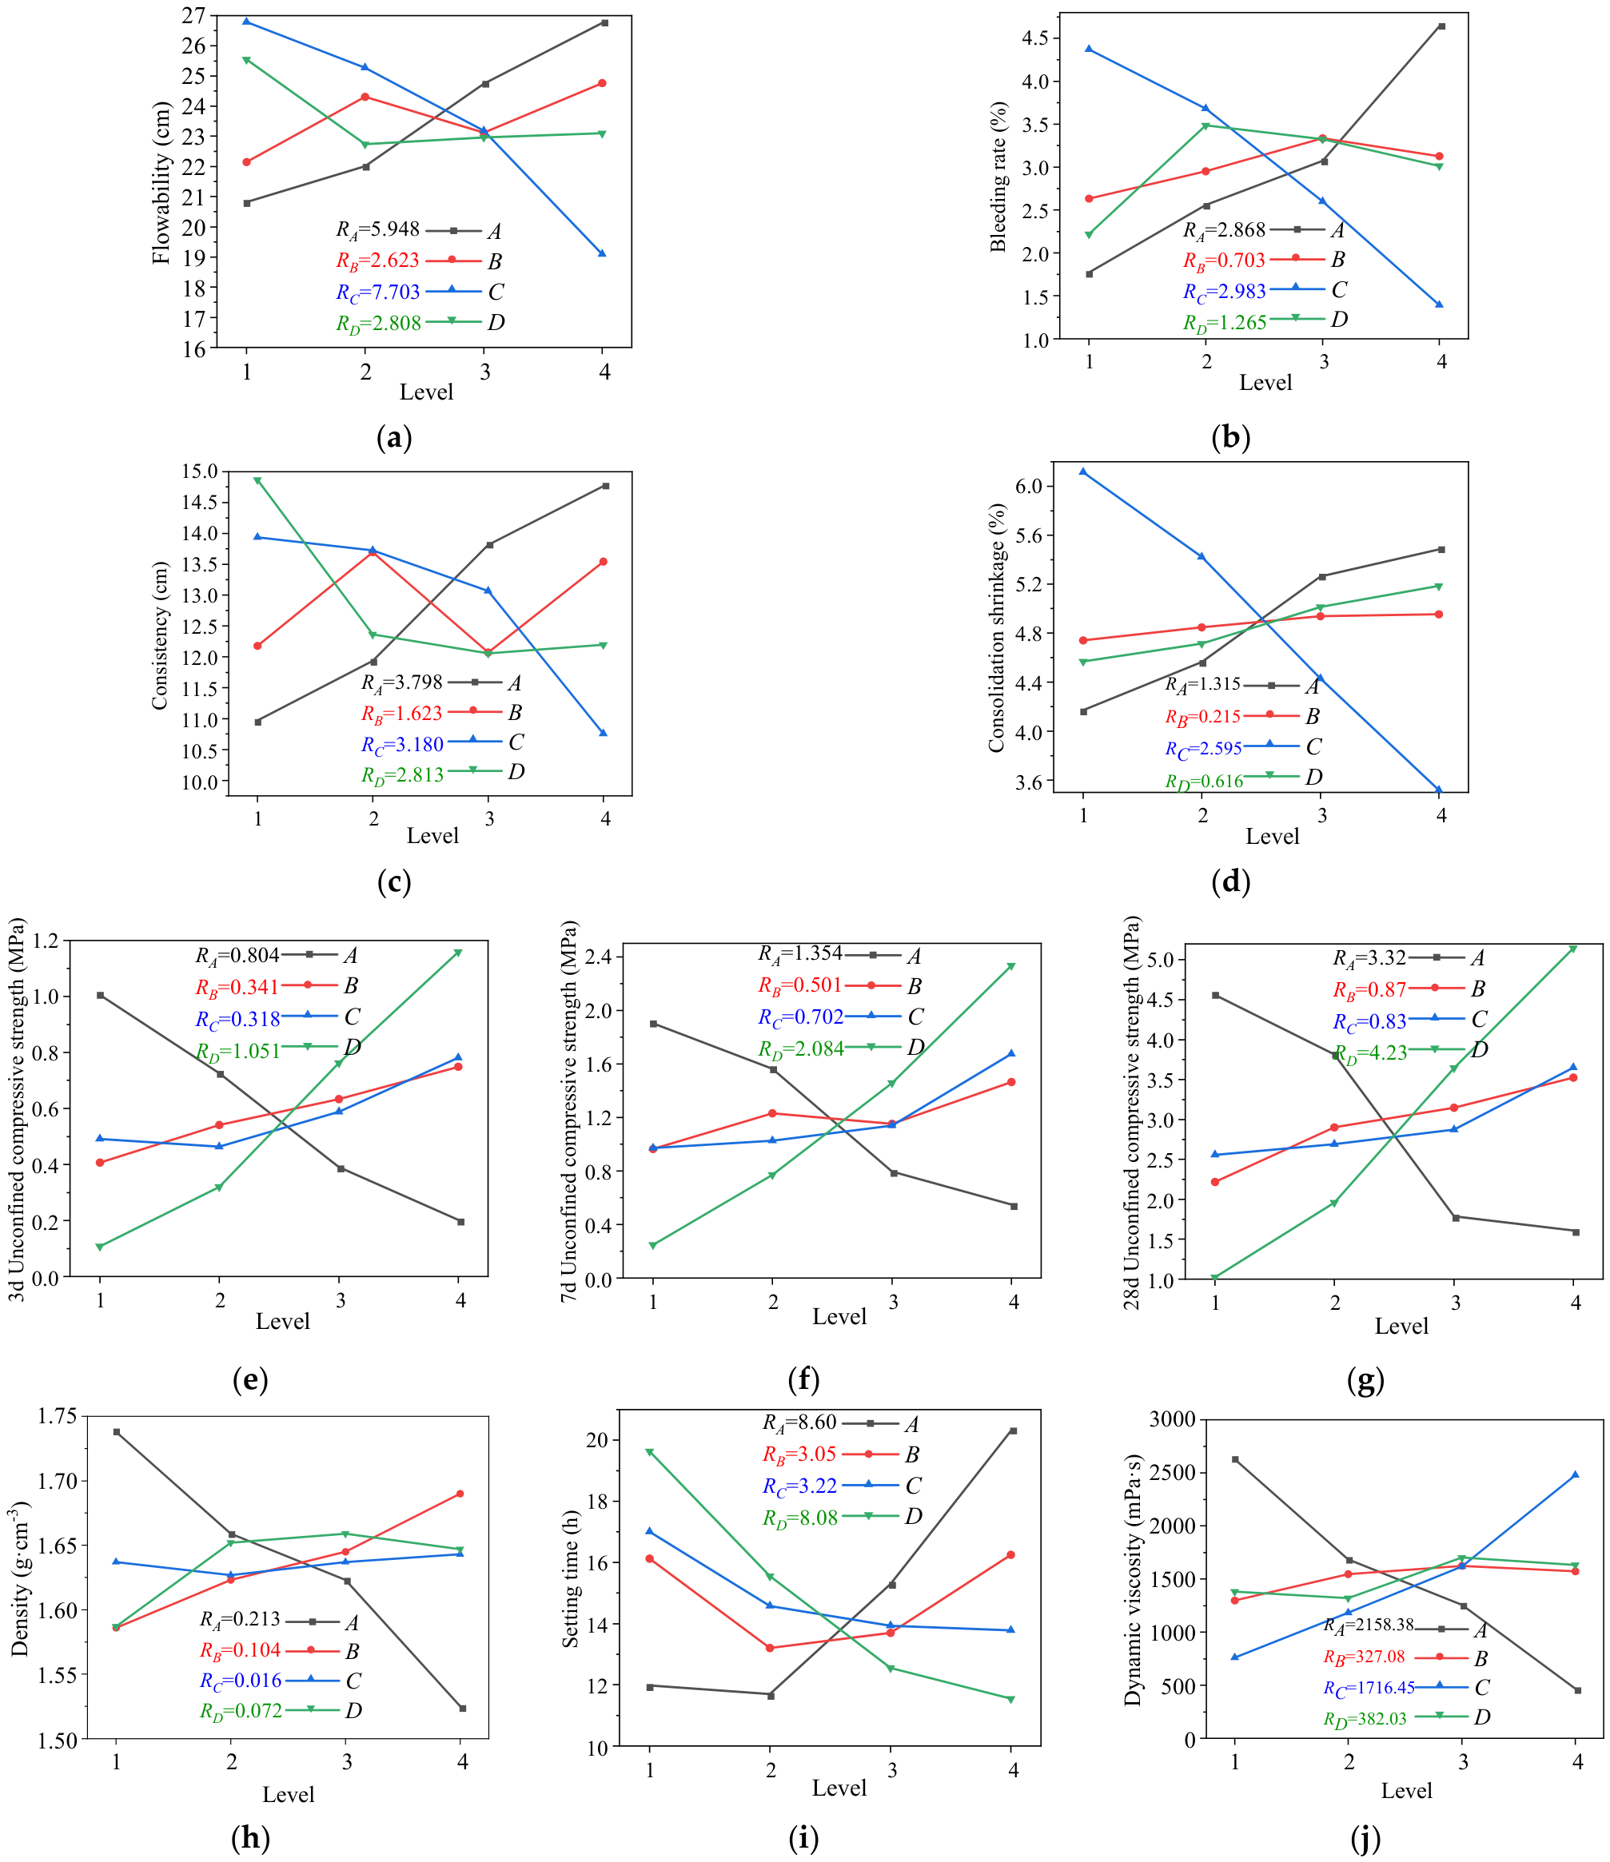
Based on the grout performance indices measured in the laboratory tests, range analysis was performed on the orthogonal experimental results using the above method. The range values R for the influencing factors of each performance index were obtained, and the range diagrams illustrating the influence degree of each factor on grout performance were subsequently plotted, as shown in Figure 5.
Figure 5.
Range analysis of basic grout properties: (a) flowability; (b) bleeding rate; (c) consistency; (d) consolidation shrinkage; (e) 3 d compressive strength; (f) 7 d compressive strength; (g) 28 d compressive strength; (h) density; (i) setting time; (j) dynamic viscosity.
As shown in the figures, the influence of different mix proportion parameters on the basic properties of the grout is presented. To elucidate the relationship between the basic properties of shield tail grouting slurry and its buoyancy characteristics, this study focused on three core indicators: apparent density, setting time, and dynamic viscosity. Specifically, apparent density directly determines the magnitude of the initial static buoyancy of the grout, and a lower density can effectively reduce the initial uplift force acting on the tunnel segments from the source [42]. Setting time governs the duration of the high-risk window during which the segments are exposed to significant uplift forces, with a shorter setting time enabling the grout to develop structural strength more rapidly and thereby restricting segment displacement [43,44]. Dynamic viscosity reflects the viscous resistance of the fluid grout to segment movement, where higher dynamic viscosity can significantly impede segment uplift and delay the floating process [45,46]. These three indicators are interrelated yet play distinct roles, collectively forming the core basis for evaluating and optimizing the anti-floating performance of grouts.
As shown in the range analysis diagrams, the water-to-binder ratio (A) is the most dominant factor affecting the anti-floating performance of the grout. Specifically, the apparent density is primarily controlled by the water-to-binder ratio; an increase in this ratio results in a higher free water content within the grout, leading to a significant reduction in apparent density and thereby directly decreasing the initial static buoyancy. Similarly, the setting time is also dominated by the water-to-binder ratio; a higher ratio prolongs the grout setting time, which in turn extends the high-risk window during which the segments are subjected to substantial uplift forces. Dynamic viscosity, on the other hand, is influenced jointly by the water-to-binder ratio and the bentonite-to-water ratio; a lower water-to-binder ratio combined with a higher bentonite-to-water ratio can markedly increase the dynamic viscosity, thereby enhancing the viscous resistance of the fluid grout to segment movement and effectively delaying the uplift process [47]. In summary, the water-to-binder ratio plays a decisive role in the anti-floating performance of shield tail grouting slurry by simultaneously regulating the three core indicators: apparent density, setting time, and dynamic viscosity.
3.2. Mix Proportion Optimization of Shield Tail Grouting Slurry for Anti-Floating Performance
For the shield tail grouting slurry used in large-diameter shield tunnelling, optimization based on a single performance index cannot meet the requirements of field construction. It is necessary to comprehensively balance the interactions among multiple indicators. Only by selecting optimal parameter combinations to keep all performances within reasonable ranges can the slurry mix proportion satisfying engineering demands be determined.
The key indicators reflecting the buoyancy characteristics of slurry include apparent density, setting time and dynamic viscosity. These parameters are evidently mutually restricted with conventional performance indices such as fluidity, bleeding rate, consistency and compressive strength [48,49]. Since it is impractical to maximize all performance indicators simultaneously in engineering practice, a comprehensive balancing method is adopted to identify the optimal parameter combination according to local hydrogeological conditions and construction conditions so as to realize the dynamic optimization of slurry mix proportion.
The range analysis results are summarized in Table 4. The water-to-binder ratio is the dominant factor influencing the apparent density, dynamic viscosity, and setting time of the slurry. From the perspective of segment anti-floating, a lower apparent density is beneficial for reducing static buoyancy. However, an excessively low water-to-binder ratio significantly increases viscosity and reduces fluidity, impairing pumpability. After comprehensive evaluation, the optimal water-to-binder ratio was determined to be 0.75. The binder-to-sand ratio primarily affects apparent density and compressive strength. An excessively high ratio increases bleeding and decreases slurry stability; thus, it was set to 0.6. The bentonite-to-water ratio is the key factor controlling fluidity, bleeding rate, consolidation shrinkage, and dynamic viscosity. It was optimized to 0.2 after balancing all performance indices. The cement-to-fly ash ratio mainly governs setting time and compressive strength. An appropriate increase in this ratio shortens setting time and improves early strength, which is favorable for anti-floating control. Consequently, the cement-to-fly ash ratio was set to 0.6.
Table 4.
Range analysis of grout performance indicators.
The optimal mix proportion was determined through a comprehensive balancing approach, with a water-to-binder ratio of 0.75, binder-to-sand ratio of 0.6, bentonite-to-water ratio of 0.2, and cement-to-fly ash ratio of 0.6. This mix was designated as YH1. As shown in Table 5, in comparison with the 16 orthogonal mixes presented in Table 3, the optimized YH1 grout exhibits high dynamic viscosity, low apparent density, and rapid setting time, thereby demonstrating excellent anti-floating performance. Furthermore, YH1 also maintains moderate flowability, low bleeding rate, and minimal consolidation shrinkage, along with satisfactory mechanical properties. Overall, the optimized grout achieves a good balance among workability, stability, and strength, fully satisfying the anti-floating and construction requirements for shield tunnel engineering.
Table 5.
Performance results of optimized grout.
3.3. Characteristics of Time-Dependent Buoyancy Evolution of Grout
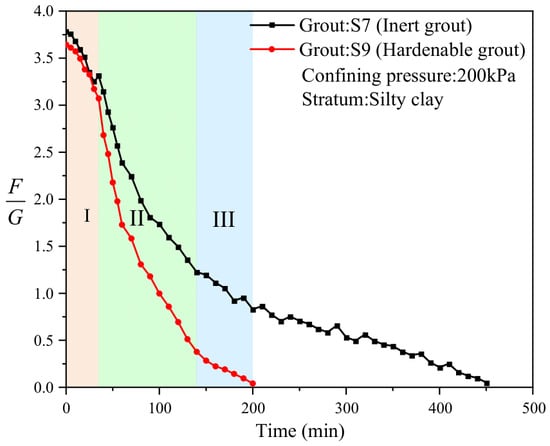
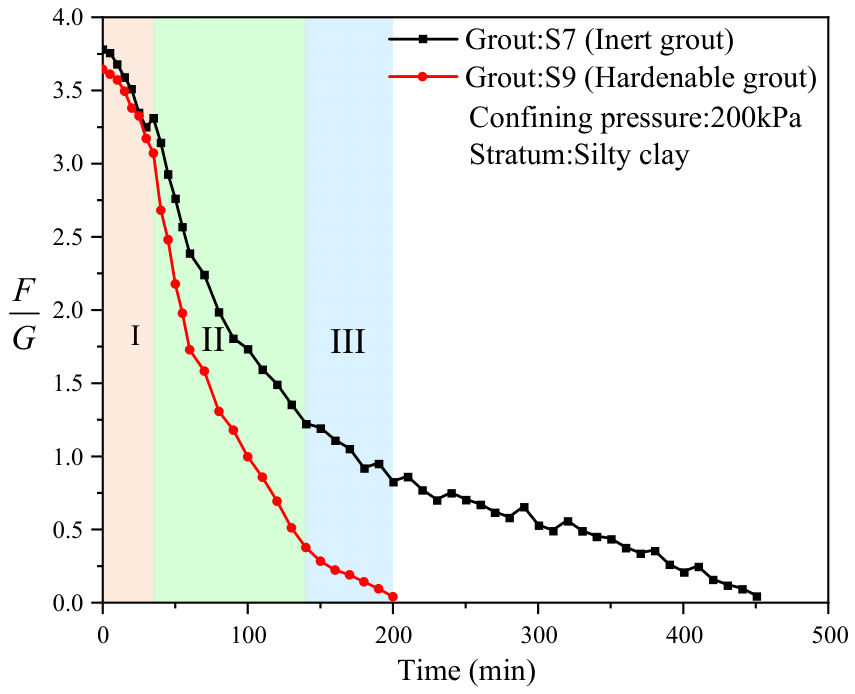
Conventional cement-based grout S9 and inert grout S7 were selected for comparative analysis. The time-dependent buoyancy curves obtained from tests in silty clay stratum under 200 kPa confining pressure are presented in Figure 6.
Figure 6.
Time-dependent buoyancy curves of grout. Note: The buoyancy decay process of conventional cement-based grout S9 is divided into three stages: (I) Initial Linear Dissipation Stage, (II) Rapid Decay Stage, and (III) Slow Stabilization Stage.
Based on the experimental observations of the time-dependent buoyancy curve for conventional cement-based shield tail grouting slurry S9 under confining pressure, the decay process can be systematically divided into three distinct stages.
- (1)
- Initial Linear Dissipation Stage (Stage I)
In this stage, the buoyancy decreases slowly with time. The grout remains in a highly fluid state after mixing, with dispersed internal particles and relatively low viscous resistance. The initial decay of buoyancy is primarily attributed to the early drainage of grout into the surrounding ground driven by confining pressure, as well as the slow increase in viscosity caused by early cement hydration. At this point, the grout has not yet developed significant structural strength. This stage essentially represents the preliminary combined effect of physical drainage and early hydration.
- (2)
- Rapid Decay Stage (Stage II)
In this stage, the buoyancy decreases sharply, representing the most significant change throughout the entire decay process. As the cement hydration reaction enters the acceleration period through the early deceleration period, hydration products continue to form and gradually interweave into a network structure. The internal structural strength of the grout develops progressively, leading to a marked increase in viscous resistance to the segments. Under the combined action of grout consolidation drainage and structural strength development, the buoyancy decays rapidly. In the later part of this stage, hydration products gradually clog the pore channels, reducing the drainage rate, while the hydration reaction rate also slows down, resulting in a corresponding deceleration of buoyancy decay [50].
- (3)
- Slow Stabilization Stage (Stage III)
In this stage, the residual buoyancy further decreases and eventually stabilizes near zero. This is mainly due to later-stage hydration shrinkage, pozzolanic reactions, and the expulsion of minor residual water. As the reaction proceeds, the internal structure of the grout becomes further densified. As both the reaction rate and drainage rate decrease significantly, the buoyancy change becomes gradual and ultimately approaches zero [51].
Unlike conventional cement-based grout S9, the buoyancy dissipation process of inert grout S7 exhibits only a single-stage characteristic, with its curve approximating a negative exponential decay. After applying confining pressure, free water in the grout rapidly seeps into the surrounding ground under the pressure gradient, causing a fast initial decline in buoyancy. As drainage continues, the particles gradually compact, reducing the void ratio and weakening the drainage driving force due to longer seepage paths and increased flow resistance. Consequently, the buoyancy declines exponentially and eventually approaches zero.
Comparison between the two grouts indicates that the three-stage decay pattern of conventional cement-based grout arises from the coupled effects of physical drainage and chemical solidification, in which the increase in viscous resistance and the formation of structural strength driven by cement hydration are the key factors triggering accelerated buoyancy dissipation. In contrast, due to the absence of cement, the buoyancy dissipation of inert grout is controlled solely by physical drainage and consolidation, presenting a typical single negative exponential decay pattern.
3.4. Buoyancy Evolution Laws of Grout Under Various Conditions
3.4.1. Buoyancy Evolution Under Different Confining Pressures
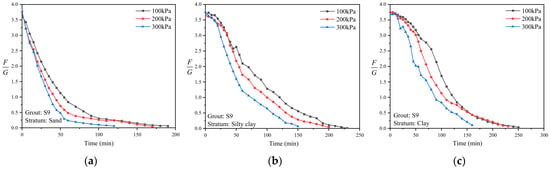
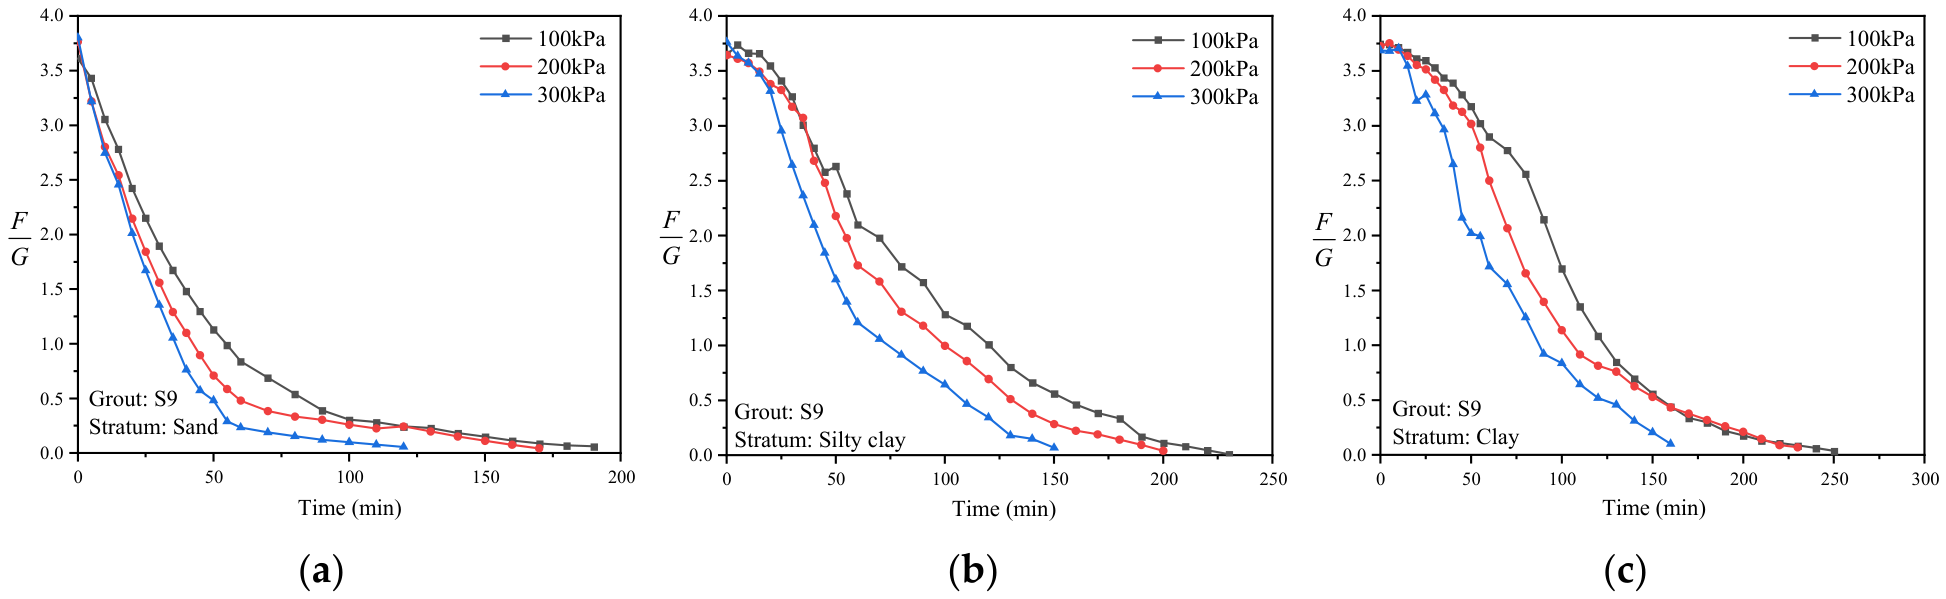
Confining pressure is a key external factor influencing the buoyancy dissipation process of the grout. To reveal the buoyancy evolution characteristics under different confining pressures, conventional grout S9 was selected as the research object. Experiments were conducted in three types of strata (silty sand, silty clay, and clay) under confining pressures of 100 kPa, 200 kPa, and 300 kPa, respectively. The corresponding time-dependent buoyancy curves are shown in Figure 7.
Figure 7.
Buoyancy evolution curves under different confining pressures: (a) sand; (b) silty clay; (c) clay.
Under the same stratum conditions, higher confining pressure accelerates buoyancy dissipation. Taking the complete buoyancy dissipation time as the evaluation index, the dissipation time under 300 kPa confining pressure is 25–50% shorter than that under 100 kPa. In addition, higher confining pressure leads to lower residual buoyancy in the final stabilization stage. This phenomenon is attributed to the dual effects of confining pressure, which accelerates both physical drainage and consolidation as well as cement hydration. It is noteworthy that the accelerating effect of confining pressure varies across different strata. In high-permeability sandy strata, drainage channels are unobstructed, resulting in a more pronounced acceleration effect. In low-permeability clayey strata, however, the acceleration is relatively limited due to a restricted drainage capacity, although a clear trend of reduced dissipation time is still observed.
3.4.2. Buoyancy Evolution Under Different Stratum Conditions
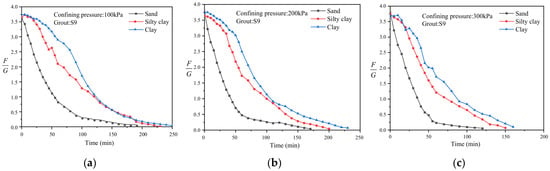
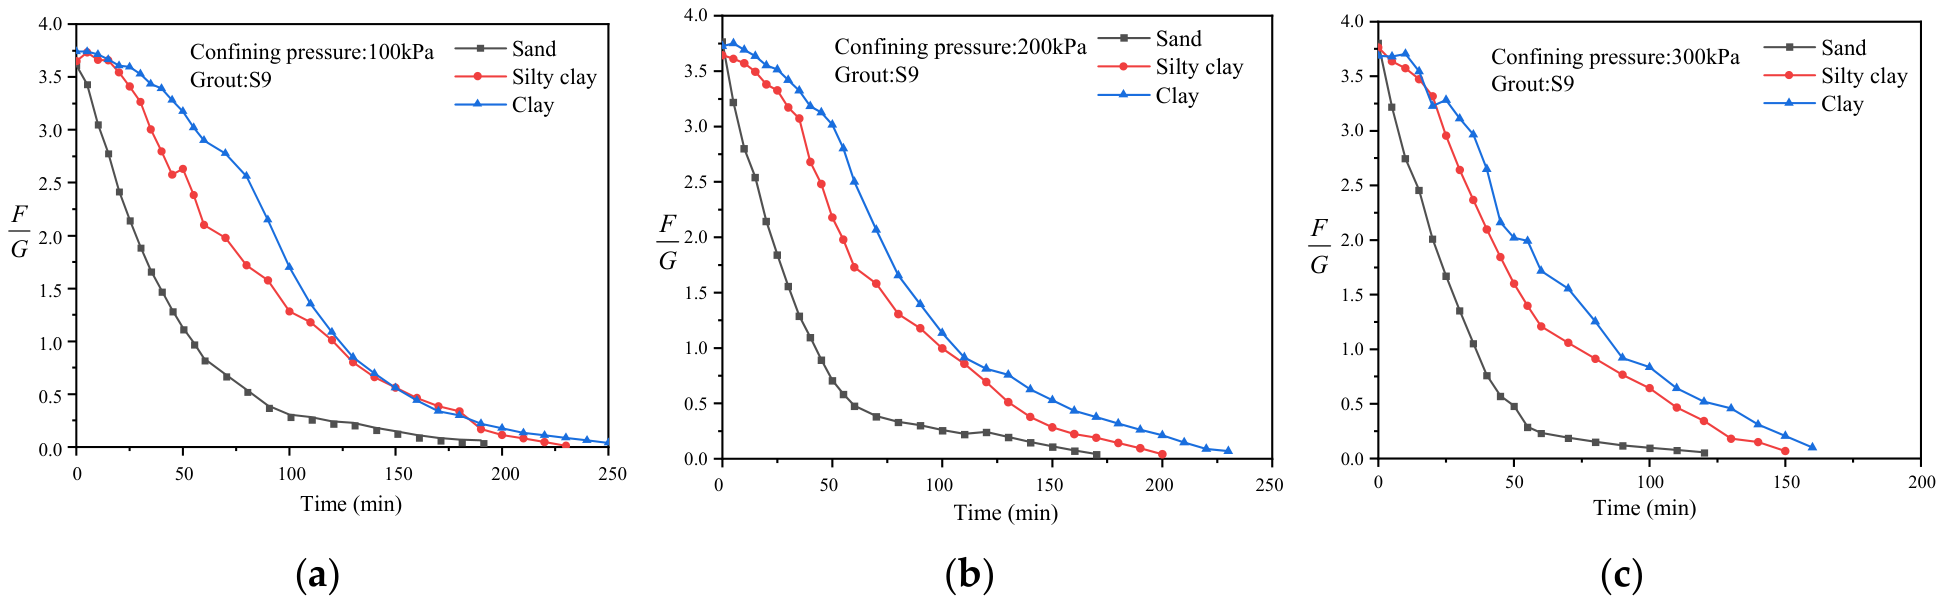
Stratum condition represents another key external factor governing the buoyancy dissipation process of the grout. Using conventional cement-based grout S9 as the test material, time-dependent buoyancy tests were conducted under identical confining pressure conditions across three representative strata: sandy soil, silty clay, and clay. The resulting buoyancy evolution curves under different stratum conditions are shown in Figure 8.
Figure 8.
Buoyancy evolution curves under different stratum conditions: (a) 100 kPa; (b) 200 kPa; (c) 300 kPa.
Under the same confining pressure, buoyancy dissipation accelerates with increasing stratum permeability. When the time to complete buoyancy dissipation is taken as the evaluation criterion, the stabilization time in sandy soil is 44–60% shorter than that in clay. Furthermore, the residual buoyancy in the stabilization phase is markedly lower in high-permeability strata compared to low-permeability strata. This can be attributed to the more effective drainage pathways provided by high-permeability strata, which significantly accelerate the physical drainage and consolidation process, leading to more rapid and thorough buoyancy dissipation.
Further examination indicates that stratum permeability substantially influences the boundaries and morphological characteristics of each buoyancy dissipation stage. In low-permeability clay strata, the three stages are clearly delineated with distinct transition points. In contrast, in high-permeability sandy strata, the boundary between the initial linear dissipation stage and the rapid decay stage becomes blurred. This occurs because rapid drainage takes place at an early stage, resulting in a substantial reduction in buoyancy, followed by a swift transition to the chemically dominated solidification stage. Moreover, the evolution mechanism of the third stage in sandy strata differs markedly from that in clay strata. Due to rapid initial drainage, some cement particles may remain partially hydrated. Consequently, the third stage involves a prolonged combined process of physical drainage and continued cement hydration, which is distinctly different from the mechanism observed in clay strata. The synergistic effect of these mechanisms enables the buoyancy in the third stage to decay rapidly to near zero in sandy strata.
3.4.3. Buoyancy Evolution Under Different Mix Proportions
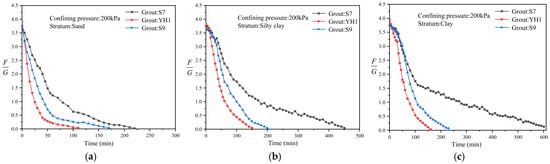
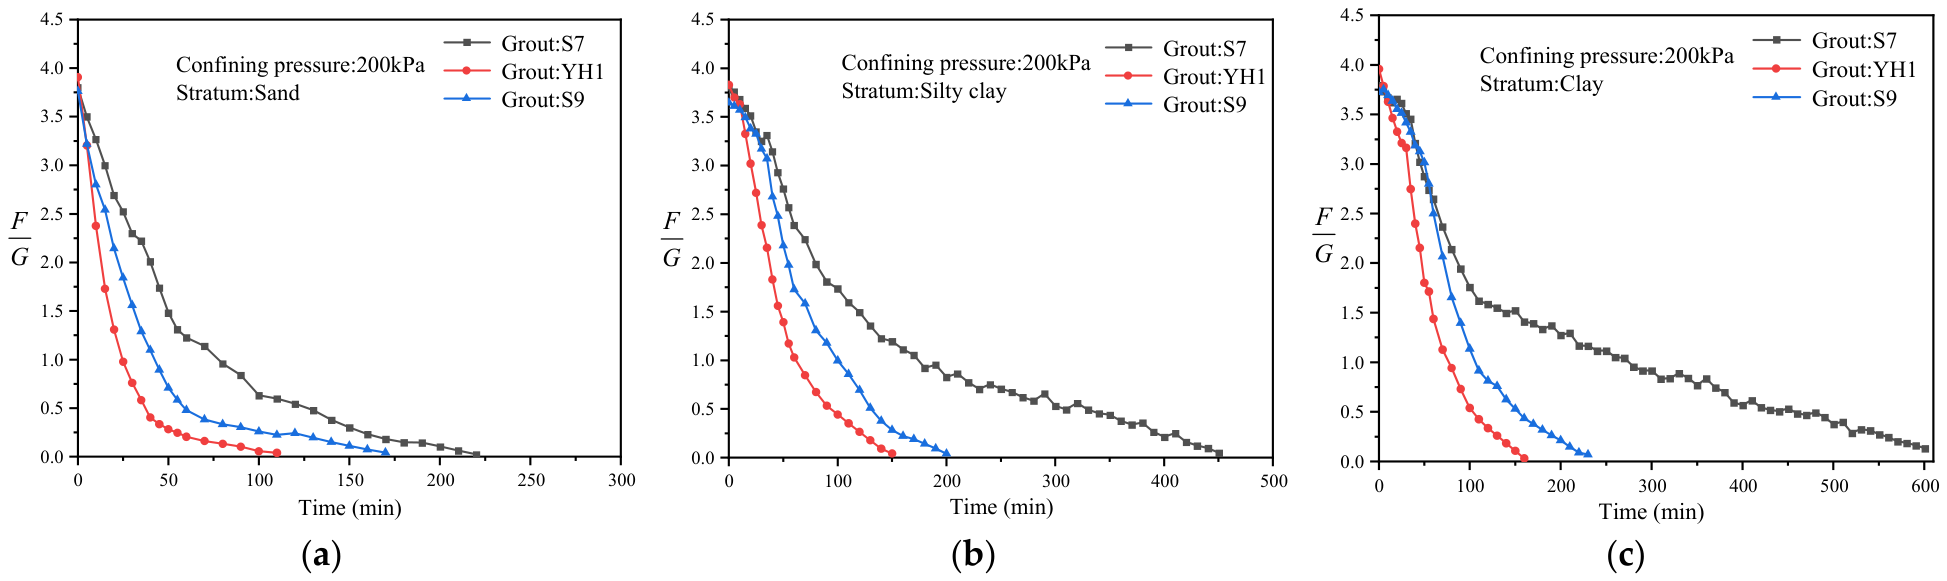
Grout mix proportion is a critical factor influencing the buoyancy dissipation of the grout. To investigate the effect of mix proportion on buoyancy evolution characteristics, a comparative analysis was conducted on the time-dependent buoyancy curves of inert grout S7, conventional cement-based grout S9, and optimized grout YH1 under a confining pressure of 200 kPa. The test results are presented in Figure 9.
Figure 9.
Buoyancy evolution curves under different grout mix ratios: (a) sand; (b) silty clay; (c) clay.
Under the same stratum and confining pressure conditions, the buoyancy evolution of inert grout S7 differs significantly from that of conventional grout S9. Due to the absence of cement, S7 has a lower density and thus a lower initial buoyancy. Although free water is rapidly expelled under confining pressure, leading to a fast initial buoyancy decline, the lack of chemical hydration causes the later consolidation to rely solely on physical drainage. As a result, the release of residual buoyancy becomes extremely slow, with the time required for complete dissipation of effective buoyancy being 60% to 280% longer than that of conventional grout S9. In contrast, the optimized grout YH1 demonstrates superior performance, shortening the time to complete buoyancy dissipation and stabilization by 20% to 35% compared with conventional grout S9, primarily by accelerating cement hydration and enabling earlier development of viscous resistance.
3.5. Field Application and Validation
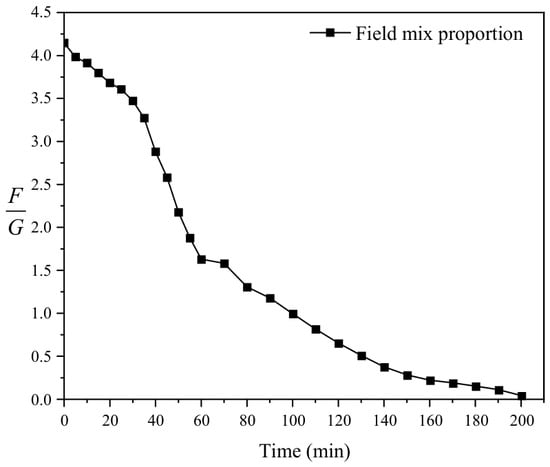
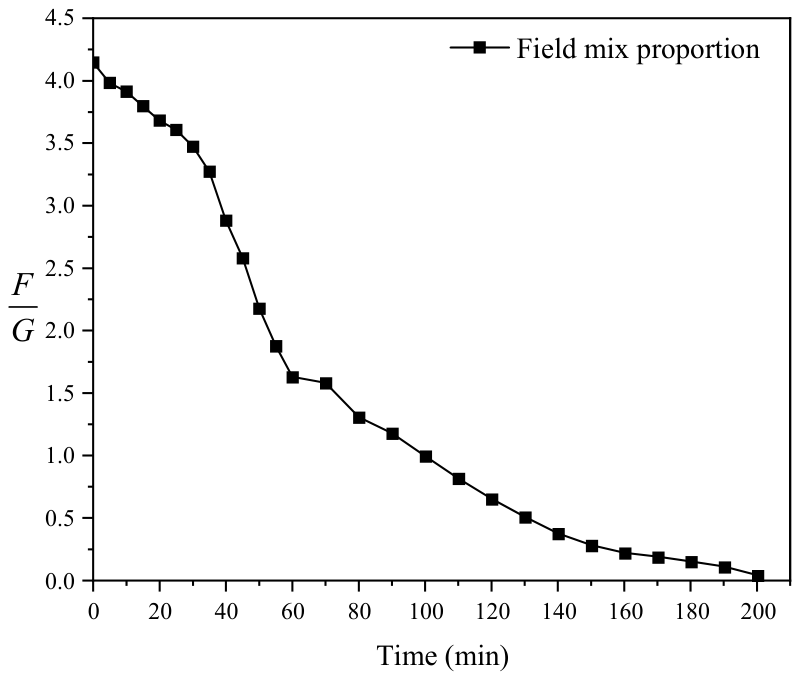
The tunnel mainly passes through interbedded strata of silty sand and silty clay. To verify the anti-floating performance of the field grout mix proportion, in situ soil samples were collected and tested under simulated confining pressure conditions using the self-developed grout buoyancy testing apparatus. Figure 10 shows the buoyancy evolution curve of the field grout under actual confining pressure.
Figure 10.
On-site grout buoyancy evolution diagram.
The test results indicate that the field grout exhibits excellent buoyancy dissipation performance with a rapid decay rate, achieving complete buoyancy dissipation within 200 min. This characteristic significantly shortens the duration of the uplift load acting on the segments, facilitates rapid convergence of the tunnel structure posture, and effectively controls uplift deformation in large-diameter shield tunnels. To further validate the practical performance of the grout, comprehensive segment uplift monitoring was carried out during construction.
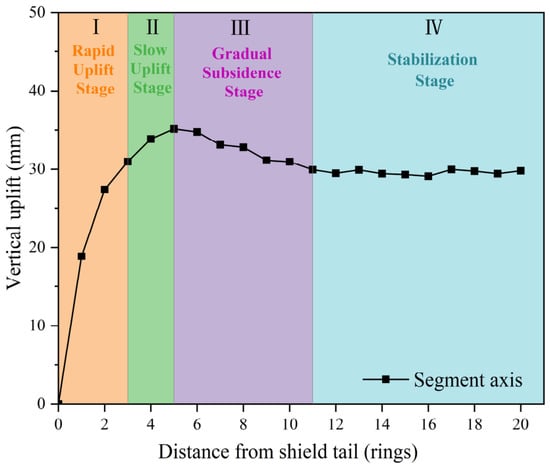
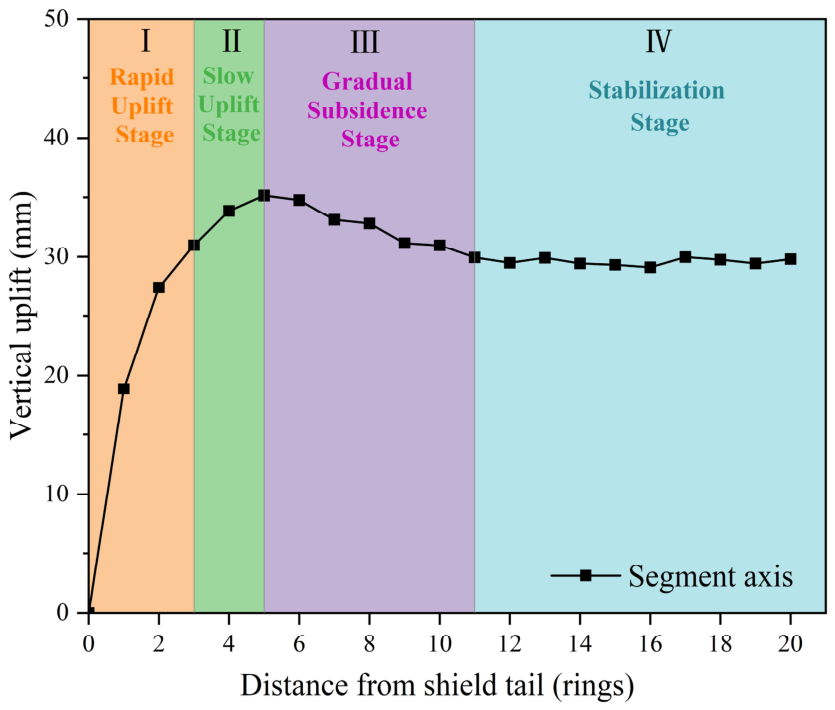
The 196th ring was selected as a representative sample for analysis. The entire uplift process of a single ring can be divided into four stages: rapid uplift, slow uplift, gradual subsidence, and stabilization, as shown in Figure 11.
Figure 11.
Measured uplift trend of the 196th ring segment.
- (1)
- Rapid Uplift Stage
After emerging from the shield tail, the segments experienced rapid uplift. The uplift of the first ring reached 18.87 mm, accounting for 53.67% of the final stable uplift. The cumulative uplift increased to 27.40 mm (77.92%) at the second ring and 30.98 mm (88.11%) at the third ring. This stage was primarily driven by grout buoyancy. Immediately after leaving the shield tail, the surrounding grout has not yet solidified and continues to exert significant vertical buoyant force. Combined with the upward additional load from grouting pressure, these forces overcome the segment self-weight and inter-ring frictional resistance, resulting in substantial uplift. As the grout gradually gels and buoyancy decays, the incremental uplift decreases ring by ring until the buoyant force dissipates completely.
- (2)
- Slow Uplift Stage
At the fourth ring, the cumulative uplift reached 33.88 mm (96.13% of the final value). The maximum uplift of 35.16 mm occurred at the fifth ring. At this point, the grout buoyancy had fully dissipated, eliminating the driving force for further uplift. However, due to shear force transfer from the uplift of the preceding rings and the relatively low early strength of the grout, minor additional uplift still occurred between the fourth and fifth rings. This stage is characterized by slow uplift, during which the segment uplift reaches its peak value.
- (3)
- Gradual Subsidence Stage
As shield advancement continued, the segments from the fifth to eleventh rings transitioned from uplift to gradual subsidence. By this stage, the grout behind the lining had fully solidified, completely eliminating the uplift driving force. The self-weight of the segments became the dominant load, while the reverse shear forces induced by the earlier uplift further promoted subsidence. During subsidence, the segments compressed the surrounding ground, increasing passive earth pressure and progressively constraining vertical displacement, thereby slowing the subsidence rate.
- (4)
- Stabilization Stage
After the eleventh ring behind the shield tail, the grout strength was fully developed, and the segments moved away from the active construction disturbance zone. The integrated “segment–grout–soil” composite structure was formed, and the ground constraint reached its maximum. Consequently, the vertical displacement of the segments stabilized with negligible further change.
The laboratory buoyancy tests were conducted using homogeneous soil specimens, whereas the actual tunnel alignment passes through multiple strata with distinctly different properties, resulting in significant spatial variability in soil parameters and permeability. Such geological heterogeneity can substantially influence the development of tunnel deformation [52]. Therefore, when applying the laboratory results to engineering practice, the limitation that soil spatial variability was not considered must be fully acknowledged. Accordingly, systematic and comprehensive field monitoring of segment uplift was implemented throughout the entire construction process.
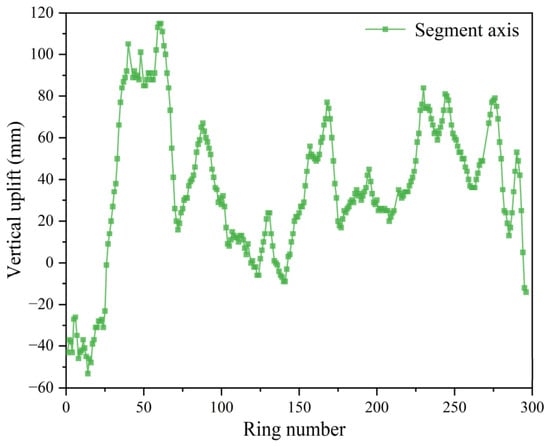
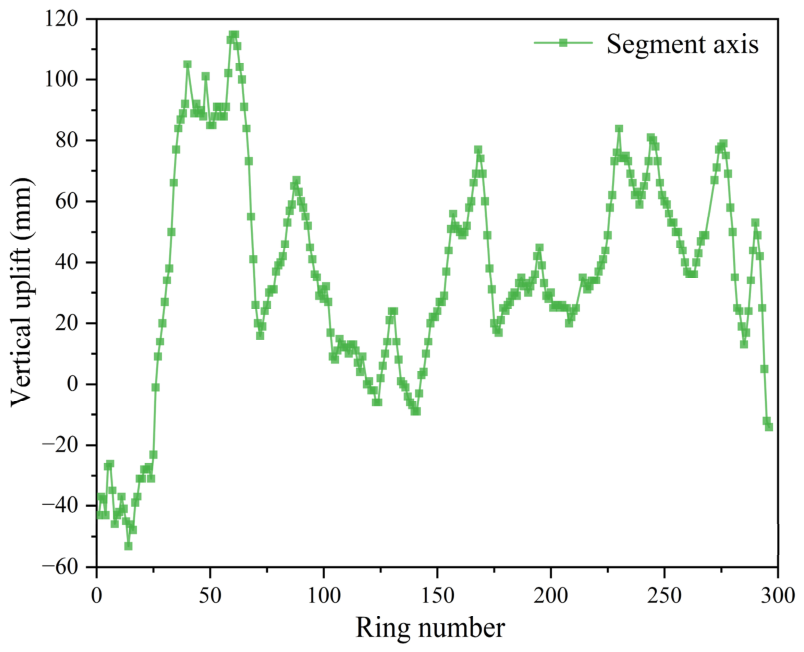
As shown in Figure 12, field monitoring data indicate that the on-site grout mix proportion effectively controlled the vertical displacement of the segments, with no continuous uplift observed. Due to ground disturbance and the early-stage mechanical properties of the grout, segment uplift in the shield launch section reached its peak value. Once normal excavation commenced, the displacement decreased rapidly and gradually stabilized. The overall tunnel lining alignment satisfied the specification requirements, and no segment dislocation or structural damage was observed on site, demonstrating that the adopted mix proportion meets the practical requirements of engineering applications.
Figure 12.
Segment floating displacement of the tunnel.
Although the present analysis is largely qualitative due to the limited dataset from a single project, the monitoring results reveal a clear temporal correlation between grout buoyancy dissipation and segment uplift. Approximately 90% of the total uplift deformation occurred while grout buoyancy remained active. This finding suggests that controlling both the magnitude and duration of slurry buoyancy is critical for limiting segment uplift. The relatively low buoyancy generated by the on-site mix resulted in a small overall segment uplift. These observations validate the reliability of the predictions obtained from the self-developed testing apparatus. To establish a quantitative relationship between grout buoyancy dissipation and segment uplift, future studies should collect field data from multiple projects and develop corresponding predictive models.
Overall, the total segment uplift is positively correlated with the buoyancy of the grout. Uplift deformation primarily occurs during the persistence period of grout buoyancy. In engineering practice, selecting shield tail grouting materials with short initial setting times and high early strength can effectively prevent and control segment uplift problems. The YH1 mixture optimized in this study demonstrated excellent buoyancy resistance in indoor confining pressure tests and shows good potential for engineering applications. Future research could involve conducting field application tests of YH1 in actual shield tunnel projects to verify its buoyancy resistance under real-world conditions.
4. Conclusions
This study addresses segment uplift control in large-diameter shield tunnels through buoyancy regulation of synchronous grouting slurry. A novel testing apparatus capable of simulating in situ confining pressures was developed to investigate the time-dependent buoyancy dissipation behavior of grouts. By integrating laboratory experiments with field monitoring from the Yangcheng West Lake Third Channel project, the following main conclusions are drawn:
- (1)
- The apparent density, dynamic viscosity, and setting time were identified as the key indicators for slurry anti-floating performance. Through orthogonal testing and comprehensive optimization, an improved mix YH1 (W/B = 0.75, B/S = 0.6, Ben/W = 0.2, C/F = 0.6) was developed, which effectively balances workability and anti-floating performance.
- (2)
- A novel scaled buoyancy testing apparatus was established to simulate realistic formation confining pressures. Experimental results revealed that cement-based grouts exhibit a distinct three-stage buoyancy dissipation pattern (initial linear dissipation, rapid decay, and slow stabilization) due to the coupled effects of physical drainage and cement hydration, whereas inert grouts follow a single exponential decay. Confining pressure, stratum permeability, and mix proportion were identified as the primary factors controlling buoyancy evolution.
- (3)
- Field monitoring showed that the segment uplift process can be divided into four stages, with most deformation occurring during the buoyancy persistence period. This study qualitatively analyzed the relationship between slurry buoyancy dissipation and segment uplift development, providing a reference for evaluating and optimizing grout anti-floating performance in engineering practice. By effectively controlling segment uplift, the optimized grouting strategy helps reduce structural defects, extend the service life of tunnels, and lower long-term maintenance costs, thereby contributing to the construction of more resilient and sustainable urban underground infrastructure.
Author Contributions
Conceptualization, X.Z., W.L. and J.L.; methodology, X.Z. and W.L.; validation, X.Z. and Q.Y.; formal analysis, X.Z. and J.L.; data curation, X.Z. and Q.Y.; writing—original draft preparation, X.Z.; writing—review and editing, X.Z. and Q.Y.; supervision, X.Z., W.L. and J.L.; project administration, W.L.; funding acquisition, W.L. All authors have read and agreed to the published version of the manuscript.
Funding
This study was financed and jointly supported by (1) The National Natural Science Foundation of China (No. 52508399) and (2) the Natural Science Foundation of Jiangsu Province (No. BK20231318).
Institutional Review Board Statement
Not applicable.
Informed Consent Statement
Not applicable.
Data Availability Statement
The original contributions presented in this study are included in the article. Further inquiries can be directed to the corresponding author.
Acknowledgments
We would like to express our gratitude to all those who have provided support. Their assistance has been invaluable.
Conflicts of Interest
The authors declare no conflicts of interest.
References
- Yu, P.; Liu, H.; Wang, Z.; Fu, J.; Zhang, H.; Wang, J.; Yang, Q. Development of urban underground space in coastal cities in China: A review. Deep Undergr. Sci. Eng. 2023, 2, 148–172. [Google Scholar] [CrossRef] [Scilit]
- Broere, W. Urban underground space: Solving the problems of today’s cities. Tunn. Undergr. Space Technol. 2016, 55, 245–248. [Google Scholar] [CrossRef] [Scilit]
- Qiu, W.; Dong, X.; Su, L.; Xue, X.; Zhang, K. Development and consideration of Chinese super-large diameter shield tunnel. Arch. Civ. Eng. 2024, 70, 473–486. [Google Scholar] [CrossRef] [Scilit]
- Zlatanic, S.; Wongkaew, M.; Jiang, Y.; Bauer, A.; Hetu, P. Large-Diameter Tunnels–An Emerging Urban Transportation Solution. GeoStrata Mag. Arch. 2022, 26, 24–31. [Google Scholar]
- Li, Y.; Zou, Z. Numerical investigation on the influence of super-large-diameter shield tunneling on nearby existing metro tunnels and the protection scheme. Appl. Sci. 2023, 13, 13179. [Google Scholar]
- Zeng, Y.; Njock, P.G.A.; Xiong, W.; Zhang, X.L.; Shen, S.L. Risks analysis of large diameter slurry shield tunneling in urban area. Undergr. Space 2023, 13, 281–300. [Google Scholar] [CrossRef] [Scilit]
- Hu, M.; Sun, J.; Wu, B.; Wu, H.; Xu, Z. Shield tunnel (Segment) uplift prediction and control based on interpretable machine learning. Sustainability 2024, 16, 910. [Google Scholar] [CrossRef] [Scilit]
- Wu, H.N.; Xu, X.P.; Chen, R.P.; Liu, Y.; Cheng, H.Z.; Xiao, C. Observed uplift behaviors of segmental lining during shield tunneling in hard rock: A case study from Changsha, China. Tunn. Undergr. Space Technol. 2024, 150, 105816. [Google Scholar] [CrossRef] [Scilit]
- He, Y.; Zhao, D.; Xu, J.; Zhang, Q.; Liu, R.; Li, W.; Bai, J. Monitoring of segmental lining uplift and synchronous grouting control during shield tunnel construction using point-cloud data. Autom. Constr. 2026, 185, 106870. [Google Scholar] [CrossRef] [Scilit]
- Guo, J.; Li, Z.; Liu, J.; Wu, S.; Li, H.; Shi, S.; Ye, Q.; Wang, X. Analysis of segment uplift during shield tunnel construction considering stratum seepage effects. Sci. Rep. 2026, 16, 14501. [Google Scholar] [CrossRef] [Scilit] [PubMed]
- Ma, L.; Xue, C.; Yang, H.; Mo, Y. Longitudinal analysis model for segment lining uplift during shield tunnelling considering shearing dislocation of circumferential joints. Appl. Math. Model. 2024, 132, 298–318. [Google Scholar] [CrossRef] [Scilit]
- Wu, H.; Shen, S.L.; Zhou, A. Risk assessment of tunnel segment uplift during construction based on variable weight-cloud model. Reliab. Eng. Syst. Saf. 2025, 1, 111503. [Google Scholar]
- Koizumi, A.; Murakami, H.; Ishida, T. Design method of segments at a sharply curved section. J. Jpn. Soc. Civ. Eng. 1992, 448, 111–120. [Google Scholar] [CrossRef] [Scilit]
- Xiao, M.; Feng, K.; Zhang, Y.; Zhou, Z. Analysis of segment dislocation caused by grout buoyancy during synchronous grouting of shield tunnels. Tunn. Constr. 2021, 41, 2048–2057. [Google Scholar]
- Chen, R.; Meng, F.; Ye, Y.; Liu, Y. Numerical simulation of the uplift behavior of shield tunnel during construction stage. Soils Found. 2018, 58, 370–381. [Google Scholar] [CrossRef] [Scilit]
- Wang, J.; Feng, K.; Wang, Y.; Lin, G.; He, C. Soil disturbance induced by EPB shield tunnelling in multilayered ground with soft sand lying on hard rock: A model test and DEM study. Tunn. Undergr. Space Technol. 2022, 130, 104738. [Google Scholar] [CrossRef] [Scilit]
- Cheng, W.C.; Song, Z.P.; Tian, W.; Wang, Z.F. Shield tunnel uplift and deformation characterization: A case study from Zhengzhou metro. Tunn. Undergr. Space Technol. 2018, 79, 83–95. [Google Scholar]
- Geng, D.X.; Hu, Y.C.; Jiang, Y.L. Modified Calculation Model for Segment Floating in Slurry Shield Tunnel. J. Perform. Constr. Facil. 2021, 35, 5. [Google Scholar] [CrossRef] [Scilit]
- Yuan, J.; Wang, D.; Wang, D. Study on Rising Displacement of Segment of Shield Tunnel in Soft Soils. Appl. Mech. Mater. 2014, 501–504, 1684–1687. [Google Scholar] [CrossRef] [Scilit]
- Zhang, R.L.; Tang, L.M.; Tang, K. Analysis on segment floating in the construction of large-diameter crossing-river shield tunnel. Appl. Mech. Mater. 2015, 724, 17–21. [Google Scholar]
- Han, X.; Oreste, P.; Ye, F. The buoyancy of the tunnel segmental lining in the surrounding filling material and its effects on the concrete stress state. Geotech. Geol. Eng. 2023, 41, 741–758. [Google Scholar]
- Zhou, Y.; Liu, G.; Jin, J.; Huang, Q.; Ye, R.; Ji, Y. Calculation of shield tunnel uplift induced by synchronous grouting. Sci. Rep. 2025, 15, 39982. [Google Scholar] [CrossRef] [Scilit] [PubMed]
- Lin, W.J.; Zhang, M.X.; Xiao, X.C.; Wu, H.M.; Jia, W.R. Analysis on floating mechanism of large-diameter shield tunnel segments considering the viscosity characteristics of slurry. J. China Foreign Highw. 2019, 39, 164–169. [Google Scholar]
- Zhong, X.C.; Huang, S.Y.; Hum, R.G.; Zhu, C.; Hu, Y.K.; Chen, X.Q. Longitudinal uplift characteristics of segments of shield tunnels based on buoyancy of grouting. Rock Soil Mech. 2023, 44, 1615–1624. [Google Scholar]
- Shi, Z.; Bu, X.; Zeng, K.; Xie, X.; Zeng, H. Optimization study for cement-based grout mixture ratio of shield tunnel considering spatiotemporal evolution of grout buoyancy. Constr. Build. Mater. 2024, 442, 137600. [Google Scholar] [CrossRef] [Scilit]
- Wang, X.; Wang, S.; Lin, Z.; Zhong, M.; Chen, P.; Chen, J. Calculation Model and Verification of Shield Tunnel Segment Flotation Based on Grout Buoyancy Dissipation Characteristics. Chin. J. Geotech. Eng. 2025, 48, 147–156. [Google Scholar]
- GB 175-2023; Common Portland Cement. China Standards Press: Beijing, China, 2023.
- GB/T 1596-2017; Fly Ash Used in Cement, Mortar and Concrete. China Standards Press: Beijing, China, 2017.
- GB/T 20973-2020; Bentonite. China Standards Press: Beijing, China, 2020.
- GB/T 14684-2022; Sand for Construction. China Standards Press: Beijing, China, 2022.
- Yao, W.; Sheng, J.; Tian, J.; Wei, B.; Sun, J.; Wang, Z. Buoyancy Characteristics of Synchronous Grouting Slurry in Shield Tunnels. Appl. Sci. 2025, 15, 8994. [Google Scholar] [CrossRef] [Scilit]
- Wang, H.; Qin, W.; Ding, W.; Wang, C.; Yu, W.; Wang, Z. Research on the antifloating performance of grouts with different mix proportions in synchronous grouting of shield tunnels: From laboratory tests to theoretical calculations. Int. J. Geomech. 2024, 24, 04023279. [Google Scholar] [CrossRef] [Scilit]
- JGJ/T 70-2009; Standard for Test Method of Basic Properties of Construction Mortar. China Architecture & Building Press: Beijing, China, 2009.
- GB/T 50080-2016; Standard for Test Method of Performance on Ordinary Fresh Concrete. China Architecture & Building Press: Beijing, China, 2016.
- Li, P.N.; Zhu, H.H.; Li, X.J. Two stage compound diffusion mechanism and pressure space-time distribution mode of synchronous grouting for large cross-section special-shaped shield. China Civ. Eng. J. 2023, 56, 90–106. [Google Scholar]
- Liang, J.; Liu, W.; Yin, X.; Li, W.; Yang, Z.; Yang, J. Experimental study on the performance of shield tunnel tail grout in ground. Undergr. Space 2025, 20, 277–292. [Google Scholar] [CrossRef] [Scilit]
- Liang, J.; Liu, W.; Gong, J.; Chen, C.; Dong, X.; Fu, C. An Explainable Intelligent System for Multi-Performance Shield Tunnel Tail Grout Optimization. Comput. Aided Civ. Infrastruct. Eng. 2025, 40, 6165–6183. [Google Scholar]
- Shi, Z.; Xu, J.; Xie, X.; Zeng, H.; Xu, W.; Niu, G.; Xiao, Z. Disaster mechanism analysis for segments floating of large-diameter shield tunnel construction in the water-rich strata: A case study. Eng. Fail. Anal. 2024, 157, 107953. [Google Scholar]
- Mei, Y.; Luo, Z.; Jiang, H.; Gong, H.; Hou, Y.; Wang, X. Study on the floating law of metro segments in water-rich sandy silt and silty clay strata. KSCE J. Civ. Eng. 2022, 26, 2979–2991. [Google Scholar] [CrossRef] [Scilit]
- Zhou, H.; Zhang, Y.; Zhu, W.; Zhong, Q.; Huang, X. Optimisation of synchronous grouting mix ratio for shield tunnels. Appl. Sci. 2024, 14, 4098. [Google Scholar] [CrossRef] [Scilit]
- Wang, S.; Lin, Z.; Peng, X.; Wang, X.; Tu, G.; Song, Z. Research and evaluation on water-dispersion resistance of synchronous grouting slurry in shield tunnel. Tunn. Undergr. Space Technol. 2022, 129, 104679. [Google Scholar] [CrossRef] [Scilit]
- Zhang, D.M.; Huang, Z.K.; Yin, Z.Y.; Ran, L.Z.; Huang, H.W. Predicting the grouting effect on leakage-induced tunnels and ground response in saturated soils. Tunn. Undergr. Space Technol. 2017, 65, 76–90. [Google Scholar] [CrossRef] [Scilit]
- Duan, S.; Wu, Y.; Zhang, Q.; Liu, R.; Zhang, M.; Jiao, Y. Optimizing backfill grout to minimize shield tunnel segments uplift by considering time-dependent grout buoyancy. Phys. Fluids 2025, 37, 037161. [Google Scholar] [CrossRef] [Scilit]
- Hu, R.; Zhong, X.; Yi, B.; Liu, Z.; Liu, C. Study on floating of shield tail segment controlled by synchronous two-component grout in weathered rock strata. Chin. J. Undergr. Space Eng. 2024, 20, 2010–2019. [Google Scholar]
- Liang, Y.; Huang, X.; Gao, S.; Yin, Y. Study on the floating of large diameter underwater shield tunnel caused by synchronous grouting. Geofluids 2022, 2022, 2041924. [Google Scholar] [CrossRef] [Scilit]
- Liu, J.; Li, P.; Shi, L.; Fan, J.; Kou, X.; Huang, D. Spatial distribution model of the filling and diffusion pressure of synchronous grouting in a quasi-rectangular shield and its experimental verification. Undergr. Space 2021, 6, 650–664. [Google Scholar] [CrossRef] [Scilit]
- Fu, Y.; Mei, C.; Chen, X.; Li, W.; Yu, B.; Li, X.; Wang, B.; Wang, S. The time-dependent grout buoyancy behavior based on cement hydration mechanism. Cem. Concr. Res. 2023, 166, 107100. [Google Scholar] [CrossRef] [Scilit]
- Ye, F.; Xia, T.; Ying, K.; Li, Y.J.; Liang, X.; Han, X. Optimization method for backfill grouting of shield tunnel based on stratum suitability characteristics. Chin. J. Geotech. Eng. 2022, 44, 2225–2233. [Google Scholar]
- Liu, W.; Liang, J.; Xu, T. Tunnelling-Induced Ground Deformation Subjected to the Behavior of Tail Grouting Materials. Tunn. Undergr. Space Technol. 2023, 140, 105253. [Google Scholar] [CrossRef] [Scilit]
- Bullard, J.W.; Jennings, H.M.; Livingston, R.A.; Nonat, A.; Scherer, G.W.; Schweitzer, J.S.; Scrivener, K.L.; Thomas, J.J. Mechanisms of cement hydration. Cem. Concr. Res. 2011, 41, 1208–1223. [Google Scholar] [CrossRef] [Scilit]
- Lothenbach, B.; Scrivener, K.; Hooton, R.D. Supplementary cementitious materials. Cem. Concr. Res. 2011, 41, 1244–1256. [Google Scholar] [CrossRef] [Scilit]
- Hu, M.; Sun, J.; Wu, B.; Wu, H.; Xu, Z. Ground settlement induced by piggyback shield tunnelling in spatially variable soils: 3D random finite-element modelling. J. Rock Mech. Geotech. Eng. 2025. in press. [Google Scholar] [CrossRef] [Scilit]

Disclaimer/Publisher’s Note: The statements, opinions and data contained in all publications are solely those of the individual author(s) and contributor(s) and not of MDPI and/or the editor(s). MDPI and/or the editor(s) disclaim responsibility for any injury to people or property resulting from any ideas, methods, instructions or products referred to in the content. |
© 2026 by the authors. Licensee MDPI, Basel, Switzerland. This article is an open access article distributed under the terms and conditions of the Creative Commons Attribution (CC BY) license.