


Abstract
Artificial intelligence (AI), as a representative general-purpose technology, has attracted increasing attention regarding its potential with green technological innovation (GTI). Understanding this relationship is important for promoting sustainable development and supporting China’s ‘Dual Carbon’ objectives. Using a balanced panel dataset of 108 prefecture-level cities in the Yangtze River Economic Belt (YREB) from 2012 to 2023, this study examines the relationship between AI development and urban GTI. To investigate this relationship, we employ a two-way fixed effects (TWFE) model as the primary empirical framework and supplement the analysis with spatial econometric models and exploratory machine learning techniques. Specifically, we examine whether AI development is associated with urban GTI, whether such associations exhibit spatial dependence, and whether potential non-linear patterns can be observed in the data. The results indicate that: (1) AI development is positively associated with urban GTI, with stronger associations observed for substantive green innovation than for strategic green innovation. (2) Spatial econometric estimates suggest that AI development is correlated with higher GTI levels in neighboring cities, although these findings should be interpreted as spatial associations rather than causal spillover effects. (3) Exploratory machine learning analyses reveal potential non-linear relationships between AI development and GTI. However, these patterns should not be interpreted as evidence of causal threshold effects. (4) The positive association between AI and GTI appears stronger in the middle reaches of the YREB and in regions characterized by relatively stringent environmental regulation. Overall, the findings provide evidence that AI development is associated with urban green technological innovation within the YREB. The results also offer preliminary insights into the spatial and non-linear characteristics of this relationship and may inform future research on digital technologies and sustainable development.
1. Introduction
To address global climate change and achieve China’s “Dual Carbon” goals, promoting a green and low-carbon transformation of economic development has become an important policy objective. Green technological innovation (GTI) is widely regarded as a key mechanism for improving resource-use efficiency and supporting sustainable development. Chen et al. [1] argue that the traditional extensive economic growth model is unsustainable, and enhancing green total factor productivity, centered on GTI, is a crucial pathway toward the sustainable development of the industrial economy. As a major economic corridor spanning China’s eastern, central, and western regions, the Yangtze River Economic Belt (YREB) occupies a strategic position in both economic growth and ecological conservation. However, the region continues to face challenges related to energy consumption, environmental pressure, and uneven innovation capacity. Understanding the factors associated with improvements in GTI within the YREB therefore remains an important research topic.
At the same time, the rapid development of artificial intelligence (AI), big data, cloud computing, and related digital technologies is reshaping economic activities worldwide. As a representative general-purpose technology, AI possesses broad applicability across industries and has the potential to improve information processing, resource allocation, and innovation efficiency. Existing studies suggest that digital technologies can contribute to industrial upgrading, entrepreneurial activities, and economic development [2,3]. Nevertheless, the extent to which AI development is associated with green technological innovation remains insufficiently understood, particularly at the city level and within specific regional contexts.
Existing studies have provided valuable insights into the relationship between digital transformation and environmental performance. Research by Ren et al. [4] indicates that the digitalization process can significantly influence regional energy consumption patterns by optimizing factor allocation and providing technical support for energy conservation and emission reduction. Liu et al. [5] find that the digital economy can effectively facilitate industrial structure upgrading, thereby enhancing green total factor productivity at the urban level.
However, several research gaps remain. First, existing studies treat GTI as a homogeneous concept, potentially overlooking differences in innovation quality. Li and Zheng [6] argue that firms may respond differently to policy incentives, resulting in substantial variation between strategic innovation aimed at increasing patent quantity and substantive innovation focused on technological breakthroughs. Distinguishing between these two dimensions may provide a more nuanced understanding of the relationship between AI development and green innovation outcomes.
Second, although digital technologies are frequently assumed to exert positive environmental effects, the relationship may not be strictly linear. The implementation of AI technologies often requires substantial investments in infrastructure, human capital, and complementary technologies. As a result, the relationship between AI development and GTI may vary across different stages of technological development and regional conditions.
Third, the regional diffusion of digital technologies may generate heterogeneous outcomes across locations. Given the significant economic and technological disparities among cities within the YREB, the relationship between AI development and GTI may exhibit spatial dependence and regional heterogeneity. However, existing studies have paid relatively limited attention to these spatial dimensions.
To address these gaps, this study employs panel data from 108 prefecture-level cities in the YREB covering the period 2012–2023. The primary objective is to examine the relationship between AI development and urban GTI while exploring potential spatial and non-linear characteristics of this relationship. A two-way fixed-effects model serves as the main empirical framework, supplemented by robustness tests, spatial econometric analysis, heterogeneity analysis, and exploratory machine learning techniques.
The contributions of this study are threefold.
First, this study refines the measurement of GTI by distinguishing between substantive green innovation and strategic green innovation. This distinction allows for a more comprehensive assessment of innovation quality and provides additional insights into whether AI development is associated with different forms of green innovative activity.
Second, this study explores several factors that may be related to the observed AI–GTI relationship, including industrial structure upgrading and technological development. Rather than establishing definitive causal mechanisms, the analysis evaluates whether these factors are empirically associated with the relationship between AI development and GTI.
Third, this study extends the literature by examining potential spatial and non-linear characteristics of the AI–GTI relationship. Spatial econometric models are employed to investigate regional dependence patterns, while an explainable machine learning framework is used as an exploratory tool to identify possible non-linear associations. These analyses are intended to complement the baseline findings and provide additional descriptive evidence rather than establish causal relationships.
The remainder of this paper is organized as follows. First, we construct a city-level indicator of AI development based on the distribution of AI-related enterprises. Second, we estimate the relationship between AI development and GTI using panel econometric models and a series of robustness tests. Third, spatial econometric models are employed to examine whether the observed relationship exhibits regional dependence. Finally, exploratory machine learning methods are used to investigate potential non-linear patterns in the data. Together, these approaches provide a comprehensive empirical assessment of the relationship between AI development and green technological innovation in the YREB.
2. Theoretical Basis and Research Hypotheses
2.1. Literature Review
2.1.1. Literature on AI and Green Technological Innovation
Previous studies have examined the potential relationship between digital technologies and environmental performance at both the firm and regional levels. Within the broader literature on technological change, AI has increasingly been viewed as an important general-purpose technology with implications for productivity, innovation, and economic transformation. Acemoglu et al. [7] pointed out that AI, as a new type of general-purpose technology, exerts an impact on economic growth by reshaping production processes. Li et al. [8] found that AI can reduce the trial-and-error costs of front-end R&D and accelerate the recombination of cross-domain tacit knowledge, thereby showing a significant positive link to GTI output.
Several studies have explored the relationship between AI and green innovation. Existing evidence suggests that AI adoption may be associated with improvements in research efficiency, knowledge diffusion, and innovation outcomes [9,10]. At the regional level, digital technologies have also been linked to industrial upgrading, resource allocation efficiency, and green development performance [11,12]. These findings indicate that AI may contribute to conditions that support green technological innovation.
However, the existing literature does not provide a unanimous conclusion regarding the nature and magnitude of this relationship. Most studies focus on average effects and often assume a relatively stable relationship between digital technology development and environmental outcomes. As a result, less attention has been paid to possible variations across regions, development stages, and institutional environments.
2.1.2. Potential Non-Linear and Context-Dependent Relationships
Alongside studies emphasizing the benefits of digital technologies, another strand of literature highlights potential constraints and unintended consequences associated with technological expansion. Research in energy economics suggests that improvements in efficiency do not always translate directly into proportional environmental benefits because behavioral and structural responses may partially offset expected gains [13,14].
Recent discussions on AI development have similarly emphasized the substantial resource requirements associated with digital infrastructure, including data centers, computing facilities, and algorithm training processes [15]. Cui et al. [16] note that while AI may improve innovation efficiency, the expansion of supporting infrastructure can also increase resource consumption. Based on network externality theory, Jing et al. [17] proposed that the positive linkage of AI is not a simple linear evolution but exhibits a non-linear pattern of increasing or decreasing marginal returns after crossing a specific application threshold. These observations suggest that the relationship between AI development and environmental outcomes may be more complex than a simple linear framework implies.
In addition to resource considerations, regional heterogeneity may influence how AI technologies are adopted and utilized. Differences in technological capabilities, industrial structures, institutional quality, and innovation capacity may shape the extent to which AI-related investments are associated with green innovation outcomes. Consequently, the relationship between AI development and GTI may vary across locations and development stages. The existing literature therefore provides grounds for considering the possibility of heterogeneous and non-linear relationships. However, empirical evidence remains limited regarding whether such patterns are observable at the city level and how they may differ across regions.
Overall, the current literature offers important insights into the relationship between digital transformation and environmental performance, but several gaps remain. First, most studies focus on the broader digital economy rather than AI specifically, making it difficult to identify the unique role of AI in relation to green technological innovation [18]. Second, existing studies often examine individual transmission channels separately, while relatively few studies explore the broader structural conditions that may be associated with the AI–GTI relationship. Third, although regional heterogeneity has received increasing attention, the spatial dimensions of AI development and green innovation remain insufficiently explored. In particular, limited evidence exists regarding whether AI development and GTI exhibit spatial dependence across cities [19]. Finally, many studies treat GTI as a homogeneous concept and do not distinguish between substantive green innovation and strategic green innovation [20,21]. This may obscure important differences in innovation quality and lead to an incomplete understanding of the relationship between AI development and green technological innovation.
2.2. Theoretical Analysis and Research Hypotheses
2.2.1. AI Development and Green Technological Innovation
As a representative general-purpose technology, artificial intelligence (AI) has attracted increasing attention regarding its potential relationship with innovation activities. Existing studies suggest that AI may improve information-processing efficiency, facilitate knowledge recombination, and support research and development activities through advanced data analytics and algorithmic capabilities [16]. These characteristics may contribute to conditions that are conducive to innovation by reducing information costs and enhancing the efficiency of knowledge utilization.
At the regional level, AI development may also be associated with broader innovation ecosystems through improved connectivity, resource allocation, and technological collaboration. However, the magnitude and direction of this relationship remain an empirical question, particularly in the context of green technological innovation (GTI).
Accordingly, this study proposes:
Hypothesis 1 (H1).
AI development is positively associated with urban GTI.
2.2.2. Potential Channels Associated with the AI-GTI Relationship
The relationship between AI development and GTI may be influenced by broader structural and technological conditions. Existing studies suggest that digital technologies are frequently accompanied by changes in industrial organization, technological capabilities, and resource allocation patterns.
First, AI development may be associated with industrial structure upgrading. The adoption of digital technologies can coincide with the expansion of knowledge-intensive sectors and improvements in production efficiency, potentially creating conditions that are favorable to innovation activities [22,23]. Industrial upgrading may therefore be related to the observed relationship between AI development and GTI.
Second, AI development may also be associated with improvements in regional technological capacity. Investments in digital infrastructure, innovation resources, and technology-related public services may enhance the broader innovation environment and increase opportunities for knowledge creation and diffusion. These factors may contribute to the relationship between AI development and GTI.
Nevertheless, the extent to which these factors operate as effective channels remains an empirical issue that requires further investigation.
Accordingly, this paper proposes:
Hypothesis 2 (H2).
Industrial structure upgrading and technological development are associated with the relationship between AI development and urban GTI.
2.2.3. Potential Non-Linear Characteristics
Although many studies emphasize the benefits of digital technologies, an increasing body of literature suggests that technological effects may vary across different development stages and institutional environments [24].
The implementation of AI often requires complementary investments in infrastructure, human capital, and organizational adaptation. Consequently, the relationship between AI development and GTI may not necessarily be constant across all levels of AI development. Instead, the strength of the observed association may vary as technological capabilities, innovation resources, and supporting conditions evolve.
Recent studies have therefore suggested that the relationship between digital technologies and innovation outcomes may exhibit non-linear characteristics [25]. However, whether such patterns are present in the relationship between AI development and GTI remains an empirical question.
Accordingly, this paper proposes:
Hypothesis 3 (H3).
The relationship between AI development and urban GTI may exhibit non-linear characteristics.
2.2.4. Spatial Dependence and Heterogeneity
The development and diffusion of digital technologies often occur within interconnected regional systems. Knowledge exchange, labor mobility, industrial linkages, and information networks may contribute to interdependence among neighboring cities.
As a result, AI development and GTI may exhibit spatial dependence rather than being entirely independent across locations. The strength of this relationship may also vary across regions because of differences in economic development, technological capacity, industrial structure, and institutional environments [19,22].
Within the YREB, substantial differences exist in resource endowments, innovation capacity, and environmental governance [16]. These differences may be associated with heterogeneous relationships between AI development and GTI across regions and regulatory environments.
Accordingly, this paper proposes:
Hypothesis 4 (H4).
The relationship between AI development and GTI exhibits spatial dependence and regional heterogeneity.
Based on the above theoretical considerations and research hypotheses, the empirical analysis proceeds by examining the baseline relationship between AI development and GTI, followed by robustness, spatial, heterogeneity, and exploratory non-linear analyses.
3. Research Design
3.1. Variable Selection and Metric Description
3.1.1. Dependent Variables
This paper adopts the number of green patent applications at the prefecture-level city as the proxy variable to measure urban GTI. Compared to the granted patents, patent applications can more timely reflect the current R&D activity. Considering the heterogeneity of innovation quality, this study avoids treating the patent classification as self-evident. Drawing on the established conceptual frameworks of Li and Zheng [6] and Chen and Zhang [9], we subdivide green innovation into substantive and strategic dimensions. It is crucial to clarify that this classification serves strictly as a proxy-based operational distinction rather than a definitive measurement of absolute innovation quality. We explicitly acknowledge that patent type is a useful but imperfect proxy. In practice, some green utility models may still provide meaningful practical value and incremental market benefits, while some green invention patents may not necessarily represent high-impact technological breakthroughs.
Specifically, green invention patents require strict substantive examination, possess high technological novelty, and involve substantial R&D risks. Therefore, the natural logarithm of the number of green invention patent applications (Ln_Green_Inv) is defined as “substantive green innovation,” generally representing fundamental technological breakthroughs driven by genuine market demand. Conversely, green utility model patents undergo only a formal administrative review, feature shorter R&D cycles, and have relatively low technical barriers. While micro-entities frequently utilize utility models as strategic tools for short-term policy compliance, subsidy acquisition, or market signaling, we caution against rigidly equating them merely with low-quality behavior. Consequently, the natural logarithm of green utility model patent applications (Ln_Green_Uti) is defined as “strategic green innovation,” reflecting the differences in technological thresholds and institutional review stringencies. To avoid zero values when taking the logarithm, 1 is added to all patent application counts before the logarithmic transformation.
3.1.2. Core Independent Variable
Existing literature mostly relies on word frequencies in local government work reports to characterize the AI development level, but this is prone to the endogeneity bias of “policy declaration equating to actual development.” Its positive link to GTI relies not only on the underlying R&D of leading enterprises but also on the penetration and scenario landing of application-layer enterprises in the industrial chain. Therefore, the actual agglomeration of intelligent enterprises can more objectively reflect the regional digital industry ecology.
To accurately capture the actual landing process of AI technology, this paper draws on existing measurement methods [8,26] and applies a double-filtering method of “keyword mining and industry code cross-validation” to screen enterprise registration data. First, based on the foundational, technological, and application layers of AI, core keywords such as “big data, deep learning, artificial intelligence, machine learning, cloud computing, and computing power” are set to conduct full-text retrieval of the enterprises’ business scopes. Second, combined with the Industrial Classification for National Economic Activities, the screening scope is restricted to industries including “Internet and related services,” “Software and information technology services,” and “Professional and technical services.” Finally, the number of AI enterprises in each city is aggregated by year, and 1 is added before taking the natural logarithm (Ln_AI_com) to measure the AI development level. Considering the time lag in technology transformation, and to partially mitigate the endogeneity issue stemming from reverse causality, this variable is lagged by one period in the baseline regression.
3.1.3. Mediating Variables
To explore the internal logic underlying the positive AI-GTI nexus, this paper selects technological level (Sci_Exp) and overall upgrading of industrial structure (Ind_Str) as mediating variables, examining their transmission pathways from the dual dimensions of resource allocation optimization and industrial evolution.
Specifically, public technological investments (Sci_Exp) can effectively share the high R&D costs of enterprises, mitigate innovation risks, and provide a material guarantee for the green transition of AI technologies [27]. This study explicitly connects it to two micro-mechanisms: absorptive capacity and technological conversion efficiency. First, local fiscal inputs provide crucial R&D subsidies and digital infrastructure, significantly lowering enterprises’ learning costs and supporting an increase in their absorptive capacity to decode complex AI algorithms. Second, sustained scientific expenditure fosters high-tech talent pools and optimizes the innovation ecosystem, thereby maximizing the conversion efficiency of translating abstract digital elements into tangible green patents.
Furthermore, the overall upgrading of the industrial structure (Ind_Str) captures the systematic evolutionary process facilitated by AI. As calculated in Equation (1), this index characterizes the depth of the industrial structure’s ascent to higher levels [28]. It signifies the flow of resources toward low-energy, high-tech intelligent industries, thereby providing structural momentum for GTI output.
where represents the proportion of the added value of the primary, secondary, and tertiary industries to the city’s Gross Domestic Product (GDP).
3.1.4. Control Variables
To reduce omitted variable bias, drawing on the research of Cui et al. [16] and Huang et al. [22], this paper selects economic development level (Ln_PGDP), environmental regulation (Env_Reg), government intervention (Gov_Int), foreign direct investment (FDI), financial scale (Fin_Dev), and human capital (Hum_Cap) as control variables. The specific definitions and measurement methods for each variable are detailed in Table 1. Notably, this paper measures environmental regulation using the frequency proportion of environment-related keywords in local government work reports. Compared to a single pollution emission indicator, this text-based metric more comprehensively reflects the local government’s willingness toward environmental governance.
Table 1.
Variable definitions and descriptions.
To clearly present the construction logic of the aforementioned variables, the core variables and their measurement methods are shown in Table 1.
3.2. Data Sources and Descriptive Statistics
The research sample in this paper consists of panel data from 108 prefecture-level and above cities in the YREB from 2012 to 2023. The sample covers 11 provinces and municipalities across the upper, middle, and lower reaches of the Yangtze River [19]. Figure 1 graphically illustrates the spatial scope of our study area, which encompasses the core node cities within the YREB. Crucially, the map delineates the precise boundaries separating the Upper, Middle, and Lower reaches, overlaid with the major hydrological systems of the Yangtze River main stem. This rigorous GIS visualization guarantees that our subsequent analysis of spatial heterogeneity is grounded in accurate geographical and economic boundaries.
Figure 1.
Spatial Distribution and Hydrological Systems of the YREB.
Patent data are sourced from the China National Intellectual Property Administration (CNIPA) and the Chinese Research Data Services (CNRDS) database and are precisely matched with the “International Green Patent Classification List” published by the World Intellectual Property Organization (WIPO). Urban macro data are obtained from the China City Statistical Yearbook and respective provincial and municipal statistical yearbooks over the years. A small number of missing values are filled using the linear interpolation method. To eliminate the interference of extreme values on the regression results, all continuous variables are subject to a 1% and 99% Winsorization prior to the regression. The descriptive statistics results are shown in Table 2.
Table 2.
Statistical summary table of variables.
3.3. Model Specification
To examine the relationship between AI development and green technological innovation (GTI), this study adopts a hierarchical empirical strategy centered on a two-way fixed-effects (TWFE) framework.
The TWFE model serves as the primary empirical specification for estimating the association between AI development and urban GTI while controlling for unobserved city-specific characteristics and common time effects. To evaluate the robustness of the baseline results, additional analyses, including instrumental-variable estimation, dynamic panel estimation, and placebo tests, are conducted. Building on the baseline analysis, a Spatial Durbin Model (SDM) is employed to examine whether the AI–GTI relationship exhibits spatial dependence across cities within the Yangtze River Economic Belt (YREB). The purpose of this analysis is to investigate regional interdependence patterns rather than establish definitive spatial transmission mechanisms. Furthermore, given the possibility that the relationship between AI development and GTI may vary across development stages and regional conditions, heterogeneity analysis and an explainable machine learning framework (XGBoost-SHAP) are employed as supplementary exploratory tools. These analyses are intended to identify potential non-linear patterns and heterogeneous associations that may not be fully captured by conventional linear specifications.
Accordingly, the empirical strategy of this study proceeds in three stages. First, the baseline relationship between AI development and GTI is estimated using the TWFE model and a series of robustness tests. Second, spatial econometric models are employed to investigate regional dependence patterns. Third, heterogeneity analysis and exploratory machine learning methods are used to examine potential non-linear characteristics of the observed relationship.
3.3.1. Baseline Regression Model
To test the impact of AI on urban GTI, referring to relevant empirical studies [22,23], this paper constructs a two-way fixed effects panel model, as shown in Equation (2).
where i denotes the city and t denotes the year; represents the dependent variable; is the AI development level lagged by one period; is the set of control variables; and represent the city and year fixed effects, respectively; and is the random error term. The standard errors of the regressions are all clustered at the city level.
3.3.2. Structural Association Analysis
To explore whether industrial structure upgrading and technological development are empirically associated with the relationship between AI development and GTI, the following specifications are estimated.
where represents the mediating variables. To control for time-invariant city heterogeneity and macro-cyclical trends, we adopt a two-way fixed effects strategy—incorporating both city () and year () fixed effects—to ensure the validity of our mechanism estimations.
3.3.3. Spatial Econometric Model Specification
Given that both AI development and green technological innovation (GTI) may exhibit spatial dependence across cities, this study employs a spatial econometric framework to further examine regional interrelationships. Following Yao et al. [26], a series of model selection procedures, including Lagrange Multiplier (LM) tests, Wald tests, and Likelihood Ratio (LR) tests, were conducted to determine the appropriate spatial specification. Although the LR-SEM test yielded a marginally insignificant result in certain subsamples (p = 0.105), the Spatial Durbin Model (SDM) was ultimately selected based on the recommendations of Elhorst (2014) [29] and its flexibility in accounting for spatial interactions among both dependent and explanatory variables.
The rationale for employing the SDM is that economic and innovation activities in one city may be associated with developments in neighboring cities. Consequently, both GTI and AI development may exhibit regional interdependence rather than evolving independently across locations. Compared with conventional spatial autoregressive (SAR) and spatial error (SEM) models, the SDM allows the inclusion of spatially lagged explanatory variables and therefore provides a more comprehensive framework for examining spatial dependence patterns.
The SDM specification is expressed as follows:
where denotes the spatial autoregressive coefficient, and W represents the spatial weight matrix. The core coefficient of interest is , which reflects whether AI development in neighboring cities is associated with local GTI outcomes. Consistent with the objectives of this study, the SDM results are interpreted as evidence of spatial dependence rather than definitive proof of spatial transmission mechanisms.
3.3.4. Exploratory Analysis Based on Explainable Machine Learning
To complement the conventional econometric analysis, this study employs an explainable machine learning framework based on XGBoost and SHAP (Shapley Additive Explanations). The purpose of introducing this framework is to explore whether the relationship between AI development and GTI exhibits potential non-linear patterns that may not be fully captured by traditional linear specifications.
Unlike conventional parametric models, XGBoost does not require researchers to impose a predetermined functional form. Instead, the model identifies complex relationships directly from the data, making it useful for exploring heterogeneous and potentially non-linear associations among variables. However, the objective of this analysis is exploratory rather than causal.
To improve model interpretability, SHAP values are employed to quantify the relative contribution of each explanatory variable to model predictions. In addition, Partial Dependence Plots (PDPs) are used to visualize how predicted GTI outcomes vary across different levels of AI development while holding other factors constant. These tools facilitate the interpretation of complex predictive relationships identified by the machine learning model.
Because machine learning algorithms are typically developed under independent and identically distributed (IID) assumptions, special preprocessing procedures are applied to the panel dataset. Specifically, a two-way de-meaning approach based on fixed-effect residualization is employed to remove city-specific and time-specific effects prior to model estimation. This procedure helps reduce the influence of unobserved heterogeneity and allows the model to focus on within-city variation over time.
To ensure transparency and robustness, the dataset is divided into a training sample (80%) and a testing sample (20%). Hyperparameter tuning is conducted using five-fold cross-validation combined with a grid-search procedure. The optimal parameter configuration includes a maximum tree depth of 5, a learning rate of 0.1, and 300 estimators. The final model achieves an out-of-sample R2 of 0.8378 and a root mean squared error (RMSE) of 0.6166 on the testing sample, indicating satisfactory predictive performance.
4. Empirical Results and Analysis
4.1. Baseline Regression Analysis
To examine the relationship between AI development and urban green technological innovation (GTI), this section estimates a series of two-way fixed-effects models. Table 3 reports the estimation results following the sequential introduction of control variables. All specifications include city and year fixed effects to account for time-invariant city characteristics and common macroeconomic shocks. Standard errors are clustered at the city level.
Table 3.
Baseline regression results: The impact of AI on GTI.
Column (1) presents the baseline specification, including only the lagged AI variable and fixed effects. The estimated coefficient of AI development is positive and statistically significant. Across Columns (2)–(7), the coefficient remains relatively stable after the inclusion of additional control variables. In the full specification reported in Column (7), the coefficient of AI development is 0.223 and remains statistically significant at the 10% level. This result suggests a positive association between AI development and substantive green technological innovation [30,31]. However, the magnitude of the coefficient should be interpreted cautiously, as the estimates do not by themselves establish a causal relationship.
Regarding the control variables, the coefficient of economic development (Ln_PGDP) is positive and statistically significant. This finding indicates that economically more developed cities tend to exhibit higher levels of green technological innovation. Other control variables do not show consistently significant effects across specifications.
4.2. Endogeneity Treatment and Robustness Tests
4.2.1. Endogeneity Discussion
Although the baseline regression incorporates city and year fixed effects to account for unobservable factors, the use of observational panel data inevitably raises concerns regarding omitted variables, reverse causality, and other sources of endogeneity. Therefore, to assess the robustness of the baseline findings and reduce potential estimation bias, this study employs several complementary approaches, including instrumental-variable estimation (2SLS), dynamic panel GMM estimation, and a placebo test [32].
First, a two-stage least squares (2SLS) approach is implemented using two instrumental variables. The first instrument, Terrain_IV, is constructed as the interaction between urban terrain undulation and a time trend. The underlying rationale is that topographic complexity may influence the cost of deploying digital and AI-related infrastructure and therefore may be associated with local AI development. Because terrain is a time-invariant geographic characteristic, much of its long-run influence is absorbed by city fixed effects. Nevertheless, we acknowledge that terrain may also be indirectly related to broader patterns of infrastructure development and economic geography, and therefore the exclusion restriction cannot be regarded as perfectly testable. The second instrument, Spatial_IV, is measured as the inverse-distance weighted average of AI development in neighboring cities. This variable is expected to be associated with local AI adoption through regional demonstration effects and technology diffusion. However, because spatial interactions are also examined explicitly in the subsequent spatial econometric analysis, the interpretation of this instrument requires caution. Consequently, the instrumental-variable results are viewed as supportive evidence that helps alleviate endogeneity concerns rather than as definitive evidence of causal identification [33].
Second, a dynamic panel GMM model is estimated to account for the persistence of green technological innovation over time. The lagged dependent variable is included to capture the dynamic nature of innovation activities. As reported in Column (3) of Table 4, the coefficient on the lagged dependent variable is positive and statistically significant, indicating substantial persistence in GTI. After controlling for this dynamic component, the estimated coefficient of AI development remains positive and statistically significant. In addition, the Hansen J-test fails to reject the validity of the instrument set (p = 0.363), providing support for the empirical specification.
Table 4.
Empirical results of endogeneity mitigation and dynamic robustness tests.
Taken together, these results suggest that the positive association between AI development and GTI remains observable after accounting for potential dynamic persistence and endogeneity concerns.
Finally, a placebo test is conducted to examine whether the baseline findings could be driven by random shocks or arbitrary data patterns. Specifically, the AI variable is randomly reassigned across cities and years 100 times, and the baseline model is re-estimated for each iteration. The average estimated coefficient from the placebo regressions is close to zero (MeanCoef = −0.0003), suggesting that the baseline estimates are unlikely to be explained solely by random variation.
Overall, the results from the instrumental-variable estimation, dynamic panel model, and placebo test provide additional support for the stability of the baseline findings. While these approaches cannot completely eliminate all endogeneity concerns, they indicate that the positive empirical relationship between AI development and urban green technological innovation is relatively robust across alternative specifications and identification strategies [34].
4.2.2. Robustness Tests
- (1)
- Alternative Dependent Variables
Considering that different types of green patents may reflect varying levels of technological sophistication, this study replaces substantive green invention patents with two alternative measures: mixed green patents (invention + utility model) and strategic green innovation (Ln_Green_Uti). The results reported in Table 5 show that the coefficients of AI are statistically insignificant for both alternative measures. These findings suggest that the observed AI–GTI relationship is more evident for substantive green innovation characterized by higher technological content, whereas the association is not apparent for patent activities primarily reflecting incremental or strategic innovation behavior [35].
Table 5.
Robustness tests of replacing variables and excluding samples.
- (2)
- Winsorization
To reduce the potential influence of extreme observations arising from local policy shocks or reporting anomalies, all continuous variables were winsorized at the 1% and 99% levels. As reported in Column (4) of Table 5, the coefficient of AI remains positive and statistically significant at the 10% level. This result suggests that the baseline findings are not driven solely by a small number of extreme observations.
- (3)
- Excluding Municipalities Directly Under the Central Government
Municipalities such as Shanghai and Chongqing possess distinctive advantages in terms of digital infrastructure, innovation resources, and policy support. To examine whether the baseline results are disproportionately influenced by these cities, they are excluded from the sample. Column (5) of Table 5 indicates that the coefficient of AI remains positive and statistically significant (0.2240). This finding suggests that the positive association between AI development and GTI is not confined to a small number of highly developed municipalities and can also be observed among ordinary prefecture-level cities.
- (4)
- Alternative Measures of AI Development
To address potential measurement concerns associated with the number of registered AI enterprises, two alternative indicators are introduced: industrial robot density (Ln_AI_robot) and AI-related invention patent applications (Ln_AIInv).
Industrial robot data are obtained from the International Federation of Robotics (IFR). Following the shift-share (Bartik) approach, city-level robot density is constructed as:
where denotes the national number of industrial robots in industry j in year t, and represents the employment share of industry j in city i relative to the national total in year t. The AI-related patent data are retrieved from the National Intellectual Property Administration (CNIPA) by aggregating patent applications matching specific AI keywords.
Following Sun et al. [36], industrial robots and AI-related patents provide alternative perspectives on local AI-related technological activity. While robot density reflects the adoption of intelligent production technologies, AI patents capture AI-oriented research and innovation activities.
The estimation results reported in Columns (6) and (7) indicate that both alternative indicators exhibit positive coefficients, although statistical significance remains relatively modest (10% level). Therefore, these findings should be interpreted cautiously as supplementary evidence broadly consistent with the baseline results rather than as definitive validation of a specific mechanism.
Importantly, the three indicators capture different dimensions of AI development and should not be regarded as interchangeable measures. The baseline indicator reflects the local concentration of AI-related firms, industrial robots reflect technology deployment, and AI patents capture innovation-oriented activities. The broadly consistent positive coefficients across these alternative measures suggest that the observed AI–GTI relationship is not exclusively dependent on a single operationalization of AI development. Nevertheless, the evidence should be interpreted as indicating a stable empirical association rather than establishing a particular causal pathway linking AI development and green technological innovation.
4.3. Potential Associated Factors and Heterogeneity Analysis
4.3.1. Analysis of Potential Associated Factors
To further explore factors that may be associated with the relationship between AI development and green technological innovation (GTI), this study examines industrial structure upgrading (Ind_Str) and technological development (Ln_Sci_Exp). Rather than establishing definitive transmission mechanisms, this analysis aims to assess whether these factors are empirically related to the observed AI–GTI relationship.
Table 6 reports the estimation results after controlling for city and year fixed effects.
Table 6.
Mechanism test and moderation effect regression results (TWFE).
The results indicate that the coefficient of AI development remains positive and statistically significant after the inclusion of technological development and industrial structure variables. As shown in Column (4), the estimated coefficient of AI remains positive (0.2283), suggesting that the baseline AI–GTI relationship is not fully explained by these additional factors.
At the same time, the estimated coefficients of industrial structure upgrading and technological development do not exhibit consistently strong statistical significance across specifications. Therefore, the evidence does not provide strong support for interpreting these variables as direct linear channels through which AI development is associated with GTI.
Consequently, while industrial structure upgrading and technological development may be relevant contextual factors within the broader innovation environment, the available evidence does not allow definitive conclusions regarding their precise roles in shaping the relationship between AI development and green technological innovation. Further investigation using more detailed firm-level or project-level data may be necessary to better understand these potential relationships.
4.3.2. Heterogeneity Analysis
To explore whether the observed AI–GTI relationship varies across different regional and institutional contexts, heterogeneity analyses are conducted based on geographical location and environmental regulation intensity. The results are reported in Table 7.
Table 7.
Heterogeneity analysis of regression results.
With respect to geographical location, the estimated coefficient of AI is positive and statistically significant only for cities located in the middle reaches of the Yangtze River Economic Belt, whereas the coefficients for the upper and lower reaches are statistically insignificant. These findings suggest that the strength of the observed AI–GTI relationship may vary across regions with different economic structures, industrial compositions, and levels of digital development.
Regarding environmental regulation, the estimated coefficient of AI is positive and statistically significant in the high-regulation group but statistically insignificant in the low-regulation group. This result indicates that the AI–GTI relationship appears to be more pronounced in cities operating under stronger environmental regulatory conditions.
However, these heterogeneity results should be interpreted with caution. While they suggest that regional and institutional contexts may be associated with differences in the observed relationship between AI development and GTI, they do not by themselves establish the specific mechanisms responsible for such differences. Future research may further investigate the underlying factors contributing to these heterogeneous patterns.
4.4. Spatial Dependence Analysis
4.4.1. Spatial Correlation Test
Prior to estimating spatial econometric models, it is necessary to examine whether the key variables exhibit spatial dependence. Accordingly, this study calculates the global Moran’s I statistics for urban green technological innovation (Ln_Green_Inv) and AI development (Ln_AI_com) using an inverse geographic distance matrix constructed from the latitude and longitude coordinates of Chinese cities [37].
The annual results are reported in Table 8. Throughout the sample period (2012–2023), the Moran’s I statistics for both variables are consistently positive and statistically significant at the 1% level. These findings indicate that cities with relatively high (or low) levels of green innovation and AI development tend to be geographically clustered rather than randomly distributed.
Table 8.
Global Moran’s I indices for main variables (2012–2023).
The observed spatial clustering suggests the presence of regional dependence patterns in both GTI and AI development. However, Moran’s I statistics alone do not identify the specific mechanisms underlying such spatial patterns. Therefore, the results should be interpreted as evidence of spatial autocorrelation rather than proof of spatial spillover effects or network externalities [38].
To provide an intuitive illustration of the geographic distribution of the key variables, Figure 2 presents the spatial patterns of AI development and GTI across cities in the Yangtze River Economic Belt (YREB) over the sample period. The figure indicates that both variables display notable regional variation and clustering tendencies, which is consistent with the Moran’s I results and provides preliminary motivation for the subsequent spatial econometric analysis.
Figure 2.
Spatiotemporal patterns and trends of AI and GTI in the YREB.
4.4.2. Identification and Selection of Spatial Models
Having established the existence of spatial dependence, this study proceeds to identify an appropriate spatial econometric specification. The results of the model selection procedures are reported in Table 9.
Table 9.
Identification and degeneration tests of spatial panel models (Wald/LR).
.
First, Lagrange Multiplier (LM) tests based on the residuals of the non-spatial panel model indicate significant spatial dependence in both the dependent variable and the disturbance term. These results suggest that a conventional panel model may not fully capture the spatial structure present in the data.
Second, Wald tests and Likelihood Ratio (LR) tests are conducted to assess whether the Spatial Durbin Model (SDM) can be simplified to either a Spatial Autoregressive Model (SAR) or a Spatial Error Model (SEM). For the full sample, both the LR-SAR and LR-SEM statistics reject the null hypothesis of model simplification at conventional significance levels. Similar results are observed for the upper and lower reaches subsamples.
For the middle-reaches subsample, the evidence is somewhat less conclusive. While the LR-SAR statistic rejects the simplification hypothesis at the 10% level, the LR-SEM statistic does not reach conventional significance levels. Following the recommendations of Elhorst [29], when the test results are mixed, the more general SDM specification is preferred because it allows spatial interactions among both dependent and explanatory variables and reduces the risk of model misspecification [39].
Based on the combined evidence from the LM, Wald, and LR tests, this study adopts the Spatial Durbin Model (SDM) with two-way fixed effects as the baseline spatial specification. The purpose of the SDM analysis is to examine regional dependence patterns associated with AI development and GTI rather than to establish definitive spatial transmission mechanisms.
4.4.3. Full-Sample Decomposition of Spatial Effects
To examine how AI development is associated with GTI within a spatial framework, the estimated effects from the Spatial Durbin Model are decomposed into direct effects, indirect effects, and total effects using the partial-derivative approach. The results are reported in Table 10 based on the inverse geographic distance matrix.
Table 10.
Decomposition results of spatial effects in the SDM (Based on ).
The decomposition results indicate that the estimated direct effect of AI development on GTI is 0.136, while the estimated indirect effect is 1.393.
The positive direct effect suggests that higher levels of AI development within a city are associated with higher levels of local green technological innovation after accounting for spatial dependence. This finding is consistent with the baseline regression results and indicates that the observed AI–GTI relationship remains present within the spatial econometric framework.
In addition, the estimated indirect effect is positive and substantially larger than the direct effect. This result implies that the association between AI development and GTI is not limited to the city in which AI activity occurs but is also correlated with conditions in surrounding cities. In other words, spatial interactions appear to be an important feature of the AI–GTI relationship within the Yangtze River Economic Belt.
However, the decomposition results should be interpreted cautiously. Although the indirect effect is consistent with the presence of spatial dependence, it does not by itself identify the precise channels through which these regional associations arise. The estimated spatial effects may reflect a variety of factors, including inter-city economic linkages, technology diffusion, industrial complementarities, labor mobility, policy similarities, or other unobserved regional characteristics.
Overall, the results suggest that AI development and GTI exhibit meaningful spatial interdependence within the Yangtze River Economic Belt.
4.4.4. Spatial Heterogeneity Analysis
To examine whether the spatial relationship between AI development and GTI differs across regions of the Yangtze River Economic Belt (YREB), the sample is divided into three subregions: the upper, middle, and lower reaches. The corresponding Spatial Durbin Model decomposition results are reported in Table 11.
Table 11.
Spatial effect decomposition of regional sub-samples.
The results indicate substantial regional variation in the estimated spatial effects.
For the upper reaches, the direct effect of AI is positive and marginally significant, whereas the indirect effect is statistically insignificant. This finding suggests that the observed association between AI development and GTI is primarily localized within cities in this region, while evidence of broader regional dependence remains limited.
For the middle reaches, the direct, indirect, and total effects are all positive and statistically significant. Compared with the upper reaches, the estimated spatial effects are stronger, indicating that the relationship between AI development and GTI is associated with a broader regional context rather than being confined to individual cities.
For the lower reaches, the indirect effect remains positive and statistically significant, whereas the direct effect is not statistically significant. This pattern suggests that spatially associated effects account for a relatively larger share of the estimated relationship between AI development and GTI in this region.
Overall, the results reveal notable regional heterogeneity in the spatial association between AI development and GTI. However, the decomposition results alone do not identify the specific mechanisms responsible for these differences. Variations in industrial structure, economic development, innovation capacity, institutional conditions, and digital infrastructure may all contribute to the observed regional patterns.
4.4.5. Robustness Analysis Using Alternative Spatial Weight Matrix
To assess the robustness of the spatial estimation results, this study re-estimates the Spatial Durbin Model using several alternative spatial weight matrices, including an inverse geographic distance matrix (W_geo), an inverse-squared geographic distance matrix (W_geo2), an economic distance matrix (W_eco), and an economic–geographic nested matrix (W_nest). The corresponding decomposition results are reported in Table 12.
Table 12.
Spatial spillover effects under different spatial weight matrices.
First, under the inverse-squared geographic distance matrix, which assigns substantially greater weight to nearby cities, the estimated indirect effect of AI remains positive and statistically significant. This finding suggests that the baseline results are not highly sensitive to the specification of geographic distance. Second, when economic proximity is used to define inter-city relationships, the estimated indirect effect also remains positive and statistically significant. Similar results are obtained using the economic–geographic nested matrix, which simultaneously incorporates geographic and economic proximity. Taken together, the results obtained from alternative spatial weight matrices are broadly consistent with the baseline specification. The persistence of positive indirect effects across different weighting schemes suggests that the estimated spatial relationship between AI development and GTI is relatively stable across alternative representations of inter-city connectivity.
4.4.6. Robustness Analysis Using Alternative Spatial Econometric Specifications
To assess whether the spatial estimation results depend on a particular model specification, this study additionally estimates Spatial Autoregressive Models (SAR) and Spatial Error Models (SEM). The results are reported in Table 13.
Table 13.
Robustness test: Substitution of spatial econometric models.
The SAR estimation indicates that the direct effect of AI development on local GTI remains positive and statistically significant. In addition, the estimated spatial coefficient is positive and statistically significant at the 10% level, suggesting the presence of spatial dependence within the sample. The SEM results likewise indicate a positive and statistically significant association between AI development and GTI after accounting for spatial correlation in the disturbance term. The consistency of the estimated coefficients across alternative spatial specifications suggests that the baseline findings are not highly sensitive to the choice of spatial econometric model.
Overall, the results from the SAR and SEMs are broadly consistent with those obtained from the Spatial Durbin Model. This consistency provides additional support for the stability of the observed relationship between AI development and green technological innovation within the Yangtze River Economic Belt.
Taken together, the empirical analyses reported in Table 2, Table 3, Table 4, Table 5, Table 6, Table 7, Table 8, Table 9, Table 10, Table 11, Table 12 and Table 13 yield several observations. First, across the baseline estimations, endogeneity checks, and robustness analyses, AI development is consistently associated with higher levels of substantive green technological innovation. At the same time, the results do not indicate a statistically significant relationship with strategic green innovation. This pattern suggests that the observed AI–GTI relationship is more evident for innovation activities characterized by relatively higher technological content.
Second, the analyses exploring potential non-linear relationships indicate that the association between AI development and GTI may vary across different levels of AI development. However, these findings should be interpreted as descriptive evidence of non-linear patterns rather than definitive proof of threshold effects or stage-based development processes.
Third, the spatial analyses reveal that the relationship between AI development and GTI exhibits regional dependence and heterogeneity across different parts of the Yangtze River Economic Belt. The estimated spatial effects remain broadly consistent across alternative spatial weight matrices and model specifications, suggesting that the observed spatial patterns are relatively robust.
4.5. Non-Linear Pattern Exploration Based on Explainable Machine Learning
4.5.1. Feature Importance Analysis
To complement the econometric analyses, this study employs the XGBoost–SHAP framework as an exploratory tool for examining potential non-linear patterns in the data. Consistent with the limitations of machine learning-based interpretation, the results presented in this section are intended to describe predictive relationships rather than establish causal mechanisms.
Prior to examining non-linear patterns, feature importance measures are used to assess the relative contribution of each variable to the predictive performance of the model. Figure 3 reports three commonly used indicators generated by XGBoost: Gain, Weight, and Cover.
Figure 3.
Multi-indicator evaluation of feature importance for predictive GTI.
The results indicate that economic development (Ln_PGDP) contributes the largest share of predictive information across all three measures. This finding suggests that variations in local economic conditions are closely associated with the model’s ability to predict differences in GTI.
Among the explanatory variables considered in this study, the lagged AI development indicator (L.Ln_AI_com) ranks highly across the feature importance metrics. This result suggests that AI development contains substantial predictive information for explaining variation in GTI within the sample.
The technological level (Sci_Exp) and industrial structure upgrading (Ind_Str) exhibit lower feature importance values. These findings are broadly consistent with the relatively weak statistical significance observed in the linear mechanism analysis.
4.5.2. Exploration of Non-Linear Associations Using Partial Dependence Plots
To further explore potential non-linear relationships, Partial Dependence Plot (PDP) analysis is conducted for the AI development variable. Figure 4 illustrates how the model’s predicted GTI values vary across different levels of AI development while holding other variables constant at their average values. The PDP suggests that the relationship captured by the model is non-linear rather than strictly linear.
Figure 4.
Exploratory analysis of the marginal predictive association between AI and GTI. Note: As a machine learning explainability tool, this visualization explores potential non-linear data structures. It should be interpreted as a suggestive empirical association rather than a definitive causal mechanism.
At relatively low levels of AI development, predicted GTI values remain comparatively stable and, in some ranges, exhibit limited variation. As AI development increases, the slope of the partial dependence function becomes steeper, indicating that the model associates higher levels of AI development with larger predicted GTI values.
A noticeable change in the shape of the curve appears around the upper portion of the AI distribution. However, this pattern should be interpreted cautiously. The PDP does not identify a statistically verified threshold, nor does it demonstrate the existence of a specific stage-based development process. Instead, it merely indicates that the predictive relationship captured by the model varies across the observed range of AI development.
Overall, the XGBoost–SHAP analysis suggests that the association between AI development and GTI may be heterogeneous across different levels of AI development. These findings provide descriptive evidence that complements the econometric results by highlighting potential non-linear patterns within the data.
5. Discussion and Conclusions
5.1. Discussion
This study examines the relationship between AI development and green technological innovation (GTI) in the Yangtze River Economic Belt (YREB) using a combination of panel econometric models, spatial analysis, and exploratory machine learning techniques. Several observations emerge from the empirical results.
First, the results consistently indicate a positive association between AI development and substantive green technological innovation. This relationship remains statistically significant across multiple model specifications and robustness checks. However, the findings should be interpreted as evidence of a stable empirical association rather than definitive proof of a causal transformation process.
Second, the analyses suggest that the relationship between AI development and GTI may not be strictly linear. While the machine learning results reveal heterogeneous predictive patterns across different levels of AI development, these patterns should be interpreted cautiously. The observed non-linearity may reflect differences in regional development conditions, technological capabilities, industrial structures, or other unobserved factors. The present study is not able to determine the precise mechanisms underlying these patterns.
Third, the spatial analyses indicate that the relationship between AI development and GTI extends beyond individual cities and exhibits significant regional dependence. The estimated spatial effects remain broadly robust across alternative spatial weight matrices and econometric specifications. Nevertheless, the spatial models do not identify the specific channels through which these regional associations arise. Technology diffusion, economic linkages, labor mobility, policy similarities, and other regional characteristics may all contribute to the observed spatial patterns.
Fourth, the mechanism analysis provides only limited evidence regarding the pathways through which AI development may be associated with GTI. Although industrial structure upgrading and technological development remain theoretically relevant factors, the empirical results do not provide strong support for a simple linear mediation process. Consequently, these variables should be interpreted as potentially relevant contextual conditions rather than confirmed transmission channels.
The findings of this study may also be viewed in a broader international context. Existing research on digital transformation and green development in OECD countries and the European Union similarly suggests that the outcomes of digital technologies depend heavily on regional economic conditions, institutional environments, and innovation capacities [40,41]. While the specific institutional settings differ across countries, the present results contribute to the broader literature by documenting how AI development is associated with green technological innovation within a large developing economy undergoing rapid digital transformation.
5.2. Main Conclusions
Based on panel data from 108 cities in the Yangtze River Economic Belt from 2012 to 2023, this study reaches the following conclusions.
(1) AI development is positively associated with substantive green technological innovation. Across the baseline estimations, endogeneity checks, and robustness tests, higher levels of AI development are consistently associated with higher levels of green invention patent activity. In contrast, the relationship between AI development and strategic green innovation is not statistically significant.
(2) The relationship between AI development and GTI appears to exhibit non-linear characteristics. The exploratory machine learning analysis suggests that the predictive association between AI development and GTI varies across different levels of AI development. However, these patterns should be interpreted as descriptive evidence rather than confirmation of specific threshold effects or causal development stages.
(3) The relationship between AI development and GTI exhibits significant spatial dependence and regional heterogeneity. Spatial econometric analyses indicate that AI development is associated not only with local GTI outcomes but also with broader regional patterns. These spatial relationships remain broadly robust across alternative spatial weight matrices and model specifications. Nevertheless, the underlying mechanisms responsible for these spatial patterns require further investigation.
Overall, the findings suggest that AI development is closely associated with green technological innovation in the Yangtze River Economic Belt. At the same time, the results should be interpreted within the limitations of observational data and the adopted empirical framework. Future research using more granular micro-level data and stronger identification strategies would help clarify the causal mechanisms underlying the observed relationships.
5.3. Research Limitations and Future Prospects
This study has several limitations that should be acknowledged.
First, the analysis is constrained by the availability of city-level macro data. The primary AI indicator, measured by the number of AI-related enterprises (Ln_AI_com), captures the concentration of AI-related economic activity but may not fully reflect other dimensions of AI development, such as computing capacity, AI investment intensity, data infrastructure, or actual technology adoption. Similarly, although green innovation is differentiated into substantive and strategic categories using patent classifications, patent-based indicators may not fully capture the quality, commercial value, or practical impact of innovation activities. Future research could benefit from incorporating more detailed firm-level information, including AI-related R&D expenditures, technology adoption measures, patent quality indicators, venture capital investment, and computing infrastructure data.
Second, the environmental implications of AI development require further investigation. While AI development may be associated with improvements in green innovation performance, AI infrastructure itself consumes considerable energy and resources [15,42]. The present study does not directly quantify the environmental costs associated with data centers, computing facilities, or AI model training. Future research could develop more comprehensive evaluation frameworks that jointly consider both the potential environmental benefits and the resource requirements associated with AI development.
Third, the mechanisms linking AI development and green technological innovation remain only partially understood. Although industrial structure upgrading and technological development were examined as potential explanatory factors, the empirical evidence provides limited support for a simple linear transmission process. Future research could employ more disaggregated industry-level or firm-level data to examine whether the relationship between AI development and green innovation differs across sectors, technological fields, and stages of industrial development. Additional attention could also be given to factors such as absorptive capacity, organizational capabilities, and regional innovation environments.
Fourth, although multiple approaches were adopted to mitigate endogeneity concerns, the limitations of observational data should be recognized. The instrumental-variable estimations satisfy conventional statistical diagnostics; however, the exclusion restrictions cannot be verified directly. For example, topographic conditions may be associated with long-term economic development patterns, infrastructure accessibility, or industrial location decisions. Likewise, spatially weighted AI indicators may capture broader regional dynamics that are difficult to isolate completely from innovation outcomes. Consequently, the instrumental-variable results should be interpreted as supportive evidence rather than definitive proof of causality. Future studies may further strengthen identification by exploiting policy experiments, institutional reforms, or other exogenous shocks related to AI development.
Finally, although the study focuses on the Yangtze River Economic Belt, the generalizability of the findings to other regions and countries remains uncertain. Differences in institutional environments, industrial structures, innovation systems, and digital infrastructure may influence the relationship between AI development and green technological innovation. Comparative studies across regions and countries would help evaluate the extent to which the observed patterns are context-specific or more broadly applicable.
6. Policy Recommendations
Based on the empirical findings of this study, several policy implications can be derived.
First, policymakers should consider regional differences in digital development conditions when promoting AI-related initiatives.
The empirical results indicate that the association between AI development and green technological innovation is not uniform across cities. The exploratory non-linear analysis suggests that the relationship may vary according to the stage of AI development and local technological conditions. Therefore, a one-size-fits-all policy approach may be inappropriate. Regions with relatively limited digital infrastructure and innovation resources may require complementary investments in human capital, technological capabilities, and supporting infrastructure before they can fully benefit from AI-related development.
Second, greater attention should be paid to regional coordination in digital and innovation policies.
The spatial econometric results reveal significant spatial dependence in both AI development and green technological innovation. In addition, the estimated spillover effects suggest that developments in one city may be associated with innovation outcomes in neighboring cities. These findings imply that regional cooperation mechanisms, information-sharing platforms, and inter-city innovation networks may help strengthen the diffusion of knowledge and technological resources across the YREB. However, the precise channels through which such spillovers operate require further investigation.
Third, innovation policies should place greater emphasis on innovation quality rather than solely on innovation quantity.
The robustness analyses indicate that the positive association between AI development and green innovation is more evident for green invention patents than for utility-model patents. This finding suggests that AI development may be more closely related to higher-quality forms of green technological activity. Consequently, policymakers may consider supplementing patent-count-based evaluation systems with indicators that better reflect technological novelty, commercial applicability, and environmental effectiveness.
Finally, continued investment in innovation-supporting institutions remains important.
Although the mediation analysis does not provide strong evidence for clear linear transmission channels, the results suggest that local technological capabilities and broader innovation conditions may be relevant contextual factors associated with green technological innovation. Therefore, policies aimed at strengthening research capacity, innovation infrastructure, and technological collaboration may contribute to creating favorable conditions for the development of both digital technologies and green innovation.
Author Contributions
Conceptualization, M.C. and L.L.; methodology, M.C. and L.L.; validation, M.C. and H.L.; formal analysis, M.C.; investigation, M.C.; data curation, M.C. and H.L.; writing—original draft preparation, M.C. and H.L.; writing—review and editing, M.C. and H.L.; project administration, M.C. All authors have read and agreed to the published version of the manuscript.
Funding
This work was supported by the research grant of Pai Chai University in 2025. (2025A0129).
Institutional Review Board Statement
Not applicable.
Informed Consent Statement
Not applicable.
Data Availability Statement
The data that support the findings of this study are available in the National Bureau of Statistics of China at https://www.stats.gov.cn/english/ [accessed on 8 February 2026].
Conflicts of Interest
The authors declare no conflicts of interest.
Abbreviations
The following abbreviations are used in this manuscript:
| AI | Artificial Intelligence |
| GTI | Green Technological Innovation |
| SAR | Spatial Autoregressive Model |
| SDM | Spatial Durbin Model |
| SEM | Spatial Error Model |
| TWFE | Two-Way Fixed Effects |
| WIPO | World Intellectual Property Organization |
| YREB | Yangtze River Economic Belt |
References
- Chen, S.; Golley, J. Green productivity growth in China’s industrial economy. Energy Econ. 2014, 44, 89–98. [Google Scholar] [CrossRef] [Scilit]
- Goldfarb, A.; Tucker, C. Digital Economics. J. Econ. Lit. 2019, 57, 3–43. [Google Scholar] [CrossRef] [Scilit]
- Zhao, T.; Zhang, Z.; Liang, S. Digital economy, entrepreneurship, and high-quality economic development: Empirical evidence from urban China. Manag. World 2020, 36, 65–76. [Google Scholar]
- Ren, S.; Hao, Y.; Xu, L.; Wu, H.; Ba, N. Digitalization and energy: How does internet development affect China’s energy consumption? Energy Econ. 2021, 98, 105220. [Google Scholar] [CrossRef] [Scilit]
- Liu, Y.; Yang, Y.; Li, H.; Zhong, K. Digital economy development, industrial structure upgrading and green total factor productivity: Empirical evidence from China’s cities. Int. J. Environ. Res. Public Health 2022, 19, 2414. [Google Scholar] [CrossRef] [Scilit] [PubMed]
- Li, W.; Zheng, M. Is it substantive innovation or strategic innovation? Macro industrial policy and micro enterprise innovation. Econ. Res. J. 2016, 51, 60–73. [Google Scholar]
- Acemoglu, D.; Restrepo, P. The Race between Man and Machine: Implications of Technology for Growth, Factor Shares, and Employment. Am. Econ. Rev. 2018, 108, 1488–1542. [Google Scholar] [CrossRef] [Scilit]
- Li, X.; Ye, C. A new measurement of artificial intelligence and its application. J. World Econ. 2026, 49, 102–125. [Google Scholar]
- Chen, M.; Zhang, Y. Research on the impact of artificial intelligence application on the peer effect of green technological innovation. J. Changzhou Univ. (Soc. Sci. Ed.) 2026, 27, 60–73. [Google Scholar] [CrossRef]
- Dong, F.; Hu, M.; Gao, Y.; Liu, Y.; Zhu, J.; Pan, Y. How does digital economy affect carbon emissions? Evidence from global 60 countries. Sci. Total Environ. 2022, 852, 158401. [Google Scholar] [CrossRef] [Scilit] [PubMed]
- Yu, Y.; Sun, P.; Hong, J. Application of industrial robots and upgrading of manufacturing structure. China Ind. Econ. 2021, 10, 100–120. [Google Scholar]
- Li, B.; Liu, Z.; Jia, X.; Ma, F. Digital finance, financing constraints, and green technological innovation: A spatial analysis. Glob. Financ. J. 2024, 61, 100988. [Google Scholar] [CrossRef] [Scilit]
- Borenstein, S. A microeconomic framework for evaluating energy efficiency rebound and some implications. Energy J. 2015, 36, 1–22. [Google Scholar] [CrossRef] [Scilit]
- Lange, S.; Pohl, J.; Santarius, T. Digitalization and energy consumption: Does ICT reduce energy demand? Ecol. Econ. 2020, 176, 106760. [Google Scholar] [CrossRef] [Scilit]
- de Vries, A. The growing energy footprint of artificial intelligence. Joule 2023, 7, 2191–2194. [Google Scholar] [CrossRef] [Scilit]
- Cui, W. Has artificial intelligence promoted green innovation? Sci. Decis. 2024, 4, 61–74. [Google Scholar]
- Jing, W.; Sun, B. Evolution and impact mechanism of network effects in the new formats of the digital economy. Econ. Res. J. 2019, 54, 4–21. [Google Scholar]
- Bai, P.; Zhang, Y. Research on the impact of digital economy development on China’s total factor productivity. Stat. Res. 2021, 38, 33–45. [Google Scholar]
- He, X.; Ruan, J.; Bian, C. Has the application of artificial intelligence promoted green innovation in the three major urban agglomerations of the Yangtze River Economic Belt? From the perspectives of “digital dividend” and “digital divide”. Econ. Geogr. 2024, 44, 137–147. [Google Scholar] [CrossRef]
- Song, Y.; Wang, J.; Ge, Y.; Xu, C. An optimal parameters-based geographical detector model enhances geographic characteristics of explanatory variables for spatial heterogeneity analysis. GIScience Remote Sens. 2020, 57, 593–610. [Google Scholar] [CrossRef] [Scilit]
- Luo, G.; Guo, J.; Yang, F.; Wang, C. Environmental regulation, green innovation and high-quality development of enterprise: Evidence from China. J. Clean. Prod. 2023, 418, 138112. [Google Scholar] [CrossRef] [Scilit]
- Huang, Z.; Jiang, P. Digital Road to Low Carbon: Industrial Robots and Urban Industrial Carbon Emissions. J. Financ. Econ. 2023, 49, 4–18. [Google Scholar] [CrossRef]
- Guo, F.; Wang, J.; Wang, Z.; Kong, T.; Zhang, X.; Cheng, Z. Measuring China’s Digital Financial Inclusion: Index Compilation and Spatial Characteristics. China Econ. Q. 2020, 19, 1401–1418. [Google Scholar] [CrossRef]
- Sun, X.; Song, Y.; Zhao, P. How does Artificial Intelligence Affect Labor Income—Micro Analysis and Empirical Test Based on Personal Ability. J. Shanxi Univ. Financ. Econ. 2022, 44, 17–29. [Google Scholar] [CrossRef]
- Yang, G.; Li, S.Q.; Xu, T.H.; Subhash, L.; Bu, S.Q.; Gu, C.H.; Ai, Q. Distributed Model Predictive Control Strategy for Multi-Energy Virtual Power Plant Based on Digital Twin. IEEE Trans. Smart Grid 2025, 17, 1971–1984. [Google Scholar] [CrossRef] [Scilit]
- Yao, J.; Zhang, K.; Guo, L.; Feng, X. How does artificial intelligence improve enterprise production efficiency? From the perspective of labor skill structure adjustment. Manag. World 2024, 2, 101–133. [Google Scholar] [CrossRef]
- Chen, W.; Pan, L.; Lin, C.; Zhao, M.; Li, T.; Wei, X. Efficiency Evaluation of Green Technology Innovation of China’s Industrial Enterprises Based on SBM Model and EBM Model. Math. Probl. Eng. 2021, 2021, 6653474. [Google Scholar] [CrossRef] [Scilit]
- Fu, L.H. An Empirical Study on the Relationship between Industrial Structure Advanced and Economic Growth in China. Stat. Res. 2010, 27, 79–86. [Google Scholar] [CrossRef]
- Elhorst, J.P. Spatial Econometrics: From Cross-Sectional Data to Spatial Panels; Springer: Berlin/Heidelberg, Germany, 2014. [Google Scholar] [CrossRef] [Scilit]
- Li, H.; Chen, Y. Does Artificial Intelligence Promote Firms’ Green Technological Innovation? Sustainability 2025, 17, 4900. [Google Scholar] [CrossRef] [Scilit]
- Ashergawi, M.; Aljuhmani, H.Y.; Alzubi, A.B. Empowering green innovation through artificial intelligence: The strategic role of organizational agility and technological readiness in the Turkish construction sector. Eng. Manag. J. 2026. [Google Scholar] [CrossRef] [Scilit]
- Lu, G.; Li, B. Artificial Intelligence and Green Collaborative Innovation: An Empirical Investigation Based on a High-Dimensional Fixed Effects Model. Sustainability 2025, 17, 4141. [Google Scholar] [CrossRef] [Scilit]
- Zhang, W.; Liu, X.; Wang, D.; Zhou, J. Digital economy and carbon emission performance: Evidence at China’s city level. Energy Policy 2022, 165, 112927. [Google Scholar] [CrossRef] [Scilit]
- Zhou, L.; Qu, C.; Zhi, L. Research on the Impact of Digital Infrastructure on Urban Breakthrough Green Innovation: A Case Study of the Yangtze River Economic Belt in China. Sustainability 2024, 16, 9650. [Google Scholar] [CrossRef] [Scilit]
- Magdalena, R.; Sharif Karimi, M.; Si Mohammed, K.; Dumitru, M.; Hagiu, A. Pioneering sustainable energy: A dynamic analysis of AI and green patents in renewable and nuclear power. Int. J. Public Adm. 2025, 28, 2519068. [Google Scholar] [CrossRef] [Scilit]
- Sun, G.; Song, Y.; Xiao, J.; Xu, D. Artificial Intelligence and Sustainable Aviation Manufacturing: A Perspective from Green Innovation in China. Sustainability 2026, 18, 4298. [Google Scholar] [CrossRef] [Scilit]
- Anselin, L. Local indicators of spatial association—LISA. Geogr. Anal. 1995, 27, 93–115. [Google Scholar] [CrossRef] [Scilit]
- Li, Z.; Wang, J. The dynamic impact of digital economy on carbon emission reduction: Evidence city-level empirical notes in China. J. Clean. Prod. 2022, 351, 131570. [Google Scholar] [CrossRef] [Scilit]
- Monsalve-Castro, C.; Ramírez Molina, R.I.; Fajardo, E.J.; Soto Polo, G.P. Artificial intelligence as a driver in adopting green innovation in the agricultural sector: Evidence from an emerging economy. Cogent Bus. Manag. 2025, 12, 2575261. [Google Scholar] [CrossRef] [Scilit]
- Añón Higón, D.; Gholami, R.; Shirazi, F. ICT and environmental sustainability: A global perspective. Telemat. Inform. 2017, 34, 85–95. [Google Scholar] [CrossRef] [Scilit]
- Teixidó, J.; Verde, S.F.; Nicolli, F. The impact of the EU Emissions Trading System on low-carbon technological change: The empirical evidence. Ecol. Econ. 2019, 164, 106347. [Google Scholar] [CrossRef] [Scilit]
- Li, P.; Yang, J.; Islam, M.A.; Ren, S. Making AI less “thirsty”: Uncovering and addressing the secret water footprint of AI models. arXiv 2023, arXiv:2304.03271. [Google Scholar] [CrossRef] [Scilit]
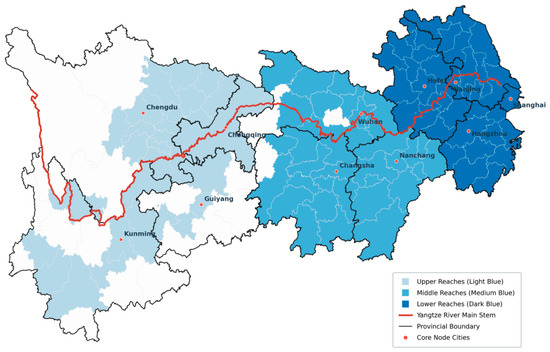
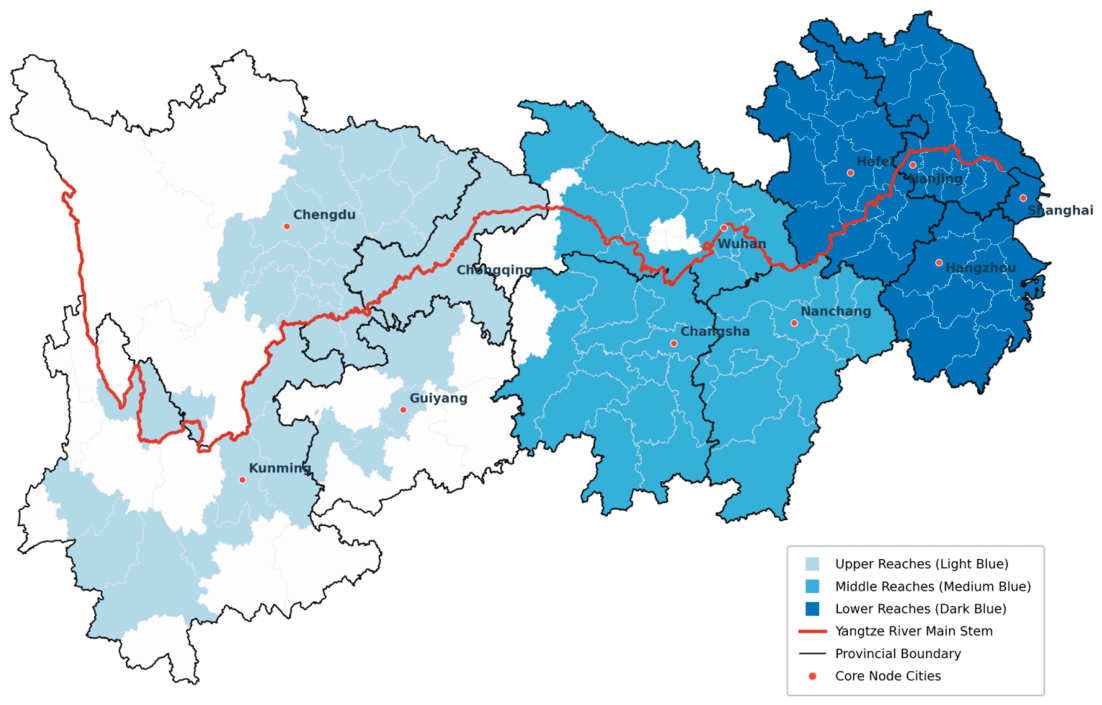
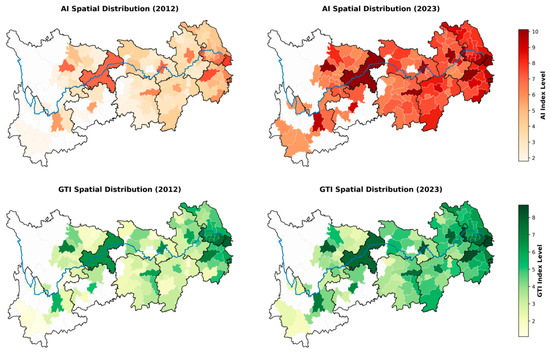
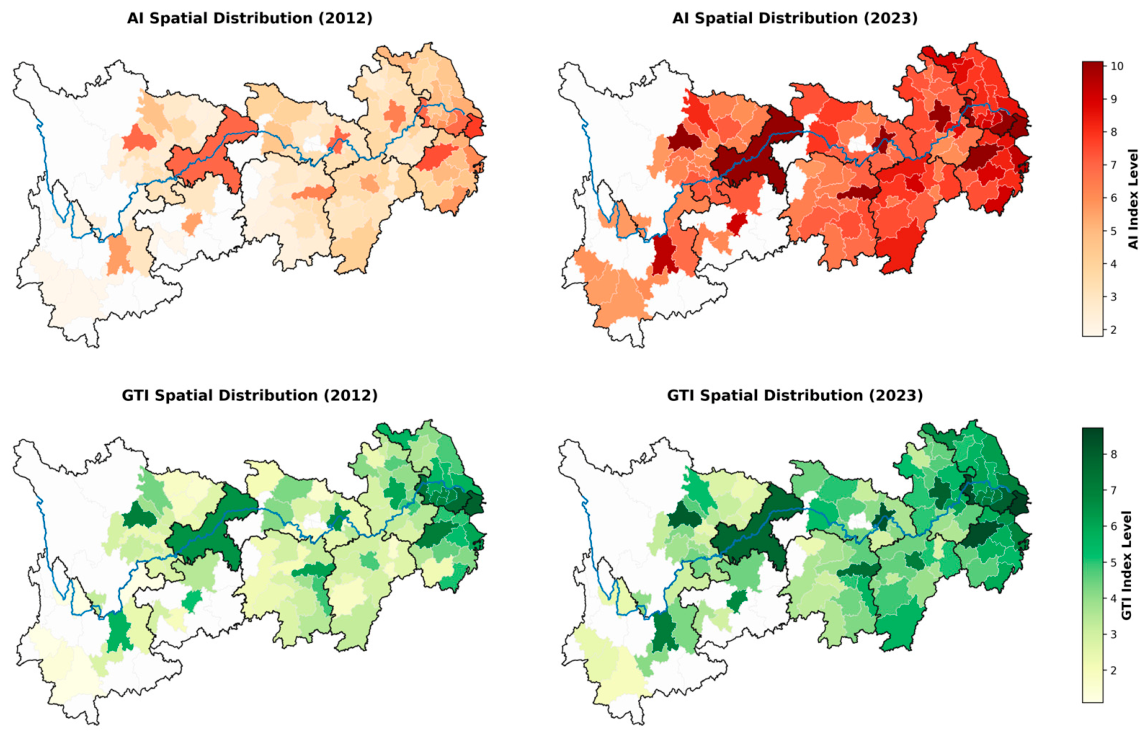
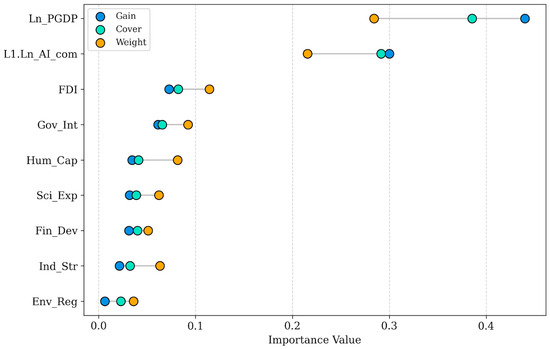
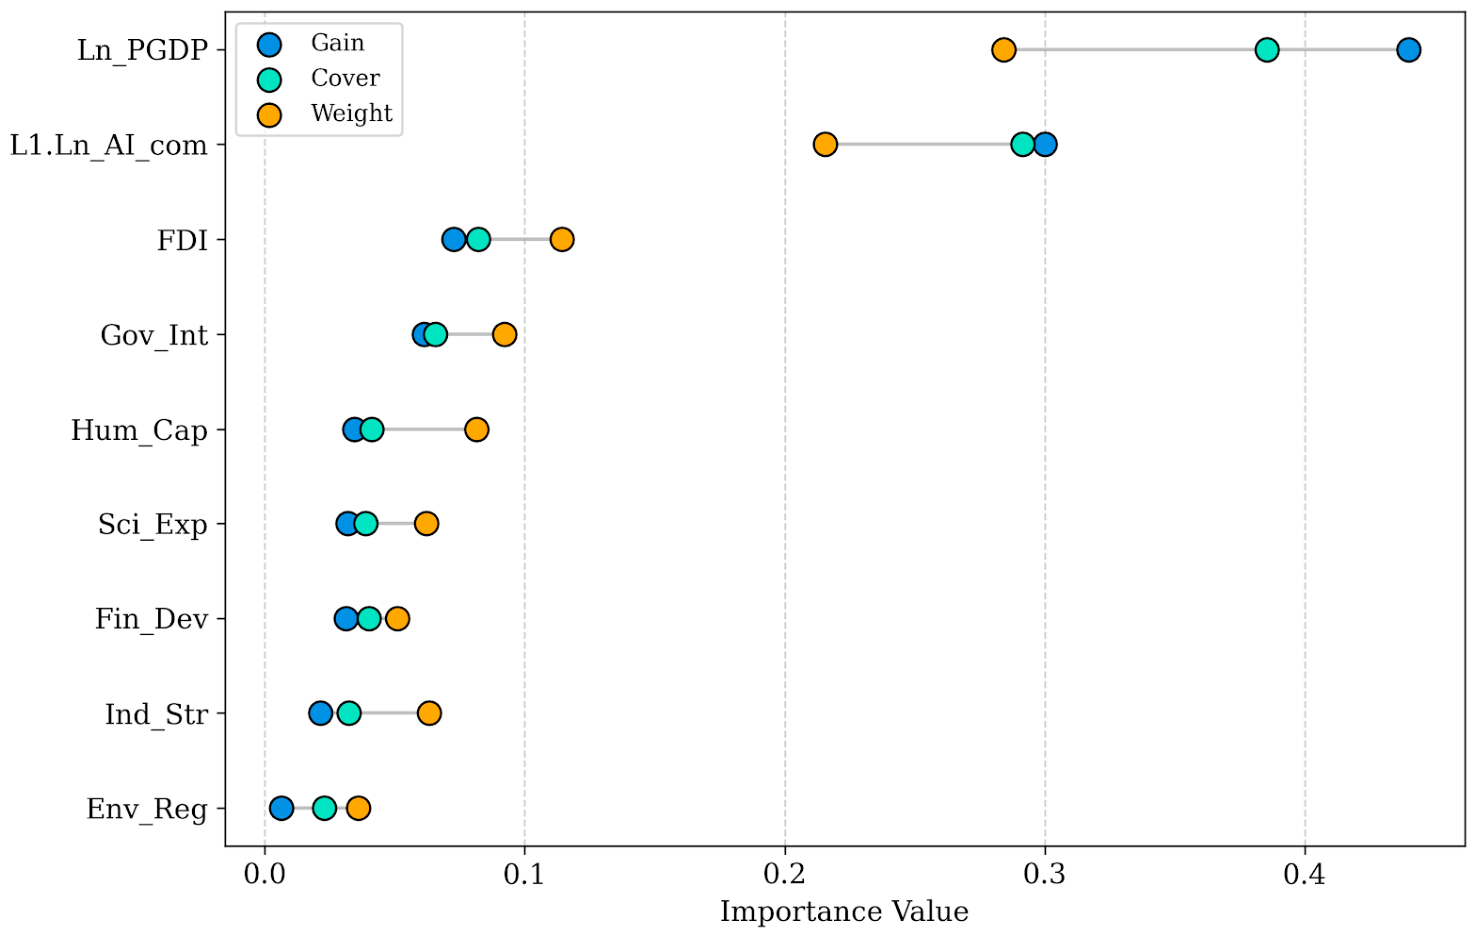
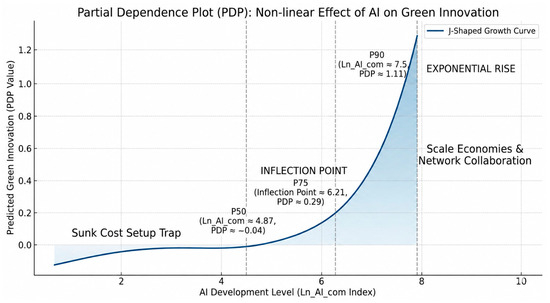
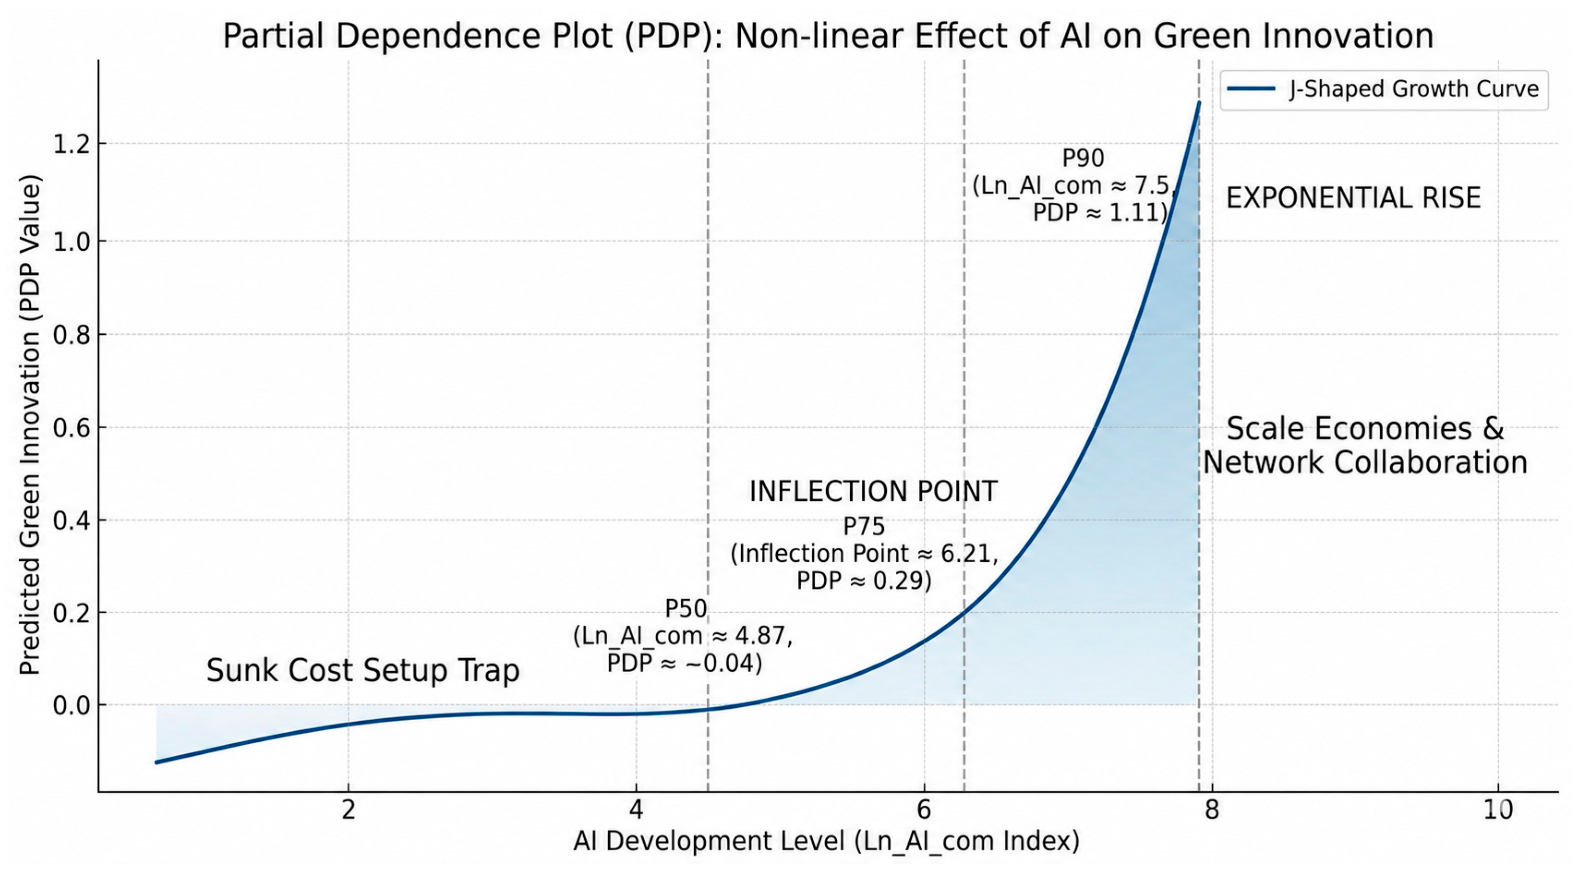

Disclaimer/Publisher’s Note: The statements, opinions and data contained in all publications are solely those of the individual author(s) and contributor(s) and not of MDPI and/or the editor(s). MDPI and/or the editor(s) disclaim responsibility for any injury to people or property resulting from any ideas, methods, instructions or products referred to in the content. |
© 2026 by the authors. Licensee MDPI, Basel, Switzerland. This article is an open access article distributed under the terms and conditions of the Creative Commons Attribution (CC BY) license.