


Abstract
Abandoned slopes often encounter problems such as compacted soil and lack of nutrients. Biochar, as a promising soil amendment agent, can effectively enhance soil fertility. Moreover, evaluating the nutrient and microbial characteristics during the improvement process is of great significance for revealing its mechanism of action in improving abandoned land. This study analyzed the characteristics of soil nutrients, microbial community structure, and co-occurrence network after reclamation under different application rates (0%, 1%, 2.5%, 4%, 5.5%, hereinafter referred to as CK, T1, T2, T3, T4) of corn straw biochar. The results showed that biochar significantly increased soil organic carbon (by 60.74–164.82%), total nitrogen (11.31–27.73%), and total phosphorus (13.32–56.03%) content, and the effect was best at a rate of 4% (T3). With the increase in biochar application rate, soil bulk density generally showed a downward trend, and pH generally showed an upward trend. Significant levels (p < 0.05) were reached from T2 to T4. There was a strong linear correlation between biochar application rate and soil organic matter, total nitrogen, and pH in the fitted model, with R2 values reaching 0.753, 0.601, and 0.706, respectively. Microbial community analysis showed that biochar application changed the bacterial community structure. With the increase in soil depth, the Shannon index and Chao index of each treatment generally increased, indicating that soil depth is one of the key factors regulating the community structure. Biochar application promoted the proliferation of beneficial bacterial groups such as Pseudomonadota and Acidobacteriota, by increasing the number of co-occurrence network nodes and edges enhancing the complexity and stability of the microbial network.
1. Introduction
Soil degradation is a prominent environmental issue worldwide, seriously threatening ecosystem services, food security and agricultural productivity and affecting key ecological processes such as carbon cycling and biodiversity [1,2]. Karst regions in China, characterized by unique geological structures, shallow soil layers, and severe soil erosion, have emerged as ecologically fragile areas facing critical soil degradation [3]. Guizhou Province, as a typical representative of karst landforms, has long been plagued by poor soil quality, low land productivity, and degraded ecosystem functions. To address the deterioration of the ecological environment, this region has implemented large-scale reforestation and grassland restoration projects on sloping farmland, resulting in a large amount of land resources at different stages of abandonment [4]. Usually, these abandoned sloping farmlands often have problems such as compact soil structure and lack of nutrients. Especially in the ecologically fragile karst areas, this will lead to a slower and more unstable natural recovery rate of the soil ecosystem, posing severe challenges to the formulation of ecological restoration strategies in the karst regions and the re-development of agricultural production potential [5,6]. Therefore, exploring efficient and stable soil-assisted improvement technologies to accelerate the reconstruction of degraded soil ecological functions is an urgent scientific issue and practical need at present.
Biochar is a carbon-rich solid substance formed through the pyrolysis of biomass [7]. Its porous structure, high specific surface area, strong adsorption capacity, and abundant surface functional groups give it great potential in improving soil physical and chemical properties, enhancing soil fertility, and regulating microbial communities [8,9]. Previous studies have shown that the application of biochar can promote the proliferation and function of beneficial microorganisms, stimulate their activities, and have a positive impact on soil microbial activities [10,11,12]. However, it has been documented that biochar also has neutral/negative effects on soil biological characteristics. For instance, Elzobair et al. [13] found that applying biochar in arid soil had no effect on soil extracellular enzyme activity, microbial community structure, microbial biomass, or arbuscular mycorrhizal fungal root colonization. This is not surprising, as various characteristics of biochar, soil types, climatic conditions, and land use patterns all have an impact on microbial properties [12,13]. It is notable that the impact of biochar on microbial communities largely depends on the application rate of biochar and the type of soil [14]. Changes in microbial functions and community structures only occur when the application rate of biochar is sufficiently high to significantly alter the soil’s water retention capacity, pH conditions, and/or nutrient concentrations [14,15]. If the application rate of biochar is insufficient to affect the soil’s acidity and alkalinity, then the microbial community may not be stimulated. For example, increasing the application rate of biochar from 0.5% to 5.0% would change the total phospholipid fatty acid content in the soil and the relative abundance of bacteria [15]. Therefore, the amount of biochar applied is a key factor influencing the diversity and composition of microorganisms in the soil [16].
Although there have been many studies on the impact of biochar on microbial communities [16,17,18], it is still unclear how it benefits soil microorganisms. The positive responses observed in laboratory experiments are not always reflected in the field [19], especially in karst areas where yellow soil, due to its special soil formation environment, typically has strong acidity, rapid nutrient leaching, and poor water and nutrient retention capacity [20,21]. This makes the application effect and mechanism of biochar in this region possibly different from other soil types. Although some studies have explored the improvement effect of biochar on karst soil, most of them focused on short-term or pot experiments. For long-unplowed soil ecosystems, a relatively stable but potentially sluggish soil ecosystem has formed. How the intervention of biochar will affect its key physical, chemical and biological properties, thereby influencing the coupling mechanism that affects the structure, function and network interactions of microbial communities, urgently needs in-depth discussion. This is of great significance for the sustainable development of soil.
Therefore, this study adopted a completely random design to reclaim a sloping farmland that had been abandoned for 20 years in the karst area of Guizhou Province, and biochar was added simultaneously during the reclamation process. One year after the addition of biochar, quantitative studies were conducted on the physical and chemical properties of the soil, as well as the composition and diversity characteristics of the bacterial community. The differences in these characteristics along the vertical direction of the soil (0–30 cm layer) were also discussed. The improvement effect of biochar on the abandoned karst sloping farmland was explored, and the intrinsic relationship between the change of bacterial community and the application of biochar was revealed. Thus, this study provided scientific support for the restoration of soil fertility in karst ecosystems after degradation and the sustainable development of agriculture.
2. Materials and Methods
2.1. Experimental Plot
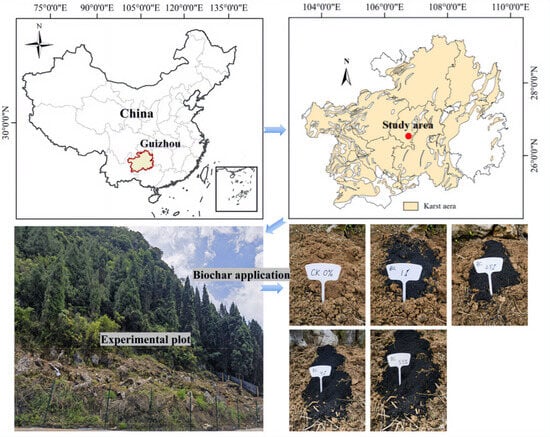
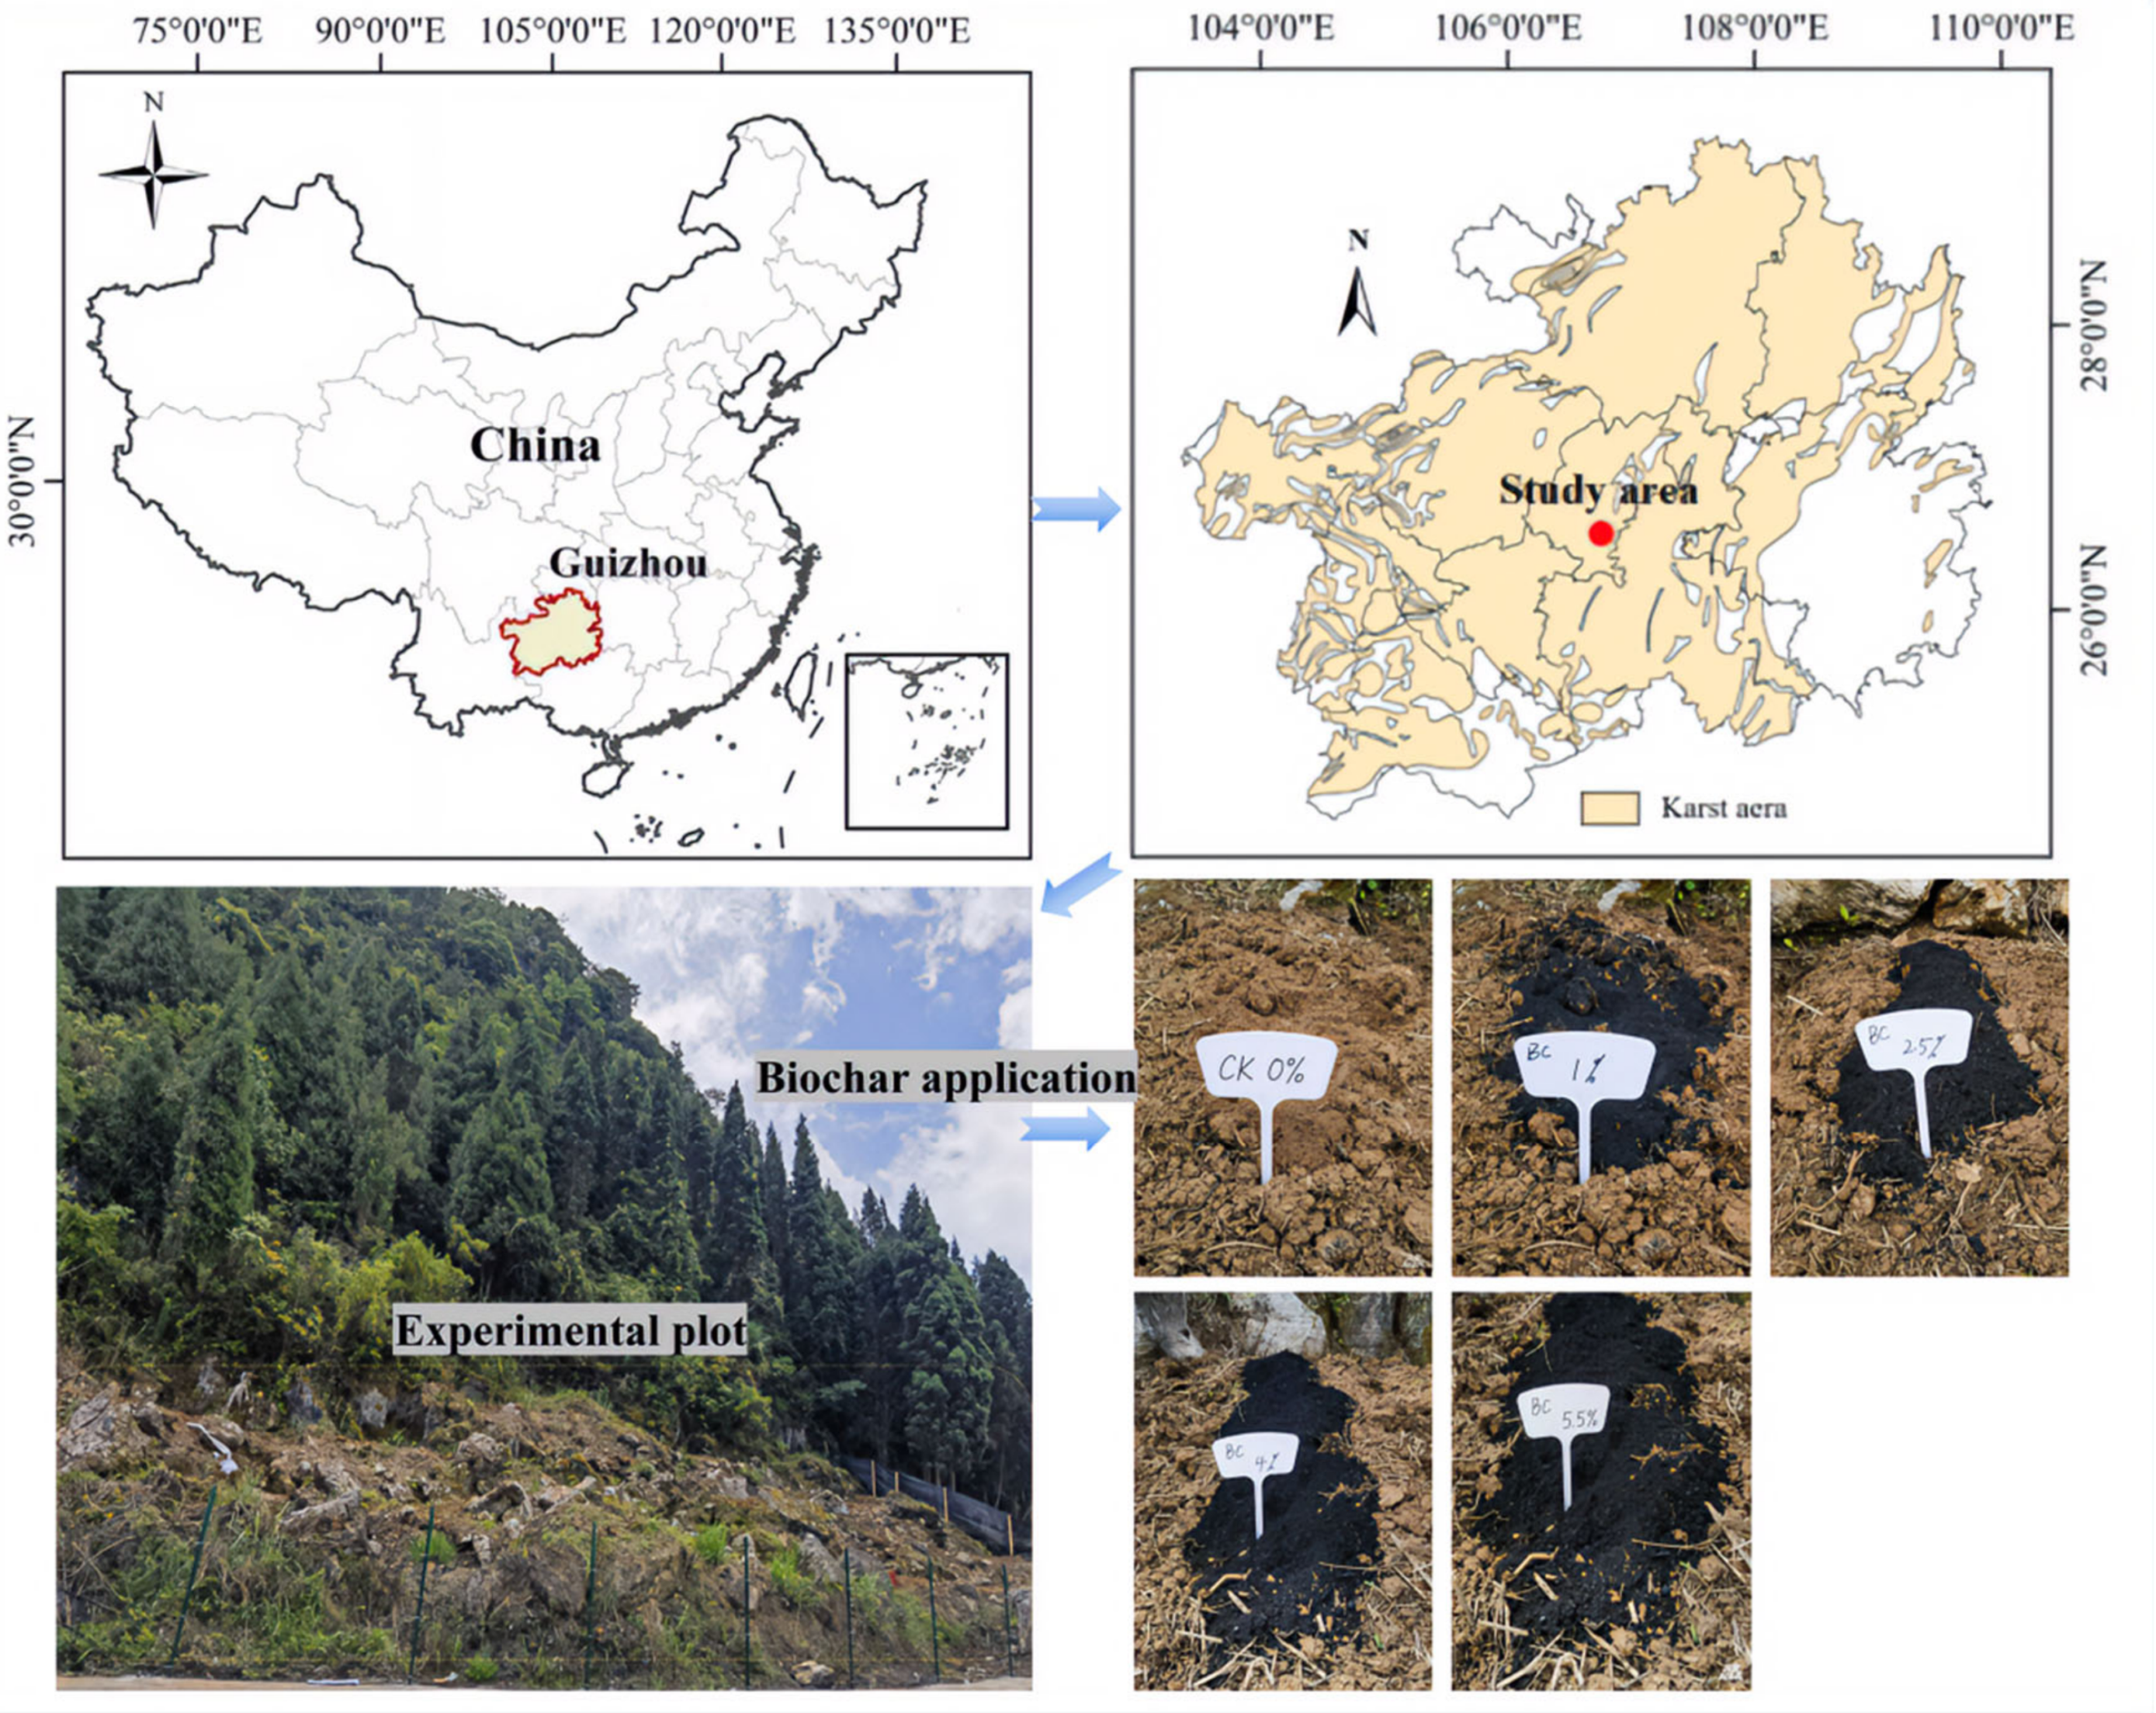
The experimental site is located in the typical sloping farmland of Xixiu District, Anshun City, Guizhou Province (Figure 1). The slope angle is approximately 10°. It is located in the subtropical monsoon climate zone. The geographical coordinates are 26.26° N latitude and 106.07° E longitude. The annual average temperature is about 14.8 °C, and the precipitation mainly occurs in summer, with an annual precipitation ranging from 1280 mm to 1530 mm. Rain and heat occur simultaneously. The experimental site was abandoned in December 2004. Twenty years later, in December 2024, it was redeveloped. During the re-development process, biochar was applied; that is, biochar was applied in December 2024. Soil samples were collected and indicators were measured one year after the application of biochar (in December 2025).
Figure 1.
Experimental plot.
2.2. Biochar Materials and Their Application
Twenty years after being abandoned, the bulk density of sloping farmland is 1.68 g/cm3, which is not conducive to the growth of crop roots. Therefore, during reclamation, it may be necessary to improve soil fertility and structure through fertilization. Given that previous studies and those of the author have demonstrated that biochar can improve soil structure and increase soil nutrients, it can be used as a soil conditioner to enhance soil fertility after reclamation [22,23].
A completely random design was adopted, and experimental plots were set up. The length and width of each experimental plot were 200 cm by 80 cm. In each experimental plot, the content ratios of corn stalk biochar were 1%, 2.5%, 4% and 5.5%, respectively (hereinafter referred to as T1, T2, T3 and T4 in sequence) (Figure 1), and the application depth was 0–30 cm. The application amounts of biochar for groups T1 to T4 can be calculated by area × depth × density × mass percentage, which are 10.75, 26.88, 43.01 and 59.14 kg, respectively. The blank control did not receive any biochar application (hereinafter referred to as CK). Each treatment was set with 3 replicates, totaling 15 experimental plots. No crops were planted during the experiment. Regular manual weeding was carried out to ensure that the experimental conditions of each plot were as close as possible.
2.3. Sample Collection and Determination Indicators
In December 2025, soil samples were collected from each experimental soil block. The sampling depth was 0–10 cm, 10–20 cm, and 20–30 cm. A portion of the fresh samples was preserved in dry ice and immediately sent to the laboratory for soil microbial diversity sequencing. Using Illumina sequencing technology, Novaseq PE 250 platforms were employed for processing, and PANDAseq (version 1.12) was used for assembly to obtain high-variable region length reads. The DNA integrity detection method is agglomerated gel electrophoresis, with the sequencing regions being ITS1F_ITS2R. The selected primers are ITS1F (primer series: CTTGGTCATTTAGAGGAAGTAA) and ITS2R (primer sequences: GCTGCGTTCTTCATCGATGC). The formal PCR test adopted the Pro Taq, 20 μL reaction system: the size of the target band of the PCR products of all samples was correct, and all samples were qualified. The PCR amplification region was 338F_806R, and the sequencing length was PE300 bp. The 16S rRNA sequence length ranged from 220 BP to 500 BP, and the average quality value of each read was greater than 20, with no more than 3 Ns. Sequences with 97% similarity were clustered, and species identification and removal of chimeric sequences were performed using USEARCH v11 (v11.0.667). The ASV data was standardized using the minimum normalization method, and the diversity of the bacterial community at the phylum classification level was analyzed.
Another portion was sent to the laboratory for air-drying and determination of the main physical and chemical properties of the soil, including pH, total nitrogen, total phosphorus, total potassium, and organic carbon content. Soil pH was determined by the potentiometric method, total nitrogen content was determined by the Kjeldahl nitrogen determination method, total phosphorus was determined by the antimony–molybdenum colorimetric method, TK was determined by the sodium hydroxide fusion-flame photometric method, and the organic carbon content was determined using the high-temperature external thermogravimetric potassium dichromate oxidation titration method.
2.4. Statistical Analysis
The data were statistically analyzed using spss 26.0. The main contents included basic statistical analysis of each indicator, t-test, post hoc test of the least significant difference (LSD), and Pearson correlation analysis. Data organization and chart drawing were conducted using Excel 2016 and origin 2021b.
The microbial community diversity was calculated using Mothur (version 1.48.4) software. Among them, the bacterial diversity was evaluated using the Shannon and Chao abundance indices. Non-metric multidimensional scaling (NMDS) was used to describe the clustering relationship among soil samples. Principal coordinate analysis (PCA) based on Bray–Curtis distance was used to test the significance of differences among different biochar application treatments. CCA analysis was used to determine the correlation between soil properties and bacterial community structure.
3. Results
3.1. The Impact of Biochar Addition on Soil
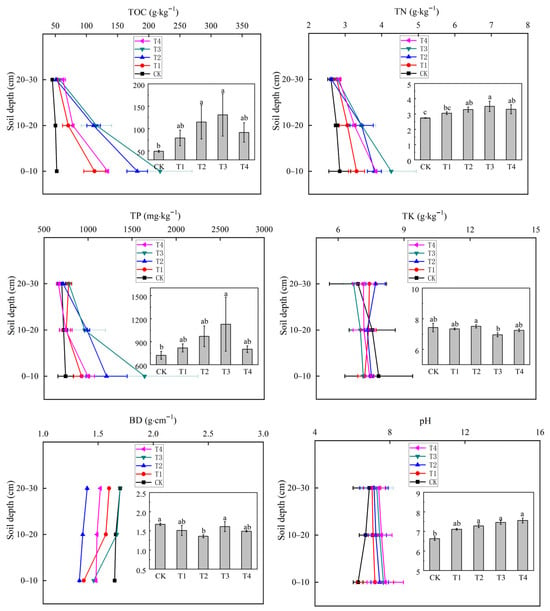
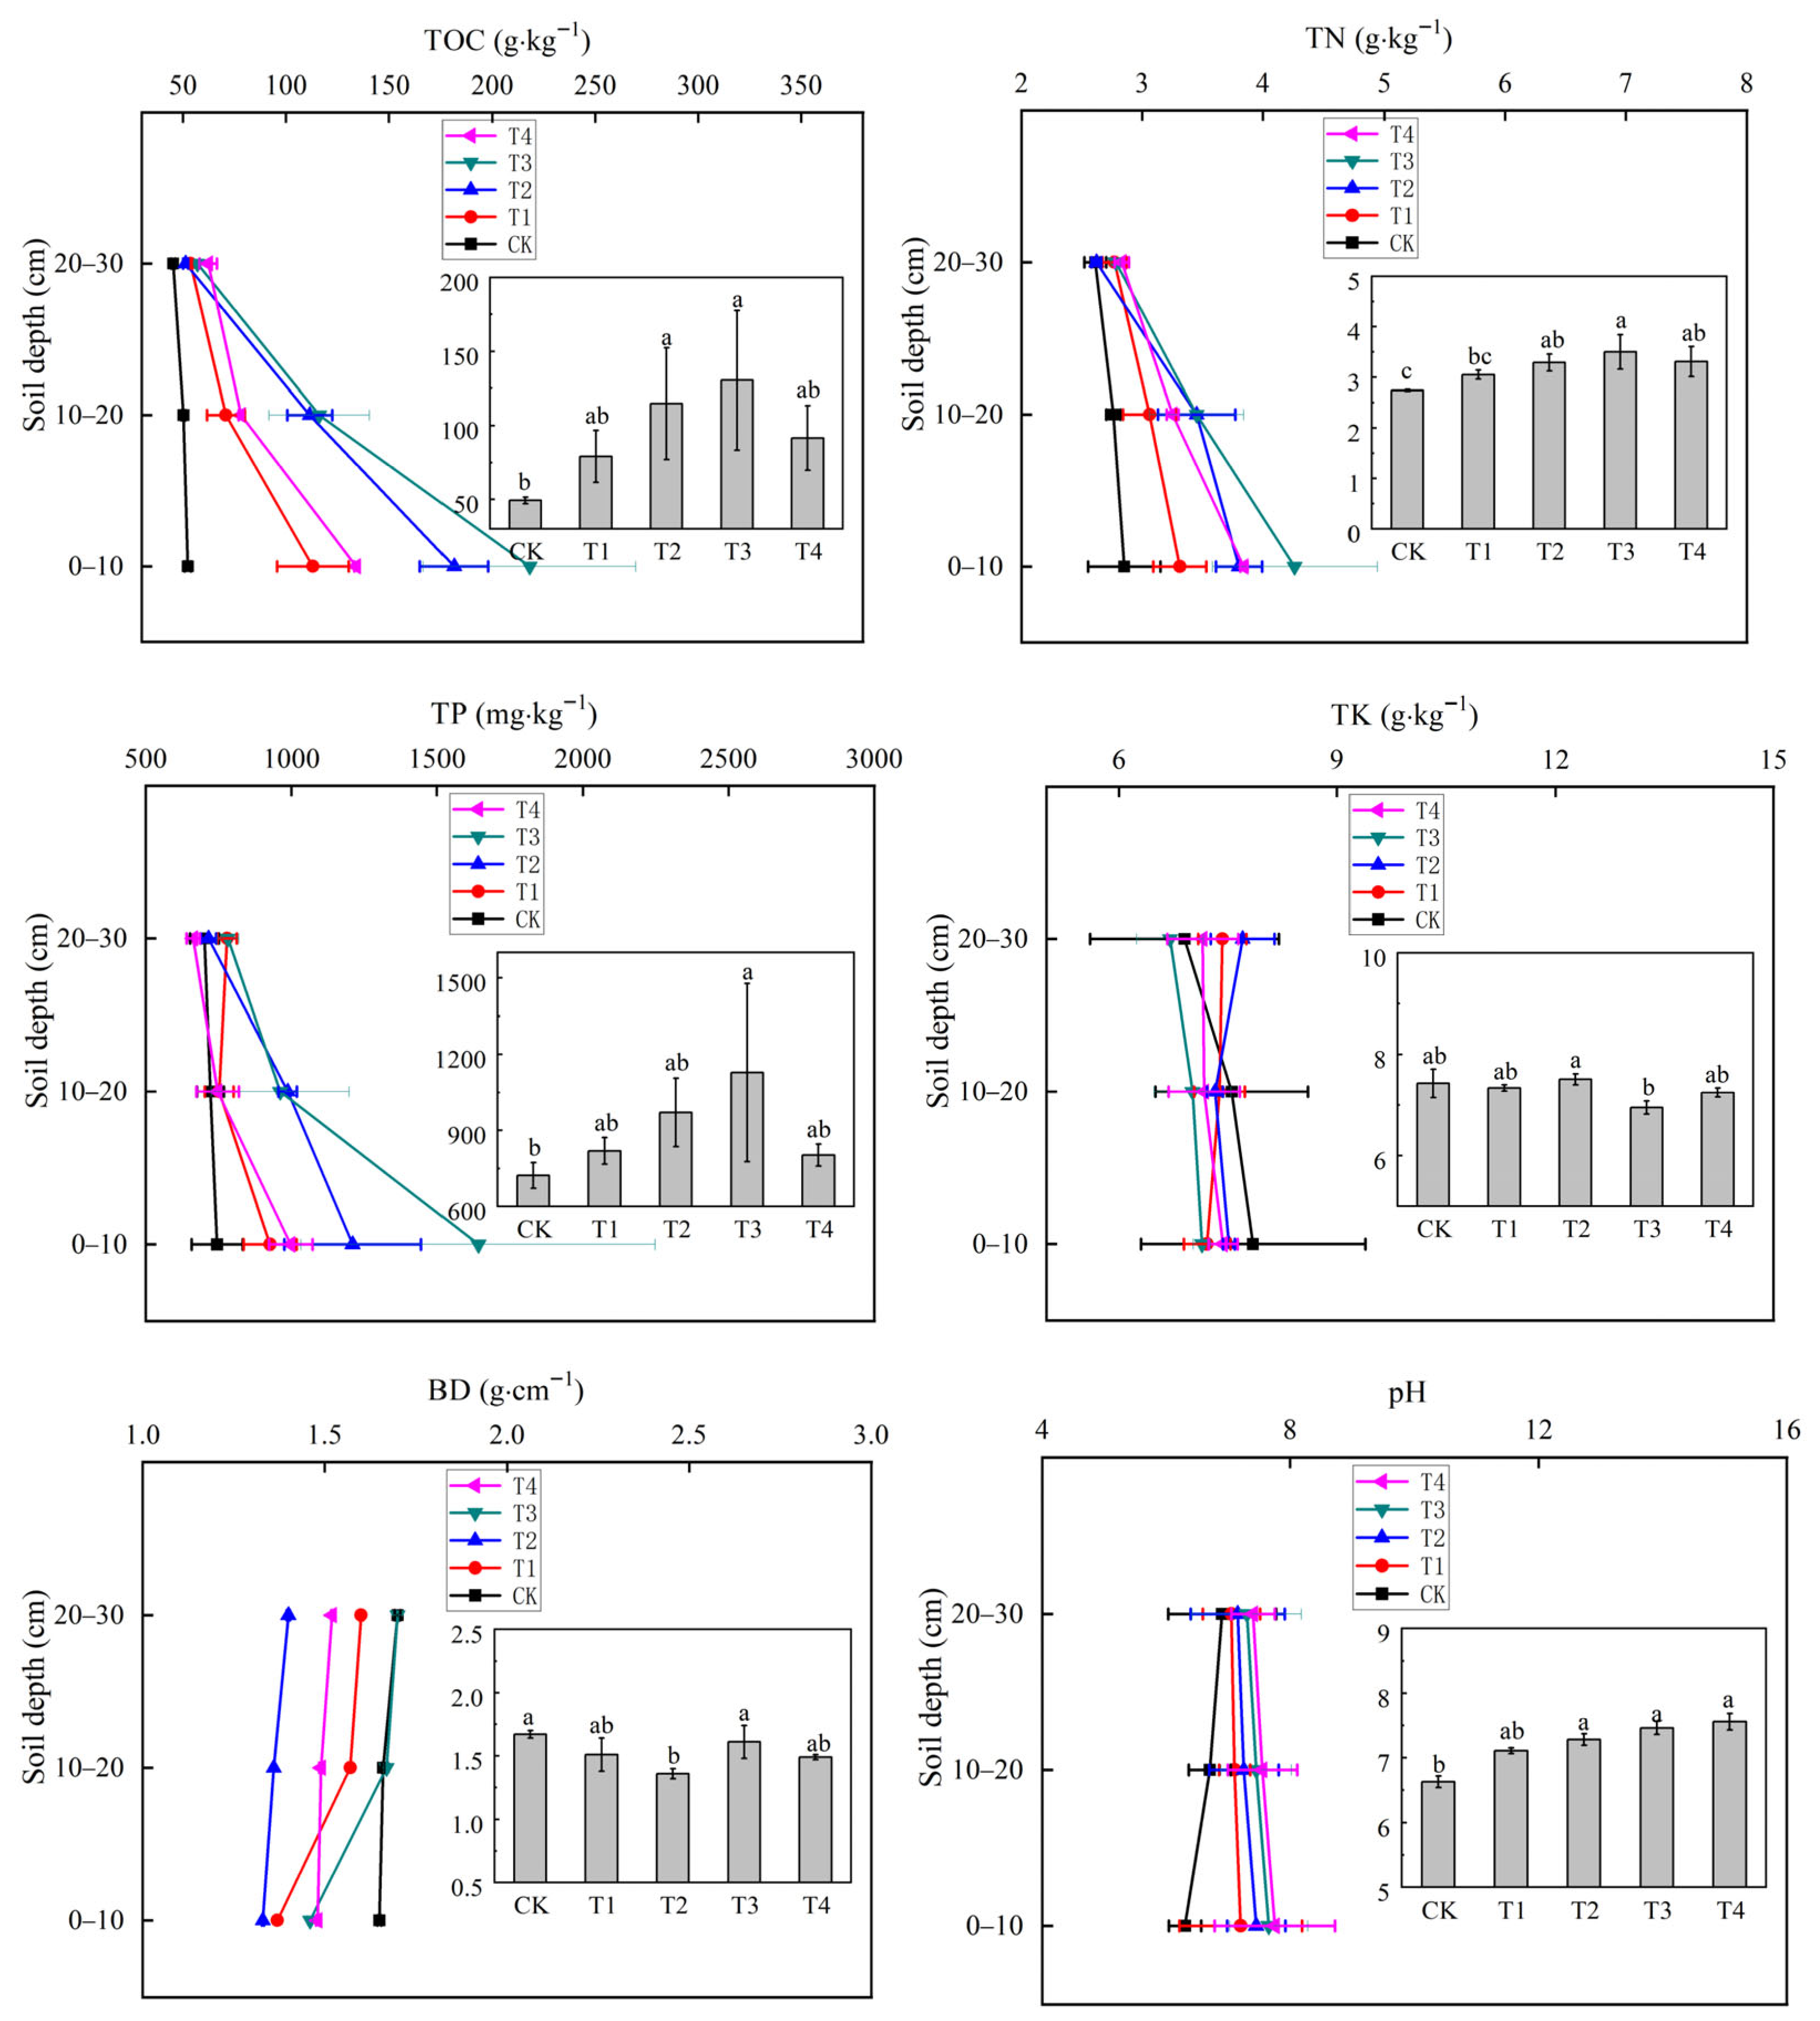
As shown in Figure 2, compared with CK, the application of biochar (T1–T4) increased the total organic carbon content in the soil, reaching significant levels under T2 and T3 treatments (p < 0.05). With the increase in application amount, the total organic carbon content showed a trend of first increasing and then decreasing. Under the T1, T2, T3, and T4 treatments, the total organic carbon was successively 60.74%, 132.96%, 164.82%, and 85.83% higher than that of CK. With the increase in soil depth, the total organic carbon in the soil showed a decreasing trend. Overall, compared with other treatments, in the 0–10 cm and 10–20 cm soil layers of the T3 treatment, the organic carbon content was the highest, which was 218.15 g/kg and 116.2 g/kg, respectively (Table 1).
Figure 2.
Soil properties in different soil layers after biochar application (the differences among mean values of each indicator were analyzed using the least significant difference (LSD) method; different lowercase letters indicate that the means of each index have significant differences (p < 0.05)), the bar chart shows the average values under each treatment, and the curves represent the measured values under the soil layers of 0–10 cm, 10–20 cm, and 20–30 cm. TOC = total organic carbon, TN = total nitrogen, TP = total phosphorus, TK = total potassium, BD = bulk density, pH = hydrogen potential; CK, T1, T2, T3, and T4 successively represent the biochar application amounts of 0%, 1%, 2.5%, 4%, and 5.5%.
Table 1.
Soil nutrients at different soil layer depths.
Compared with CK, the application of biochar increased the total nitrogen content in the soil. Under the T1, T2, T3 and T4 treatments, the total organic carbon was successively 11.31%, 20.07%, 27.73% and 20.80% higher than that of the CK. It reached a significant level under the T2–T4 treatments (p < 0.05). The total nitrogen content in the soil showed a trend of increasing first and then decreasing with the increase in biochar application amount. As the soil depth increased, the total nitrogen content in the soil showed a decreasing trend. Overall, compared with other treatments, the total nitrogen content in the 0–10 cm and 10–20 cm soil layers in the T3 treatment was the highest, which was 4.26 g/kg and 3.45 g/kg, respectively (Table 1).
Application of biochar increased the total phosphorus content in soil, reaching significant levels under treatment T3 (p < 0.05); the total phosphorus contents in treatment groups T1, T2, T3, and T4 were 13.32%, 34.33%, 56.03%, and 11% higher, respectively, than that in the control group (CK). As the amount of biochar applied increased, the total phosphorus content first rose and then declined. With the increase in soil depth, the total phosphorus contents in the soil all showed a decreasing trend. Compared with other treatments, the T3 treatment had the highest total phosphorus content in the 0–10 cm soil layer, which was 1640.15 mg/kg (Table 1).
The effect of biochar application on soil total potassium content was not significant (p > 0.05). The total potassium content in the CK, T1, T2, T3, and T4 treatments is 7.43, 7.34, 7.51, 6.95, and 7.25 g/kg, respectively. With the increase in soil depth, the total potassium content generally shows a decreasing trend. Compared with other treatments, the total potassium content in the 0–10 cm, 10–20 cm, and 20–30 cm soil layers in CK is the highest, which is 7.84, 7.55 g/kg, and 6.9 g/kg, respectively. With the increase in the amount of biochar added, the soil bulk density generally shows a downward trend. A significant difference is observed in the T2 treatment (p < 0.05). The pH value generally shows an increasing trend, and it reaches a significant level in the T2–T4 treatments (p < 0.05).
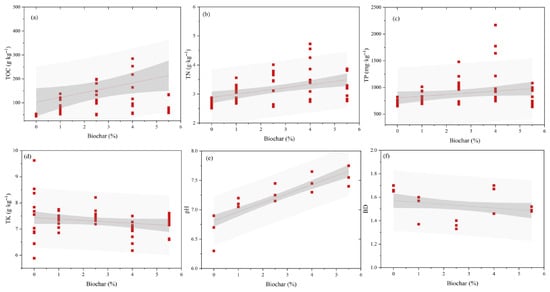
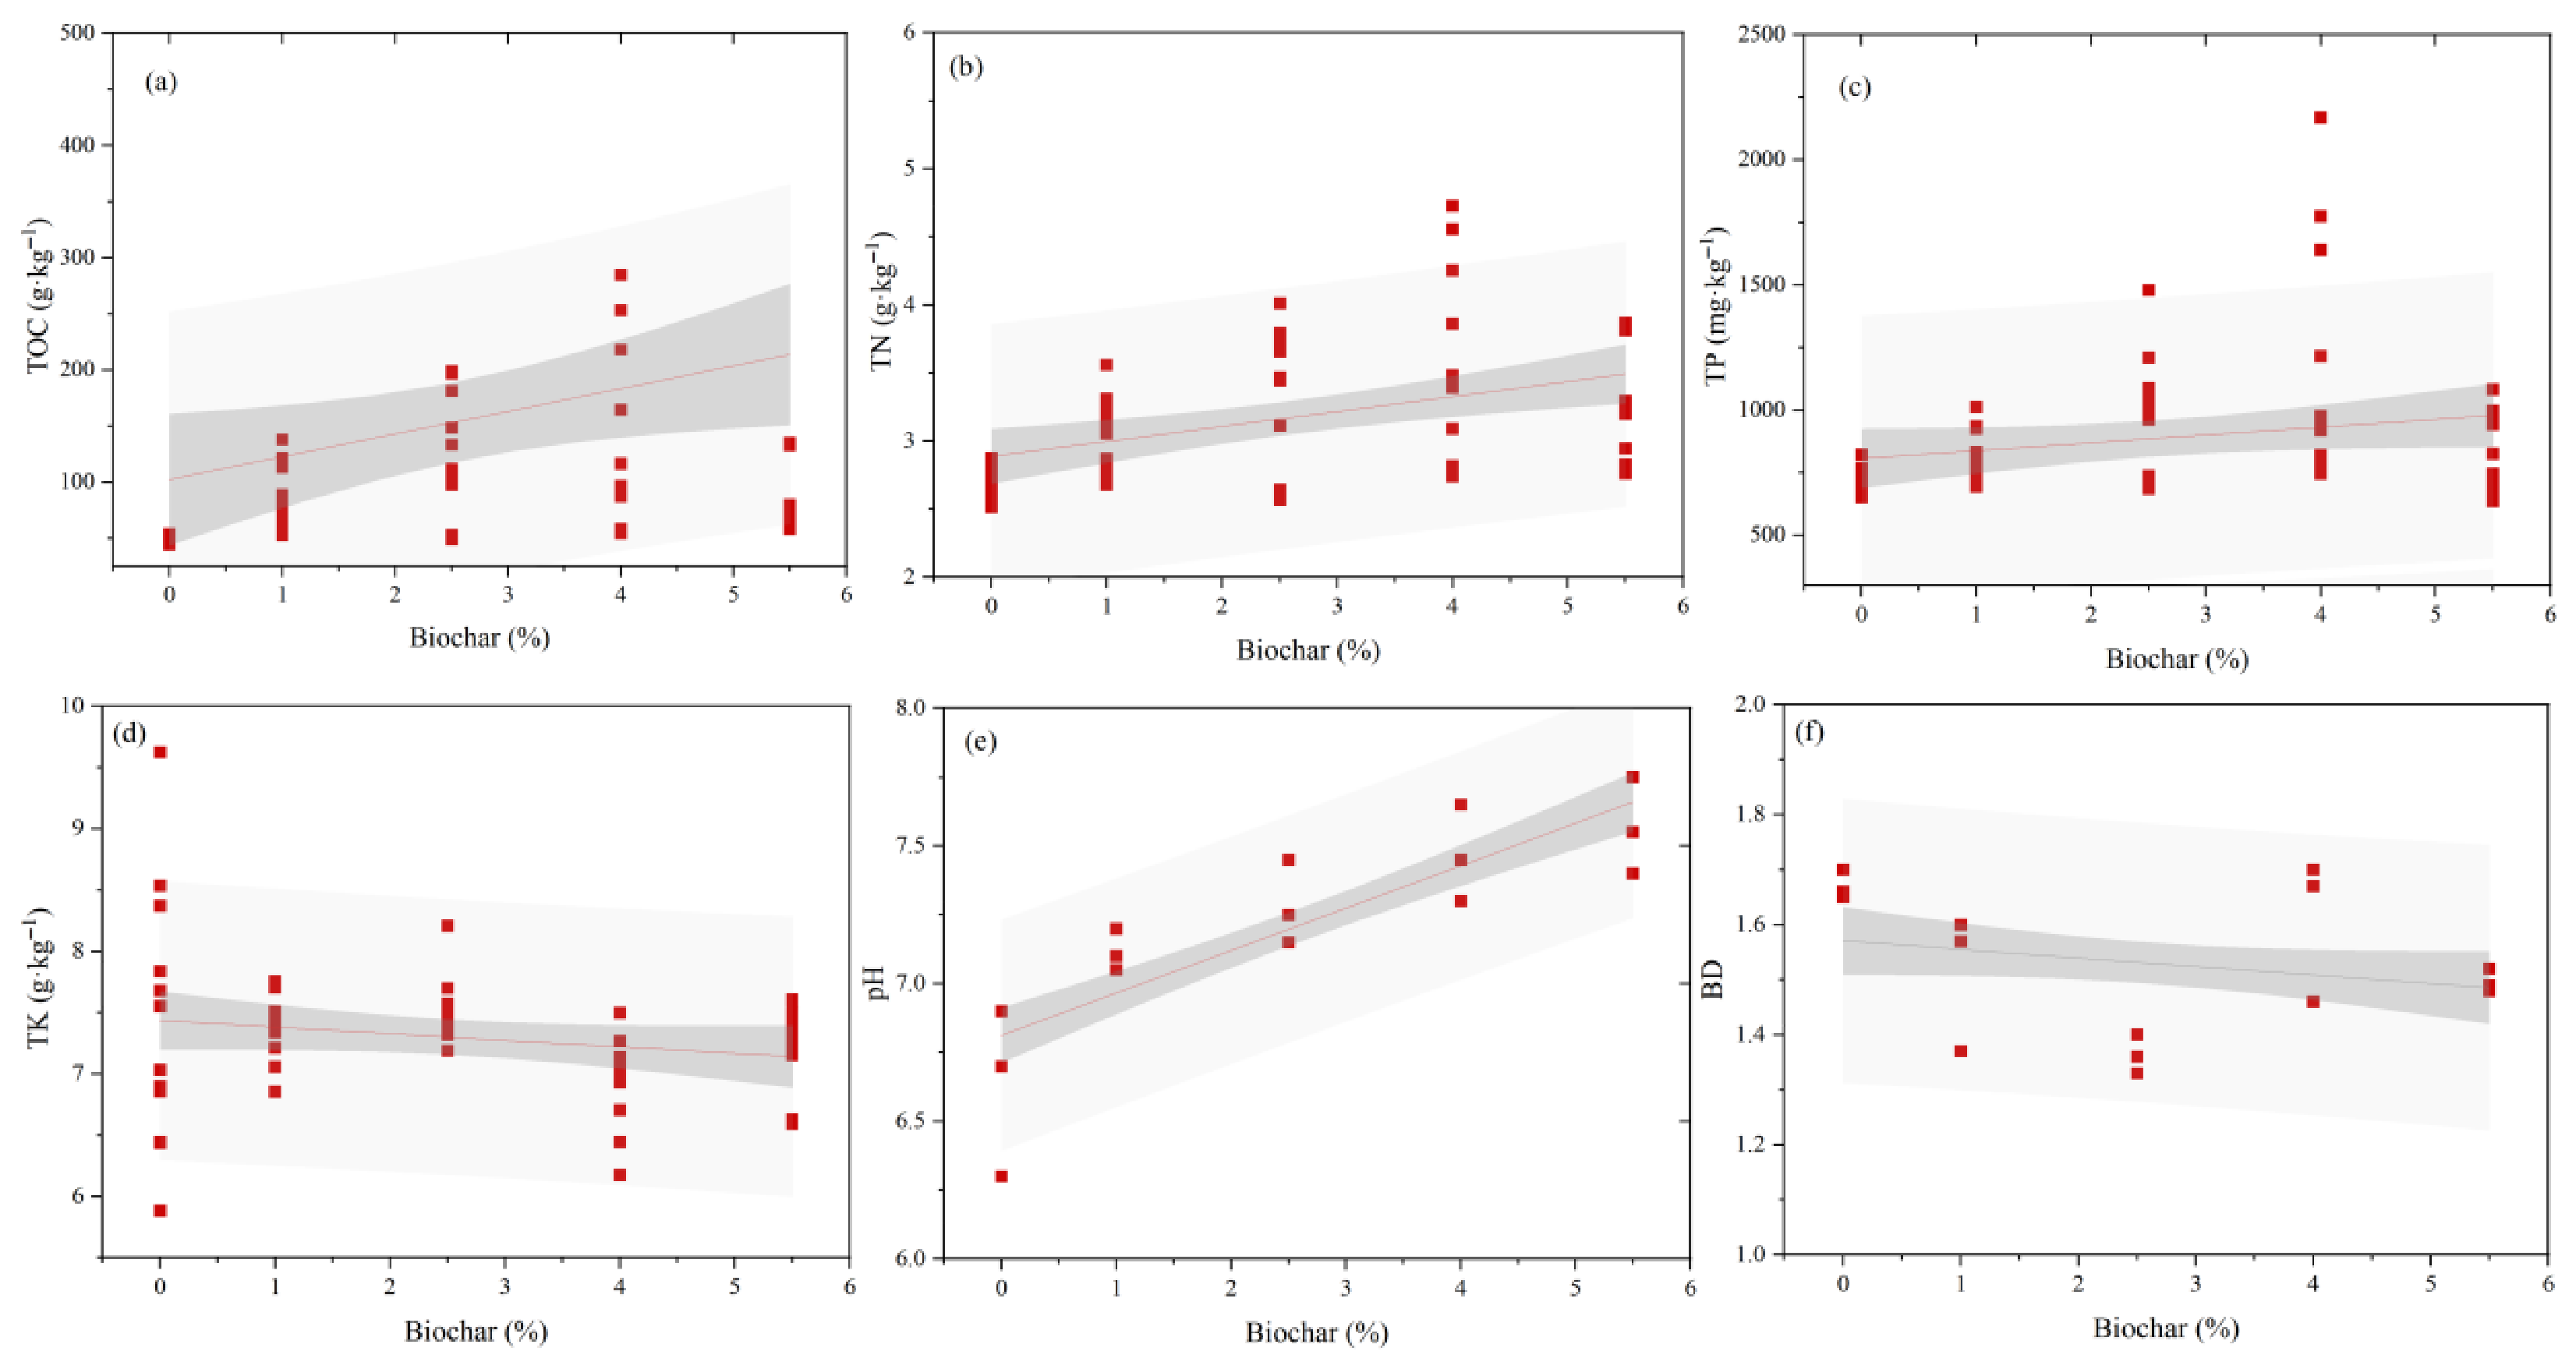
Figure 3 shows that as the amount of biochar added increases, all soil physicochemical parameters (soil organic matter, total nitrogen, total phosphorus, and pH) exhibit an upward trend. The fitting results for total organic carbon, total nitrogen, and pH in the soil showed good correlation with the biochar addition levels, with R2 values of 0.753, 0.601, and 0.706, respectively.
Figure 3.
Changes in soil physical and chemical properties under different amounts of biochar application ((a–f) represent TOC, TN, TP, TK, pH, and BD, respectively. TOC = total organic carbon, TN = total nitrogen, TP = total phosphorus, TK = total potassium, BD = bulk density, pH = hydrogen potential). The solid lines represent the regression fitting results of the ordinary least squares method, while the shaded areas represent the 95% confidence intervals.
3.2. Bacterial Community Characteristics
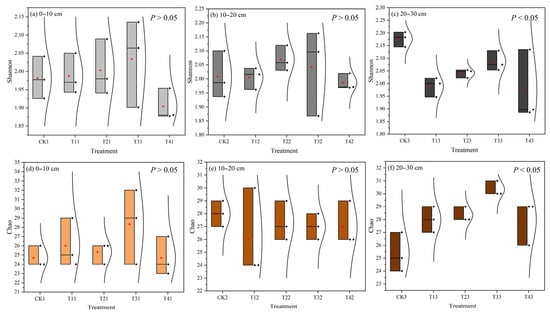
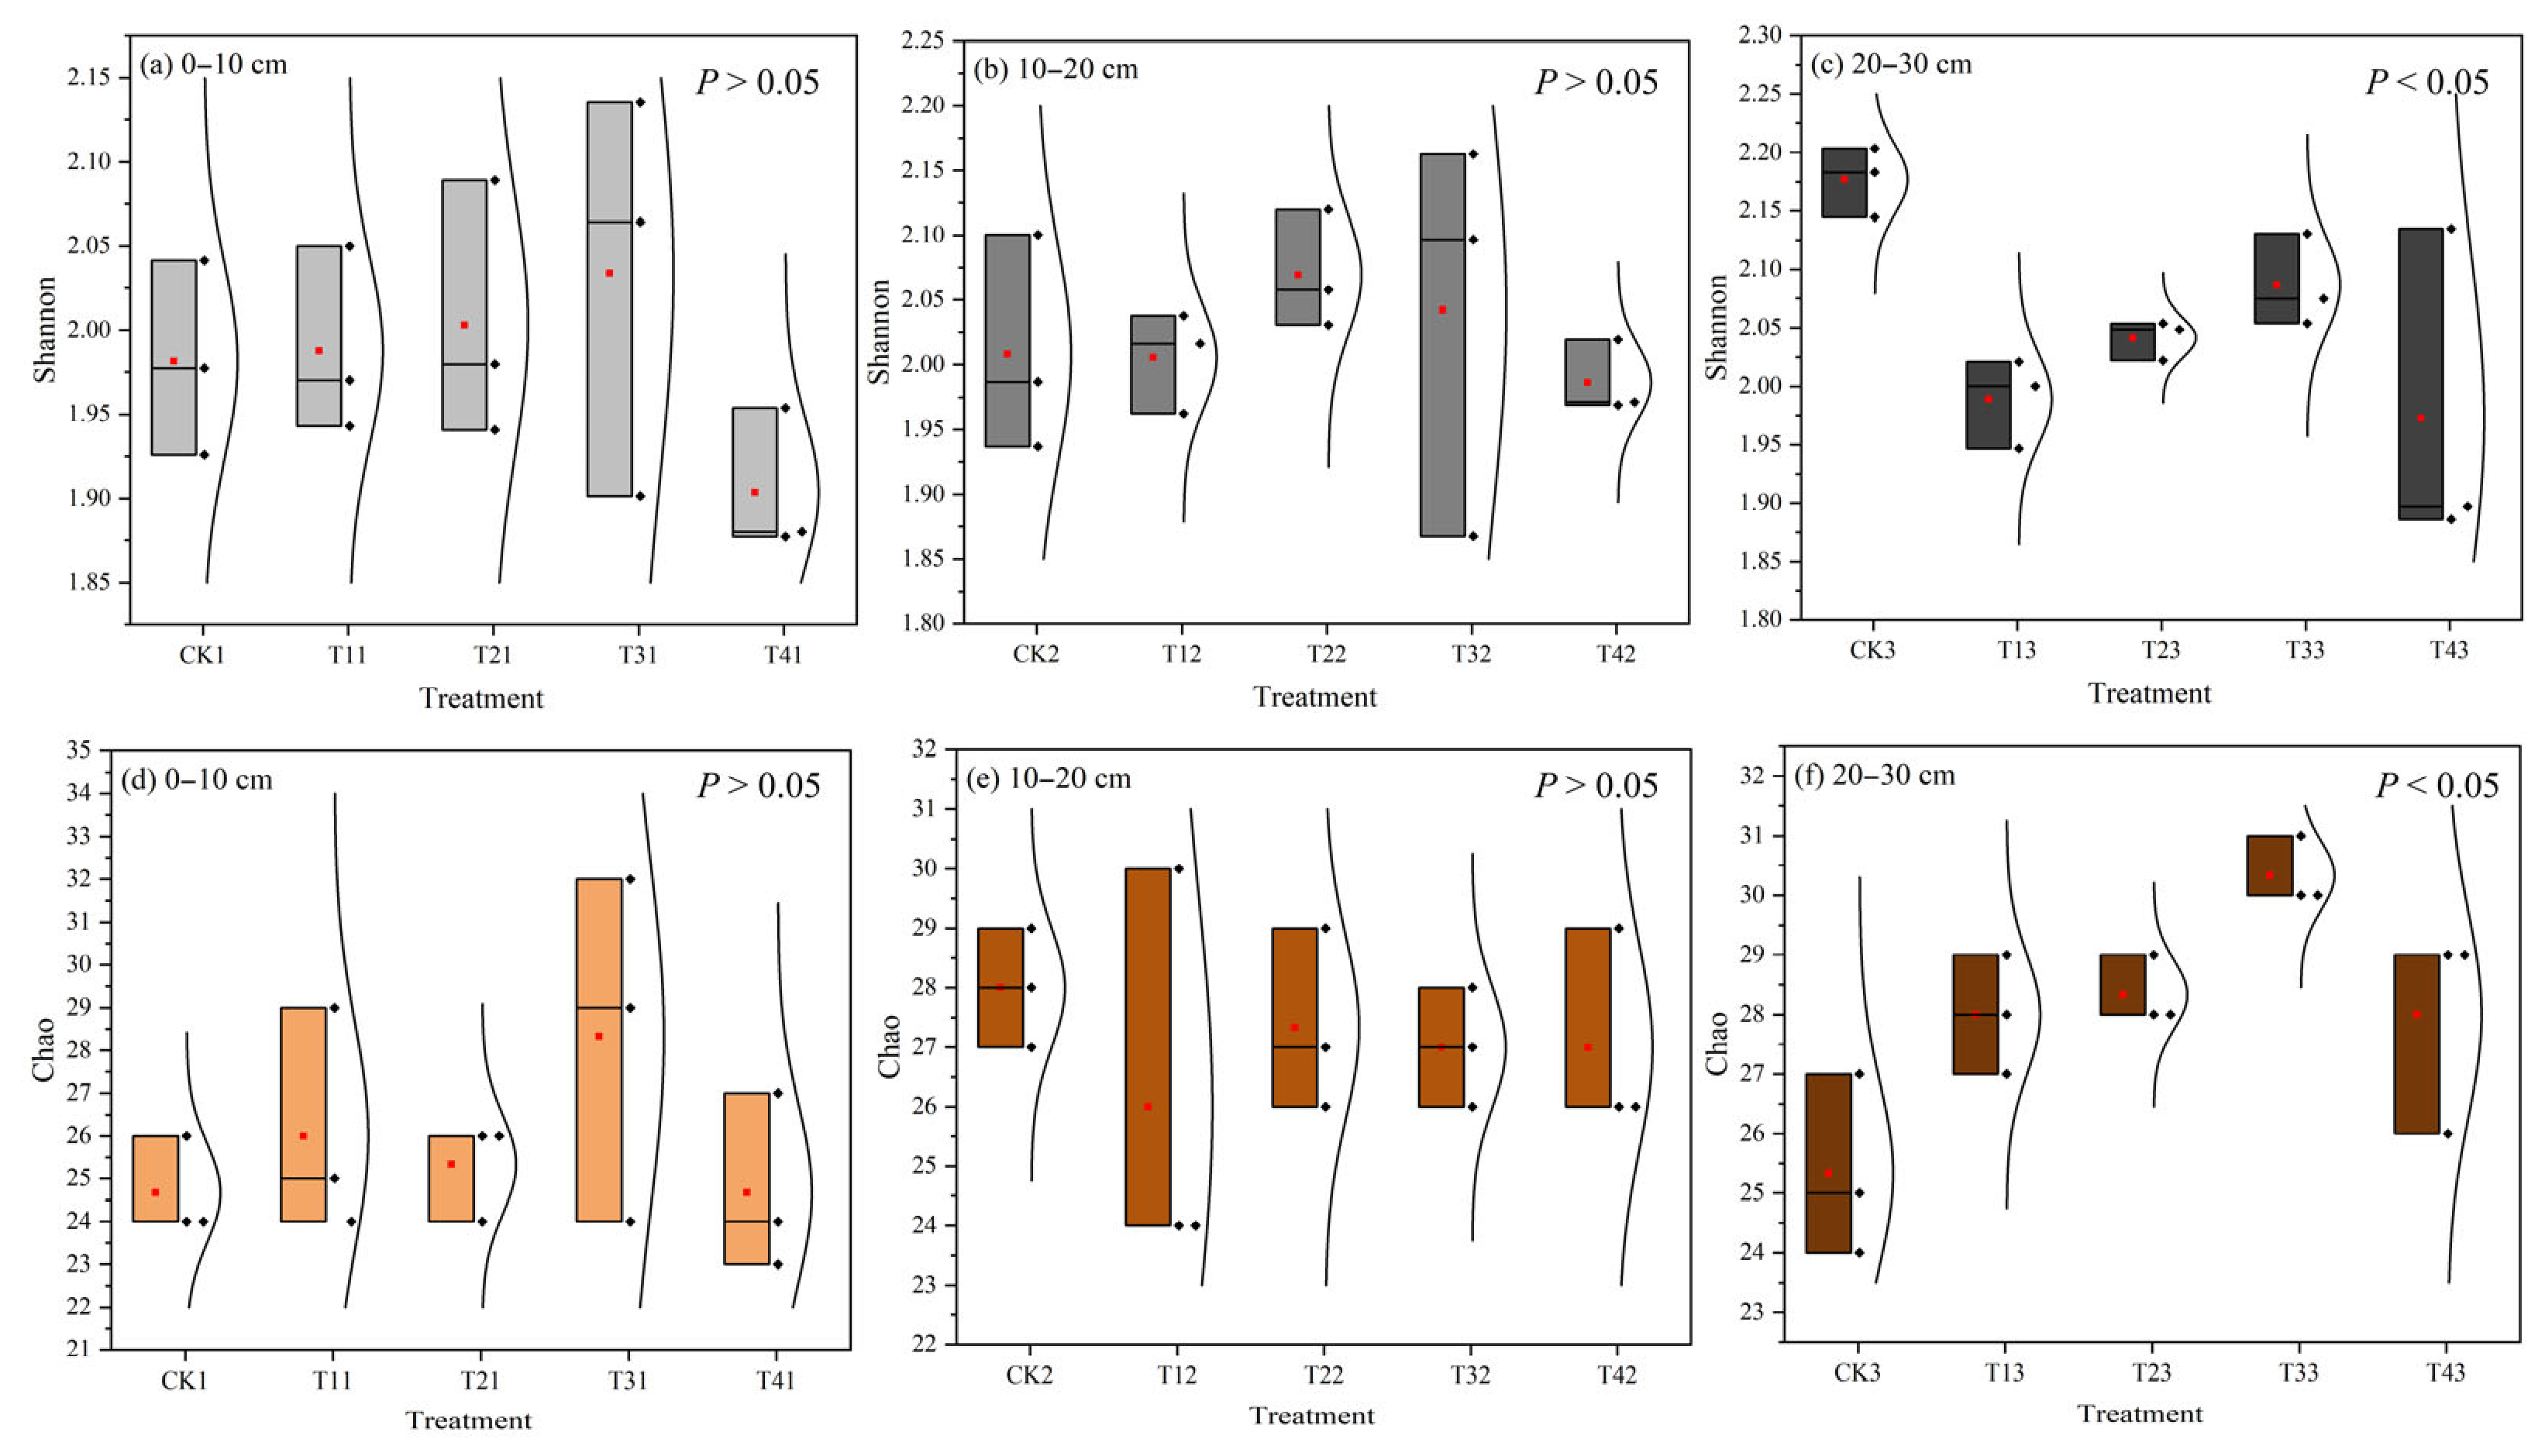
After biochar application, the average shannon index values for CK, T1, T2, T3, and T4 in the 0–10 cm soil layer were 1.98, 1.99, 2.00, 2.03, and 1.90, respectively; the average chao index (chao1; all subsequent chao indices refer to chao1) was 24.66, 26, 28.33, and 24.66, respectively. Compared with other treatment groups, the T3 treatment exhibited the highest average values for both shannon index and chao index (Figure 4a,d). In the 10–20 cm soil layer, the average shannon index values for CK, T1, T2, T3, and T4 were 2.01, 2.01, 2.03, 2.04, and 1.98, respectively; the average chao index values were 28, 26, 27.33, 27 and 27, respectively (Figure 4b,e). In the 20–30 cm soil layer, the average shannon index values for CK, T1, T2, T3, and T4 were 2.17, 1.99, 2.04, 2.08, and 1.97, respectively; the average chao index values were 25.33, 28, 28.33, 30.33, and 28, respectively (Figure 4c,f).
Figure 4.
The changes in bacterial populations and diversity indices after the application of biochar treatment ((a–c) represent the Shannon index under the soil layers of 0–10 cm, 10–20 cm and 20–30 cm respectively; (d–f) represent the Chao index under the soil layers of 0–10 cm, 10–20 cm and 20–30 cm respectively; CK1–T41 represents the diversity index changes in the 0–10 cm soil layer; CK, T1, T2, T3, T4; CK2–T42 represents the diversity index changes in the 10–20 cm soil layer; CK, T1, T2, T3, T4; CK3–T43 represents the diversity index changes in the 20–30 cm soil layer), using the t-test to analyze the diversity indices among the various biochar treatment groups.
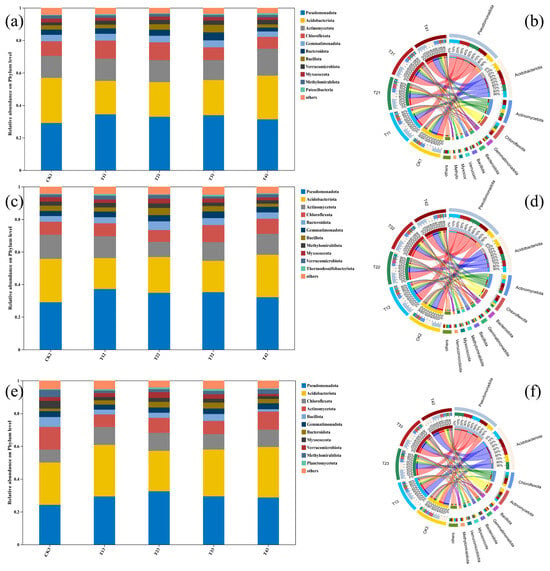
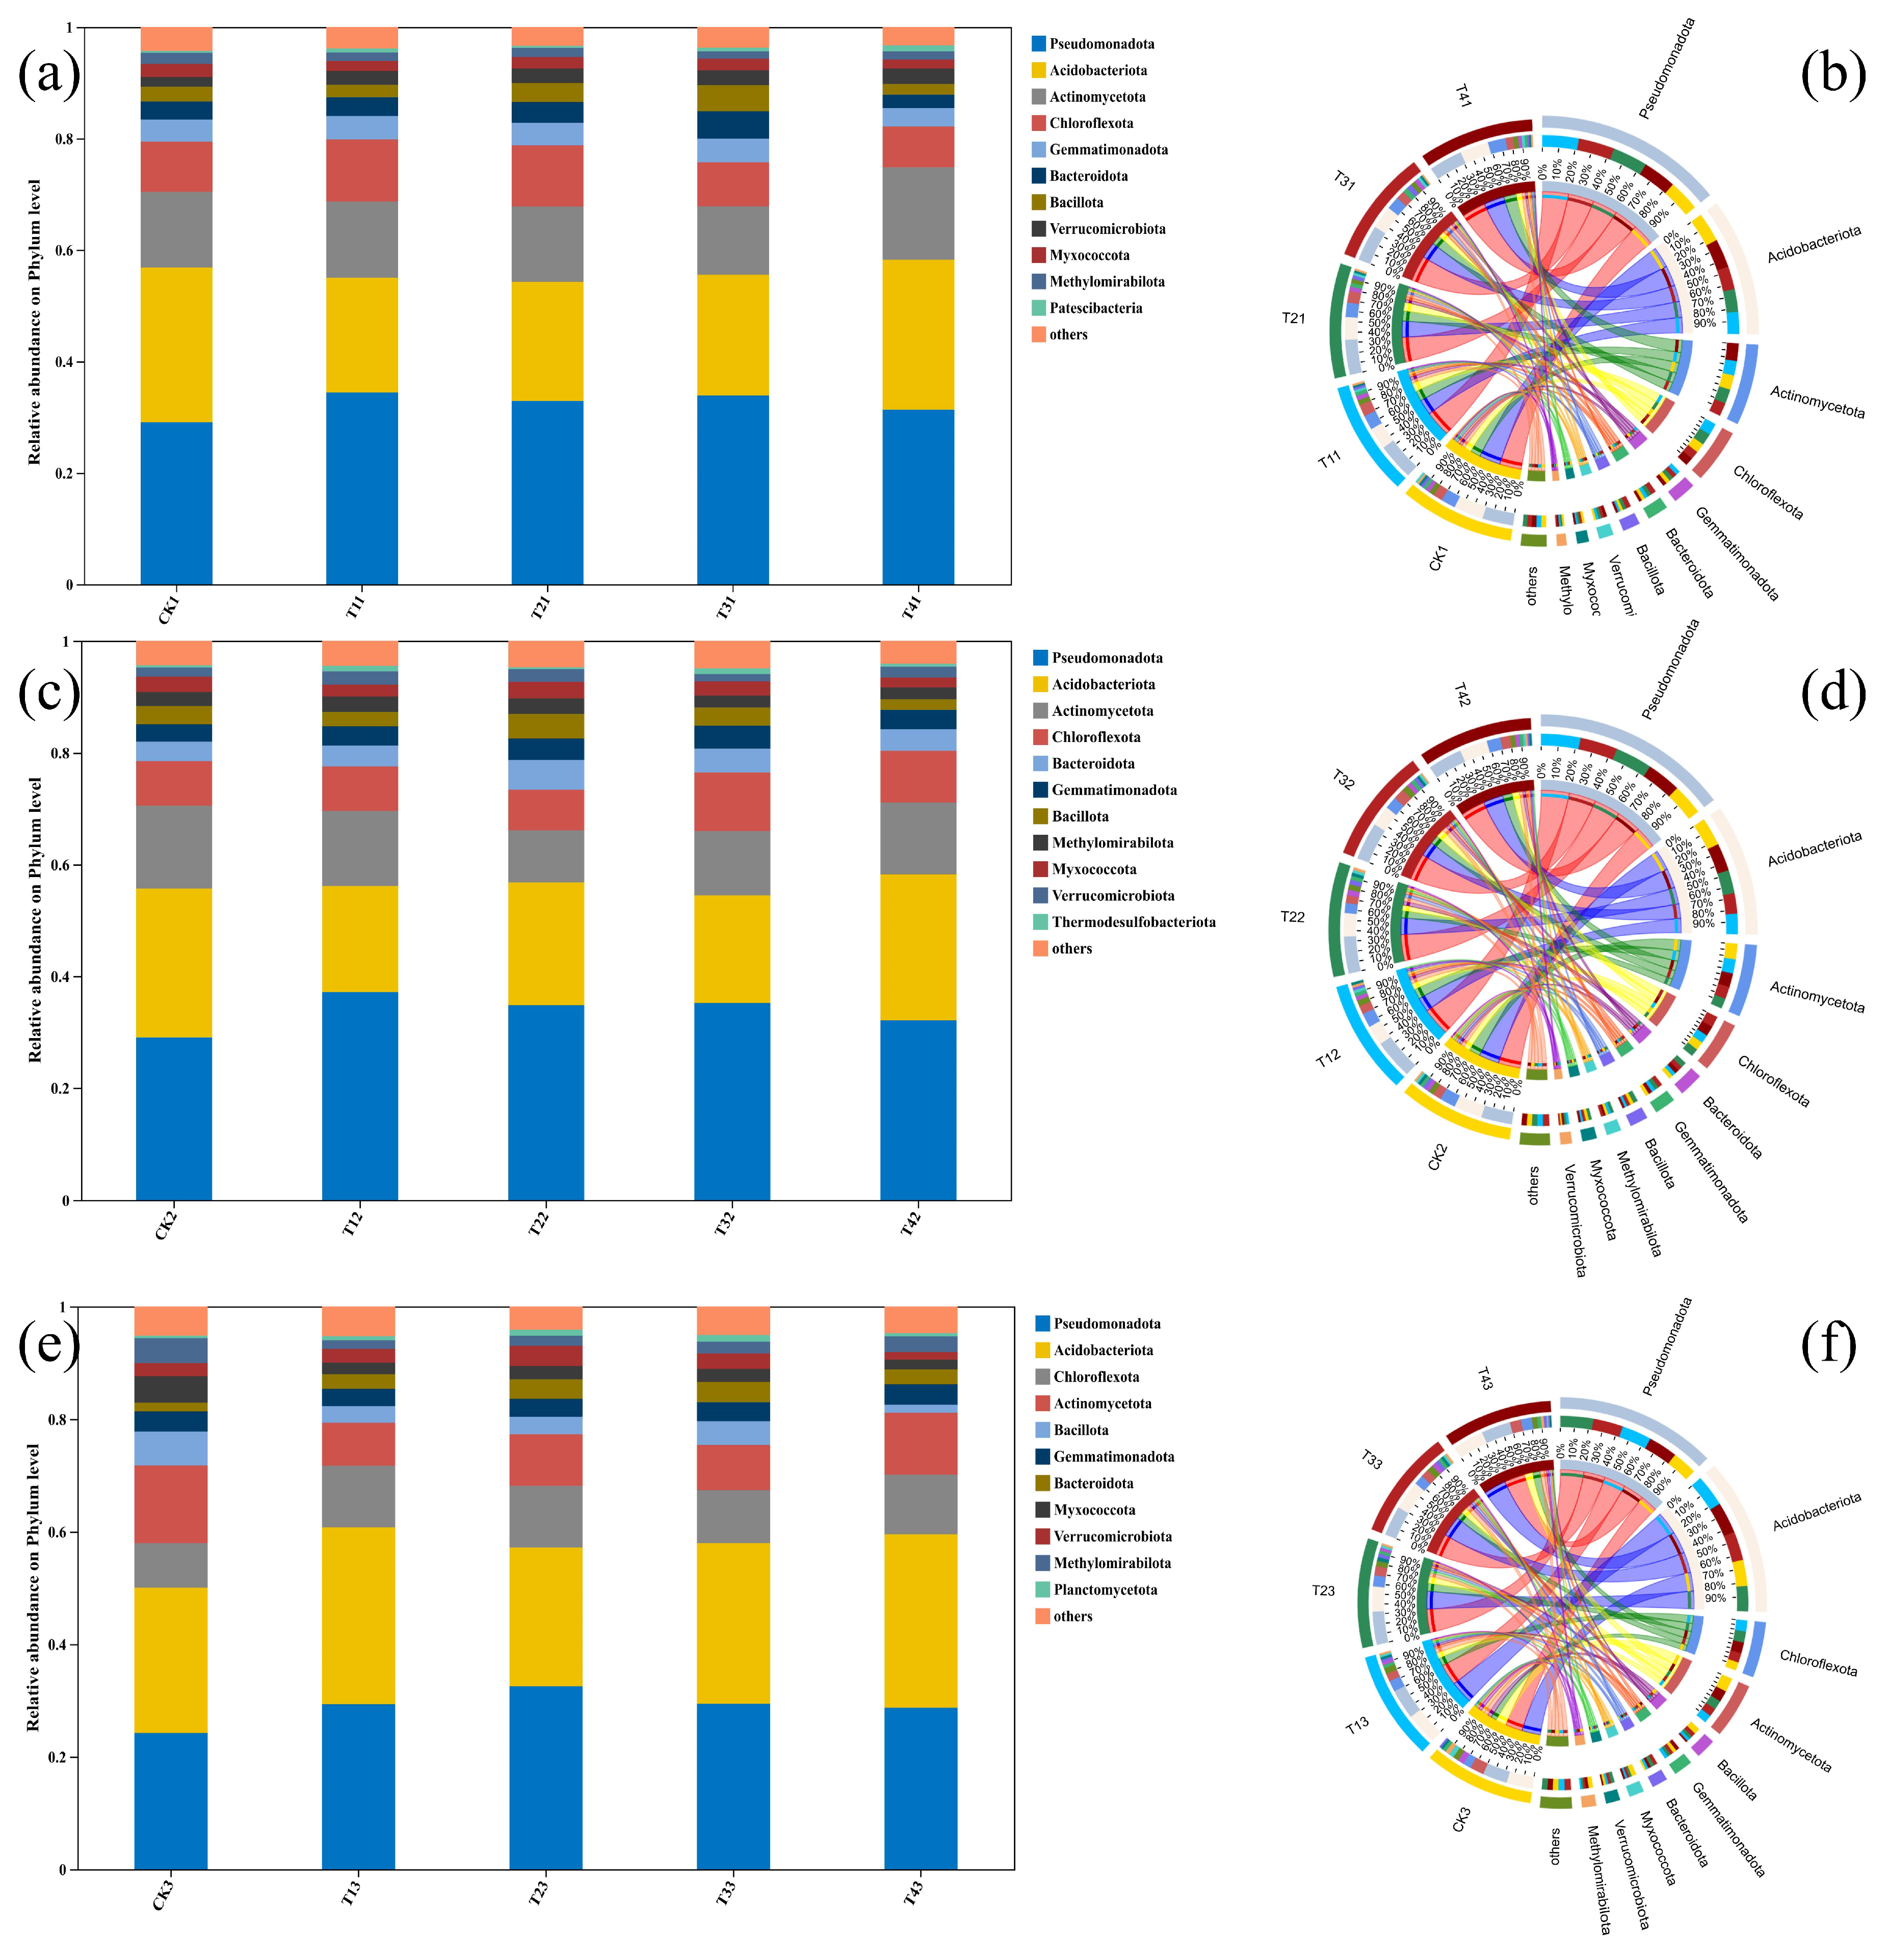
Figure 5 shows the relative abundance of microbial communities under each treatment condition. In the 0–10 cm and 10–20 cm soil layers (Figure 5a,c), the proportion of Pseudomonas (blue) is the highest (0.29–0.37), making it the dominant phylum. Secondly, there are Acidobacteria (yellow) (0.19–0.27), Actinomycetes (gray) (about 0.09–0.13), Sterococcus (dark blue) (about 0.05–0.10), etc. In the 20–30 cm soil layer (Figure 5e), the proportions of Pseudomonas (blue) (0.24–0.33) and Acidobacteria (yellow) (0.26–0.31) are relatively high. The circos plots (Figure 5b,d,f) further visually present the association networks of species within each treatment, with the dominant phyla (such as Pseudomonadota and Acidobacteriota) having a higher connectivity.
Figure 5.
Analysis of bacterial community composition after application of biochar (CK1–T41 represent the diversity index changes in the 0–10 cm soil layer; CK, T1, T2, T3, T4; CK2–T42 represent the diversity index changes in the 10–20 cm soil layer; CK, T1, T2, T3, T4; CK3–T43 represent the diversity index changes in the 20–30 cm soil layer). (a), (c) and (e) respectively represent the community bar plots at 0–10 cm, 10–20 cm, and 20–30 cm; (b), (d), and (f) respectively represent the community circos plots at 0–10 cm, 10–20 cm, and 20–30 cm.
The community composition in different soil layers of the same biochar addition treatment group was consistent: Pseudomonadota and Acidobacteriota were always the dominant groups, and the relative abundance of secondary phyla (such as Actinomycetota and bacteroidota) fluctuated less. The community structures among different treatment groups were differentiated.
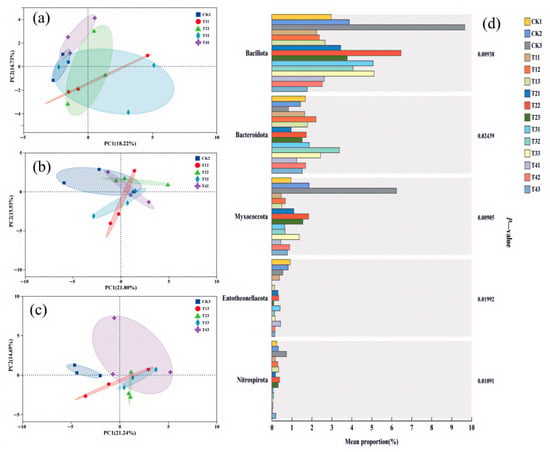
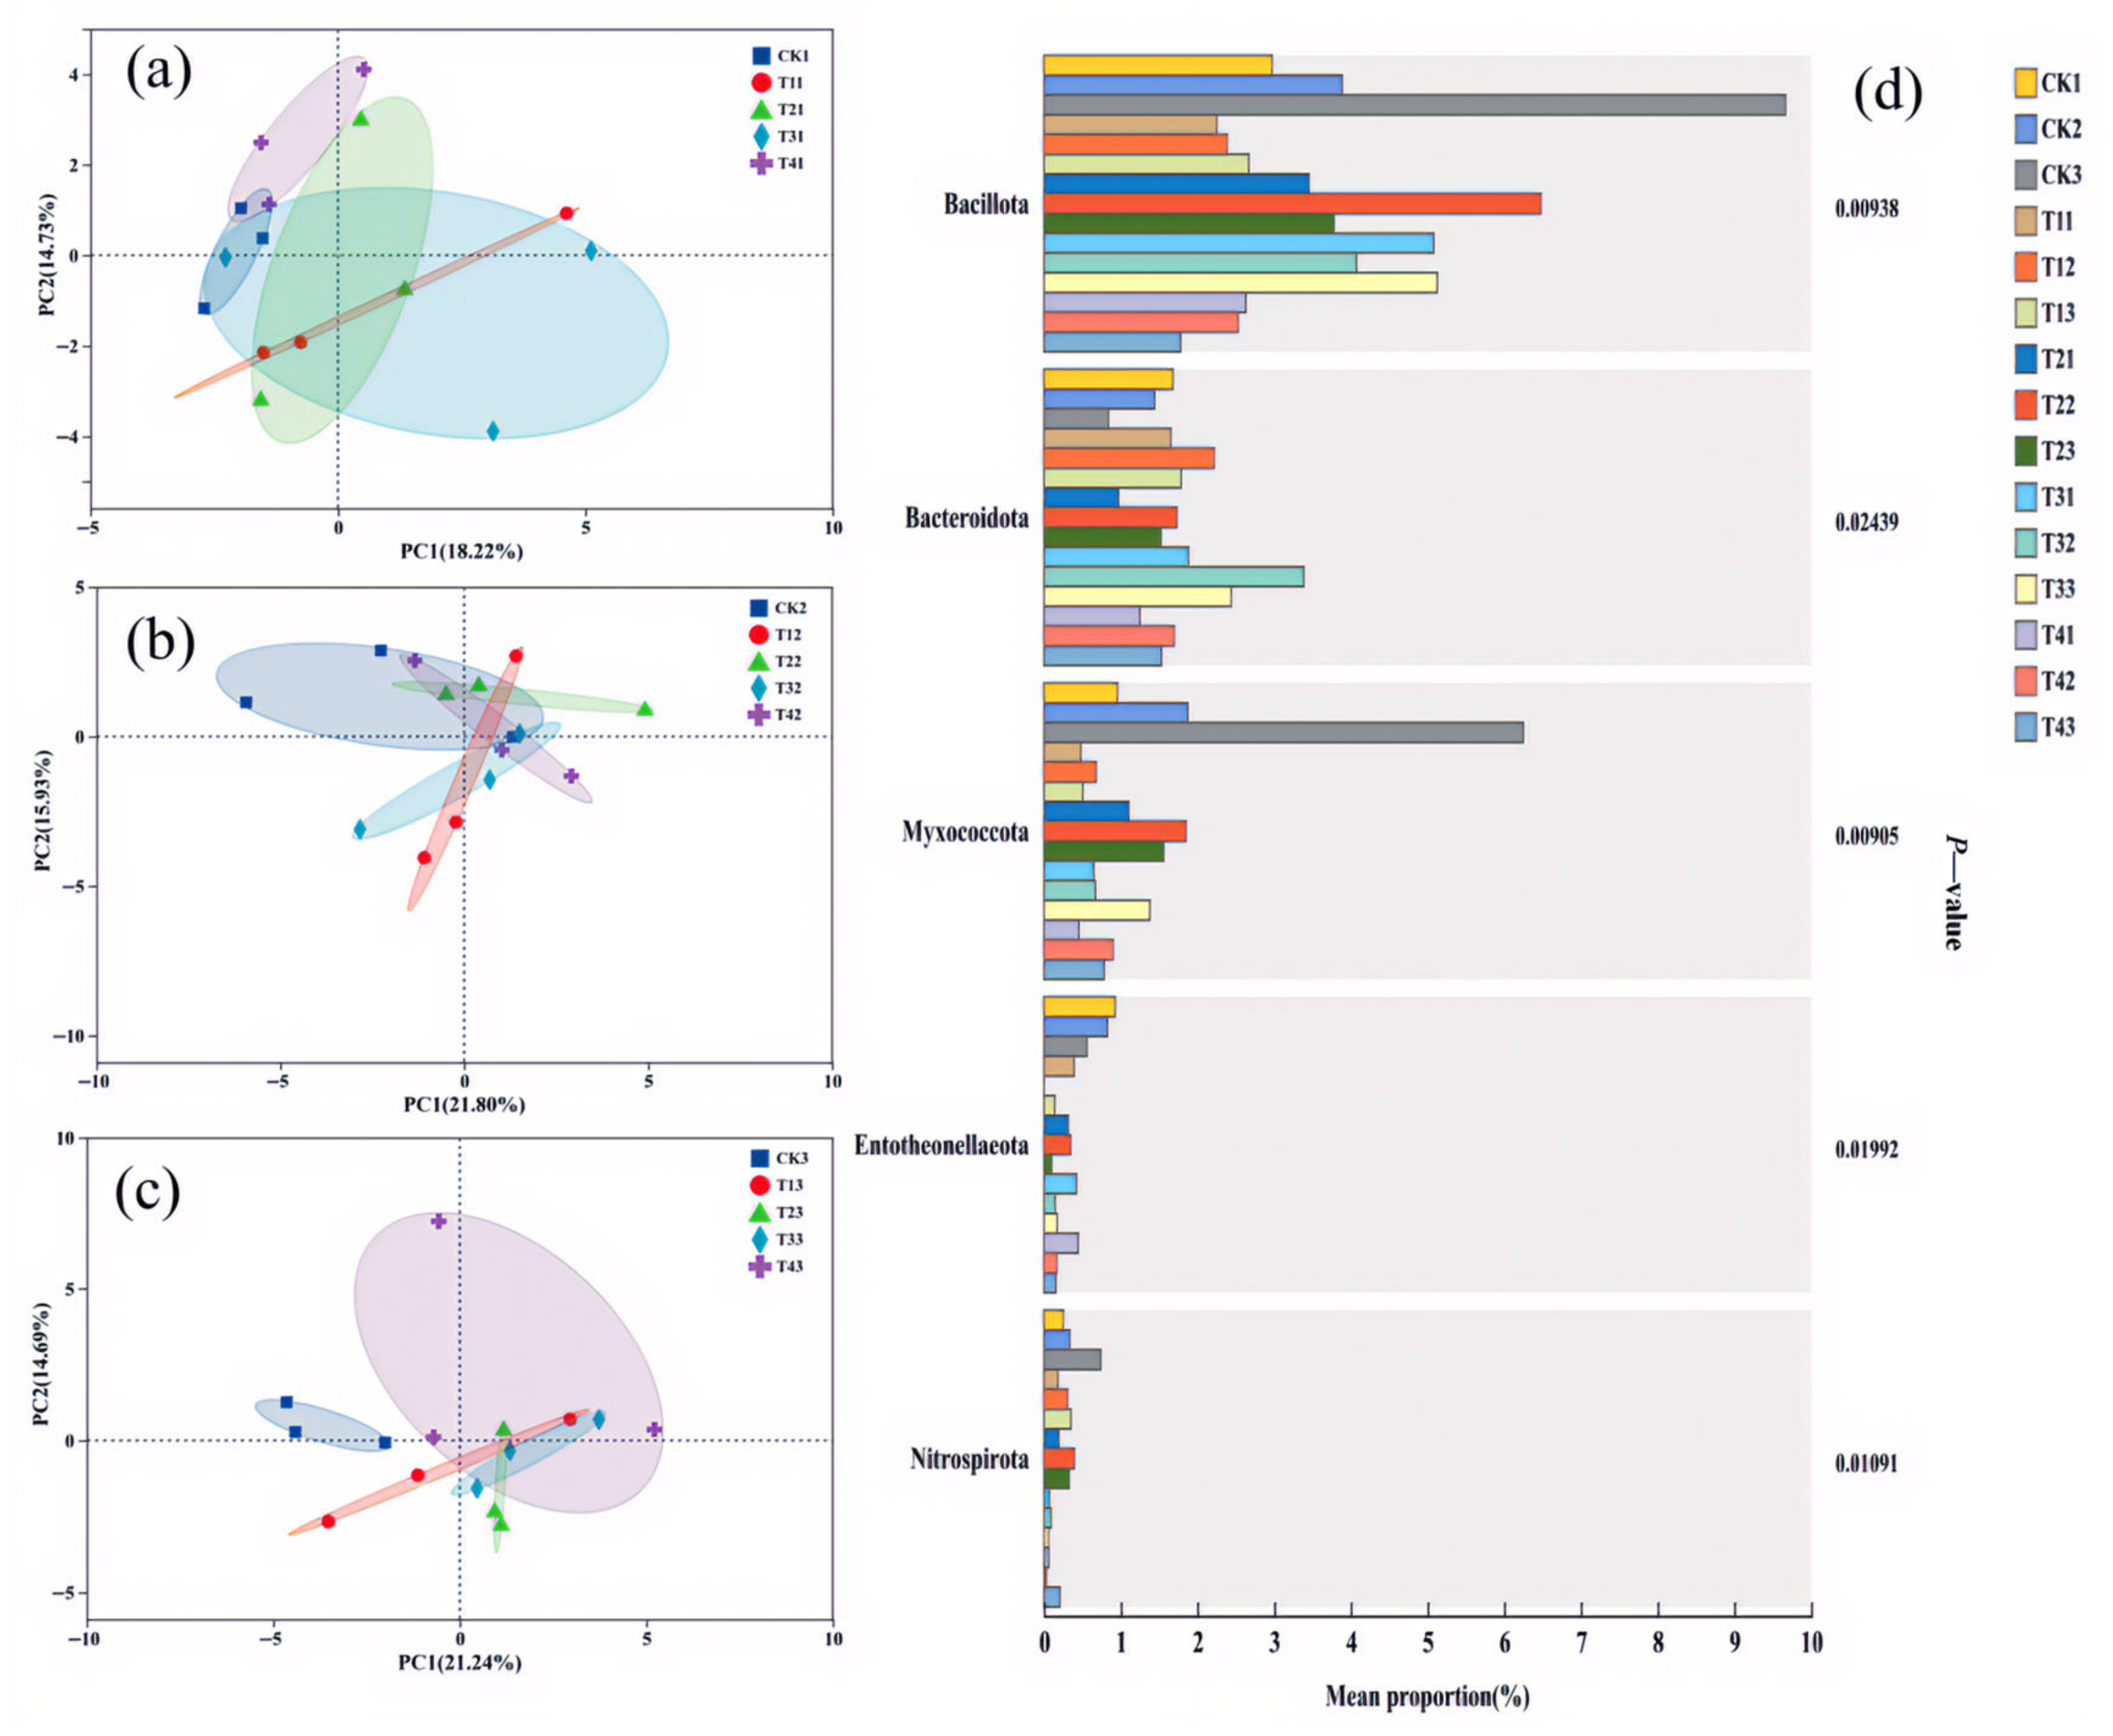
Through principal coordinate analysis (PCA), it can be observed (Figure 6a–c) that the first principal coordinate (PC1) explains 14.73–21.24% of the variation, and the second principal coordinate (PC2) explains 4.09–5.93% of the variation. Among them, there are significant differences in the community structure among the treatment groups: the sample points of the CK group (blue) and the T group (colored) are clearly separated in the PCA space (as shown in Figure 6a, in the 0–10 cm soil layer, the elliptical clusters of CK and T1–T4 have no overlap, and the same is true for Figure 6b,c). This indicates that the addition of biochar as a treatment measure significantly changed the microbial community structure. The sample points within the same treatment group (e.g., T1–T4 in the 0–10 cm layer) are highly clustered, indicating good repeatability within the group; the elliptical clusters in different treatment groups overlap but still have distinctions, suggesting that the community effects of different treatments have specificity. Through the analysis of differences in community composition at the phylum level, it can be seen (Figure 6d) that the Bacillota relative abundance in the treatment group with added biochar is generally higher than that in the CK group (for example, in the range of 0–10 cm, the abundances of T1 to T4 are all greater than 5%, while CK is less than 4%); the Bacteroidota abundance is also higher than that in the CK group, with the abundances of T3 and T4 in the 0–10 cm layer being close to 6% and significantly higher than CK (p = 0.009); the Myxococcota abundance is overall higher than that in the CK group, with the abundances of T2 and T3 > 3%, and significantly different from CK (p = 0.009); the Entotheonellaeota and Nitrospirota abundances are relatively low, but the treatment group with added biochar is still slightly higher than the CK group, and there are significant differences between some groups (for example, in the 0–10 cm layer, T4 and CK, p = 0.020; in the 20–30 cm layer, T4 and CK, p = 0.011).
Figure 6.
Analysis of bacterial PCA (a–c) and species difference analysis (d) after application of biochar treatment (CK1–T41 represent the diversity index changes in the 0–10 cm soil layer; CK, T1, T2, T3, T4; CK2–T42 represent the diversity index changes in the 10–20 cm soil layer; CK, T1, T2, T3, T4; CK3–T43 represent the diversity index changes in the 20–30 cm soil layer).
3.3. Linkages Between Microbial Communities and Environmental Variables
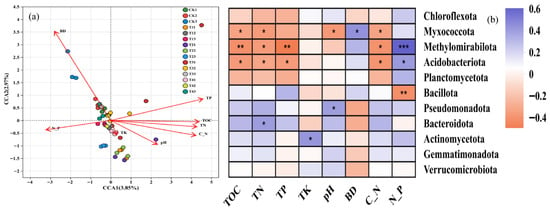
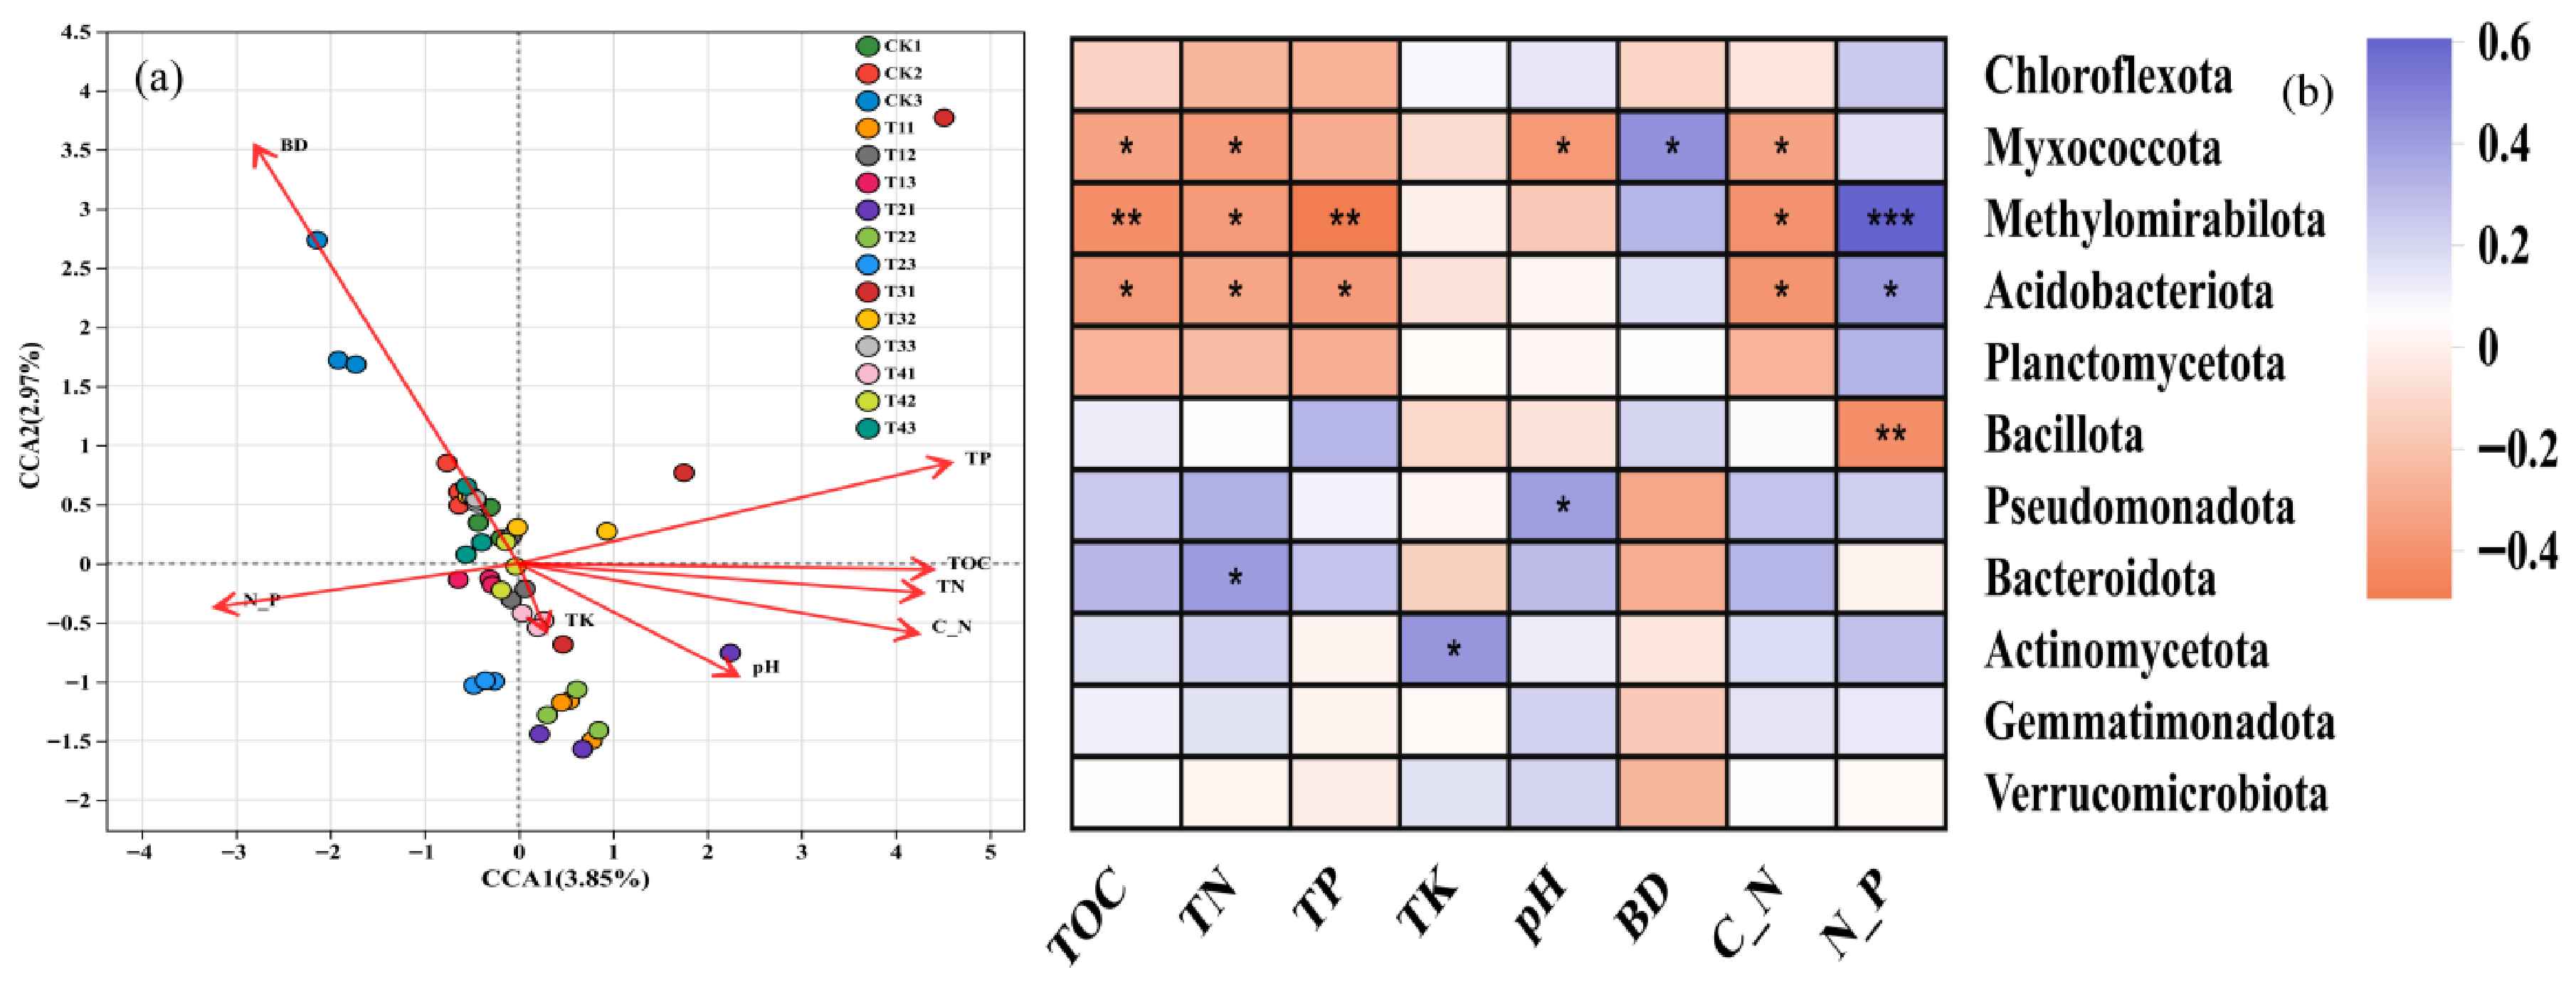
Through the analysis of the environmental driving factors of the community structure (Figure 7a), it can be known that the first axis (CCA1) explains 3.85% of the variation, and the second axis (CCA2) explains 2.97% of the variation. Among the environmental variables, pH, TN, TP, and TK are positively correlated with the community structure, while BD, TOC, C/N, and N/P are negatively correlated. The distribution of sample points (different treatment groups) in the CCA space shows that there is differentiation in the community structure among the treatment groups, and the sample points cluster significantly, indicating that the treatment measures (T1–T4) combined with the changes in soil physical and chemical properties jointly drive the differentiation of the microbial community. Figure 7b quantifies the correlation between eight microbial phyla and eight environmental factors. The results show that Chloroflexota, Myxococcota, Methylomirabilota, and Acidobacteriota are significantly positively correlated with TOC, TN, TP, TK, and pH (for example, the correlation coefficient between Chloroflexota and TN; TP is positive and marked with *), suggesting that these phyla prefer high-nutrient and alkaline soil environments; Bacillota, Pseudomonadota, Bacteroidota, Actinomycetota, Gemmatimonadota, and Verrucomicrobiota are significantly negatively correlated with BD, C/N, and N/P (for example, the correlation coefficient between Bacillota and BD is negative and marked with **), indicating that these phyla have a lower abundance in compact, low-C/N, and low-N/P soils; the correlations of most phyla with environmental factors reach a significant level (or *), indicating that soil physical and chemical properties are the key driving forces regulating the composition of the microbial community.
Figure 7.
Analysis of environmental drivers of community structure ((a) represents CCA analysis; (b) is the correlation heatmap, and the color levels on the right indicate the correlation coefficients. Blue (positive value) indicates a positive correlation, while orange (negative value) indicates a negative correlation. The depth of the color represents the strength of the correlation. * indicates a significant difference (p < 0.05), ** and *** indicate an extremely significant difference (p < 0.01). The more asterisks there are, the more significant the correlation. The correlation applies to all microbial communities; CK1–T41 represent the diversity index changes in the 0–10 cm soil layer; CK, T1, T2, T3, T4; CK2-T42 represent the diversity index changes in the 10–20 cm soil layer; CK, T1, T2, T3, T4; CK3-T43 represent the diversity index changes in the 20–30 cm soil layer).
Using the random matrix method, a co-occurrence network of bacterial communities was constructed (Table 2). The complexity of the network was represented by the number of nodes, the number of edges, and the average degree, while the network central coefficient was used to reflect the criticality of the nodes. After the addition of biochar, the number of nodes in the network changed. The overall number of nodes generally showed an increasing trend with the increase in the amount of biochar addition, indicating that the addition of biochar made the network structure more complex, and the complexity was positively correlated with the addition amount. In the same biochar treatment, with the increase in soil depth, the number of nodes in the network showed an increasing trend, and the number of nodes and edges in the 10–20 cm and 20–30 cm soil layers were generally higher than those in the 0–10 cm layer, suggesting that the microbial network in the deeper soil (10–30 cm) was more complex. The central coefficient generally showed an upward trend with the increase in application concentration, indicating that the application treatment enhanced the role of core nodes in the network and improved the stability and functional integration ability of the network.
Table 2.
Co-occurrence network indices after application of biochar.
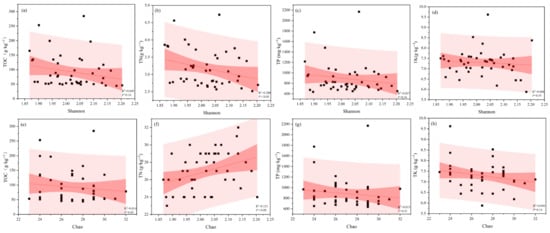
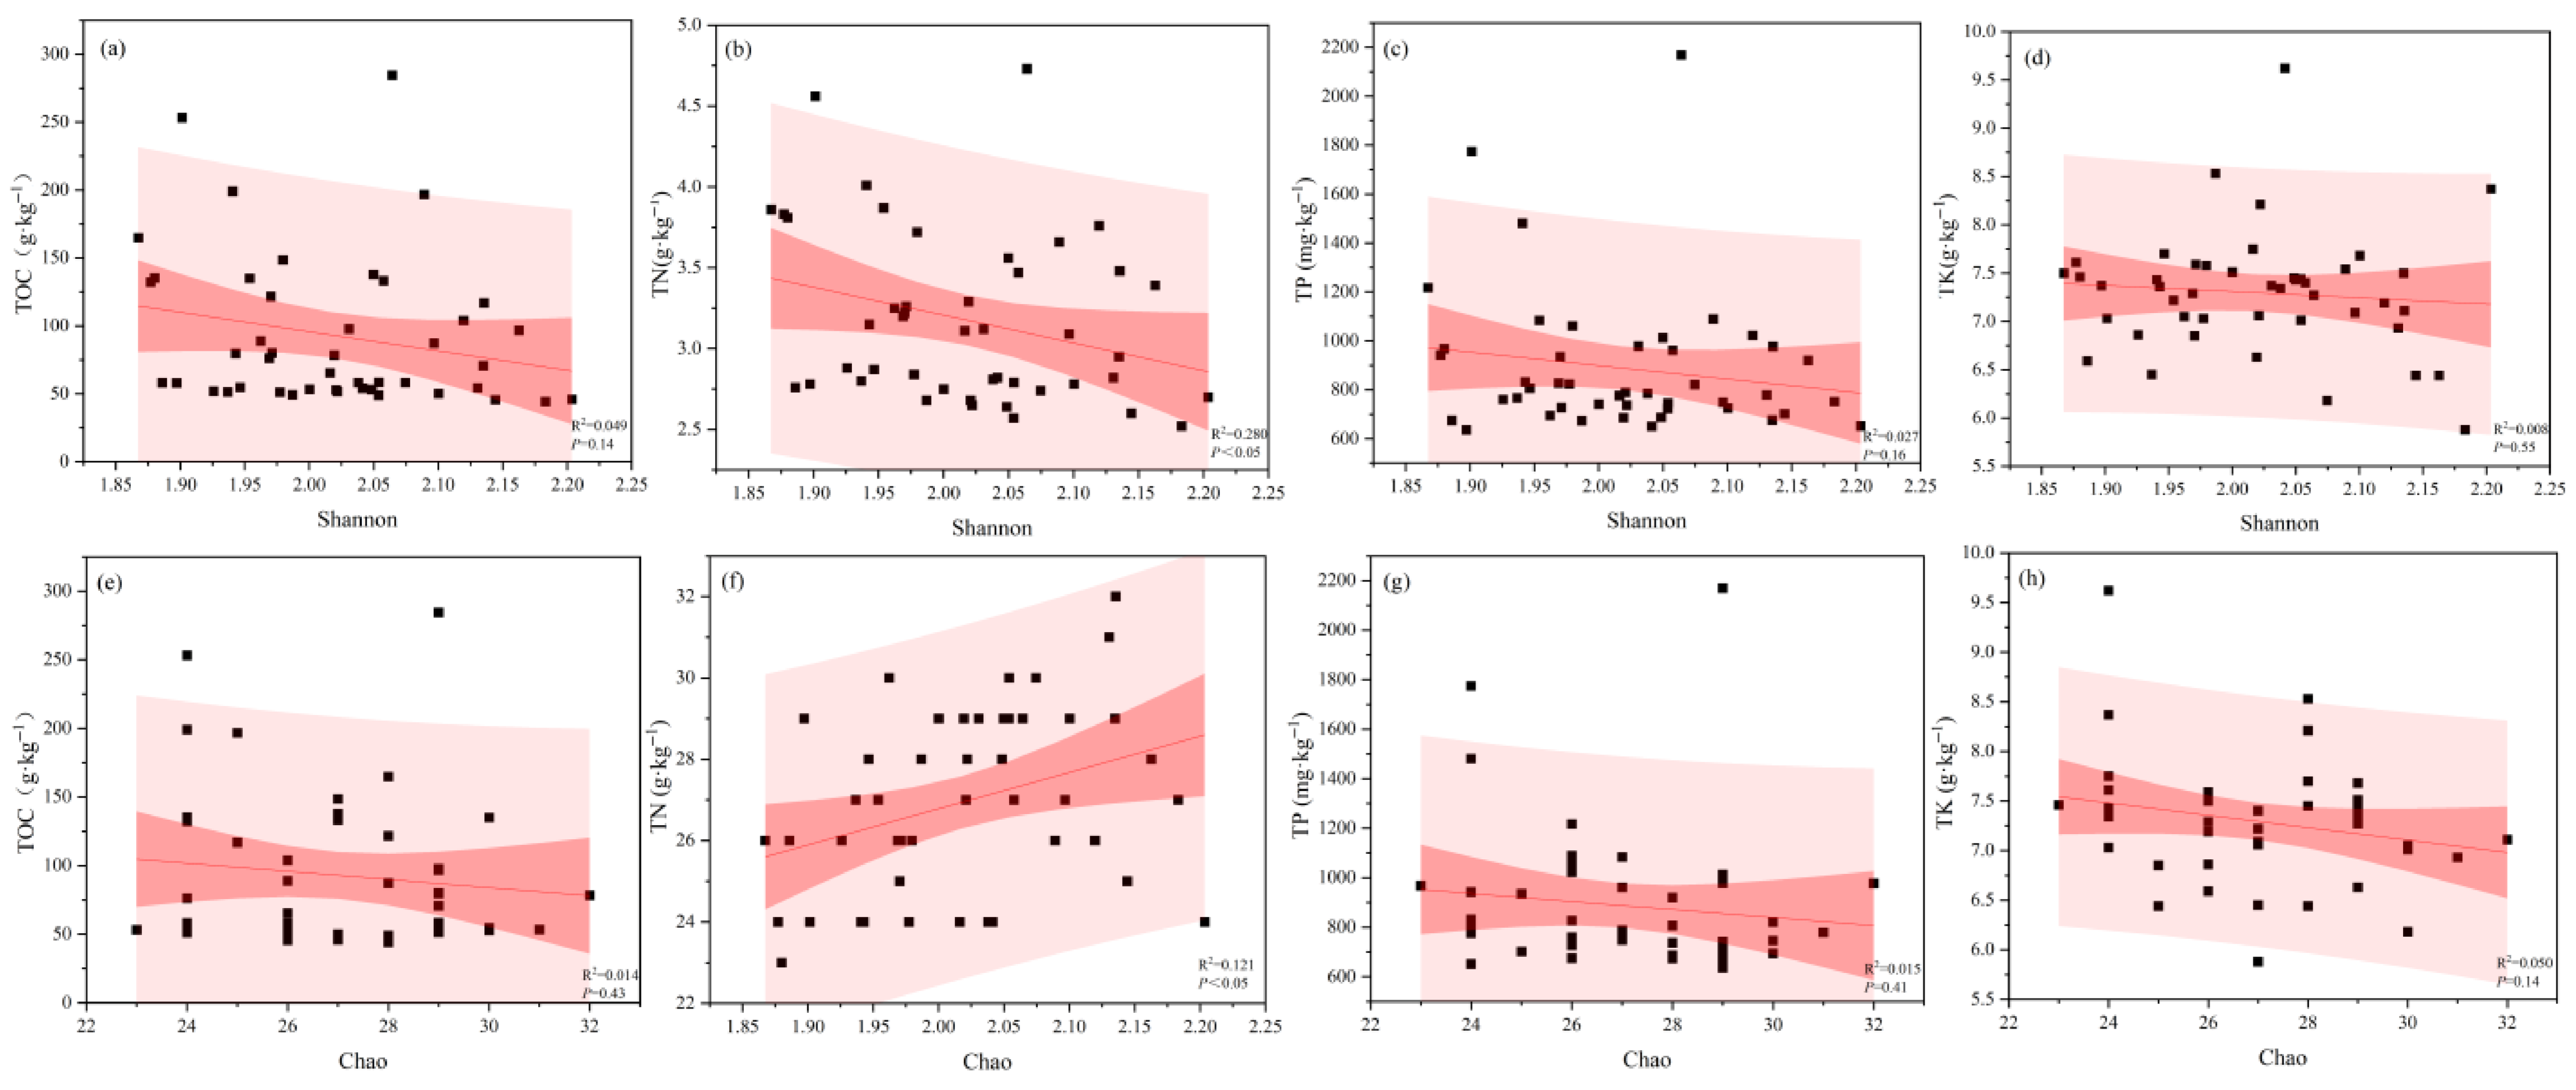
The relationship between bacterial diversity and soil nutrients is shown in Figure 8. The R2 values of the Shannon index and the Chao index with respect to soil total nitrogen are 0.280 and 0.121, respectively, presenting a very strong linear correlation (Figure 8b,f). In contrast, there are certain correlations between bacterial diversity indices and total organic carbon, total phosphorus, and total potassium, but they do not reach a significant level, with p values of 0.14, 0.16, 0.55, 0.43, 0.41, and 0.14, respectively (Figure 8a,c,d,e,g,h).
Figure 8.
There is a linear relationship between the characteristics of bacterial communities and soil fertility ((a–d) represents the relationship between the Shannon index and TOC, TN, TP, and TK in sequence, and (e–h) represents the relationship between the Chao index and TOC, TN, TP, and TK, TOC = total organic carbon, TN = total nitrogen, TP = total phosphorus, TK = total potassium, BD = bulk density, pH = hydrogen potential). The solid line represents the regression fitting result of the ordinary least squares method, while the shaded area indicates the 95% confidence interval.
4. Discussion
4.1. The Impact of Biochar on the Physical and Chemical Properties of Soil in Karst Abandoned Areas
This study found that as the application rate of corn straw biochar increased, the contents of total organic carbon (TOC), total nitrogen (TN), and total phosphorus (TP) in the soil all showed a significant upward trend and reached a peak at a 4% application rate (T3). This result is consistent with previous research findings. This might be due to the fact that biochar is a substance with a large surface area and high aromaticity that is generated under high-temperature pyrolysis conditions [24]. Especially at low-temperature pyrolysis (200–400 °C), biochar has more oxygen-containing functional groups, such as –COOH, –OH, C=O, and –CHO groups. These functional groups promote the exchange of nutrients, thereby improving the soil fertility level [25]. Biochar itself contains nutrients such as carbon, nitrogen, phosphorus, potassium, etc., which leads to a direct change in the nutrient content of the soil when biochar is applied [26]. Meanwhile, nutrient loss due to runoff may result in the depletion of certain nutrients; for instance, the TK content in this experiment was significantly reduced under the T3 treatment. The soil bulk density and pH show a significant decrease and increase trend, respectively. This research result is consistent with those of previous studies. Hossain et al. [27] also indicated that regardless of the soil type, research environment, biochar application amount or application method, applying biochar will reduce the soil bulk density. Because the bulk density (BD) of most biochars (approximately 0.3–0.6 g/cm3) is much lower than that of ordinary agricultural soil, applying biochar will reduce the bulk density of most soils. Most studies have shown that applying biochar will increase the soil pH value [28,29]. In summary, biochar significantly alters the physical and chemical properties of abandoned land soil and increases the soil nutrient content.
4.2. The Influence of Biochar on the Bacterial Community of Karst Abandoned Land Soil
The application of biochar alters the structure of soil bacterial communities. The diversity indices, the Shannon index and Chao index, increase initially with the increase in biochar application amount but then decrease. One of the reasons why the application of biochar increases soil bacterial diversity is that biochar has a high porosity, protecting soil bacteria from predators and increasing ecological niches that support more microbial diversity [17]. At the third application rate of biochar in T3, both diversity indices reached their maximum values, indicating that the bacterial community diversity of bioorganisms was more abundant under the biochar application rate of T3. This application rate can be considered as an appropriate dosage for soil improvement in the reclamation of karst abandoned land within a short period of time. The PCA shows that the sample points of the CK group and the treatment group are clearly separated, and the relative abundances of dominant phyla (Pseudomonadota, Acidobacteriota) have undergone reorganization.
The Pseudomonadota phylum of bacteria is beneficial for alleviating soil acidification and increasing pH [30]. CCA analysis (Figure 7) also indicates a significant correlation between pH and the Pseudomonadota phylum, suggesting that biochar affects the diversity of the Pseudomonadota phylum by influencing soil pH. The Actinobacteria phylum positively impacts the carbon cycling process by promoting the decomposition and transformation of organic matter [31]. The co-occurrence network analysis further reveals that the addition of biochar increases the number of nodes and edges, enhancing the complexity and centrality coefficient of the network. This is reflected in the increase in the number of nodes, links, and modularization degree after biochar application [32]. This is because the application of biochar can improve nutrient conditions, thereby enhancing the interactions between microorganisms and altering the structure of the microbial community [33]. Moreover, the stronger stability of the bacterial community will have a positive impact on soil nutrients, facilitating the completion of the nutrient cycling process [34]. Therefore, the more complex the bacterial structure, the stronger the ecological function of the soil [35]. It indicates that biochar enhances the stability and resistance of the microbial community by strengthening the functional integration ability of core nodes and strengthening the stability and resistance of the microbial community.
This study also found that soil depth is a key variable regulating the effects of biochar: as the soil layer deepens, the overall diversity indices (shannon, chao) of microorganisms increase, and the complexity of the co-occurrence network in the deep soil (10–30 cm) is higher. This may be due to the redistribution of water at the rock–soil interface and the migration effect of biochar, making the deep soil of karst sloping farmland an important area for the reorganization of microbial functions. It also indirectly indicates that in karst sloping farmland, the response of deep soil microorganisms to the input of biochar may be more dependent on the vertical transport patterns of water and solutes.
4.3. The Correlation Between Soil Physical and Chemical Indicators and Microbial Communities
The structural characteristics of soil bacterial communities are mainly influenced by soil properties, moisture, plants, temperature, climate and other factors [36,37]. The results of this study indicate that the application of biochar increased the abundance of the Actinomycetota phylum. The CCA analysis results indicate that pH, TN, TP were significantly positively correlated with the community structure, while bulk density (BD) and C/N were negatively correlated, indicating that biochar indirectly drives the succession of microbial communities by simultaneously improving soil physical and chemical properties [38]. Among them, the positive correlations of groups such as Chloroflexota and Myxococcota with nutrient indicators indicate their adaptability to high-nutrient environments, while the negative correlations of Bacillota and Pseudomonadota with BD reflect the limitation of soil compactness on microbial colonization.
5. Conclusions
In abandoned sloping farmland in karst regions that has been idle for 20 years, the application of corn straw biochar can significantly restore soil fertility and ecological functions. The amount of biochar applied is a very important influencing factor. An appropriate amount of biochar application maximizes the benefits for soil nutrients and microbial diversity. Higher application doses are not always better; for instance, in this experiment, the soil improvement effect of T4 treatment was inferior to that of T3 treatment. Furthermore, soil depth significantly influences microbial community regulation: the coexistence networks of microorganisms in deeper soil layers are more complex and stable, necessitating consideration of the response characteristics of microorganisms and nutrients across different soil layers during practical remediation efforts. This study examines the improvement effects of biochar on karst abandoned slopes over a short period (1 year), and future research will focus on its long-term impacts (e.g., exceeding 20 years) on soil physicochemical properties and microbial communities. In summary, the findings provide valuable insights for soil remediation and sustainable agricultural development of karst abandoned slope farmlands.
Author Contributions
Conceptualization, Z.L.; Methodology, X.Y. and Z.L.; Investigation, X.Y., X.T. and Y.L. (Yuanzhou Liu); Data curation, X.Y., Y.T. and Y.L. (Yi Liang); Writing—original draft, X.Y.; Visualization, X.Y. All authors have read and agreed to the published version of the manuscript.
Funding
This work was financially supported by Technology Talent Growth Project of the Department of Education of Guizhou Province (Qianjiaoji [2024] 168, Qianjiaoji [2024] 167); Guizhou Provincial Basic Research Program (Natural Science) (QKHJC-MS [2025] 188; QKHJC-ZK [2024] 515); Guizhou Institute of Technology High-level Talent Research Startup Project (2025GCC026; 2023GCC071); Water Conservancy Science and Technology Project of Guizhou Province (KT202519).
Institutional Review Board Statement
Not applicable.
Informed Consent Statement
Not applicable.
Data Availability Statement
Data will be made available on request.
Conflicts of Interest
Author Yuan Tian was employed by the China Water Conservancy and Hydropower Engineering Consulting Co., Ltd. The remaining authors declare that the research was conducted in the absence of any commercial or financial relationships that could be construed as a potential conflict of interest.
References
- Pravalie, R.; Patriche, C.; Borrelli, P.; Panagos, P.; Rosca, B.; Dumitrascu, M.; Nita, I.A.; Savulescu, I.; Birsan, M.V.; Bandoc, G. Arable lands under the pressure of multiple land degradation processes. A global perspective. Environ. Res. 2021, 194, 110697. [Google Scholar] [CrossRef] [Scilit] [PubMed]
- Wang, R.; Hou, J.H.; Chen, L.T.; He, L.L.; Na, L.P.; Wang, Y.Y.; Lu, H.H.; Yang, S.M.; Liu, Y.X. Priming effects of vermiculite modified rice straw biochar on soil organic carbon: A new perspective of soil bacteria. Biochar 2025, 7, 54. [Google Scholar] [CrossRef] [Scilit]
- Zhao, Y.; Wang, Y.; Liu, X.; Shi, Y.; Yang, J. A machine learning-based study on ecological sensitivity and its driving factors in the karst landforms of yangshuo county, Guilin. Front. Environ. Sci. 2026, 13, 1742310. [Google Scholar] [CrossRef] [Scilit]
- Yang, L.; Zhao, C.; Jiao, S.; Li, S.; Wang, L.; Li, Y. Reconstructing spatial pattern of historical cropland in karst areas of Guizhou, Southwest China. Sci. Rep. 2022, 12, 22391. [Google Scholar] [CrossRef] [Scilit] [PubMed]
- Wang, Q.; Li, Y.B.; Luo, G.J. Spatiotemporal change characteristics and drivingmechanism of slope cultivated land transition in karst trough valley area of Guizhou Province, China. Environ. Earth Sci. 2020, 79, 12. [Google Scholar] [CrossRef] [Scilit]
- Crawford, C.L.; Wiebe, R.A.; Yin, H.; Radeloff, V.C.; Wilcove, D.S. Biodiversity consequences of cropland abandonment. Nat. Sustain. 2024, 7, 1596–1607. [Google Scholar] [CrossRef] [Scilit]
- Zhang, Q.Q.; Song, Y.F.; Wu, Z.; Yan, X.Y.; Gunina, A.; Kuzyakov, Y.; Xiong, Z.Q. Effects of six-year biochar amendment on soil aggregation, crop growth, and nitrogen and phosphorus use efficiencies in a rice-wheat rotation. J. Clean. Prod. 2019, 242, 118435. [Google Scholar] [CrossRef] [Scilit]
- Kabir, E.; Kim, K.; Kwon, E.E. Biochar as a tool for the improvement of soilandenvironment. Front. Environ. Sci. 2023, 11, 1324533. [Google Scholar] [CrossRef] [Scilit]
- Ighalo, J.O.; Ohoro, C.R.; Ojukwu, V.E.; Oniye, M.; Shaikh, W.A.; Biswas, J.K.; Seth, C.S.; Mohan, G.B.M.; Chandran, S.A.; Rangabhashiyam, S. Biochar for ameliorating soil fertility and microbial diversity: From production to action of the black gold. iScience 2025, 28, 111524. [Google Scholar] [CrossRef] [Scilit] [PubMed]
- Jeffery, S.; Verheijen, F.G.A.; van der Velde, M.; Bastos, A.C. A quantitative review of the effects of biochar application to soils on crop productivity using meta-analysis. Agric. Ecosyst. Environ. 2011, 144, 175–187. [Google Scholar] [CrossRef] [Scilit]
- Ye, J.; Joseph, S.D.; Ji, M.; Nielsen, S.; Mitchell, D.R.; Donne, S.; Horvat, J.; Wang, J.; Munroe, P.; Thomas, T. Chemolithotrophic pro-cessesin the bacterial communities on the surface of mineral-enriched biochars. ISME J. 2017, 11, 1087. [Google Scholar] [CrossRef] [Scilit] [PubMed]
- Ali, A.; Jabeen, N.; Chachar, Z.; Chachar, S.; Ahmed, S.; Ahmed, N.; Laghari, A.A.; Sahito, Z.A.; Farruhbek, R.; Yang, Z.P. The role of biochar in enhancing soil health & interactions with rhizosphere properties and enzyme activities in organic fertilizer substitution. Front. Plant Sci. 2025, 16, 1595208. [Google Scholar] [CrossRef] [Scilit] [PubMed]
- Elzobair, K.A.; Stromberger, M.E.; Ippolito, J.A.; Lentz, R.D. Con-trasting efects of biochar versus manure on soil microbial com-munities and enzyme activities in an Aridisol. Chemosphere 2016, 142, 145–152. [Google Scholar] [CrossRef] [Scilit] [PubMed]
- Enebe, M.C.; Ray, R.L.; Griffin, R.W. The impacts of biochar on carbon sequestration, soil processes, and microbial communities: A review. Biochar 2025, 7, 107. [Google Scholar] [CrossRef] [Scilit]
- Wang, X.; Song, D.; Liang, G.; Zhang, Q.; Ai, C.; Zhou, W. Maize biochar addition rate infuences soil enzyme activity and microbial community composition in a fuvoaquic soil. Appl. Soil Ecol. 2015, 96, 265–272. [Google Scholar] [CrossRef] [Scilit]
- Gomez, J.; Denef, K.; Stewart, C.; Zheng, J.; Cotrufo, M.F. Biochar addition rate infuences soil microbial abundance and activity in temperate soils. Eur. J. Soil Sci. 2014, 65, 28–39. [Google Scholar] [CrossRef] [Scilit]
- Lehmann, J.; Rillig, M.C.; Thies, J.; Masiello, C.A.; Hockaday, W.C.; Crowley, D. Biochar effects on soil biota: A review. Soil Biol. Biochem. 2011, 43, 1812–1836. [Google Scholar] [CrossRef] [Scilit]
- Apostolovic, T.; Gross, A.; Rodríguez, A.F.G.; de la Rosa, J.M.; Glaser, B.; Knicker, H.; Maletic, S. Impact of biochar aging on soil physicochemical properties. Agronomy 2025, 14, 3007. [Google Scholar] [CrossRef] [Scilit]
- Jones, D.L.; Murphy, D.V.; Khalid, M.; Ahmad, W.; Edwards-Jones, G.; DeLuca, T.H. Short-term biochar-induced increase in soil CO2 release is both biotically and abiotically mediated. Soil Biol. Biochem. 2011, 43, 1723–1731. [Google Scholar] [CrossRef] [Scilit]
- Dai, Q.H.; Peng, X.D.; Wang, P.J.; Li, C.L.; Shao, H.B. Surface erosion and underground leakage of yellow soil on slopes in karst regions of southwest China. Land Degrad. Dev. 2018, 29, 2438–2448. [Google Scholar] [CrossRef] [Scilit]
- Watlet, A.; Kaufmann, O.; Triantafyllou, A.; Poulain, A.; Chambers, J.E.; Meldrum, P.I.; Wilkinson, P.B.; Hallet, V.; Quinif, Y.; Ruymbeke, M.V.; et al. Imaging groundwater infiltration dynamics in the karst vadose zone with long-term ERT monitoring. Hydrol. Earth Syst. Sci. 2018, 22, 1563–1592. [Google Scholar] [CrossRef] [Scilit]
- Kaiser, M.; Ghezzehei, T.A.; Kleber, M.; Myrold, D.D.; Berhe, A.A. Influence of calcium carbonate and charcoal applications on organic matter storage in silt-sized aggregates formed during a microcosm experiment. Soil Sci. Soc. Am. J. 2014, 78, 1624–1631. [Google Scholar] [CrossRef] [Scilit]
- Yin, X.A.; Zhao, L.S.; Fang, Q.; Zi, R.Y.; Fang, F.Y.; Yang, X.C.; Ding, G.J. Effects of biochar amendment on the surface and underground runoff and soil loss of karst slopes at the microplot scale. Catena 2024, 238, 107857. [Google Scholar] [CrossRef] [Scilit]
- Sohi, S.P.; Krull, E.S.; Lopezcapel, E.; Bol, R. A review of biochar and its use and function in soil. Adv. Agron. 2010, 105, 47–82. [Google Scholar] [CrossRef] [Scilit]
- Ralebitso-Senior, T.K.; Orr, C.H. Microbial ecology analysis of biochar-augmented soils: Setting the scene. In Biochar Application: Essential Soil Microbial Ecology; Elsevier: Amsterdam, The Netherlands, 2016; pp. 1–40. [Google Scholar] [CrossRef] [Scilit]
- Purakayastha, T.J.; Bera, T.; Bhaduri, D.; Sarkar, B.; Mandal, S.; Wade, P.; Kumari, S.; Biswas, S.; Menon, M.; Pathak, H.; et al. A review on biochar modulated soil condition improvements and nutrient dynamics concerning crop yields: Pathways to climate change mitigation and global food security. Chemosphere 2019, 227, 345–365. [Google Scholar] [CrossRef] [Scilit] [PubMed]
- Hossain, M.Z.; Bahar, M.M.; Sarkar, B.; Donne, S.W.; Ok, Y.S.; Palansooriya, K.N.; Kirkham, M.B.; Chowdhury, S.; Bolan, N. Biochar and its importance on nutrient dynamics in soil and plant. Biochar 2020, 2, 379–420. [Google Scholar] [CrossRef] [Scilit]
- Cheng, H.G.; Jones, D.L.; Hill, P.; Bastami, M.S.; Tu, C.L. Infuence of biochar produced from diferent pyrolysis temperature on nutrient retention and leaching. Arch. Agron. Sci. 2018, 64, 850–859. [Google Scholar] [CrossRef] [Scilit]
- Yan, S.; Niu, Z.Y.; Zhang, A.G.; Yan, H.T.; Zhang, H.; He, K.X.; Xiao, X.Y.; Wang, N.L.; Guan, C.W.; Liu, G.S. Biochar application on paddy and purple soils in southern China: Soil carbon and biotic activity. R. Soc. Open Sci. 2019, 6, 181499. [Google Scholar] [CrossRef] [Scilit] [PubMed]
- Li, X.; Chen, D.; Carrión, V.J.; Revillini, D.; Yin, S.; Dong, Y.; Zhang, T.; Wang, X.; Delgado-Baquerizo, M. Acidification suppresses the natural capacity of soil microbiome to fight pathogenic Fusarium infections. Nat. Commun. 2023, 14, 5090. [Google Scholar] [CrossRef] [Scilit] [PubMed]
- Wu, C.; Shi, L.; Xue, S.; Li, W.; Jiang, X.; Rajendran, M.; Qian, Z. Effect of sulfur-ironmodified biochar on the available cadmium and bacterial community structure in contaminated soils. Sci. Total Environ. 2019, 647, 1158–1168. [Google Scholar] [CrossRef] [Scilit] [PubMed]
- Banerjee, S.; Walder, F.; Buechi, L.; Meyer, M.; Held, A.Y.; Gattinger, A.; Keller, T.; Charles, R.; van der Heijden, M.G.A. Agricultural intensification reduces microbial network complexity and the abundance of keystone taxa in roots. ISME J. 2019, 13, 1722–1736. [Google Scholar] [CrossRef] [Scilit] [PubMed]
- Wang, X.C.; Huang, D.S.; Liu, T.H.; Wang, C.; Ma, H.Y.; Xu, M.G.; Zhang, W.J.; Wu, L. Dynamics and drivers of soil organic carbon sequestration by cropland afforestation: A global meta-analysis. Land Degrad. Dev. 2025; early view. [CrossRef] [Scilit]
- Zhang, C.; Zhao, X.; Liang, A.J.; Li, Y.Y.; Li, X.Y.; Li, D.P.; Hou, N. Insight into the soil aggregate-mediated restoration mechanism of degraded black soil via biochar addition: Emphasizing the driving role of core microbial communities and nutrient cycling. Environ. Res. 2023, 228, 115895. [Google Scholar] [CrossRef] [Scilit] [PubMed]
- Wagg, C.; Schlaeppi, K.; Banerjee, S.; Kuramae, E.E.; van der Heijden, M.G.A. Fungal-bacterial diversity and microbiome complexity predict ecosystem functioning. Nat. Commun. 2019, 10, 4841. [Google Scholar] [CrossRef] [Scilit] [PubMed]
- Quilliam, R.S.; Helen, C.; Glanville, B.; Stephen, C.; Wade, C.; Davey, L.; Jones, B. Life in the charosphere-does biochar in agricultural soil provide a significant habitat for microorganisms? Soil Biol. Biochem. 2013, 65, 287–293. [Google Scholar] [CrossRef] [Scilit]
- Yan, T.T.; Xue, J.H.; Zhou, Z.D.; Wu, Y.B. Biochar-based fertilizer amendments improve the soil microbial community structure in a karst mountainous area. Sci. Total Environ. 2021, 794, 148757. [Google Scholar] [CrossRef] [Scilit] [PubMed]
- Zhou, N.N.; Han, Z.; Yin, X.A.; Hu, Y.; Zhao, L.S. Biochar enhances soil fertility through bacterial community modulation in karst slopes. Land Degrad. Dev. 2025, 37, 1810–1822. [Google Scholar] [CrossRef] [Scilit]

Disclaimer/Publisher’s Note: The statements, opinions and data contained in all publications are solely those of the individual author(s) and contributor(s) and not of MDPI and/or the editor(s). MDPI and/or the editor(s) disclaim responsibility for any injury to people or property resulting from any ideas, methods, instructions or products referred to in the content. |
© 2026 by the authors. Licensee MDPI, Basel, Switzerland. This article is an open access article distributed under the terms and conditions of the Creative Commons Attribution (CC BY) license.